Embed Size (px)
Citation preview

Last Updated: June 3, 2016
SolarWindsOrion Common Components
Version 2016.1
Administrator Guide

© 2016 SolarWinds Worldwide, LLC. All rights reserved.
This document may not be reproduced by any means nor modified, decompiled, disassembled, published or distributed, in whole or in part, or translated to any electronic medium or other means without the prior written consent of SolarWinds. All right, title, and interest in and to the software and documentation are and shall remain the exclusive property of SolarWinds and its respective licensors.
SOLARWINDS DISCLAIMS ALL WARRANTIES, CONDITIONS OR OTHER TERMS, EXPRESS OR IMPLIED, STATUTORY OR OTHERWISE, ON SOFTWARE AND DOCUMENTATION FURNISHED HEREUNDER INCLUDING WITHOUT LIMITATION THE WARRANTIES OF DESIGN, MERCHANTABILITY OR FITNESS FOR A PARTICULAR PURPOSE, AND NONINFRINGEMENT. IN NO EVENT SHALL SOLARWINDS, ITS SUPPLIERS, NOR ITS LICENSORS BE LIABLE FOR ANY DAMAGES, WHETHER ARISING IN TORT, CONTRACT OR ANY OTHER LEGAL THEORY EVEN IF SOLARWINDS HAS BEEN ADVISED OF THE POSSIBILITY OF SUCH DAMAGES.
The SolarWinds and other SolarWinds marks, identified on the SolarWinds website, as updated from SolarWinds from time to time and incorporated herein, are registered with the U.S. Patent and Trademark Office and may be registered or pending registration in other countries. All other SolarWinds trademarks may be common law marks or registered or pending registration in the United States or in other countries. All other trademarks or registered trademarks contained and/or mentioned herein are used for identification purposes only and may be trademarks or registered trademarks of their respective companies.
2

Table of Contents
How Orion Platform products work 18
Discover and add network devices 19
Discover your network with the Discovery Wizard 19
Add nodes using Active Directory 23
Credentials for Active Directory discovery 24
Automatically add discovered nodes 24
Add discovered devices to SolarWinds 26
Add a single node for monitoring 29
Choose the polling method to use 31
External Node (No Status) 31
Status Only: ICMP 31
Most Devices: SNMP & ICMP 32
Windows Servers: WMI and ICMP 32
Windows Servers: Agent 32
Import nodes from a list of IP addresses 33
Manage scheduled discovery results 33
Minimize SNMP processing load during discoveries using the Discovery Ignore List 34
Add ignored devices back to discovery 34
Manage devices in the Orion Web Console 34
Stop monitoring devices 34
View node data in tooltips 35
Edit node properties 35
Edit the node name, web address, and which view opens when you double-click the node 36
Edit polling settings 36
Edit dependencies or custom properties 37
Add what additional data you want to poll on the node 37
Customize alerting thresholds 37
3

Change the polling method for a node 37
Promote a node from ICMP to SNMP monitoring 38
Change polling engine node assignments 39
View the resources and statistics monitored on a node 39
Suspend collecting data for monitored nodes 39
Resume data collection for nodes 40
Poll and rediscover devices immediately 40
Group objects and mirror network dependencies in the Orion Web Console 40
Group monitored objects 41
Create groups 41
Edit group properties or change the group members 42
Delete groups 42
Set the group status based on the status of the group members 42
Mirror network object dependencies in the Orion Web Console 43
Create a dependency between network objects 44
Edit a dependency between network objects 45
Delete a dependency between network objects 45
View active alerts on child objects when the parent object is down 46
Monitor your network 47
View events, alerts, traps, and syslogs in the Orion Web Console Message Center 47
Monitor hardware health 47
Monitored Hardware Sensors 47
Enable hardware health monitoring 48
Enable monitoring from the Add Node wizard 48
Enable hardware health monitoring on a node 48
Enable, disable, or adjust hardware health sensors 48
Update hardware health statistics 49
Enable hardware sensors 49
Disable hardware sensors 49
4

Edit hardware health thresholds 50
Change the MIB used for polling hardware health statistics 50
Change the MIB tree used for polling hardware health globally 50
Change the MIB for polling hardware health statistics on a specific node 51
Change hardware health temperature units 51
Monitor virtual infrastructure in the Orion Web Console 51
Prerequisites to monitoring virtual infrastructure 51
Create ESX server credentials for SolarWinds Orion products 52
Enable SNMP on VMware ESXi and ESX servers 52
Change VMware credentials in the Orion Web Console 52
Add virtual servers for monitoring 52
Assess the status of the virtual environment 53
View ESX host details 54
Monitor Quality of Experience metrics 54
How SolarWinds Packet Analysis Sensors work 56
Network Packet Analysis Sensor (NPAS) 56
Server Packet Analysis Sensor (SPAS) 56
Limitations to Packet Analysis Sensors 56
Common Packet Analysis Sensor deployment scenarios 57
Aggregation per application 58
Aggregation per site 59
Aggregation per computer 61
Monitor traffic to and from a port mirror, SPAN, or network tap 63
Monitor traffic to and from a specific node 65
Remove a sensor 66
Monitor QoE applications and nodes 66
Manage global QoE settings 66
Manage QoE Packet Analysis Sensors 68
Monitor applications for QoE 69
5

Monitor nodes with a network sensor 71
Ignore traffic from applications or nodes 72
Define custom HTTP applications 73
Advanced sensor configuration 73
Configure which interface to monitor for traffic 74
Set the number of CPU cores and the amount of memory QoE can use 74
Configure QoE thresholds 75
Packet Analysis Sensor agents 75
Monitor devices with SolarWinds Orion agents 75
Agent settings 76
Navigate to the Agent Settings page 76
Adjust the Global Agent Settings 76
Server-initiated communication 77
Agent-initiated communication 77
Windows agent deployment 78
Deploy Windows agent software through a server push 78
Deploy the Windows agent manually 79
Mass deploy a Windows agent 79
Deploy with a Gold Master Image 81
Deploy a Windows agent with Patch Manager 81
Deploy on Windows Core Servers 85
Manually deploy a Windows agent on Amazon Web Services 85
Automatically deploy a Windows agent on Amazon Web Services 86
Automatically deploy a Windows agent on Microsoft Azure 87
Certificates and the agent 87
Agent management 88
Manage Agents toolbar options 88
Manage Agents table columns 89
Edit agent settings 90
6

Track your polling method 90
View the status of agent plug-ins 91
Edit agent settings in the Windows Control Panel 92
Connect to a previously installed agent 92
Change the agent communication mode 93
Change the agent port 94
Agent polling method 94
Check nodes polling with agents for changes 94
View network events in the Web Console 95
Filter the displayed logged events in the Web Console 95
Remove events from the Web Console 95
Monitor Syslog messages 95
Before you begin 96
View Syslog messages in the Orion Web Console 96
Clear Syslog messages in the Orion Web Console 97
Syslog resources in the Orion Web Console 97
View syslog messages in the Syslog Viewer 98
View and clear Syslog messages in the Syslog Viewer 98
Search for Syslog messages in the Syslog Viewer 99
Define the number of messages displayed, message retention, and the displayed columns in the Syslog Viewer 99
Trigger alerts when receiving specific Syslog messages 100
Syslog alert actions 101
Forward syslog messages 102
Syslog message priorities 103
Syslog facilities 103
Syslog severities 104
Monitor SNMP traps 104
Before you begin 105
7

View SNMP traps in the Orion Web Console 105
View SNMP traps in the Trap Viewer 105
View current traps in the Trap Viewer 105
Search for traps in the Trap Viewer 106
Define how many traps to display, if you want to refresh the traps view, trap retention, and the information displayed in the Trap Viewer 106
Configure Trap Viewer filters and alerts 107
Available trap alert actions 108
What is a Trap Template? 109
Integrate an Orion Platform product with ServiceNow 110
Before you begin 110
Install and configure the SolarWinds Alert Integration application in ServiceNow 110
Create a ServiceNow integration user with Web service access only 111
Configure an Orion Platform product with ServiceNow 111
Use alerts to monitor your environment 112
Alert preconfiguration tasks 112
Configure the default information in the email action 113
Best practices and tips for alerting 113
Navigate to the Alert Manager 114
Create new alerts to monitor your environment 114
Set alert properties 114
Define the conditions that must exist to trigger an alert 115
Define the conditions that must exist to reset an alert 117
Schedule when an alert monitors your environment 118
Define what happens when an alert is triggered 119
Add actions to alerts 119
Add what happens when an alert is not acknowledged 120
Define what happens when the alert is reset 121
Review the alert's configuration 122
8

Commonly created alerts 122
Alert me when a server goes down 122
Discover network device failures 123
Alert on custom properties 124
View triggered alerts in the Orion Web Console 125
Remove alerts from the Active Alerts list 125
Test alert triggers and actions 125
Test trigger conditions 125
Test alert actions while creating or editing an alert 125
Test alert actions in the Action Manager 126
Modify multiple alerts or share alerts 126
Add actions to alerts without opening the Alert Wizard 126
Share alerts with others 127
Build complex conditions 127
How conditions are evaluated 127
Wait for multiple objects to meet the trigger condition 128
Evaluate multiple condition blocks 129
How condition blocks are evaluated 129
Evaluate multiple object types 129
Manage alert actions 130
Assign an action to an alert 130
Enable and Disable Alerts 130
Available alert actions 130
Change a custom property 130
Create a ServiceNow incident 131
Dial a paging or SMS service 131
Email a web page to users 132
Create a dynamic URL 132
Execute an external batch file 132
9

Execute an external Visual Basic script 133
Log the alert message to a file 134
Log the alert to the NPM event log 134
Change the resource allocation of a virtual machine 135
Delete a snapshot of a virtual machine 135
Move a virtual machine to a different host 136
Move a virtual machine to a different storage 137
Pause a virtual machine 137
Power off a virtual machine 138
Power on a virtual machine 139
Restart a virtual machine 139
Suspend a virtual machine 140
Take a snapshot of a virtual machine 140
Play a sound when an alert is triggered 141
Restart IIS sites or application pools 142
Send a Windows Net message 142
Send an SNMP trap 143
Send a GET or POST request 144
Send a syslog message 144
Send an email or page 145
Manually set a custom status 146
Use the speech synthesizer to read alerts 147
Log an alert to the Windows Event Log on a specific server 147
Changes in the alerting engine 148
Changed or removed functionality 148
Database changes 148
Macro or variable changes 149
Defunct alert variables 149
Alert migration to the web 149
10

Migration issues 150
Limitations to migrated alerts 150
Share alerts with other SolarWinds products 150
Manage the Orion Web Console 151
Log in for the first time as an Administrator 151
Log in to the Orion Web Console 151
Manage Orion Polling Engines 151
Update polling settings 151
Configure polling interval settings 152
Configure polling statistics intervals 152
Configure the dynamic IP address and hostname resolution 153
Configure Database Settings 153
Configure network settings 155
Configure calculations and threshold settings 156
Calculate node availability 157
Node Status 157
Percent Packet Loss 157
Assign credentials to virtual servers 158
Assign credentials to Hyper-V servers 158
Assign credentials to VMware servers 158
Set general thresholds 158
Set the node warning level 159
Delete polling engines 159
Thresholds 159
Set general thresholds 160
Customize thresholds for single objects 161
Baselines and baseline calculations 161
What data is subject to statistical baseline calculation? 161
Use mean and standard deviations as thresholds 161
11

Customize how the baseline is calculated 162
General threshold types 163
Manage Orion Web Console user accounts 164
Create users 164
Create users based on existing Active Directory or local domain accounts 165
Change account passwords 167
Enable users to authenticate through LDAP 167
Define what users can access and do 168
Restrict user access to network areas by applying limitations 170
Create limitations based on custom properties 170
Delete account limitations 171
Patterns for limitations 171
Set default menu bars and views for users 171
Limit users to specific network areas 172
Configure automatic login 173
Enable Windows Authentication with Active Directory 174
Supported Active Directory scenarios 174
Log in with Windows pass-through security 176
Share views with non-Orion Web Console users 176
Automatically login by passing your credentials through the URL 177
Administrative functions of the Orion Web Console 177
Orion Web Console administration 177
Getting Started 177
Node & Group Management 178
Alerts & Reports 178
Product Specific Settings 178
Thresholds & Polling 179
Windows Credentials 179
User Accounts 179
12

Views 179
Customize Navigation & Look 180
Details 180
View secure data 180
Handle counter rollovers 181
Configure web proxy settings 181
Filter nodes in resources using SQL queries 182
SQL Query Examples 182
Custom properties 182
Create a custom property 183
Remove a custom property 185
Import custom property values 186
Export custom property data 187
Change custom properties values 187
Edit values for custom properties 187
Filter objects when assigning custom properties 187
Draw horizontal lines in resources 188
Customize the Orion Web Console look, views, settings, charts, and maps 190
Customize the Orion Web Console look 190
My Dashboards 190
Customize My Dashboards 191
Specify My Dashboards and Alerts & Activity items for users 191
Add items to My Dashboards 192
Add menu bars 193
Change the Orion Web Console color scheme 194
Change the Orion Web Console logo 194
Use Orion Web Console breadcrumbs 195
Customize breadcrumbs 195
Create, delete, modify, or restrict views 195
13

Create new views 195
Create views 196
Add resources and columns to views, and define subviews 197
Add resources to the view 197
Add columns 198
Change column width 199
Move resources on views 199
Divide content into subviews 199
Enable NOC View Mode 200
Limit objects on a view 201
Use a view as a template 201
Delete views 201
Specify views for device types 201
Resource configuration examples 201
Display a Network Atlas map in the Orion Web Console 202
Display a list of objects on a network map 202
Display a custom list of available maps 202
Display the Worldwide Map 203
Display events received during a given time period 203
Specify user-defined links 203
Specify Custom HTML 204
Filter nodes 204
Group nodes within a view 205
Add a Service Level Agreement Line to charts (SolarWinds NPM) 205
Add external website views 206
Export views to PDF 206
Create custom summary views 206
Orion Web Console and chart settings 208
Web Console settings 208
14

Auditing settings 210
Chart settings 210
Discovery, Worldwide Map, and Active Alerts settings 211
Active Alerts settings 211
Customize charts in the Orion Web Console 211
Drop-down customization options 211
Edit Resource page 212
Custom Chart page 213
Customize charts 214
Customize custom charts 215
Custom chart drop-down menu options 215
Edit the chart 215
95th Percentile Calculations 216
View monitored objects on maps 217
The Worldwide Map 217
Set up the Worldwide map 218
Map objects 218
Network Atlas Maps 219
Display nodes in the Worldwide Map of Orion Nodes resource 220
Place nodes automatically on the Worldwide Map 221
In what format should the location on a Cisco device be configured? 222
Place objects into the map using custom properties 222
Create and view reports 224
Predefined reports 224
Create, schedule, export, and import reports in the Orion Web Console 224
Create reports in the Orion Web Console 224
Modify an existing web-based report 224
Create a new web-based report 225
Customize a web-based report layout 228
15

Add content to a web-based report 229
Add a custom chart or table to a web-based report 229
Add a data series and customize a chart 230
Add a data series and customize a table 231
Build conditions 232
Restrict who can access reports 232
Create or add a report limitation category 233
Restrict user access to the report 233
Generate reports on a schedule 233
Schedule a report to run automatically while creating or editing a report 233
Create and assign report schedules in Report Manager 234
Schedule reports from the Schedule Manager 235
Export reports 236
Export reports as XML 236
Import XML reports 236
Export Excel and PDF reports from the Orion Web Console 236
Modify legacy reports in Report Writer 237
Report Writer Preview Mode 237
Report Writer Design Mode 237
Create and modify reports in Report Writer 238
Report Writer General Options tab 238
Report Writer Select Fields Options tab 238
Report Writer Filter Results Options tab 239
Report Writer Top XX Records Options tab 239
Report Writer Time Frame Options tab 240
Report Writer Summarization Options tab 240
Report Writer Report Grouping Options tab 240
Report Writer Field Formatting Options tab 240
Customize report headers and footers with Report Writer 241
16

Allow access to restricted Report Writer reports 241
Export reports from Report Writer 241
Access remote nodes 243
Use Integrated Remote Desktop 243
Access nodes using HTTP, SSH, and Telnet 243
17
How Orion Platform products workOrion Platform products monitor the health and performance of your network through ICMP, SNMP, WMI, and Syslog communication and data collection.
18

Discover and add network devicesWhen you install your Orion Platform product, you must identify the devices you want to monitor, and add them to the SolarWinds Orion database.
l To automatically discover and add a larger number of devices across your enterprise, use the Network Sonar Discovery and Network Sonar Results Wizards.
l To add individual objects for monitoring, add single nodes using Node Management in the Orion Web Console.
Discover your network with the Discovery Wizard
Check out this video on object discovery.
Before you begin:
n Enable the networking devices you want to monitor for SNMP.
n Enable Windows devices for WMI.
The first time you discover your network, SolarWinds recommends adding a limited number of edge routers or switches, firewalls and load balancers (if you have them), and critical physical or virtual servers and hosts.
Add nodes with high latency one at a time.
1. If the Discovery Wizard does not start automatically after configuration, click Settings > Network Discovery.
2. Click Add New Discovery, and then click Start.
19

3. On the Network panel, if this is your first discovery, add a limited number of IP addresses.
As you scale your implementation, you can use the following scanning options.
Option Description
IP RangesUse this option when you want Orion to scan one or more IP ranges.If you have many IP ranges to scan, consider adding multiple discovery jobs rather than including all ranges in a single job.
Subnets
Use this option to scan every IP address in a subnet. SolarWinds recommends scanning at most a /23 subnet (512 addresses max).Scanning a subnet returns everything that responds to ping, so we recommend only scanning subnets where the majority of devices are objects you want to monitor.
IP Addresses
Use this option for a limited number of IP addresses that do not fall in a range.Since a network discovery job can take a long time to complete, SolarWinds recommends using this option when you are first starting out.
Active Directory
Use this option to scan an Active Directory Domain Controller.Using Active Directory for discovery is particularly useful for adding large subnets because Orion can use the devices specified in Active Directory instead of scanning every IP address.
4. If the Agents panel appears, you enabled the Quality of Experience (QoE) agent during installation. The QoE agent monitors packet-level traffic. If there are any nodes using agents, select the Check all existing nodes check box.
This setting ensures that any agents you deploy, including the one on your Orion server, are up-to-date. If there are no nodes using agents, you can leave this option unchecked.
20

5. On the Virtualization panel, to discover VMware vCenter or ESX hosts on your network: a. Check Poll for VMware, and click Add vCenter or ESX Credential. b. Select <New credential> and provide required information.
If you do not add the host credentials, Orion still discovers the virtual machines (VMs) on the host. However, you will not be able to see the relationships mapped between the VMs and hosts.
6. On the SNMP panel: a. If all devices on your network require only the default SNMPv1 and SNMPv2 public and
private community stings, click Next. b. If any device on your network uses a community string other than public or private, or if you
want to use an SNMPv3 credential, click Add Credential and provide the required information.
21

7. On the Windows panel, to discover WMI or RPC-enabled Windows devices, click Add New Credential and provide the required information.
SolarWinds recommends that you monitor Windows devices with WMI instead of SNMP.
8. On the Monitoring Settings panel, SolarWinds recommends manually setting up monitoring the first time you run discovery. This allows you to review the list of discovered objects and select the ones you want to monitor.
When you scale monitoring, you can configure discovery to automatically start monitoring objects it finds.
22

9. On the Discovery Settings panel, click Next.
10. Accept the default frequency and run the discovery immediately.
Discovery can take anywhere from a few minutes to a few hours, depending on the number of network elements the system discovers.
Add nodes using Active DirectoryQuery your Active Directory Domain Controller to add nodes quickly and efficiently. Your SolarWinds Orion server can use the devices specified in AD instead of scanning every IP address in the subnet.
Create scheduled discoveries to discover and import any new servers and workstations that have been added to AD automatically.
1. Click Settings > Network Discovery, and click Add New Discovery.
2. On Network Selection, click Add Active Directory Controller to query.
3. On the Add Active Directory DC pop-up, enter your domain controller’s IP address/hostname and credentials, and click Next.
23

4. Select the organizational units (OUs) you want to scan for nodes, and click Finish.
By default, all OUs are selected, but only servers will be added. Add workstations by clearing the Import servers only check box below the OUs.
On the Network Selection page, you will see the OUs you have added. You can add additional AD controllers, or any other IP addresses that you need before continuing with discovery.
5. Complete the Network Discovery.
Credentials for Active Directory discoveryWhen you use Active Directory discovery to add nodes, you must provide the credentials of a Domain Administrator user.
The credentials you provide are added to the discovery wizard as Windows credentials automatically.
If the Active Directory credentials are not same as the Windows credentials for monitoring the node, add credentials for WMI monitoring in the Windows Credentials step.
Automatically add discovered nodesAutomatic monitoring means you do not have to go through the Discovery Import wizard every time you run a discovery. It is useful when you have configured your discovery to find similar nodes or network devices.
1. Click Settings > Network Discovery, and add a discovery, or select an existing one and click Edit.
2. Click through the Discovery Wizard to the Monitoring Settings page. 3. Choose to include devices that only respond to ICMP (ping). If you decide to exclude devices that only
respond to ICMP, your discovery list may be smaller than you expect and you must add those devices manually.
24

4. On Monitor Settings, select Automatically monitor based on my, and click Define Monitoring Settings.
5. Select the interfaces properties you want to apply to any discovered nodes and click Next. You can also create advanced filters for interfaces under Advanced selection options. This option is available for NPM.
Tips for choosing interfaces n Only monitor access ports that should always be up. Do NOT monitor desktop access
ports because these ports will show an error state when everyone goes home for the day (for example).
n For switches, routers & firewalls, select Up trunk ports and wireless access ports. n For servers, select Up interfaces. n Use Advanced Filtering Options for existing interface descriptions to choose your most
interesting ports, such as 'uplink', 'WAN', etc.
25

6. Choose the types of volumes you want to monitor.
Tips for choosing volumes n For switches, routers, and firewalls, select Flash memory, and RAM. n For servers, select RAM, Virtual Memory, Fixed Disk, Mount Points (*nix systems), or
Network Disk (Windows). n We do not recommend monitoring CDs, removable disks, or floppy disks (CDs always
show '100% full,' and removable disks disappear and display as unknown). n Other and Unknown volumes cannot be identified on import, so you may need to take
additional actions to identify them.
7. Choose the applications you want to monitor. Only the most commonly monitored applications are available in this screen. You can monitor other applications by using applications templates. This option is available for SAM.
8. Click Finish.
9. Continue configuring your discovery. When the discovery is run, your monitoring settings will be applied to any discovered devices, and anything that matches will be imported and monitored automatically.
Add discovered devices to SolarWinds
Check out this video on running a network discovery and adding devices.
After the Network Sonar Wizard discovers your network, the Network Sonar Results Wizard opens, allowing you to import network elements into your SolarWinds product. Nodes that are discovered do not count against your license count. Only nodes that you have added to the SolarWinds Orion database count against your license.
26
When you manually run discovery, by default, the system automatically selects all network elements to be monitored. You must clear the check boxes for elements you do not want monitored.
If you are discovering your network for the first time, SolarWinds recommends that you monitor a small number of devices.
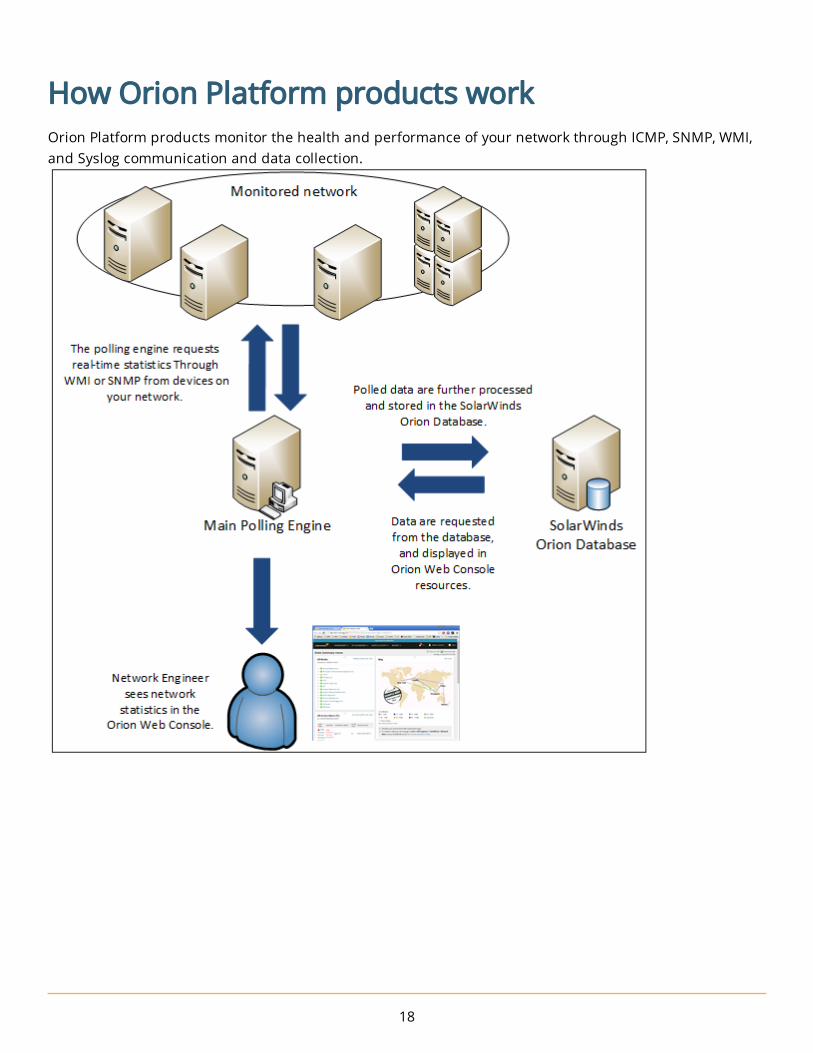
1. If the Network Sonar Results Wizard does not open automatically, click the Scheduled Discovery Results tab, select nodes you want to monitor, and then click Import Nodes.
2. Ensure the device types you want to monitor are selected, and click Next.
If a device appears as unknown vendor, it means that the credentials could not be validated. As a result, the product can only detect if the device is up or down, and cannot collect any other data. To resolve this issue, verify the SNMP configuration on the device. If the credentials still cannot be validated, and you have an active SolarWinds contract, contact technical support.
3. Ensure the interfaces you want monitor are selected, and click Next.
SolarWinds recommends that you do not monitor VoIP interfaces or NULL interfaces.
By default, SolarWinds NPM imports interfaces that are discovered in an Operationally Up state. However, because interfaces may cycle off and on, you can also select Operationally Down or Administratively Shutdown states for import.
27

4. Ensure the volume types you want to monitor are selected, and click Next.
SolarWinds recommends that you do not monitor compact disks or removable disks.
5. Review the list of elements to be imported, and click Import.
6. When the import completes, click Finish.
7. Click the My Dashboards > Summary to begin exploring your network.
28

Add a single node for monitoring
Check out this video on adding a single node.
As an alternative to using the Network Sonar Discovery wizard, you can add individual nodes for monitoring.
Adding a single node offers more detail in monitoring and is the recommended approach when you have a node with high latency. Do not include nodes with high latency in a discovery job.
As you add a single node for monitoring, you can:
n Select the statistics and resources to monitor.
n Add Universal Device Pollers.
n Identify how often the node status, monitored statistics, or topology details are updated.
n Add custom properties.
n Edit alert thresholds.
To add a single node for monitoring:
1. Log in to the Orion Web Console as an administrator.
2. Click Settings > Manage Nodes, and then click Add a Node.
29
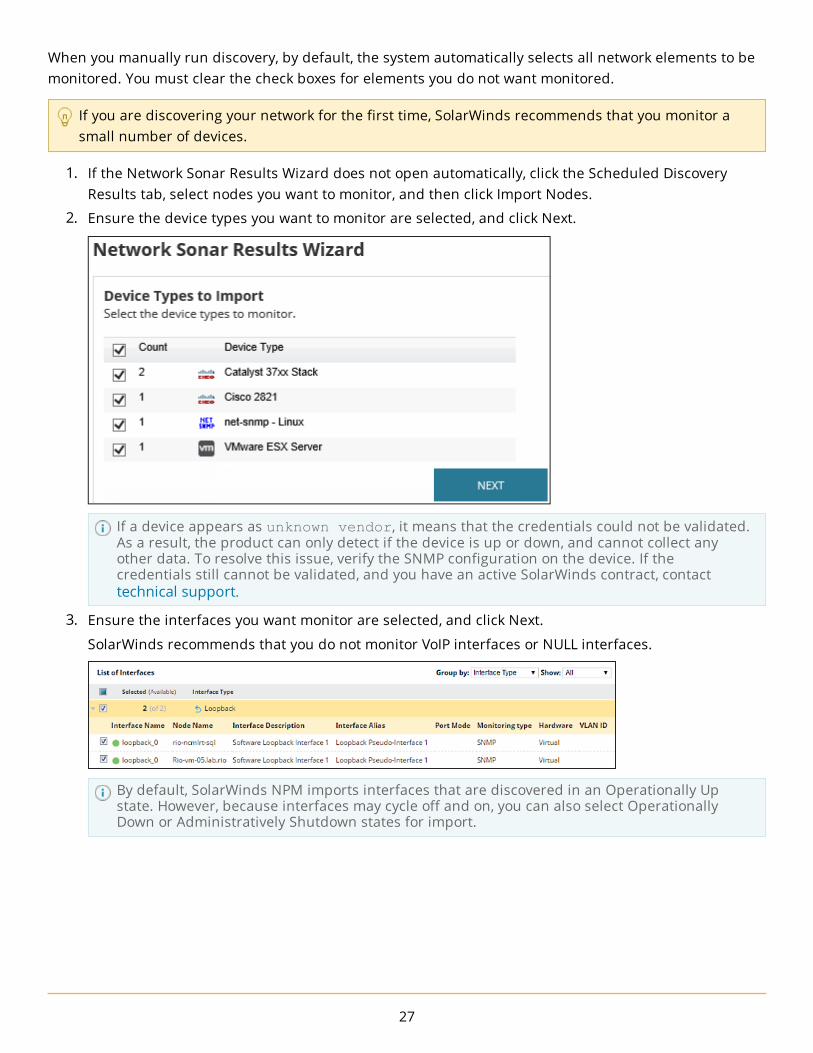
3. Specify the node, and click Next. a. Provide the host name or IP address. b. Select the polling method, and provide credentials.
4. Select the statistics and resources to monitor on the node, and click Next.
5. If you want to monitor a special metric on the node and have defined the metric using a custom poller, select the poller on the Add Pollers pane, and click Next.
30

6. Review and adjust the device properties. a. To edit the SNMP settings, change the values, and click Test. b. To edit how often the node status, monitored statistics, or topology details are updated,
change the values in the Polling area.
For critical nodes, you may need to poll status information or collect statistics more frequently than the default polling intervals. Change the polling intervals if polling the nodes takes too long.
c. Enter values for custom properties for the node.The Custom Properties area will be empty if you have not defined any custom properties for the monitored nodes. See "Add custom properties to nodes" in the SolarWinds Getting Started Guide - Customize.
d. To adjust when the status of the node changes to Warning or Critical, edit alerting thresholds for the metric. Select the Override box and set thresholds specific for the node.
7. Click OK, Add Node.
The node will be monitored according to the options you set.
Choose the polling method to useSelect a polling method to monitor nodes in the way that best suits your environment.
External Node (No Status)
The node is not polled, and no data is collected from the node. The node is included in your environment and used to monitor an application or another element on the node. This method allows you to build a more complete map of your network environment within your SolarWinds Orion Platform product.
Status Only: ICMP
Limited information is gathered using Internet Control Message Protocol (ICMP) or ping. This polling method is used to monitor status and measure the average response time and packet loss percentage for managed devices.
Use this method when you need limited information or to monitor devices that do not support SNMP or WMI.
This polling method requires that you enable ICMP on your nodes. Consider adjusting any network intrusion detection systems or your firewalls to allow for the ICMP traffic.
31

Most Devices: SNMP & ICMP
This method allows you to query the Management Information Base (MIB) and performance indicators that are tied to specific Object Identifiers (OIDs) in addition to polling the device status, average response time, and packet loss percentage. This method is suitable for SNMP-enabled devices such as routers, switches, and computers. You must provide the appropriate SNMP community strings for SNMP v1 or v2c, or SNMP v3 credentials.
Your devices must have ICMP and SNMP enabled to use this polling method. If you want to poll with a specific version of SNMP, you must disable all other versions on the device.
Consider adjusting any network intrusion detection systems or your firewalls to allow for the ICMP traffic.
Windows Servers: WMI and ICMP
This polling method can only be used for Windows computers. Windows Management Instrumentation (WMI) is a proprietary technology used to poll performance and management information from Windows-based network devices, applications, and components.
When used as an alternative to SNMP, WMI can provide much of the same monitoring and management data currently available with SNMP-based polling with the addition of Windows specific communications and security features.
Your devices must have WMI and ICMP enabled to use this polling method. You can use WBEMTest.exe, which is included on every computer that has WMI installed, to test the connectivity between your SolarWinds Orion server and your Windows computer.
Due to specific characteristics of WMI polling requests, polling a single WMI enabled object uses approximately five times the resources required to poll the same or similar object with SNMP on the same polling frequency. Consider adjusting any network intrusion detection systems or your firewalls to allow for the ICMP traffic.
Windows Servers: Agent
An agent is software that provides a communication channel between the SolarWinds Orion server and a Windows computer. Agents are used to communicate the information that SolarWinds plug-ins collect to the SolarWinds Orion server.
Information collected by plug-ins depend on the type of plug-in installed on the agent. For example, the Quality of Experience plug-in collects packet traffic, while a SAM plug-in collects application data used to monitor the applications. Agents automatically download the plug-ins for all installed products.
This polling method is most useful in the following situations:
n When host and applications are behind firewall NAT or proxies
n Polling node and applications across multiple discrete networks that have overlapping IP address space
32

n Secure encrypted polling over a single port is required
n Support for low bandwidth, high latency connections
n Polling nodes across domains where no domain trusts have been established
n Full end-to-end encryption between the monitored host and the poller
Import nodes from a list of IP addressesImport devices from a seed file in the Network Sonar Discovery wizard.
Enter one IP address or host name per line.
1. Open the seed file.
2. Log in to the Orion Web Console, and click Settings > Network Discovery.
3. Click Add New Discovery to create a new discovery, or select a discovery, and click Edit.
4. Click IP Addresses, and copy and paste the IP addresses or host names of the devices from your seed file into the field.
5. Click Validate to confirm that the provided IP addresses and host names are assigned to SNMP-enabled devices.
6. Complete the discovery and import the devices.
The Network Sonar Results Wizard opens with the results of your discovery.
Manage scheduled discovery resultsThe Scheduled Discovery Results tab of Network Discovery provides a list of all recently discovered, changed, or imported devices on your monitored network. Results are compared between discoveries, and listed on this tab.
1. Log in to the Orion Web Console and navigate to Settings > Network Discovery.
2. Click Scheduled Discovery Results.
3. Filter the results the left pane.
4. Update your SolarWinds Orion database to include changed or discovered nodes by selecting all nodes to update or to add, and clicking Import Nodes.
5. Ignore devices in future discoveries by selecting the nodes to ignore, and clicking Add to Ignore List.
33

Minimize SNMP processing load during discoveries using the Discovery Ignore ListNetwork discoveries often find devices you do not intend to monitor. Add the devices you do not want to monitor to the Discovery Ignore List to minimize the SNMP load associated with discovering devices not meant for monitoring.
1. Log in to the Orion Web Console, and navigate to Settings > Network Discovery.
2. Click Scheduled Discovery Results.
3. Select devices you want to ignore, and click Add to Ignore List.
Use items in the Status and Group by lists to help you find devices.
The selected devices will not be discovered by the discovery.
Add ignored devices back to discovery
1. Log in to the Orion Web Console, and navigate to Settings > Network Discovery.
2. Click the Discovery Ignore List, and select the objects you want to monitor.
3. Click Remove from Ignore List.
4. Confirm that you want to stop ignoring selected items by clicking OK.
The devices removed from the list will be included in the discovery again.
Manage devices in the Orion Web ConsoleIn the Orion Web Console, you can add and remove devices, quickly view and edit device properties from the Node Management view.
You need node management rights.
Access the Node Management view in two ways:
n Click Settings > Manage Nodes.
n Click Manage Nodes in the All Nodes resource.
The All Nodes resource is included on the Orion Summary Home view by default, but you can include it on any other view.
Stop monitoring devices
Deleting a node also deletes all its applications, interfaces, and volumes. An individual event may be recorded for each deleted network object.
1. Log in to the Orion Web Console as an administrator.
2. Click Settings > Manage Nodes.
34

3. Select the object, and click Delete.
To find a monitored application, interface, or volume, expand the parent node, and select the object.
n To find a node, use the filter and search tools above the node list. n To group found nodes, select a property in the Group By list.
To delete multiple interfaces on different nodes, use the search tool above the table to find the nodes, and select the interfaces.
4. Click OK to confirm deletion.
View node data in tooltips
Hover over a monitored node in the Orion Web Console to view an immediate status overview of the device.
NODE DATA IN TOOLTIPS
Node Status Current status of the node (Up, Down, Warning, Unmanaged, or Unreachable).
Polling IP Address
The IP address currently assigned to the selected node.
Machine Type The vendor icon and vendor description of the selected node.
Average Response Time
The measured average response time of the selected node as of the last node poll.
Packet LossThe percent of all transmitted packets that are lost by the selected node as of the last node poll.
CPU LoadThe percent of available processing capacity on the selected node that is currently used as of the last node poll.
Memory UsedThe percent of available memory on the selected node that is currently used as of the last node poll.
Edit node properties
Only edit node properties in a single browser tab to prevent database errors and data losses.
You need Node Management Rights.
Available properties depend on the Orion Platform products you have installed.
1. Click Settings > Manage Nodes.
2. Locate the node for which you want to edit properties.
To find the node, use the filter and search tools above the nodes list.
3. Select the node, and click Edit Properties.
35
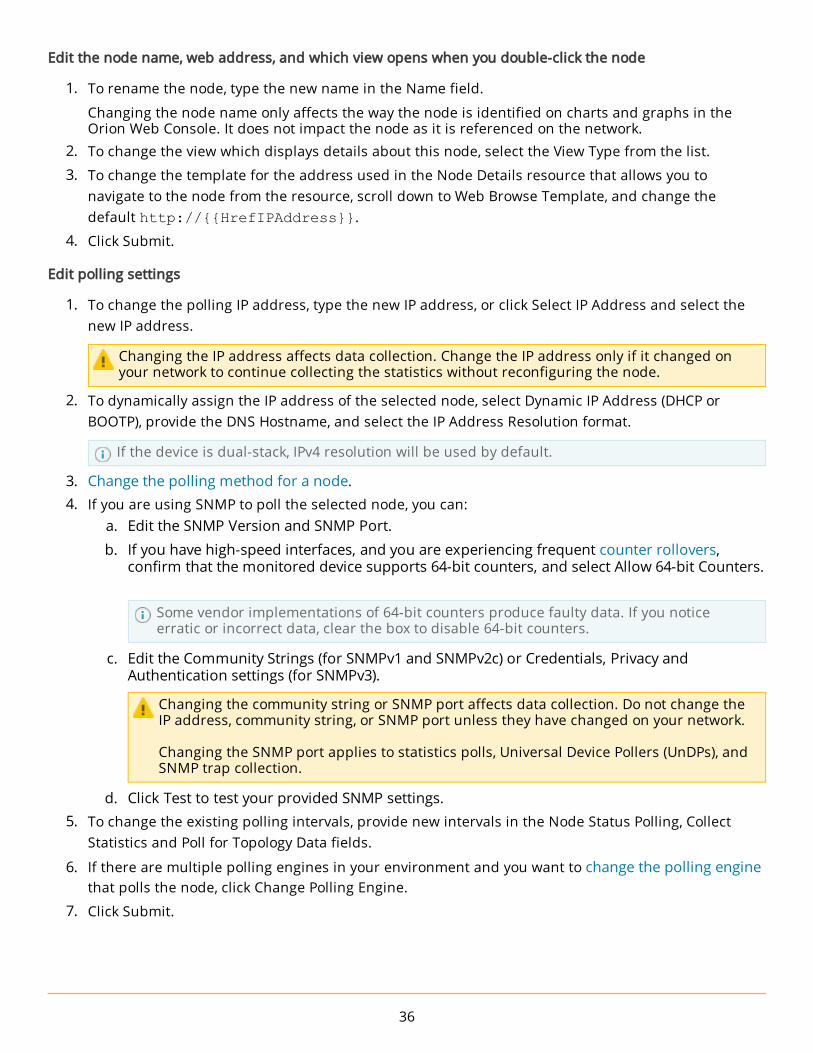
Edit the node name, web address, and which view opens when you double-click the node
1. To rename the node, type the new name in the Name field.
Changing the node name only affects the way the node is identified on charts and graphs in the Orion Web Console. It does not impact the node as it is referenced on the network.
2. To change the view which displays details about this node, select the View Type from the list.
3. To change the template for the address used in the Node Details resource that allows you to navigate to the node from the resource, scroll down to Web Browse Template, and change the default http://{{HrefIPAddress}}.
4. Click Submit.
Edit polling settings
1. To change the polling IP address, type the new IP address, or click Select IP Address and select the new IP address.
Changing the IP address affects data collection. Change the IP address only if it changed on your network to continue collecting the statistics without reconfiguring the node.
2. To dynamically assign the IP address of the selected node, select Dynamic IP Address (DHCP or BOOTP), provide the DNS Hostname, and select the IP Address Resolution format.
If the device is dual-stack, IPv4 resolution will be used by default.
3. Change the polling method for a node. 4. If you are using SNMP to poll the selected node, you can:
a. Edit the SNMP Version and SNMP Port. b. If you have high-speed interfaces, and you are experiencing frequent counter rollovers,
confirm that the monitored device supports 64-bit counters, and select Allow 64-bit Counters.
Some vendor implementations of 64-bit counters produce faulty data. If you notice erratic or incorrect data, clear the box to disable 64-bit counters.
c. Edit the Community Strings (for SNMPv1 and SNMPv2c) or Credentials, Privacy and Authentication settings (for SNMPv3).
Changing the community string or SNMP port affects data collection. Do not change the IP address, community string, or SNMP port unless they have changed on your network.
Changing the SNMP port applies to statistics polls, Universal Device Pollers (UnDPs), and SNMP trap collection.
d. Click Test to test your provided SNMP settings. 5. To change the existing polling intervals, provide new intervals in the Node Status Polling, Collect
Statistics and Poll for Topology Data fields.
6. If there are multiple polling engines in your environment and you want to change the polling engine that polls the node, click Change Polling Engine.
7. Click Submit.
36

Edit dependencies or custom properties
1. To add, edit, or delete an existing dependency that includes the node, click Manage Dependencies and adjust the dependencies.
2. Provide values for custom properties on the node. If you cannot see the required custom property, click Manage Custom Properties to create or manage custom properties.
3. Click Submit.
Add what additional data you want to poll on the node
1. If the node is a UCS Manager and you want to poll for UCS data, select Poll for UCS, provide the Port on which the UCS manager listens and credentials.
Click Test to verify that the credentials are valid for the selected UCS Manager.
2. If you have SolarWinds User Device Tracker (UDT) installed and the node has UDT ports attached, you can poll Layer 3 data. Select Poll Layer 3 Data from Device, and enter the Layer 3 Polling Interval.
Select Disable VRF Context Polling, if required.
3. If SolarWinds SAM is installed, you can monitor Active Directory users that log in to your network. Select Active Directory Domain Controller, and provide the following information.
a. Select the credential to be used, or select <New Credential>, and define the credential.
Administrator credentials are needed only for installing agents.
b. Click Test to validate. c. Enter the Domain Controller Polling Interval to be used. The default is 30 minutes.
4. To poll for VMware, select Poll for VMware, provide the vCenter or ESX Server credentials, and click Test. See Monitor virtual infrastructure in the Orion Web Console for more details.
5. Click Submit.
Customize alerting thresholds
Be informed when polled values for a metric on the node reach unwanted values by specifying custom thresholds for the node.
1. Scroll down, select Override Orion General Thresholds for the metric, and adjust the default values. 2. Click Submit.
Change the polling method for a node
1. Log in to the Orion Web Console as an administrator.
2. Click Settings > Manage Nodes.
3. Select the node for which you want to change the polling method, and click Edit Properties.
4. Select the Polling Method.
37

5. If you are using SNMP to poll the selected node, select the SNMP version supported on the device, and provide the port and community strings. Click Test to verify that the SNMP settings are correct.
By default, Orion Platform products use SNMPv2c to poll for performance information. If you want to poll the device using SNMPv1, you must disable SNMPv2c on the device.
For most SNMPv2c devices, the community string public gives sufficient access.
To see the available community strings, click into the Community String field, and press the down arrow key.
To save the community strings as a credential set, provide a Name, and click Save. 6. Click Submit.
Promote a node from ICMP to SNMP monitoring
Orion Platform products only use ICMP to poll devices for status, average response time, and packet loss.
If a node which you added to the SolarWinds Orion database as an ICMP only node also supports SNMP, and you want to start collecting additional statistics, change the polling method to SNMP.
1. Log in to the Orion Web Console as an administrator.
2. Click Settings > Manage Nodes.
3. Select Nodes from the Show drop-down list, and locate the node which you want to edit.
4. Select the node, and click Edit Properties.
5. In the Polling Method section, select Most Devices: SNMP and ICMP.
6. Select the version of SNMP to use. The default is SNMPv2c.
7. If you have installed multiple polling engines, select the Polling Engine you want to use to collect statistics from the added node. This option is not displayed if you are only using one polling engine.
8. If the SNMP port on the added node is not the Orion default of 161, enter the actual port number.
9. If the added node supports 64-bit counters and you want to use them, select Allow 64-bit Counters.
If you notice erratic or incorrect data when using 64-bit counters, clear the Allow 64 Bit Counters box for the device, and contact the hardware manufacturer.
10. For SNMPv1 or SNMPv2c, enter the Community String and, optionally, the Read/Write Community String. Click Test to validate the strings.
The Community String is a password to authenticate data sent between the management station and the device. The default is usually "public". Use the strings configured on the device.
11. For SNMPv3, provide the credentials and click Test to validate the credentials. See the vendor documentation for your network device for further information.
12. Click Submit.
38
Change polling engine node assignments
Reassigning nodes to new polling engines may be required in the following situations:
n Moving or renaming your SolarWinds Orion server
n Deleting an existing polling engine
n Merging two or more SolarWinds Orion server
To change a polling engine node assignment:
1. Log in to the Orion Web Console as an administrator.
2. Click Settings > Manage Nodes.
3. Locate the node to manage using either of the following methods:
n Use the search tool above the node list to search your SolarWinds Orion database for the device you want to manage.
n Select a Group by criteria, and expand the group including the node to manage. 4. Select the node for which you want to change the polling engine.
5. Click More Actions, and click Change Polling Engine.
The current number of Assigned Objects is listed for each available polling engine. This number is updated with each automatic polling engine synchronization. Updates to the Assigned Objects count can only be completed for polling engines that are operationally up.
6. Select the polling engine, and click Change Polling Engine.
View the resources and statistics monitored on a node
Resources monitored on a node include interfaces and volumes. The status of objects is signified by an icon. The List Resources view also lists statistics monitored on the node.
1. Click Settings > Manage Nodes.
2. Locate the node to view:
n Use the search tool above the node list. n Select a Group By option, and expand the group including the node to view.
3. Select the node, and click List Resources on the Node Management toolbar.
The interfaces and volumes for this nodes are displayed, showing which are being currently monitored.
Suspend collecting data for monitored nodes
Monitored devices are regularly polled for operational status. Collected statistics are displayed in the Orion Web Console.
You can temporarily suspend data collection on individual nodes and resume data collection as necessary.
If you suspend data collection for a node, it is suspended automatically for all interfaces and volumes on the selected node.
39

Suspending data collection is helpful when you need to perform maintenance on a node or its components, such as upgrading firmware, installing new software, or updating security. Suspend polling data for the node while the device is down for maintenance to maintain the accuracy of data and prevent unnecessary alert messages.
1. Log in to the Orion Web Console as an administrator.
2. Click Settings > Manage Nodes.
3. Locate the node(s).
4. Select the nodes, and click Unmanage.
5. Provide start and end times and dates for your management suspension, and click OK.
Data for the selected node and monitored resources on the node will be suspended for the specified time period.
Resume data collection for nodes
On Manage Nodes, select the node, and click Remanage.
Information for the selected node, all monitored interfaces and volumes on it will be collected again.
Poll and rediscover devices immediately
Devices are polled for statistics and status regularly, as specified in the Polling Settings. Discoveries run according to their schedule.
You can poll a device or rediscover a node manually at any time.
1. Log in to the Orion Web Console as an administrator.
2. Click Settings > Manage Nodes.
3. Select the node or interface you want to poll or rediscover.
4. To poll the selected node or interface, click More Actions > Poll Now.
5. To rediscover the selected node, click More Actions > Rediscover.
Group objects and mirror network dependencies in the Orion Web ConsoleGroups and dependencies help you organize how data about your network is presented in the Orion Web Console and can improve or simplify alerts.
You can manage Orion objects such as nodes, volumes, applications, interfaces, and even other groups as groups. By using groups, you can logically organize monitored objects, and use the groups as the basis of alerts. For example, you can group nodes from the same location and create alerts and reports about the status of the group.
Dependencies between objects allow you to better represent the status of objects on your network.
40

Without dependencies, all monitored objects on an unresponsive monitored node report as down. By establishing dependencies, the child objects are displayed as Unreachable instead of down. This prevents false object down alerts.
Group monitored objects
A group is a collection of monitored objects, such as a group of nodes from the same location, or group of all nodes owned by a department.
You can include groups in other groups. For example, you can group all nodes managed by DevOps that are mission critical and then add that group to a more inclusive list of mission critical objects.
Nesting a group within another does not create a strict parent/child relationship. You can include any group as a member in any number of other groups.
Create groups
Select objects you want the group to contain, or specify group members using a dynamic query based on shared properties. Objects added through dynamic queries are automatically added or removed from the group.
1. Click Settings > All Settings in the menu bar.
2. In the Node & Group Management grouping, click Manage Groups.
3. Click Add New Group.
4. Click Advanced to set the Status Rollup Mode, how often objects refresh in the group, or any custom properties.
To create custom properties, click Manage Custom Properties in a new tab. See Custom properties.
5. Manually or automatically select objects for this group. n Select the check box next to the object to select object manually. n Automatically select group members based on shared properties by clicking Add Dynamic
Query and creating conditions.
Click Preview to verify that the dynamic query is selecting the intended objects.
6. Click Create Group.
The new group is listed on the Manage Groups page and can be used in other parts of the product, including alerts and dependencies.
41
Edit group properties or change the group members
You can edit the properties of an existing group, or add and remove objects. If you remove an object from the group and that object has triggered an alert while it was a member of the group, the alert continues to be active until it's acknowledged.
1. Click Settings > All Settings in the menu bar.
2. In the Node & Group Management grouping, click Manage Groups.
3. Select a group you want to edit, and click Edit Properties.
4. Click Advanced to set the Status Rollup Mode, how often objects refresh in the group, or any custom properties.
To create custom properties, open Manage Custom Properties in a new tab.
5. To add or remove the group members, click Add & Remove Objects.
You can also change group members directly on the Manage Groups page.
6. Manually or automatically select objects for this group. n Select the check box next to the object to select object manually. n Automatically select group members based on shared properties by clicking Add Dynamic
Query and creating conditions.
Click Preview to verify that the dynamic query is selecting the intended objects.
7. Edit an existing query by selecting a dynamic query, and clicking Edit Dynamic Query.
8. To remove an object or query from a group, select the query or object, and click Remove.
9. Click Submit to save the edited objects and queries.
10. Click Submit again to save the group.
Delete groups
1. Click Settings > All Settings in the menu bar.
2. In the Node & Group Management grouping, click Manage Groups.
3. Select a group, and click Delete.
Set the group status based on the status of the group members
The status of a group is determined on the status of the group members.
The Show Best Status selection is useful for displaying groups that are defined as collections of redundant or backup devices.
OBJECT STATES GROUP STATUS
(Up, Warning, Down) (Up)
42

OBJECT STATES GROUP STATUS
(Up, Down) (Up)
(Warning, Down, Unknown) (Warning)
The Show Worst Status selection ensures that the worst status in a group of objects is displayed for the whole group.
OBJECT STATES GROUP STATUS
(Up, Warning, Down) (Down)
(Warning, Up) (Warning)
(Warning, Down, Unknown) (Down)
The Mixed Status Shows Warning selection ensures that the status of a group displays the worst warning-type state in the group. If there are no warning-type states, but the group contains a mix of up and down
states, then a Mixed Availability ( ) warning status is displayed for the whole group.
OBJECT STATES GROUP STATUS
(Critical)
(Critical)
(Mixed Availability)
Mirror network object dependencies in the Orion Web Console
Dependencies are parent-child relationships between network objects that allow you to account for constraints on the network. The constraints can be the result of the design of a specific device, such as interfaces on a switch or router, or the result of the physical architecture of the network itself.
For example, when a parent object, such as a switch, goes down or becomes unresponsive all interfaces on the switch will also be unresponsive, even though they may be working.
To account for this situation, the Unreachable status is used for the interfaces, because their parent node reports as down, and their own status cannot be determined.
Enable Auto Dependencies in the Polling Settings page to create 1:1 parent-child node dependencies automatically. You can choose to ignore dependencies created this way in the Manage Dependencies view.
43

Create a dependency between network objects
1. Click Settings > All Settings in the menu bar.
2. In the Node & Group Management grouping, click Manage Dependencies.
3. Click Add New Dependency.
4. Select the parent object or group, and click Next.
To define a dependency so that the reported states of child objects depend on the status of multiple parent objects, create a group including all parent objects, and select it on this view.
5. Type a Dependency Name, select the child entities, and click Next.
To define a dependency so that the reported states of multiple child objects depend on the status of one or more parent objects, create a group including all child objects, and select it on this view.
6. Review the settings for the dependency. If there are active alerts on child objects, they are listed on this view.
7. Click Submit.
The dependency appears on the Manage Dependencies page.
You can also display the dependency on custom views in the Orion Web Console.
44

Edit a dependency between network objects
Automatic Dependencies cannot be edited.
1. Click Settings > All Settings in the menu bar.
2. Click Manage Dependencies in the Node & Group Management grouping.
3. Select a dependency, and click Edit.
4. Select the parent object or group, and click Next.
To define a dependency so that the reported states of child objects depend on the status of multiple parent objects, create a group including all parent objects, and select it on this view.
5. Select the child object or group, and click Next.
To define a dependency so that the reported states of multiple child objects depend on the status of one or more parent objects, create a group including all child objects, and select it on this view.
6. Review the settings for the dependency. If there are active alerts on child objects, they are listed on this view. If the parent object is down, the listed alerts might be suppressed.
7. Click Submit.
Changes are saved to the dependency. Active alerts that affect members of the dependency stay active until acknowledged, even if you remove the object from the dependency.
Delete a dependency between network objects
Automatic Dependencies cannot be deleted. You can ignore them in the Manage Dependencies page.
1. Click Settings > All Settings in the menu bar.
2. Click Manage Dependencies in the Node & Group Management grouping.
3. Select the dependency, and click Delete.
4. Click Yes to confirm.
Deleted dependencies are removed from the Manage Dependencies page. The dependencies are not removed from historical logs. Active alerts that rely on the deleted dependency stay active until acknowledged.
45

View active alerts on child objects when the parent object is down
When a parent object is down and the dependent child objects are Unreachable, alerts based on polled statistics are not triggered, but you can display active alerts on child objects manually.
Alerts based on default or custom property values are not affected.
If a child object can be polled using a different route, it is polled as usual. Its status does not switch to Unreachable, and alerts are not suppressed.
1. Click Settings > All Settings in the menu bar.
2. Click Manage Dependencies in the Node & Group Management grouping.
3. Select the dependency that includes the child object on which the alerts are active, and click Alerts on Child.
46

Monitor your networkUse Orion Platform products to monitor objects on your network, such as your hardware health or devices separated from your network by a firewall, or monitor metrics, such as Quality of Experience.
View events, alerts, traps, and syslogs in the Orion Web Console Message CenterThe Message Center provides a view where you can see all events, alerts, traps, and Syslog messages on your network.
1. Click Alerts & Activity > Message Center.
2. To display messages for specific devices, select device properties in the Filter Devices area.
3. In the Filter Messages area, select the Time period for the messages you want to review, and provide the number of messages you want to show.
4. To show all messages, including messages that have been acknowledged, select Show Acknowledged in the Filter Messages area.
5. To display only certain types of messages, select the messages to be displayed.
6. Click Apply to update the list of displayed messages.
Monitor hardware healthGet immediate insight into hardware issues on your network. Monitoring hardware health on Cisco, Dell, F5, HP, and Juniper devices informs you which of these devices are in Up, Warning, Critical, or Unknown states.
1. When adding a device into the SolarWinds Orion database for monitoring, enable polling hardware health statistics.
2. Hardware health statistics are polled through SNMP, from a MIB tree on your devices. For Cisco devices, make sure that the correct MIB is selected.
3. Make sure the correct sensors are enabled for the nodes.
Monitored Hardware SensorsSENSOR UP WARNING CRITICAL UNKNOWN
Fan status
Power Supply status
47
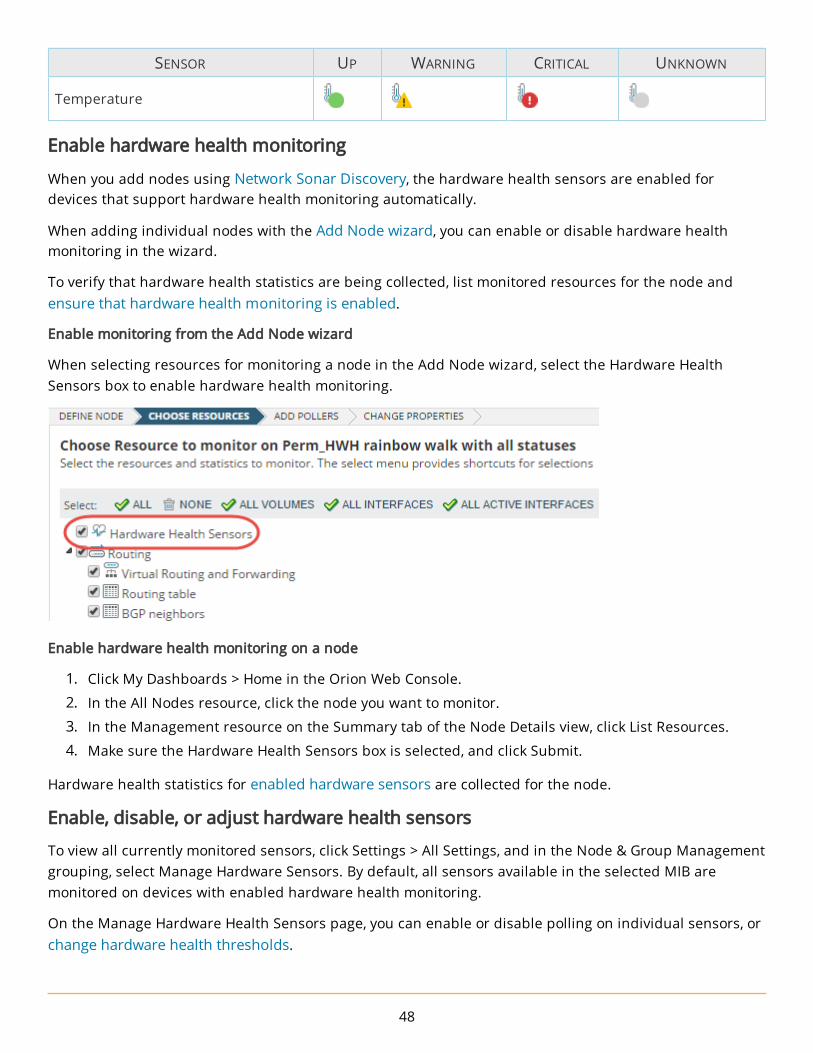
SENSOR UP WARNING CRITICAL UNKNOWN
Temperature
Enable hardware health monitoring
When you add nodes using Network Sonar Discovery, the hardware health sensors are enabled for devices that support hardware health monitoring automatically.
When adding individual nodes with the Add Node wizard, you can enable or disable hardware health monitoring in the wizard.
To verify that hardware health statistics are being collected, list monitored resources for the node and ensure that hardware health monitoring is enabled.
Enable monitoring from the Add Node wizard
When selecting resources for monitoring a node in the Add Node wizard, select the Hardware Health Sensors box to enable hardware health monitoring.
Enable hardware health monitoring on a node
1. Click My Dashboards > Home in the Orion Web Console.
2. In the All Nodes resource, click the node you want to monitor.
3. In the Management resource on the Summary tab of the Node Details view, click List Resources.
4. Make sure the Hardware Health Sensors box is selected, and click Submit.
Hardware health statistics for enabled hardware sensors are collected for the node.
Enable, disable, or adjust hardware health sensors
To view all currently monitored sensors, click Settings > All Settings, and in the Node & Group Management grouping, select Manage Hardware Sensors. By default, all sensors available in the selected MIB are monitored on devices with enabled hardware health monitoring.
On the Manage Hardware Health Sensors page, you can enable or disable polling on individual sensors, or change hardware health thresholds.
48

Update hardware health statistics
All changes are applied in the Orion Web Console with the next poll. Look up the current polling interval, and if necessary, poll for the statistics manually.
1. Click Settings > All Settings, and click Polling Settings in the Thresholds & Polling grouping.
2. Scroll down to Hardware Health Polling section, and note the Default Statistics Poll Interval.
n We recommend that you do NOT enter a shorter polling interval here because it might affect the polling performance. To immediately update hardware health statistics for a node, see step 3.
n Consider how often you need to update the health statistics and how long you need to keep historical records. To improve the performance, enter a longer polling interval, or shorten the retention periods.
3. Go to the node details view, and click Poll Now in the Management resource.
Hardware health statistics will be immediately updated. This will not affect the performance as if you shortened the polling interval.
Enable hardware sensors
Hardware health information is collected only for nodes where the hardware sensors are enabled.
1. Go to Manage Hardware Sensors view (Settings > All Settings > Node & Group Management > Manage Hardware Sensors).
2. Find the sensor(s) you want to enable. You can either use the Group by pane, or use the Search box.
To find all sensors available on a node, select Node in the Group by list, and then select the node.
3. Select the sensor that you want to enable on the node, and click Enable.
Hardware health information for the selected nodes will be collected now.
Disable hardware sensors
If you do not want to collect specific hardware health information or any hardware health information, disable sensors.
1. Go to Manage Hardware Sensors view (Settings > All Settings > Node & Group Management > Manage Hardware Sensors).
2. Find the sensor(s) you want to enable. You can either use the Group by pane, or use the Search box.
To find all sensors available on a node, select Node in the Group by list, and then select the node.
3. Select the sensor(s) which you want to disable on the node, and click Disable.
Hardware health statistics for the selected sensors on the selected nodes will not be collected now.
49

Edit hardware health thresholds
Hardware states displayed in the Orion Web Console change based on thresholds set for the sensors. You can either use thresholds available on the device, set a sensor to always appear to be up, or customize thresholds.
When values polled on a node reach the threshold value, an event triggers together with the alert "Hardware is in warning or critical state."
1. Go to Manage Hardware Sensors view (Settings > All Settings > Node & Group Management > Manage Hardware Sensors).
2. Select the sensor that you want to edit, and click Edit Thresholds.
To find all sensors available on a node, select Node in the Group By list, and select the node.
3. Select how you want to change the selected hardware sensor's status:
Use Orion DefaultsUse thresholds configured on the device. This is the default setting.
Force to UpIf you are not concerned about a sensor, select this option. The sensor will always be displayed as UP, ignoring the real data from the sensor.
Set Custom ThresholdsUse the dynamic query builder to define the status for the selected sensor.
4. Click Submit.
The status of the hardware health sensor will now be governed by the specified threshold.
Change the MIB used for polling hardware health statistics
Hardware sensors information on Cisco devices can be polled using one of the following MIBs.
n CISCO-ENTITY-SENSOR-MIB (default MIB) n CISCO-ENVMON-MIB
Each MIB contains different OIDs, and information for individual nodes might be included only in one of them. If you see inconsistencies between the actual hardware health and the status shown in the Orion Web Console, change the MIB used for polling hardware health statistics.
Change the MIB tree used for polling hardware health globally
1. Log in to the Orion Web Console as an administrator.
2. Click Settings > All Settings in the menu bar.
3. In the Thresholds & Polling grouping, click Polling Settings.
4. Scroll down to the Hardware Health Polling section, and select the MIB in the Preferred Cisco MIB list.
5. Click Submit.
The default MIB used for polling all hardware sensors on all monitored nodes is changed now.
50

Change the MIB for polling hardware health statistics on a specific node
1. Open the Node Details view, and click Edit Node in the Management resource.
2. Scroll down to the Hardware Health Polling section, and select the MIB.
3. Click Submit.
Changing MIB for a node overrides the general settings. Once you customize the MIB for polling hardware health sensors, it will not change if you change the general settings.
Change hardware health temperature units
By default, hardware health resources display temperature in degrees Fahrenheit.
1. Log in to the Orion Web Console.
2. Navigate to a node details view.
3. Go to the Current Hardware Health resource, and click Edit.
4. Select the unit for temperature display (Fahrenheit or Celsius).
5. Click Submit.
The selected unit will be applied in all hardware health resources in the Orion Web Console. This setting is user-specific, and it is connected with your user account.
You can also access the temperature unit setting when editing a user in the Hardware Health Package Settings.
Monitor virtual infrastructure in the Orion Web ConsoleSolarWinds Integrated Virtual Infrastructure Monitor (IVIM) is the feature that enables virtual monitoring directly from the Orion Web Console.
It is available as a feature of SolarWinds NPM or SolarWinds SAM, in integration with SolarWinds VMAN, or as a standalone solution.
IVIM monitors the following:
n ESXi and ESX Server version 4.1 or later
n VMware vSphere version 4.1 or later
n Microsoft Hyper-V Server versions 2008 R2, 2012, 2012 R2
Prerequisites to monitoring virtual infrastructure
n SolarWinds NPM or SolarWinds IVIM is installed.
n SNMP on your virtual servers is enabled.
51

n VMware Tools are installed on all virtual machines you want to monitor.
If your virtual machines are on monitored ESXi and ESX servers, VMware Tools are not a requirement but provide access to additional information, such as IP addresses.
n ESX credentials on ESX servers are created.
n You virtual infrastructure is discovered.
Create ESX server credentials for SolarWinds Orion products
For polling performance data, you must create credentials on your ESX Servers for the SolarWinds Orion polling engine.
To create the credentials, log in to the ESX server, and create a user. For more information, consult your vendor documentation.
Credentials created for the polling engine must have read-only rights as a minimum.
Enable SNMP on VMware ESXi and ESX servers
SolarWinds Orion uses SNMP to poll performance data from VMware ESXi and ESX Servers. In order to make this performance data available to SolarWinds Orion, you must enable SNMP on your ESXi and ESX Servers.
Consult VMware's documentation for information on enabling SNMP.
VMware only makes a limited amount of information available to SNMP queries for VMware ESXi and ESX Servers version 4.0 and higher. To access additional information on these versions, we use the VMware API.
Change VMware credentials in the Orion Web Console
If credentials for a VMware account change on the device, update the credentials in the Orion Web Console.
1. Log in to the Orion Web Console as an administrator.
2. Click Settings > All Settings in the menu bar.
3. In the Node & Group Management grouping, click Manage Virtual Devices.
4. Click the VMware Credentials Library tab.
5. Select the credential you want to update, and click Edit Credential to make the necessary changes.
Add virtual servers for monitoring
Hyper-V nodes, VMware vCenter, ESX servers, and virtual machines which you want to monitor must be added to the SolarWinds Orion database.
52

Add the nodes using Network Sonar Discovery.
1. Log in to the Orion Web Console as an administrator.
2. Launch Network Discovery in the Orion Web Console through Settings > Network Discovery > Add New Discovery.
3. On the Virtualization page, select Poll for VMware, and if the vCenter or ESX Credentials are not listed, add them.
4. On the Windows page, add Windows credentials for accessing Hyper-V nodes.
5. Complete the wizard and import the results.
Assess the status of the virtual environment
The Virtualization Summary view shows the overall status of your virtualized infrastructure.
1. Log in to the Orion Web Console.
2. Click My Dashboards > Home > Virtualization in the menu bar.
53

View ESX host details
Click an ESX Host server in the Virtualization Summary page to open the ESX Host Details view.
Monitor Quality of Experience metricsOn the Quality of Experience (QoE) dashboard you can monitor traffic on your network. QoE uses Packet Analysis Sensors to provide packet-level traffic information about key devices and applications.
54

With QoE, you can:
n Compare statistics, such as network response time (TCP Handshake) and application response time (Time to First Byte) to determine if a bottleneck is on the application or the network.
n Use data volume trends to pinpoint traffic anomalies and investigate the cause.
n Monitor risky types of traffic, for example, traffic that might bypass firewalls or lead to data leaks.
With the ability to analyze packet traffic, QoE provides real observed network response time (NRT) and application response time (ART). In addition, Packet Analysis Sensors can classify and categorize traffic for over 1000 different applications by associated purpose and risk-level.
Traffic data is captured using Packet Analysis Sensors. These sensors collect packets using either a dedicated Windows SPAN or mirror port monitor or directly on your Windows server. Packet Analysis Sensors capture packets from the local network interface (NIC) and then analyze collected packets to calculate metrics for application performance monitoring. These metrics provide information about application health and allow you to identify possible application performance issues before they are reported by end-users.
For more information about specific implementations of QoE, see Common Packet Analysis Sensor deployment scenarios.
55
How SolarWinds Packet Analysis Sensors work
SolarWinds provides two types of Packet Analysis Sensors to monitor and analyze your network traffic.
n Packet Analysis Sensors for Networks (network sensor) collect and analyze packet data that flow through a single, monitored switch for up to 50 discrete applications per node.
n Packet Analysis Sensors for Servers (server sensor) collect and analyze packet data of specific applications that flow through a single node.
After a sensor is deployed and configured, it captures packets and analyzes them to calculate performance metrics for the monitored applications. An included communication agent allows the sensor to send back sampled packet data to the SolarWinds Orion server, which includes statistics such as volume, transactions, application response time, and network response time for each application on a node. The packet data are then saved to the SolarWinds Orion database. The information is used to populate your QoE dashboard. You can configure how long you retain the packet data in the Database Settings section of the Polling Settings screen.
Network Packet Analysis Sensor (NPAS)
Your network administrator must create a dedicated SPAN, mirror port, or in-line tap monitor on the physical or virtual switch before you can deploy or configure a network sensor.
After you deploy and configure the network sensor to the node monitoring the switch, the sensor captures all packets that flow through the switch and categorize the packets by application.
Packets that correspond to monitored applications are analyzed for QoE metrics, such as response times or traffic volume. Data are then sent to the SolarWinds Orion server using the SolarWinds agent.
Server Packet Analysis Sensor (SPAS)
A SPAS can monitor:
n packet traffic on a single node
n up to 50 applications per node
A SPAS captures packets traveling to and from the node. It identifies packets that are sent to or from the monitored application and analyzes them for QoE metrics, such as response time or traffic volume. Data are then sent to the SolarWinds Orion server using the agent.
Limitations to Packet Analysis Sensors
The number of nodes you can monitor is limited by the data throughput per node, the number of cores, and the amount of RAM available on the monitoring server.
The system requirements increase for every 100 Mbps of traffic.
SENSOR LIMITATIONS VALUE
Maximum throughput (NPAS and SPAS) 1 Gbps
56

SENSOR LIMITATIONS VALUE
Maximum number of nodes per sensor (NPAS) 50 nodes
Maximum number of node and application pairs (NPAS and SPAS)
50,000 pairs
Maximum number of sensors deployed on your network 1,000 sensors
Maximum number of applications per node or sensor (NPAS and SPAS)
1,000 applications per node
Common Packet Analysis Sensor deployment scenarios
After you install your Orion platform product, deploy network sensors on a server dedicated to monitoring a network switch or deploy server sensors directly on physical or virtual servers or workstations.
If you select QoE during the installation, a sensor is already on your SolarWinds Orion server collecting data about applications that SolarWinds Orion is using.
Based on how you want to aggregate the returned QoE metrics, there are three main deployment scenarios per sensor type.
AGGREGATION LEVEL SENSOR DEPLOYMENT CONFIGURATION
I HAVE ACCESS TO MY NETWORK (NPAS)
Per applicationDeploy an NPAS to a port mirror that monitors all traffic to and from the application
Automatic
Per siteDeploy an NPAS to a port mirror that monitors all traffic to and from the site
Add a sampling of endpoints to the NPAS as managed nodes
Per clientDeploy an NPAS to a port mirror that monitors all traffic to and from the site
Add all of the endpoints to the NPAS as managed nodes
I HAVE ACCESS TO MY APPLICATION SERVERS (SPAS)
Per applicationDeploy the SPAS directly on the application server
Automatic
Per site Deploy the SPAS to select endpoints Automatic
Per client Deploy the SPAS to all endpoints Automatic
n When deploying both network and server sensors on the same network, ensure that you do not monitor the same node with multiple sensors. This impacts the QoE metrics.
57
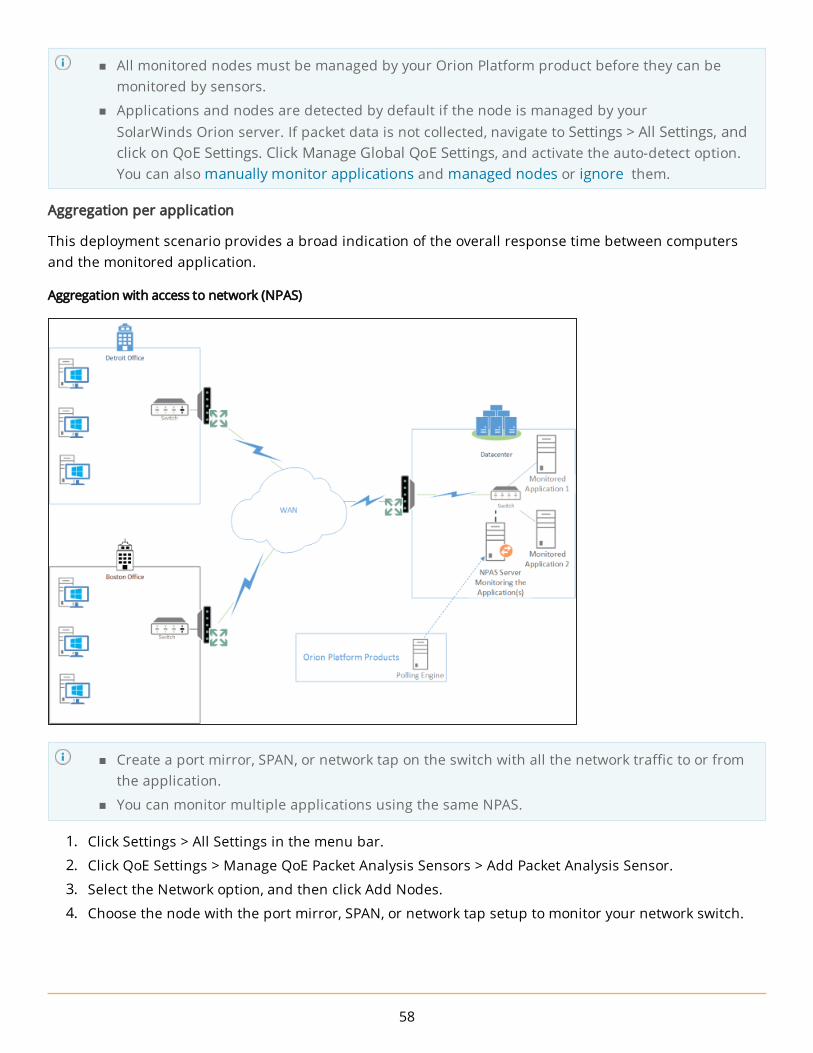
n All monitored nodes must be managed by your Orion Platform product before they can be monitored by sensors.
n Applications and nodes are detected by default if the node is managed by your SolarWinds Orion server. If packet data is not collected, navigate to Settings > All Settings, and click on QoE Settings. Click Manage Global QoE Settings, and activate the auto-detect option. You can also manually monitor applications and managed nodes or ignore them.
Aggregation per application
This deployment scenario provides a broad indication of the overall response time between computers and the monitored application.
Aggregation with access to network (NPAS)
n Create a port mirror, SPAN, or network tap on the switch with all the network traffic to or from the application.
n You can monitor multiple applications using the same NPAS.
1. Click Settings > All Settings in the menu bar.
2. Click QoE Settings > Manage QoE Packet Analysis Sensors > Add Packet Analysis Sensor.
3. Select the Network option, and then click Add Nodes.
4. Choose the node with the port mirror, SPAN, or network tap setup to monitor your network switch.
58

5. Assign and test the credentials for the selected node.
6. Click Add Nodes and Deploy Agents to deploy the network sensor to the node.
Aggregation with access to application servers (SPAS)
1. Click Settings > All Settings in the menu bar.
2. Click QoE Settings > Manage QoE Packet Analysis Sensors > Add Packet Analysis Sensor.
3. Select the Server option, and then click Add Nodes.
4. Choose the nodes with the application you want to monitor.
5. Assign and test the credentials for each node.
6. Click Add Nodes and Deploy Agents to deploy a sensor on the node.
Aggregation per site
This deployment scenario provides an aggregated response time per monitored site or network to the application. For example, the response time from your Detroit office to your datacenter is one second, but the response time from Boston to your datacenter is seven seconds. If you used the aggregation per application deployment method, the response time for the application is four seconds.
This method requires you to identify users who best represent how the application is used. You then use the users' computers as data points to monitor with Packet Analysis Sensors.
59

Aggregation per site with access to network (NPAS)
n Create a port mirror, SPAN, or network tap on the switch with all the network traffic to or from the application.
n You can monitor multiple applications using the same NPAS.
n Identify a sample set of users whose computers are monitored by the NPAS.
1. Click Settings > All Settings in the menu bar.
2. Click QoE Settings > Manage QoE Packet Analysis Sensors > Add Packet Analysis Sensor.
3. Select the Network option, and then click Add Nodes.
4. Choose the node with the port mirror, SPAN, or network tap setup to monitor your network switch.
5. Assign and test the credentials for the selected node.
6. Click Add Nodes and Deploy Agents to deploy the network sensor to the node.
60

Aggregation per site with access to application servers (SPAS)
Identify a sample set of users whose computers are monitored by the SPAS.
1. Click Settings > All Settings in the menu bar.
2. Click QoE Settings > Manage QoE Packet Analysis Sensors > Add Packet Analysis Sensor.
3. Select the Server option, and then click Add Nodes.
4. Choose the nodes with the application you want to monitor.
5. Assign and test the credentials for each node.
6. Click Add Nodes and Deploy Agents to deploy a sensor on the node.
Aggregation per computer
This deployment scenario provides highly granular response times for the application because metrics for each computer are recorded.
One or two workstations can experience long response times, which may not be caught when aggregated per site or per application.
This method requires all workstations to be managed within your Orion Platform product.
61
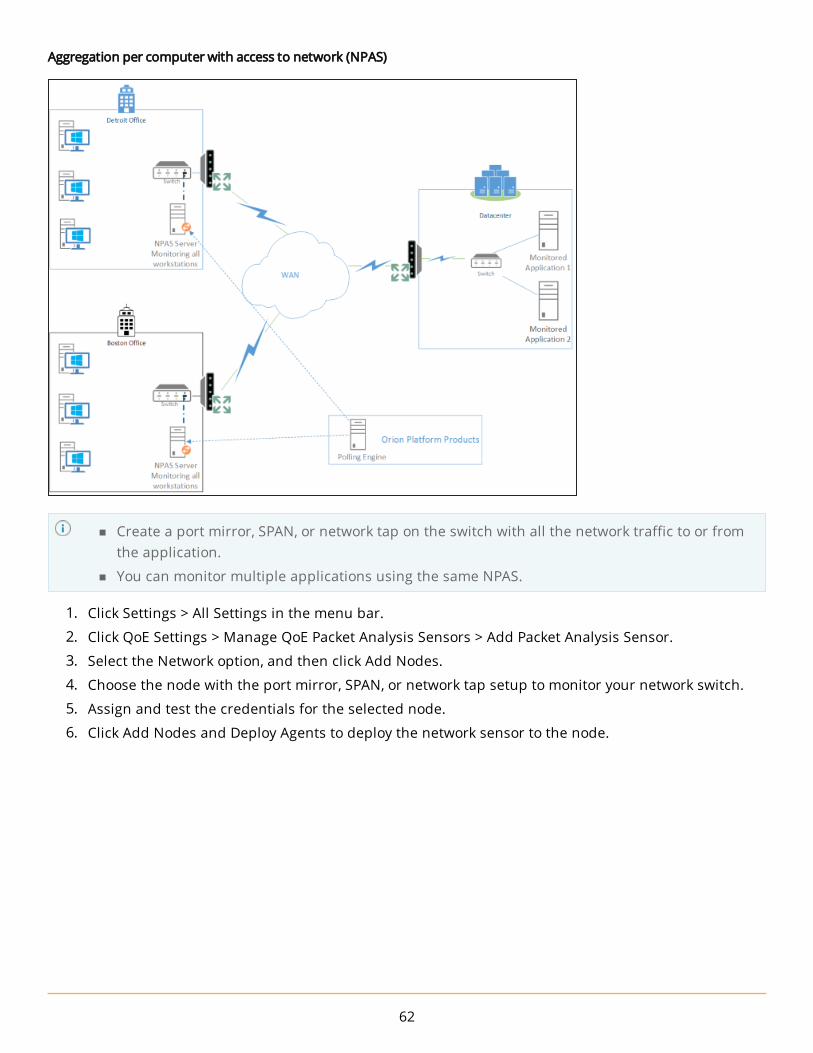
Aggregation per computer with access to network (NPAS)
n Create a port mirror, SPAN, or network tap on the switch with all the network traffic to or from the application.
n You can monitor multiple applications using the same NPAS.
1. Click Settings > All Settings in the menu bar.
2. Click QoE Settings > Manage QoE Packet Analysis Sensors > Add Packet Analysis Sensor.
3. Select the Network option, and then click Add Nodes.
4. Choose the node with the port mirror, SPAN, or network tap setup to monitor your network switch.
5. Assign and test the credentials for the selected node.
6. Click Add Nodes and Deploy Agents to deploy the network sensor to the node.
62

Aggregation per computer with access to application servers (SPAS)
1. Click Settings > All Settings in the menu bar.
2. Click QoE Settings > Manage QoE Packet Analysis Sensors > Add Packet Analysis Sensor.
3. Select the Server option, and then click Add Nodes.
4. Select the all user computers to monitor.
5. Assign and test the credentials for each node.
6. Click Add Nodes and Deploy Agents to deploy an agent on the node.
Monitor traffic to and from a port mirror, SPAN, or network tap
Network sensors monitor all packets that flow through the switch and categorize the packets by application.
After you deploy a network sensor to the port mirror, SPAN, or network tap, the sensor monitors packets to and from the node, identifies the application or the URL, and analyzes the packets for QoE metrics, such as response time or traffic volume.
Before you begin
n Data from sensors is directed to the polling engine assigned to the node when the sensor was deployed.
n A high number of applications or nodes can cause performance issues with the sensors.
The network sensor must be installed on a Windows computer that is monitoring the switch's SPAN or mirror port.
63

Install the network sensor
1. Click Settings > All Settings in the menu bar.
2. Click QoE Settings > Manage QoE Packet Analysis Sensors > Add Packet Analysis Sensor.
3. Select Network, and click Add Nodes.
4. Move the node that monitors your switch to the Selected Nodes panel, and click Add Selected Nodes.
Make sure you select the Windows machine that is monitoring the SPAN or mirror port of the switch.
5. Assign and test the credentials for the node, and click Submit.
6. Click Add Nodes and Deploy Agents.
When the sensors are successfully deployed, a message is displayed in Notifications.
Deploying the sensor and receiving the first set of data can take several minutes. When the deployment is finished, select the sensor on the Manage Quality of Experience (QoE) Packet Analysis Sensors page, click Edit Sensor, and verify the selected NIC.
Monitor website traffic based on domains
After you deploy a network sensor, you can filter application traffic based on domain names instead of all http traffic.
1. Click Settings > All Settings in the menu bar.
2. Click QoE Settings > Manage Global QoE Settings.
64

3. Set the HTTP application domain detection level.
4. Set the Auto-detect QoE applications option to Active, and click Submit.
QoE can automatically detect the first 50 applications, or you can add specific applications.
Discovered applications have the "No Risk" Risk Level and the "Both Business and Social" Productivity Rating associated with them. To modify the Risk Level and Productivity Rating, click QoE Settings > Manage (QoE) Applications, and edit the application.
Use the Global QoE Settings page to disable monitoring or discovery of multiple applications. Select the applications, and click Disable Monitoring or Disable Discovery.
Nodes are automatically detected and added by default. To specify which nodes and applications to monitor manually, see Monitor QoE applications and nodes.
Monitor traffic to and from a specific node
These sensors monitor all the application traffic into and out of the server they are installed on.
After you deploy a server sensor to the application node, the sensor monitors packets to and from the node, identifies the application or the URL, and analyzes the packets for QoE metrics, such as response time or traffic volume.
1. Click Settings > All Settings in the menu bar.
2. Click QoE Settings > Manage QoE Packet Analysis Sensors, and click Add Packet Analysis Sensor.
3. Select Server, and click Add Nodes.
4. Move the Windows nodes that will host the server sensors to the Selected Nodes panel, and click Add Selected Node.
5. Assign and test credentials for each node, and click Submit.
6. Click Add Nodes and Deploy Agents. QoE auto-discovers the applications on the servers.
When the sensors are successfully deployed, a message is displayed in Notifications.
65

n Deployment may take some time and will run as a background process.
n QoE automatically chooses settings, including the interface to capture traffic data and limits to memory and CPU, during deployment. You can change these settings after deployment is complete by selecting the sensor and clicking Edit.
n You can confirm the deployment status on the Manage QoE Packet Analysis Sensors page.
To specify manually which applications to monitor, see Monitor applications for QoE. Applications are automatically detected and added by default.
Remove a sensor
Removing a sensor from a node is a two-step process. First delete the sensor using the Orion Web Console, and then remove the communication agent directly from the node.
1. Delete the sensor using the Orion Web Console:a. Click Settings > All Settings in the menu bar.b. Click QoE Settings > Manage QoE Packet Analysis Sensors.c. Select the node.d. Click Delete Sensor.e. Click Delete when prompted.
2. Remove the agent directly from the node:a. Log in to the computer with administrative credentials.b. Navigate to Control Panel > Programs and Features.c. Select SolarWinds Agent.d. Click Uninstall.e. Follow the onscreen prompts to completely uninstall the agent.
The sensor is removed from the list and the communication agent is uninstalled and cannot gather traffic data or send data.
Monitor QoE applications and nodes
By default nodes and applications are automatically monitored by QoE when you deploy a Network or Server Sensor. You can automatically filter which nodes or applications are monitored.
See Global QoE Settings for more information on changing these settings.
Server Sensors automatically monitor the top 50 applications on the node they are installed on based on the global settings. You can change which applications are monitored after the sensor is deployed.
Manage global QoE settings
You can control how Packet Analysis Sensors behave by changing the settings on Manage Global QoE Settings page. Settings are distributed to sensors regularly when the agent is updated. You can manually update an agent from the Manage Agents page.
66

QoE applications
Control how you monitor QoE applications for both Network Packet Analysis Sensors and Server Packet Analysis Sensors.
Auto-detect QoE applications
Use this to detect and monitor traffic associated with all applications that fulfill the auto-detection rules defined on this page. This is active by default. You must select applications manually when this option is disabled.
If you automatically detect nodes, you should also automatically detect applications to receive all metrics.
HTTP application domain detection level
Choose how QoE breaks up monitored http traffic.
n Top level (http://*) - Monitor all http traffic.
n Second level (http://hostname/*) - Separate and monitor http traffic based on domains.
n Third level (http://hostname/path1/*) - Separate and monitor http traffic based on the domain and first level directory within each domain.
Add auto-detected applications
Refine the monitored applications by choosing to monitor all application traffic sources, traffic destinations, or all application traffic. Packet sources and destinations are based on the source or destination IP address included in the packet.
n Transaction destinations (servers) - Monitor applications that receive traffic based on the destination IP address of the packet.
n Transaction sources (client) - Monitor applications that generate traffic based on the source IP address of the packet.
n Either a source or destination - Monitor all application traffic.
For each node, include top X application that have at least Y% of total QoE traffic.
Filter the number of monitored applications to applications that generate a certain amount of network traffic.
Nodes with QoE traffic
Control how you monitor QoE nodes for Network Packet Analysis Sensor.
Auto-detect QoE nodes
Use this to detect and monitor the first 50 nodes with network traffic. This is active by default. You must select nodes manually when this option is disabled.
67

If you automatically detect nodes, you should also automatically detect applications to receive all metrics.
Add auto-detected monitored nodes
Further refine the nodes that are monitored by choosing to monitor all nodes that are traffic sources, traffic destinations, or all nodes that generate or receive network traffic. Packet sources and destinations are based on the source or destination IP address included in the packet.
n Transaction destinations (servers) - Monitor nodes that receive traffic based on the destination IP address of the packet.
n Transaction sources (client) - Monitor nodes that generate traffic based on the source IP address of the packet.
n Either a source or destination - Monitor all traffic.
Manage QoE Packet Analysis Sensors
Nodes that are defined as QoE Sensors appear on this page, as well as the nodes and applications that are being watched by each node.
n Each sensor can support up to 50 applications.
n PPPoE packets are not processed by QoE sensors.
Add a Packet Analysis Sensor to a node
Use the Add Packet Analysis Sensor wizard to select the nodes on which you want to deploy packet analysis sensors.
1. Click Settings > All Settings in the menu bar.
2. Click QoE Settings > Manage QoE Packet Analysis Sensors.
3. Click Add Packet Analysis Sensor.
4. Select either the Server or Network sensor type option.
n Server sensor - Installs an agent and QoE sensor on the selected Windows servers, then collects data locally on those servers.
n Network sensor - Installs an agent and QoE sensor on dedicated Windows servers monitoring SPAN or mirror ports. Collects packet data for any specified nodes/applications sending traffic through the monitored port.
5. Click Add Nodes.
6. Choose the Windows nodes that you want to deploy your sensors on.
7. Test the credentials for each node.
68

8. Click Add Nodes and Deploy Agents to deploy an agent on the node.
Deployment may take some time and will run as a background process.
QoE automatically chooses settings such as interface to capture traffic data, as well as memory and CPU limits, during agent deployment. You can change these settings once deployment is complete by selecting the sensor and clicking Edit.
When deployment is complete, a message is added to the notification area.You can also check the status on the Manage QoE Packet Analysis Sensors page.
9. Specify which nodes and applications to monitor. The steps for specifying nodes and applications can be found in Monitor QoE applications and nodes.
Disable a sensor
Sensors are enabled by default. You can disable a sensor as a troubleshooting tool or to disable a sensor if it is overloaded with traffic. A disabled sensor will not collect traffic information about any of the nodes listed for that sensor.
1. In the Manage Quality of Experience (QoE) Packet Analysis Sensors page, select the sensor and click Disable Sensor.
Delete a sensor
Deleting a sensor also deletes all of the nodes and applications associated with the sensor. It does NOT delete the nodes from Orion or the applications from the Manage QoE Applications page).
1. In the Manage Quality of Experience (QoE) Packet Analysis Sensors page, select the sensor and click Delete Sensor.
Delete nodes from Network sensors
Nodes cannot be deleted from Server sensors since they only record traffic on the node the sensor is installed on.
View the status of the Sensor
A status can be whether sensor is connected or not, if it is in the process of being deployed, and so forth. You can also access the Manage Agents page from here by clicking Manage Agent next to the sensor’s status.
1. In the Manage Quality of Experience (QoE) Packet Analysis Sensors page, view the Agent Status column.
Monitor applications for QoE
Applications are automatically monitored when traffic is detected by the Packet Analysis Sensor. However, you can manually select specific applications to monitor. QoE installs with the ability to monitor over 1000 pre-defined applications, including FTP, RDP, CIFS, SQL, and Exchange. You can also define your own custom HTTP applications.
69

n Because of the hardware requirements needed to process large amounts of traffic, SolarWinds recommends that you preferentially monitor business-critical nodes and applications.
n You should not assign more than 50 applications to a single node due to potential performance issues. However, you can monitor up to 1000 applications.
Monitor QoE applications automatically
While QoE sensors automatically detect and monitor applications by default, the settings may have changed or you may have upgraded from a version of QoE that does not automatically monitor applications.
Only applications that meet the criteria selected in QoE Applications are monitored automatically.
1. Click Settings > All Settings in the menu bar.
2. Click QoE Settings > Manage Global QoE Settings.
3. Select Active in Auto-detect QoE applications.
4. Change other settings to refine the number of applications you automatically monitor. See Global QoE Settings for more information on the settings.
5. Click Submit.
It may take some time for the settings to apply.
Monitor applications manually
You may choose to add monitored applications manually to QoE.
1. Click Settings > All Settings in the menu bar.
2. In the Settings grouping, click QoE Settings > Manage QoE Applications.
n Applications are only listed if there are monitored nodes. You must first add a Network or Server Sensor before you can enable any applications.
n Enabled applications are currently being monitored on at least one node. n Applications can be disabled, which means that no traffic for the application is
currently collected on any node.
3. Click Add New.
4. Select Choose a pre-configured application.
Applications that are already enabled do not display in the list.
5. Use the Search or Group By options to find the application you want to monitor, select it, and then click Next.
6. On the Configure Application view, edit the Category, Risk Level, or Productivity Rating as necessary, and then click Next.
70

7. On the Specify Nodes view, choose the nodes you want to monitor for this type of traffic.
Only nodes that have already been specified as nodes to monitor on the Manage QoE Nodes page display in this list.
8. Click Next.
9. Review your choices on the Summary page, and then click Finish.
Your newly enabled application will display on the Manage QoE Applications page in alphabetical order.
Monitor nodes with a network sensor
Nodes are automatically detected and monitored when network traffic originates from or terminates at a node. However, you can manually specify the nodes after the network sensor has been successfully deployed. For information about adding applications, see Monitor applications for QoE.
You can monitor up to 50 nodes per network sensor.
Add nodes automatically
While Network Sensors automatically detect and monitor nodes by default, the settings may have changed or you may have upgraded from a version of QoE that does not automatically monitor nodes. QoE automatically monitors the first 50 nodes with traffic.
n Automatic node discovery may not be 100% accurate due to devices with the same IP addresses in your network.
n Only nodes that meet the criteria selected in Nodes with QoE Traffic are added automatically.
1. Click Settings > All Settings in the menu bar.
2. Click QoE Settings > Manage Global QoE Settings.
3. Select Active in Auto-detect QoE nodes.
4. Change other settings to refine the number of nodes you automatically monitor. See Global QoE Settings for more information on the settings.
5. Click Submit.
It may take some time for the settings to apply.
Add nodes manually
If a node is already monitored and you want to monitor it with a different sensor, you must delete the node from the original sensor before you can add it to the new network sensor.
1. Navigate to the Manage QoE Packet Analysis Sensors page.
2. Expand the Network sensor that you want to add a node to.
71

3. Click the Add Node to Monitor button.
4. On the Create QoE Node page, choose the managed nodes you want to monitor with this network sensor.
5. On the Select QoE Applications page, choose the applications you want to monitor for these nodes. See Monitor applications for QoE for more information.
6. Review your selections on the Summary page.
7. Click Finish.
View the nodes and applications selected by expanding the Network Sensor you just configured.
Ignore traffic from applications or nodes
You can ignore traffic generated by applications or from a specific node.
Ignore application traffic
If you decide to no longer monitor an application, disable discovery or monitoring for that application in the Manage QoE Applications page.
These settings are on a global level. You cannot turn application discovery or monitoring on or off for specific sensors.
1. Click Settings > All Settings in the menu bar.
2. Click QoE Settings > Manage QoE Applications.
3. Toggle Monitoring or Discovery OFF.
Use the following table to determine which combination of settings you want to use.
MONITORING ON MONITORING OFF
DISCOVERY ONApplications are automatically discovered and application traffic is monitored
Applications are automatically discovered, but application traffic is not monitored
DISCOVERY OFFApplications cannot be automatically discovered, and application traffic is monitored
Applications cannot be automatically discovered, and application traffic is not monitored
Ignore node traffic
You can permanently ignore all traffic from specific nodes that you monitor on a network sensor. This is often used to reassign a node to a different network sensor.
You cannot add a node back to its original network sensor.
1. Click Settings > All Settings in the menu bar.
2. In the Settings grouping, click QoE Settings > Manage QoE Packet Analysis Sensors.
72

3. Select a network sensor, and click Edit.
4. Select the node you want to remove, and click Delete.
The node is removed from the sensor and all traffic to and from the node is ignored.
Define custom HTTP applications
In addition to choosing from predefined applications, you can define custom HTTP applications, and add them to nodes you are monitoring.
1. Click Settings > All Settings in the menu bar.
2. Click QoE Settings > Manage QoE Applications.
3. Click Add New.
4. On the Select Application page, select Create a new HTTP application, and click Next.
5. On the Configure Application page, enter the name and description of the application you’re creating, and then choose the Category, Risk Level, and Productivity Rating appropriate for the application.
6. Set the URL Filter. This specifies the HTTP application traffic to monitor. When you choose which filter to use in the drop-down, notice that the example changes to indicate how the accompanying text field will be used.
For example, selecting Hostname contains changes the help text to http://*...*/path/page.html. Any text you enter will be included in the filter where the "…" is.
7. Enter the hostname or URL for your filter, and then click Next.
8. On the Specify Nodes page, choose the nodes to monitor for this type of traffic. Only nodes that have already been specified as nodes to monitor (on the Manage QoE Nodes page) will display in this list.
9. Click Next. Review your choices on the Summary page, and click Finish.
Your new application will display on the Manage QoE Applications page in alphabetical order.
Advanced sensor configuration
Sensors cannot be edited until they are fully deployed. An entry displays in the notification area when your sensor is deployed, or you can check the Manage QoE Packet Analysis Sensors page. The status of completely deployed and working sensors is Up.
73
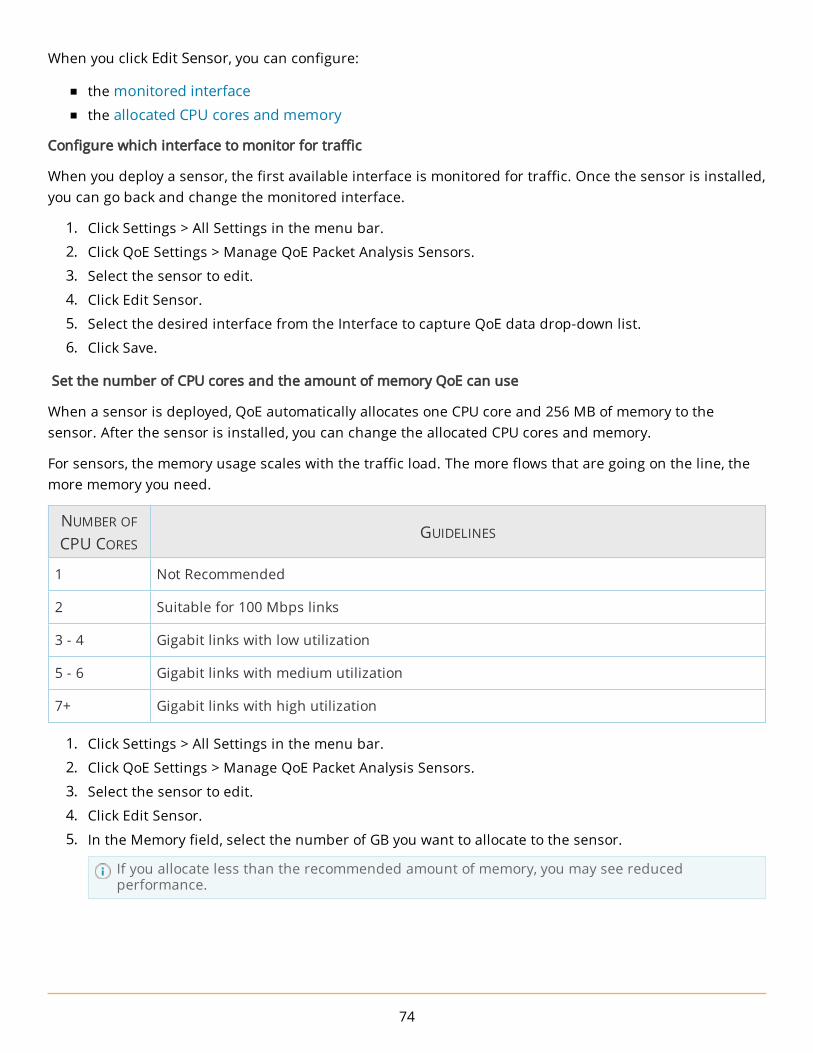
When you click Edit Sensor, you can configure:
n the monitored interface n the allocated CPU cores and memory
Configure which interface to monitor for traffic
When you deploy a sensor, the first available interface is monitored for traffic. Once the sensor is installed, you can go back and change the monitored interface.
1. Click Settings > All Settings in the menu bar.
2. Click QoE Settings > Manage QoE Packet Analysis Sensors.
3. Select the sensor to edit.
4. Click Edit Sensor.
5. Select the desired interface from the Interface to capture QoE data drop-down list.
6. Click Save.
Set the number of CPU cores and the amount of memory QoE can use
When a sensor is deployed, QoE automatically allocates one CPU core and 256 MB of memory to the sensor. After the sensor is installed, you can change the allocated CPU cores and memory.
For sensors, the memory usage scales with the traffic load. The more flows that are going on the line, the more memory you need.
NUMBER OF
CPU CORESGUIDELINES
1 Not Recommended
2 Suitable for 100 Mbps links
3 - 4 Gigabit links with low utilization
5 - 6 Gigabit links with medium utilization
7+ Gigabit links with high utilization
1. Click Settings > All Settings in the menu bar.
2. Click QoE Settings > Manage QoE Packet Analysis Sensors.
3. Select the sensor to edit.
4. Click Edit Sensor.
5. In the Memory field, select the number of GB you want to allocate to the sensor.
If you allocate less than the recommended amount of memory, you may see reduced performance.
74

6. In the CPU Cores field, select the number of CPU cores you want to allocate to the sensor.
If you allocate fewer than the recommended number of CPU cores, you may see reduced performance.
7. Click Save.
Configure QoE thresholds
You can modify the application response time (ART), network response time (NRT), volume, and transaction thresholds that are used to alert you to irregularities in your network.
We recommend that the sensors collect a few days' worth of data before setting thresholds.
1. Click Settings > All Settings in the menu bar.
2. Click QoE Settings > Manage QoE Applications.
3. Select the application to edit, and click Edit.
4. Click Next, and then click Next again.
5. On the Summary page, click the plus sign by Thresholds.
6. Select Override Orion General Thresholds next to each data type.
7. Change the threshold. You can use specific thresholds or you can use a dynamic threshold based onthe baseline established. The default baseline is seven days, which is configurable in the OrionPolling Settings page.
8. Click Finish.
Packet Analysis Sensor agents
The software that provides a communication channel between your SolarWinds server and the monitored object to which you have deployed your Packet Analysis Sensor is called an "agent". Agents are used to send the data that QoE collects back to the SolarWinds Orion server. The agent runs as a service, and it has a small installed footprint (under 100MB installed).
Monitor devices with SolarWinds Orion agentsAn agent is software that provides a communication channel between the Orion server and a Windows computer. Agents are used to provide information about key devices and applications that you specify. This can be beneficial in the following situations:
n Polling hosts and applications behind firewall NAT or proxies.
n Polling node and applications across multiple discrete networks that have overlapping IP address space.
n Secure, encrypted polling over a single port.
n Support for low bandwidth, high latency connections.
n Polling nodes across domains where no domain trusts have been established.
n Full ,end-to-end encryption between the monitored host and the main poller.
75

You can monitor servers hosted by cloud-based services such as Amazon EC2, Rackspace, Microsoft Azure, and other Infrastructure as a Service (IaaS).
After deployment, all communication between the SolarWinds Orion server and the agent occur over a single fixed port. This communication is fully encrypted using 2048-bit TLS encryption. The agent protocol supports NAT traversal and passing through proxy servers that require authentication.
Java Management Extensions (JMX) polling is not supported using a Windows agent.
Agent settings
The Agent Settings page provides access to all of the settings and tools needed to install and manage agents. Additional agent settings can be found in the Windows Control Panel.
Navigate to the Agent Settings page
1. Click Settings > All Settings in the menu bar.
2. Under Product Specific Settings, click Agent Settings.
n Manage Agents: opens the Manage Agents page from which you can add a new agent, edit, update, or reboot an existing agent.
n Download Agent Software: opens the Agent Downloads page from which you can mass deploy or manually install an agent.
n Define Global Agent Settings: opens the Global Agent Settings page from which you can allow automatic agent registration and allow automatic agent updates.
Adjust the Global Agent Settings
1. Click Settings > All Settings in the menu bar.
2. Under Product Specific Settings, click Agent Settings.
3. Click Define Global Agent Settings.
The following options are available on the Global Agent Settings page:
n Allow automatic agent registration: Select this option to automatically register the agent and verify communication with the Orion Server. If this option is disabled, you can register any waiting agents by clicking Settings > All Settings > Manage Agents > Add Agent > Connect to a previously installed agent.
n Automatically create node: Agents are automatically registered as Orion nodes.
n Allow automatic agent updates: Select this option to automatically upgrade the agent software when updates are available. This process pushes a new version of the agent to client computers over the agent communication channel. No extra ports or permissions are needed. After the agent receives the new version, it updates itself. This process typically does not require rebooting.
If automatic updates are disabled and a new version of the software is installed on the server, outdated agents may not be able to communicate with the server. Ensure all agent versions match the version of the server.
n XX Hours: Control the length of time the agent displays as new in the Manage Agents list.
76

Server-initiated communication
All communication between your Orion server or additional polling engine and the agent is initiated by the Orion server, and the agent does not initiate communication to your Orion server. You must have a direct route from the Orion server or additional poller to the host where the agent is installed. To use this communication method, port 17790 must be open on the firewall of the remote host to retrieve information from the agent.
This communication method is also known as a passive agent.
Agent-initiated communication
All communication between your Orion server or additional poller engine and the agent is initiated by the agent, and your Orion server does not initiate communication with the agent. You do not need to have a direct route from the Orion server or additional poller to the host where the agent is installed. To use this communication method, port 17778 must be open on the Orion server firewall to receive information from the agent.
This communication method is most useful when the agent is installed on a network separated from your Orion server by one or more NAT devices, and you have no easy way to connect the two.
This communication method is also known as an active agent. In active mode, there are no listening ports on the agent.
77

Windows agent deployment
SolarWinds Orion products supports three methods of deploying an agent to a client computer running Windows.
n Push the agent software from the Orion Server to one or more client computers.
n Mass deploy the agent software to multiple computers using a mass deployment technology, such as Group Policy.
n Manually install the agent on a client computer.
Agents do not work with AppInsight for SQL when the SQL Server being monitored is in a cluster.
Deploy Windows agent software through a server push
Select this method of deployment to perform a network-wide deployment from the SolarWinds Orion server. This method does not require downloading additional files. In order for this deployment method to succeed, the SolarWinds Orion server must be able to communicate with the client computers.
1. Click Settings > All Settings in the menu bar.
2. Under Node & Group Management, click Manage Agents.
3. Click Add Agent.
4. Select how you would like to add the agent.
Deploy the agent on my network
Select this method to install the agent on multiple client computers.
1. On the Deploy Agent on Network page, enter the IP address or host name of the Windows computer where you want the agent to be installed, or select nodes from the list, and then click Next.
The IP address field does not accept ranges. Only add computers that are not nodes in the system.
2. On the Agent Settings page: a. Select the computer you selected in the previous step, and click Assign Credentials b. Select a credential from the list, or enter new credentials, and click Submit.
You can assign credentials to multiple locations or nodes by selecting multiple entries.
3. Click Deploy Agent.
When the connection is successful, the agent displays in the agent list on the Manage Agents page.
Connect to a previously installed agent
Select this method to connect to agents that were configured with server-initiated communication, or if Allow Automatic Agent Registration is not enabled. When you connect to an agent, you first need to select the communication mode that was chosen when the agent was installed. If the communication mode is server-initiated (passive), a shared secret was required during installation. This secret must be entered again here.
78

1. On the Add Agent page, enter a name for the Agent.
2. Select the agent communication mode.
3. For server-initiated communication: a. Enter the IP address or host name where the agent is located. b. Enter the shared secret. c. Optional: Expand Advanced and adjust the following settings as needed:
a. Change the agent port number. This is the port the agent uses for listening. b. Use a proxy. Select a proxy and enter the proxy URL. c. Use proxy authentication, and enter credentials.
4. For Agent-initiated communication, select the agent from the Agent list.
5. Select Allow automatic agent updates to upgrade the agent automatically when upgrading to new versions of Orion Platform modules that support the agent.
Disabling this option requires you to manually upgrade agents after upgrading your Orion Platform products.
6. Click Submit.
When the connection is successful, the agent displays in the agent list on the Manage Agents page.
Deploy the Windows agent manually
Selecting this method of deployment may be helpful in troubleshooting connectivity issues with another form of agent deployment. This method is also helpful when the Orion server cannot communicate directly with the endpoint where the agent will be installed, such as in the case of Active Agent mode.
1. Click Settings > All Settings in the menu bar.
2. Under Product Specific Settings, click Agent Settings > Download Agent Software.
3. Click Install Manually, and click Next.
4. Click Download MSI.
5. Download and copy the MSI file to the client machine, and execute it.
6. In the Installation wizard, select Agent Initiated Communication or Orion Server Initiated Communication.
7. Enter the SolarWinds Orion server IP address or hostname, and the SolarWinds Orion administrator account credentials.
When installation is successful, the agent displays in the agent list on the Manage Agents page.
Mass deploy a Windows agent
If you are already using a mass-deployment technology, this deployment method is an easy way to get agents on a large number of computers.
Polling engine selection is important. When you download the MST file, the file includes the polling engine IP address and other vital information. When you deploy the agent using the MSI file, along with the MST file on the managed node, the agent will be installed and pointed to the correct polling engine.
79

What is an MST file?
A Microsoft Transform (MST) file is a collection of specified changes applied to a base Windows Installer package file at the time of deployment. It is an overlay on top of an existing MSI file that defines what specific components or features of an application get installed. The MST file modifies the Microsoft Installer package.
After the software you want to install is packaged in the Windows Installer package format, you can use MST files to customize the software for your organization, such as installing only specific features. The modular design of Windows Installer packages simplifies deployment. When you apply transforms to an MSI file, Windows Installer can dynamically add or modify data in the installation database to customize the installation of the application. Additional information on creating MST files can be found on technet.microsoft.com.
Generate and download the MST file
1. Click Settings > All Settings in the menu bar.
2. Under Product Specific Settings, click Agent Settings > Download Agent Software.
3. Click Mass Deploy to Multiple Machines, and click Next.
4. Select the agent communication mode.
n For agent-initiated communication, enter the polling engine you want the agent to use. You may need to manually enter the polling engine information if the IP address is different from what the SolarWinds Orion server reports. This happens when the monitored host is behind a NAT or proxy device. In these cases, enter the IP address of the SolarWinds Orion server or the additional polling engine as it is accessible from the host where the agent will be installed.
a. To use an existing polling engine, select Use Connection Details from Polling Engine, and then select a polling engine from the list.
b. To manually enter the polling engine IP address, select Enter Connection Details Manually, and then enter the host name and IP address. The IP address is required. Use the host name and IP address of the polling engine that you can access from the client.
n For server-initiated communications, enter your agent communication port number. The default port is 17790.
5. Click Download .MSI, and save the file.
6. Click Download .MST, and save the file.
Add the MST file to a Group Policy
1. Share a folder containing the MST and MSI files with proper permissions.
2. In Active Directory, locate the container where you want to advertise the application, and then access the container properties.
A container is a site, domain, or organizational unit (OU).
3. Create a Group Policy object.
4. In Advanced Options, add the Software installation policy. Select the network path for the agent MSI and MST files.
The agent is deployed at login and is registered by Orion (if auto-registration is enabled).
80

Deploy with a Gold Master Image
Use a Gold Master Image when you want to maintain a master image of agent software that is copied when a new server is provisioned. This saves time for virtual machines, physical servers, and cloud instances. Whenever a new server is brought online using this image, the agent will already be installed.
Install an agent offline
1. Click Settings > All Settings in the menu bar.
2. Under Product Specific Settings, click Agent Settings > Download Agent Software.
3. Click Distribute via a Golden Master Image, and click Next.
4. Select the agent communication mode.
n For agent-initiated communication, enter the polling engine you want the agent to use. You may need to manually enter the polling engine information if the IP address is different from what the SolarWinds Orion server reports. This happens when the monitored host is behind a NAT or proxy device. In these cases, enter the IP address of the SolarWinds Orion server or the additional polling engine as it is accessible from the host where the agent will be installed.
a. To use an existing polling engine, select Use Connection Details from Polling Engine, and then select a polling engine from the list.
b. To manually enter the polling engine IP address, select Enter Connection Details Manually, and then enter the host name and IP address. The IP address is required. Use the host name and IP address of the polling engine that you can access from the client.
n For server-initiated communications, enter your agent communication port number. The default port is 17790.
5. Click Download .ZIP, and save the file.
6. Extract the contents of the ZIP file, and double-click setup.bat.
7. Follow the instructions in the Installation wizard.
Enable server-initiated communication on deployed agents
If you are deploying a server-initiated agent, take the following steps to enable agent communication with your SolarWinds Orion server.
1. Click Settings > All Settings in the menu bar.
2. Under Node & Group Management, click Manage Agents.
3. Click Add Agent > Connect to a previously installed agent > Next.
4. Enter a name for the agent, and click Server-initiated communication.
5. Enter the IP address of the node where the agent is deployed, and the port number for the agent. The default port is 17790.
6. Click Submit.
Deploy a Windows agent with Patch Manager
You can only perform this deployment method if you have successfully configured Patch Manager to push software in your environment. This method contains four parts you must perform in order: download the installation files, build the package, add deployment rules, and publish the package.
81

Download the installation files
1. Click Settings > All Settings in the menu bar.
2. Under Product Specific Settings, click Agent Settings > Download Agent Software.
3. Click Mass Deploy to Multiple Machines, and click Next.
4. Select the communication method and enter the required information. For more information, see Mass deploy a Windows agent.
5. Download and save the MSI and MST files to a location on your Patch Manager server.
Record the Latest Version value under the MSI file download. This is needed when creating a package in Patch Manager.
Optional: Rename the SolarWinds agent files to SolarWinds Agent <version> for easier tracking.
Build the package
1. Launch SolarWinds Patch Manager.
2. In the navigation pane, expand Administration and Reporting > Software Publishing, and then click SolarWinds, Inc. Packages.
3. From the SolarWinds, Inc. Packages action pane, click New Package. This launches the Patch Manager Package Wizard.
82

4. In the package information screen, enter the following general information for the package:
n Package Title: SolarWinds Orion Agent (version number) MSI n Description: SolarWinds Orion Agent n Classification: Tools n Vendor: SolarWinds, Inc. n Product: Orion Agent (This must be entered the first time) n Severity: None n Impact: Normal n Reboot Behavior: Can request reboot
All other fields can be left empty.
5. Click Next.
Add deployment rules
1. On the Prerequisite Rules window, click Add Rule.
2. Select Windows Version as the Rule Type, and enter the following information:
3. Click OK to save this rule, and click Next.
4. On the Select Package window, select the Package Type as a Microsoft Installer File (.msi), and then select I already have the content for the package locally on my network.
5. Click the browse icon and locate the MSI file for the SolarWinds Orion agent. The Download URL field will automatically populate.
83

6. The GUID product code is extracted from the MSI file and displayed for review. Copy the GUID product code that you will use later.
The GUID is detected from the installer. Use the one displayed in your environment.
7. Select Includes additional files with the package, and click the button to the right to open the Package Content Editor.
8. In the Package Content Editor, click Add Files, and browse to the MST File for the SolarWinds Orion agent.
9. Click OK to close the Package Content Editor. To confirm that you want to add these files to the cache, click Yes.
10. Select None for the Binary Language.
11. In the Command Line field, enter: TRASNFORMS=(MST FILE NAME)
Example: TRANSFORMS=SolarWinds_Agent_1.5.0.951.mst
12. Click Next.
13. On the Applicability Rules window, click Add Rule > Create MSI Rule.
14. Select Rule Type: Product Installed, and select Not Rule.
15. Enter the product code without the brackets, and leave all other fields empty.
16. On the Installed Rules window, click OK to save the rule, and then click Next.
17. Click Add Rule > Basic Rule.
18. For the Rule Type, select File Version with Registry Value. Enter the following values: a. Registry Key: HKEY_LOCAL_MACHINE\SOFTWARE\Wow6432Node\SolarWinds\Agent b. Registry Value: InstallDir c. Comparison: Equal To. d. Version: Version number of the agent
84

19. Click OK to save the rule, and click Next. Review the Summary Page, and enter notes at the bottom.
20. Click Next to save, and click OK.
When the file packaging and uploading completes, a Package Saved dialog displays.
Publish the package
1. In the SolarWinds, Inc. Packages view in Patch Manager, select the SolarWinds Orion Agent package that you created.
2. In the SolarWinds Orion Agent action pane, click Publish Packages.
3. Accept the default selections, or choose a specific Windows Server Update Services (WSUS) server for publication, and then click Next.
4. You are notified when the package publishes.
5. Click Finish to close the Publishing Wizard.
The package for the SolarWinds Orion agent is packaged and published to your WSUS server.
Deploy on Windows Core Servers
If you are installing the agent on a Windows Core Server, you must install the .NET Framework 4.5. Also install the latest Windows service pack and critical updates.
Prerequisites to installing an agent on Windows Core
n Start WoW64.
n Start the .NET 2.0 layer.
n Start the .NET 2.0 layer for WoW64.
n Download and install the .NET framework from www.microsoft.com.
By default, no web browser is installed with Windows Core. Consider transferring the necessary files with FTP or a flash drive.
After the .NET Framework is installed, you may need to reboot the host server. The agent can then be deployed to the host server and operate normally.
Manually deploy a Windows agent on Amazon Web Services
You can manually deploy agents to a virtual machine using Remote Desktop Connection.
85

Requirements for manual agent deployment
n Agent-initiated communication: The poller must have a public IP address which is visible from the node with the agent installed. Port 17778 must be open on the poller.
n Server-initiated communication: The node with the agent installed must have a public IP address. Port 17790 must be open.
You can manually deploy the agent in one of two ways:
Install through the command prompt
1. Click Settings > All Settings in the menu bar.
2. Under Product Specific Settings, click Agent Settings > Download Agent Software.
3. Click Mass Deploy to Multiple Machines, and click Next.
4. Download the MSI and MST files.
5. Run a command prompt as administrator from the context menu.
6. Enter the following command:
msiexec /i "SolarWinds-Agent.msi" TRANSFORMS="SolarWinds-Agent.mst"
Deploy the agent manually using the interactive wizard
Follow the instructions in Deploy the Windows agent manually.
Automatically deploy a Windows agent on Amazon Web Services
1. Click Settings > All Settings in the menu bar.
2. Under Product Specific Settings, click Agent Settings > Download Agent Software.
3. Click Mass Deploy to Multiple Machines, and click Next.
4. Download the MSI and MST files.
5. Log in to your Amazon Web Services S3 account.
6. Create a bucket and upload the MSI and MST files.
7. Create a PowerShell script to use on each virtual machine where you want to install the agent. This script will run on each virtual machine when it is launched for the first time, downloading and executing the agent.
8. Log in to your Amazon Web Services account.
You can perform the following steps through the API or AWS command line interface.
9. Create an instance, and paste your PowerShell script under Advanced Details in the User Data text box. Select the As Text option.
10. For instances that are already created, take the following steps: a. Stop the instance where you want to deploy the agent b. Right-click the instance and click Instance Settings > View/Change User Data. c. Paste your PowerShell script in the text box as Plain Text.
86

Automatically deploy a Windows agent on Microsoft Azure
1. Click Settings > All Settings in the menu bar.
2. Under Product Specific Settings, click Agent Settings > Download Agent Software.
3. Click Mass Deploy to Multiple Machines, and click Next.
4. Download the MSI and MST files.
5. Upload the MSI and MST files to your Azure Blob Storage.
6. Create a PowerShell script to use on each virtual machine where you want to install the agent. Thisscript will run on each virtual machine when it is launched for the first time, downloading andexecuting the agent.
7. Add your PowerShell script to virtual machines manually on the last step of the Create a VirtualMachine wizard in the Azure management portal.
This step can also be accomplished via the API or AWS command line interface.
Certificates and the agent
The Verisign Root Certificate Authority (CA) must be current. This is required because the agent software is signed using a Verisign certificate. If your certificate is not current, you must download the Root CA certificate and install it to the Local Computer\Trusted Root Certification Authority store onthe server hosting the agent.
For more information, search for "Add the Certificates Snap-in to an MMC" at technet.microsoft.com.
87

Agent management
Check agent connection and deployment status on the Manage Agents page.
1. Click Settings > All Settings in the menu bar.
2. Under Node & Group Management, click Manage Agents.
Manage Agents toolbar options
BUTTON DESCRIPTION
Add AgentGo to the Add Agent page, where you can deploy the agent on a network, or connect to a previously installed agent.
Edit Settings
Go to the Edit Agent Settings page, where you can adjust the agent name and automatic updating.
Delete Remotely uninstall the agent.
Choose Resources
Displays a list of resources and statistics to monitor. This is only available for agents that are deployed on nodes.
n For a Single Agent: Go to the List Resources page to choose items on the node you want to monitor.
n For Multiple Agents: From here, Orion discovers available resources on the agents you have selected using Network Sonar Discovery. You can choose items on the nodes to monitor.
Manage as Node
Manage the agent as a new node by navigating to the Add Node page with pre-configured agent details.
More Actions
n View installed agent plug-ins: Displays a dialog detailing the node the agent is deployed on, the agent status, connection status, plug-in status, and plug-in version.
n View installed plug-ins report: Generates a report detailing node status, agent DNS name, automatic update enabled, connection status, agent status, agent version, plug-in, plug-in status, and plug-in version.
n Retry agent installation: Attempts to install the agent in the event of a file transfer timeout due to network connectivity issues.
n Reboot Agent Machine: Reboots the server that hosts the selected agent.
This button is disabled by default. It is enabled when the installation of an agent requires a system reboot.
88

BUTTON DESCRIPTION
n Update: Updates the agent software to the latest version available.
This button is disabled by default. It becomes enabled when: n Automatic updates for the agent is disabled. n The selected agent requires an update.
n Reconnect to passive agent: The server tries to re-establish the connection to the passive agent when the connection is lost and automatic reconnection fails. This can also be used for connecting to an agent that was deleted but not uninstalled.
Manage Agents table columns
The table on the Manage Agents page displays information on the status and connection of your agents.
COLUMN HEADER DESCRIPTION
Agent/Node Name or IP address of the listed node.
Agent Status
Current status of the listed agent.
Agent Status can be as follows:
n Connected/OK: Everything is working.
n Unknown: The agent is connected but no communication is received.
n Update Available: The agent version is older than the version on the server and should be updated.
n Update in Progress: The agent is currently being updated.
n Reboot Required: The agent needs to be rebooted in order to finish the installation of plug-ins.
n Reboot in Progress: The agent is currently being rebooted. Once reboot is complete, the agent should finish installation of plugins.
n Reboot Failed: The agent cannot be rebooted. It may be temporarily offline or there may be some other issue.
n Plugin Update Pending: A plugin on the agent has an older version than the one that is on the server and should be updated.
Connection Status
Current connection status of the listed agent.
Connection status can be as follows:
n Connected/OK: The agent is connected.
n Unknown: The agent management service is not running.
n Service not Responding: The agent management service is running, but the agent is not connected.
n Deployment Pending: An agent deployment is going to start, but has not started.
89

COLUMN HEADER DESCRIPTION
n Deployment in Progress: The agent is being deployed to the target node.
n Deployment Failed: Agent deployment failed.
n Invalid Response: The status displayed if the agent responds in an unexpected manner.
n Waiting for Connection: The agent was approved, but has yet to connect to the Orion server.
Registered On Date when the agent was added to the agent management system.
Mode
Agent communication type:
n Agent-initiated: The agent initiates the connection to the agent management system.
n Server-initiated: The agent listens on its designated port for connections from the Orion server.
VersionVersion of the agent software. This is helpful in determining which agents should be updated.
Edit agent settings
Editing the configuration of an agent may be necessary if you experience problems and want to collect diagnostics.
1. Click Settings > All Settings in the menu bar.
2. Under Node & Group Management, click Manage Agents.
3. Select an agent, and click Edit Settings.
Agent settings and troubleshooting options
n Agent Name: change the display name displayed in Orion.
n Communication type: choose whether the agent uses server-initiated or agent-initiated communication.
n Allow automatic agent updates: choose whether the Orion server can update the agent software to the latest version available.
n Troubleshooting:
n Log level: the amount of detail saved to the log.
n Diagnostics: click Collect new diagnostics, and then Download to save to your local disk. Send the zip file to our support team if requested.
Track your polling method
If nodes are using different polling methods, you may want to keep track of the polling method of each node to troubleshoot issues more easily. There are several methods you can use to identify the polling method of nodes:
90

n Node Details page: view individually
n Application Details page: view individually
n Manage Nodes page: view as a list
n Create a report to identify agent usage
Identify the polling method from the Node Details page
1. From the web console, click My Dashboards > Home.
2. In the All Nodes resource, expand a node tree and click a node to go to the Node Details page.
3. In the Polling Details resource, locate the Polling Method.
Identify the polling method from the Application Details page
1. From the Orion Web Console, click My Dashboards > Applications.
2. In the All Applications resource, expand an application tree and click an application to go to the Application Details page.
3. In the Application Details resource, click Management > Edit Application Monitor.
4. Expand the Advanced heading to locate the Preferred Polling Method.
All applications default to agent-based polling, even when no agent is installed. Use this option to override the default behavior.
Identify the polling method from the Manage Nodes page
1. Click Settings > All Settings in the menu bar.
2. Under Node & Group Management, click Manage Nodes.
3. If not already visible, add the Polling Method field by clicking >> in the upper-right of the table.
Create a report to identify agent usage
1. From the web console, navigate to Reports > All Reports.
2. Enter agent in the Search box.
3. Click Agent Inventory to view the report.
View the status of agent plug-ins
1. Click Settings > All Settings in the menu bar.
2. Under Node & Group Management, click Manage Agents.
3. Select an agent, and click More Actions > View installed agent plug-ins.
91

STATUS MEANING
The plug-in is installedThe plug-in is installed, working correctly, and communicating with no problems.
Installation PendingThe plug-in is waiting to be deployed. It may be waiting for the computer it is installed on to reboot, or because some other process on the remote host has interrupted the installation process.
UnknownThe status is unknown due to networking interruptions, communication problems with the agent, or because the plug-in is no longer installed.
Error The plug-in may have installed incorrectly or failed to load.
In Progress The plug-in is either being installed or uninstalled.
If you think a plug-in should be available and cannot find it in the list, you may need to check your purchased products or manually update your agent. New plug-ins and updates to existing plug-ins are installed when an agent is updated. It may take a few minutes before the status changes.
Orion deploys and removes plug-ins as needed when you enable and disable features. It is normal for agents to have different plug-ins.
Edit agent settings in the Windows Control Panel
If the agent loses connectivity to the SolarWinds Orion server, or is unable to connect after being manually installed, you can configure its settings in the Windows Control Panel. This enables the agent to reconnect to the SolarWinds Orion server.
1. Open Orion Agent Settings in the Control Panel.
2. Select the Agent Communication Mode.
3. Edit the Connection Settings.
The Agent Shared Secret is provided for security. When you install the agent, you must set a shared secret. When the SolarWinds Orion server connects to the agent, it verifies the secret to connect.
4. Click OK to save your changes.
Connect to a previously installed agent
You can connect to agents that you installed previously or modify the assigned polling engine of the agent. The steps are different depending on the agent communication mode. You should confirm the agent communication mode before connecting.
Connect to an agent using agent-initiated communication
1. Click Settings > All Settings in the menu bar.
2. Under Node & Group Management, click Manage Agents.
3. Click Add Agent.
4. Click Connect to a previously installed agent, and click Next.
92
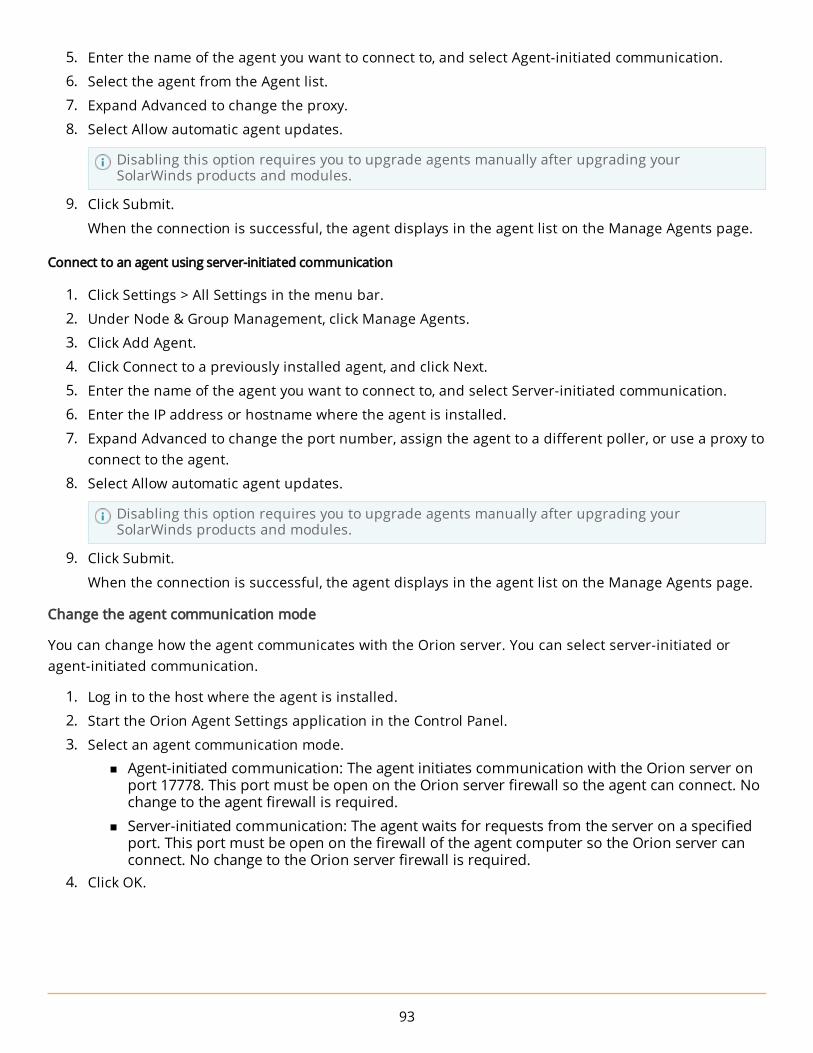
5. Enter the name of the agent you want to connect to, and select Agent-initiated communication.
6. Select the agent from the Agent list.
7. Expand Advanced to change the proxy.
8. Select Allow automatic agent updates.
Disabling this option requires you to upgrade agents manually after upgrading your SolarWinds products and modules.
9. Click Submit.
When the connection is successful, the agent displays in the agent list on the Manage Agents page.
Connect to an agent using server-initiated communication
1. Click Settings > All Settings in the menu bar.
2. Under Node & Group Management, click Manage Agents.
3. Click Add Agent.
4. Click Connect to a previously installed agent, and click Next.
5. Enter the name of the agent you want to connect to, and select Server-initiated communication.
6. Enter the IP address or hostname where the agent is installed.
7. Expand Advanced to change the port number, assign the agent to a different poller, or use a proxy to connect to the agent.
8. Select Allow automatic agent updates.
Disabling this option requires you to upgrade agents manually after upgrading your SolarWinds products and modules.
9. Click Submit.
When the connection is successful, the agent displays in the agent list on the Manage Agents page.
Change the agent communication mode
You can change how the agent communicates with the Orion server. You can select server-initiated or agent-initiated communication.
1. Log in to the host where the agent is installed.
2. Start the Orion Agent Settings application in the Control Panel.
3. Select an agent communication mode.
n Agent-initiated communication: The agent initiates communication with the Orion server on port 17778. This port must be open on the Orion server firewall so the agent can connect. No change to the agent firewall is required.
n Server-initiated communication: The agent waits for requests from the server on a specified port. This port must be open on the firewall of the agent computer so the Orion server can connect. No change to the Orion server firewall is required.
4. Click OK.
93

Change the agent port
1. On the computer with the deployed agent, edit the following configuration file using a text editor:
C:\Program Files (x86)\SolarWinds\Orion\AgentManagement\SolarWinds.AgentManagement.ServiceCore.dll.config
2. Change the port number on the following line:
<agentManagementServiceConfiguration messagingPort="17778" />
3. Save the file.
4. Restart the SolarWinds Orion Module Engine service.
n If you installed the agent manually, you can change the port number during installation through the wizard in the web console.
n If you deployed the agent from the server, the port number is set automatically.
n If you used the MST file for mass deployment, you must download a new MST file from the server after you change the port number.
Change the port on deployed agents
1. Log in to the computer with the deployed agent.
2. Open Orion Agent Settings in the Control Panel.
3. Enter a new port number, and click OK.
Agent polling method
When the Agent Polling Method is selected, an agent is deployed to the node and installed using the credential you selected. After the agent is installed, it operates under a local account.
Check nodes polling with agents for changes
Agent discovery has an option to keep nodes that use agents updated. Select this option so the Orion server can find new volumes, interfaces, and other objects on nodes that are polled by an agent.
While normal discovery finds new nodes and adds them to the SolarWinds Orion server, this is not true for nodes using the agent. Agent discovery is an extension to the standard discovery process.
94

A discovery profile may contain:
n Nodes using both the agent and non-agent nodes
n Non-agent nodes
n Agent nodes
View network events in the Web ConsoleAll events that occur to monitored devices on your network are automatically logged and displayed in the Orion Web Console. You can view and remove them as your network management policies require.
Filter the displayed logged events in the Web Console
Network events are logged and shown in the order they occur in the Events view of the Orion Web Console.
You can choose how long network events are kept in the Events Retention field in Orion Polling Settings under Database Settings.
1. Click Alerts & Activity > Events in the menu bar.
2. Filter events by object, event type, or time period.
3. In the Show X Events field, provide the maximum number of events to view. Showing a large number of events, such as a 1000, can negatively impact performance.
4. To show events that have already been cleared, select Show Cleared Events.
5. Click Refresh.
Remove events from the Web Console
Clearing an event removes the event from the Events view.
Cleared events are not removed from the event log and can still be used for reporting.
1. Click Alerts & Activity > Events in the menu bar.
2. Select individual events to clear or click Select All. 3. Click Clear Selected Events.
Monitor Syslog messagesSyslog messages are received by the SolarWinds Syslog Service, which listens for incoming messages on UDP port 514. Received messages are decoded and stored in the SolarWinds Orion database. The SolarWinds Syslog Service can handle large numbers of simultaneously incoming Syslog messages from all your monitored devices.
A SolarWinds installation can process approximately 1 million Syslog messages per hour, which is about 300 Syslog messages per second. You can process more by increasing your hardware requirements over the minimum requirements.
You can view Syslog messages in the Orion Web Console or in the Syslog Viewer application.
95

Before you begin
n Confirm that your network devices are configured to send Syslog messages to the SolarWinds Orion server IP address. For proper configuration of network devices, refer to the documentation supplied by the device vendor.
n Ensure UDP port 514 is open for IPv4 and IPv6.
n The message must be formatted according to the Request for Comments (RFC) requirements.
n If a long message is split into smaller parts, these parts should be formatted to not be skipped.
SolarWinds recommends setting up Enable RFC Relay in the service to true to allow the service to restructure the message by adding the default facility, severity, or date.
View Syslog messages in the Orion Web Console
The Orion Web Console provides both syslog-specific resources and a syslog view with a table of syslog messages received by your SolarWinds Orion server.
The Syslog view displays a list of all the syslog messages generated by monitored network devices. The messages are listed by time of transmission, with the most recent at the top of the list.
1. Log in to the Orion Web Console, and click Alerts & Activity > Syslogs in the menu bar.
2. To filter syslog messages so that only messages relevant for specific devices are displayed:
n To view messages for a specific syslog-enabled network object, select it in the Network Object list.
Only objects that have sent a syslog message to the Orion server will be listed in this field.
n To view messages for a specific device, provide the IP address in the IP Address field. n To view messages for a specific device type, select it in the Type of Device list. n To view messages for a specific vendor, select the vendor in the Vendors list.
96

3. To select which syslog messages should be displayed:
n To view only messages with a severity, select the severity. n To view messages for a facility, select the facility. n To view messages of a type, type the string into the Message Type field. n To view only messages containing a pattern, provide the string in the Message Pattern field.
You can use the following wildcards:Asterisk (*)
Use * before or after the pattern string if the provided pattern is not the beginning, the end or the full message.
Underscore (_) Use _ as a placeholder for one character.
n To view syslog messages from a specific period of time, select either a period of time or enter custom Beginning and Ending Date/Times.
n Type the number of syslog messages you want to view into Number of Displayed Messages. n To view cleared and acknowledged syslog messages, select Show Cleared Messages.
4. Click Refresh to update the syslog messages list with your settings.
Syslog messages matching the selected criteria display in a list beneath the search area.
Click Hide or Show in the top-right corner of the view to remove or restore the Syslog messages search criteria area.
Click the Hostname or Message to open the Device Details view for the device.
Clear Syslog messages in the Orion Web Console
1. Log in to the Orion Web Console.
2. Click Alerts & Activity > Syslogs in the menu bar.
3. Define what you want to see in the Syslog messages table, and click Refresh. 4. Select the messages you want to acknowledge, and click Clear Selected Messages.
The messages are cleared. You can see cleared messages when you select the Show Cleared Messages box.
Syslog resources in the Orion Web Console
Every syslog message has a designated severity.
Advanced Syslog Counts
This resource groups by severity all Syslog messages received by the currently viewed node. For each severity, this resource provides the number of received Syslog messages.
Advanced Syslog Parser
This resource provides a comprehensive view of the Syslog messages most recently received by the viewed node.
97

Advanced Syslog Summary
This resource groups by message type all Syslog messages received by the currently viewed node, where the message type is encoded in the Syslog message packet. For each message type, this resource provides the severity, the hostname or IP address of the message originator, and the total number of Syslog messages received.
Last 25 Syslog Messages
This resource provides a list of the last 25 Syslog messages sent by monitored network devices to the viewed node.
Click the hostname, IP address, or message text to the Object Details page, which provides extensive diagnostic information about the monitored network.
Click Edit to set the maximum number of displayed messages, select the time period for viewing messages, or establish filters to limit the displayed messages.
Syslog Summary
This resource lists the Syslog messages received by the viewed node from monitored network devices over a specified period of time.
View syslog messages in the Syslog Viewer
SolarWinds Orion also provides the standalone Syslog Viewer application for viewing and acknowledging Syslog messages on your network. Syslog Viewer collects Syslog messages from your network and presents them in a readily reviewable and searchable list so that you can easily monitor your network.
You must be able to log in to the computer running your SolarWinds Orion server.
Open the Syslog Viewer by clicking Start > All Programs > SolarWinds Orion > Syslog and SNMP Traps > Syslog Viewer.
View and clear Syslog messages in the Syslog Viewer
Syslog Viewer collects Syslog messages from your network and presents them in a readily reviewable and searchable list so that you can easily monitor your network. Clear messages you have already read and acted upon.
You must be able to log in to the computer running your SolarWinds Orion server.
1. Click Start > All Programs > SolarWinds Orion > Syslog and SNMP Traps > Syslog Viewer.
2. Click View > Current Messages.
3. Clear read messages:
n Right-click any message, and select Acknowledge Selected. n Add an Acknowledged column to the Syslog Viewer, and select the messages that you want to
acknowledge.
Selected messages are acknowledged now.
98

Search for Syslog messages in the Syslog Viewer
In the Syslog Viewer, you can search through collected Syslog messages and format search results.
1. Click View > Search Messages.
2. Enter the search criteria.
3. Click Search Database.
4. To group messages for easier navigation, select the type of grouping from the Grouping list.
You can acknowledge messages both in the search results and in the Current Messages view. See Define the number of messages displayed, message retention, and the displayed columns in the Syslog Viewer.
5. To limit the number of displayed message, enter or select a number in the Maximum Number of Messages to Display field.
6. To view messages that meet your search criteria as they arrive, select a number for the Auto Refresh Every number of seconds field.
Auto Refresh is only available when you are viewing current messages. The Date/Time Range must be set to Today, Last 24 Hours, Last 2 Hours, or Last Hour.
Define the number of messages displayed, message retention, and the displayed columns in the Syslog Viewer
You must be able to log in to the computer running your SolarWinds Orion server.
1. Click Start > All Programs > SolarWinds Orion > Syslog and SNMP Traps > Syslog Viewer.
2. Click File > Settings.
3. Click the General tab in the Syslog Server Settings window.
4. Adjust the Maximum Number of Messages to Display in Current Messages view slider to set the number of messages you want to display.
5. Automatically refresh the current messages view by selecting the option, and setting the refresh rate with the middle slider.
6. Adjust Retain Syslog Messages for How Many Days to set the length of time Syslog messages should stay in the database.
This setting significantly affects the database size and performance.
7. Click the Displayed Columns tab.
8. Use the arrow keys to select and order the fields of information you want to see in the Current Messages view.
Clearing Syslog messages is easier if you add the Acknowledged column to your view.
9. To wrap Syslog message text in the Current Messages view, select Word Wrap Long Messages.
99

10. If you do not expect to use the Syslog Viewer as your primary viewer for Syslog messages, select the Message Parsing tab, and select what should be removed:
n Remove embedded Date/Time from Syslog Messages n Remove Message Type from Syslog Messages n Remove Domain Name from DNS Lookups.
Removing the added data from each record helps you reduce the size of your SolarWinds Orion database.
Trigger alerts when receiving specific Syslog messages
You must be able to log in to the computer running your SolarWinds Orion server.
1. Click Start > All Programs > SolarWinds Orion > Syslog and SNMP Traps > Syslog Viewer.
2. Click File > Settings.
3. Click Alerts/Filter Rules.
4. Click Add New Rule to create a rule, or edit a selected rule.
5. On the General tab, complete the following steps: a. Provide or edit the Rule Name. b. Select Enabled. c. Select the servers from the Apply this Rule To list. d. Enter the IP addresses or subnets to which this rule applies in the Source IP Addresses area.
Syslog rules may not be applied to nodes in an unmanaged state.
6. To limit the rule only to messages from specific hosts, domains, or host name patterns, click the DNS Hostname tab, and enter a DNS Hostname Pattern.
The DNS Hostname Pattern rule is case-sensitive.
To use regular expressions, select Use Regular Expressions in this Rule.
7. To limit the rule only to specific message types or texts within a Syslog message, go to the Message tab, and enter rules for Message Type Pattern and Syslog Message Pattern.
8. To apply specific severity or facility types, go to the Severity / Facility tab, and select the severity and facility types.By default, all message severities and facilities are selected.
9. To apply the rule only during a specific period of time, select the Time of Day tab, select Enable Time of Day Checking, enter the time period, and select the days of the week on which to apply the rule.
Messages received outside the specified time frame will not trigger alerts.
Enabling Time of Day checking creates more overhead for the CPU.
100

10. To suppress alert actions until a specified number of messages arrive that match the rule, complete the following procedure:
a. Select the Trigger Threshold tab, and select Define a Trigger Threshold for this Rule. b. Enter option values.
When Suspend Further Alert Actions For is selected, alert actions are not sent until the specified amount of time has expired. When the time period expires, only new alerts are sent. All alerts suppressed during the time period are discarded.
11. Configure Syslog alert actions on the Alert Actions tab: a. To create an action for the rule, click Add New Action. b. To edit an action for the rule, select the action, and click Edit Selected Action. c. Configure the action.
Syslog alerts use a unique set of variables.
d. To delete an action, select the action, and click Delete Action. e. Use the arrow buttons to set the order in which actions are performed.
Actions are processed in the order listed, from top to bottom. f. Click OK to save all changes and return to Syslog Viewer Settings.
12. Use the arrow buttons to arrange the order in which the rules are applied.Rules are processed in the order they appear, from top to bottom.
Syslog alert actions
Discard the Syslog Message
Delete unwanted Syslog messages sent to the Syslog server.
Tag the Syslog Message
Add a custom tag to received Syslog messages. Ensure you include the Tag column in the viewer when assigning a tag.
Modify the Syslog Message
Modify the severity, facility, type, or contents of a Syslog message.
Log the Message to a file
Specify a file and a series of variables with which to tag Syslog messages sent to the file. Ensure you have already created the log file you want to use. The alert cannot create a file.
Windows Event Log
Write a message to local or remote Windows Event Logs.
Forward the Syslog message
Specify the IP address or hostname and the port to forward a Syslog event.
101

Send a new Syslog message
Trigger a new Syslog message, sent to a specific IP address or hostname, on a specific port, with a customizable severity, facility, and message.
Send an SNMP Trap
Send a trap to an IP address following a specific trap template and using a specific SNMP community string.
Play a sound
Play a sound when a matching Syslog message is received.
Text to Speech output
Define the speech engine, speed, pitch, volume, and message to read.
Execute an external program
Allows you to specify an external program to launch using a batch file. This action is used when creating real-time change notifications in Orion.
Execute an external VB Script
Launch a VB Script using the selected script interpreter engine and a saved script file.
Send a Windows Net Message
Send a net message either to a specific computer or to an entire domain or work group.
Send an E-mail / Page
Send an email from a specified account to a specified address, using a specific SMTP server, and containing a customizable subject and message.
Stop Processing Syslog Rules
Stops the processing of Syslog rules for the matching Syslog message.
Forward syslog messages
The Syslog message forwarding action allows you to forward received syslog messages. Additionally, if you have WinPCap version 3.0 or later installed on your SolarWinds Orion server, you can forward syslog messages as spoofed network packets.
The following procedure assumes you are editing a Forward the Syslog Message alert action. For more information, see Trigger alerts when receiving specific Syslog messages.
1. Provide the hostname or IP address of the destination to which you want to forward the received syslog message.
2. Provide the UDP Port you are using for Syslog messaging.
The default is UDP port 514.
102

3. Specify what IP address should be used for the source device in the syslog message. By default, the device IP is replaced by the SolarWinds Orion server IP address.
a. To designate a specific IP address or hostname as the Syslog source, select Retain the Original Source Address of the Message, select Use a Fixed Source IP Address, and provide the IP address or hostname.
b. To keep the original IP address of the syslog source device, select Retain the Original Source Address of the Message, select Spoof Network Packet, and select the Network Adapter.
4. Click OK to complete the configuration.
You have defined the destination, port for sending the syslog message, and the source IP of the device in the syslog message used in the alert action.
Syslog message priorities
At the beginning of each Syslog message, there is a priority value. The priority value is calculated using the following formula:
Priority = Facility * 8 + Severity
Syslog facilities
The facility value indicates which machine process created the message. The Syslog protocol was originally written on BSD Unix, so Facilities reflect the names of UNIX processes and daemons.
If you are receiving messages from a UNIX system, consider using the User Facility as your first choice. Local0 through Local7 are not used by UNIX and are traditionally used by networking equipment. Cisco routers, for example, use Local6 or Local7.
NUMBER SOURCE NUMBER SOURCE
0 kernel messages 12 NTP subsystem
1 user-level messages 13 log audit
2 mail system 14 log alert
3 system daemons 15 clock daemon
4 security/authorization messages 16 local use 0 (local0)
5 messages generated internally by Syslog 17 local use 1 (local1)
6 line printer subsystem 18 local use 2 (local2)
7 network news subsystem 19 local use 2 (local3)
8 UUCP subsystem 20 local use 2 (local4)
9 clock daemon 21 local use 2 (local5)
10 security/authorization messages 22 local use 2 (local6)
11 FTP daemon 23 local use 2 (local7)
103

Syslog severities
The following table provides a list of Syslog severity levels with descriptions and suggested actions for each.
NUMBER SEVERITY SUGGESTED ACTIONS
0 EmergencyA "panic" condition affecting multiple applications, servers, or sites. System is unusable. Notify all technical staff on call.
1 AlertA condition requiring immediate correction, for example, the loss of a backup ISP connection. Notify staff who can fix the problem.
2 CriticalA condition requiring immediate correction or indicating a failure in a primary system, for example, a loss of a primary ISP connection. Fix CRITICAL issues before ALERT-level problems.
3 ErrorNon-urgent failures. Notify developers or administrators as errors must be resolved within a given time.
4 WarningWarning messages are not errors, but they indicate that an error will occur if required action is not taken. An example is a file system that is 85% full. Each item must be resolved within a given time.
5 NoticeEvents that are unusual but are not error conditions. These items might be summarized in an email to developers or administrators to spot potential problems. No immediate action is required.
6 InformationalNormal operational messages. These may be harvested for network maintenance functions like reporting and throughput measurement. No action is required.
7 DebugInformation useful to developers for debugging an application. This information is not useful during operations.
Monitor SNMP trapsIf you monitor a large number of devices, where each device may have many connected objects of its own, requesting information from each device is impractical. You can set up the SNMP Trap Server, and each managed device can notify it about any issues by sending a trap message.
You can monitor SNMP traps with SolarWinds NPM or SolarWinds SAM.
SNMP traps are received by the SolarWinds Trap Service, which listens for incoming trap messages on UDP port 162, and then decodes, displays, and stores the messages in the SolarWinds Orion database.
The SolarWinds Trap Service can receive and process SNMP traps from any type of monitored network device, and can handle large numbers of simultaneously incoming traps.
104

A SolarWinds installation can process approximately 500 traps per second. Higher capacity can only be achieved with significant hardware improvements over minimum SolarWinds requirements.
You can view SNMP traps either in the Orion Web Console or in the Trap Viewer application. The Trap Viewer application allows you to configure trap-specific alerts, to view, filter, and search for traps.
Before you begin
n Configure devices to send SNMP traps to the IP address assigned to the Orion server. For more information about proper configuration, refer to the documentation supplied by the vendor of your devices.
n Make sure the UDP port 162 is open for IPv4 and IPv6.
n When you use SNMPv3 for polling a device and receiving traps from it, confirm that the same authentication type (auth, noauth, or priv) is configured for both polling and traps.
View SNMP traps in the Orion Web Console
1. Log in the Orion Web Console.
2. Click Alerts & Activity > Traps in the menu bar.
3. To display only traps relevant for a specific device, specify the device:
n To display only traps for a device, select the device in the Network Object field. n To view traps for certain device type, select the device type in the Type of Device field.
4. Define what traps you want to view:
n To view only traps of a designated type, select the type in the Trap Type field. n To view only traps originating from a specific IP address, type the IP Address in the Source IP
Address field. n To view only traps with a designated community string, select the string in the Community
String field. n To view only traps from a specific period of time, select the time period from the Time Period
menu. 5. Confirm the number of traps displayed in the Number of Displayed Traps field.
6. Click Refresh to update the Traps view with your new settings.
View SNMP traps in the Trap Viewer
After the monitored devices on your network are configured to send traps to the SolarWinds Orion server, configure the Orion Trap Viewer to display received trap information.
n Ensure your network devices are properly configured by referring to the documentation supplied by the vendor of your network devices.
n The Orion Trap Viewer receives traps on UDP port 162.
View current traps in the Trap Viewer
The Trap Viewer is an application which allows you to view, search for traps, or configure filters and alerts.
105

You must be able to log in to the computer running your SolarWinds Orion server.
1. Click Start > All Programs > SolarWinds Orion > Syslog and SNMP Traps > Trap Viewer.
2. Click View > Current Traps.
3. Click a column header to order listed traps by the selected trap characteristic.
4. Configure the Trap Viewer by clicking and dragging columns to order the presentation of trap characteristics.
The current traps are now displayed according to your settings.
Search for traps in the Trap Viewer
You can search collected trap messages and format the search results list in the Trap Viewer.
1. Click Start > All Programs > SolarWinds Orion > Syslog and SNMP Traps > Trap Viewer.
2. Click View > Search Traps.
3. Enter search criteria, and click Search Database.
4. To group messages for easier navigation, select the type of grouping from the Grouping list.
5. To limit the number of displayed messages, enter or select a number in the Maximum number of messages to display field.
6. To view messages that meet your search criteria as they arrive, select a number for the Auto Refresh Every number seconds field.
Auto Refresh is only available when you are viewing current messages. The Date / Time Range must be set to Today, Last 24 Hours, Last 2 Hours, or Last Hour.
7. To hide the search criteria pane, toggle the pane open and closed by clicking the double up arrows in the top right of the page.
You can now see the traps according to your settings.
Define how many traps to display, if you want to refresh the traps view, trap retention, and the information displayed in the Trap Viewer
1. Click Start > All Programs > SolarWinds Orion > Syslog and SNMP Traps > Trap Viewer.
2. Click File > Settings.
3. On the General tab, configure the Trap server settings: a. Position the top slider to set the Maximum Number of Traps to Display in Current Traps
View. b. If you want to Automatically Refresh the Current Traps View, select the option, and position
the middle slider to set the refresh rate. c. Position the Retain Trap Messages For How Many Days slider to set the length of time that
traps remain in the database. 4. On the Displayed Columns tab, use the arrow keys to select and order the fields of information you
want to see in the Current Traps view.
106
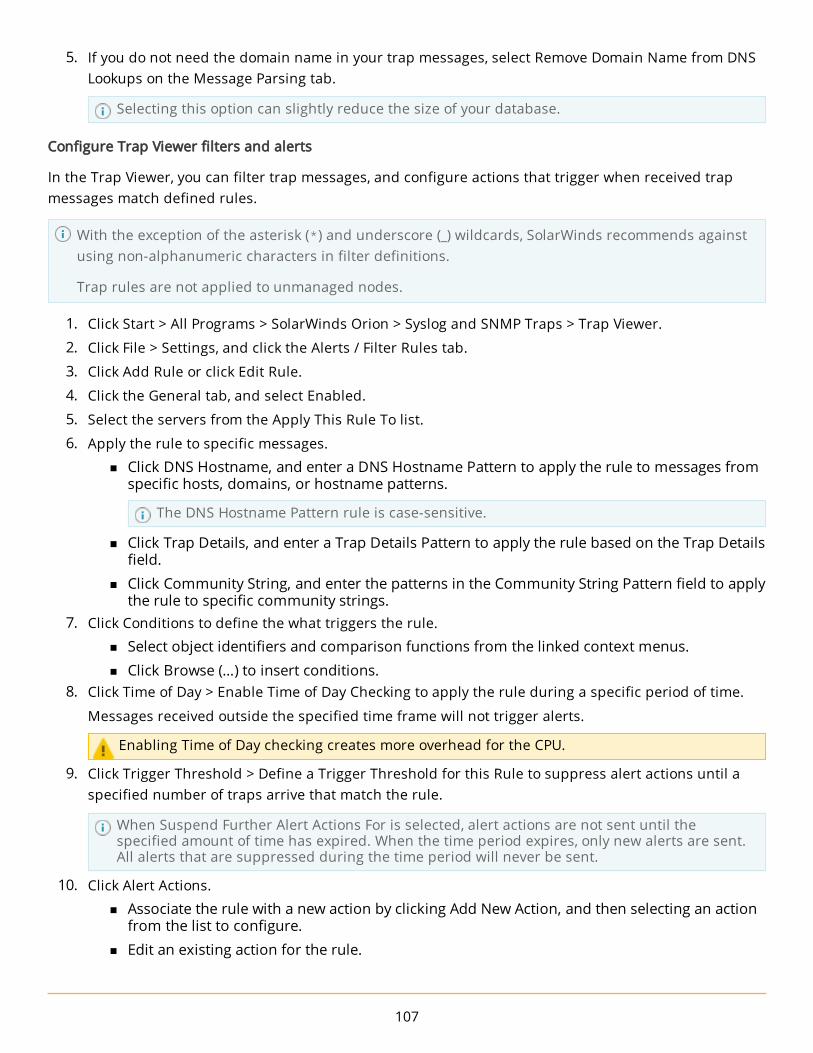
5. If you do not need the domain name in your trap messages, select Remove Domain Name from DNS Lookups on the Message Parsing tab.
Selecting this option can slightly reduce the size of your database.
Configure Trap Viewer filters and alerts
In the Trap Viewer, you can filter trap messages, and configure actions that trigger when received trap messages match defined rules.
With the exception of the asterisk (*) and underscore (_) wildcards, SolarWinds recommends against using non-alphanumeric characters in filter definitions.
Trap rules are not applied to unmanaged nodes.
1. Click Start > All Programs > SolarWinds Orion > Syslog and SNMP Traps > Trap Viewer.
2. Click File > Settings, and click the Alerts / Filter Rules tab.
3. Click Add Rule or click Edit Rule.
4. Click the General tab, and select Enabled.
5. Select the servers from the Apply This Rule To list.
6. Apply the rule to specific messages.
n Click DNS Hostname, and enter a DNS Hostname Pattern to apply the rule to messages from specific hosts, domains, or hostname patterns.
The DNS Hostname Pattern rule is case-sensitive.
n Click Trap Details, and enter a Trap Details Pattern to apply the rule based on the Trap Details field.
n Click Community String, and enter the patterns in the Community String Pattern field to apply the rule to specific community strings.
7. Click Conditions to define the what triggers the rule.
n Select object identifiers and comparison functions from the linked context menus. n Click Browse (…) to insert conditions.
8. Click Time of Day > Enable Time of Day Checking to apply the rule during a specific period of time.
Messages received outside the specified time frame will not trigger alerts.
Enabling Time of Day checking creates more overhead for the CPU.
9. Click Trigger Threshold > Define a Trigger Threshold for this Rule to suppress alert actions until a specified number of traps arrive that match the rule.
When Suspend Further Alert Actions For is selected, alert actions are not sent until the specified amount of time has expired. When the time period expires, only new alerts are sent. All alerts that are suppressed during the time period will never be sent.
10. Click Alert Actions.
n Associate the rule with a new action by clicking Add New Action, and then selecting an action from the list to configure.
n Edit an existing action for the rule.
107
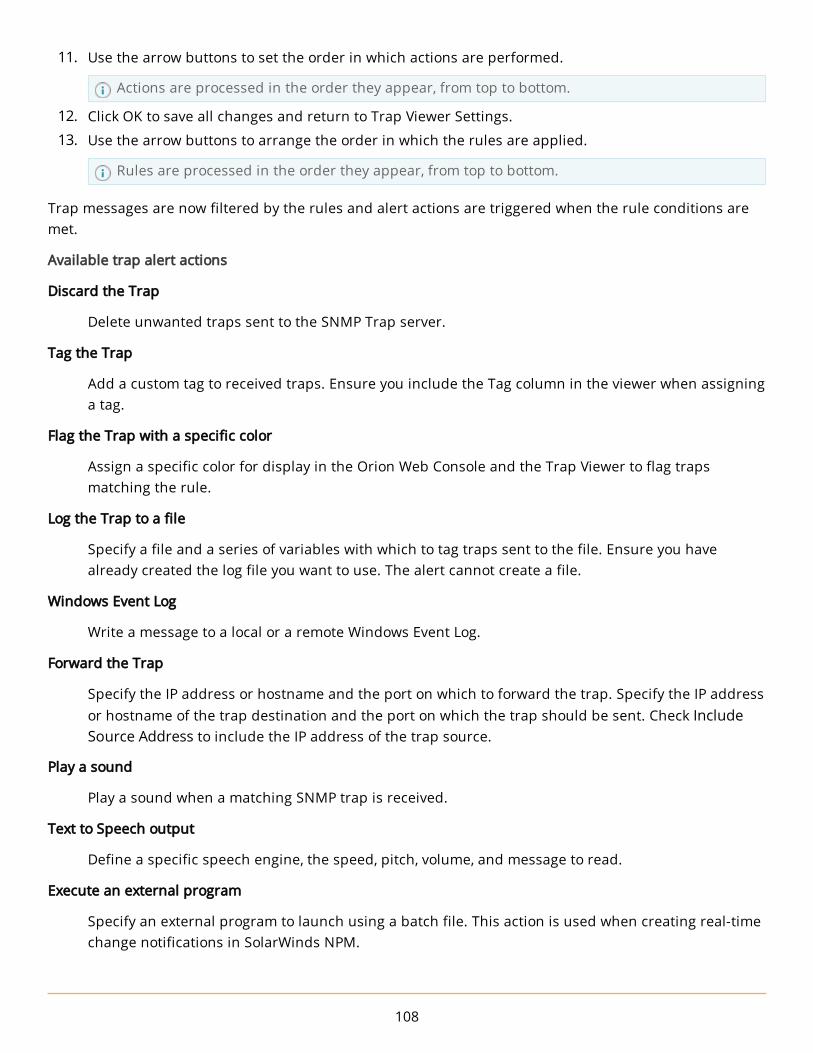
11. Use the arrow buttons to set the order in which actions are performed.
Actions are processed in the order they appear, from top to bottom.
12. Click OK to save all changes and return to Trap Viewer Settings.
13. Use the arrow buttons to arrange the order in which the rules are applied.
Rules are processed in the order they appear, from top to bottom.
Trap messages are now filtered by the rules and alert actions are triggered when the rule conditions are met.
Available trap alert actions
Discard the Trap
Delete unwanted traps sent to the SNMP Trap server.
Tag the Trap
Add a custom tag to received traps. Ensure you include the Tag column in the viewer when assigning a tag.
Flag the Trap with a specific color
Assign a specific color for display in the Orion Web Console and the Trap Viewer to flag traps matching the rule.
Log the Trap to a file
Specify a file and a series of variables with which to tag traps sent to the file. Ensure you have already created the log file you want to use. The alert cannot create a file.
Windows Event Log
Write a message to a local or a remote Windows Event Log.
Forward the Trap
Specify the IP address or hostname and the port on which to forward the trap. Specify the IP address or hostname of the trap destination and the port on which the trap should be sent. Check Include Source Address to include the IP address of the trap source.
Play a sound
Play a sound when a matching SNMP trap is received.
Text to Speech output
Define a specific speech engine, the speed, pitch, volume, and message to read.
Execute an external program
Specify an external program to launch using a batch file. This action is used when creating real-time change notifications in SolarWinds NPM.
108

Execute an external VB Script
Allows you to launch a VB Script using the selected script interpreter engine and a saved script file.
Send a Windows Net Message
Send a Windows Net message either to a specific computer or to an entire domain or workgroup.
The only operating systems supporting Windows Net Messaging on which SolarWinds supports Orion installations are Windows Server 2003 and Windows XP. SolarWinds only supports Orion evaluations on Windows XP.
Send an E-mail / Page
Send an email from a specified account to an address, using a specific SMTP server, and containing a customizable subject and message.
Stop Processing Trap Rules
Stops the processing of SNMP trap rules for the matching trap.
Change the status of an interface
SolarWinds NPM can change the status of an interface from which a trap is received. Designate the status to which the interface should change.
What is a Trap Template?
Trap templates are used to format your trap messages. You can use SolarWinds macros or variables in the OID Value and ValueName attributes or call values from your MIB.
The templates are placed in the following locations:
n /SolarWinds/Common/Orion-Detailed-Alert.trap
n /SolarWinds/Common/Orion-Generic-Alert.trap
n /SolarWinds/Orion/ForwardSyslog.trap
The following table describes the OIDs section of the Orion Generic Alert trap template. This is the section you modify to display the information you want in your trap messages.
TEMPLATE OID LINE INFORMATION RETURNED
OID OID="1.3.6.1.2.1.1.3.0" MIB="RFC1213-MIB" Name="sysUpTime.0" Value="0" DataType="67" ValueName="0" HexValue=""
This line displays how long the device has been up.
OID OID="1.3.6.1.6.3.1.1.4.3.0" MIB="SNMPv2-MIB" Name="snmpTrapEnterprise.0" Value="1.3.6.1.4.1.11307" DataType="6" ValueName="enterprises.11307" HexValue=""
This line displays the enterprise associated with the trap.
OID OID="1.3.6.1.4.1.11307.10.1" MIB="SNMPv2-SMI" Name="enterprises.11307.10.1" Value="${AlertMessage}" DataType="4"
When the template is used in an alert, this line displays the alert
109

TEMPLATE OID LINE INFORMATION RETURNED
ValueName="${AlertMessage}" HexValue=""message associated with the triggered alert.
Add more information by adding another OID element and incrementing the OID.
Integrate an Orion Platform product with ServiceNowIntegrate your Orion Platform product with ServiceNow to automatically open new ServiceNow tickets based on critical events defined in your Orion Platform product.
The integration with ServiceNow allows for two-way communication between your Orion Platform product and ServiceNow. By integrating the two systems, you can:
n Automatically create incidents in ServiceNow and assign them to the correct tech or group
n Synchronize the acknowledgement of alerts and tickets in SolarWinds Orion and ServiceNow
n Update, close, and reopen tickets
n Suppress ticket storms
You can integrate one Orion Platform product with multiple ServiceNow instances.
The integration requires NPM 12.0, SAM 6.3, or any other Orion Platform product running Core version 2016.1 or later.
Before you begin
Before you can configure the integration details in your SolarWinds Orion product, check the prerequisites and configure your ServiceNow instance.
n The communication between the SolarWinds server and the ServiceNow instance uses HTTPS port 443. Open this port for outbound communication.
n For minimum hardware and software requirements, see the administrator guide of your product.
n Download the ServiceNow integration application from the ServiceNow app store.
n Install the integration app and configure your ServiceNow instance for the integration.
Install and configure the SolarWinds Alert Integration application in ServiceNow
The SolarWinds Alert Integration application enables the communication between your SolarWinds server and the ServiceNow instance.
After downloading the SolarWinds Alert Integration application from the ServiceNow store, deploy the application in ServiceNow.
1. Navigate to your downloaded system applications.
2. Locate the SolarWinds Alert Integration application, and click Install.
When the installation is complete, the caption of the Install button will change to Installed.
110

After the installation is complete, SolarWinds recommends that you create a ServiceNow integration user with Web service access only.
Create a ServiceNow integration user with Web service access only
1. Navigate to the user administration section in ServiceNow, and create a new user.
2. Provide a user ID, a password, and other required information.
3. Specify that the new user should have Web service access only.
4. Edit the newly created user, and add the x_sow_intapp.integration_user role to the role list.
After installing the integration application and creating an integration user, you can now configure the integration with ServiceNow in your SolarWinds Orion server.
Configure an Orion Platform product with ServiceNow
After completing the configuration of the integration in ServiceNow, you can configure the integration to be able to automatically create, update, and resolve alerts that were raised in your Orion Platform product in your ServiceNow instance.
1. In the Orion Web Console, click Settings > All Settings.
2. In the Alerts & Reports group, click ServiceNow Instances.
3. Click Add Instance.
4. Enter a name and the URL for the ServiceNow instance.
5. Enter the ServiceNow credentials:
n UsernameThe user name of the account that is configured for the SolarWinds integration role.
n Password 6. Test the connection to your ServiceNow instance. If the connection is not working, you receive
descriptive messages to help you solve the issue.
7. If you are accessing your ServiceNow instance through a HTTP proxy, select Use a HTTP proxy server, and click the Configure your HTTP proxy settings link to edit the details. For more information, see Configure web proxy settings.
8. Click Save.
111

Use alerts to monitor your environmentAn alert is an automated notification that a network event has occurred, such as a server becoming unresponsive. The network event that triggers an alert is determined by conditions you set up when you configure your alert. You can schedule alerts to monitor your network during a specific time period, and create alerts that notify different people based on how long the alert has been triggered.
The types of events for which you can create alerts vary, depending on the Orion Platform products you have installed. For example, you can create an alert to notify you if a node in a specific location goes down or if the network response time is too slow when you have NPM. If you have installed SAM, you can receive alerts about application response times or when your Exchange mailbox database is almost full.
You can create alerts for any monitored object. You can alert against volumes and nodes with most Orion Platform products.
Use the following topics to get started if you have never used Orion Platform products:
n Alert preconfiguration tasks n Best practices and tips for alerting n Navigate to the Alert Manager n Create new alerts to monitor your environment n Alert me when a server goes down
You can also view our Alert Lab on thwack for community-based alert information.
Alert preconfiguration tasksSome alerts require extra configuration, separate software installations, or information that you may need to request from other departments.
Alert actions that require set up before creating or configuring alerts include:
n Send an email or page n Dial a paging or SMS service n Play a sound when an alert is triggered n Send an SNMP trap n Use the speech synthesizer to read alerts
Monitored objects in the SolarWinds Orion database must exist before creating or configuring alerts. Monitored objects can include items such as nodes, databases, and applications.
112

Configure the default information in the email actionThe information you provide in the default email action is used to populate the Send an Email/Page action. You can still customize individual email actions if you configure the default email action.
n Separate email addresses with a semicolon.
n All email actions require a designated SMTP server.
1. Click Settings > All Settings in the menu bar.
2. Click Configure Default Send Email Action.
3. Under the Default Recipients heading, provide the email addresses of all default recipients for any email alert action, like the following: [email protected]; [email protected]; [email protected]
4. Provide the default sender and reply address. 5. Enter the default SMTP server information.
Selecting SSL encryption automatically changes the SMTP port number to 465.
Best practices and tips for alertingUse these best practices and tips to help you configure and test your alerts.
Use the out-of-the-box alerts as templates
SolarWinds recommends using the alerts that are included when you install the product as templates for your new alerts.
Find an alert that is similar to one you want to create and then click Duplicate & Edit in the menu bar. Fields are pre-populated so you can skip to specific parts of the Alert Wizard where there is data you want to change.
Enable out-of-the-box alerts
If there are out-of-the-box alerts that match your monitoring needs, enable them in your environment. You can customize the alert actions for those alerts. If you want to modify the conditions, use the alert as a template.
Restrict who receives alerts
During your initial evaluation and testing, send alerts to a few people instead of to a large distribution list. This can prevent overloading your email server while you fine-tune your alerts.
Plan which devices to monitor
To reduce the number of alerts sent out, consider which devices are most important. For example, you may want to receive alerts only for mission-critical interfaces instead of every interface on a device.
113
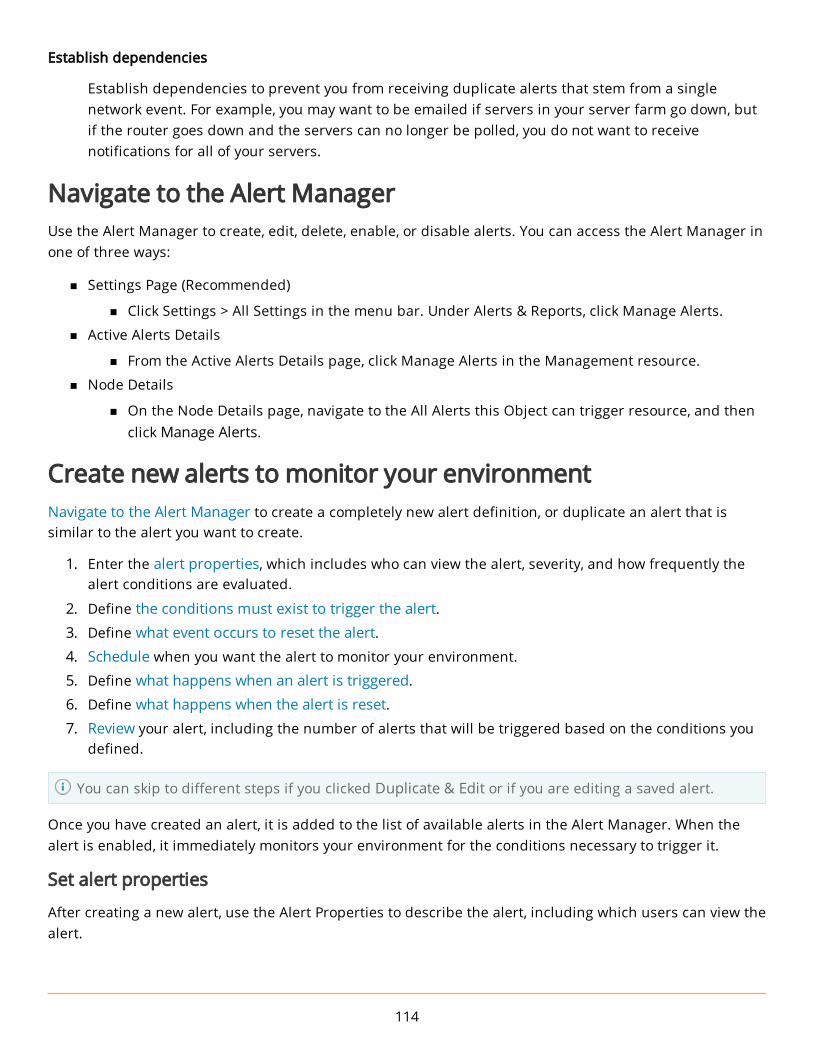
Establish dependencies
Establish dependencies to prevent you from receiving duplicate alerts that stem from a single network event. For example, you may want to be emailed if servers in your server farm go down, but if the router goes down and the servers can no longer be polled, you do not want to receive notifications for all of your servers.
Navigate to the Alert ManagerUse the Alert Manager to create, edit, delete, enable, or disable alerts. You can access the Alert Manager in one of three ways:
n Settings Page (Recommended)
n Click Settings > All Settings in the menu bar. Under Alerts & Reports, click Manage Alerts.
n Active Alerts Details
n From the Active Alerts Details page, click Manage Alerts in the Management resource.
n Node Details
n On the Node Details page, navigate to the All Alerts this Object can trigger resource, and then click Manage Alerts.
Create new alerts to monitor your environmentNavigate to the Alert Manager to create a completely new alert definition, or duplicate an alert that is similar to the alert you want to create.
1. Enter the alert properties, which includes who can view the alert, severity, and how frequently the alert conditions are evaluated.
2. Define the conditions must exist to trigger the alert. 3. Define what event occurs to reset the alert. 4. Schedule when you want the alert to monitor your environment.
5. Define what happens when an alert is triggered.
6. Define what happens when the alert is reset. 7. Review your alert, including the number of alerts that will be triggered based on the conditions you
defined.
You can skip to different steps if you clicked Duplicate & Edit or if you are editing a saved alert.
Once you have created an alert, it is added to the list of available alerts in the Alert Manager. When the alert is enabled, it immediately monitors your environment for the conditions necessary to trigger it.
Set alert properties
After creating a new alert, use the Alert Properties to describe the alert, including which users can view the alert.
114

Name of alert definition
This is a required field. The name is displayed in the Alert Manager and can be used to sort your alerts. If you intend to create a large number of alerts, consider a naming convention that allows you to quickly scan through them.
SolarWinds recommends a name that describes the condition and most visible alert action. For example, you can use "Email NetAdmins when router goes down" as the name of an alert.
Description of alert definition
Describe the alert. This is displayed on the Manage Alerts page, so important information should be near the front.
Enabled (On/Off)
Choose to evaluate the alert immediately after it is created and saved. The alert is enabled. If you are in the process of refining your alert, you may want to disable this alert until it is ready for use.
Evaluation Frequency
Set how frequently you want to evaluate the conditions. If you choose to alert on an event, such as a changed IP address, the condition is not evaluated by frequency, but by when the change is reported based on the polling interval.
SolarWinds recommends using intervals longer than one minute to evaluate alert conditions. Shorter frequencies can negatively impact your network performance or computing resources.
Severity of Alert
Control how the alert in the Active Alerts resource looks, and use the severity to group or filter alerts more easily.
Alert Custom Properties
Use custom properties to organize your alerts. For example, you can create a "Responsible Team" custom property and use it to help audit who receives specific alerts.
You must create a custom property for alerts before you can use it in an alert.
Alert Limitation Category
Restrict who can view the alerts. For example, managed service providers can restrict alerts to their specific customers. Create a new alert limitation by editing or creating a user account.
Define the conditions that must exist to trigger an alert
The trigger condition is the most complex step in creating an alert. Before you begin, you may want to revisit the Best practices and tips for alerting. To see an example of completed trigger conditions, see the Alert me when a server goes down topic.
115

Trigger conditions are built using child conditions that are evaluated in order. Child conditions are represented as a line item under the Actual Trigger Condition. You can have multiple trigger condition blocks with multiple child conditions.
Filter your environment to only display the objects you want to monitor in The scope of alert. Use the Show List link to view all of the objects that the alert monitors.
1. Choose what objects you want to monitor in the I want to alert on field.
2. Establish how much of your environment you want to monitor in The scope of alert.
You can monitor all objects in your environment or filter your environment to a specific set of objects.
3. Create your trigger condition.
a. Choose if the child conditions must be true or false to trigger the alert. n All child conditions must be satisfied (AND) - Every child condition must be met n At least one child condition must be satisfied (OR) - At least one child condition must be
true n All child conditions must NOT be satisfied - Every child condition must be false n At least one child condition must NOT be satisfied - At least one child condition must be
false b. Click the + sign to add child conditions.
n Add Single Value Comparison (Recommended) - The child condition evaluates a single field, like Status
n Add Double Value Comparison - The child condition evaluates two conditions, such as Status and OS
n Add And/Or block - Adds a sub condition block
Use the X at the end of each child condition to delete it, or use the drop-down menu at the top of the block to delete the entire condition.
c. Select the object you want the child condition to evaluate, and then select which field you want to evaluate. In the example screenshot, the object is "Node" and the field is "Status".
You can evaluate objects based on variables or macros.
d. Select how you want to compare the polled value of the field to the value entered here, and then enter the value. In the example screenshot, the comparison is "is equal to" and the value is "Down".
116
e. To use more complex conditions, such as evaluating when an application on a specific server is down and a different application on another server is down, enable complex conditions under Advanced options. See Building Complex Conditions for more information, or visit thwack, SolarWinds' community website, for support from other users.
f. Choose how long the condition must exist before an alert is triggered. This prevents receiving alerts when the alert condition, such as high CPU utilization, occurs briefly or only once during a certain time period.
n Send an alert immediately when the condition is met by clearing any selection for Condition must exist for more than.
n Wait before sending an alert by selecting Condition must exist for more than, and entering how long the condition must exist. This option prevents multiple alerts firing if the condition is temporary.
If you have successfully created an alert condition, you can move to the next step in the alert wizard. The Summary step evaluates the conditions against your environment and returns how many objects will trigger the alert.
Define the conditions that must exist to reset an alert
Use the reset condition to define what must occur to remove an alert instance from the active alerts list. For example, the "Email me when a Node goes down" alert automatically resets when the node comes back up. You can use the built-in reset conditions or create your own.
When reset conditions are met, the alert is removed from Active Alerts. You can also add actions that occur when the reset conditions are met.
For example, you can create an alert that triggers when nodes in your lab go down. If node 192.168.4.32 goes down, the alert fires for that specific instance of the trigger condition and any escalation levels you create continue until you reset the alert. After the alert is reset, all trigger actions stop and a new alert fires the next time node 192.168.4.32 goes down. If you have created reset actions, the reset actions fire.
When the alert is reset, escalation actions are halted.
Select one of the following reset conditions:
n Reset this alert when trigger condition is no longer true (Recommended)
SolarWinds recommends using this reset condition. If the trigger condition is no longer true when the objects are next polled, this selection automatically resets the alert.
You can use the Condition must exist for more than option in the trigger conditions in conjunction with this reset condition. Trigger conditions that involve volatile components, such as high CPU utilization, can trigger excessively with this reset condition.
117

n Reset this alert automatically afterSelect to reset an alert after a set amount of time has passed. If this interval is less than the amount of time you wait for different escalation levels, the escalation levels that occur after this interval do not fire. This reset condition is especially useful to remove event-based alerts from Active Alerts.For example, if the trigger conditions still exists after 48 hours, you can use this to trigger your alert actions again. The alert is reset and triggers as soon as the trigger condition is detected, which is as soon as the objects are polled for this example.
n No reset condition - Trigger this alert each time the trigger condition is metThe alert fires each time the trigger conditions are met.
For example, when the alert for node 192.168.4.32 going down fires, a new alert for 192.168.4.32 fires every time the node is down when it is polled.
n No reset actionThe alert is active and is never reset. To re-trigger the alert, the alert must be manually cleared from the Active Alerts view.
n Create a special reset condition for this alertSelect to build a specific reset condition. For example, you can choose to reset the condition when the node has been up for more than 10 minutes. The alert wizard evaluates the reset condition for errors. If there are no errors, you can proceed to the next step, or go back to previous steps.
See Define the conditions that must exist to trigger an alert or Build complex conditions for more information on creating conditions.
Schedule when an alert monitors your environment
You can configure when an alert monitors your environment. By default, alerts monitor your network for changes all the time. Schedule when you want to monitor your network for the trigger conditions you created for the alert.
You can create multiple schedules that control when an alert is enabled or disabled. For example, you can schedule the alert to monitor your network during off hours, and disable the alert during your maintenance windows.
Alerts must be enabled to allow schedules to run.
1. Select Specify time of day schedule for this alert. 2. Click Add Schedule.
118
3. Enter the following information:
n Schedule NameThis is not required, but may help you organize or troubleshoot your schedules. If you do not enter a name, a name is automatically generated from the time period.
n Enable or Disable alert during following time periodIf you choose to disable the alert, it is enabled all other times unless otherwise scheduled.
n FrequencyChoose when to monitor on a high level, such as daily, weekly, or monthly.
n Enable or Disable everyThese options change based on the frequency.
n If you selected Daily: You can choose to enable or disable the alert every few days, up to every 31 days. You can also select business days. For example, you may want to disable network or disk activity alerts if you run daily, off-site backups of your critical data.
n If you selected Weekly: Choose which days the alert is enabled or disabled. You may want to disable alerts during a weekly maintenance window.
n If you selected Monthly: Choose which months the alert is enabled or disabled. This option is useful when you have quarterly or monthly maintenance windows.Choose either a specific date, such as June 22nd, or a day, such as Thursday.
n Starting onChoose when to begin the schedule.
n Right now - Start the schedule immediately.
n Specific Date - Select a time and day to begin the schedule. n Ending on
Choose an end date for the schedule, if necessary.
4. Click Add Schedule to create the schedule.
When you add a schedule to an alert, the alert only monitors during the time period you have scheduled, or does not monitor during that time. Alert actions can also have schedules, so not all alert actions may occur during the scheduled period.
Define what happens when an alert is triggered
Choose actions that occur whenever the trigger conditions are met. You can also set up escalations levels so that different actions occur if the alert has not been acknowledged quickly enough.
Add actions to alerts
By default, what you enter into the Message displayed when this alert field is displayed in the All Active Alerts resource.
You can create a new action or use an action that you have already created. When you reuse an action, you are also reusing all of its configurations, including its schedule and execution settings.
119

If you are alerting others through email, SolarWinds recommends that you notify a small number of users while you fine tune your alerts.
1. Click Add Action.
2. Select an action from the list.
See Alert Actions for a complete list of available actions.
3. Click Configure Action.
4. Enter the necessary information for the action.
Each action requires different information. Select from the list of Alert Trigger Actions for more information per action.
Some actions require extra configuration steps, specific information, or special software. See Alert preconfiguration tasks.Each action has the following sections:
n Name of action - This is not required, but makes it easier to organize and find your actions in the Action Manager.
n Time of Day - You can choose different actions to occur at different times of the day or month. For example, if you want to send a page, you might send it to a different person on weekends or holidays rather than during the week.
n Execution settings - You can select both options, neither option, or a single option. n Do not execute this action if the alert has been acknowledged already (Recommended) n Repeat this action every X minutes until the alert is acknowledged
5. Click Add Action to save it to the list of actions in the alert.
Add a preexisting action to the alert
You can add actions that have already been configured to an alert. For example, if you configured an action to reboot a VM, you can add that action to a separate alert.
If you use a preexisting action, any configuration change you make to the action, including schedules, is used in every alert the action is assigned.
1. Click Assign Action(s).
2. Select one or more actions from the list.
3. Click Assign.
Add what happens when an alert is not acknowledged
Escalation levels in Orion Platform products refer to user-defined time intervals between when an alert is activated and when a user acknowledges that alert. You can configure the alert to perform different actions per escalation level.
Escalation Level 1 contains all initial actions that you want to occur when the trigger conditions are met and the alert activates.
Escalation Levels 2 and above include all actions you want to occur if no one acknowledged the alert during the previous escalation levels.
120

For example, if an alert for a critical server activates and all of the recipient or first-level responders are out for training and do not acknowledge the alert, then the actions fire in the second escalation level. These actions may include emailing managers or other backup staff.
1. In an existing alert, click Trigger Actions.
2. Below the action, click Add Escalation Level. 3. Choose how long you want to wait after the previous escalation level before performing the actions
in the new escalation level.
4. Enter new actions in this escalation level.
You can copy all of the actions as Reset Actions. This lets you quickly craft actions to indicate that the issue has been acknowledged or resolved. Click Copy Actions to Reset Actions Tab.
When an alert is triggered, the actions will be performed in the order that they are displayed on the list. You can test each action to ensure the action does what you expect it to do.
Define what happens when the alert is reset
Use reset actions to perform specific tasks when an alert is no longer active, such as writing to the log that the issue has been acknowledged. Reset actions are usually used to notify others that the situation has been resolved or to write the resolution to a log file.
1. Click Add Action. 2. Select an action from the list.
See Alert Actions for a complete list of available actions.
3. Click Configure Action. 4. Enter the necessary information for the action.
Each action requires different information. Select from the list of Alert Actions for more information per action.Some actions require extra configuration steps, specific information, or special software. See Preconfiguration Tasks.Each action has the following sections:
n Name of action - This is not required, but can make it easier to organize and find your actions in the Action Manager.
n Time of Day - You can choose different actions to occur at different times of the day or month. For example, if you want to send a page, you might send it to a different person on weekends or holidays than during the week.
5. Click Add Action to save it to the list of reset actions in the alert.
To perform the same actions as when the alert was triggered, click Copy Actions From Trigger Actions Tab. Use the copied trigger actions as a base and modify them to reflect that the alert is no longer active.
When an alert is reset, the actions will be performed in the order that they are listed. You can test each action to ensure the action does what you expect it to do.
121

Review the alert's configuration
The Summary tab allows you to check your alert definition before you save any changes.
Before you click Submit, review the information box above it. This box lists the number of objects that will trigger the alert immediately based on your current trigger condition.
Modify any section by clicking Edit next to that section.
You can integrate your alerts with other SolarWinds' products, such as AlertCentral or Web Help Desk, by expanding Alert Integration.
Once you have created an alert, it is added to the list of available alerts in the Alert Manager. When the alert is enabled, it immediately monitors your environment for the conditions necessary to trigger it.
Commonly created alertsThe following sections walk you through the easiest method to create common alerts and include tips on how to build more complex alerts.
Alert me when a server goes down
Use the following procedure to create an alert that writes to a log and sends an email when a Windows server goes down.
1. Search for "Email me when a Node goes down" in the Alert Manager.
2. Select the check box next to the alert, and then click Duplicate & Edit. 3. Enter a name for the alert, such as "Notify me when Windows 2008 servers go down".
4. Enable the alert, and then click Trigger Condition or Next. 5. In The scope of alert, select Only following set of objects. 6. Select Node Machine Type is equal to Windows 2008 Server as the child condition.
You can further refine your scope by entering another AND condition. For example, you can enter Node IP Address starts with 10.10.45 to restrict the scope of the alert to a specific subnet.
122

7. The actual trigger condition should be Node Status is equal to Down.
Select and enter a value for Condition must exist for more than to prevent being alerted when a node enters the down state frequently within a set amount of time. This prevents you from receiving alerts until the node has been in the down state for longer than the time you have selected.
You can further suppress alerts by enabling complex conditions in the Advanced options. This allows you to choose to wait until multiple nodes are down before triggering a single alert.
8. Click Reset Condition. The default action should be to reset the alert when the node is up.
9. Click Trigger Actions, and then click Add Action.
10. Select Log the Alert to a file, and then click Configure Action. a. Enter the location of the log. For example, enter C:\ExampleAlertLog.txt in the Alert Log
Filename Field. b. In the Message text box, type Node ${N=SwisEntity;M=Caption} is currently down. c. Click Add Action.
11. Click Add Escalation Level, and enter 5 minutes to wait for 5 minutes before escalating to the next level.
12. Click Add Action in Escalation Level 2, and select Send an Email/Page. Click Configure Action. a. Enter your email as the recipient. b. Add a message.
You can use variables to customize your message. You can also use a variable that allows you to acknowledge an alert from email (${N=Alerting;M=AcknowledgeUrl}).
c. Enter your SMTP server information if you have not already done so.
You can enter a default SMTP server that is used for all your email in the Configure Default Send Email Action setting.
d. Go to Execution settings to click Add Action.
13. Click Copy Actions to Reset Actions Tab, and then click Next. 14. Click Edit next to your logging action, and modify your message to Node
${N=SwisEntity;M=Caption} is back up.
15. Click Edit next to your email action, and modify your message. You can also delete the email if you do not want to know if the situation has been resolved.
16. Click Summary to see if any object will trigger the alert, and then click Submit.
Once you have created the alert, it is added to the list of available alerts in the Alert Manager. You can test and view the results of each of your alert actions. See Testing Alerts for more information.
Discover network device failures
With alerting, Orion Platform products give you the ability to immediately discover whenever any device on your network is experiencing a problem.
123

Create an alert that uses a custom location property to alert you to a node failure on your monitored network.
Alert on custom properties
The following example creates multiple alerts using the NodeLocation custom property. An alert triggers when a node goes down. Upon triggering, the alert will write to a local log file, send a syslog message, and send an SNMP trap.
The ${variable} syntax is required for variables.
1. Click Alerts & Activity > Alerts in the menu bar, and then click Manage Alerts.
2. Select the check box next to Node is down, and then click the Duplicate & Edit button.
3. Click Trigger Condition, and add a child condition. A child condition should already exist for a nodebeing down.
4. Select the node object, and choose NodeLocation in the field drop-down menu. Enter a comparisonand value.
5. Click the Trigger Actions, and then click Add Action.
6. Select Log the Alert to a file, and then click Configure Action.a. Enter the log filename in the Alert Log Filename field.b. In the Message text box, type the following:
Node ${N=SwisEntity;M=Caption} is currently down.c. Click Add Action.
7. Click Add Action, and select Send a Syslog Message. Click Configure Action.a. Type 127.0.0.1 as the Hostname or IP Address of the Syslog Server, and then type the
following in the Message field:Node ${N=SwisEntity;M=Caption} is currently down.
b. Click Add Action.8. Click Add Action, and select Send SNMP Trap. Click Configure Action.
a. Type 127.0.0.1 as the SNMP Trap Destination, and then type the following in the AlertMessage field:Node ${N=SwisEntity;M=Caption} is currently down.
b. Click Next.c. Click Add Action.
9. Click Summary to see if any objects will trigger the alert, and click Submit.
After you have created the alert, it is added to the list of available alerts in the Alert Manager. You can test and view the results of each of your alert actions.
n You can view results of your Syslog message action in the Web Console or through the Syslog Viewer on your SolarWinds Orion server.
n To view the results of your SNMP Trap action, click Start > All Programs > SolarWinds Orion > Syslog and SNMP Traps > Trap Viewer.
124

View triggered alerts in the Orion Web ConsoleView active triggered alerts through Alerts & Activity > Alerts in the menu bar. Click each alert to view the details, which includes a historic count of how frequently the object triggers the alert and other objects that are experiencing the same set of conditions that triggered the alert you are viewing.
You can also add the All Active Alerts resource to any view.
Remove alerts from the Active Alerts listWhen an alert has triggered and becomes active, you can then acknowledge it. After an alert is acknowledged, alert actions in higher escalation levels are halted and the time it was acknowledged and the account that acknowledged it is recorded. You can also add notes that other users can read.
Depending on your organization, acknowledging an alert can have different purposes outside of halting further notifications. The most common purposes are to provide an audit trail or to prevent multiple people from working on the same issue.
You must enable the Allow Account to Clear Events privilege to acknowledge alerts. For more information about access privileges for Orion Web Console users, see Define what users can access and do.
1. Click Alerts & Activity > Alerts in the menu bar.
2. Click Acknowledge next to the alerts you want to acknowledge.
Tip: Depending on how you configure the email, you can acknowledge an alert directly from an email notification.
You can hide acknowledged alerts by clicking More, and then selecting Hide Acknowledged Alerts.
Test alert triggers and actionsYou do not have to actually experience a device failure to confirm that your alerts are working. The trigger condition is automatically evaluated and trigger and reset actions can be tested individually.
Test trigger conditions
Alert conditions are automatically evaluated on the Summary tab. Scroll to the bottom of the page and view the information box above the Submit button.
Test alert actions while creating or editing an alert
When you simulate actions, the action will be performed regardless of whether the trigger condition is true. If the action sends a message to a recipient, you should reduce the recipient list to yourself and a small number of team members until you are confident the alert is ready to be enabled in your production environment.
125

The Send Email/Page, Play a Sound, and Text to Speech Output actions do not have to fire. You can view what the message will look like when the trigger or reset action fires without performing the action.
1. Click Trigger Actions or Reset Actions.
2. Click Simulate next to the alert action you want to test. 3. Select an object to resolve any variables you have used in your alert action.
4. Click Execute. Test email, play a sound, and text to speech actions without sending an email by clicking Simulate.
Test alert actions in the Action Manager
You can also test actions independent of the trigger or reset conditions by using the Action Manager.
1. Select the action you want to test.
2. Click Test. 3. Select an object to resolve any variables you have used in your alert action.
4. Click Execute. Test email actions without sending an email by clicking Simulate.
After the alert test completes, you can view the results of your alert actions.
l To view the results of your email alert action, open EvaluationAlertLog in your Orion folder, typically <Volume:>\ProgramData\Solarwinds \Logs\Orion\ActionsExecution.log.
l To view results of your Syslog message action, click Start > All Programs > SolarWinds Orion > Syslog and SNMP Traps > Syslog Viewer.
l To view the results of your Syslog message action, click Start > All Programs > SolarWinds Orion > Syslog and SNMP Traps > Trap Viewer.
Modify multiple alerts or share alertsUse the Alert Manager to bulk edit multiple alerts. You can enable or disable multiple alerts or add pre-configured actions.
Alerts must be enabled to be executed. For example, if an alert is scheduled to run for a short period of time each year, it must be enabled so the schedule runs. A disabled alert will not be executed, even if it is scheduled to run.
Add actions to alerts without opening the Alert Wizard
Assign actions that you have already configured to alerts. You can assign multiple actions to multiple alerts. Actions are categorized into trigger and reset actions based on how the action was created in the Alert Wizard.
SolarWinds does not provide generic actions due to the differences in intent behind trigger and reset actions. For example, a trigger action to send an email is usually a notification that an event happened, while the associated reset action is usually a notification that the event has been resolved.
126

Share alerts with others
SolarWinds customers share their customized alerts in the SolarWinds thwack community. Visit thwack.solarwinds.com to download and import alerts created by others.
Export an alert to save the alert definition as an XML file on your local computer. Alerts are exported to XML and can only be imported from XML. You can send this file to other coworkers or share it in the SolarWinds thwack community.
Before you share an alert, check the exported file for confidential information, such as SMTP server credentials, and delete before making it public. Also review your company policy on sharing this type of file.
Build complex conditionsComplex conditions are generally enabled by users who are comfortable with building normal trigger conditions, or who have trialed alerts using the normal trigger conditions and require more control over the trigger conditions to better refine the environmental conditions that trigger an alert.
Do not use complex conditions until you have tested the trigger conditions individually. Creating an alert with complex conditions without testing it may prevent you from receiving important alerts.
1. Navigate to the Trigger Condition page.
2. Expand Advanced options.
3. Select Enable complex conditions.
You can use complex conditions to do the following:
n Wait for multiple objects to meet the trigger condition before alerting n Evaluate multiple condition blocks n Evaluate multiple object types
How conditions are evaluated
Conditions are a set of user-defined rules governing alert triggers and resets.
All child conditions must be satisfied (AND)
Every child condition in the group must be true before the alert is triggered.
In the following example, there are three child conditions.
n Node Status is equal to Up
n Percent Loss is greater than or equal to 75
n CPU Load is greater than or equal to 85
This alert will not trigger unless the Node is Up, packet loss is greater than or equal to 75%, and CPU load is greater than or equal to 85%.
127

You can also think of the condition as:
Alert when: (Node Status = Up) AND (Percent Loss >= 75) AND (CPU Load >= 85)
At least one child condition must be satisfied (OR)
At least one child condition must be true before the alert is triggered.
In this example the alert trigger reads:
Alert when: (Node Status = Up) OR (Percent Loss >= 75) OR (CPU Load >= 85)
In this situation, if any of the three conditions become true, the alert will trigger.
All child conditions must NOT be satisfied
Every child condition must be false before the alert is triggered.
In this example the alert trigger reads:
Do not alert when: (Node Status = Down) AND (Percent Loss <= 75) AND (CPU Load <= 85)
Alternatively, you can think of the trigger as:
Alert when: (Node Status != Down) AND (Percent Loss > 75) AND (CPU Load > 85)
The conditions have been inverted (Node Status = Down instead of Node Status = Up).
At least one child condition must NOT be satisfied
Any child condition must be false before the alert is triggered.
In this example the alert trigger reads:
Do not alert when: (Node Status = Down) OR (Percent Loss <= 75) OR (CPU Load <= 85)
Alternatively, you can think of the trigger as:
Alert when: (Node Status != Down) OR (Percent Loss > 75) OR (CPU Load > 85)
The conditions have been inverted (Node Status = Down instead of Node Status = Up).
Wait for multiple objects to meet the trigger condition
With complex conditions enabled, you can choose to trigger alerts only when multiple objects meet the trigger condition.
After you have enabled complex conditions, the following option is available in your trigger condition:
This setting combines all alerts that would be sent for each object into a single alert.
128
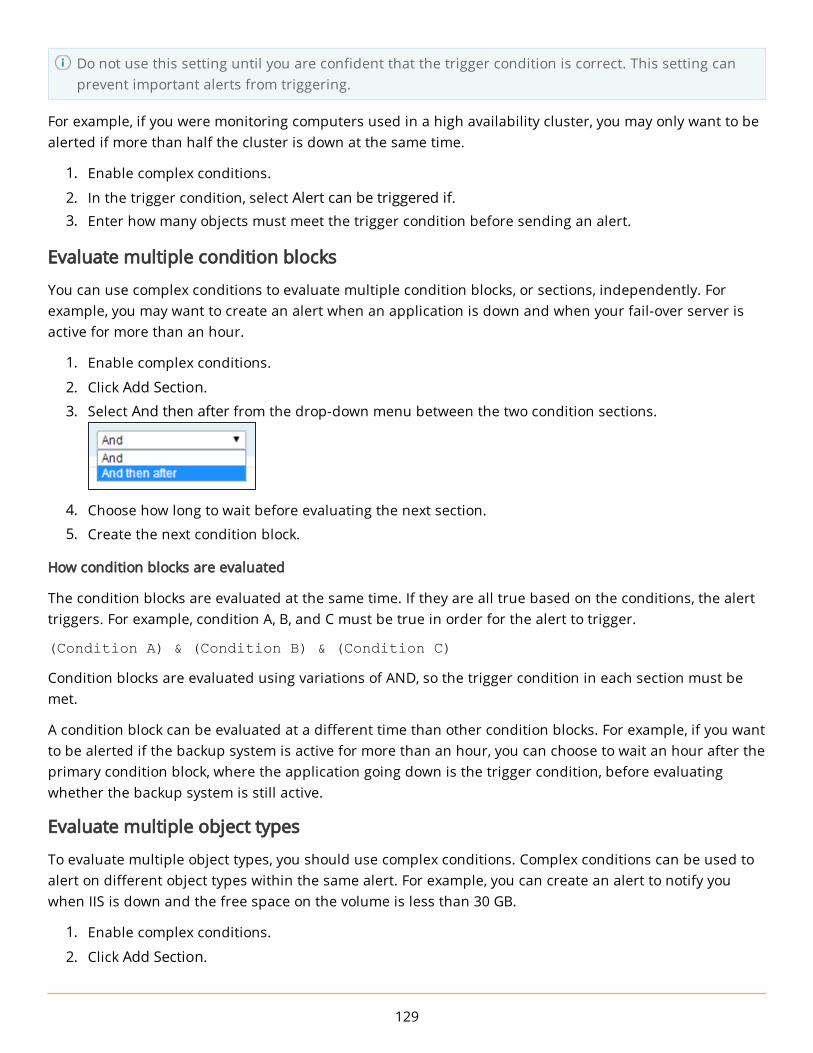
Do not use this setting until you are confident that the trigger condition is correct. This setting can prevent important alerts from triggering.
For example, if you were monitoring computers used in a high availability cluster, you may only want to be alerted if more than half the cluster is down at the same time.
1. Enable complex conditions.
2. In the trigger condition, select Alert can be triggered if. 3. Enter how many objects must meet the trigger condition before sending an alert.
Evaluate multiple condition blocks
You can use complex conditions to evaluate multiple condition blocks, or sections, independently. For example, you may want to create an alert when an application is down and when your fail-over server is active for more than an hour.
1. Enable complex conditions.
2. Click Add Section.
3. Select And then after from the drop-down menu between the two condition sections.
4. Choose how long to wait before evaluating the next section.
5. Create the next condition block.
How condition blocks are evaluated
The condition blocks are evaluated at the same time. If they are all true based on the conditions, the alert triggers. For example, condition A, B, and C must be true in order for the alert to trigger.
(Condition A) & (Condition B) & (Condition C)
Condition blocks are evaluated using variations of AND, so the trigger condition in each section must be met.
A condition block can be evaluated at a different time than other condition blocks. For example, if you want to be alerted if the backup system is active for more than an hour, you can choose to wait an hour after the primary condition block, where the application going down is the trigger condition, before evaluating whether the backup system is still active.
Evaluate multiple object types
To evaluate multiple object types, you should use complex conditions. Complex conditions can be used to alert on different object types within the same alert. For example, you can create an alert to notify you when IIS is down and the free space on the volume is less than 30 GB.
1. Enable complex conditions.
2. Click Add Section.
129

3. Choose a different value in I want to alert on.
Manage alert actionsYou can edit, test, enable, disable, and delete alert actions from the Action Manager.
Mostly for bulk actions and assigning previously created actions to alerts. View meta data about the action to help troubleshoot alert actions from a single area instead of trying to find the action in an alert.
Assign an action to an alert
You can use actions that you have already configured in multiple alerts. For example, if you have configured an action to email emergency response teams, you can assign this action to multiple alerts. When you assign an alert, it is added to the highest escalation level.
Enable and Disable Alerts
Use the On/Off toggle or select an alert and click Enable/Disable to enable or disable alerts.
Alerts must be enabled to be evaluated. For example, if an alert is scheduled to run for a short period of time each year, it must be enabled so the schedule runs. A disabled alert will not be evaluated, even if it is scheduled to run.
Available alert actionsOrion Platform products provide a variety of actions to signal an alert condition on your network.
Change a custom property
Custom properties are additional fields, such as country, building, asset tag, or serial number, that you can define and store in your SolarWinds Orion database. After properties are added, you can view or filter using them.
1. When editing or adding an alert, click Add Action in the Trigger or Reset Action section of the AlertWizard.
2. Select the Change Custom Property option, and then click Configure Action.
3. Under Custom Property Settings, select the custom property and enter the value you want to changeit to.
4. Schedule the action by selecting Time of Day > Use special Time of Day schedule for this action. This schedule only applies to the alert action you are editing.
This is often used to prevent an action from occurring during specific windows.
5. Select how frequently this action occurs for each triggered alert in Execution Settings.
6. Click Add Action.
The action is added to the trigger or reset action list, and you can test the action using the Simulate button. When the trigger or reset conditions of the alert are met, the value of the custom property you selected changes.
130

Create a ServiceNow incident
This alert management action is only available if the integration with ServiceNow® is enabled.
For information about configuring ServiceNow integration, see Configure an Orion Platform product with ServiceNow.
1. When editing or adding an alert, click Add Action in the Trigger or Reset Action section of the AlertWizard.
2. Select Create ServiceNow Incident, and click Configure Action.
3. Under Select ServiceNow Instance, specify the ServiceNow instance where you want to create theincident.
4. Under Incident Detail, define the properties of an incident template that will be used for newincidents. For example, here you can define the urgency, impact, and other properties of incidents.Text areas can hold macro variables to add information about alerts and alert objects.
If the property you want is not displayed in the Incident Detail section, click Select Properties at the bottom of the section, and select the property from the list.
5. Under State Management, define the status of the incident when the incident is reset, reopened,acknowledged, and closed. You can also specify notes to be added to the incident.
6. Schedule the action by selecting Time of Day > Use special Time of Day schedule for this action. This schedule only applies to the alert action you are editing.
This is often used to prevent an action from occurring during specific windows.
7. Select how frequently this action occurs for each triggered alert in Execution Settings.
8. Click Add Action.
The action is added to the trigger or reset action list, and you can test the action using the Simulate button. When the trigger or reset conditions of the alert are met, an incident will be created or updated in the specified ServiceNow instance.
When you use this alert action, we recommend that you only use it on the trigger tab. It is also recommended that you only use one ServiceNow action per alert.
To deactivate the integrated behavior, remove the alert action from the alert definition.
You can specify one alert action for one ServiceNow instance. To create an incident in another ServiceNow instance, specify another alert action and use a different ServiceNow instance.
Dial a paging or SMS service
This action forwards alerts to a paging or SMS service. You must download and install NotePager Pro from Notepage.net to your SolarWinds Orion server to use this action.
For instructions on configuring this action, see the NotePage Technical Support page at http://www.notepage.net/solar-winds/technicalsupport.htm and SolarWinds Network Performance Monitor Integration at www.notepage.net.
131

Email a web page to users
Send a web page, including content of resources available in the Orion Web Console, to others.
1. When editing or adding an alert, click Add Action in the Trigger or Reset Action section of the AlertWizard.
2. Select the Email a Web Page option, then click Configure Action.
3. Enter the Recipients.
Multiple addresses must be separated with commas.
4. Enter the Subject and Message of your alert trigger email/page. n For the Optional Web Server Authentication section, select User currently logged in, Another
user, or No user defined.
Use variables to make the message dynamic.
n You can create a dynamic URL to send information about the object that triggered the alert.5. Enter your SMTP server information.
6. Schedule the action by selecting Time of Day > Use special Time of Day schedule for this action. This schedule only applies to the alert action you are editing.
This is often used to prevent an action from occurring during specific windows.
7. Select how frequently this action occurs for each triggered alert in Execution Settings.
8. Click Add Action.
The action is added to the trigger or reset action list, and you can test the action using the Simulate button. When the trigger or reset conditions of the alert are met, an email is sent to the recipients.
Create a dynamic URL
Use variables to create a URL that changes based on the object that triggers the alert. Click Insert Variable and search for URL to find the all of the variables you can use to create the dynamic URL.
For example, enter ${N=SwisEntity;M=DetailsUrl} in the URL field to email a link to the Details view of the object that triggered the alert. When the email is sent, the variable resolves to a valid URL such as http://myserver/Orion/View.aspx?NetObject=N:3 and the email contains the content of theDetails view in the body.
Execute an external batch file
There are several circumstances where you may want to execute a program when a specific network event occurs. For example, you may want to run a custom script to reboot your SQL servers.
External programs selected for this action must be executable using a batch file called from the command line. Programs executed this way run in the background. However, you can set the SolarWinds Alerting Engine Service to Interact with Desktop.
SolarWinds recommends that scripts and batch files be placed on the root of c:\ to simplify the path for the batch file.
132
1. When editing or adding an alert, click Add Action in the Trigger or Reset Action section of the AlertWizard.
2. Select the Execute an External Program option, then click Configure Action.
3. Under Execute an External Program settings:a. Enter the Network path to external program in the field provided.
For example: Use c:\test.bat, where c:\ is the disk on your main poller and test.batis your external program to be executed.
b. Select either Define User or No User Defined for Optional Windows Authentication4. Schedule the action by selecting Time of Day > Use special Time of Day schedule for this action. This
schedule only applies to the alert action you are editing.
This is often used to prevent an action from occurring during specific windows.
5. Select how frequently this action occurs for each triggered alert in Execution Settings.
6. Click Add Action.
The action is added to the trigger or reset action list, and you can test the action using the Simulate button. When the trigger or reset conditions of the alert are met, the external program runs.
Execute an external Visual Basic script
In some situations, you may want to execute a Visual Basic (VB) script when a network event occurs to perform a specific action.
SolarWinds recommends that scripts and batch files be placed on the root of c:\ to simplify the path for the batch file.
1. When editing or adding an alert, click Add Action in the Trigger or Reset Action section of the AlertWizard.
2. Select the Execute an External VB Script option, then click Configure Action.
3. Under Execute an External VB Script settings:a. Select a VB Script Interpreter from the drop down list.b. Enter the Network path to the external VB Script in the field provided.
For example: Use c:\test.vbs, where c:\ is the disk on your main Orion poller andtest.vbs is your external VB Script to be executed.
c. Select either Define User or No User Defined for Optional Windows Authentication4. Schedule the action by selecting Time of Day > Use special Time of Day schedule for this action. This
schedule only applies to the alert action you are editing.
This is often used to prevent an action from occurring during specific windows.
5. Select how frequently this action occurs for each triggered alert in Execution Settings.
6. Click Add Action.
The action is added to the trigger or reset action list, and you can test the action using the Simulate button. When the trigger or reset conditions of the alert are met, the VB script runs.
133

Log the alert message to a file
SolarWinds can be configured to log alerts to a designated file which can be viewed at a later time.
1. When editing or adding an alert, click Add Action in the Trigger or Reset Action section of the AlertWizard.
2. Select the Log the Alert to a File option, then click Configure Action.
3. Under Log to File Settings:a. Enter the log filename in the Alert Log Filename field.b. Enter a maximum log file size in MB (0 = unlimited).c. Enter the Message of your alert trigger in the field provided.
4. Schedule the action by selecting Time of Day > Use special Time of Day schedule for this action. This schedule only applies to the alert action you are editing.
This is often used to prevent an action from occurring during specific windows.
5. Select how frequently this action occurs for each triggered alert in Execution Settings.
6. Click Add Action.
The action is added to the trigger or reset action list, and you can test the action using the Simulate button. When the trigger or reset conditions of the alert are met, the alert is logged to the file with the message you created.
Log the alert to the NPM event log
Record when an alert is triggered to the NetPerfMon (NPM) event log on your SolarWinds Orion server or on a remote server for later investigation.
1. When editing or adding an alert, click Add Action in the Trigger or Reset Action section of the AlertWizard.
2. Select Log the Alert to the NetPerfMon Event Log from the options, and then click Configure Action
3. Under Log the Alert to the NetPerfMon Event Log settings, enter the text you want written to the file.
Use variables to make the message dynamic.
4. Schedule the action by selecting Time of Day > Use special Time of Day schedule for this action. This schedule only applies to the alert action you are editing.This is often used to prevent an action from occurring during specific windows.
5. Expand Execution Settings to select when the action occurs.
6. Click Add Action.
The action is added to the trigger or reset action list, and you can test the action using the Simulate button. When the trigger or reset conditions of the alert are met, the alert is logged to the NPM event log with the message you created.
134

Change the resource allocation of a virtual machine
If a virtual machine is experiencing performance issues, you can have an alert trigger a specified allocation of resources. This alert management action is available if the integration with Virtualization Manager is enabled.
1. When editing or adding an alert, click Add Action in the Trigger or Reset Action section of the AlertWizard.
2. Select Manage VM - Change CPU/Memory Resources, and click Configure Action.
3. Enter a name for the action.
4. Under Select Virtual Machine, specify the virtual machine on which you want to adjust the number ofCPUs, the memory capacity, or both.
a. To change the resource allocation of the virtual machine that triggered the alert, click Executethis action.
This option is only available if the alert is built to trigger for virtual machines.
b. To change the resource allocation of a different virtual machine, click Select specific VM, andsearch for a virtual machine.
5. To power off the virtual machine before changing the resource allocation, and then power it on againafter the resource allocation has been changed, select the relevant option.
If the option is not selected, the action will be performed live on the virtual machine.
6. Under Specify New Resources, specify whether you want to add more resources to the virtualmachine, or replace the existing resources with new resources, and then specify the parameters ofthe new resource or resources.
a. Select Number of processors, and specify the number of processors to allocate.b. Select Memory, and specify the memory capacity to allocate.
7. Schedule the action by selecting Time of Day > Use special Time of Day schedule for this action. This schedule only applies to the alert action you are editing.
This is often used to prevent an action from occurring during specific windows.
8. Select how frequently this action occurs for each triggered alert in Execution Settings.
9. Click Add Action.
The action is added to the trigger or reset action list, and you can test the action using the Simulate button. When the trigger or reset conditions of the alert are met, the specified CPU and memory resources will be allocated to the virtual machine.
Delete a snapshot of a virtual machine
If a virtual machine is experiencing resource issues, you can have an alert trigger a virtual machine snapshot to be deleted. This alert management action is only available if the integration with Virtualization Manager is enabled.
1. When editing or adding an alert, click Add Action in the Trigger or Reset Action section of the AlertWizard.
2. Select Manage VM - Delete Snapshot, and click Configure Action.
135

3. Under Select Virtual Machine, specify the virtual machine from which you want to delete a snapshot.a. To delete a snapshot of the virtual machine that triggered the alert, click Execute this action.
This option is only available if the alert is built to trigger for virtual machines.
b. To delete a snapshot of a different virtual machine, click Select specific VM, and search for avirtual machine.
4. Schedule the action by selecting Time of Day > Use special Time of Day schedule for this action. This schedule only applies to the alert action you are editing.
This is often used to prevent an action from occurring during specific windows.
5. Select how frequently this action occurs for each triggered alert in Execution Settings.
6. Click Add Action.
The action is added to the trigger or reset action list, and you can test the action using the Simulate button. When the trigger or reset conditions of the alert are met, the snapshot of the specified virtual machine will be deleted.
Move a virtual machine to a different host
If a virtual machine is experiencing issues, you can have an alert trigger the virtual machine to be moved to a different host. This alert management action is only available if the integration with Virtualization Manager is enabled.
1. When editing or adding an alert, click Add Action in the Trigger or Reset Action section of the AlertWizard.
2. Select Manage VM - Move to a Different Host, and click Configure Action.
3. Under Select Virtual Machine, specify the virtual machine that you want to move.a. To move the virtual machine that triggered the alert, click Execute this action.
This option is only available if the alert is built to trigger for virtual machines.
n To apply the action only to virtual machines of a specific vendor, select the relevant option, and specify whether you want to perform to action on Hyper-V or VMware virtual machines.
b. To move a different virtual machine, click Select specific VM, and search for a virtual machine.4. To power off the virtual machine before moving it to a different host, and then power it on again
after the action has been completed, select the relevant option.
If the option is not selected, the action will be performed live on the virtual machine.
5. Under Select Target Host, search for the host where you want to move the selected virtual machine.
6. Schedule the action by selecting Time of Day > Use special Time of Day schedule for this action. This schedule only applies to the alert action you are editing.This is often used to prevent an action from occurring during specific windows.
7. Select how frequently this action occurs for each triggered alert in Execution Settings.
8. Click Add Action.
136

The action is added to the trigger or reset action list, and you can test the action using the Simulate button. When the trigger or reset conditions of the alert are met, the specified virtual machine will be moved to a different host.
Move a virtual machine to a different storage
If a virtual machine is experiencing storage issues, you can have an alert trigger the moving of the virtual machine to a different storage location. This alert management action is only available if the integration with Virtualization Manager is enabled.
1. When editing or adding an alert, click Add Action in the Trigger or Reset Action section of the AlertWizard.
2. Select Manage VM - Move to a Different Storage, and click Configure Action.
3. Under Select Virtual Machine, specify the virtual machine that you want to move.a. To move the virtual machine that triggered the alert, click Execute this action.
This option is only available if the alert is built to trigger for virtual machines.
n To apply the action only to virtual machines of a specific vendor, select the relevant option, and specify whether you want to perform to action on Hyper-V or VMware virtual machines.
b. To move a different virtual machine, click Select specific VM, and search for a virtual machine.4. To power off the virtual machine before moving it to a different storage, and then power it on again
after the action has been completed, select the relevant option.
If the option is not selected, the action will be performed live on the virtual machine.
5. Under Select Target Datastore, search for the datastore where you want to move the selected virtualmachine.
a. In a VMware environment, select one of the available datastores.b. In a Hyper-V environment, select one of the available datastores, and click either Use the
default location to move the virtual machine to the default location of the datastore, or clickSpecify custom path, and enter a custom location.
6. Schedule the action by selecting Time of Day > Use special Time of Day schedule for this action. This schedule only applies to the alert action you are editing.
This is often used to prevent an action from occurring during specific windows.
7. Select how frequently this action occurs for each triggered alert in Execution Settings.
8. Click Add Action.
The action is added to the trigger or reset action list, and you can test the action using the Simulate button. When the trigger or reset conditions of the alert are met, the specified virtual machine will be moved to a different datastore.
Pause a virtual machine
If a virtual machine is experiencing issues, you can have an alert trigger a pause for the virtual machine. This alert management action is only available if the integration with Virtualization Manager is enabled.
137

This action can only be configured for Hyper-V virtual machines.
1. When editing or adding an alert, click Add Action in the Trigger or Reset Action section of the AlertWizard.
2. Select Manage VM - Pause, and click Configure Action.
3. Under Select Virtual Machine, specify the virtual machine that you want to pause.a. To pause the virtual machine that triggered the alert, click Execute this action.
This option is only available if the alert is built to trigger for virtual machines.
b. To pause a different virtual machine, click Select specific VM, and search for a virtualmachine.
4. Schedule the action by selecting Time of Day > Use special Time of Day schedule for this action. This schedule only applies to the alert action you are editing.
This is often used to prevent an action from occurring during specific windows.
5. Select how frequently this action occurs for each triggered alert in Execution Settings.
6. Click Add Action.
The action is added to the trigger or reset action list, and you can test the action using the Simulate button. When the trigger or reset conditions of the alert are met, the specified virtual machine will be paused.
Power off a virtual machine
If a virtual machine is experiencing issues, you can have an alert trigger the virtual machine to be powered off. This alert management action is only available if the integration with Virtualization Manager is enabled.
1. When editing or adding an alert, click Add Action in the Trigger or Reset Action section of the AlertWizard.
2. Select Manage VM - Power Off, and click Configure Action.
3. Under Select Virtual Machine, specify the virtual machine that you want to power off.a. To power off the virtual machine that triggered the alert, click Execute this action.
This option is only available if the alert is built to trigger for virtual machines.
b. To power off a different virtual machine, click Select specific VM, and search for a virtualmachine.
4. Schedule the action by selecting Time of Day > Use special Time of Day schedule for this action. This schedule only applies to the alert action you are editing.
This is often used to prevent an action from occurring during specific windows.
5. Select how frequently this action occurs for each triggered alert in Execution Settings.
6. Click Add Action.
The action is added to the trigger or reset action list, and you can test the action using the Simulate button. When the trigger or reset conditions of the alert are met, the specified virtual machine will be powered off.
138

Power on a virtual machine
If a virtual machine is powered off, you can have an alert trigger the virtual machine to be powered on. This alert management action is only available if the integration with Virtualization Manager is enabled.
1. When editing or adding an alert, click Add Action in the Trigger or Reset Action section of the AlertWizard.
2. Select Manage VM - Power On, and click Configure Action.
3. Under Select Virtual Machine, specify the virtual machine that you want to power on.a. To power on the virtual machine that triggered the alert, click Execute this action.
This option is only available if the alert is built to trigger for virtual machines.
b. To power on a different virtual machine, click Select specific VM, and search for a virtualmachine.
4. Schedule the action by selecting Time of Day > Use special Time of Day schedule for this action. This schedule only applies to the alert action you are editing.
This is often used to prevent an action from occurring during specific windows.
5. Select how frequently this action occurs for each triggered alert in Execution Settings.
6. Click Add Action.
The action is added to the trigger or reset action list, and you can test the action using the Simulate button. When the trigger or reset conditions of the alert are met, the specified virtual machine will be powered on.
Restart a virtual machine
If a virtual machine is experiencing issues, you can have an alert trigger the virtual machine to be restarted. This alert management action is only available if the integration with Virtualization Manager is enabled.
1. When editing or adding an alert, click Add Action in the Trigger or Reset Action section of the AlertWizard.
2. Select Manage VM - Reboot, and click Configure Action.
3. Under Select Virtual Machine, specify the virtual machine that you want to reboot.a. To reboot the virtual machine that triggered the alert, click Execute this action.
This option is only available if the alert is built to trigger for virtual machines.
b. To reboot a different virtual machine, click Select specific VM, and search for a virtualmachine.
4. Schedule the action by selecting Time of Day > Use special Time of Day schedule for this action. This schedule only applies to the alert action you are editing.
This is often used to prevent an action from occurring during specific windows.
5. Select how frequently this action occurs for each triggered alert in Execution Settings.
6. Click Add Action.
139

The action is added to the trigger or reset action list, and you can test the action using the Simulate button. When the trigger or reset conditions of the alert are met, the specified virtual machine restarts.
Suspend a virtual machine
If a virtual machine is experiencing performance issues, you can have an alert trigger the virtual machine to be suspended. This alert management action is only available if the integration with Virtualization Manager is enabled.
1. When editing or adding an alert, click Add Action in the Trigger or Reset Action section of the AlertWizard.
2. Select Manage VM - Suspend, and click Configure Action.
3. Under Select Virtual Machine, specify the virtual machine that you want to suspend.a. To suspend the virtual machine that triggered the alert, click Execute this action.
This option is only available if the alert is built to trigger for virtual machines.
b. To suspend a different virtual machine, click Select specific VM, and search for a virtualmachine.
4. Schedule the action by selecting Time of Day > Use special Time of Day schedule for this action. This schedule only applies to the alert action you are editing.
This is often used to prevent an action from occurring during specific windows.
5. Select how frequently this action occurs for each triggered alert in Execution Settings.
6. Click Add Action.
The action is added to the trigger or reset action list, and you can test the action using the Simulate button. When the trigger or reset conditions of the alert are met, the specified virtual machine is suspended.
Take a snapshot of a virtual machine
If a virtual machine is experiencing issues, you can have an alert trigger a snapshot of the virtual machine to be taken. This alert management action is only available if the integration with Virtualization Manager is enabled.
1. When editing or adding an alert, click Add Action in the Trigger or Reset Action section of the AlertWizard.
2. Select Manage VM - Take Snapshot, and click Configure Action.
3. Under Select Virtual Machine, specify the virtual machine of which you want to take a snapshot.a. To take a snapshot of the virtual machine that triggered the alert, click Execute this action.
This option is only available if the alert is built to trigger for virtual machines.
b. To take a snapshot a different virtual machine, click Select specific VM, and search for avirtual machine.
140

4. Schedule the action by selecting Time of Day > Use special Time of Day schedule for this action. This schedule only applies to the alert action you are editing.
This is often used to prevent an action from occurring during specific windows.
5. Select how frequently this action occurs for each triggered alert in Execution Settings.
6. Click Add Action.
The action is added to the trigger or reset action list, and you can test the action using the Simulate button. When the trigger or reset conditions of the alert are met, a snapshot is taken of the specified virtual machine.
Play a sound when an alert is triggered
The Play a Sound action uses the SolarWinds desktop notification client to play the sound on your computer when an alert arrives.
You must download and install the client on every computer that you want to play a sound when an alert arrives. After installing the desktop notification client, configure which sound you want to play when an alert is received.
Computers that do not have the desktop notification client installed on them do not play a sound when an alert arrives. If you want an alert notification sound to play on your desktop or laptop, you must install and configure the desktop notification client on that computer.
Download the desktop notification client from <Your SolarWinds Orion server>/DesktopNotificationTool/SolarWinds.DesktopNotificationTool.msi. Run the installer and follow the on-screen instructions to install the client.
The desktop notification client requires the following information to connect to your SolarWinds Orion server and receive alerts:
n Orion Server Name or IP Address
n Orion User Name
n Password
You can use the server name and credentials that you use to logon to your SolarWinds product.
SolarWinds can be configured to play a sound upon alert trigger or reset. This alert action is frequently used in NOC environments. The SolarWinds Desktop Notification client must be installed on each computer that you want to play a sound. The following procedure configures a sound to play for an alert.
1. When editing or adding an alert, click Add Action in the Trigger or Reset Action section of the AlertWizard.
2. Select the Play a Sound option, and then click Configure Action.
141

3. Under Play a sound settings:
n If not installed, click Download our desktop notification client to download and install the notification client. From the notification client, select an alert sound.
4. Schedule the action by selecting Time of Day > Use special Time of Day schedule for this action. This schedule only applies to the alert action you are editing.
This is often used to prevent an action from occurring during specific windows.
5. Select how frequently this action occurs for each triggered alert in Execution Settings.
6. Click Add Action.
The action is added to the trigger or reset action list, and you can test the action using the Simulate button. When the trigger or reset conditions of the alert are met, a sound plays through the client.
Restart IIS sites or application pools
If IIS or application pools are experiencing performance or resource issues, you can use an alert to restart them.
You must know the IIS Server name and the Site or Application Pool to restart a remote instance of IIS.
1. When editing or adding an alert, click Add Action in the Trigger or Reset Action section of the AlertWizard.
2. Select Restart IIS Site/Application Pool from the options, and then click Configure Action.
3. Expand Restart IIS Site/Application Pool Settings.a. Select the IIS Action to Perform from the drop down list.b. Choose the Site or Application Pool.
4. Schedule the action by selecting Time of Day > Use special Time of Day schedule for this action. This schedule only applies to the alert action you are editing.
This is often used to prevent an action from occurring during specific windows.
5. Select how frequently this action occurs for each triggered alert in Execution Settings.
6. Click Add Action.
The action is added to the trigger or reset action list, and you can test the action using the Simulate button. When the trigger or reset conditions of the alert are met, the selected site or pool restarts.
Send a Windows Net message
If a computer is experiencing issues, you can have an alert trigger a Windows Net Message to be sent to a specific computer or to all computers.
Alerts can be configured to display a pop-up Windows Net Message either on a specific computer or on all computers in a selected domain or workgroup. The following steps configure Windows Net messaging for triggered or reset alerts.
142

The only operating systems supporting Windows Net Messaging are Windows Server 2003 and Windows XP or earlier.
1. When editing or adding an alert, click Add Action in the Trigger or Reset Action section of the AlertWizard.
2. Select the Send Net Message option, then click Configure Action.
3. Under Send a Net Message settings:
a. Enter Computer Name or IP address in the field provided.
You can enter multiple computers or IP addresses by separating them with commas.
b. Enter the Message of your alert trigger in the field provided.4. Schedule the action by selecting Time of Day > Use special Time of Day schedule for this action. This
schedule only applies to the alert action you are editing.
This is often used to prevent an action from occurring during specific windows.
5. Select how frequently this action occurs for each triggered alert in Execution Settings.
6. Click Add Action.
The action is added to the trigger or reset action list, and you can test the action using the Simulate button. When the trigger or reset conditions of the alert are met, the message is sent to the selected computers.
Send an SNMP trap
SNMP traps signal the occurrence of significant events by sending SNMP messages to a monitoring device. You can have an alert trigger this action to inform you of these events.
This action requires the following information:
n UDP port number
n SNMP version number
n SNMP credentials
1. When editing or adding an alert, click Add Action in the Trigger or Reset Action section of the AlertWizard.
2. Select the Send SNMP Trap option, then click Configure Action.
3. Under Send SNMP Trap Message:
a. Enter SNMP Trap Destinations in the field provided.
Multiple IP Addresses should be separated by commas or semicolons.
b. Select a Trap Template from the drop down lists.
4. Enter the Message of your alert trigger in the field provided.a. Optionally click Insert Variable to add variables using the following procedure:
143

5. Expand SNMP Properties.a. Enter a UDP Port number in the field provided.b. Select an SNMP Version from the drop down list.c. Enter the SNMP Community String in the field provided.
6. Schedule the action by selecting Time of Day > Use special Time of Day schedule for this action. This schedule only applies to the alert action you are editing.
This is often used to prevent an action from occurring during specific windows.
7. Select how frequently this action occurs for each triggered alert in Execution Settings.
8. Click Add Action.
The action is added to the trigger or reset action list, and you can test the action using the Simulate button. When the trigger or reset conditions of the alert are met, the SNMP trap message is sent.
Send a GET or POST request
SolarWinds can be configured to communicate alerts using HTTP GET or POST functions. As an example, a URL may be used as an interface into a trouble ticket system, and, by correctly formatting the GET function, new trouble tickets may be created automatically.
1. When editing or adding an alert, click Add Action in the Trigger or Reset Action section of the AlertWizard.
2. Select the Send a GET or POST Request to a Web Server option, then click Configure Action.
3. Under HTTP request settings:a. Enter a URL in the field provided.b. Select either Use HTTP GET or Use HTTP POST.
4. Schedule the action by selecting Time of Day > Use special Time of Day schedule for this action. This schedule only applies to the alert action you are editing.This is often used to prevent an action from occurring during specific windows.
5. Select how frequently this action occurs for each triggered alert in Execution Settings.
6. Click Add Action.
The action is added to the trigger or reset action list, and you can test the action using the Simulate button. When the trigger or reset conditions of the alert are met, the GET or POST request is sent to the server. You can view the server logs to confirm that the action occurred.
Send a syslog message
SolarWinds can log received alerts to the syslog of a designated machine for later investigation. The following procedure configures an alert to send a message to a designated syslog server.
1. When editing or adding an alert, click Add Action in the Trigger or Reset Action section of the AlertWizard.
2. Select the Send a SysLog Message option, then click Configure Action.
144
3. Under Send a SysLog message settings:
a. Enter the Hostname or IP Address of the syslog server in the field provided.
Multiple syslog servers should be separated by commas.
b. Select a Severity and a Facility from the drop down lists.
4. Enter the Message of your alert trigger in the field provided.5. Schedule the action by selecting Time of Day > Use special Time of Day schedule for this action. This
schedule only applies to the alert action you are editing.
This is often used to prevent an action from occurring during specific windows.
6. Select how frequently this action occurs for each triggered alert in Execution Settings.
7. Click Add Action.
The action is added to the trigger or reset action list, and you can test the action using the Simulate button. When the trigger or reset conditions of the alert are met, the syslog message is sent.
Send an email or page
This action sends an email from the product to selected recipients for investigation into the cause of the alert.
Before configuring this alert you must first configure the default SMTP server the product uses to send email. You can change the default SMTP server later or use different SMTP servers for specific alerts.
You need the following information:
n The SMTP host name or IP address
n The SMTP port number
n Whether the SMTP server uses SSL
n The SMTP credentials, if necessary
n Default sender email address
Configure the SMTP server in the alert action or from the Settings page.
1. When editing or adding an alert, click Add Action in the Trigger or Reset Action section of the AlertWizard.
2. Select the Send an Email/Page option, then click Configure Action.
145

3. Enter recipients and the message.
n You must provide at least one email address in the To field, and multiple addresses must be separated with commas. Some pager systems require a valid reply address to complete the page.
n Messaging is disabled if both the Subject and Message fields are empty.
4. Enter the SNMP information.
5. Schedule the action by selecting Time of Day > Use special Time of Day schedule for this action. This schedule only applies to the alert action you are editing.
This is often used to prevent an action from occurring during specific windows.
6. Select how frequently this action occurs for each triggered alert in Execution Settings.
7. Click Add Action.
The action is added to the trigger or reset action list, and you can test the action using the Simulate button. When the trigger or reset conditions of the alert are met, the email or page is sent.
Manually set a custom status
Setting a custom status can be useful if you want to change the status of a familiar node, but does not affect actual, polled values. For example, if the custom status is set to Up, but the server is down or unresponsive, packet loss continues to be 100%. Alerts based on the status do not trigger in this instance, but alerts based on a polled value, such as packet loss, do trigger.
When the status is set with an alert, the status does not update to the actual, polled status. The status must be switched manually to a different status or configured to use the polled status. Change the status to use the polled status from the node details page or create a reset action to set the status to use the polled status.
1. When editing or adding an alert, click Add Action in the Trigger or Reset Action section of the AlertWizard.
2. Select the Set Custom Status option, then click Configure Action.
3. Under Change Object Status Manually:a. Select Change to a specific status if you are creating a trigger action, and choose a status.b. Select Use polled status if you are creating a reset action.
4. Schedule the action by selecting Time of Day > Use special Time of Day schedule for this action. This schedule only applies to the alert action you are editing.
This is often used to prevent an action from occurring during specific windows.
5. Select how frequently this action occurs for each triggered alert in Execution Settings.
6. Click Add Action.
The action is added to the trigger or reset action list, and you can test the action using the Simulate button. When the trigger or reset conditions of the alert are met, the status for the object changes.
146

Use the speech synthesizer to read alerts
The Text to Speech Output action uses the SolarWinds desktop notification client and your computer's speech synthesizer to convert text messages-to-speech messages. The action notifies users of new alerts by reading the alert out loud. This capability is especially helpful for users who are visually impaired or who are not always at their desks to read alerts onscreen.
Download and install the client on each computer that you want to play a sound. Then configure which synthesizer you want to play.
SolarWinds uses Microsoft® Speech Synthesis Engine version 5.0. If you are under active SolarWinds maintenance, you may also install and use other text-to-speech engines by visiting the SolarWinds website. The following procedure configures text-to-speech output for an alert trigger or reset.
Due to restrictions on Windows service applications, the Text to Speech action is not available to SolarWinds installations on Windows 7 or Windows Server 2008 and higher.
1. When editing or adding an alert, click Add Action in the Trigger or Reset Action section of the AlertWizard.
2. Select the Text to Speech Output option, then click Configure Action.3. Under Text to Speech Output settings click Download our desktop notification client to download,
install, and configure the notification client.
4. Schedule the action by selecting Time of Day > Use special Time of Day schedule for this action. This schedule only applies to the alert action you are editing.
This is often used to prevent an action from occurring during specific windows.
5. Select how frequently this action occurs for each triggered alert in Execution Settings.
6. Click Add Action.
The action is added to the trigger or reset action list, and you can test the action using the Simulate button. When the trigger or reset conditions of the alert are met, the message is read.
Log an alert to the Windows Event Log on a specific server
You may specify that an alert be logged to the Windows Event Log either on the SolarWinds server or on a remote server for later investigation.
1. When editing or adding an alert, click Add Action in the Trigger or Reset Action section of the AlertWizard.
2. Select the Windows Event Log option, then click Configure Action.
3. Under Event Log Settings:
a. Select either Use Event Log Message on Network Performance Monitor Server or Use Event LogMessage on a Remote Server.
b. Enter the Message of your alert trigger.
147

4. Schedule the action by selecting Time of Day > Use special Time of Day schedule for this action. This schedule only applies to the alert action you are editing.
This is often used to prevent an action from occurring during specific windows.
5. Select how frequently this action occurs for each triggered alert in Execution Settings.
6. Click Add Action.
The action is added to the trigger or reset action list, and you can test the action using the Simulate button. When the trigger or reset conditions of the alert are met, the alert message is added to the Windows Event log.
Changes in the alerting engineAs of Orion Platform version 2015.1, alerts are no longer created with the desktop-based, Advanced Alerts Manager or Basic Alerts Manager. Alerts are instead created and managed in the SolarWinds Orion Web Console.
Alerts that you created in the desktop-based Alert Manager are migrated to the web-based alerting engine when upgrading to Core version 2015.1 or later. Some alerts may not be successfully migrated and include information about why they were not migrated in the migration log. You can view the alert migration logs in the informational banners displayed after you update your installation.
Changed or removed functionality
The suppression section has not been carried over to web-based alerting. Use options, such as Condition must exist for more than, in the trigger conditions to accomplish similar tasks.
Database changes
The following are a list of tables that have been changed that you may be using in custom SQL queries:
n Engines has been renamed to AllEngines.
n Nodes has been split into NodesCustomProperties, NodesData, and NodesStatistics.
n History has been split into table-specific history tables, such as the AlertHistory table.
The new alerting engine also includes the following new alerting tables:
n Actions
n ActionsAssignments
n ActionsProperties
n AlertActive
n AlertActiveObjects
n AlertConditionState
n AlertConfigurations
n AlertHistory
n AlertHistoryView (introduced in 2015.1.3)
148

n AlertMigrationLog
n AlertObjects
n AlertSchedules
For a list of database changes from Orion Platform version 2014.2 to version 2016.1, including new tables, column changes, or data constraint or data type changes, see the online Database Changes spreadsheet.
Macro or variable changes
The following variables are no longer valid:
n ${Property} - The property the alert is monitoring. You can select a new variable with the specificproperty you want to view.
n ${TriggeredValue} - The value that triggered the alert. You can select a new variable with thespecific property you want to view.
n ${AlertStartTime} - When the alert active. You can use the Time of Day scheduler to controlwhen the alert is active.
n ${AlertEndTime} - When the alert is no longer active. You can use the Time of Day scheduler tocontrol when the alert is not active.
n ${ObjectSubType} - Determines if the node supports SNMP or is ICMP only. You can useNode.ObjectSubType as the macro name.
Defunct alert variablesThe following variables are no longer valid:
n ${Property} - The property the alert is monitoring. You can select a new variable with the specificproperty you want to view.
n ${TriggeredValue} - The value that triggered the alert. You can select a new variable with thespecific property you want to view.
n ${AlertStartTime} - When the alert active. You can use the Time of Day scheduler to controlwhen the alert is active.
n ${AlertEndTime} - When the alert is no longer active. You can use the Time of Day scheduler tocontrol when the alert is not active.
n ${ObjectSubType} - Determines if the node supports SNMP or is ICMP only. You can useNode.ObjectSubType as the macro name.
Alert migration to the webThe Advanced Alert Manager and the Basic Alert Manager are deprecated in SolarWinds Orion Core 2015.1 and later. A web-based alerting engine replaces the previous alerting engine and includes new alerting variables.
149

To facilitate using the web-based alerting engine, part of the upgrade process migrates alerts created with the desktop-based alerting engine to the web-based alerting engine. All alerts are migrated, including alerts that are disabled.
Migration issues
Some alerts may not be successfully migrated. The migration log records all alerts that are migrated and includes error messages for alerts that either cannot be migrated or that are not migrated successfully.
Common reasons that migration may not be successful include:
n Invalid alert variables or macros - Some variables are no longer supported.
n Invalid conditions - Some conditions are no longer supported.
n Large alert scope - The number of objects that are relevant to an alert may be too large to migrate.
Limitations to migrated alerts
After an alert has been migrated, you can only view the alert definition through the web-based Alert Manager. You can no longer click the alert in the views.
Share alerts with other SolarWinds productsAlerts may be shared with selected other SolarWinds products that are not part of the SolarWinds Orion Platform, such as AlertCentral and Web Help Desk.
1. On the Alert Summary page, expand Alert Integration.
2. Select the Integrate alert with other SolarWinds check box. 3. Provide an appropriate Alert Subject. You can choose to use this name as the subject field for the
alert.
4. Choose the alert Severity.
This information may be used to determine how a shared alert is handled by the other product.
5. Include additional alert properties in the alert by clicking Insert Variable and choosing the ones you want to include. This ensures that the variables you used in the alert message are translated correctly to the other product.
150

Manage the Orion Web ConsoleThe Orion Web Console is an integral part of the Orion Platform products and can be accessed from virtually any computer connected to the Internet.
To customize the Orion Web Console, you need administrator rights.
You can customize the Orion Web Console for multiple users, update polling settings and thresholds, and store individually customized views as user profiles.
Log in for the first time as an Administrator 1. Launch the Orion Web Console using either of the following methods:
n Start Orion Web Console in your SolarWinds Orion program folder. n Launch a browser and enter http://ip_address or http://hostname, where ip_address
is the IP address of your SolarWinds Orion server, or where hostname is the domain name of your SolarWinds Orion server.
2. Enter Admin as your User Name, and click Login.
Until you set a password, you can log in as Admin with no password. After your first login, change the Admin password.
Log in to the Orion Web Console
1. Launch the Orion Web Console using either of the following methods:
n Start Orion Web Console in your SolarWinds Orion program folder. n Launch a browser and enter http://ip_address or http://hostname, where ip_address
is the IP address of your SolarWinds Orion server, or where hostname is the domain name of your SolarWinds Orion server.
2. Enter the user name and password, and click Login.
Manage Orion Polling EnginesTo optimize your polling engines for best performance, SolarWinds recommends tuning them regularly. If you use more than one polling engine, you must balance the load so each engine performs best.
View information about the performance of all polling engines in your Orion Platform product installation in the Polling Engine view by clicking Settings > All Settings, and then Polling Engines in the Details group.
Modify polling engine settings by clicking Settings > All Settings, and then Polling Settings in the Thresholds & Polling group.
Update polling settings
Click Settings > All Settings, and in the Thresholds & Polling group, click Polling Settings to configure your poller.
151
Depending on the Orion Platform products you have installed, additional polling settings may be available. See your SolarWinds Orion Administrator Guide for more information about the settings.
Configure polling interval settings
You can improve your SolarWinds Orion server performance by entering longer polling intervals.
Configure how frequently the polling engine requests information from devices.
Default Node Poll Interval
The interval for polling the status and response time of monitored devices. By default, this interval is 120 seconds.
Default Volume Poll Interval
The interval for polling the status and response time of volumes. By default, this interval is 120 seconds.
Default Rediscovery Interval
The interval for polling the entire network to detect any re-indexed interfaces. Monitored network devices are also checked for IOS upgrades for EnergyWise support. By default, this interval is 30 minutes.
Rediscovery scans your network for changes to your monitored nodes. If you want to discover changes to your environment, schedule a network discovery to occur on a periodic basis and check the scheduled discovery results.
The minimum rediscovery interval is five minutes (in earlier versions, the interval was one minute). You cannot submit polling interval settings if the default rediscovery interval is not set to at least five minutes.
Lock Custom Values
Select this option to store the configured custom ICMP polling interval settings.
Re-Apply Polling Intervals
Apply the settings specified in this section to all objects in the database by clicking Re-Apply Polling Intervals. Click Submit to use the current settings for new objects.
If you leave the page without submitting the changes, your settings will be applied to objects in the database, but will not be saved. For objects added to the database in the future, the saved settings will be used. Not submitting the changes can result in different settings for objects that are already in the database, and different settings for newly added objects.
Configure polling statistics intervals
Configure the default polling intervals for device statistics. To apply poller settings, click Re-Apply Polling Statistic Intervals.
152
Default Node Topology Poll Interval
Configure the interval for polling topology data of monitored devices. By default, this interval is 30 minutes. To reduce network load, increase this polling interval.
Default Node Statistics Poll Interval
Configure the interval for polling performance statistics of monitored devices. By default, this interval is 10 minutes.
Default Interface Statistics Poll Interval
Configure the interval for polling performance statistics of monitored interfaces. By default, this interval is 9 minutes.
Default Volume Statistics Poll Interval
Configure the interval for polling the performance statistics of volumes. By default, this interval is 15 minutes.
Configure the dynamic IP address and hostname resolution
Select the default IP address version (IPv4 or IPv6) to use when resolving the address of monitored dual stack devices.
A dual stack device is capable of providing IP addresses in both IPv4 and IPv6 formats.
To monitor IPv6 devices, enable IPv6 on the SolarWinds Orion server.
Immediately change the settings by clicking Re-Apply Resolution Preference.
Configure Database Settings
Configure the time of day when the database maintenance runs, and how long data are retained in the SolarWinds Orion database.
Shortening retention periods can improve the database performance.
Changing default settings can require additional space in the SolarWinds Orion database. Consider your SQL environment resources, such as disk space and hardware configuration before you change the retention periods.
It can take more than 10 minutes to propagate some changes to SolarWinds Orion database settings.
Archive Time
Configure the time of day when the maintenance of the SolarWinds Orion database runs.
Auditing Trails Retention
Specify the number of days until the audit trails statistics are deleted from the database.
153

Detailed Statistics Retention
Specify the time period in which all statistics collected in the SolarWinds Orion database are summarized into hourly statistics. By default, this period is seven days.
Hourly Statistics Retention
Specify the time period in which all statistics collected in the SolarWinds Orion database are summarized into daily statistics. By default, this period is 30 days.
Daily Statistics Retention
Specify how long daily statistics are kept in the SolarWinds Orion database. After the specified time, the daily statistics are deleted. By default, this period is 365 days.
Container Detailed Statistics Retention
Specify when group statistics are summarized into hourly statistics. The default is seven days.
Container Hourly Statistics Retention
Specify when hourly group statistics are summarized into daily statistics. The default is 30 days.
Container Daily Statistics Retention
Specify how long group statistics are kept in the SolarWinds Orion database. The default is 365 days.
Baseline Data Collection Duration
Specify the number of days that are included into the baseline.
Detailed Wireless Statistics Retention
Specify the number of days until the detailed wireless statistics in the SolarWinds Orion database are summarized into hourly statistics. By default, this period is seven days.
Hourly Wireless Statistics Retention
Specify the number of days until the hourly wireless statistics are summarized into daily statistics. By default, this period is 30 days.
Daily Wireless Statistics Retention
Specify the number of days until the daily wireless statistics are deleted from the database. By default, this period is 365 days.
Events Retention
Specify the number of days until the all network events data are deleted from the SolarWinds Orion database. By default, this period is 30 days.
Syslog Messages Retention
Specify the number of days until all data related to received Syslog messages are deleted from the SolarWinds Orion database. By default, this period is seven days.
154
Trap Messages Retention
Specify the number of days until all data related to received trap messages are deleted from the SolarWinds Orion database. By default, this period is 30 days.
Max Alert Execution Time
Specify the time period until the alerts are disabled if they are not executed successfully. If the defined alert condition persists, Orion continues trying to execute the alert.
Alert Acknowledge URL Text
Provide text that is displayed when alerts are available for acknowledgment over the web. When viewing an alert, click the text to acknowledge the alert.
Allow alert actions for unmanaged objects
Select this option if you want the SolarWinds Alerting Engine to execute configured alert actions for unmanaged objects.
Enabling this option increases the processing load on both the SolarWinds server and the database server.
Discovery Retention
Specify the number of days until all network discovery profiles are deleted from the SolarWinds Orion database. The retention starts when a discovery is first defined. By default, this period is 60 days.
Downtime History Retention
Specify the number of days until the downtime history is deleted from the database. By default, this period is seven days.
Configure network settings
Configure the settings related to ICMP and SNMP requests.
ICMP Timeout
Configure the period after which all ICMP (ping) requests made by the poller time out if a response is not received. By default, this period is 2500 ms.
ICMP Data
Specify the text that is included in all ICMP packets sent by the poller.
SNMP Timeout
Configure the period after which all SNMP requests made by the poller time out if a response is not received. By default, this period is 2500 ms.
155

SNMP Retries
Configure the number of times the poller retries the request if there is no response to an SNMP poll request within the SNMP timeout period. By default, this value is 2.
UCS API Timeout
Configure the period after which all UCS API requests made by the poller time out if a response is not received. By default, this period is 240 seconds.
Perform reverse DNS lookup
Select this option if you want the SolarWinds Orion server to perform reverse DNS lookups on monitored DHCP nodes. By default, reverse DNS lookup for DHCP nodes is enabled.
Configure calculations and threshold settings
The following settings designate methods for calculating availability and transmission rate baselines, selecting the node warning level and counter type, and indicating security preferences for community strings and other potentially sensitive information in the web console.
Availability Calculation (advanced)
Configure the type of calculation that is performed to determine device availability.
Baseline Calculation (advanced)
Enable this option to ensure that baselines for the transmission rates of the elements of your network are calculated upon startup. This baseline is used as a starting point for any comparison statistics.
Enable Auto Dependencies
Enable this option to ensure that the SolarWinds Orion server collates topology information from networked devices and creates dependency links between devices.
Allow Secure Data on Web (advanced)
Select this option if your network is secure and you want to allow users to view community strings and other potentially sensitive information in the Orion Web Console. Sensitive information about your network is not available in the Orion Web Console.
This setting does not affect the display of custom reports that you export to the web.
Node Warning Level
Configure the period after which devices that do not respond to polling are displayed as Down in the Orion Web Console. By default, this period is 120 seconds.
Counter Rollover
Specify a method that decides what happens if a polled value is less than the previous polled value.
156

Default Assigned IP Address
Specify the node IP address that is recorded if DNS resolution fails for a monitored node. If you leave this field blank, no IP address will be stored.
Disable HTML Encoding for Polled Data
Specify if you want to HTML-encode polled data. HTML encoding provides added security for polled data in the Orion Web Console.
Calculate node availability
Determine the availability under Orion Polling Settings > Calculations & Thresholds > Availability Calculation by using one of the following methods.
Node Status
The default method is based on the historical up or down status of the selected node. The selected node is polled for status on the Default Node Poll Interval defined on the Orion Polling Settings view.
If the selected node responds to a ping within the default interval, the node is considered up, and a value of 100 is recorded in the Response Time view. If the node does not respond to a ping within the default interval, the node is considered down and a value of 0 is recorded in the Response Time view.
To calculate node availability over a selected time period, the sum of all Response Time table records for the selected node over the selected time period is divided by the selected time period. This provides an average availability over the selected time period.
Percent Packet Loss
This method is a more complicated calculation that bases the availability of a selected node on its packet loss percentage. The selected node is polled for status. If it responds within the Default Node Poll Interval defined on the Orion Polling Settings view, a value of 100 is averaged with the previous 10 availability records.
The result of the Percent Packet Loss calculation is a sliding-window average. To calculate node availability over a selected time period, the sum of all results in the Response Time table for the selected node over the selected time period is divided by the selected time period. This provides an average availability over time.
The Percent Packet Loss method introduces a historical dependency into each availability node record. It is best practice to leave calculations based on Node Status unless you specifically need node availability based on packet loss.
157
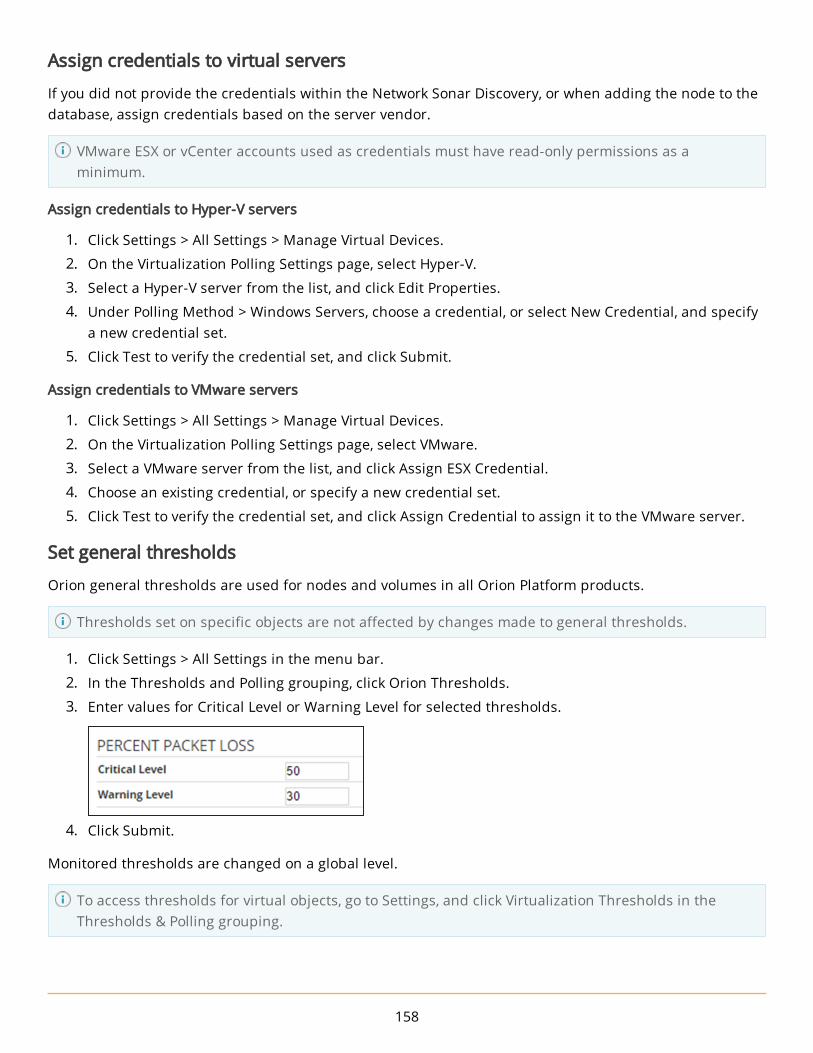
Assign credentials to virtual servers
If you did not provide the credentials within the Network Sonar Discovery, or when adding the node to the database, assign credentials based on the server vendor.
VMware ESX or vCenter accounts used as credentials must have read-only permissions as a minimum.
Assign credentials to Hyper-V servers
1. Click Settings > All Settings > Manage Virtual Devices.
2. On the Virtualization Polling Settings page, select Hyper-V.
3. Select a Hyper-V server from the list, and click Edit Properties.
4. Under Polling Method > Windows Servers, choose a credential, or select New Credential, and specify a new credential set.
5. Click Test to verify the credential set, and click Submit.
Assign credentials to VMware servers
1. Click Settings > All Settings > Manage Virtual Devices.
2. On the Virtualization Polling Settings page, select VMware.
3. Select a VMware server from the list, and click Assign ESX Credential.
4. Choose an existing credential, or specify a new credential set.
5. Click Test to verify the credential set, and click Assign Credential to assign it to the VMware server.
Set general thresholds
Orion general thresholds are used for nodes and volumes in all Orion Platform products.
Thresholds set on specific objects are not affected by changes made to general thresholds.
1. Click Settings > All Settings in the menu bar.
2. In the Thresholds and Polling grouping, click Orion Thresholds.
3. Enter values for Critical Level or Warning Level for selected thresholds.
4. Click Submit.
Monitored thresholds are changed on a global level.
To access thresholds for virtual objects, go to Settings, and click Virtualization Thresholds in the Thresholds & Polling grouping.
158
Set the node warning level
A device may drop packets or fail to respond to a poll for many reasons. When the device fails to respond, the device status is changed from Up to Warning. You can specify how long a node can remain in the Warning status before it is marked as Down. During the interval specified, the service continually checks the node status.
Some of the events or alerts for down nodes you are receiving can inform you about nodes that are not actually down. Their status can be caused by intermittent packet loss on the network.
Set the Node Warning Interval to a higher value to avoid false notifications.
1. Log in to the Orion Web Console as an administrator.
2. Click Settings > All Settings in the menu bar.
3. In the Thresholds & Polling grouping, select Polling Settings.
4. Scroll down to Calculations & Thresholds, and enter a higher value for Node Warning Level.
The default Node Warning Level interval is 120 seconds.
5. Click Submit.
Delete polling engines
If there are polling engines in your SolarWinds environment that have no assigned monitored objects, you can delete them from the Polling Engine details view.
n This method for deleting polling engines from your SolarWinds environment is only available for polling engines that no longer have objects assigned for monitoring.
n If you want to delete an existing polling engine to which monitored objects are currently assigned, use Node Management to reassign monitored objects to other polling engines, and delete the polling engine as indicated in this procedure.
1. Log in to the Orion Web Console as an administrator.
2. Click Settings > All Settings in the menu bar.
3. Click Polling Engines in the Details group.
4. Verify that the Elements listing for the polling engine you want to delete reports "0 elements assigned," and click Delete unused polling engine.
5. Click Yes, delete to confirm the deletion.
ThresholdsMany Orion Web Console resources can display error and warning states when a monitored value on a device exceeds a threshold. Orion Platform products come with predefined static thresholds for monitored statistics, but you can override these and customize them for each object.
You can use thresholds to define trigger conditions for alerts.
159

Orion Platform products provide two threshold levels: critical and warning. A value that crosses a warning threshold appears yellow, and a critical threshold appears red.
If you want to change the predefined value for a threshold, use a static threshold or a dynamic baseline threshold.
n A Static threshold is a constant value that you set for a threshold. For example, the warning threshold for response time might be 500 ms, and the critical value might be 1000 ms. You should be familiar with the performance of that object to know what a reasonable value for a static threshold is.
n A Dynamic baseline threshold uses deviations. Data for a statistic are collected for a week, and then used to calculate the mean and standard deviation. The warning and critical threshold values are defined as 2 and 3 standard deviations above the mean, respectively. For example, if the mean value for packet loss for a specific node is 0%, the warning threshold for packet loss would be 3% (+2 standard deviations) and the critical threshold would be 4% (+3 standard deviations). Dynamic baseline thresholds are the most accurate way to define thresholds for a specific device.
Baselines are calculated once, after data has been collected for a week. You can recalculate baselines on demand.
Set general thresholds
Orion general thresholds are used for nodes and volumes in all Orion Platform products.
Thresholds set on specific objects are not affected by changes made to general thresholds.
1. Click Settings > All Settings in the menu bar.
2. In the Thresholds and Polling grouping, click Orion Thresholds.
3. Enter values for Critical Level or Warning Level for selected thresholds.
4. Click Submit.
Monitored thresholds are changed on a global level.
To access thresholds for virtual objects, go to Settings, and click Virtualization Thresholds in the Thresholds & Polling grouping.
160

Customize thresholds for single objects
Get notified when polled values on critical devices reach different values than on other objects. For example, set warning and critical thresholds for CPU load on critical devices to a lower percentage than the default settings.
1. Click Settings > All Settings in the menu bar.
2. In the Node & Group Management grouping, click Manage Nodes.
3. Find the node or interface for which you want to set custom thresholds.
4. Select the object, and click Edit Properties.
5. Scroll down to Alerting Thresholds, select the Override Orion General Thresholds check box by the metric, and provide values for Warning and Critical thresholds.
If you want to use dynamic thresholds, click Use Dynamic Baseline Thresholds. The integer values will be replaced with macros for dynamic thresholds (${USE_BASELINE_WARNING}, ${USE_BASELINE_CRITICAL}).
When the polled values for the selected metric cross the thresholds on the object, the object will be highlighted, and appropriate alerts triggered.
To customize thresholds for virtual objects, go to Settings, and click Manage Virtual Devices in the Node & Group Management grouping. Select a VMware object, click Edit Thresholds, and change the thresholds.
Baselines and baseline calculations
With baselines, you can define what is normal for individual monitored objects based on polled data. By default, the baseline calculator uses the last seven days of collected statistic values to determine what is normal for individual monitored objects. The baseline is calculated using mean and standard deviation.
You can use baselines to detect deviations from the average polled values and be alerted on the deviations. Baselines can be displayed on some charts in the Orion Web Console.
What data is subject to statistical baseline calculation?
NODES INTERFACES VOLUMES
CPU Load Received (Incoming) Errors & Discards Percent Disk Usage
Percent Memory Used Transmitted (Outgoing) Errors & Discards
Response Time Received (Incoming) Percent Utilization
Percent Loss Transmitted (Outgoing) Percent Utilization
Use mean and standard deviations as thresholds
To get notified when polled values for a node or interface are outside the range specified by mean and standard deviations, set dynamic baseline thresholds.
161

If you have a contextual understanding of the metric you are monitoring, consider defining the thresholds manually. Baselines are calculated values and do not know what is crucial for your environment.
1. Click Settings > Manage Nodes.
2. Locate and select the node or interface, and click Edit Properties.
3. Scroll down to Alerting Thresholds, select Override Orion General Thresholds, click Use Dynamic Baseline Thresholds.
Before you use calculated deviations as thresholds, click Latest Baseline Details to review the latest baseline statistics.
Mean and standard deviations will now be used as alerting thresholds for the node or interface.
Customize how the baseline is calculated
A baseline is a period when things are operating normally in your environment. Any anomalies that occur during the baseline period will be calculated into the results and skew the recommended values. If you are aware of an anomaly, re-baseline to ensure that the recommended values are accurate.
Consider customizing baselines if significant changes happen that influence what is normal in your environment, such as merging a new company, onboarding a large number of users, or making substantive improvements to the infrastructure.
By default, baseline calculations are based on data collected during seven days. Node baseline calculations are performed daily, and interface baseline calculations are performed weekly on Sunday.
1. Log in to the Orion Web Console using an account with administrative privileges.
2. Click Settings > All Settings in the menu bar.
3. In Thresholds & Polling, click Polling Settings.
4. Scroll down to Database Settings, and adjust the number of days in the Baseline Data Collection Duration field so that the time does not include a known deviation from the normal status.
The Baseline Data Collection Duration cannot exceed the Detailed Statistics Retention configured in the same section.
5. To change the frequency of calculating interface baselines, choose the Interface Baseline Calculation Frequency.
You can customize the calculation frequency only for interface baselines. The number of monitored interfaces is usually much larger than the number of nodes. Calculating baselines for nodes usually does not affect performance as much as performing the same calculations for all monitored interfaces.
6. Click Submit.
Your settings will now be used for calculating baselines.
162

General threshold types
Avg CPU Load
Monitored network devices experiencing CPU loads higher than the value set for the Critical Level display in High CPU Load reports and resources. Gauges for these devices also display as bold red.
Monitored network devices experiencing a CPU load higher than the value set for the Warning Level, but lower than the value set for the Critical Level, display as red in High CPU Load reports and resources. Gauges for these devices also display as red.
You can choose to calculate exhaustion using average daily values or peak daily values.
Disk Usage
Monitored network devices experiencing a disk usage higher than the value set for the Critical Level display as bold red in High Disk Usage reports and resources.
Monitored network devices experiencing a disk usage higher than the value set for the Warning Level, but lower than the value set for the Critical Level, display as red in High Disk Usage reports and resources.
You can choose to calculate exhaustion using average daily values or peak daily values.
Percent Memory Used
Monitored network devices experiencing a percent memory usage higher than the value set for the Critical Level display in High Percent Utilization reports and resources. Gauges for these devices also display as bold red.
Monitored network devices experiencing a percent memory usage higher than the value set for the Warning Level, but lower than the value set for the Critical Level, display in High Percent Utilization reports and resources. Gauges for these devices also display as red.
You can choose to calculate exhaustion using average daily values or peak daily values.
Percent Packet Loss
Monitored network devices experiencing a percent packet loss higher than the value set for the Critical Level display in High Percent Loss reports and resources. Gauges for these devices also display as bold red.
Monitored network devices experiencing a percent packet loss higher than the value set for the Warning Level, but lower than the value set for the Critical Level, display in High Percent Loss reports and resources. Gauges for these devices also display as red.
Orion Platform products calculate percent packet loss using ICMP ping requests made on the Default Poll Interval. The poller sends a ping to monitored devices and records the results of the ten most recent ping attempts. Percent packet loss is expressed as the number of failed ping requests, X, divided by the number of ping requests, 10.
163
For example, if, at a given point in time, the last ten ping requests made of a selected device resulted in 2 failures and 8 successes, the percent packet loss for the selected device at the given time is reported as 2/10, or 20%.
Response Time
Monitored devices experiencing response times longer than the value set for the Critical Level display in High Response Time reports and resources. Gauges for these devices also display as bold red.
Devices experiencing response times longer than the value set for the Warning Level, but shorter than the value set for the Critical Level, also display in High Response Time reports and resources. Gauges for these devices also display as red.
Orion Platform products calculate response time using ICMP ping requests made on the Default Node Poll Interval. The poller sends a ping to monitored devices and records the results of the ten most recent ping attempts. Average Response Time is expressed as the average response time of these last 10 ping requests. If the poller does not receive a ping response within the Default Poll Interval, it will attempt to ping the non-responsive device once every 10 seconds for the period designated as the Warning Interval.
Manage Orion Web Console user accountsUsers need an Orion Web Console account to perform actions in your SolarWinds product, such as acknowledging alerts. Default account views and privileges are assigned in the account manager.
You may not need to grant all users accounts if they only need to review reports or access views. See Share views with non-Orion Web Console users for more information.
Add users individually, add group accounts, or use Active Directory accounts. If a user is in multiple group accounts, the permissions of the group highest on the Groups tab of the Account Manager are applied to the user. By default SolarWinds uses MSAPI to authenticate Active Directory users, but you can authenticate users with LDAP.
To prevent issues with accounts, make sure that your SQL Server does not have the no count connection option enabled.
Create users
Check out this video on account permissions and limitations.
Before you begin, consider what tasks the user must perform, and what views and menu bars are most suitable.
Users created using default settings can log in to the Orion Web Console and see information available in views, resources, and reports. For administration and customization tasks, users need extra rights.
164

1. Log in to the Orion Web Console, and click Settings > All Settings.
2. Click Manage Accounts in the User Accounts grouping, and click Add New Account on the Individual Accounts tab.
3. Select Orion individual account, and click Next.
4. Provide the account credentials, and click Next.
5. On Define Settings, provide rights so that the user can perform assigned tasks, select default views and menu bars, and then click Submit.
The user account is listed in the Individual Accounts tab.
Create users based on existing Active Directory or local domain accounts
Users can use their existing Active Directory credentials to log in to the Orion Web Console, so you do not need to manage an extra user account.
n You must enable Windows Account Login in the Orion Web Console. 1. Click Settings > All Settings, and in Product Specific Settings, click Web Console Settings.
2. In Windows Account Login, select Enable automatic login, and click Submit.
n To maintain administrative privileges, individual and group Windows user accounts must be defined in the same domain as the SolarWinds server they can access.
n Only Security AD groups are supported. Distribution Groups are not supported.
1. Log in to Orion Web Console, and click Settings > All Settings.
2. Click Manage Accounts in the User Accounts grouping, and click Add New Account.
165
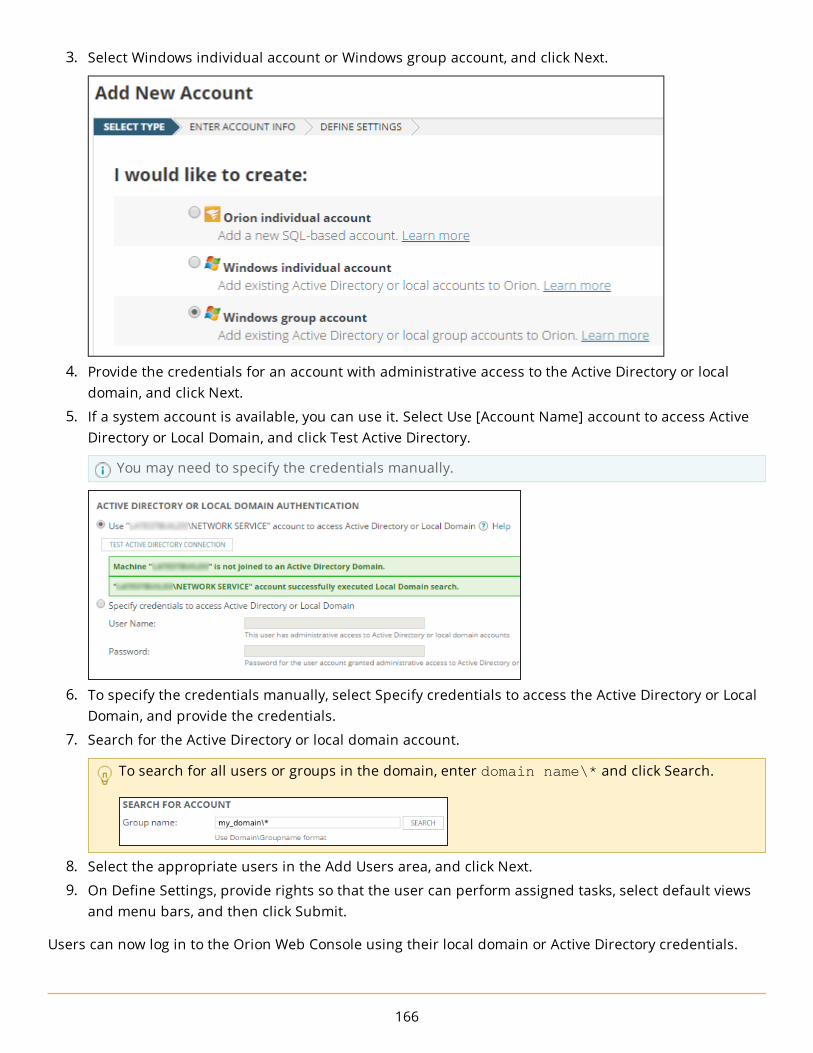
3. Select Windows individual account or Windows group account, and click Next.
4. Provide the credentials for an account with administrative access to the Active Directory or local domain, and click Next.
5. If a system account is available, you can use it. Select Use [Account Name] account to access Active Directory or Local Domain, and click Test Active Directory.
You may need to specify the credentials manually.
6. To specify the credentials manually, select Specify credentials to access the Active Directory or Local Domain, and provide the credentials.
7. Search for the Active Directory or local domain account.
To search for all users or groups in the domain, enter domain name\* and click Search.
8. Select the appropriate users in the Add Users area, and click Next.
9. On Define Settings, provide rights so that the user can perform assigned tasks, select default views and menu bars, and then click Submit.
Users can now log in to the Orion Web Console using their local domain or Active Directory credentials.
166

If you use Active Directory, users can also automatically login with their Windows credentials.
Change account passwords
When you log in to the Orion Web Console for the first time, SolarWinds recommends that you change the password for the Admin account.
Only users with administrator rights can change the password.
1. Log in to the Orion Web Console, and click Settings > All Settings.
2. Click Manage Accounts in the User Accounts grouping.
3. Select a user, and click Change Password.
4. Enter and confirm the new password, and click Change Password.
Enable users to authenticate through LDAP
You can choose to have all of your AD users authenticate through LDAP. The SolarWinds Orion server does not need to be added to the Windows domain with this authentication method.
We do not support Anonymous authentication through LDAP.
1. Log in to the Orion Web Console as an administrator.
2. Click Settings > All Settings in the menu bar.
3. Click Advanced AD Settings in the User Accounts grouping.
4. Toggle Authenticate Active Directory Users via LDAP.
5. Enter your LDAP server information and select the authentication method that matches what is used in LDAP.
Click Discover DN to fill in the distinguished name (DN) of the AD domain automatically. If the DN field does not populate, verify that the Directory Server Address is correct.
Windows individual accounts now use LDAP. If you created Orion Web Console accounts that use Active Directory or local accounts and those accounts cannot authenticate through LDAP, those accounts cannot login.
If you disable this selection, Windows users or group members created while it was enabled cannot login.
167

Define what users can access and do
Each user or group account can have different privileges applied to it, such as the ability to modify alert definitions or delete nodes.
1. Log in to the Orion Web Console as an administrator.
2. Click Settings > All Settings in the menu bar.
3. Click Manage Accounts in the User Accounts grouping.
4. Select an account, and click Edit.
5. Specify the login options.
LOGIN OPTION SETTING
Should the user be able to log in immediately?
Set Account Enabled to Yes.Disabling an account does not delete it. Account definitions and details are stored in the SolarWinds Orion database and can be enabled later.
Should the user be able to log in only temporarily?
Specify the expiration date.
Should the user be logged in indefinitely even if the browser is closed?
Select Yes for the Disable Session Timeout option. Session timeouts are global and set in Web Console Settings.By default, new user accounts are configured to timeout automatically.
168
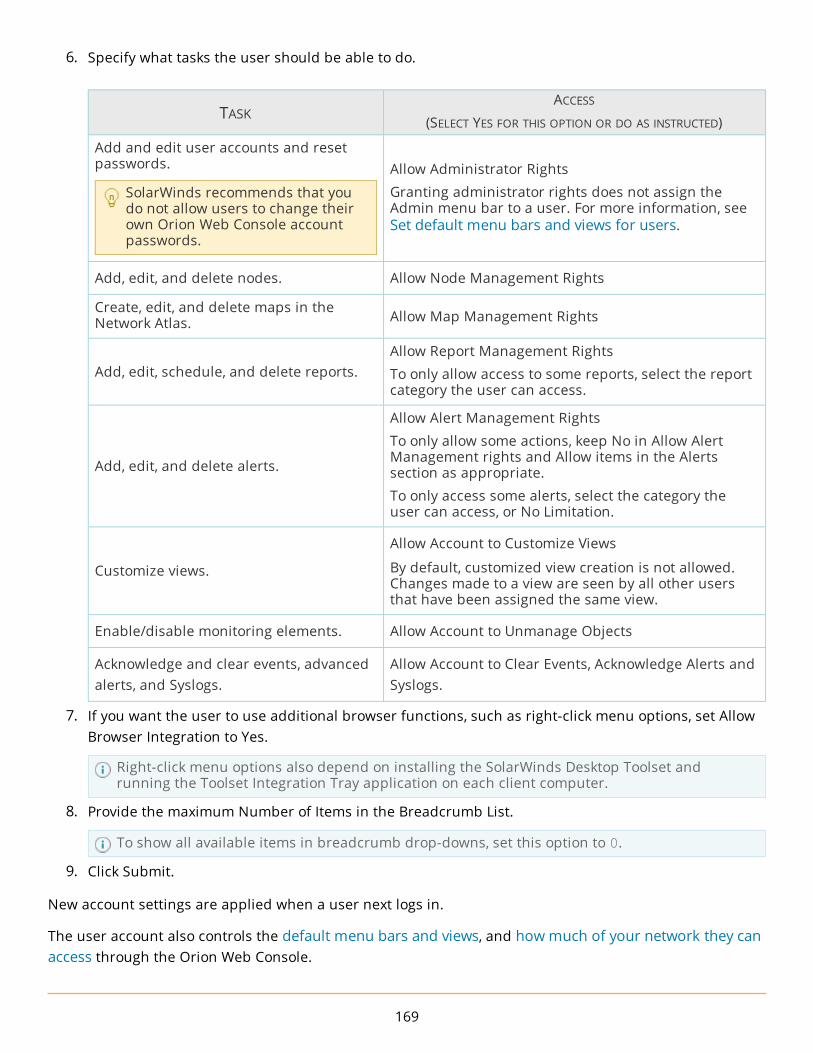
6. Specify what tasks the user should be able to do.
TASKACCESS
(SELECT YES FOR THIS OPTION OR DO AS INSTRUCTED)
Add and edit user accounts and reset passwords.
SolarWinds recommends that you do not allow users to change their own Orion Web Console account passwords.
Allow Administrator RightsGranting administrator rights does not assign the Admin menu bar to a user. For more information, see Set default menu bars and views for users.
Add, edit, and delete nodes. Allow Node Management Rights
Create, edit, and delete maps in the Network Atlas. Allow Map Management Rights
Add, edit, schedule, and delete reports. Allow Report Management RightsTo only allow access to some reports, select the report category the user can access.
Add, edit, and delete alerts.
Allow Alert Management RightsTo only allow some actions, keep No in Allow Alert Management rights and Allow items in the Alerts section as appropriate.To only access some alerts, select the category the user can access, or No Limitation.
Customize views.
Allow Account to Customize Views
By default, customized view creation is not allowed. Changes made to a view are seen by all other users that have been assigned the same view.
Enable/disable monitoring elements. Allow Account to Unmanage Objects
Acknowledge and clear events, advanced alerts, and Syslogs.
Allow Account to Clear Events, Acknowledge Alerts and Syslogs.
7. If you want the user to use additional browser functions, such as right-click menu options, set Allow Browser Integration to Yes.
Right-click menu options also depend on installing the SolarWinds Desktop Toolset and running the Toolset Integration Tray application on each client computer.
8. Provide the maximum Number of Items in the Breadcrumb List.
To show all available items in breadcrumb drop-downs, set this option to 0.
9. Click Submit.
New account settings are applied when a user next logs in.
The user account also controls the default menu bars and views, and how much of your network they can access through the Orion Web Console.
169

Restrict user access to network areas by applying limitations
Account limitations restrict user access to specific network areas or withhold certain types of information from designated users.
To limit user access, apply a limitation on the user account, and specify the network area the user can access. Depending on the limitation, you can use logical operators and wildcards.
Pattern limitations can have a negative impact on performance and are error prone.
If the default limitations are not enough, you can create limitations based on custom properties, and apply them on user accounts.
n Group limitations are not applied until after the group availability is calculated.
n Because SolarWinds NetFlow Traffic Analyzer (NTA) initially caches account limitations, it may take up to a minute for account limitations to take effect in SolarWinds NTA.
1. Log in to the Orion Web Console as an administrator.
2. Click Settings > All Settings in the menu bar.
3. In the User Accounts grouping, click Manage Accounts.
4. Edit an individual or group account. a. Click Add Limitation in the Account Limitations section. b. Select the type of limitation to apply, and click Continue. c. Define the limitation, and click Submit.
The limitation will be added to the Edit Account page.
5. Click Submit.
When the user logs back in, the account respects the limitations applied to it.
Create limitations based on custom properties
You can define the part of a monitored network that users can access based on custom properties, and create custom limitations. Custom limitations are added to the list of available limitation types that you can apply on individual user accounts. After you create the limitation, you must edit accounts to use the limitation, and then select how the account is restricted.
n Before you start, plan how you want to limit the user access, and create custom properties.
n This procedure requires access to the computer that hosts the SolarWinds Orion server.
1. Click Start > All Programs > SolarWinds Orion > Grouping and Access Control > Account Limitation Builder.
2. Click Start on the splash screen.
3. Click Add Limitation.
4. Select a Custom Property. The fields are populated automatically based on your selection.
170
5. Choose a Selection Method.
This is the selection format that will appear when you are choosing values for the account limitation in the Orion Web Console.
Pattern matching is the most powerful selection, but it is also the selection most prone to errors when restricting access and impacts performance.
6. Click OK.
Your account limitation is added to the top of the table view. You may now apply the limitation on user accounts to restrict user access to monitored objects in the Orion Web Console.
Delete account limitations
Deleting a limitation makes it unavailable for future use in the Orion Web Console. If the limitation is applied to user accounts, the accounts will remain limited.
This procedure requires access to the computer that hosts the SolarWinds Orion server.
1. Start the Account Limitation Builder in the SolarWinds Orion > Grouping and Access Control program folder.
2. Click Start on the splash screen.
3. Click the row of the limitation that you want to delete.
Use <Shift+Click> to highlight multiple consecutive rows or <Ctrl+Click> to highlight multiple non-consecutive rows.
4. Click Edit > Delete Selected Limitations.
The limitation is now unavailable for limiting user accounts in the Orion Web Console.
Patterns for limitations
When restricting user access to network areas, you can specify the limitation with patterns using OR, AND, EXCEPT, and NOT operators with _ and * as wildcards if the limitation allows pattern matching.
Patterns are not case sensitive.
You may also group operators using parentheses, as in the following example.
(*foo* EXCEPT *b*) AND (*all* OR *sea*) matches seafood and footfall, but not football or Bigfoot.
Set default menu bars and views for users
The items users see in My Dashboards and in Alerts & Activity are specified in their user accounts.
Improve performance by setting the Home Page View to a view with a limited number of resources on it.
171

1. Click Settings > All Settings in the menu bar.
2. In the User Accounts grouping, click Manage Accounts.
3. Select a user, and click Edit.
4. Scroll down to Default Menu Bars and Views, and select top menu bars from the lists.
5. Select Yes for the items the user will see in the Alerts & Activity menu bar.
6. Select an item and use the arrows to change the order of menu bars. Select an item from the list to specify the default Home page view.
7. Click Submit.
The user can now use the specified links in My Dashboards and Alerts & Activity menu bars.
New account settings are applied when a user next logs in.
You can set default view for feature-specific views, such as hardware health or F5, or for product-specific view, such as VSAN or Application Details.
Limit users to specific network areas
Account limitations ensure that Orion Web Console users only view the network objects that are relevant to their job duties.
172
You can use account limitations in the following ways:
n Limit customer views to specific network nodes
n Limit views by department or functional area
n Limit views by device type or device role
n Limit views based on the geographic location of devices
Predefined account limitations use built-in SolarWinds Orion properties to limit user access. For greater flexibility, you can create your own account limitations in the Account Limitation Builder, based on custom properties.
Configure automatic login
You can log in automatically to the Orion Web Console using any of the following methods.
Use a Windows Active Directory Account
Create users based on active directory or local domain accounts, and enable automatic login for users logged in to the server. See Create users based on existing Active Directory or local domain accounts.
Windows authentication must be enabled in the Configuration Wizard and the Web Console Settings. See Enable Windows Authentication with Active Directory.
Automatically log in with Windows Pass-through Security
Users can be authenticated through Windows Security, with no need to log in with separate credentials. For more information, see Log in with Windows pass-through security.
Share content to non-SolarWinds users with the DirectLink account
If the DirectLink account is active, any URL referring directly to an Orion Web Console page will bypass the login page by logging the user into the DirectLink account. See Share views with non-Orion Web Console users.
Pass-through user credentials in a URL
See Automatically login by passing your credentials through the URL.
Users are authenticated in the following priority:
1. Windows Active Directory Authentication when enabled
2. The Account or User ID and Password passed on the URL
3. The Account or User ID and Password entered on the login.aspx page
4. The Windows User if Pass-through Security is enabled
5. The Windows Domain to which the User belongs, for example, Development\Everyone
6. A DirectLink Account
173

Enable Windows Authentication with Active Directory
The Orion Web Console can authenticate Active Directory users and users who are members of Active Directory security groups by using MSAPI or LDAP. By default, Windows individual or group accounts use MSAPI to authenticate accounts.
You can only use one authentication protocol at a time. All Windows accounts are authenticated through MSAPI or LDAP, depending on which one is enabled.
SolarWinds offers a free analyzer tool for Active Directory that provides instantaneous visibility into effective permissions and access rights. The tool provides a complete hierarchical view of the effective permissions access rights for a specific file folder (NTSF) or share drive. Download it for free from here: http://www.solarwinds.com/products/freetools/permissions_analyzer_for_active_directory/.
Authenticate users through MSAPI
1. Enable the Orion Web Console to use automatic Windows Authentication. a. Start the Configuration Wizard in the SolarWinds Orion > Configuration and Auto-Discovery
program folder. b. Select Website, and click Next. c. Provide the appropriate IP Address, Port, and Website Root Directory, and select Yes - Enable
Automatic Login Using Windows Authentication. d. Click Next, and complete the Configuration Wizard.
2. Log in to the Orion Web Console using the appropriate domain and user, providing Domain\User name or Username@Domain as the User Name.
3. Run the Configuration Wizard and enable Windows authentication.
4. Login to the Orion Web Console, and navigate to Settings > All Settings. In Web Console Settings, select Enable automatic login in the Windows Account Login drop-down.
Supported Active Directory scenarios
The following Active Directory login scenarios are supported for SolarWinds products using the latest version of the Orion Platform.
SCENARIOWEB CONSOLE
LOGIN SUPPORTED?LOCAL LOGIN REQUIRED?
NETWORK ATLAS AND UNMANAGE
UTILITY LOGIN SUPPORTED?
Login with "Orion Server" domain AD account
Yes
No
LogonFallback must be enabled.
YesLogin with "Orion Server" domain Group AD account
174
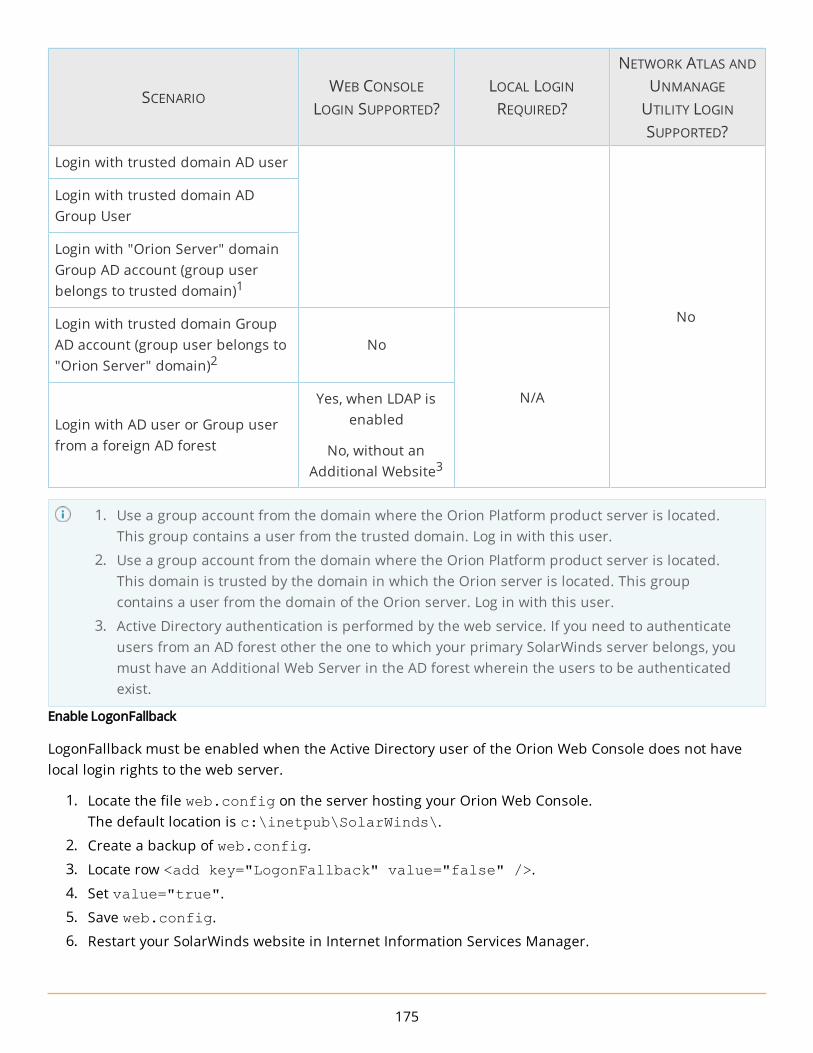
SCENARIOWEB CONSOLE
LOGIN SUPPORTED?LOCAL LOGIN REQUIRED?
NETWORK ATLAS AND UNMANAGE
UTILITY LOGIN SUPPORTED?
Login with trusted domain AD user
No
Login with trusted domain AD Group User
Login with "Orion Server" domain Group AD account (group user belongs to trusted domain)1
Login with trusted domain Group AD account (group user belongs to "Orion Server" domain)2
No
N/A
Login with AD user or Group user from a foreign AD forest
Yes, when LDAP is enabled
No, without an Additional Website3
1. Use a group account from the domain where the Orion Platform product server is located. This group contains a user from the trusted domain. Log in with this user.
2. Use a group account from the domain where the Orion Platform product server is located. This domain is trusted by the domain in which the Orion server is located. This group contains a user from the domain of the Orion server. Log in with this user.
3. Active Directory authentication is performed by the web service. If you need to authenticate users from an AD forest other the one to which your primary SolarWinds server belongs, you must have an Additional Web Server in the AD forest wherein the users to be authenticated exist.
Enable LogonFallback
LogonFallback must be enabled when the Active Directory user of the Orion Web Console does not have local login rights to the web server.
1. Locate the file web.config on the server hosting your Orion Web Console.The default location is c:\inetpub\SolarWinds\.
2. Create a backup of web.config.
3. Locate row <add key="LogonFallback" value="false" />.
4. Set value="true".
5. Save web.config.
6. Restart your SolarWinds website in Internet Information Services Manager.
175
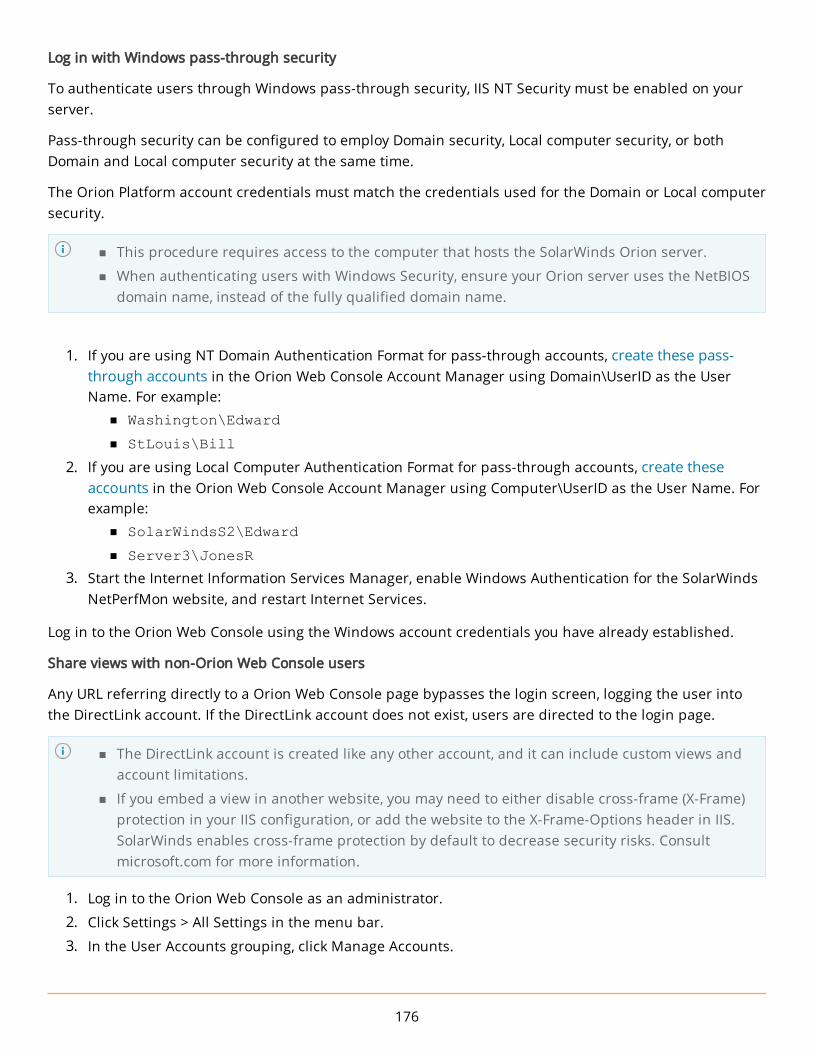
Log in with Windows pass-through security
To authenticate users through Windows pass-through security, IIS NT Security must be enabled on your server.
Pass-through security can be configured to employ Domain security, Local computer security, or both Domain and Local computer security at the same time.
The Orion Platform account credentials must match the credentials used for the Domain or Local computer security.
n This procedure requires access to the computer that hosts the SolarWinds Orion server.
n When authenticating users with Windows Security, ensure your Orion server uses the NetBIOS domain name, instead of the fully qualified domain name.
1. If you are using NT Domain Authentication Format for pass-through accounts, create these pass-through accounts in the Orion Web Console Account Manager using Domain\UserID as the User Name. For example:
n Washington\Edward
n StLouis\Bill
2. If you are using Local Computer Authentication Format for pass-through accounts, create these accounts in the Orion Web Console Account Manager using Computer\UserID as the User Name. For example:
n SolarWindsS2\Edward
n Server3\JonesR
3. Start the Internet Information Services Manager, enable Windows Authentication for the SolarWinds NetPerfMon website, and restart Internet Services.
Log in to the Orion Web Console using the Windows account credentials you have already established.
Share views with non-Orion Web Console users
Any URL referring directly to a Orion Web Console page bypasses the login screen, logging the user into the DirectLink account. If the DirectLink account does not exist, users are directed to the login page.
n The DirectLink account is created like any other account, and it can include custom views and account limitations.
n If you embed a view in another website, you may need to either disable cross-frame (X-Frame) protection in your IIS configuration, or add the website to the X-Frame-Options header in IIS. SolarWinds enables cross-frame protection by default to decrease security risks. Consult microsoft.com for more information.
1. Log in to the Orion Web Console as an administrator.
2. Click Settings > All Settings in the menu bar.
3. In the User Accounts grouping, click Manage Accounts.
176

4. Click Add New Account.
5. Type DirectLink as the User Name.
6. Type a Password, confirm it, and click Next.
7. Edit DirectLink account options. See Define what users can access and do. 8. Click Submit.
Users can now look at views without an account on the Orion Web Console.
Automatically login by passing your credentials through the URL
Create a favorite or bookmark that includes your Orion individual account user name and password as parameters within the URL.
HTTP requests are not encrypted, so account information sent in HTTP requests are not secure. For more information about enabling HTTPS on your Orion Platform product server, consult www.microsoft.com.
Create a favorite with a link in the following form to pass the login information:
http://DOMAIN/Orion/Login.aspx?AccountID=USER&Password=PASSWORD
Provide the hostname or IP address of your SolarWinds Orion server as the DOMAIN. Provide your Orion user name as the USER, and then provide your Orion user account password as the PASSWORD.
Administrative functions of the Orion Web ConsoleThe following sections describe the primary administrative functions performed by an Orion Web Console administrator.
Orion Web Console administration
Users with Administrator rights can click Settings > All Settings to access the Main Settings and Administration page. The page presents a variety of tools to control the appearance and delivery of information to Orion Web Console users.
As more Orion Platform products are added, additional options will be displayed.
Getting Started
Before you can start monitoring your network, you must designate the network objects you want to monitor. This grouping provides direct links to discovery-related views so you can quickly and easily start monitoring your network:
n Discovery Central provides a centralized overview of the types and number of network objects you are monitoring with your Orion installation.
n Network Sonar Discovery starts the Network Sonar Discovery Wizard that automatically discovers
177

devices across your entire network for monitoring.
n Add a Node opens the Add Node Wizard. See Add a single node for monitoring.
Node & Group Management
n Manage Nodes displays the Node Management page, where an Orion Web Console administrator can immediately add, view, and manage all network objects currently managed or monitored by your Orion Platform products.
n Manage Virtual Devices opens the Virtualization Polling Settings view where you can view both a list of currently monitored Hyper-V or VMware ESX Servers and a library of the VMware credentials used to monitor your ESX Servers. For more information, see Monitor virtual infrastructure in the Orion Web Console.
n Manage Dependencies opens the Manage Dependencies view. Dependencies allow you to formalize dependent relationships between monitored objects based on network topology or priority to eliminate the potential for duplicated or redundant polling and alerting.
n Manage Agents allows you to create and manage your alerts. For more information, see Agent management.
n Manage Groups opens the Manage Groups view. To a greater degree than previously available with custom properties, groups enable you to logically organize your monitored network objects. For more information, see Group monitored objects.
n Manage Custom Properties allows you to create and manage custom properties that you can use within your Orion Platform products. For more information, see Custom properties.
n Manage World Map allows you to manage the nodes you want to display in the Worldwide Map resource.
n Manage Pollers allows you to create new pollers or edit existing pollers to fit the needs of your unique devices. You can also import pollers created by your peers from thwack.
n Manage Hardware Sensors allows you to enable or disable monitoring hardware health sensors in the Orion Web Console. For more information, see Monitor hardware health.
Alerts & Reports
n Manage Alerts - create and manage web-based alerts. For more information, see Use alerts to monitor your environment.
n Manage Reports - create and manage web-based reports. For more information, see Create a new web-based report.
n Manage SMTP Servers - add and manage SMTP servers used to send email notifications.
n Configure Default Send Email Action - configure the default SMTP server and email information used with the Send Email alert action.
Product Specific Settings
n Virtualization Settings allow an Orion Web Console administrator to set up Virtualization Manager integration, configure virtualization, and view your License Summary.
178
n Web Console Settings allow an Orion Web Console administrator to customize the function and appearance of both the Orion Web Console and the charts that are displayed as resources in Orion Web Console views. For more information about configuring Orion Web Console and Chart Settings, see Orion Web Console and chart settings.
n Agent Settings allow an Orion Web Console administrator to configure settings relevant for your agents. For more information, see Agent settings.
n Proxy Settings allow an Orion Web Console administrator to configure a proxy server through which Orion can connect to thwack and check for maintenance updates if Orion does not have internet access. For more information, see Configure web proxy settings.
Thresholds & Polling
n Polling Settings define the configuration of polling intervals, timeouts, statistics calculations, and database retention settings for your Orion polling engine. For more information about configuring Orion Polling Settings, see Update polling settings.
n Virtualization Thresholds allows you to set warning and critical thresholds specific for the Virtualization module.
n Custom Poller Thresholds allow you to set warning and critical threshold levels for your custom pollers.
n NPM Thresholds allow you to set warning and critical thresholds specific for the Network Performance Monitor.
n Orion Thresholds allow you to configure warning and critical thresholds for nodes and volumes. These thresholds are used in all Orion modules.
For more information about custom poller, NPM, or Orion thresholds, see Thresholds.
Windows Credentials
Use the Manage Windows Credentials page to create and manage credentials you use to connect to Windows computers on your network.
User Accounts
n Manage Accounts allows you to manage user accounts, and specify management rights and limitations.
n Accounts List provides a table of existing accounts and appropriate details, such as assigned rights or the last login.
Views
n The Manage Views page enables administrators to add, edit, copy, or remove Orion Web Console views. See Create, delete, modify, or restrict views.
n The Add New View page enables you to define new Orion Web Console views.
n The Created NOC Views provides the list of current Network Operations Center page, and enables you to add new NOC views.
n The Views by Device Type page allows administrators to designate default views for network devices. See Specify views for device types.
179

Customize Navigation & Look
n Customize Menu Bars allows Orion Web Console administrators to configure the menu bars seen by individual users. See My Dashboards.
n Color Scheme allows administrators to select a default color scheme for resource title bars. The color scheme selection takes effect immediately throughout the web console. See Change the Orion Web Console color scheme.
n External Websites allows Orion Web Console administrators to designate any external website as an Orion Web Console view, appearing in the Views toolbar. See Add external website views.
Details
Database Details
This is an information-only page that displays details about the SQL Server database currently used by your SolarWinds Orion installation, such as the version and configuration settings for both your SolarWinds Orion server and your database server, and the total number of monitored objects in the SolarWinds Orion database.
Polling Engines
This page shows the status and selected configuration information for each currently operational polling engine.
Orion Platform Details
This is an information-only page that displays details about your installation of the common components and resources that all Orion Platform products share, including information about your SolarWinds Orion server, monitored object counts, and the version numbers of the executables and DLLs required by any and all installed Orion Platform products.
License Details
This is an information-only page that displays details about all Orion products that you currently have installed. This page also shows the version numbers of the Orion products you are running and the versions of associated DLLs.
View secure data
Sensitive network information, such as community strings, logins, and passwords, is not viewable in the Orion Web Console by default.
If you have secured your network, you can display secure data in the Orion Web Console.
1. Click Settings > All Settings in the menu bar.
2. In the Thresholds & Polling grouping, click Polling Settings.
3. Scroll down to the Calculations & Thresholds area, and select Allow Secure Data On Web (Advanced).
This setting does not affect the display of custom reports that you export to the web.
180

Handle counter rollovers
Specify a method that decides what happens if a polled value is less than the previous polled value.
Orion Platform products are capable of handling either 32-bit or 64-bit counters.
By default, counters are assumed to be 32-bit.
32-bit counters have a maximum value of 232, or 4,294,967,296.
64-bit counters have a maximum value of 264, or 18,446,744,073,709,551,616.
1. Log in to the Orion Web Console as an administrator.
2. Click Settings > All Settings in the menu bar.
3. In the Thresholds & Polling grouping, click Polling Settings.
4. Scroll down to the Calculations & Thresholds area, and select the Counter Rollover method.
n If you use 32-bit counters, select Method 1.This method detects a rollover, and calculates based on it.First, the method checks whether the device rebooted and reset its counters to 0. In this case, the last value is 0. When it is a real rollover, we take the maximum value of the 32 or 64 bit number, take the difference between the maximum and the last polled value, and add it to the current polled value: (MaxValue - LastPolledValue) + CurrentPolledValue
n If you use 64-bit counters, select Method 2. When a rollover is detected, Orion drops the poll and takes a new sample within 20 seconds. The new data point is stored, throwing the first data point away.In memory, we have the value from the previous poll (A) and the LastPolledValue (B). Because B < A, we detect counter rollover. Orion drops the last poll and does a fast poll within 20 seconds. The value stored in the database is calculated as C-B.
Orion fully supports the use of 64-bit counters, but these counters can exhibit erratic behavior in some implementations. If you notice peculiar results, disable the use of 64-bit counters for the problem device, and contact the device manufacturer.
Configure web proxy settings
If your SolarWinds Orion server does not have Internet access, you can use a proxy server to allow the Orion server to connect to certain pages and websites. Use a proxy server to:
n Access the thwack community n Access the product blog
n Check for maintenance updates
n Access the ServiceNow instance you integrated with your SolarWinds Orion server. For information about integrating SolarWinds Orion with ServiceNow, see Integrate an Orion Platform product with ServiceNow.
181

To configure web proxy settings:
1. In the Orion Web Console, click Settings > All Settings > Product specific settings > Proxy Settings.
2. Select Use the following settings, and specify the IP address and port number of the proxy server.
3. If the proxy server requires authentication, select the check box, and specify the user name and password.
4. Enter a URL, and click Test connection to verify that you can reach the destination address through the proxy.
5. Click Save.
Filter nodes in resources using SQL queriesWhen you are managing or monitoring large numbers of network devices, node list resources can easily become very large and difficult to navigate. Filters are optional SQL queries that are used to limit node list displays for easier resource navigation. SQL queries can be made on any predefined or custom properties.
If you have upgraded to Orion Platform version 2015.1.x or later, your custom SQL or SWQL query or filter may no longer work correctly. For a list of database changes from Orion Platform version 2014.2 to version 2016.1, including new tables, column changes, or data constraint or data type changes, see the Database Changes spreadsheet.
1. Click Edit in any node list resource.
2. Provide an appropriate SQL query in the Filter Nodes (SQL) field, and click Submit.
SQL Query Examples
By default, node list resources are designed to sort nodes alphabetically by node caption. This configuration cannot be overwritten using a SQL filter, so order by clauses included in SQL filters are redundant and will result in Custom SQL filter formatting errors.
The following are valid status levels:
n 0 = Unknown (current up/down status of the node is unknown)
n 1 = Up (The node is responding to PINGs)
n 2 = Down (The node is not responding)
n 3 = Warning (The node may be responding, but the connection from the server to the Node is dropping packets)
Custom propertiesEvery object you monitor includes a list of default properties used to describe the devices, such as IP address, host name, or MAC address. You can also create custom properties and use them to create special alerts, reports, views, and groups.
182
Custom properties are user-defined fields, such as country, building, asset tag, or serial number, that you can associate with monitored network objects.
Custom properties must use the Latin1 character set.
Custom property uses include:
l Add information to nodes, such as contact, owner, or support contract.
l Add a custom property that is used as an account limitation on nodes.
l Add a custom property to nodes for grouping on the web or in a report.
l Add a custom property and display it as an annotation on a chart.
A collection of the most commonly used properties is available out-of-the-box, but you can create custom properties to meet your precise requirements.
When a custom property is defined, you can import values for the property from a text- or comma-delimited file.
To apply a property to only a few objects, go to the Edit view in the Orion Web Console.
You may also create external records by exporting custom properties from selected objects as a spreadsheet.
When you create, edit or remove a custom property, an event is logged. These events are audited, and you can display them in Audit Events resources.
Create a custom property
Custom properties help you add custom labels to monitored objects, group objects based on the property or alert on objects with a certain value for the property.
Depending on the selected object type, some options are not available.
1. Click Settings > All Settings in the menu bar.
2. In the Node & Group Management grouping, click Manage Custom Properties.
3. Click Add Custom Property.
4. Select the object type for the property, and click Next.
The available object types depend on the Orion Platform products installed. All installations allow you to create Node and Volume custom properties.
183

5. Define the custom property, and click Next.
Frequently used custom properties are available as templates. Select a template, and adjust the settings if necessary. Templates ensure that naming conventions are met when necessary for certain workflows.
a. Edit the Property Name and Description fields.
Property names are not case-sensitive, and must be unique for each object type. For example, you can have separate Comment properties for Nodes, Volumes, and other object types.
b. Select the Format for the property.
We recommend that you limit the string length for text properties. The string length can affect SQL performance, especially when custom properties are used in limitations. The shorter the string length, the faster the queries.
To limit the string length, click Edit, and provide the maximum number of characters.
c. Create a drop-down menu with specific values for the property by selecting Restrict values, and adding the values.
Restricting values helps to maintain the consistency of values for individual custom properties.
d. If you want to limit how the custom property for nodes should be used, clear boxes in the Usage section.
6. Select objects for which you want to define the custom property. a. Click Select <Objects>, and locate, and select the objects in the Available <Objects> pane. b. Click Add, and then click Select <Objects>.
7. Enter or select a default value for the property.
To add a value for properties with restricted values, select Add New Value from the drop-down menu, and enter the new value.
8. To apply the selected property to a different group of objects, click Add More, select the objects, and click Submit.
184
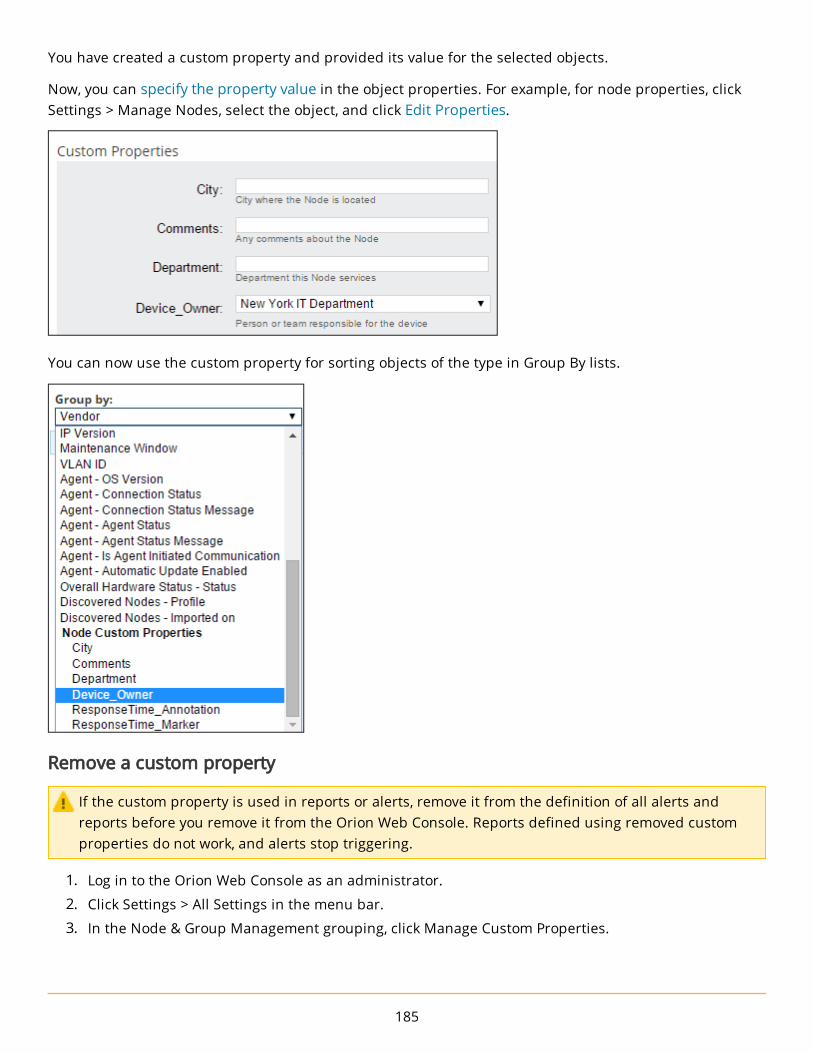
You have created a custom property and provided its value for the selected objects.
Now, you can specify the property value in the object properties. For example, for node properties, click Settings > Manage Nodes, select the object, and click Edit Properties.
You can now use the custom property for sorting objects of the type in Group By lists.
Remove a custom property
If the custom property is used in reports or alerts, remove it from the definition of all alerts and reports before you remove it from the Orion Web Console. Reports defined using removed custom properties do not work, and alerts stop triggering.
1. Log in to the Orion Web Console as an administrator.
2. Click Settings > All Settings in the menu bar.
3. In the Node & Group Management grouping, click Manage Custom Properties.
185

4. Select properties you want to remove, and click Delete.
5. Confirm your action when prompted.
Import custom property values
If you have a spreadsheet listing custom property values, such as asset tags of all your network nodes, you can make this information available for reporting and publication in the Orion Web Console.
Your data must be formatted as a table, and at least one column title should match an existing object property such as IP Address.
1. Log in to the Orion Web Console as an administrator.
2. Click Settings > All Settings in the menu bar.
3. In the Node & Group Management grouping, click Manage Custom Properties.
4. Click Import Values.
5. Browse to the custom property data file, and click Open.
6. Select the object type you want in the Import Values For drop-down, and click Next.
7. For each detected Spreadsheet Column in your data, select the corresponding Orion Database Column, and select the Relationship between the columns.
n Select Matches to indicate columns in the spreadsheet that correspond to existing columns in the SolarWinds Orion database, such as IP Address or MAC address.
n Select Imports To to import the data in the spreadsheet column to the selected SolarWinds Orion database column.
This option overwrites any existing data in the corresponding custom properties.
n Select Imports To, and select <No Match Found, Ignore> for any spreadsheet column you do not want to import.
n Click Create This Custom Property Now to open the Add Custom Property in a new browser tab if you need to create a custom property for this spreadsheet column.
8. Click Import.
When you view the values of the object type, the values of the custom property you selected are populated.
186

Export custom property data
If you want to keep records of custom properties for selected monitored nodes, you can export them as a spreadsheet. For example, you can create a single spreadsheet that lists the asset tags of all your network nodes.
You can only select custom properties for a single object type.
1. Log in to the Orion Web Console as an administrator.
2. Click Settings > All Settings in the menu bar.
3. In the Node & Group Management grouping, click Manage Custom Properties.
4. Select the custom properties you want to export, and click Export Values. You can Filter objects to find the custom properties more easily.
5. To export custom property data for specific objects, click Select <Objects>, and select the objects.
6. Select the database columns you want to export. You can also change which custom properties you want to export.
7. Select the file type for the exported data. This can be .csv, .txt, .html or xls.
8. Click Export.
The exported file is downloaded to your browser's default download location.
Change custom properties values
You can change the value of a custom property from the Manage Custom Properties page or bulk edit the values of a custom property assigned to objects.
You can only edit properties of one object type at a time.
Edit values for custom properties
When you are entering a large amount of data, it can be easier to import the values from a spreadsheet.
1. Log in to the Orion Web Console as an administrator.
2. Click Settings > All Settings in the menu bar.
3. In the Node & Group Management grouping, click Manage Custom Properties.
4. Select the custom properties, and click View / Edit Values. You can filter objects to find the custom properties more easily.
5. To add or change a value for a property, enter the value into the field.
6. To add the same custom property value for multiple objects, select the objects, and click Edit Multiple Values. Select the property, enter the value, and click Save Changes.
7. When you have added or edited the values, click Save Changes.
Filter objects when assigning custom properties
You can limit objects displayed in the Custom Property Editor to find the objects you want to edit.
187
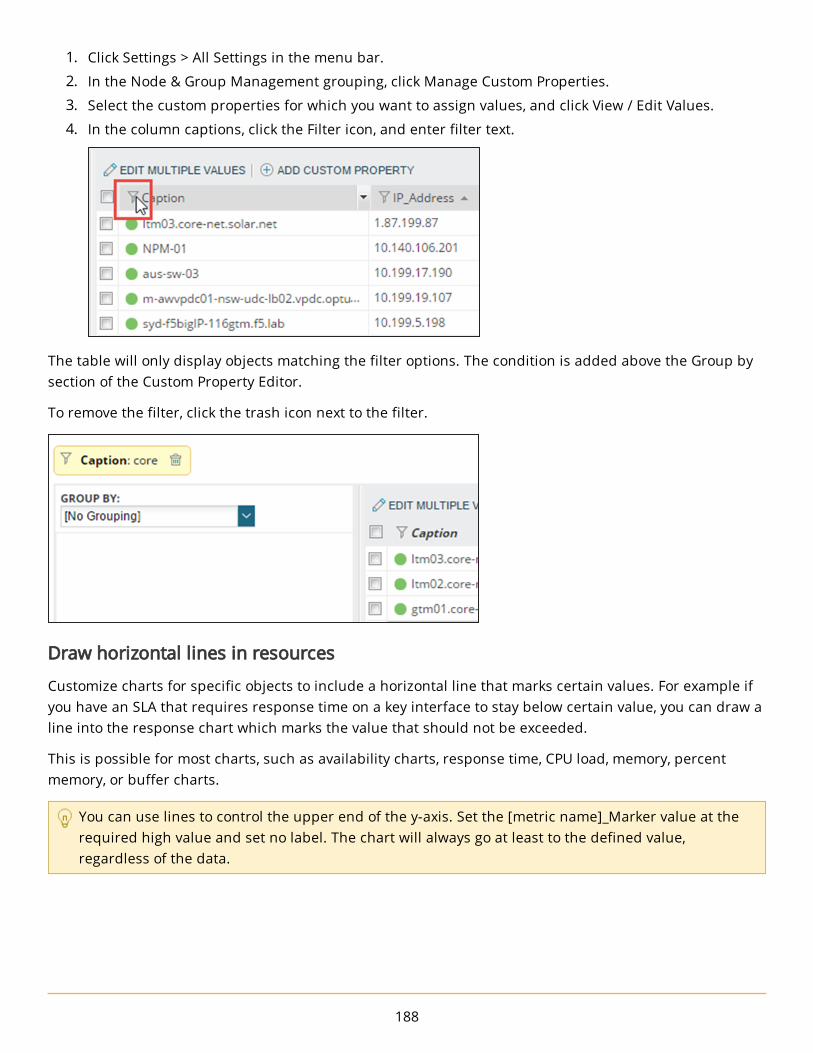
1. Click Settings > All Settings in the menu bar.
2. In the Node & Group Management grouping, click Manage Custom Properties.
3. Select the custom properties for which you want to assign values, and click View / Edit Values.
4. In the column captions, click the Filter icon, and enter filter text.
The table will only display objects matching the filter options. The condition is added above the Group by section of the Custom Property Editor.
To remove the filter, click the trash icon next to the filter.
Draw horizontal lines in resources
Customize charts for specific objects to include a horizontal line that marks certain values. For example if you have an SLA that requires response time on a key interface to stay below certain value, you can draw a line into the response chart which marks the value that should not be exceeded.
This is possible for most charts, such as availability charts, response time, CPU load, memory, percent memory, or buffer charts.
You can use lines to control the upper end of the y-axis. Set the [metric name]_Marker value at the required high value and set no label. The chart will always go at least to the defined value, regardless of the data.
188

1. Create two custom properties for nodes based on property templates: n [metric name]_Marker, for example ResponseTime_Marker, designating the value where the
line will display. n [metric name]_Annotation, for example ResponeTime_Annotation, provide a label for the
line. 2. In Property Templates, select [metric name]_Marker.
3. On Assign Values, select the objects, and provide values for the line.
4. Create the [metric name]_Annotation custom property based on the template, select the objects, and provide the label for the line.
When you now go to the details view for the node and consult the Response time graph, you will see a labeled line signifying the selected value there.
189

Customize the Orion Web Console look, views, settings, charts, and maps
You need the Allow Administrator Rights privilege.
Customize the Orion Web Console lookMy Dashboards
My Dashboards provide menu bars with shortcuts to Orion Web Console views. The default menu bars include Home, and a menu bar for each installed Orion Platform product.
Click My Dashboards to show the default menus.
You can customize views and labels offered in default menus for individual users.
190
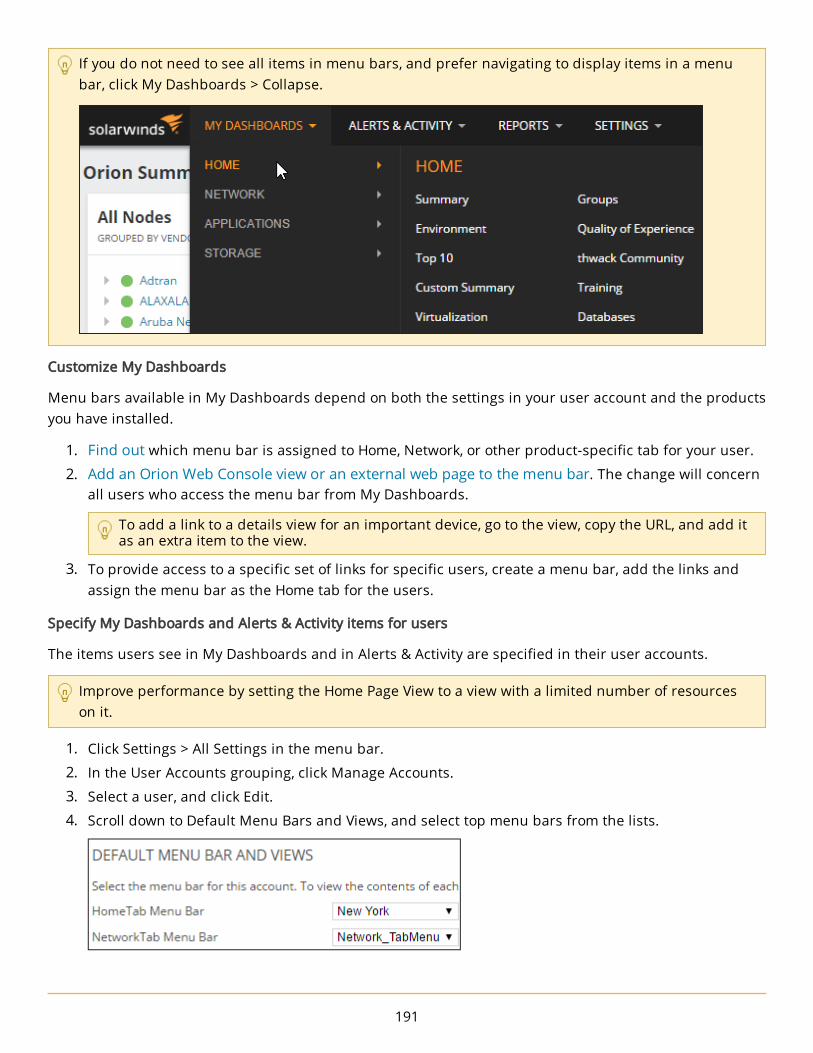
If you do not need to see all items in menu bars, and prefer navigating to display items in a menu bar, click My Dashboards > Collapse.
Customize My Dashboards
Menu bars available in My Dashboards depend on both the settings in your user account and the products you have installed.
1. Find out which menu bar is assigned to Home, Network, or other product-specific tab for your user.
2. Add an Orion Web Console view or an external web page to the menu bar. The change will concern all users who access the menu bar from My Dashboards.
To add a link to a details view for an important device, go to the view, copy the URL, and add it as an extra item to the view.
3. To provide access to a specific set of links for specific users, create a menu bar, add the links and assign the menu bar as the Home tab for the users.
Specify My Dashboards and Alerts & Activity items for users
The items users see in My Dashboards and in Alerts & Activity are specified in their user accounts.
Improve performance by setting the Home Page View to a view with a limited number of resources on it.
1. Click Settings > All Settings in the menu bar.
2. In the User Accounts grouping, click Manage Accounts.
3. Select a user, and click Edit.
4. Scroll down to Default Menu Bars and Views, and select top menu bars from the lists.
191
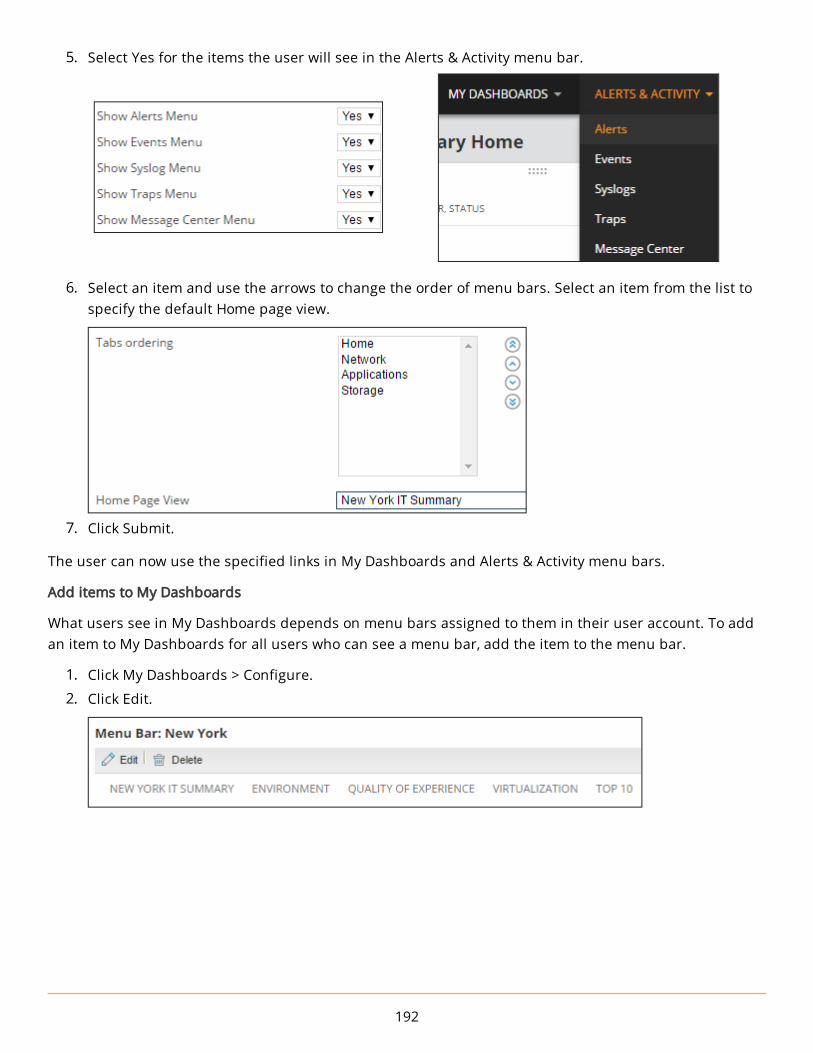
5. Select Yes for the items the user will see in the Alerts & Activity menu bar.
6. Select an item and use the arrows to change the order of menu bars. Select an item from the list to specify the default Home page view.
7. Click Submit.
The user can now use the specified links in My Dashboards and Alerts & Activity menu bars.
Add items to My Dashboards
What users see in My Dashboards depends on menu bars assigned to them in their user account. To add an item to My Dashboards for all users who can see a menu bar, add the item to the menu bar.
1. Click My Dashboards > Configure.
2. Click Edit.
192

3. Drag available items from the left-hand column to Selected Items on the right.
Hover over any view title to read the description.To change the order of menu items, drag and drop items in the Selected column.
4. Click Submit to save your changes.
You can also add links to node details views for specific nodes, or to external Internet pages as a menu item.
a. Click Add below the Available items list, provide a name, URL and description for the menu item, and click add.
b. Drag the new item to the Selected items column.
Users who can see the menu bar in My Dashboards will see the added items.
Add menu bars
When you have a list of items you want users to access from My Dashboards, create a menu bar.
1. Click My Dashboards > Configure.
2. Scroll to the bottom of the page, and click New Menu Bar.
3. Name the menu bar.
193

4. Drag views from the Available items column into Selected items.
5. Click Submit.
The new menu bar is created. You can now assign it to users who will see the items in My Dashboards.
Change the Orion Web Console color scheme
1. Click Settings > All Settings in the menu bar.
2. In the Customize Navigation & Look grouping, click Color Scheme.
3. Select a color scheme, and click Submit.
Change the Orion Web Console logo
1. Create a graphic to replace the SolarWinds logo.
The recommended logo size is 250 x 50 pixels. The maximum allowed size is 900 x 500 pixels.
2. Place your graphic in the images directory.
The default location of the directory is C:\Inetpub\SolarWinds\NetPerfMon\. 3. Click Settings > All Settings in the menu bar.
4. In the Product Specific Settings grouping, click Web Console Settings.
5. Ensure the Site Logo box is selected, and click Browse to navigate to your logo.
194

6. Click Submit.
Use Orion Web Console breadcrumbs
As you navigate Orion Web Console views, you can use breadcrumbs to the pick other views that are on the same or higher navigational level as your current view.
n You cannot view breadcrumbs in wizards, dashboards, or full-page resources such as All Active Alerts.
n Only the first 50 monitored nodes, listed in alphanumeric order by IP address, are displayed.
1. Click a breadcrumb to open the view.
2. Click > next to a breadcrumb to open a clickable list of all views at the same navigation level. For example, if you are on a Node Details view, clicking > displays a list of other monitored nodes.
Customize breadcrumbs
1. Click > at an appropriate level in the breadcrumbs to open the drop-down. 2. Click Customize This List.
3. Select an option from the menu, and click Submit.
All items in the customized list will be identical for the selected criterion.
Create, delete, modify, or restrict viewsOrion Web Console views are configurable presentations of network information that can include maps, charts, summary lists, reports, events, and links to other resources.
Customized views can be assigned to menu bars. With NOC View Mode enabled, views may be optimized for display in Network Operations Centers.
To make views and graphs larger for larger screens, resize the columns dynamically (drag the division bars) and use your browser zoom controls, such as <Ctrl>+<+> in Chrome.
Create new views
You can customize the Orion Web Console for individual users by creating views.
You need Administrator Rights for creating views.
195

Plan what should be on a view before you create it.
OPTION ACTION
Identify objects to see on the view.Select the appropriate object type, such as nodes, interfaces, groups, applications, and so on.
View information for all objects of the selected object type.
Select a Summary view.
View details for a selected object. Select a Details view.
Select information about the objects you want to see.
Select resources.
Divide the information into several tabs.
Enable Left Navigation.
Optimize the view for large screens or mobile devices.
Create a Network Operations Center (NOC) view.
Limit what devices should be displayed on the view.
Add a limitation.
Access the view from the Menu Bar. Add the view into the menu bar.
Create views
Check out this video on creating a new view.
1. Log in to the Orion Web Console, and click Settings > All Settings.
2. Click Add New View in the Views grouping.
3. Name the view, and select the view type.
4. Click Submit.
You have now created an empty view. The Customize view page opens automatically. Add resources that contain the information you want to see.
The Type of View affects how the view is made accessible to users, and your choice may not be changed later. For more information, see Specify views for device types.
After you have created a new view, the Customize page opens.
196

Add resources and columns to views, and define subviews
Administrators can edit views on the Customize page for the view. Click Customize Page on the view, or access the page through Manage Views.
1. Click Settings > All Settings in the menu bar.
2. In the Views grouping, click Manage Views.
3. Select the view, and click Edit.
Add resources to the view
Check out this video on adding and customizing resources.
1. On the Customize page, click + next to the column that you want to add the resources.
To open the Customize view page, click Settings > All Settings > Manage Views. Select the view, and click Edit.
2. Select resources in the middle pane, and click Add Selected Resources.
You can limit offered resources by criteria in the Group by list, or search for a resource in the Search box.
197

3. Use the arrow icons next to the columns to move resources between columns.
4. Click Done.
The view should now be populated with the resources you selected.
n Resources already in your view are not marked in the list. You can add a resource on a view more than once.
n Some resources may require additional configuration.
n Several options on the Add Resources page are added to the list of resources for a page, but the actual configuration of a given map, link, or code is not added until the page is previewed.
Add columns
Resources on views are divided into columns.
On the Customize Page, click Add New Column.
You do not have to add resources here. You can click Done, and drag resources between the columns on the view.
198

Change column width
To change a column width, position the cursor between the columns and drag the column border to achieve the appropriate width.
Move resources on views
To move resources within a column or between columns on a subview, drag the handle at the top of the resource to the new location.
Divide content into subviews
If there is too much information on the view, group and divide resources into subviews.
1. On the Customize view, select Enable Left Navigation.
To open the Customize view page, click Settings > All Settings > Manage Views. Select the view, and click Edit.
199

2. Click Add Tab.
3. Type a name for the new tab, and click Update.
4. Select an icon, and add resources.
5. Click Done.
To save space on the views, click the double arrow button to minimize subviews.
When you are done with your changes, click Preview, and then click Submit.
Enable NOC View Mode
Network Operations Center (NOC) View Mode enables you to customize web console views for optimal display on large network operations center screens. With NOC View enabled, a web console view cycle through its network monitoring resources for continually updated, shared viewing.
1. Click Customize Page in the top right of the view for which you want to enable NOC View Mode.
2. Select Enable NOC view mode.
3. Click Done & Go To NOC to display the view in the NOC mode.
200

Limit objects on a view
As a security feature, administrators can limit which devices are displayed on a view.
1. Click Settings > All Settings in the menu bar, and click Manage Views in the Views grouping.
2. Select a view, and click Edit.
You can also open the Customize View page from the view, by clicking Customize Page.
3. On the Customize View page, click Edit in the View Limitation area.
4. Select the type of view limitation you want to apply, and click Continue.
5. Provide or select strings or options to define the device types that you want to include or exclude from the selected view, and click Submit.
The asterisk (*) is a valid wildcard. Pattern limitations restrict views to devices for which the corresponding fields include the provided string.
Use a view as a template
When you want to create multiple views based on the same device type, create one view, and use it as a template to create other new views.
1. Click Settings > All Settings in the menu bar.
2. In the Views group, click Manage Views.
3. Select the view you want to copy, and click Copy.
4. Edit the copied view.
Delete views
1. Click Settings > All Settings in the menu bar.
2. In the Views group, click Manage Views.
3. Select the view you want to delete, and click Delete.
Specify views for device types
In the Orion Web Console, you can specify views displayed for each type of device you have on your network, such as routers, firewalls, or servers.
1. Click Settings > All Settings in the menu bar.
2. In the Views grouping, click Views by Device Type.
3. Select a Web View for the individual types of devices currently monitored on your network.
4. Click Submit.
When you click a device now, the view specified for the device type will be displayed.
Resource configuration examples
Several resources that may be selected from the Add Resources page require additional configuration.
201

Display a Network Atlas map in the Orion Web Console
Network maps created with Network Atlas can give a quick overview of your network. Add a Network Atlas map on a view.
1. Open a view where you want to add the map, and click Customize Page.
2. Click the plus sign in the column to open the Add Resource dialog.
3. Enter map in the Search box, and click Search.
4. Select Map, and click Add Selected Resources.
5. Click Preview to preview the map, and click Edit to customize the resource.
6. Select a map.
7. Specify the Zoom percentage at which you want to display the map.
If you leave the Zoom field blank, the map displays at full scale, based on the size of the column in which the map displays.
8. Click Submit.
The map is added to the view.
Display a list of objects on a network map
1. Open the view where you want to add the list of objects on a map, and click Customize Page.
2. Click the plus sign in the column to open the Add Resource dialog.
3. Enter map in the Search box, and click Search.
4. Select List of Objects on Network Map, and click Add Selected Resources.
5. Click Preview to preview the map, and click Edit to customize the resource.
6. Select a network map from the list of maps, and click Submit.
The view will now include a resource listing objects on the selected map.
Display a custom list of available maps
Clicking a map in the list opens the map in a new window.
1. Open the view where you want to add the list of maps, and click Customize Page.
2. Click the plus sign in the column to open the Add Resource dialog.
3. Enter map in the Search box, and click Search.
4. Select Custom List of All Maps, and click Add Selected Resources.
5. Click Preview to preview the resource, and click Edit to customize the resource.
6. Select maps you want to include in your maps list.
7. Click Submit.
202

Display the Worldwide Map
The worldwide map provides a quick geographical overview of your network at any level from global down to street.
1. Open the view where you want to add the Worldwide Map, and click Customize Page.
2. Click the plus sign in the column to open the Add Resource dialog.
3. Enter map in the Search box, and click Search.
4. Select Worldwide Map, and click Add Selected Resources.
5. Click Preview, and if the map looks correct, click Done.
You have now added the Worldwide map to the view. Customize the world map now.
1. Click Edit in the Worldwide Map resource title bar.
2. Provide a Title and Subtitle for the map.
Titles and subtitles can be entered as either text or HTML.
3. Enter a value for Height. The default is 400 px.
4. Click Set Location and Zoom Level if you want to change the default location (the center of the map) and zoom of the map.To set the default zoom and location manually, click Advanced, and enter the latitude and longitude of the default location and the zoom level.
5. To filter the groups and nodes to be displayed, click Group and/or Nodes, and enter a SWQL filter. Click Examples to see a few SWQL filter samples.
6. Click Submit.
Display events received during a given time period
1. Open the view where you want to add the events summary, and click Customize Page.
2. Click the plus sign in the column to open the Add Resource dialog.
3. Enter event in the Search box, and click Search.
4. Select Event Summary, and click Add Selected Resources.
5. Click Preview to preview the resource, and click Edit to customize the resource.
6. Select the time period for displaying events in Time Period.
7. Click Submit.
Specify user-defined links
You can copy URLs of external websites or customized views from preview pages, and copy them to the User Links resource.
1. Open the view where you want to add the links resource, and click Customize Page.
2. Click the plus sign in the column to open the Add Resource dialog.
3. Enter links in the Search box, and click Search.
4. Select User Links, and click Add Selected Resources.
5. Click Preview to preview the resource, and click Edit to customize the resource.
203

6. Enter the following information for each link you want to define:a. A link Name and the URL of your link.b. If you want your links to open in a new browser window, select Open in New Window.
Https URLs are not supported.
7. Click Submit.
Specify Custom HTML
When you have static information that you want to provide in the Orion Web Console, add the Custom HTML resource on a view. This resource can also provide quick access to customized views.
1. Open the view where you want to add the custom resource, and click Customize Page.
2. Click the plus sign in a column to open the Add Resource dialog.
3. Enter html in the Search box, and click Search.
4. Select Custom HTML, and click Add Selected Resources.
5. Click Preview to preview the resource, and click Edit in the resource.
6. Enter HTML formatted content as required.
7. Click Submit.
Filter nodes
The Orion Web Console can maintain a customizable node list for your network. Node lists can be configured for specific views using SQL query filters.
1. Open the view where you want to add the node list, and click Customize Page.
2. Click the plus sign in a column to open the Add Resource dialog.
3. Enter nodes in the Search box, and click Search.
4. Select All Nodes - Table, and click Add Selected Resources.
5. Click Preview to preview the resource, and click Edit in the resource.
6. To filter your node list by text or IP address range, provide the text or IP address range by which youwant to filter your node list in the Filter Text field:
n Type Home in the Filter Text field to list all nodes with "Home" in the node name or as alocation.
n Type 192.168.1.* in the Filter Text field to list all nodes in the 192.168.1.0-255 IP addressrange.
7. Select the property for the filter text provided above:
n If you typed Home in the Filter Text area, select Node Name or Location to list nodes with"Home" in the node name or as a location.
n If you typed 192.168.1.* in the Filter Text area, select IP Address to list only nodes in the192.168.1.0-255 IP address range.
8. To apply a SQL filter to the node list, enter an appropriate query in the Filter Nodes (SQL) field.
By default, node list resources are designed to sort nodes alphabetically by node caption. This configuration cannot be overwritten using a SQL filter, so ORDER BY clauses included in SQL filters are redundant and will result in Custom SQL filter formatting errors.
204
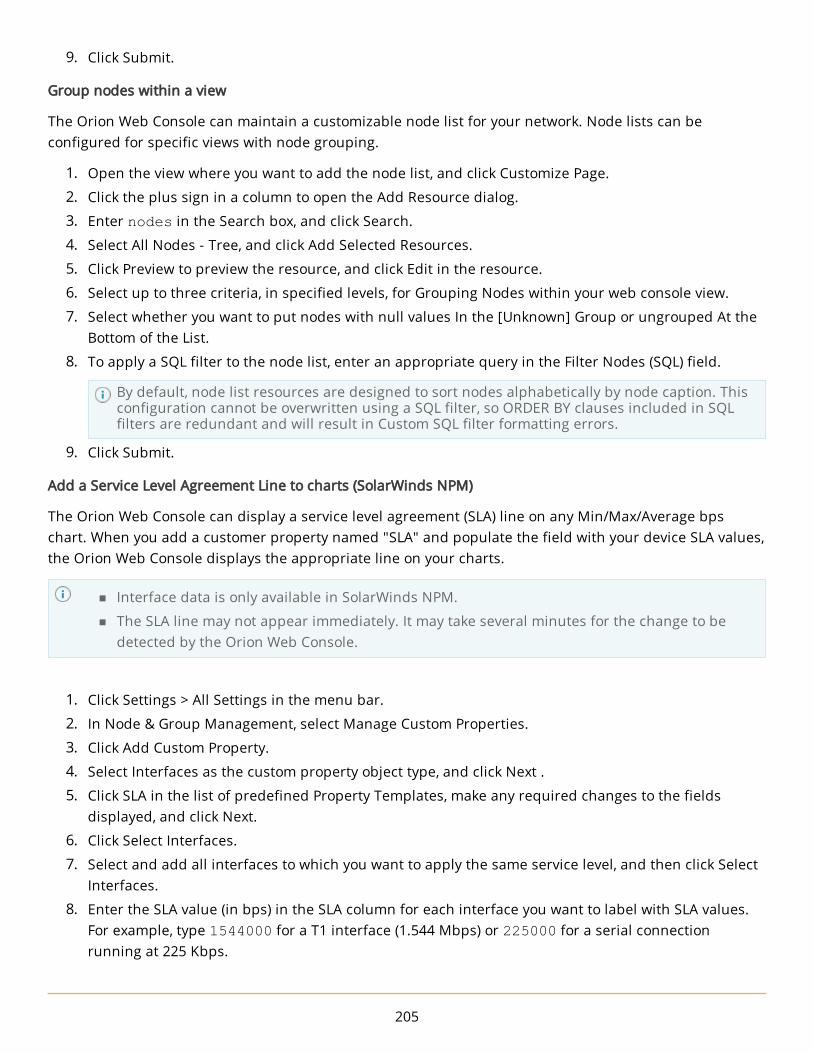
9. Click Submit.
Group nodes within a view
The Orion Web Console can maintain a customizable node list for your network. Node lists can be configured for specific views with node grouping.
1. Open the view where you want to add the node list, and click Customize Page.
2. Click the plus sign in a column to open the Add Resource dialog.
3. Enter nodes in the Search box, and click Search.
4. Select All Nodes - Tree, and click Add Selected Resources.
5. Click Preview to preview the resource, and click Edit in the resource.
6. Select up to three criteria, in specified levels, for Grouping Nodes within your web console view.
7. Select whether you want to put nodes with null values In the [Unknown] Group or ungrouped At the Bottom of the List.
8. To apply a SQL filter to the node list, enter an appropriate query in the Filter Nodes (SQL) field.
By default, node list resources are designed to sort nodes alphabetically by node caption. This configuration cannot be overwritten using a SQL filter, so ORDER BY clauses included in SQL filters are redundant and will result in Custom SQL filter formatting errors.
9. Click Submit.
Add a Service Level Agreement Line to charts (SolarWinds NPM)
The Orion Web Console can display a service level agreement (SLA) line on any Min/Max/Average bps chart. When you add a customer property named "SLA" and populate the field with your device SLA values, the Orion Web Console displays the appropriate line on your charts.
n Interface data is only available in SolarWinds NPM.
n The SLA line may not appear immediately. It may take several minutes for the change to be detected by the Orion Web Console.
1. Click Settings > All Settings in the menu bar.
2. In Node & Group Management, select Manage Custom Properties.
3. Click Add Custom Property.
4. Select Interfaces as the custom property object type, and click Next .
5. Click SLA in the list of predefined Property Templates, make any required changes to the fields displayed, and click Next.
6. Click Select Interfaces.
7. Select and add all interfaces to which you want to apply the same service level, and then click Select Interfaces.
8. Enter the SLA value (in bps) in the SLA column for each interface you want to label with SLA values. For example, type 1544000 for a T1 interface (1.544 Mbps) or 225000 for a serial connection running at 225 Kbps.
205

9. To enter a different SLA value for a different set of interfaces, click Add More.
10. Click Submit.
Browse to the Interface Details view of one of the interfaces you edited. The SLA line displays on any chart showing Min/Max/Average bps.
Add external website views
You can select any external website and add it to the Orion Web Console as a view.
You need Administrator Rights.
1. Log in to the Orion Web Console and click Settings > All Settings in the menu bar.
2. In the Customize Navigation & Look grouping, click External Websites.
3. Click Add.
4. Provide a Menu Title. This will be used for the website in the My Dashboards menu bar.
5. If you want to include a heading for the view, provide an optional Page Title.
6. Provide the URL of the external website, in the following format: http://domain_name
7. Select the Menu Bar to which you want to add the website link.See My Dashboards.
If you select Admin as the menu bar, the website will be available from My Dashboards > Home for administrators.
8. Click OK.
9. Click Preview to see the external website in the Orion Web Console.
Export views to PDF
Many views in the Orion Web Console can be exported to portable document format (PDF).
The Export to PDF feature requires IIS Anonymous Access. Confirm that the IUSR_SERVERNAME user is in the local Users group on your Orion server.
1. Open a view, and click Export to PDF in the top right corner of the view.
2. If you are prompted to save the PDF file, click Save.
3. Navigate to a location, provide a file name, and click Save.
Create custom summary views
The Custom Summary view enables you to create a fully customized object-based view.
You need the Allow Account to Customize Views right enabled.
1. Click My Dashboards > Home > Custom Summary.
2. Click Edit in any Custom Object Resource.
206

3. Provide a Title and Subtitle for the resource.
4. Select an object type from the Choose Object Type drop-down.
5. Click Select Object.
6. On the Select Objects window, use the Group by selection field to filter the list of monitored objects.
7. Select one or more objects on which to base the selected resource, click the green arrow to move objects into the Selected Objects pane and click Submit to add the objects.
8. Specify what information about the selected object(s) you want to see in the resource, and click Submit.
207

The fields displayed and information required depend upon the object type selected.
Orion Web Console and chart settingsThe Web Console Settings page allows an Orion Web Console administrator to customize the Orion Web Console user environment.
1. Click Settings > All Settings in the menu bar.
2. In the Product Specific Settings grouping, click Web Console Settings.
3. When you finish configuring the settings, click Submit.
Web Console settings
Session Timeout
Provide the amount of time, in minutes, that Orion Web Console waits through user inactivity before the user is logged out.
Windows Account Login
Select whether you want to enable or disable automatic login with Windows Active Directory Credentials. With this feature enabled, the user can log in automatically.
Page Refresh
Specify the amount of time that passes before an Orion Web Console view reloads automatically
208
Site Logo
Select the box, and provide a path to a banner graphic that appears at the top of every Orion Web Console page.
NOC View Logo
Select the box, and provide a path to a banner graphic that appears at the top of every NOC view.
Site Login Text
Provide a text all Orion Web Console users will see before they log in. Enter up to 3500 characters. HTML tags are allowed.
Help Server
Provide the URL of the server where online help for Orion Platform products is stored. The default location is http://www.solarwinds.com.
If you are in an Internet-restricted network environment but require access to online help, download the online help for your products, including the Orion Platform offline help, copy it to a web server, and change the Help Server URL to that of the web server. You can download the online help from the documentation page for your product at https://support.solarwinds.com/Success_Center.
Status Rollup Mode
Specify how the availability status of nodes in node trees or on maps is displayed in the Orion Web Console.
n Mixed Status shows Warning ensures that the status of a node group displays the worst warning-type state in the group. If none of the group members have a warning-typed state but the group contains both up and down nodes, a Mixed Availability warning state is displayed for the whole group. Examples:Critical + Down = Critical, Critical + Warning = Critical,Up + Down = Mixed Availability.
n Show Worst Status ensures the worst state in a node group is displayed for the whole group. Examples:Up + Down = DownUnreachable + Shutdown = Shutdown.
209

Child Status Rollup Mode
Specify how the status of any single node on the node tree or on a map is displayed.
n Select Show Worst Status to ensure that the worst status of the node group is displayed for the whole group (e.g. red if any of the nodes are down).
n Select Show Worst Status (Interfaces only) to ensure that the worst status of any of the interfaces on a selected node is displayed. Only if you have SolarWinds NPM installed.
n Select Show Worst Status (Applications only) to ensure that the worst status of any of the applications on a selected node is displayed.
n Select Show only ICMP Status to only display up/down status for monitored interfaces.
Child Status Display Mode
Select whether you want to use a static or blinking icon to display the status of the children of any single node on the node tree or on a map. By default, a static icon displays the status of child objects.
Integration Tips
Specify whether you want to show or hide the list of products in the How SolarWinds Products Work Together section of the Settings page.
Drag and Drop Views
Turn on or off the ability to drag resources around on views.
Auditing settings
Select Enable Audit Trails to keep a record of all actions taken by Orion Web Console users. Depending on the number of technicians or the activity level of your installation, this may increase the storage needs of your database.
Chart settings
Chart Aspect Ratio
Chart Aspect Ratio is the height/width ratio for web console charts. This ratio should be set between 0.25 and 3.0 to avoid erratic display problems, though the performance of individual systems may differ.
Thumbnail Aspect Ratio
Thumbnail Aspect Ratio is the height/width ratio for chart thumbnails.
95th Percentile Calculations
95th Percentile Calculations adds annotation lines to charts at the entered percentile. This value is normally set to 95.
210

Maximum Number of Data Series Displayed on Chart
The Maximum Number of Data Series Displayed on Chart setting determines the maximum number of data series that will display on a chart at the same time. The default value for this setting is 10.
Show Data Points on Lines
The actual data points that are used to create a chart may be shown by checking Show Data Points on Lines.
Font Size
Font Size sets the default relative size, Small, Medium, or Large, of the text that is displayed within charts in the Orion Web Console. This setting is independent of your browser settings. The font settings in your browser will affect resource headers and some resource contents.
Discovery, Worldwide Map, and Active Alerts settings
Notify About New Removable Volumes
Select the box if you want to be notified when removable volumes are added to your network and discovered during network discovery. You should configure the default send email action to receive notifications.
Automatic Geolocation
Select the box to place nodes automatically on worldwide maps.
Active Alerts Refresh
Specify how often the active alerts grid page is refreshed.
Active Alerts settings
Select how frequently you want the active alerts resource to refresh. Any alerts that trigger within the refresh interval appear when the grid refreshes.
Customize charts in the Orion Web ConsoleUse the customization options available in the chart to customize the data, layout and time frame shown by the chart.
Available customization options depend on the chart.
Drop-down customization options
Some charts have drop-down menus that include the following options:
n View chart data over the Last 7 Days or over the Last 30 Days
n Select Edit Chart or click on the chart to open the chart resort in a new tab.
n View Chart Data as an HTML format document
n View Chart Data in Excel to see chart data in an Excel™-compatible format
211

Edit Resource page
If a chart has an Edit button, click it to get to the Edit Resource page. Edit titles, time periods, or other details, and click Submit to go back to the view and see the changes applied in the chart.
Titles and subtitles
You can customize the title and subtitle for the resource and for the chart.
To change the chart labels, click Advanced, and enter a text or variable that displays as the chart title or subtitle.
The default for the chart subtitle is ${ZoomRange], which shows the selected zoom range.
Other options depend on the chart type.
Calculated series: Show a trend line
Select the box to display a trend line on the graph. This shows potential future results as extrapolated from collected historical data.
The trend lines are intended only as approximate predictions of future data.
Calculated series: Show the sum of all data series
Select the box if you want to display the sum of all data series in the form of stacked bars or lines.
Calculated Series: Show the 95th percentile line
Select the box to show the 95th percentile line. This is a well-known statistical standard used to discard maximum spikes, based on 5 minute data samples. The calculation gathers these values every 5 minutes for however long you select, throwing away the top 5% so as to yield the 95th percentile value.
Maximum Number of Items to Display:
Enter the highest number of items you want to display in this chart.
Time periods: Default zoom range
Select the default range of data to be displayed from the drop-down list.
Time periods: Amount of historical data to load
Select the amount of historical data to load from the drop-down list.
Time periods: Sample interval
Select the sample interval to be used from the drop-down list. Each sample interval is represented on a chart by a single point or bar. Data within a selected sample interval is summarized automatically.
212
Custom Chart page
Click Export or click the chart to open the Custom Chart page in a new tab. You can change the chart settings and click Refresh to see the changes applied in the same tab.
If the chart has a drop-down menu, you can also access the custom chart page by selecting the Edit chart option.
Title, Subtitle, Subtitle #2
Enter a title and optional subtitles to be displayed above the chart.
Time Period: Select a Time Period
Select the time period that you want the chart to cover.
Alternatively, you can enter a specific time period for the chart.
Time Period: Beginning Date/Time
Enter the start date and time for the chart in one of the formats shown. If you do not enter a time, this will default to 12:00:00 AM.
Time Period: Ending Date/Time
Enter the end date and time for the chart in one of the formats shown. If you do not enter a time, this will default to 12:00:00 AM.
Sample Interval
Select the sample interval. Each sample interval is represented on a chart by a single point or bar. Data within a selected sample interval is summarized automatically.
Chart Size: Width
Enter a custom width, in pixels, for this chart. The default is 640.
Chart Size: Height
Enter a custom height, in pixels, for this chart. Enter 0 to maintain the original width/height ratio.
Font Size
Select the font size for the chart from the drop-down list.
Trend Line: Show Trend
Select the box to display a trend line on the graph. This shows potential future results as extrapolated from collected historical data.
Due to the broad array of factors that can affect the performance of devices, trend lines are intended as approximate predictions of future data only.
213
Display Chart Data: Raw Data
Click to display or save the data being used in this report as an xls file.
Display Chart Data: Chart Data
Click to display the data in this report as a HTML table in the web browser.
Customize charts
If a chart has an Edit button, click Edit to customize the chart.
Title
Enter or edit a title for this resource.
Subtitle
Enter or edit an optional subtitle for the resource.
Other options depend on the chart type.
Calculated series: Show a trend line Select the box to display a trend line on the graph. This shows potential future results as extrapolated from collected historical data.
The trend lines are only intended as approximate predictions of future data.
Calculated series: Show the sum of all data series Check this box if you want to display the sum of all data series in the form of stacked bars or lines.
Calculated Series: Show the 95th percentile line
Check this box to show the 95th percentile line. This is a well-known statistical standard used to discard maximum spikes, based on 5 minute data samples. The calculation gathers these values every 5 minutes for however long you select, throwing away the top 5% so as to yield the 95th percentile value.
Maximum Number of Items to Display: Enter the highest number of items you want to display in this chart.
Time periods: Default zoom range
Select the default range of data to be displayed from the drop-down list.
Time periods: Amount of historical data to load
Select the amount of historical data to load from the drop-down list.
Time periods: Sample interval
Select the sample interval to be used from the drop-down list. Each sample interval is represented on a chart by a single point or bar. Data within a selected sample interval is summarized automatically.
Advanced: Chart title
Enter a title to appear above the chart.
214
Advanced: Chart Subtitle
Enter an optional subtitle to appear beneath the chart title. The default is ${ZoomRange], which shows the selected zoom range.
Customize custom charts
If the chart has a drop-down menu in its top line, the following edit options apply.
Custom chart drop-down menu options
n View chart data over the Last 7 Days or over the Last 30 Days.
n Select Edit Chart or click on the chart to open the chart resort in a new tab.
n View Chart Data as an HTML format document.
n View Chart Data in Excel to see chart data in an Excel™-compatible format.
Edit the chart
If you click Edit Chart from the drop-down menu or click on the chart, the chart resource opens in a new tab and you can edit the following:
Chart Titles: Title
Enter a title to be displayed above the chart.
Chart Titles: Subtitle
Enter an optional subtitle to be displayed beneath the title.
Chart Titles: Subtitle #2
Enter a second optional subtitle to be displayed beneath the title.
Time Period: Select a Time Period
Select the time period that you want the chart to cover.
Alternatively, you can enter a specific time period for the chart.
Time Period: Beginning Date/Time
Enter the start date and time for the chart in one of the formats shown. If you do not enter a time, this will default to 12:00:00 AM.
Time Period: Ending Date/Time
Enter the end date and time for the chart in one of the formats shown. If you do not enter a time, this will default to 12:00:00 AM.
Sample Interval
Select the sample interval. Each sample interval is represented on a chart by a single point or bar. Data within a selected sample interval is summarized automatically.
215
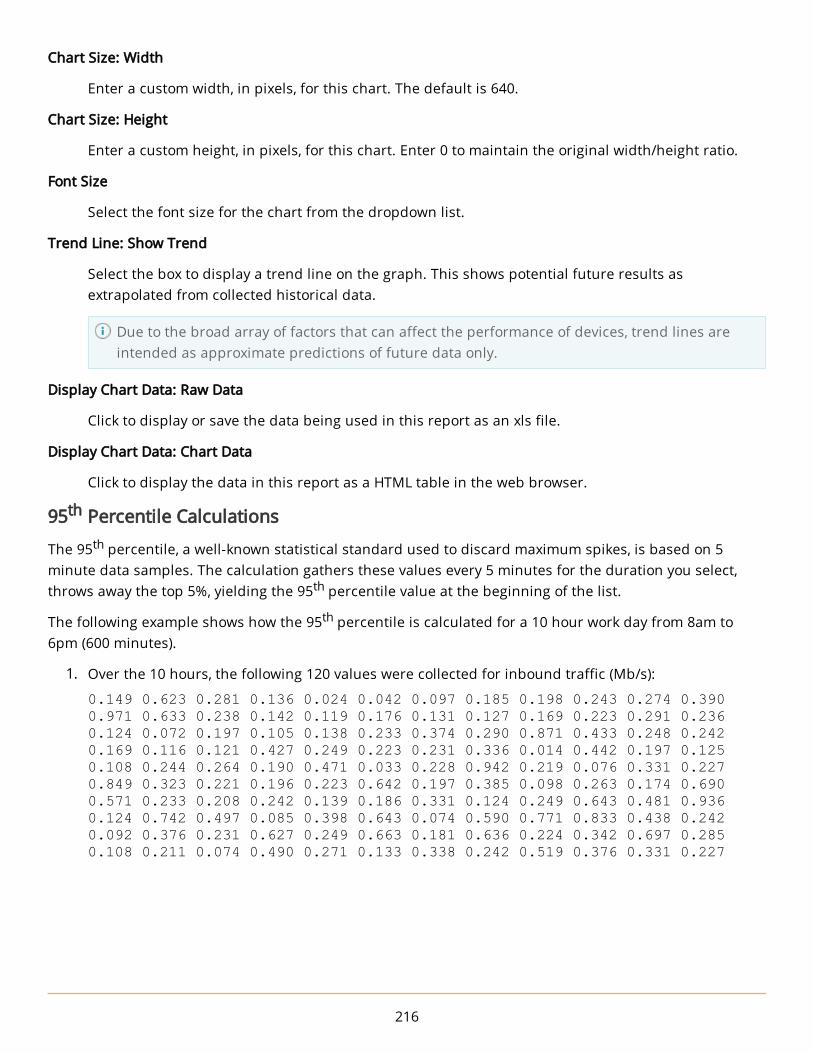
Chart Size: Width
Enter a custom width, in pixels, for this chart. The default is 640.
Chart Size: Height
Enter a custom height, in pixels, for this chart. Enter 0 to maintain the original width/height ratio.
Font Size
Select the font size for the chart from the dropdown list.
Trend Line: Show Trend
Select the box to display a trend line on the graph. This shows potential future results as extrapolated from collected historical data.
Due to the broad array of factors that can affect the performance of devices, trend lines are intended as approximate predictions of future data only.
Display Chart Data: Raw Data
Click to display or save the data being used in this report as an xls file.
Display Chart Data: Chart Data
Click to display the data in this report as a HTML table in the web browser.
95th Percentile Calculations
The 95th percentile, a well-known statistical standard used to discard maximum spikes, is based on 5 minute data samples. The calculation gathers these values every 5 minutes for the duration you select, throws away the top 5%, yielding the 95th percentile value at the beginning of the list.
The following example shows how the 95th percentile is calculated for a 10 hour work day from 8am to 6pm (600 minutes).
1. Over the 10 hours, the following 120 values were collected for inbound traffic (Mb/s):
0.149 0.623 0.281 0.136 0.024 0.042 0.097 0.185 0.198 0.243 0.274 0.390 0.971 0.633 0.238 0.142 0.119 0.176 0.131 0.127 0.169 0.223 0.291 0.236 0.124 0.072 0.197 0.105 0.138 0.233 0.374 0.290 0.871 0.433 0.248 0.242 0.169 0.116 0.121 0.427 0.249 0.223 0.231 0.336 0.014 0.442 0.197 0.125 0.108 0.244 0.264 0.190 0.471 0.033 0.228 0.942 0.219 0.076 0.331 0.227 0.849 0.323 0.221 0.196 0.223 0.642 0.197 0.385 0.098 0.263 0.174 0.690 0.571 0.233 0.208 0.242 0.139 0.186 0.331 0.124 0.249 0.643 0.481 0.936 0.124 0.742 0.497 0.085 0.398 0.643 0.074 0.590 0.771 0.833 0.438 0.242 0.092 0.376 0.231 0.627 0.249 0.663 0.181 0.636 0.224 0.342 0.697 0.285 0.108 0.211 0.074 0.490 0.271 0.133 0.338 0.242 0.519 0.376 0.331 0.227
216

2. The values are reordered from high to low.
0.971 0.942 0.936 0.871 0.849 0.833 0.771 0.742 0.697 0.690 0.663 0.643 0.643 0.642 0.636 0.633 0.627 0.623 0.590 0.571 0.519 0.497 0.490 0.481 0.471 0.442 0.438 0.433 0.427 0.398 0.390 0.385 0.376 0.376 0.374 0.342 0.338 0.336 0.331 0.331 0.331 0.323 0.291 0.290 0.285 0.281 0.274 0.271 0.264 0.263 0.249 0.249 0.249 0.248 0.244 0.243 0.242 0.242 0.242 0.242 0.238 0.236 0.233 0.233 0.231 0.231 0.228 0.227 0.227 0.224 0.223 0.223 0.223 0.221 0.219 0.211 0.208 0.198 0.197 0.197 0.197 0.196 0.190 0.186 0.185 0.181 0.176 0.174 0.169 0.169 0.149 0.142 0.139 0.138 0.136 0.133 0.131 0.127 0.125 0.124 0.124 0.124 0.121 0.119 0.116 0.108 0.108 0.105 0.098 0.097 0.092 0.085 0.076 0.074 0.074 0.072 0.042 0.033 0.024 0.014
3. The first 6 values are dropped, as these equal the top 5% of the values.
0.771 0.742 0.697 0.690 0.663 0.643 0.643 0.642 0.636 0.633 0.627 0.623 0.590 0.571 0.519 0.497 0.490 0.481 0.471 0.442 0.438 0.433 0.427 0.398 0.390 0.385 0.376 0.376 0.374 0.342 0.338 0.336 0.331 0.331 0.331 0.323 0.291 0.290 0.285 0.281 0.274 0.271 0.264 0.263 0.249 0.249 0.249 0.248 0.244 0.243 0.242 0.242 0.242 0.242 0.238 0.236 0.233 0.233 0.231 0.231 0.228 0.227 0.227 0.224 0.223 0.223 0.223 0.221 0.219 0.211 0.208 0.198 0.197 0.197 0.197 0.196 0.190 0.186 0.185 0.181 0.176 0.174 0.169 0.169 0.149 0.142 0.139 0.138 0.136 0.133 0.131 0.127 0.125 0.124 0.124 0.124 0.121 0.119 0.116 0.108 0.108 0.105 0.098 0.097 0.092 0.085 0.076 0.074 0.074 0.072 0.042 0.033 0.024 0.014
4. The 95th percentile is 0.771.
View monitored objects on mapsMaps in the Orion Web Console can show monitored nodes, interfaces and volumes, SAM applications and components, and network links.
Open Street Map
Display nodes on maps powered by Open Street Map.
Network Maps
Create customized maps in Network Atlas, and display them in the Orion Web Console.
The Worldwide Map
The Worldwide Map resource represents nodes and groups of nodes on a realistic geographical map that can be displayed on Orion Web Console views. When a map is viewed in the console, you can zoom in and out, view concise information pop-ups for nodes and groups, and access Node detail pages by double clicking an object.
Only one Worldwide map can be created, but can be included in as many views as required. However, the Worldwide Map in each view can have its own title, and you can apply filters to show a different selection of objects.
217

Set up the Worldwide map
You can add nodes and groups of nodes to the Worldwide map automatically or manually. If you decide to add objects automatically, GPS co-ordinates and street address information, held within each node's Custom Properties, is used to determine each object's location. Objects that do not have this information can be added manually.
Automatically add objects to the Worldwide map
1. Click Settings > All Settings in the menu bar.
2. Click Web Console Settings in the Product Specific Settings section.
3. Scroll down to the Worldwide Map Settings settings, and select the Automatic Geolocation check box.
4. Click Submit. 5. Click Manage World Map in the Node & Group Management section.
If objects have been automatically located they will be displayed on the world map within an hour.
If you try to drag an automatically placed object to another location on the map, a warning message is displayed to inform you that the object will be treated as a manually placed object once it is moved.
Manually add objects to the Worldwide map
1. Click Settings > All Settings in the menu bar.
2. Click Manage World Map in the Node & Group Management section.
3. Click Place objects on the map manually, and click on the map where you want to place the node or group.
4. Select Groups or Nodes from the Show drop-down, and how to display these objects from the Group by drop-down.
5. Check the required nodes or groups in the Available Objects column.
6. Enter a name for this location in the Name of Location field, if required.
7. Click Place on Map.
If the icon in not displayed in exactly the right place, you can drag-and-drop it into the correct location, or click Edit Location and amend the Latitude and Longitude coordinates.
Map objects
The icons used on the Worldwide map are shown below:
Single node Click to open this node's details page.
A group or nodes at the same locationClick to open the Worldwide map, showing a description of the nodes within the group in the right column. Click on a node description to open the node's details page.
218
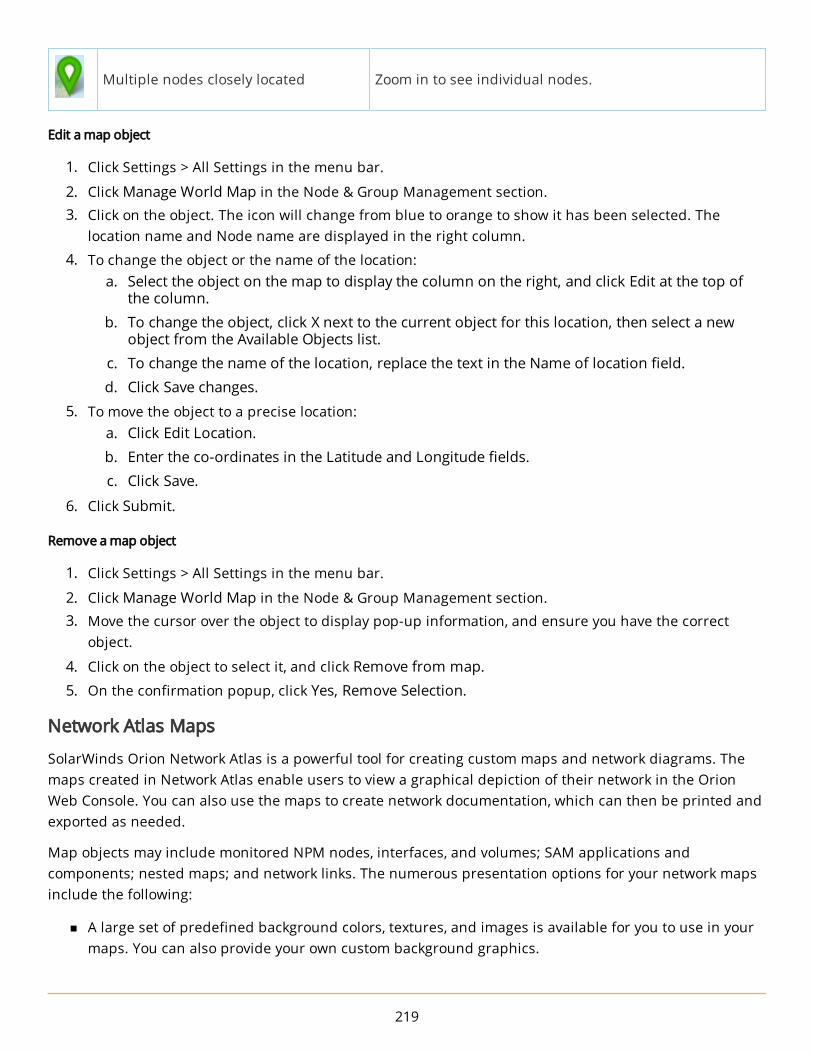
Multiple nodes closely located Zoom in to see individual nodes.
Edit a map object
1. Click Settings > All Settings in the menu bar.
2. Click Manage World Map in the Node & Group Management section. 3. Click on the object. The icon will change from blue to orange to show it has been selected. The
location name and Node name are displayed in the right column.
4. To change the object or the name of the location: a. Select the object on the map to display the column on the right, and click Edit at the top of
the column. b. To change the object, click X next to the current object for this location, then select a new
object from the Available Objects list. c. To change the name of the location, replace the text in the Name of location field. d. Click Save changes.
5. To move the object to a precise location: a. Click Edit Location. b. Enter the co-ordinates in the Latitude and Longitude fields. c. Click Save.
6. Click Submit.
Remove a map object
1. Click Settings > All Settings in the menu bar.
2. Click Manage World Map in the Node & Group Management section. 3. Move the cursor over the object to display pop-up information, and ensure you have the correct
object.
4. Click on the object to select it, and click Remove from map.
5. On the confirmation popup, click Yes, Remove Selection.
Network Atlas Maps
SolarWinds Orion Network Atlas is a powerful tool for creating custom maps and network diagrams. The maps created in Network Atlas enable users to view a graphical depiction of their network in the Orion Web Console. You can also use the maps to create network documentation, which can then be printed and exported as needed.
Map objects may include monitored NPM nodes, interfaces, and volumes; SAM applications and components; nested maps; and network links. The numerous presentation options for your network maps include the following:
n A large set of predefined background colors, textures, and images is available for you to use in your maps. You can also provide your own custom background graphics.
219

n Real-time weather or natural disaster maps may be projected directly onto your network maps using linked web graphics as a background.
n The shape, size, color, and style of map links may be customized to illustrate the status or the relative bandwidth of associated objects.
n Map objects may be presented in a unique set of graphical styles to portray network status.
n Maps may be nested to selectively reveal increasing levels of map detail, and the status of nested map child objects may be bubbled up to the parent map.
Orion Network Atlas is also fully compatible with all network maps created with Orion Map Maker used with earlier versions of Orion products. For more information, see the SolarWinds Orion Network Atlas Administrator Guide.
For information on adding Network maps to your Console views, see Display a Network Atlas map in the Orion Web Console.
Display nodes in the Worldwide Map of Orion Nodes resource
Nodes and groups that contain information about their location in the OpenStreet format are displayed automatically. See Place nodes automatically on the Worldwide Map
Objects with the same position are displayed as one location.
Although there is one Worldwide map, you can add the Worldwide Map resource to multiple views, and display different objects and information on each view. For example, you can apply different zoom levels, use different titles and subtitles, or center the map on different coordinates.
If you cannot see the Worldwide Map resource on a view, add the resource. See Add resources and columns to views, and define subviews.
Add nodes manually
Add a new location into the map, and define the nodes positioned in the location.
1. Click Manage Map in the Worldwide Map resource.
2. Click Place Nodes on the Map Manually, and click into the map where you want to place the nodes.
3. Use the Grouping and Search tools to select nodes which you want to place on the map.
Click > next to a node group to expand a list of all nodes in the group.
4. Provide a name for the location.
5. Click Place on Map.
6. Click Submit. If you want to further edit the map, click Save and Continue.
Edit the position of locations
If the exact position is not known or important, you can drag locations to their positions.
220

1. Click Manage Map in the Worldwide Map resource.
2. Click a map location, and click Edit Location.
3. Provide the Latitude and Longitude of the new location, and click Save.
4. Click Submit. If you want to further edit the map, click Save and Continue.
Add or remove nodes in locations, or rename locations
1. Click Manage Map in the Worldwide Map resource.
2. Click the map location you want to edit, and click Edit at the top right of the list of nodes at the selected map location.
3. Add or remove nodes in the location.
n Select nodes to be added in the Available Objects section. n To remove nodes, click x next to the node in the Selected Objects section.
If you want to rename the location, type the new name in the Name of Location field at the bottom of the Available Objects section.
4. Click Save Changes.
5. To apply your changes in the resource, click Submit or Save and Continue if you want to further edit your worldwide map.
Delete locations
1. Click Manage Map in the Worldwide Map resource.
2. Select the map location.
3. Click Remove from Map, and then confirm the map location removal.
4. Click Submit. If you want to further edit the map, click Save and Continue.
Place nodes automatically on the Worldwide Map
If your devices contain information about their location in the OpenStreetMap format, they can be added into the Worldwide Map resource automatically.
You can specify the position for automatic geolocation with custom properties. See Place objects into the map using custom properties.
Objects with the same position appear as one location in the map.
To verify whether the automatic placement of objects is enabled:
1. Log in to the Orion Web Console as an administrator.
2. Click Settings > All Settings in the menu bar.
3. In the Product Specific Settings, click Web Console Settings.
221

4. Scroll down to Worldwide Map Settings and make sure Automatic Geolocation is selected.
Locations will display in the Worldwide Map resource within an hour after you select this option.
5. Click Submit to apply the current settings.
Automatic geolocation does not change locations for manually placed objects. If you move an automatically placed location, its position will not be updated if you change the values for longitude and latitude.
In what format should the location on a Cisco device be configured?
You can use any format the mapquest API is able to parse.
FORMAT EXAMPLE
city (AA5), state (AA3) city (AA5), state (AA3)
city, state, postalCode Lancaster, PA, 17601
postalCode 17601
street, city, state 300 Granite Run Dr, Lancaster, PA
street, city, state, postalCode 300 Granite Run Dr, Lancaster, PA, 17601
street, postalCode 300 Granite Run Dr, 17601
latLng 40.07546,-76.329999
Place objects into the map using custom properties
If you have longitude and latitude for your nodes or groups defined as custom properties, you can use the coordinates to automatically place the nodes on the WorldWide Map.
You can create the custom properties using the Longitude and Latitude property templates.
1. Export the values for the custom properties Longitude and Latitude. a. Click Settings > All Settings, and then click Manage Custom Properties. b. Select Longitude and Latitude, click Export Values, and click Export.
222

2. Import the .csv file with longitude and latitude custom properties, and match these to Latitude andLongitude (World Map) column.
a. In the Custom Property Editor, click Import Values, select the export file with Longitude andLatitude.
b. Clear the Remove unchanged rows box, and click Next.
If the box is selected, only the data you changed manually in the exported file will be imported. After an automatic export, there are no changes, and thus no data will be imported.
c. Match Longitude and Latitude to the World Map columns.
d. Click Import.3. Optional: Verify that the values were imported successfully.
a. Click Settings > All Settings, and click Manage Custom Properties.b. Select Longitude and Latitude and click View / Edit Values.c. Add the Longitude (World Map) and Latitude (World Map) columns.
The values for Longitude (World Map) should match the Longitude values, and values for Latitude (World Map) should match the Latitude values.
You can now see the nodes in the Worldwide Map, as specified by the Longitude and Latitude (World Map) properties.
223

Create and view reportsSolarWinds provides predefined reports for each Orion Platform product. Use the web-based interface to customize these predefined reports and create your own reports.
You must use the Orion Report Writer to maintain legacy reports created with Orion Report Writer.
Predefined reportsYour SolarWinds installation comes with many predefined reports that can be used as soon as there is data to be reported on. View a list of predefined reports by clicking Reports > All Reports in the menu bar.
These predefined reports are sufficient for most needs, but can be further customized. You can also create new reports.
Create, schedule, export, and import reports in the Orion Web Console
The Orion Web Console does not allow you to edit legacy reports created with the Orion Report Writer. Use the Report Writer to edit these.
Create reports in the Orion Web Console
Highly customizable reports, featuring the same charts, tables, gauges, and resources available in your views, can be created directly from the Orion Web Console.
There are two ways to create a new report:
l Modify an existing web-based report (recommended). Add new content to or edit the existing content of an existing report. This is the recommended approach for new users.
l Create a completely new report. Select the layout and contents for the report.
Modify an existing web-based report
Modifying an existing web-based report is often the simplest way to generate a new report. You can add pre-existing resources or create a custom table or chart. You can also edit information about each resource.
1. Click Reports > All Reports in the menu bar, and click Manage Reports.
2. Select Report Origin in the Group by drop-down menu in the left pane, and select Web-based from the list.
3. Select the report to use as the basis for your new report, and click Duplicate & Edit.
4. Click Add Content.
224

5. Select the resource to add to the report, and click Select and Continue.
Some resources require you to choose a specific object to report on. For example, if you want to track how many people use a specific application, you must choose the application when adding the resource.
6. Click the Edit button on the resources to make changes such as filtering the objects, group columns, or setting a sample interval. Available options depend on the type of resource you add.
7. Click Next to display the Preview view, and click Next.
8. Add report properties, such as categories or custom properties. Use the report limitation category to restrict the report to specific user accounts. Click Next.
9. Schedule the report by clicking Schedule this report to run regularly, and creating a new schedule or adding the report to an existing schedule. Click Next.
10. Review the Summary and click Submit to save the report.
Create a new web-based report
Web-based reports are created in the Orion Web Console, and can be restricted to specific users through report limitations. Users may be assigned specific report limitation categories and can only view reports that are in the same report limitation category.
SolarWinds recommends that you duplicate and edit an existing web-based report instead of creating a new one.
1. Click Reports > All Reports > Manage Reports > Create New Report.
2. On the Layout Builder panel, click Add Content. You may be prompted to add content as soon as you click Create New Report.
225

3. Select the first resource to add to the report and click Select and Continue.
Some resources require you to choose a specific object to report on. For example, if you want to track how many people use a specific application, you must choose the application when adding the resource. The Layout Builder view is displayed with the selected resource added.
4. In the Content area, add resources and sections to the report. You can also modify the layout. a. Click Add content to add resources to your report. For more information, see Add content to
a web-based report.
226

b. Click Add section to add more rows of content to this report.
5. To filter a resource to include a specific set of data, click Edit Resource. Not all resources can be filtered.
227

6. Filter the resource and click Submit.
Each resource has different filter options.
7. After adding and filtering the resource, enter a report name, and click Next.
8. On the Preview panel, click Next.
9. Add report properties, such as categories, custom properties, or limitations, and click Next.
10. To schedule the report, click Schedule this report to run regularly, create a new schedule or assign a schedule, and click Next.
You can schedule a report to be generated, emailed, saved, or printed. 11. Review the Summary and click Submit to save the report.
Customize a web-based report layout
You can customize how the report looks, such as the width, header, or number of columns. By default a report is 960 pixels wide with a header and footer, and a single column for content.
1. Select a report to edit from the Report Manager.
2. In the Layout Builder page, change the width of your new report by doing one of the following:
n Click Fit to window width so the content of the report expands to the width of the browser window.
n Enter a new value, in pixels (px), in the Report width field. 3. Click Browse for logo to change the default logo. The Logo check box must be selected in the Header
area. Changing the logo does not affect other reports.
The maximum image size is 600 pixels wide and 240 pixels high.
228

4. In the Content area, change the number of columns or rows. You can select a predefined page layout or manually add columns and rows.
n Enter a number in the Layout columns field to change the number of columns. n Click Add section to add more rows
5. Select the Footer check box to include a footer in your report. Select each option you want included.
Add content to a web-based report
You can include any Orion Web Console resource, including charts and graphs, in a report.
The following procedure assumes you are already creating or editing a report in the Orion Web Console.
Resources can be dragged between columns and sections.
1. On the Layout Builder page, click Add Content in the column to which you want to add a new resource.
2. Use the Group by field to filter the available resources or search for a specific resource.
The Classic category grouping provides the most comprehensive list of available resources.
3. Select the resource from the list in the main pane.
If you are an advanced user and want to add a Custom Chart or Table, see Add a custom chart or table to a web-based report.
4. Click Select and Continue.
5. If the resource requires you to select specific objects: a. Select the required objects from the left pane. b. Click Add to Layout.
6. You can edit the resource if you want to change the title or subtitle.
7. If you want to add another row to your report, click Add section. You can now add content to this row as described above.
Add a custom chart or table to a web-based report
You can create custom charts or tables for inclusion in web-based reports. Custom charts or tables are usually added when you are familiar with your SolarWinds Orion database or are comfortable creating SQL or SWQL queries. Because the Orion Platform generates so much data, you need to ensure that you know exactly what data you are using, from which instances it originates, and what you do with them to ensure that your custom charts and tables show meaningful results.
You can reuse customized charts or tables by clicking Use previously specified objects when adding the chart or table and then selecting the object.
1. Click Add Content in the column to which you want to add a custom chart.
2. Group by Reports to find the Custom Chart or Custom Table resources.
3. Select Custom Chart or Custom Table, and click Select and Continue.
229

4. Use one of the following methods to configure the objects displayed in the chart or table:
n Specific Objects (static selection) - use when you know which objects you want to include in your chart or table.
a. Filter or search for the objects you want to include. b. Select the objects' check boxes.
This is the most straightforward selection method, and recommended for new users. It is also the preferred method for relatively permanent network objects.
n Dynamic Query Builder - use to select objects based on object properties. a. Select Basic Selector to create and/or queries or select Advanced Selector to create
complex queries. b. Choose the object type you want to include. c. Enter your conditions.
This is the preferred selection method for groups of objects of a specified type that may change over time. "All Cisco nodes in Austin" is an example of a group best defined using the Dynamic Query Builder.
n Advanced DataBase Query (SQL, SWQL) - only use if you are comfortable querying your SolarWinds database directly using SQL or SWQL.
a. Select SQL or SWQL, and enter your query. b. Click Preview Results to test your query.
5. Enter a name for this selection in the Selection Name field, and click Add to Layout.
You must now edit the chart or table to choose the data series or columns you want to use and modify display and filtering settings.
Add a data series and customize a chart
Once you have specified the objects for your custom chart, you need to select the data series. You can also change the sample interval and filter the results.
1. If you have just added a custom chart, the Edit Resource page opens. Click Edit Chart on the resource in the Layout Builder page to open this page.
2. Click Add Data Series in Left Y-axis.
3. Filter or search for the data series, and select the one you want to use.
The groups available and the data series within these groups will depend on the object selected.
4. Click Add Data Series. The data series is added to the Left Y-axis.
5. For additional settings for each data series, click More. Here you can:
n Edit the Display name for this data series. n Select a custom Color for this data series. n Show the 95th percentile line for this data series. n Show Trend for this data series.
6. Enter a Custom label for the Left axis.
7. Select the Units displayed, Chart type, and select the Show the sum of all data series, if required.
230

8. Select the Sample Interval. This can be as frequent as once a minute to once a week. Data within each sample interval are summarized so that a single point or bar is plotted for each of these periods.
It is possible to select a sample interval that is longer than the reporting period.
9. Choose how you want to filter your report. a. Select how you want to sort this selection of records from the Sort records by drop-down
menu. The choices depend on the data series selected. b. Select either Ascending or Descending from the Sort order drop-down. c. Select the Data aggregation method required to summarize your data by time period. d. Click Advanced if you want to sort records using a secondary field.
10. Set up additional data series using the right axis to superimpose two charts using different labels, units, and chart type.
You cannot use a separate time period or filter results settings for the right axis series.
11. Click Submit to return to the Add Report page.
Add a data series and customize a table
After you have specified the objects to be reported on for a custom table, select the data series. You can also sort and filter the results.
1. If you have just added a custom table, the Edit Resource page opens. You can open this page by clicking Edit Table on the resource in the Layout Builder page.
2. Click Add Column.
3. Filter or search for the column, and select the column you want to use.
The columns and options available depend on the objects selected.
4. Click Add Column.
5. For additional settings for a column, click Advanced. Here you can:
n Edit the Display name for this column. n Select Hide this column in the resulting table, if you want to use this column when querying
the database but do not want to show it. For example, you may want to use this column's data in the time-based settings but not show the data in the table.
n Select Allow HTML tags, if you want to use any HTML tags retrieved from the database for this column.
n Select the Display settings to be used for this column. This applies the selected formatting to the data in this column.
n Select the Data aggregation method to use for this column, to summarize your data by time period.
n Select the Alignment for this data. This can be left, right, or center. 6. Click the plus sign in the table layout section to add more columns.
7. Filter the number of records shown in the table by either a specific number or a percentage.
231
8. Restrict data in your table to a specific time period by selecting Yes from the Time-based settingsdrop-down menu.
You can only do this if your table contains a column with historical data.
a. Select the column used to specify the time period from the Date/Time column in this tabledrop-down menu.
b. Select the Sample Interval. This is used to summarize your data by time period.9. Use the Group results by option to organize the table by the values in the columns you select.
10. Click Submit to return to the Add Report page.
Build conditions
Use the Dynamic Query Builder selection when objects may change over time. For example, as your network ages, you will replace or upgrade various pieces of equipment. You can select each piece of equipment individually, or you can create a dynamic query that adds objects to the custom chart or table based on the properties you select.
The Advanced Selector provides access to all network object characteristics, and the Basic Selector provides access to a smaller subset of the most frequently used network object characteristics.
1. Select the type of selector query you want to use (Basic or Advanced).
2. Select the type of objects to report on from the I want to report on drop-down menu.
3. For the Basic Selector:a. Click Add Condition.b. Select All child conditions must be satisfied (AND) or At least one child condition must be
satisfied (OR).c. Select a property of the monitored object, a conditional relation, and provide a value.d. Click Add Simple Condition if you want to add another condition.
4. For the Advanced Selector:a. Select All child conditions must be satisfied (AND) or At least one child condition must be
satisfied (OR).b. Select which field you want to evaluate, a conditional relation, and provide a value.
c. Click the + sign to add child conditions. n Add Single Value Comparison (Recommended) - The child condition evaluates a single
field, like Status n Add Double Value Comparison - The child condition evaluates two conditions, such as
Status and OS n Add And/Or block - Adds a sub condition block
Restrict who can access reports
Use report limitation categories to limit access to any SolarWinds report created on SolarWinds Orion Platform versions 2013.1 and later. Users with a report limitation category set can only see reports that are in the same report limitation category.
232

The No Reports limitation is a special report limitation category that removes all access to reports when applied to a user account. You do not need to add No Reports as a limitation in the report properties.
n If you are running SolarWinds Orion Platform versions 2012.2.X or earlier, reports are stored in a folder on the primary SolarWinds server (default location C:\ProgramFiles\SolarWinds\Orion\Reports). Place reports into subfolders and restrict user access to the file system to limit user access.
n If you are running SolarWinds Orion Platform version 2013.1.X or later, reports are stored in the SolarWinds database, and both users and reports may be assigned a report limitation category to restrict who can access the report.
Create or add a report limitation category
When you create or edit a report, expand Report Limitation on the Properties page to add a report limitation. Choose an existing limitation or enter a new one.
Each report can have only one limitation.
After the report limitation is created and the report saved, the limitation is available in the user settings.
Restrict user access to the report
After the report limitation is saved, it is available in the user account's Define Settings page.
In the Report Limitation Category, select the limitation, and save your changes.
Generate reports on a schedule
Schedules enable you to set up report actions to occur at specific times. These actions let you generate reports and print them, save them to disk, or email them to selected recipients. You can create schedules for single or multiple reports, or assign reports to existing schedules. In addition, you can add URLs to the schedules so that screen captures of specific websites at the time the reports were generated are included.
n Reports can be assigned to schedules when they are being edited, created, or in the Schedule Manager.
n Schedules can be created from the Report Manager, the Schedule Manager, or when you create or edit a report.
Schedule a report to run automatically while creating or editing a report
You can directly assign a report to a schedule while editing the report.
1. Navigate to the Schedule Report page.
2. Click Schedule this report to run regularly, and select Create new schedule.
233

3. Click Add Frequency, and then select when you want to run the report.
Click Add Time to select additional dates and times.
n To delay when the report runs, select Specific Date in the Starting On field, and then select the date and time when you want the schedule to start.
n To stop the report from running automatically, select Ending On, and then select the date and time when you want the schedule to end.
4. Click Add Frequency.
5. Click Add Action, and select the action (Email, Print, or Save to Disk) to be executed on the configured schedule.
6. Click Configure Action.
n For email actions, enter the recipients, the message, and the SMTP server.Select Include Report's URL to allow recipients to access the report remotely.
n For print actions, enter the Windows credentials necessary to access your printer, the printer, and print settings.
n For save actions, enter the location you want to save the report to, the credentials in domain\username format, and the file type you want to save the report as. The location must be accessible from the Orion Web Console server.
7. Click Add Action.
The action is added to the Actions list. You can add multiple actions.
Create and assign report schedules in Report Manager
The Report Manager provides a list of all reports that have been set up for your SolarWinds Orion web-based reports. You can create schedules and assign reports to schedules.
Create a report schedule
1. Select a report.
2. Click on Schedule Report > Create New Schedule to display the Properties view.
3. Add additional reports to this schedule by clicking Assign another Report.
4. Click Assign Webpage to include a snapshot of the selected website, and enter the URL in the field displayed. You can assign multiple webpages.
Start each URL with http:// or https://.
5. Expand Advanced Settings to specify a user account so that its limitations are applied to this schedule. Click Another User, and enter the User name or Account ID and Password.
6. Click Next to display the Frequency view.
7. Click Add Frequency, and then select when you want to run the report.
Click Add Time to select additional dates and times.
n To delay when the report runs, select Specific Date in the Starting On field, and then select the date and time when you want the schedule to start.
n To stop the report from running automatically, select Ending On, and then select the date and time when you want the schedule to end.
234

8. Click Add Frequency, and then click Next to display the Actions view.
9. Click Add Action, and select the action (Email, Print, or Save to Disk) to be executed on the configured schedule.
10. Click Configure Action.
n For email actions, enter the recipients, the message, and the SMTP server.Select Include Report's URL to allow recipients to access the report remotely.
n For print actions, enter the Windows credentials necessary to access your printer, the printer, and print settings.
n For save actions, enter the location you want to save the report to, the credentials in domain\username format, and the file type you want to save the report as. The location must be accessible from the Orion Web Console server.
11. Click Add Action.
12. Click Next to display the Summary view.
13. If the schedule summary is correct, click Create Schedule.
The schedule is displayed in the Schedule Manager.
Assign a report to a schedule or multiple schedules
1. Select one or more reports.
2. Click Schedule Report > Assign Existing Schedule.
3. Select the schedule or schedules in the Assign existing schedule list and clicking Assign Schedule(s) to confirm that you want to assign the report.
Schedule reports from the Schedule Manager
The Report Scheduler provides a list of all report schedules that have been set up for your SolarWinds Orion web-based reports. You can create, edit, run and delete schedules from this page, and assign reports to schedules.
1. Click Reports > All Reports in the menu bar, and then click Manage Reports in the upper right.
2. Click the Schedule Manager tab.
3. Click Create New Schedule to add a new schedule. 4. Select the schedule and click Run Now. The selected schedule runs, which includes the associated
reports and report actions.
5. Select the schedule and click Assign to a Report.
235

Export reports
The most appropriate format for exporting a report depends on how you want to use the exported file. The different formats in which reports can be exported are shown below. The most common formats for exporting reports have their own icons on the Orion Web Console report page. Report Writer is a legacy feature that you can access on your SolarWinds Orion server. For more information about Report Writer, see Export reports from Report Writer.
Formats Orion Web Console Report Writer
XML a
Excel a a
PDF a a
HTML and MHTML a
Image (BMP, GIF, JPG, PNG, etc.) a
Export reports as XML
You can save reports from the Orion Web Console in XML format and import them back.
1. Click Reports > All Reports in the menu bar, and click Manage Reports in the upper right corner.
2. Display the web-based reports.
3. Click the report > Export/Import, and then click Export Report.
4. Click Save.
Import XML reports
If you import a report with the same name as an existing report, it will be prefixed with "Copy of".
1. Click Reports > All Reports in the menu bar, and click Manage Reports in the upper-right corner.
2. Display the web-based reports.
3. Click Export/Import, and then click Import Report.
4. Navigate to the required XML file on a network drive, and then click Open.
5. The file will be imported and its name displayed at the top of the list of reports.
Export Excel and PDF reports from the Orion Web Console
You can view and edit Excel files as spreadsheets. You can create read-only files using the PDF export that retain the exact formatting used in the original report.
1. Click Reports > All Reports in the menu bar, and click Manage Reports in the upper-right corner.
2. Open the report.
3. Click either Export as Excel or Export as PDF.
236

The Export to Excel button is only displayed if the report contains only custom table resources. Other resources cannot be converted to the Excel format.
Modify legacy reports in Report WriterBefore using Report Writer, you must collect some data in a database populated with devices you want to monitor. A variety of reports are included with Report Writer, and icons that precede report names distinguish available report types. The following procedure starts Report Writer.
1. Click Start > All Programs > SolarWinds Orion > Alerting, Reporting, and Mapping > Report Writer.
2. Click File > Settings.
3. In the General tab of the Report Writer Settings window, select either of the following as a default viewing mode:
You can toggle between Preview and Report Designer modes at any time by clicking Preview or Design in the toolbar.
n Preview displays the report as it will appear in printed form. For more information, see Report Writer Preview Mode.
n Report Designer is the report creation and editing interface. For more information, see Report Writer Design Mode.
4. Separate the data for individual network objects with horizontal lines by clicking Report Style, and then selecting Display horizontal lines between each row.
5. Click OK to exit Report Writer Settings.
For more information about creating reports in Report Writer, see Create and modify reports in Report Writer.
Report Writer Preview Mode
Preview mode shows a report as it will print. When you open a report in Preview mode, or switch to Preview mode from Design mode, the query to generate the report runs, and then Report Writer displays the results.
n Current page number and total number of pages in the report.
n Page navigation buttons: First Page, Page Up, Page Down, and Last Page
n Zoom views
Double-click a preview to zoom in and double-right-click to zoom out.
n Print report
Report Writer Design Mode
Use Design mode to create new reports and modify or rename existing reports. The options available for creating and modifying reports are the same. Design mode options are also dynamic, based upon the type of report, included report data, and report presentation. The options available depend on the type of report being designed, but all reports require that you select the data to include and decide how that data will be sorted, ordered, filtered, and presented.
237

Create and modify reports in Report Writer
Use the following procedure to modify or create reports in Report Writer.
1. Modify an existing report by clicking an existing report from the inventory in the left pane of the main Report Writer window.
2. Click File > New Report to create a new report.
3. Select the type of report that you would like to create, and then click OK.
Each report offers different configuration options. Depending on the report, some formatting tabs described in the following sections may not be available.
n The SQL query used to generate a report may be viewed in an additional tab. Click Report > Show SQL to add a read-only SQL tab to the Design window.
n A preview of your report is also available at any time. Click Preview to enter Preview Mode, and then click Design to return to Design Mode.
Report Writer General Options tab
The General tab is displayed by default, showing titling and display options.
1. Specify the Report Group, Report Title, Subtitle, and Description.
If you use an existing report group name, the new report is added to that existing group in the left pane of the main window.
2. Select the display Orientation of your report.
3. If you are configuring a historical report and you do not want to group data by days, clear Group historical data by days.
By default, data in some availability and historical reports is grouped by days when displayed in the Orion Web Console. Data grouping by days is not viewable in Report Viewer.
4. If you do not want to make this report available on your Orion Web Console, clear Make this Report available from the Orion website.
By default, most reports are made available for display in the Orion Web Console.
Report Writer Select Fields Options tab
Select the data fields in a report.
1. Click Select Fields.
2. If you are creating a new report or adding fields to an existing report, click the ellipsis, select Add a new field, and then dynamically define each new report field.
a. Click the asterisk after Field, and then select the type of information to include in the current report field.
b. To sort the data in the current field, click the sort asterisk and select a sort order. c. To perform an operation on the data in the current field, click the function asterisk and select
an operation.
238
3. If you are modifying an existing report, click the Field, sort, or function that you want to change and select a new value.
a. Click the asterisk after Field. b. Select the type of information to include in the current report field. c. To sort the data in the current field, click the asterisk after Sort and select a sort order. d. To perform an operation on the data in the current field, click the asterisk after Function and
select an operation.
4. To test that your selections will give you the results you want, click Execute SQL Query to view the current query results.
5. To delete a field or rearrange the order of the fields that are listed in your report, select a field, click Browse, and then select the appropriate action.
Cleared fields are not displayed in your report, but their sort and function configurations are retained.
6. To preview your report, click Preview.
Report Writer Filter Results Options tab
Use the Filter Results tab to generate filter conditions for field data by selecting appropriate descriptors from the linked context menus.
1. Click Browse, and then select from the following options: n Select Add a new elementary condition to generate a condition based on a direct comparison
of network object data fields. n Select Add a new advanced elementary condition to generate a condition based on a
comparison of device data fields and values. n Select Add a new complex condition to define a condition that filters other defined
conditions. n Select Delete current condition to remove a selected condition. n Select Move current condition forward or Move current condition backward to change the
order of your conditions.
The lists of available linked descriptors are dynamically generated in consideration of all other variables within the same condition.
2. Select individual filter conditions to enable them in your report.
Report Writer Top XX Records Options tab
You can limit the number of records shown in your report to either a top number or a top percentage of all results. Top XX options are configured as shown below.
1. To show all records in your report, select Show All Records. 2. To specify a truncated list of eligible items for your report, complete the following steps:
a. Select either Show only the Top number Records or Show the Top percentage % of Records. b. Provide appropriate number or percentage values.
239

Report Writer Time Frame Options tab
You can limit the scope of your report to a specific period of time. To configure Time Frame options, select a Named, Relative, or Specific Time Frame, and then select or provide required values.
l If you receive a SQL Timeout error message, you may edit the timeout setting in the SWNetPerfMon.db file. By default, this file is located in the C:\Program Files\SolarWinds\Orion directory.
l Because the Relative Time Frame is continuously variable, reports run with it may show different results, even if they are run close together in time.
Report Writer Summarization Options tab
You can generate summaries of your results over specific periods of time using the Summarization tab.
1. If you do not want to summarize your results, confirm that Do not Summarize the Results is selected.
2. If you want to summarize your results, complete the following steps: a. Select Summarize the Results by Hour, Date, Month, and so on, and then select the
summarization period. b. Specify the location of the summary field for your report. c. Select a location for the Summary Date/Time field.
Report Writer Report Grouping Options tab
Use the Report Grouping tab to group results by field descriptor within your report. Add, edit, and delete report groups to organize the data in your report. Establish and edit report groups as follows.
1. To add a new report group, select a field from the list to define your group, and then click Add Report Group to add your selected field to the Report Groups list.
2. To edit an existing report group, select the field from the Report Groups list, and then click Edit Report Group.
3. The following options may be changed as needed:
n The Group Header is the text that designates groups on your report. n The Web URL is the dynamic location of your published report with respect to your Orion
Web Console. n Font size, face, color, and background may all be modified by clicking associated ellipses. n Alignment may be left, center, or right. n Select Transparent Background for better results when publishing your report to the Web.
4. To change the grouping order, use the up and down arrows to change the grouping order.
Report Writer Field Formatting Options tab
Use the Field Formatting tab to customize the format of the various results fields in your report. To format results fields, select the field you want to format, and then edit labels and select options.
n The formatting options available for each field may be different according to the nature of the
240

data contained in that field.
n Select Hidden Field to hide any field in your report.
n To view your changes at any time, click Preview.
Customize report headers and footers with Report Writer
To add your company logo as the report header and footer, save your logo as Header.jpg in the SolarWinds\Common\WebResources folder, typically located in C:\Program Files\, and then click Refresh.
The image must be in JPEG format with a height of no more than 150 pixels.
Allow access to restricted Report Writer reports
SolarWinds Report Writer reports respect Orion Web Console account limitations. For security, reports are not available to users with limited accounts unless an SolarWinds Orion administrator specifically provides access.
For more information, see Create users and Restrict user access to network areas by applying limitations.
1. Open the Orion Reports folder.
All reports created or predefined in Report Writer are, by default, stored, in C:\Program Files\SolarWinds\Orion\Reports.
2. Create a new folder using the name of the account-limited user.
3. Copy the reports you want the account-limited user to see from the Orion Reports folder into the new, account-limited user folder.
4. Log in to the Orion Web Console as an administrator.
5. Click Settings > All Settings in the menu bar.
6. Click Manage Accounts in the Accounts grouping of the Orion Website Administration page.
7. Select the account-limited user, and then click Edit.
8. In the Reports section, select the Orion Reports folder you created in the Report Limitation Category list.
9. Click Submit.
Export reports from Report Writer
Report Writer provides an export menu that enables you to save your report in all formats listed in Export reports except XML. To export to XML, you need to use the SolarWinds Orion Web Console.
1. Click Start > All Programs > SolarWinds Orion > Alerting, Reporting and Mapping > Orion Report Writer.
2. Click the report you want to export.
3. Click File > Export.
241

4. Click the required file format.
5. Type a name for the exported file.
6. Click Save.
242


![CERTIFICATION REPORT - Common Criteria...File: 2016-41 SolarWinds Orion Suite for Federal Government V2.0 Applicant: SolarWinds Worldwide, LLC References: [EXT-3152] Certification](https://img.dokumen.tips/doc/110x75/5fef4b35c157905bba2bc7b3/certification-report-common-criteria-file-2016-41-solarwinds-orion-suite.jpg)