Embed Size (px)
Citation preview
Follow SolarWinds:
© 2014, SolarWinds Worldwide, LLC. All rights reserved.
SolarWinds Server &
Application Monitor
(SAM) – Buyers Guide
Follow SolarWinds: 2
Case for Application & Server Monitoring Managing an IT infrastructure and its operations is a tedious process in any organization. In today’s business scenario, organizations are using a variety of applications that are mission critical to improve business operations, customer service, and employee productivity. In order to ensure application performance is never affected, IT pros need to ensure all critical application components are working optimally, as expected by the end user. Components impacting application performance can include hardware, operating system, virtual infrastructure, application processes & services, databases and storage resources. Organizations that have implemented automated server & application monitoring tools have experienced improved application availability, reduced MTTR (mean time to repair) and improved operational efficiencies. Even in an environment of financial prudence, organizations are finding a strong business case for investing in server management and monitoring software today. Server and application management and monitoring benefits are typically realized across a number of areas that can be segmented into the following:
Complete Visibility in to Server & Application Performance
Gaining visibility of all application resources and having an integrated approach to application and server performance is a key strategy for any organization. In some cases, organizations make the investment to increase server resources or upgrading other elements within the application and the underlying performance issue still doesn’t go away. Deep performance monitoring tools can reduce the hassle of wasting several man hours and directly point you to the root cause of the issue.
Reduced Application Downtime
Application downtime can be directly quantified by simply calculating the cost of the time an IT admin or multiple administrators spend troubleshooting and resolving the cause of downtime. This cost, however, is simply the tip of the iceberg as far as the total cost of application downtime is concerned. Lost employee productivity, lost revenue, and lost customer goodwill are examples of costs that are harder to calculate, but have a much greater impact.
Reduction in Support Calls
Server management and monitoring solutions alert IT admins and support teams to potential problems before users start to complain and generate support calls. The cost of support calls can be easily calculated by looking at the number of calls per week, the time to resolve a support call, and the cost per hour of support time. By reducing the number of support calls through proactive monitoring and management of the servers and application, you will be able to directly quantify the cost savings.
Follow SolarWinds: 3
Decreased Time-to-Resolution
Time-to-resolution is the amount of time it takes to resolve an issue once the IT admin is notified. Server monitoring and management systems with real-time diagnostic data can greatly reduce the amount of time required to troubleshoot and pinpoint the source of an issue.
Managing Service Level Agreements
IT operations teams are typically held to or measured against a quantifiable service level agreement (SLA) that’s typically a percentage of application uptime. This SLA can be an internal or external SLA with your service provider as an example. If server and application availability is directly attributable to a company’s revenue (i.e. an on-line store), then the cost of downtime can be easily measured based on the average revenue that would have been generated during the downtime.
The Cost of Systems Management
The cost of systems management is comprised of a number of different elements that combine to provide a total cost of ownership (TCO).
License Cost
Server and application monitoring and management solutions can be licensed perpetually (one time license fee). The number of devices, nodes, application components, or volumes that are being monitored and managed typically determines licensing costs.
Product Maintenance, Support, and Upgrades
These costs are typically optional, but need to be factored into the TCO. Product maintenances are typically required to obtain customer support and product upgrades.
Dedicated Hardware or Software
Acquisition of hardware and software, such as a server or appliance that’s required to run a solution can come with a high price tag. There may also be additional software components, such as database software (SQL), virtualization software, or Windows licenses.
Installation/Implementation/Consulting
In some cases, the cost of installation, implementation, and fine-tuning of the solution can be as high as or higher than the cost of the up-front license.
Follow SolarWinds: 4
Training
Determine if there are any training costs in order to implement or operate the solution. Training costs need to include both the initial training costs, as well as any on-going instruction that will be required as staff is turned over.
Solution Management
The cost of any staff that’s dedicated, full or part time, to the solution needs to be applied to the overall cost.
What to Look For in a Server & Application Management System
There are dozens of free or commercially licensed server and application management systems that vary in terms of price and functionality available to monitor and troubleshoot application performance. Below are some basic guidelines on picking the right solution for your needs:
In-depth Application Monitoring
Organizations that are running a Microsoft® environment will use applications, such as SQL Server®, Exchange, and Active Directory® for in depth monitoring of database performance, mailbox services, and directory services. Your monitoring tool should be able to monitor and manage various applications and offer comprehensive performance stats. In addition, it’s an added advantage if your monitoring tool can diagnose issues with applications that are running in virtual machines, both in a VMware® and Hyper-V® environment.
Operating System Performance and Availability
The operating system (OS) is the pillar of every computing platform. Everything runs on top of the OS. Ensuring the OS is configured and performing optimally must always be a top priority. It’s critical for IT admins to monitor processes, and recording the status of CPUs, memory, and components in real-time.
Server Hardware Status
Issues with server hardware can affect applications performance. At the same time, hardware wear-and-tear from continuous use can degrade system performance. A monitoring tool should possess the capability to identify potential hardware status related to the server’s memory, power supply, fan speed, CPU temperature, hard drive, array controller, voltage regulator, etc. It’s important to identify hardware status early on because it will allow you to repair any failing components or move workloads to new systems before issues impact business functions and performance.
Multiple Vendor Application and Hardware Support
It would be very difficult in this day and age to find an organization that consists of equipment from a single vendor. While all vendors provide some type of tool or utility that will manage and monitor their own
Follow SolarWinds: 5
equipment, it’s critical that you look for a tool that allows you to monitor all of your applications and servers (physical and virtual) from different vendors in a single pane of glass.
Real-time and Historical Analysis Capabilities
Although most problems in a server directly relate to how the application is being operated right now, the only effective way to ascertain today’s behaviors is to view them in comparison with yesterdays or last week’s performance.
Visualizations Accessible from Anywhere
As an IT administrator, you’re not always sitting in your office. Problems and issues tend to pop up all across the network, some of which require on-site support. In these cases, having visualizations that can be accessed from anywhere—for example, using a standard Web browser—gives you the ability to take your solution wherever the problem exists.
Drill-down Support
With drill-down support it’s possible to quickly move from the highest-level view down into specific problems as needed. Drill-down support reduces on-screen clutter, enabling a single-glimpse and high-level view during periods of nominal activity.
Scalability & Extensibility
As the number of applications you use grows and evolves in complexity, so too will your need for server and application monitoring and management tools. Look for a software that provides the ability to add additional functionality, such as website performance monitoring, virtualization management, and network performance monitoring. Additionally, make sure that the tool you choose is capable of scaling in size to support your growing application needs.
Affordability
Lastly, any solution used in troubleshooting and resolving issues must cost less than the amount of benefit it provides. Expensive solutions take longer to pay for themselves and may be more difficult to obtain in a time of shrinking IT budgets. Finding the tool that meets your needs at an acceptable cost is important to gaining the biggest return on your investment.
Reporting & Alerting
Get notified immediately when there’s an issue with threshold breach alerts, zombie processes, and other application related issues. The key to effectively troubleshoot performance issues is finding the root cause quickly so the problem can be resolved in a timely manner. Having a proactive alerting system will ensure you’re
Follow SolarWinds: 6
notified at that very instant. In addition, you should also be able to generate reports on the alerts you receive, historical performance data, server and application inventory, etc.
SolarWinds® Server & Application Monitor
SolarWinds Server & Application Monitor (SAM) is an agentless server monitoring software that provides monitoring, alerting, and server management capabilities. Server & Application Monitor is an easy-to-use server monitoring software that supports multiple hardware vendors, including Dell®, HP®, and IBM® servers. Server & Application Monitor offers powerful application availability and performance monitoring for over 150 applications so you can detect issues before your business services go down.
Application Performance & Availability Management
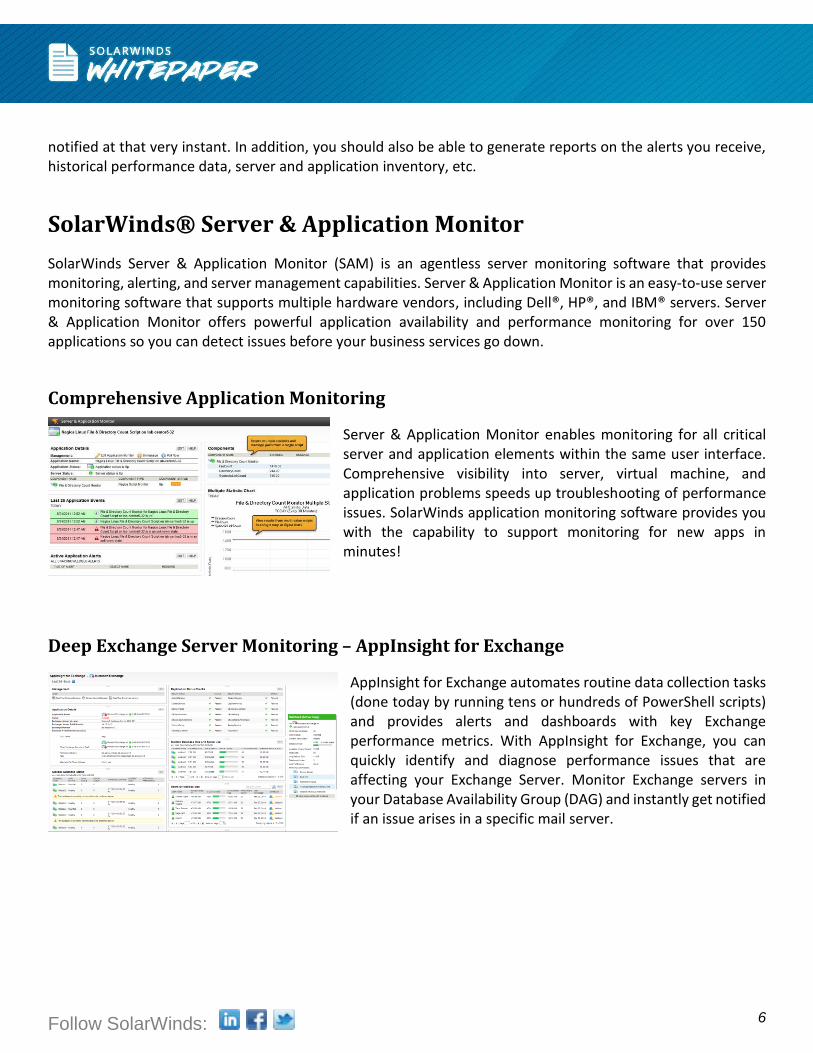
Comprehensive Application Monitoring
Server & Application Monitor enables monitoring for all critical server and application elements within the same user interface. Comprehensive visibility into server, virtual machine, and application problems speeds up troubleshooting of performance issues. SolarWinds application monitoring software provides you with the capability to support monitoring for new apps in minutes!
Deep Exchange Server Monitoring – AppInsight for Exchange
AppInsight for Exchange automates routine data collection tasks (done today by running tens or hundreds of PowerShell scripts) and provides alerts and dashboards with key Exchange performance metrics. With AppInsight for Exchange, you can quickly identify and diagnose performance issues that are affecting your Exchange Server. Monitor Exchange servers in your Database Availability Group (DAG) and instantly get notified if an issue arises in a specific mail server.
Follow SolarWinds: 7
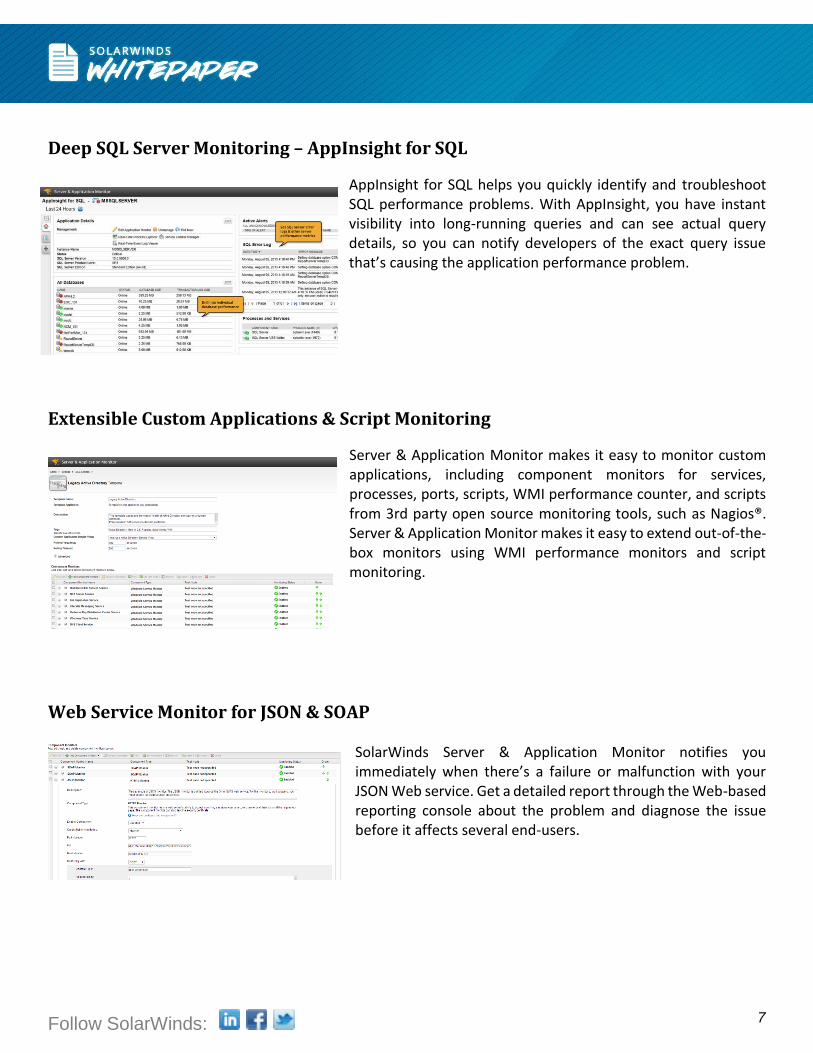
Deep SQL Server Monitoring – AppInsight for SQL
AppInsight for SQL helps you quickly identify and troubleshoot SQL performance problems. With AppInsight, you have instant visibility into long-running queries and can see actual query details, so you can notify developers of the exact query issue that’s causing the application performance problem.
Extensible Custom Applications & Script Monitoring
Server & Application Monitor makes it easy to monitor custom applications, including component monitors for services, processes, ports, scripts, WMI performance counter, and scripts from 3rd party open source monitoring tools, such as Nagios®. Server & Application Monitor makes it easy to extend out-of-the-box monitors using WMI performance monitors and script monitoring.
Web Service Monitor for JSON & SOAP
SolarWinds Server & Application Monitor notifies you immediately when there’s a failure or malfunction with your JSON Web service. Get a detailed report through the Web-based reporting console about the problem and diagnose the issue before it affects several end-users.
Follow SolarWinds: 8
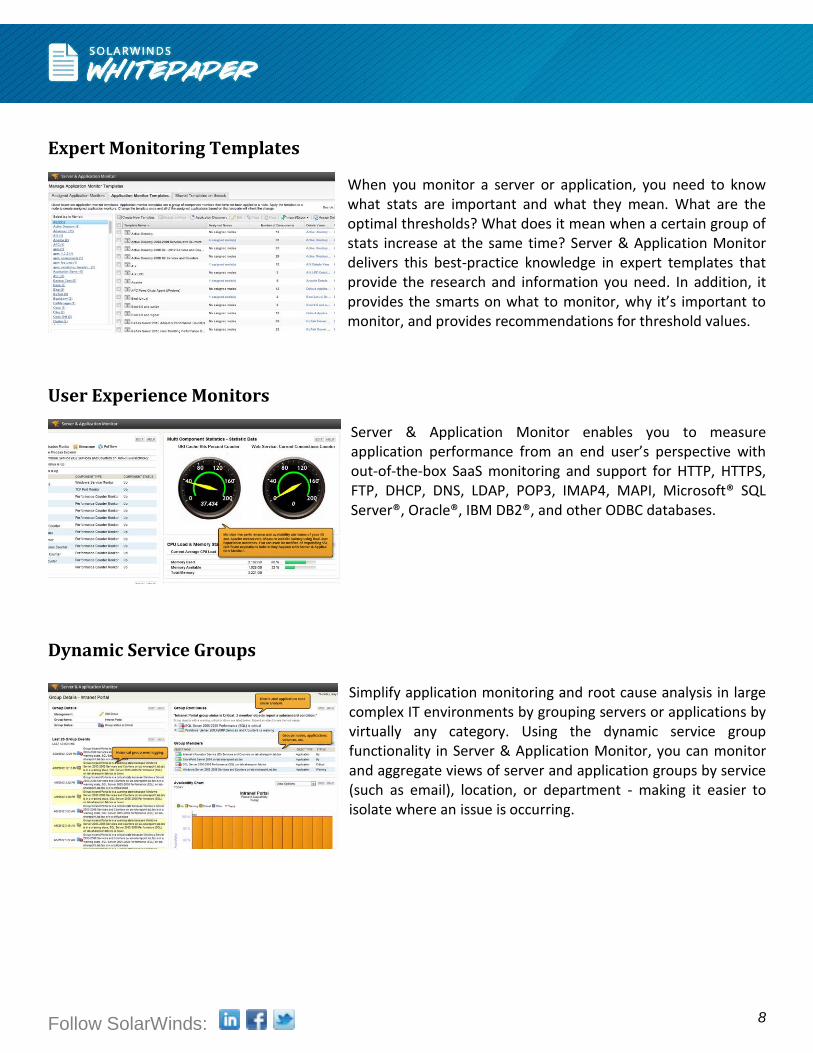
Expert Monitoring Templates
When you monitor a server or application, you need to know what stats are important and what they mean. What are the optimal thresholds? What does it mean when a certain group of stats increase at the same time? Server & Application Monitor delivers this best-practice knowledge in expert templates that provide the research and information you need. In addition, it provides the smarts on what to monitor, why it’s important to monitor, and provides recommendations for threshold values.
User Experience Monitors
Server & Application Monitor enables you to measure application performance from an end user’s perspective with out-of-the-box SaaS monitoring and support for HTTP, HTTPS, FTP, DHCP, DNS, LDAP, POP3, IMAP4, MAPI, Microsoft® SQL Server®, Oracle®, IBM DB2®, and other ODBC databases.
Dynamic Service Groups
Simplify application monitoring and root cause analysis in large complex IT environments by grouping servers or applications by virtually any category. Using the dynamic service group functionality in Server & Application Monitor, you can monitor and aggregate views of server and application groups by service (such as email), location, or department - making it easier to isolate where an issue is occurring.
Follow SolarWinds: 9
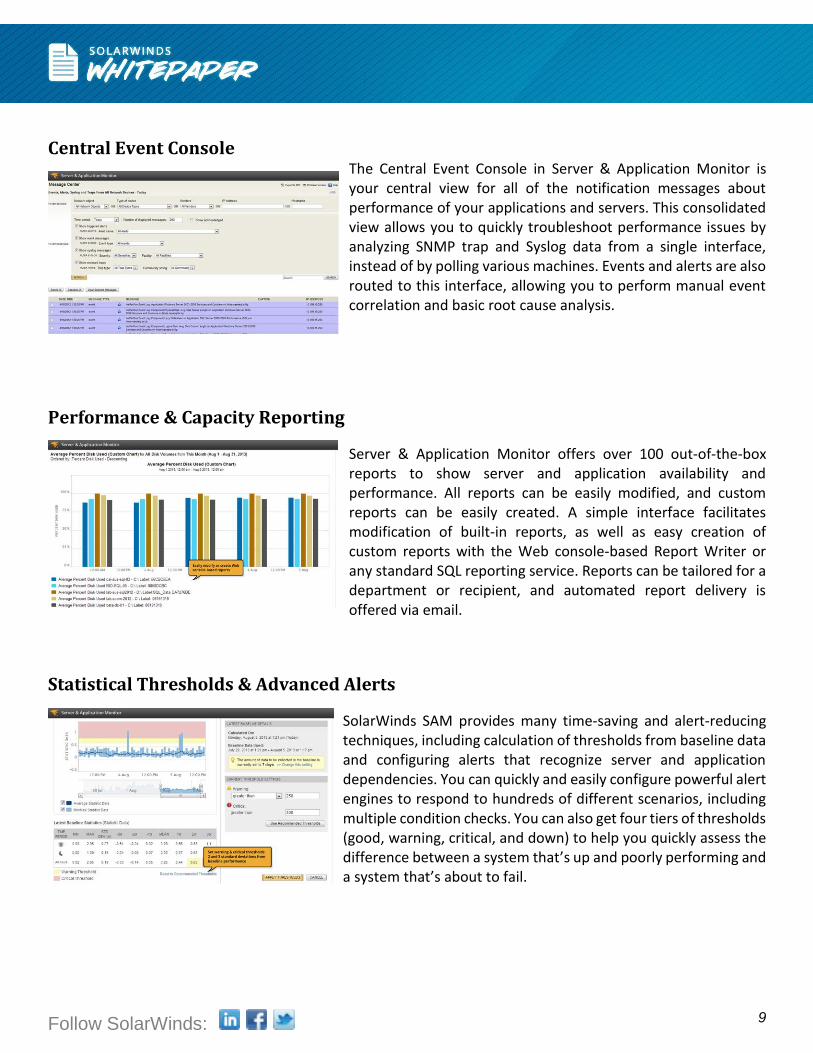
Central Event Console The Central Event Console in Server & Application Monitor is your central view for all of the notification messages about performance of your applications and servers. This consolidated view allows you to quickly troubleshoot performance issues by analyzing SNMP trap and Syslog data from a single interface, instead of by polling various machines. Events and alerts are also routed to this interface, allowing you to perform manual event correlation and basic root cause analysis.
Performance & Capacity Reporting
Server & Application Monitor offers over 100 out-of-the-box reports to show server and application availability and performance. All reports can be easily modified, and custom reports can be easily created. A simple interface facilitates modification of built-in reports, as well as easy creation of custom reports with the Web console-based Report Writer or any standard SQL reporting service. Reports can be tailored for a department or recipient, and automated report delivery is offered via email.
Statistical Thresholds & Advanced Alerts
SolarWinds SAM provides many time-saving and alert-reducing techniques, including calculation of thresholds from baseline data and configuring alerts that recognize server and application dependencies. You can quickly and easily configure powerful alert engines to respond to hundreds of different scenarios, including multiple condition checks. You can also get four tiers of thresholds (good, warning, critical, and down) to help you quickly assess the difference between a system that’s up and poorly performing and a system that’s about to fail.
Follow SolarWinds: 10
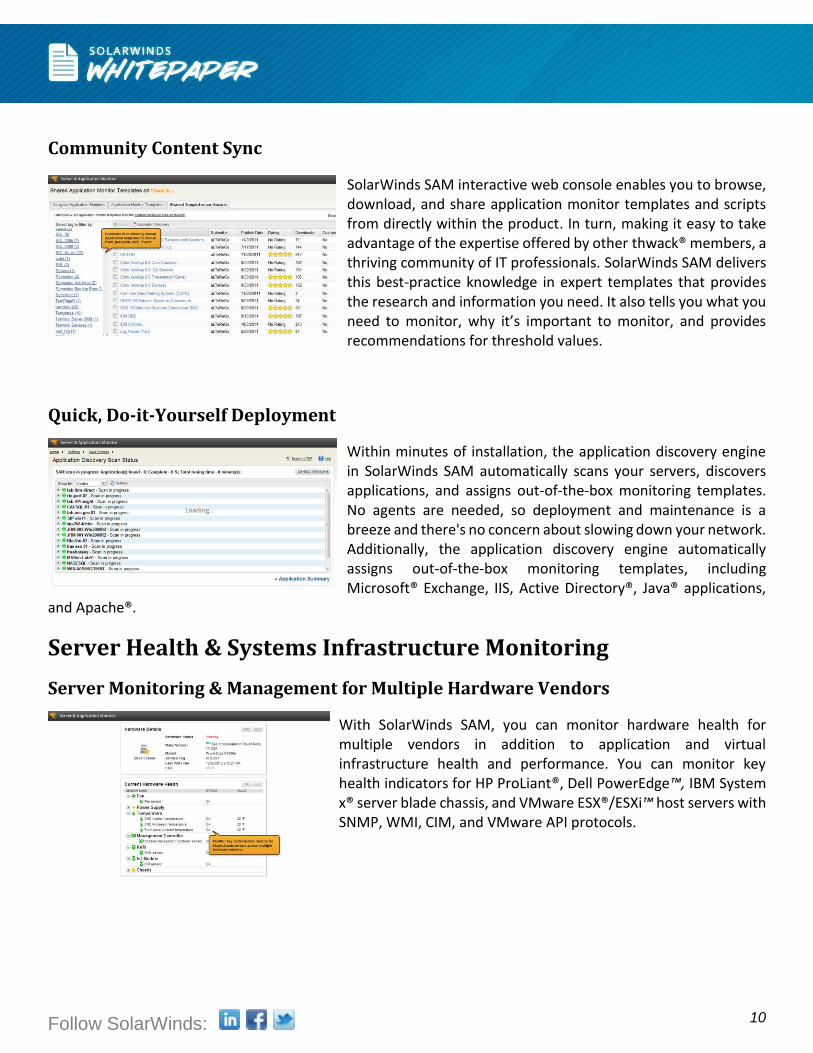
Community Content Sync
SolarWinds SAM interactive web console enables you to browse, download, and share application monitor templates and scripts from directly within the product. In turn, making it easy to take advantage of the expertise offered by other thwack® members, a thriving community of IT professionals. SolarWinds SAM delivers this best-practice knowledge in expert templates that provides the research and information you need. It also tells you what you need to monitor, why it’s important to monitor, and provides recommendations for threshold values.
Quick, Do-it-Yourself Deployment
Within minutes of installation, the application discovery engine in SolarWinds SAM automatically scans your servers, discovers applications, and assigns out-of-the-box monitoring templates. No agents are needed, so deployment and maintenance is a breeze and there's no concern about slowing down your network. Additionally, the application discovery engine automatically assigns out-of-the-box monitoring templates, including Microsoft® Exchange, IIS, Active Directory®, Java® applications,
and Apache®.
Server Health & Systems Infrastructure Monitoring
Server Monitoring & Management for Multiple Hardware Vendors
With SolarWinds SAM, you can monitor hardware health for multiple vendors in addition to application and virtual infrastructure health and performance. You can monitor key health indicators for HP ProLiant®, Dell PowerEdge™, IBM System x® server blade chassis, and VMware ESX®/ESXi™ host servers with SNMP, WMI, CIM, and VMware API protocols.
Follow SolarWinds: 11
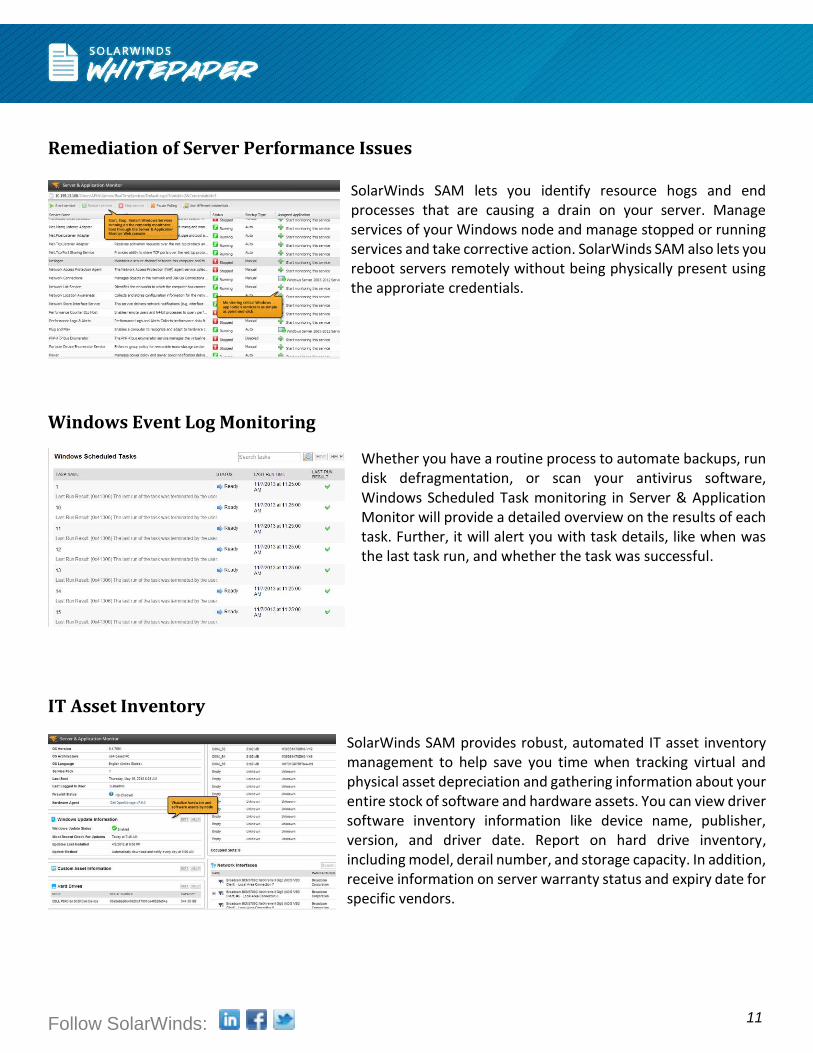
Remediation of Server Performance Issues SolarWinds SAM lets you identify resource hogs and end processes that are causing a drain on your server. Manage services of your Windows node and manage stopped or running services and take corrective action. SolarWinds SAM also lets you reboot servers remotely without being physically present using the approriate credentials.
Windows Event Log Monitoring
Whether you have a routine process to automate backups, run disk defragmentation, or scan your antivirus software, Windows Scheduled Task monitoring in Server & Application Monitor will provide a detailed overview on the results of each task. Further, it will alert you with task details, like when was the last task run, and whether the task was successful.
IT Asset Inventory
SolarWinds SAM provides robust, automated IT asset inventory management to help save you time when tracking virtual and physical asset depreciation and gathering information about your entire stock of software and hardware assets. You can view driver software inventory information like device name, publisher, version, and driver date. Report on hard drive inventory, including model, derail number, and storage capacity. In addition, receive information on server warranty status and expiry date for specific vendors.
Follow SolarWinds: 12
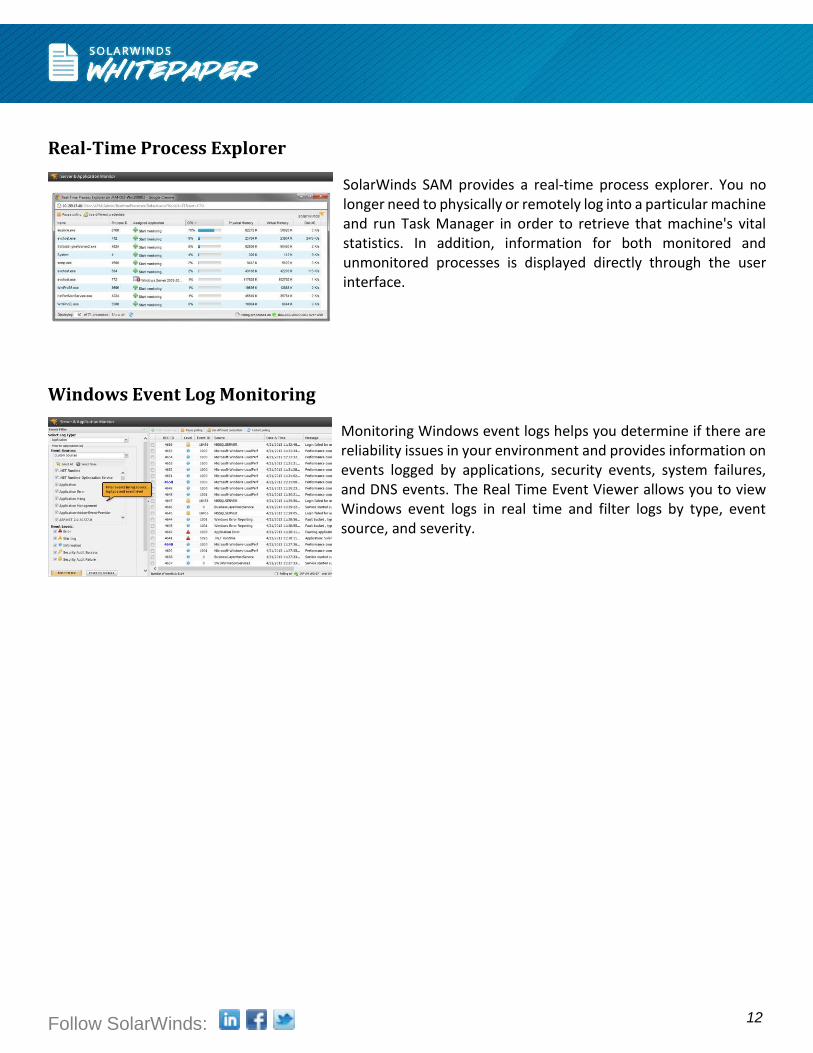
Real-Time Process Explorer
SolarWinds SAM provides a real-time process explorer. You no longer need to physically or remotely log into a particular machine and run Task Manager in order to retrieve that machine's vital statistics. In addition, information for both monitored and unmonitored processes is displayed directly through the user interface.
Windows Event Log Monitoring
Monitoring Windows event logs helps you determine if there are reliability issues in your environment and provides information on events logged by applications, security events, system failures, and DNS events. The Real Time Event Viewer allows you to view Windows event logs in real time and filter logs by type, event source, and severity.
Follow SolarWinds: 13
Scalability
As your IT infrastructure grows, SolarWinds SAM scales to meet your monitoring and management needs with a number of extensions.
Enterprise Operations Console (EOC): EOC delivers a consolidated command center for unified visibility into remote NPM deployments throughout a geographically distributed network.
Additional Polling Engines: By adding additional polling engines, you can distribute the polling load between multiple servers to provide scalability for large IT environments. Failover Engine (FoE): FoE monitors the health of your SolarWinds servers to ensure that you never lose visibility of performance monitored elements in your IT infrastructure. If something should happen to your primary SolarWinds server, the Failover Engine automatically fails over to a remote server. Web Server Engine: By adding an additional web server engine, you can enable more users to access dashboards and reports in the SolarWinds web portal without potential performance degradation.
Extensibility
SolarWinds SAM uses a modular design that allows you to easily add additional functionality as your needs change. Further, it allows you to manage your entire IT infrastructure in a unified web console.
Follow SolarWinds: 14
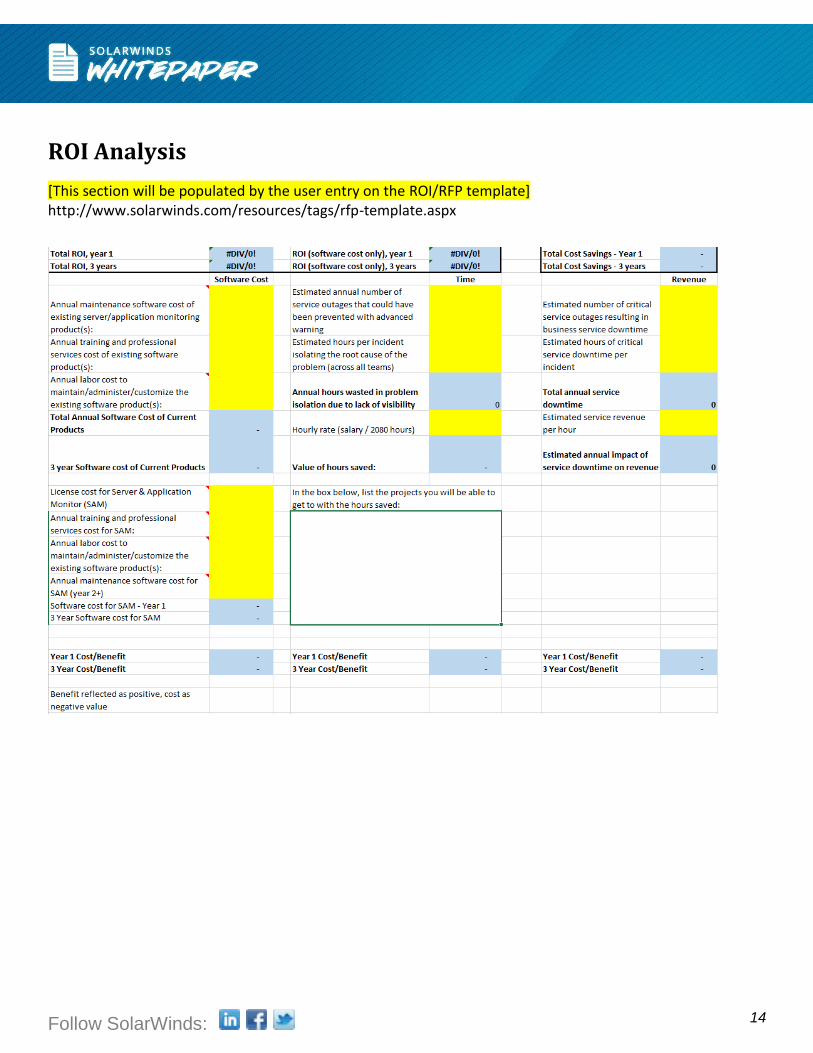
ROI Analysis
[This section will be populated by the user entry on the ROI/RFP template] http://www.solarwinds.com/resources/tags/rfp-template.aspx
Follow SolarWinds: 15
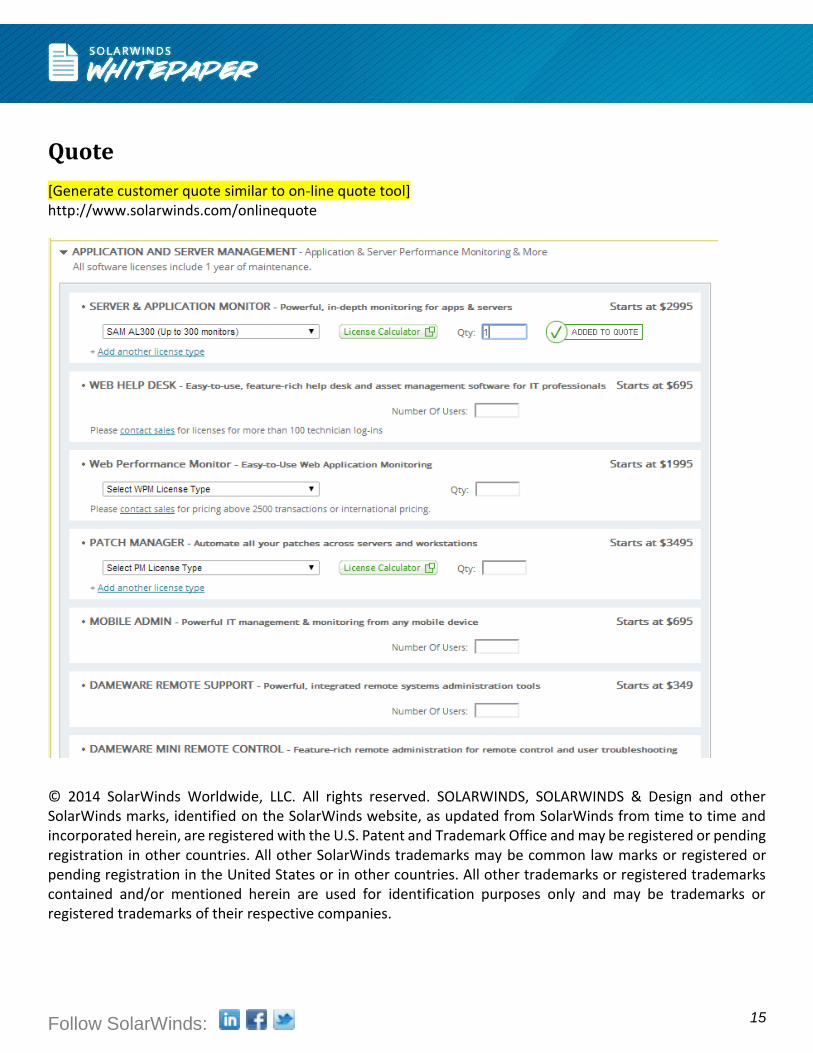
Quote
[Generate customer quote similar to on-line quote tool] http://www.solarwinds.com/onlinequote
© 2014 SolarWinds Worldwide, LLC. All rights reserved. SOLARWINDS, SOLARWINDS & Design and other SolarWinds marks, identified on the SolarWinds website, as updated from SolarWinds from time to time and incorporated herein, are registered with the U.S. Patent and Trademark Office and may be registered or pending registration in other countries. All other SolarWinds trademarks may be common law marks or registered or pending registration in the United States or in other countries. All other trademarks or registered trademarks contained and/or mentioned herein are used for identification purposes only and may be trademarks or registered trademarks of their respective companies.