Embed Size (px)
Citation preview
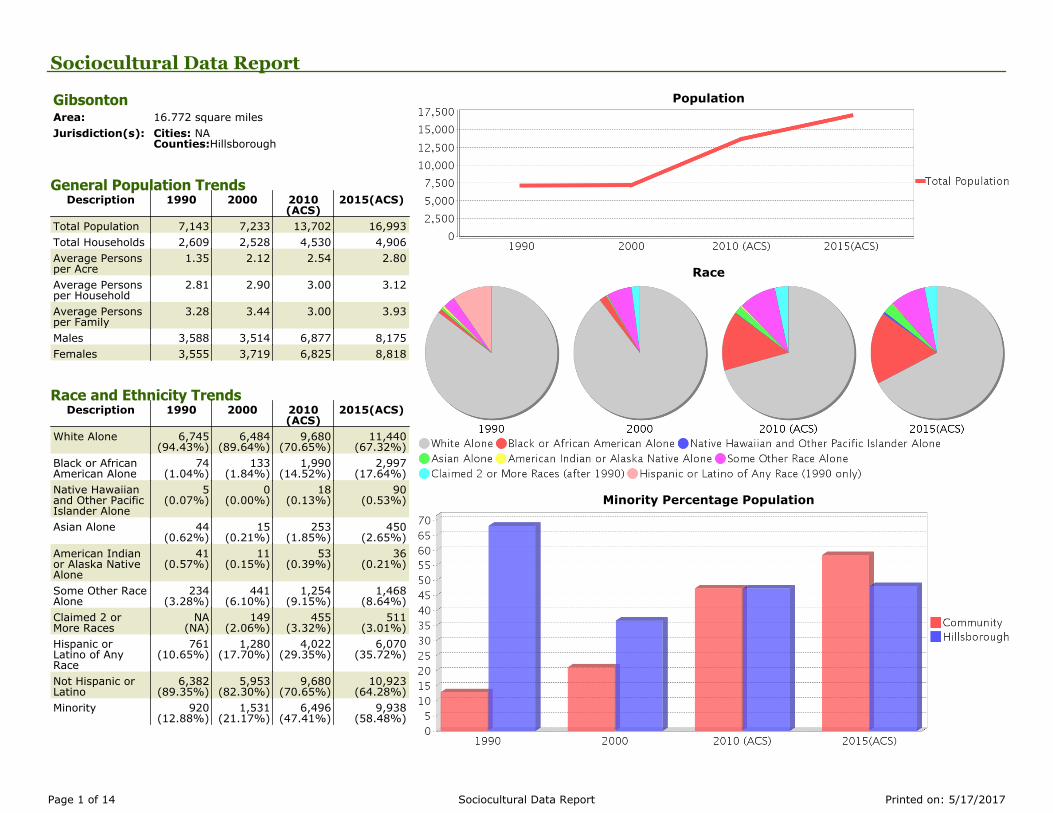
Sociocultural Data Report
GibsontonArea: 16.772 square milesJurisdiction(s): Cities: NA
Counties:Hillsborough
General Population TrendsDescription 1990 2000 2010
(ACS)2015(ACS)
Total Population 7,143 7,233 13,702 16,993Total Households 2,609 2,528 4,530 4,906Average Personsper Acre
1.35 2.12 2.54 2.80
Average Personsper Household
2.81 2.90 3.00 3.12
Average Personsper Family
3.28 3.44 3.00 3.93
Males 3,588 3,514 6,877 8,175Females 3,555 3,719 6,825 8,818
Race and Ethnicity TrendsDescription 1990 2000 2010
(ACS)2015(ACS)
White Alone 6,745(94.43%)
6,484(89.64%)
9,680(70.65%)
11,440(67.32%)
Black or AfricanAmerican Alone
74(1.04%)
133(1.84%)
1,990(14.52%)
2,997(17.64%)
Native Hawaiianand Other PacificIslander Alone
5(0.07%)
0(0.00%)
18(0.13%)
90(0.53%)
Asian Alone 44(0.62%)
15(0.21%)
253(1.85%)
450(2.65%)
American Indianor Alaska NativeAlone
41(0.57%)
11(0.15%)
53(0.39%)
36(0.21%)
Some Other RaceAlone
234(3.28%)
441(6.10%)
1,254(9.15%)
1,468(8.64%)
Claimed 2 orMore Races
NA(NA)
149(2.06%)
455(3.32%)
511(3.01%)
Hispanic orLatino of AnyRace
761(10.65%)
1,280(17.70%)
4,022(29.35%)
6,070(35.72%)
Not Hispanic orLatino
6,382(89.35%)
5,953(82.30%)
9,680(70.65%)
10,923(64.28%)
Minority 920(12.88%)
1,531(21.17%)
6,496(47.41%)
9,938(58.48%)
Population
Race
Minority Percentage Population
Page 1 of 14 Sociocultural Data Report Printed on: 5/17/2017

Age TrendsDescription 1990 2000 2010
(ACS)2015(ACS)
Under Age 5 9.31% 8.97% 10.33% 11.43%Ages 5-17 18.16% 22.09% 20.80% 21.40%Ages 18-21 6.15% 5.07% 5.03% 6.36%Ages 22-29 14.57% 11.81% 12.06% 10.93%Ages 30-39 15.65% 16.52% 17.60% 15.62%Ages 40-49 12.18% 14.12% 13.81% 15.08%Ages 50-64 13.44% 12.93% 13.95% 12.28%Age 65 and Over 10.54% 8.50% 6.44% 6.89%-Ages 65-74 7.04% 5.25% 4.14% 3.80%-Ages 75-84 2.98% 2.86% 1.81% 2.72%-Age 85 and Over 0.52% 0.39% 0.49% 0.36%Median Age NA 33 35 33
Income TrendsDescription 1990 2000 2010
(ACS)2015(ACS)
MedianHouseholdIncome
$23,910 $33,016 $39,263 $32,054
Median FamilyIncome
$25,375 $36,490 $48,011 NA
Population belowPoverty Level
18.77% 18.07% 15.34% 21.53%
Householdsbelow PovertyLevel
17.32% 16.10% 14.68% 19.49%
Households withPublic AssistanceIncome
7.24% 6.65% 4.53% 4.24%
Disability TrendsSee the Data Sources section below for an explanationabout the differences in disability data among the variousyears.
Description 1990 2000 2010(ACS)
2015(ACS)
Population 16 To64 Years with adisability
554(10.68%)
1321(20.08%) (NA) (NA)
Population 20 To64 Years with adisability
(NA) (NA) (NA)1169
(12.04%)
Population by Age Group
Median Age Comparison
Income Trends Poverty and Public Assistance
Page 2 of 14 Sociocultural Data Report Printed on: 5/17/2017

Educational Attainment TrendsAge 25 and Over
Description 1990 2000 2010(ACS)
2015(ACS)
Less than 9thGrade
576(13.43%)
512(11.82%)
496(6.54%)
1,079(11.18%)
9th to 12thGrade, NoDiploma
1,399(32.62%)
1,203(27.78%)
1,208(15.94%)
778(8.06%)
High SchoolGraduate orHigher
2,314(53.95%)
2,615(60.39%)
5,875(77.52%)
7,792(80.75%)
Bachelor'sDegree or Higher
121(2.82%)
254(5.87%)
1,258(16.60%)
1,623(16.82%)
Language TrendsAge 5 and Over
Description 1990 2000 2010(ACS)
2015(ACS)
Speaks EnglishWell
122(1.90%)
185(2.81%)
602(5.26%)
769(5.11%)
Speaks EnglishNot Well
NA(NA)
115(1.75%)
471(4.12%)
884(5.87%)
Speaks EnglishNot at All
NA(NA)
106(1.61%)
265(2.32%)
146(0.97%)
Speaks EnglishNot Well or Notat All
196(3.05%)
221(3.36%)
736(6.43%)
1,030(6.84%)
Housing TrendsDescription 1990 2000 2010
(ACS)2015(ACS)
Total 3,006 2,851 5,306 5,598Units per Acre 0.23 0.21 0.40 0.42Single-FamilyUnits
859 964 3,056 3,273
Multi-FamilyUnits
53 46 171 165
Mobile HomeUnits
1,685 1,821 1,902 2,124
Owner-OccupiedUnits
1,664 1,590 2,883 3,018
Renter-OccupiedUnits
945 938 1,648 1,888
Vacant Units 397 323 775 692Median HousingValue
$55,500 $56,250 $124,600 $87,000
OccupiedHousing Unitsw/No Vehicle
305(11.69%)
265(10.48%)
168(3.71%)
219(4.46%)
Housing Tenure
Median Housing Value Comparison
Occupied Units With No Vehicles Available
Page 3 of 14 Sociocultural Data Report Printed on: 5/17/2017

Location Maps
Existing Land UseLand Use Type Acres Percentage
Acreage Not Zoned For Agriculture 957 8.92%Agricultural 545 5.08%Centrally Assessed 0 0.00%Industrial 312 2.91%Institutional 49 0.46%Mining 6 0.06%Other 14 0.13%Public/Semi-Public 2,473 23.04%Recreation 0 0.00%Residential 1,659 15.45%Retail/Office 364 3.39%Row 2 0.02%Vacant Residential 322 3.00%Vacant Nonresidential 44 0.41%Water 0 0.00%Parcels With No Values 199 1.85%
Page 4 of 14 Sociocultural Data Report Printed on: 5/17/2017

The community facilities information below is useful in a variety of ways for environmental evaluations. These community
resources should be evaluated for potential sociocultural effects, such as accessibility and relocation potential. The facility
types may indicate the types of population groups present in the project study area. Facility staff and leaders can be
sources of community information such as who uses the facility and how it is used. Additionally, community facilities are
potential public meeting venues.
Community Boundaries (User defined)
Community Centers (Points)
Fire Stations (Points)
Florida Parks and Recreational Facilities (Points)
Government Building
Law Enforcement Facilities (Points)
Mobile Home Parks in Florida
Public and Private Schools (Points)
Community Facilities
Facility NameRiverviewSouthShoreGibsonton
Facility Name Address Zip CodeWOMEN OF THE MOOSE 9000 HONEYWELL RD 33534MOOSE LODGE 2158 - RIVERVIEW 9000 HONEYWELL RD 33602
Facility Name Address Zip CodeGIBSONTON FIRE DEPARTMENT AND RESCUESTATION 12 8612 GIBSONTON DR 33534
Facility Name Address Zip CodeGOLDEN ASTER SCRUB PRESERVE & TRAILS 12181 EAST BAY RD 33534GARDENVILLE RECREATION CENTER 16400 MORRIS BRIDGE RD 33534MOSAIC PARK 6501 RIVERVIEW DR 33578J B GIBSON PARK 10017 VAUGHN ST 33534VANCE VOGEL PARK 13010 BULLFROG CREEK RD 33534
Facility Name Address Zip CodeU S POST OFFICE - GIBSONTON 11126 S US HWY 41 33534
Facility Name Address Zip CodeHILLSBOROUGH COUNTY SHERIFF'S OFFICEGIBSONTON COMMUNITY STATION 11072 41 HWY S 33534
Facility Name Address Zip CodeBREWER & SONS RENTALS 7026 NUNDY AVE 33534RIVERWOODS MHP 6521 RIVERVIEW DRIVE 33569ALAFIA MOBILE PLAZA 11888 HWY 41 SOUTH 33534EASTWOOD ESTATES 12130 U S 41 SOUTH 33534ALAFIA RIVER DEVELOPMENT MHP 9810 VAUGHN ST 33534NISTAL PARK 11344 US 41 33534BERNHARDT'S MOBILE COURT 9901 SYMMES RD 33534RIVERWALK VILLAGE MHP 8518 GIBSONTON DR 33534
Facility Name Address Zip CodeEAST BAY HIGH SCHOOL 7710 OLD BIG BEND ROAD 33534EISENHOWER MIDDLE SCHOOL 7620 OLD BIG BEND ROAD 33534GIBSONTON ELEMENTARY SCHOOL 7723 GIBSONTON DRIVE 33534
Page 5 of 14 Sociocultural Data Report Printed on: 5/17/2017

Religious Centers (Points)
US Census Places
Facility Name Address Zip CodeGARDENVILLE BAPTIST CHURCH 7010 PAYNE AVENUE 33534FREEDOM ASSEMBLY CHURCH 11525 CORWIN STREET 33534FIRST BAPTIST CHURCH 9912 INDIANA STREET 33534NEW LIFE RESTORATION 6104 MARILLA AVENUE 33534VAUGHN STREET BIBLE CHURCH 10018 VAUGHN STREET 33534IGLESIA MANA DEL CIELO 7017 GIBSONTON DR 33534RIVERSTONE CHURCH 12011 EAST BAY RD 33534
Facility NameGibsontonRiverview
Page 6 of 14 Sociocultural Data Report Printed on: 5/17/2017

The following Census Block Groups were used to calculate demographics for this report.
1990 Census Block Groups120570138007, 120570138003, 120570138004, 120570140012, 120570140011, 120570138008, 120570137006,
120570138005, 120570138001, 120570138002, 120570141038, 120570138006, 120570136009, 120570138009,
120570137005
2000 Census Block Groups120570138013, 120570138032, 120570137024, 120570136011, 120570138042, 120570138011, 120570138012,
120570138022, 120570138052, 120570138041, 120570138021, 120570138053, 120570138031, 120570138033
2010 Census Block Groups120570138011, 120570138071, 120570136041, 120570137024, 120570138061, 120570138031, 120570138021,
120570138012, 120570138041
2015 Census Block Groups120570138021, 120570136041, 120570137024, 120570138061, 120570138031, 120570138011, 120570138071,
120570138012, 120570138041
AreaThe geographic area of the community based on a user-specified community boundary or area of interest (AOI) boundary.
JurisdictionJurisdiction(s) includes local government boundaries that intersect the community or AOI boundary.
Demographic DataDemographic data reported under the headings General Population Trends, Race and Ethnicity Trends, Age Trends,
Income Trends, Educational Attainment Trends, Language Trends, and Housing Trends is from the U.S. Decennial
Census (1990, 2000) and the American Community Survey (ACS) 5-year estimates from 2006-2010 and 2011-2015. The
data was gathered at the block group level for user-specified community boundaries and AOIs, and at the county level for
counties. Depending on the dataset, the data represents 100% counts (Census Summary File 1) or sample-based
information (Census Summary File 3 or ACS).
About the Census Data:User-specified community boundaries and AOIs do not always correspond precisely to block group boundaries. In these
instances, adjustment of the geographic area and data for affected block groups is required to estimate the actual
population. To improve the accuracy of such estimates in the SDR report, the census block group data was adjusted to
exclude all census blocks with a population of two or fewer. These areas were eliminated from the corresponding years'
block groups. Next, the portion of the block group that lies outside of the community or AOI boundary was removed. The
demographics within each block group were then recalculated, assuming an equal area distribution of the population.
Note that there may be areas where there is no population.
Block Groups
Data Sources
Page 7 of 14 Sociocultural Data Report Printed on: 5/17/2017
Use caution when comparing the 100% count data (Decennial Census) to the sample-based data (ACS). In any given
year, about one in 40 or 2.5% of U.S. households will receive the ACS questionnaire. Over any five-year period, about
one in eight households will receive the questionnaire, as compared to about one in six that received the long form
questionnaire for the Decennial Census 2000. (Source: http://mcdc.missouri.edu/pub/data/acs/Readme.shtml)The U.S.
Census Bureau provides help with this process:
http://www.census.gov/acs/www/guidance_for_data_users/comparing_2015/
Use caution when interpreting changes in Race and Ethnicity over time. Starting with the 2000 Decennial Census,
respondents were given a new option of selecting one or more race categories. Also in 2000, the placement of the
question about Hispanic origin changed, helping to increase responsiveness to the Hispanic-origin question. Because of
these and other changes, the 1990 data on race and ethnicity are not directly comparable with data from later censuses.
(Source: http://www.census.gov/prod/2001pubs/c2kbr01-1.pdf;
http://www.census.gov/pred/www/rpts/Race%20and%20Ethnicity%20FINAL%20report.pdf)
The "Minority" calculations are derived from Census and ACS data using both the race and ethnicity responses. On this
report, "Minority" refers to individuals who list a race other than White and/or list their ethnicity as Hispanic/Latino. In other
words, people who are multi-racial, any single race other than White, or Hispanic/Latino of any race are considered
minorities.
Disability data is not included in the 2010 Decennial Census, or the 2006-2010 ACS. This data is available in the 2011-
2015 ACS.
Because of changes made to the Census and ACS questions between 1990 and 2015, disability variables should not be
compared from year to year. For example: 1) With the 1990 data the disabilities are listed as a "work disability" while this
distinction is not made with 2000 or 2015 ACS data; 2) The 2015 ACS data includes the institutionalized population (e.g.
persons in prisons and group homes), while this population is not included in 1990 or 2000; 3) the age groupings changed
over the years.
Please take the following two concerns into account when viewing this data: 1) With the 1990 data the disabilities are
listed as a "work disability" while this distinction is not made with 2000 or 2015 ACS data; 2) The 2015 ACS data includes
the institutionalized population (e.g. persons in prisons and group homes), while this population is not included in 1990 or
2000.
The category Bachelor's Degree or Higher under the heading Educational Attainment Trends is a subset of the category
High School Graduate or Higher.
Income of households. This includes the income of the householder and all other individuals 15 years old and over in the
household, whether they are related to the householder or not. Because many households consist of only one person,
average household income is usually less than average family income.
Income of families. In compiling statistics on family income, the incomes of all members 15 years old and over related to
the householder are summed and treated as a single amount.
Age Trends median age for 1990 is not available. Land Use DataThe Land Use information Indicates acreages and percentages for the generalized land use types used to group parcel-
specific, existing land use assigned by the county property appraiser office according to the Florida Department of
Revenue land use codes.
Community Facilities Data- Assisted Rental Housing Units - Identifies multifamily rental developments that receive funding assistance under federal, state,
and local government programs to offer affordable housing as reported by the Shimberg Center for Housing Studies, University of
Page 8 of 14 Sociocultural Data Report Printed on: 5/17/2017

Florida.- Mobile Home Parks - Identifies approved or acknowledged mobile home parks reported by the Florida Department of Business
and Professional Regulation and Florida Department of Health.- Migrant Camps - Identifies migrant labor camp facilities inspected by the Florida Department of Health.- Group Care Facilities - Identifies group care facilities inspected by the Florida Department of Health.- Community Center and Fraternal Association Facilities - Identifies facilities reported by multiple sources.- Law Enforcement Correctional Facilities - Identifies facilities reported by multiple sources.- Cultural Centers - Identifies cultural centers including organizations, buildings, or complexes that promote culture and arts (e.g.,
aquariums and zoological facilities; arboreta and botanical gardens; dinner theaters; drive-ins; historical places and services;libraries; motion picture theaters; museums and art galleries; performing arts centers; performing arts theaters; planetariums;studios and art galleries; and theater producers stage facilities) reported by multiple sources.
- Fire Department and Rescue Station Facilities - Identifies facilities reported by multiple sources.- Government Buildings - Identifies local, state, and federal government buildings reported by multiple sources.- Health Care Facilities - Identifies health care facilities including abortion clinics, dialysis clinics, medical doctors, nursing homes,
osteopaths, state laboratories/clinics, and surgicenters/walk-in clinics reported by the Florida Department of Health.- Hospital Facilities - Identifies hospital facilities reported by multiple sources.- Law Enforcement Facilities - Identifies law enforcement facilities reported by multiple sources.- Parks and Recreational Facilities - Identifies parks and recreational facilities reported by multiple sources.- Religious Center Facilities - Identifies religious centers including churches, temples, synagogues, mosques, chapels, centers, and
other types of religious facilities reported by multiple sources.- Private and Public Schools - Identifies private and public schools reported by multiple sources.- Social Service Centers - Identifies social service centers reported by multiple sources.- Veteran Organizations and Facilities
Page 9 of 14 Sociocultural Data Report Printed on: 5/17/2017

Hillsborough County Demographic Profile
General Population Trends - HillsboroughDescription 1990 2000 2010
(ACS)2015(ACS)
Total Population 834,054 998,948 1,200,236 1,302,884Total Households 324,872 391,357 462,447 486,078Average Personsper Acre
1.216 1.458 1.751 1.90
Average Personsper Household
2.567 2.508 3.00 2.64
Average Personsper Family
3.106 3.156 3.262 3.375
Males 406,217 488,596 585,512 635,632Females 427,837 510,352 614,724 667,252
Race and Ethnicity Trends - HillsboroughDescription 1990 2000 2010
(ACS)2015(ACS)
White Alone 690,352(82.77%)
750,497(75.13%)
890,392(74.18%)
926,752(71.13%)
Black or AfricanAmerican Alone
110,283(13.22%)
147,966(14.81%)
196,352(16.36%)
216,735(16.64%)
Native Hawaiianand Other PacificIslander Alone
(NA)540
(0.05%)773
(0.06%)1,061
(0.08%)
Asian Alone 11,093(1.33%)
21,571(2.16%)
40,285(3.36%)
48,093(3.69%)
American Indianor Alaska NativeAlone
2,454(0.29%)
4,175(0.42%)
5,523(0.46%)
4,665(0.36%)
Some Other RaceAlone
19,586(2.35%)
46,587(4.66%)
39,276(3.27%)
64,340(4.94%)
Claimed 2 orMore Races (NA)
27,612(2.76%)
27,635(2.30%)
41,238(3.17%)
Hispanic orLatino of AnyRace
106,908(12.82%)
179,637(17.98%)
286,394(23.86%)
339,540(26.06%)
Not Hispanic orLatino
727,146(87.18%)
819,311(82.02%)
913,842(76.14%)
963,344(73.94%)
Minority 568,661(68.18%)
366,644(36.70%)
568,661(47.38%)
627,917(48.19%)
County Population
County Race
Page 10 of 14 Sociocultural Data Report Printed on: 5/17/2017

Age Trends - HillsboroughDescription 1990 2000 2010
(ACS)2015(ACS)
Under Age 5 7.30% 6.77% 6.70% 6.39%Ages 5-17 16.95% 18.46% 17.66% 16.84%Ages 18-21 5.96% 5.33% 5.91% 5.71%Ages 22-29 14.20% 11.31% 11.83% 11.72%Ages 30-39 17.39% 16.38% 13.93% 13.78%Ages 40-49 12.95% 15.22% 15.18% 14.09%Ages 50-64 13.00% 14.57% 17.23% 18.77%Age 65 and Over 12.25% 11.96% 11.56% 12.71%-Ages 65-74 7.41% 6.46% 6.21% 7.19%-Ages 75-84 3.83% 4.20% 3.87% 3.87%-Age 85 and Over 1.00% 1.29% 1.48% 1.65%Median Age NA 35 36 37
Percentage Population by Age Group
Income Trends - HillsboroughDescription 1990 2000 2010
(ACS)2015(ACS)
MedianHouseholdIncome
$28,477 $40,663 $49,536 $50,579
Median FamilyIncome
$33,645 $48,223 $59,886 $61,262
Population belowPoverty Level
13.29% 12.51% 14.17% 16.97%
Householdsbelow PovertyLevel
12.66% 11.50% 13.11% 15.45%
Households withPublic AssistanceIncome
6.07% 3.01% 2.06% 3.18%
Disability Trends - HillsboroughSee the Data Sources section below for an explanationabout the differences in disability data among the variousyears.
Description 1990 2000 2010(ACS)
2015(ACS)
Population 16 To64 Years with adisability
48,345(7.57%)
136,465(14.85%)
NA(NA)
NA(NA)
Population 20 To64 Years with adisability
NA(NA)
NA(NA)
NA(NA)
79,106(9.96%)
Income Trends Poverty and Public Assistance
Page 11 of 14 Sociocultural Data Report Printed on: 5/17/2017

Educational Attainment Trends - HillsboroughAge 25 and Over
Description 1990 2000 2010(ACS)
2015(ACS)
Less than 9thGrade
48,247 41,209 41,965 43,073
9th to 12thGrade, NoDiploma
84,751 84,574 69,127 66,133
High SchoolGraduate orHigher
412,022 528,058 672,988 762,685
Bachelor'sDegree or Higher
110,070 164,109 226,113 266,437
Language Trends - HillsboroughAge 5 and Over
Description 1990 2000 2010(ACS)
2015(ACS)
Speaks EnglishWell
23,611 39,227 54,355 50,719
Speaks EnglishNot Well
NA 28,250 39,803 44,487
Speaks EnglishNot at All
NA 13,819 19,950 24,627
Speaks EnglishNot Well or Notat All
20,956 42,069 59,753 69,114
Housing Trends - HillsboroughDescription 1990 2000 2010
(ACS)2015(ACS)
Total 367,740 425,962 526,016 549,024Units per Acre 0.536 0.622 0.768 0.80Single-FamilyUnits
200,373 260,157 330,155 345,207
Multi-FamilyUnits
87,418 122,837 153,087 161,555
Mobile HomeUnits
34,499 42,063 42,158 41,562
Owner-OccupiedUnits
204,966 251,023 292,728 284,285
Renter-OccupiedUnits
119,906 140,334 169,719 201,793
Vacant Units 42,868 34,605 63,569 62,946Median HousingValue
$72,400 $91,800 $198,900 $159,200
OccupiedHousing Unitsw/No Vehicle
28,289(8.71%)
31,680(8.09%)
30,440(6.58%)
34,742(7.15%)
Housing Tenure
Page 12 of 14 Sociocultural Data Report Printed on: 5/17/2017
Demographic data reported is from the U.S. Decennial Census (1990, 2000) and the American Community Survey (ACS)
5-year estimates from 2006-2010 and 2011-2015. The data was gathered at the county level. Depending on the dataset,
the data represents 100% counts (Census Summary File 1) or sample-based information (Census Summary File 3 or
ACS).
About the Census Data:Use caution when comparing the 100% count data (Decennial Census) to the sample-based data (ACS). In any given
year, about one in 40 or 2.5% of U.S. households will receive the ACS questionnaire. Over any five-year period, about
one in eight households will receive the questionnaire, as compared to about one in six that received the long form
questionnaire for the Decennial Census 2000. (Source: http://mcdc.missouri.edu/pub/data/acs/Readme.shtml)The U.S.
Census Bureau provides help with this process:
http://www.census.gov/acs/www/guidance_for_data_users/comparing_2015/
Use caution when interpreting changes in Race and Ethnicity over time. Starting with the 2000 Decennial Census,
respondents were given a new option of selecting one or more race categories. Also in 2000, the placement of the
question about Hispanic origin changed, helping to increase responsiveness to the Hispanic-origin question. Because of
these and other changes, the 1990 data on race and ethnicity are not directly comparable with data from later censuses.
(Source: http://www.census.gov/prod/2001pubs/c2kbr01-1.pdf;
http://www.census.gov/pred/www/rpts/Race%20and%20Ethnicity%20FINAL%20report.pdf)
The "Minority" calculations are derived from Census and ACS data using both the race and ethnicity responses. On this
report, "Minority" refers to individuals who list a race other than White and/or list their ethnicity as Hispanic/Latino. In other
words, people who are multi-racial, any single race other than White, or Hispanic/Latino of any race are considered
minorities.
Disability data is not included in the 2010 Decennial Census, or the 2006-2010 ACS. This data is available in the 2011-
2015 ACS.
Because of changes made to the Census and ACS questions between 1990 and 2015, disability variables should not be
compared from year to year. For example: 1) With the 1990 data the disabilities are listed as a "work disability" while this
distinction is not made with 2000 or 2015 ACS data; 2) The 2015 ACS data includes the institutionalized population (e.g.
persons in prisons and group homes), while this population is not included in 1990 or 2000; 3) the age groupings changed
over the years.
Please take the following two concerns into account when viewing this data: 1) With the 1990 data the disabilities are
listed as a "work disability" while this distinction is not made with 2000 or 2015 ACS data; 2) The 2015 ACS data includes
the institutionalized population (e.g. persons in prisons and group homes), while this population is not included in 1990 or
2000.
source:
https://www.census.gov/people/disability/methodology/acs.html
https://www.census.gov/population/www/cen2000/90vs00/index.html
The category Bachelor's Degree or Higher under the heading Educational Attainment Trends is a subset of the category
High School Graduate or Higher.
County Data Sources
Metadata
Page 13 of 14 Sociocultural Data Report Printed on: 5/17/2017

- Community and Fraternal Centers https://etdmpub.fla-etat.org/metadata/gc_communitycenter.htm- Correctional Facilities in Florida https://etdmpub.fla-etat.org/metadata/gc_correctional.htm- Cultural Centers in Florida https://etdmpub.fla-etat.org/metadata/gc_culturecenter.htm- Fire Department and Rescue Station Facilities in Florida https://etdmpub.fla-etat.org/metadata/gc_firestat.htm- Local, State, and Federal Government Buildings in Florida https://etdmpub.fla-etat.org/metadata/gc_govbuild.htm- Florida Health Care Facilities https://etdmpub.fla-etat.org/metadata/gc_health.htm- Hospital Facilities in Florida https://etdmpub.fla-etat.org/metadata/gc_hospitals.htm- Law Enforcement Facilities in Florida https://etdmpub.fla-etat.org/metadata/gc_lawenforce.htm- Florida Parks and Recreational Facilities https://etdmpub.fla-etat.org/metadata/gc_parks.htm- Religious Centers https://etdmpub.fla-etat.org/metadata/gc_religion.htm- Florida Public and Private Schools https://etdmpub.fla-etat.org/metadata/gc_schools.htm- Social Service Centers https://etdmpub.fla-etat.org/metadata/gc_socialservice.htm- Assisted Rental Housing Units in Florida https://etdmpub.fla-etat.org/metadata/gc_assisted_housing.htm- Group Care Facilities https://etdmpub.fla-etat.org/metadata/groupcare.htm- Mobile Home Parks in Florida https://etdmpub.fla-etat.org/metadata/gc_mobilehomes.htm- Migrant Camps in Florida https://etdmpub.fla-etat.org/metadata/migrant.htm- Veteran Organizations and Facilities https://etdmpub.fla-etat.org/metadata/gc_veterans.htm- Generalized Land Use - Florida DOT District 7 https://etdmpub.fla-etat.org/metadata/d7_lu_gen.htm- Census Block Groups in Florida https://etdmpub.fla-etat.org/metadata/e2_cenacs_cci.htm- 1990 Census Block Groups in Florida https://etdmpub.fla-etat.org/metadata/e2_cenblkgrp_1990_cci.htm- 2000 Census Block Groups in Florida https://etdmpub.fla-etat.org/metadata/e2_cenblkgrp_2000_cci.htm- 2010 Census Block Groups in Florida https://etdmpub.fla-etat.org/metadata/e2_cenblkgrp_2010_cci.htm
Page 14 of 14 Sociocultural Data Report Printed on: 5/17/2017