Embed Size (px)
Citation preview
Social, environmental and health vulnerability to climatechange in the Brazilian Northeastern Region
Ulisses E. C. Confalonieri & Anna Carolina L. Lima &
Isabela Brito & Ana Flávia Quintão
Received: 24 May 2011 /Accepted: 30 May 2013# Springer Science+Business Media Dordrecht 2013
Abstract A regional vulnerability study in relation to the projected patterns of climatechange (A2 and B2 scenarios) was developed for the Brazilian Northeastern region. Anaggregated Vulnerability Index was constructed for each of the nine States of the region,based on the following information: population projections; climate-induced migrationscenarios; disease trends; desertification rates; economic projections (GDP and employment)and projections for health care costs. The results obtained shall subsidize public policies forthe protection of the human population from the projected impacts of regional changes inclimate patterns.
1 Introduction
Global Climate Change (GCC) is a relatively new topic in the Public Health researchagenda. Recent research from different disciplines have shown how changes to the EarthSystem can affect human societies, including the health of the population (Confalonieri andMcMichael 2007). The most comprehensive and updated synthesis of the health effects ofglobal climate change was published as part of the Fourth Assessment Report of theIntergovernmental Panel on Climate Change (Confalonieri et al. 2007).
Several vulnerability studies to the impacts of climate change have developed quantita-tive composite indices which included social, economic, environmental and health compo-nents, both at the country and international level (Moss et al. 2001; Thornton et al. 2006).More recently, a local vulnerability index (at district level)—not particularly focused on theimpacts of climate change—has included environmental information (land cover; rainfall);economic data (poverty), demographics and health indicators (Naudê et al. 2008).
Climatic ChangeDOI 10.1007/s10584-013-0811-7
This article is part of a Special Issue on “Climate change and adaptation in tropical basins” edited by PierreGirard, Craig Hutton, and Jean-Phillipe Boulanger.
U. E. C. Confalonieri (*) :A. C. L. Lima : I. BritoCPqRR-Fiocruz, Belo Horizonte, Brazile-mail: [email protected]
A. F. QuintãoESP-MG, Belo Horizonte, Brazil
Composite Indicators are quantitative representations that summarize and integrate dif-ferent dimensions of a given process; they allow for comparisons among a set of units ofanalysis, in relation to their comparative performance (Schuschny and Soto 2009).
Warrick (2000) has proposed that, on its simplest form, vulnerability assessments shouldconsider “the inter-relations between natural and human systems, which result in biophysicaland economic impacts”. Under the biophysical dimensions, the variability of the climatesystem is included.
Brooks et al. (2005) have presented a comprehensive set of indicators of vulnerability andadaptive capacity. Included in the eight groups of variables are those related to health (eg.prevalence of infections; mortality); education (eg. illiteracy rates); geography (eg. extent ofcoastline); ecology (eg. forest cover); infrastructure, governance and technologies.
A former study of the public health and social vulnerability of Brazil to the impacts ofclimate change has indicated that the Northeastern region would be the part of the country tosuffer the most; the reasons for this were the low economic development; poor social andhealth indicators and the semi-arid climate (Confalonieri et al. 2009). Also, the application ofthe “Climate Change Index” (Baettig et al. 2007) has shown that the magnitude of theexpected changes in climate in the future, for Brazil, were higher for the Northern (Amazon)and Northeastern regions which were, therefore, considered as “Hotspots”.
In this paper we present the results of a multi-agency research project developed byBrazilian institutions to assess the vulnerability of the semi-arid region in the Northeasternpart of the country to the projected impacts of climatic change in the economic, demographicand health sectors. An analysis of the economic and demographic implications of a changingregional climate has been recently published (Barbieri et al. 2010). Here we report thedevelopment of a vulnerability Index for each state of the region, using information from theeconomic-demographic component of the research project, environmental data and epide-miological information.
2 Climate in the Brazilian Northeastern Region
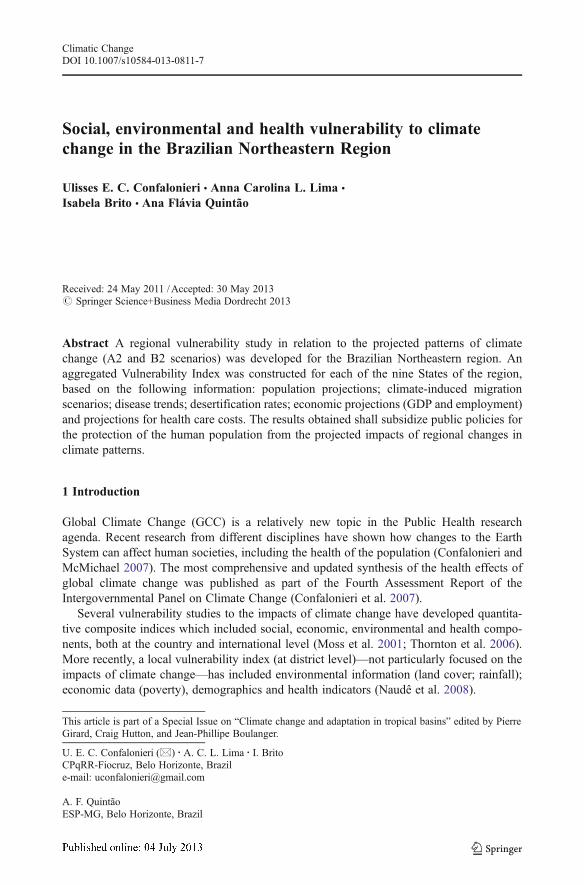
The Brazilian Northeastern region has an area of 1,600,000 Km2 (Fig. 1) and contains a semi-arid part of about 940,000 Km2, with an average annual precipitation of about 800 mm/year,where 27 million people live (Marengo 2009). In this region, rainfall varies in space, time andyears of drought and abundant rain alternate in an unpredictable way. Water balance modelshave indicated a water deficit of 60 % of the period between 1970 and 1990 (Marengo 2009).
In this area potential evaporation far exceeds annual rainfall: 3,000 h of annual sunshine andmean annual temperatures of 19 to 29 °C result in real evapotranspiration of about 700 mm;only about 22 % of rainfall results in runoff and percolation (Brant 2007). The low averagewater availability and irregular rainfall affects the regional society as a hole, especially the ruralpopulation which are smallholder crop producers and livestock farmers. Reports of droughts inthis region can be found since the 17th century and, statistically, there are 18–20 years ofdrought in every 100 years; the 20th century has had 27 years of drought ( Marengo 2009).
The social impacts of the periodic droughts in this region—frequently associated with the ElNiño phenomenon—range from effects on the subsistence, economy, security, health and well-being (Magalhães and Glantz 1992; Ribot et al. 1996; Franke et al. 2002; Confalonieri 2003;Coelho et al. 2004).
Regional climate models developed by the Brazilian Institute for Space Research (INPE) haveprojected changes in climate for several Brazilian regions (Marengo et al. 2009; Marengo 2009;Marengo et al. 2011; Chou et al. 2011). For the Northeastern region, models projected an increase
Climatic Change
in air temperature and reduction in precipitation, resulting in increased evaporation, reduction inwater storage in the soil and deficits in the water balance. Up to the end of the XXI century, theregional warming could reach 2–3 °C under the B2 scenario and up to 4 °C under the A2 scenario.Under the latter scenario negative rainfall anomalies were estimated to be around 2.4 mm/day(Marengo et al. 2007; Ambrizzi et al. 2007). This would cause the worsening of the ariditycondition and the replacement of the scrubland type vegetation cover by a desert-like ecosystem.
3 Conceptual framework
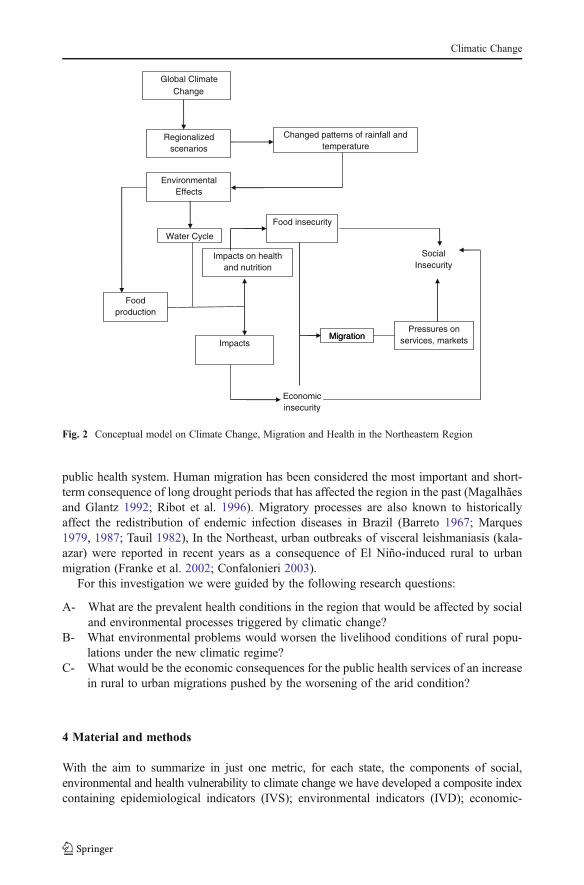
To frame the complex interactions between social-demographic, environmental processesand health aspects an explanatory model was developed. (Fig. 2)
Climate change is expected to cause impacts in the regional water cycle and a generalreduction in water availability for human use. This will have impacts in food production,hygiene and human migration. The expected health impacts would range from an increase ininfectious diseases associated to water scarcity (eg. diarrhea); poor nutrition; impacts of lowhumidity and high temperatures (eg. dehydration; respiratory ailments) to regional redistri-bution of endemic diseases due to the migration of rural populations to the large cities. Thiswould, in turn, increase the demand on the provision of health care services linked to the
Fig. 1 The Brazilian Northeastern Region
Climatic Change
public health system. Human migration has been considered the most important and short-term consequence of long drought periods that has affected the region in the past (Magalhãesand Glantz 1992; Ribot et al. 1996). Migratory processes are also known to historicallyaffect the redistribution of endemic infection diseases in Brazil (Barreto 1967; Marques1979, 1987; Tauil 1982), In the Northeast, urban outbreaks of visceral leishmaniasis (kala-azar) were reported in recent years as a consequence of El Niño-induced rural to urbanmigration (Franke et al. 2002; Confalonieri 2003).
For this investigation we were guided by the following research questions:
A- What are the prevalent health conditions in the region that would be affected by socialand environmental processes triggered by climatic change?
B- What environmental problems would worsen the livelihood conditions of rural popu-lations under the new climatic regime?
C- What would be the economic consequences for the public health services of an increasein rural to urban migrations pushed by the worsening of the arid condition?
4 Material and methods
With the aim to summarize in just one metric, for each state, the components of social,environmental and health vulnerability to climate change we have developed a composite indexcontaining epidemiological indicators (IVS); environmental indicators (IVD); economic-
Migration
SocialInsecurity
Water Cycle
Economic insecurity
Food insecurity
Foodproduction
Impacts on healthand nutrition
Impacts
Pressures onservices, marketsMigration
EnvironmentalEffects
Changed patterns of rainfall and temperature
Global ClimateChange
Regionalizedscenarios
Fig. 2 Conceptual model on Climate Change, Migration and Health in the Northeastern Region
Climatic Change
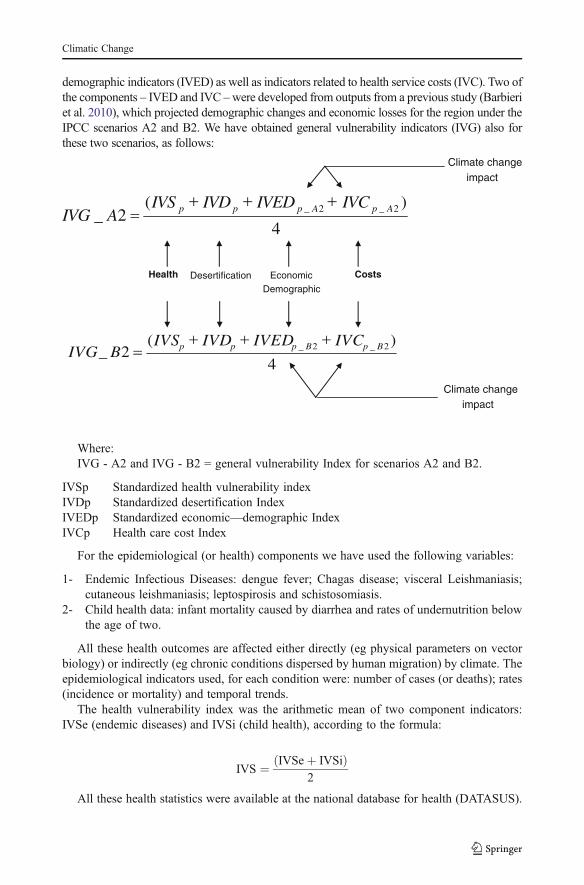
demographic indicators (IVED) as well as indicators related to health service costs (IVC). Two ofthe components – IVED and IVC –were developed from outputs from a previous study (Barbieriet al. 2010), which projected demographic changes and economic losses for the region under theIPCC scenarios A2 and B2. We have obtained general vulnerability indicators (IVG) also forthese two scenarios, as follows:
Health
Climate changeimpact
Desertification EconomicDemographic
Costs
Climate changeimpact
4
)(2_ 2_2_ ApAppp IVCIVEDIVDIVS
AIVG
4
)(2_ 2_2_ BpBppp IVCIVEDIVDIVS
BIVG
Where:IVG - A2 and IVG - B2 = general vulnerability Index for scenarios A2 and B2.
IVSp Standardized health vulnerability indexIVDp Standardized desertification IndexIVEDp Standardized economic—demographic IndexIVCp Health care cost Index
For the epidemiological (or health) components we have used the following variables:
1- Endemic Infectious Diseases: dengue fever; Chagas disease; visceral Leishmaniasis;cutaneous leishmaniasis; leptospirosis and schistosomiasis.
2- Child health data: infant mortality caused by diarrhea and rates of undernutrition belowthe age of two.
All these health outcomes are affected either directly (eg physical parameters on vectorbiology) or indirectly (eg chronic conditions dispersed by human migration) by climate. Theepidemiological indicators used, for each condition were: number of cases (or deaths); rates(incidence or mortality) and temporal trends.
The health vulnerability index was the arithmetic mean of two component indicators:IVSe (endemic diseases) and IVSi (child health), according to the formula:
IVS ¼ IVSeþ IVSið Þ2
All these health statistics were available at the national database for health (DATASUS).
Climatic Change
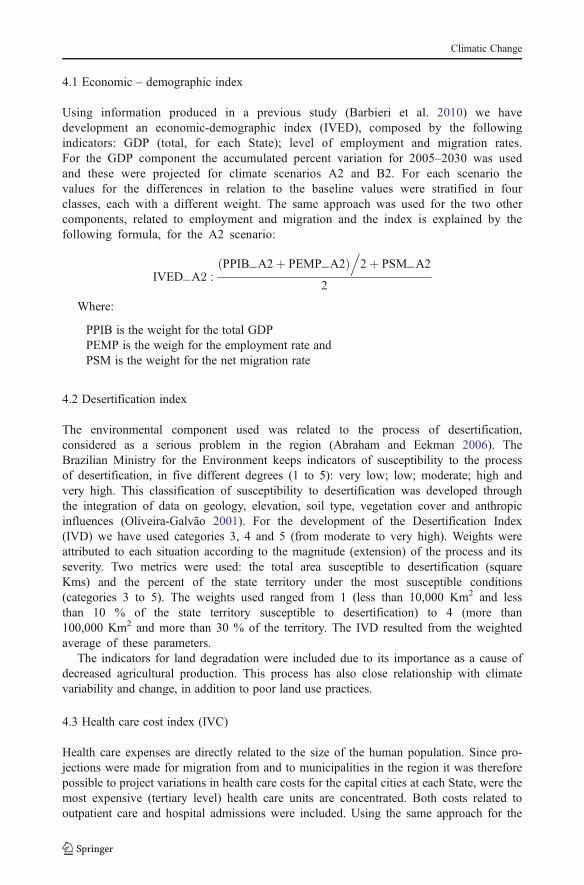
4.1 Economic – demographic index
Using information produced in a previous study (Barbieri et al. 2010) we havedevelopment an economic-demographic index (IVED), composed by the followingindicators: GDP (total, for each State); level of employment and migration rates.For the GDP component the accumulated percent variation for 2005–2030 was usedand these were projected for climate scenarios A2 and B2. For each scenario thevalues for the differences in relation to the baseline values were stratified in fourclasses, each with a different weight. The same approach was used for the two othercomponents, related to employment and migration and the index is explained by thefollowing formula, for the A2 scenario:
IVED�A2 :PPIB�A2þ PEMP�A2ð Þ
.2þ PSM�A2
2
Where:
PPIB is the weight for the total GDPPEMP is the weigh for the employment rate andPSM is the weight for the net migration rate
4.2 Desertification index
The environmental component used was related to the process of desertification,considered as a serious problem in the region (Abraham and Eekman 2006). TheBrazilian Ministry for the Environment keeps indicators of susceptibility to the processof desertification, in five different degrees (1 to 5): very low; low; moderate; high andvery high. This classification of susceptibility to desertification was developed throughthe integration of data on geology, elevation, soil type, vegetation cover and anthropicinfluences (Oliveira-Galvão 2001). For the development of the Desertification Index(IVD) we have used categories 3, 4 and 5 (from moderate to very high). Weights wereattributed to each situation according to the magnitude (extension) of the process and itsseverity. Two metrics were used: the total area susceptible to desertification (squareKms) and the percent of the state territory under the most susceptible conditions(categories 3 to 5). The weights used ranged from 1 (less than 10,000 Km2 and lessthan 10 % of the state territory susceptible to desertification) to 4 (more than100,000 Km2 and more than 30 % of the territory. The IVD resulted from the weightedaverage of these parameters.
The indicators for land degradation were included due to its importance as a cause ofdecreased agricultural production. This process has also close relationship with climatevariability and change, in addition to poor land use practices.
4.3 Health care cost index (IVC)
Health care expenses are directly related to the size of the human population. Since pro-jections were made for migration from and to municipalities in the region it was thereforepossible to project variations in health care costs for the capital cities at each State, were themost expensive (tertiary level) health care units are concentrated. Both costs related tooutpatient care and hospital admissions were included. Using the same approach for the
Climatic Change
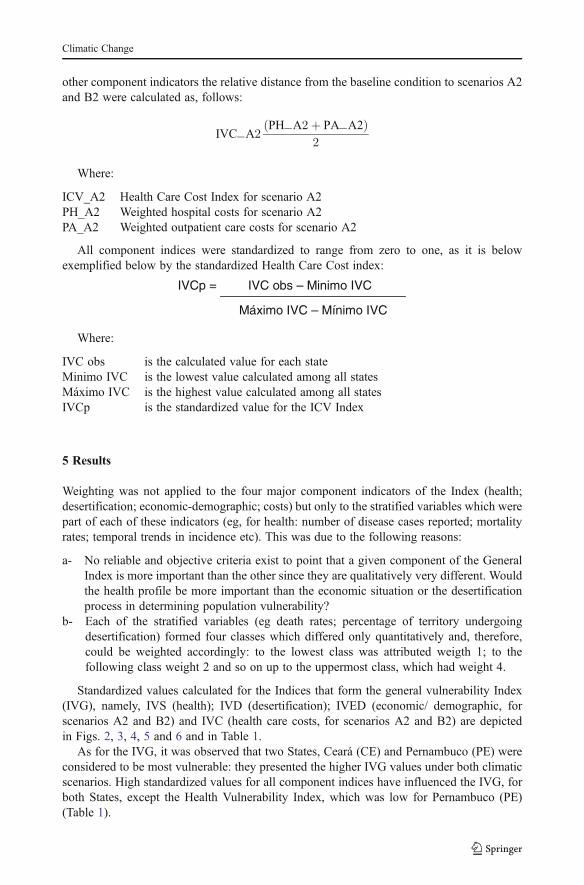
other component indicators the relative distance from the baseline condition to scenarios A2and B2 were calculated as, follows:
IVC�A2PH�A2þ PA�A2ð Þ
2
Where:
ICV_A2 Health Care Cost Index for scenario A2PH_A2 Weighted hospital costs for scenario A2PA_A2 Weighted outpatient care costs for scenario A2
All component indices were standardized to range from zero to one, as it is belowexemplified below by the standardized Health Care Cost index:
IVCp = IVC obs – Minimo IVC
Máximo IVC – Mínimo IVC
Where:
IVC obs is the calculated value for each stateMinimo IVC is the lowest value calculated among all statesMáximo IVC is the highest value calculated among all statesIVCp is the standardized value for the ICV Index
5 Results
Weighting was not applied to the four major component indicators of the Index (health;desertification; economic-demographic; costs) but only to the stratified variables which werepart of each of these indicators (eg, for health: number of disease cases reported; mortalityrates; temporal trends in incidence etc). This was due to the following reasons:
a- No reliable and objective criteria exist to point that a given component of the GeneralIndex is more important than the other since they are qualitatively very different. Wouldthe health profile be more important than the economic situation or the desertificationprocess in determining population vulnerability?
b- Each of the stratified variables (eg death rates; percentage of territory undergoingdesertification) formed four classes which differed only quantitatively and, therefore,could be weighted accordingly: to the lowest class was attributed weigth 1; to thefollowing class weight 2 and so on up to the uppermost class, which had weight 4.
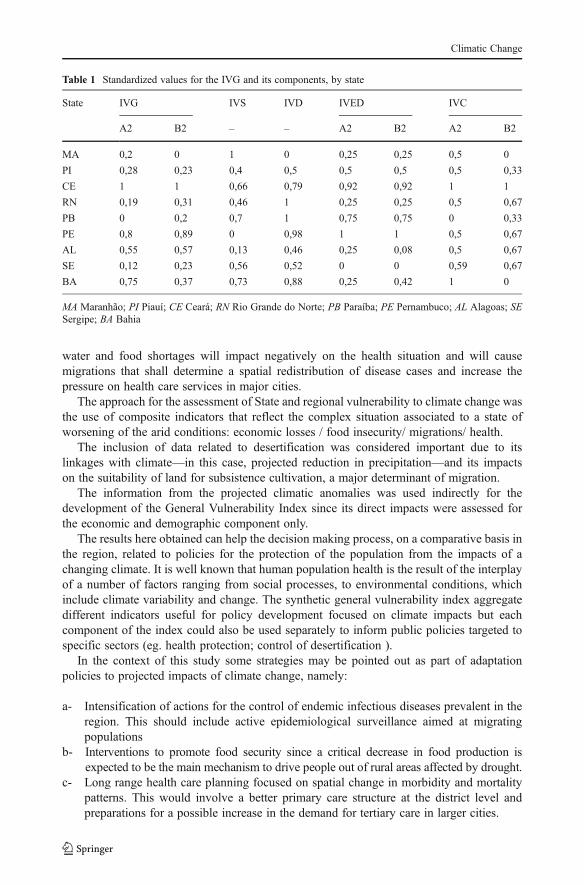
Standardized values calculated for the Indices that form the general vulnerability Index(IVG), namely, IVS (health); IVD (desertification); IVED (economic/ demographic, forscenarios A2 and B2) and IVC (health care costs, for scenarios A2 and B2) are depictedin Figs. 2, 3, 4, 5 and 6 and in Table 1.
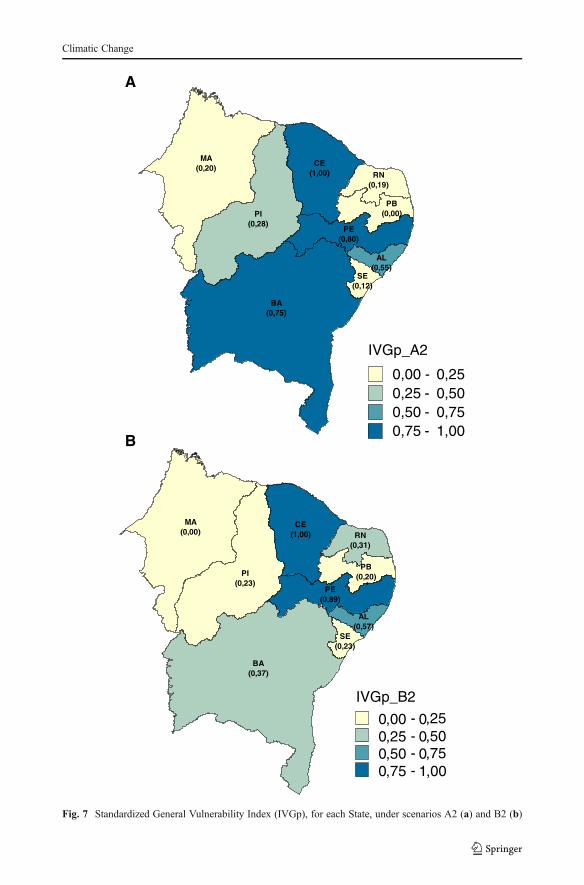
As for the IVG, it was observed that two States, Ceará (CE) and Pernambuco (PE) wereconsidered to be most vulnerable: they presented the higher IVG values under both climaticscenarios. High standardized values for all component indices have influenced the IVG, forboth States, except the Health Vulnerability Index, which was low for Pernambuco (PE)(Table 1).
Climatic Change
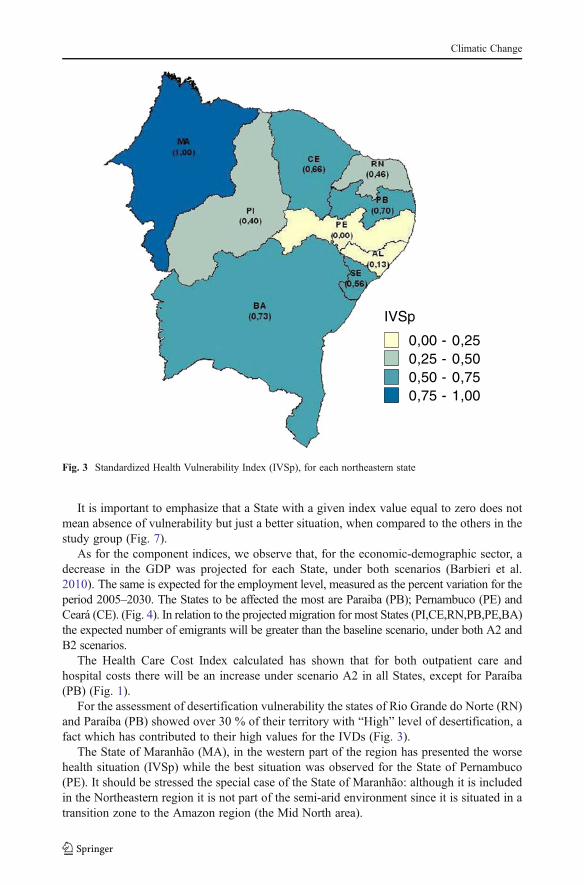
It is important to emphasize that a State with a given index value equal to zero does notmean absence of vulnerability but just a better situation, when compared to the others in thestudy group (Fig. 7).
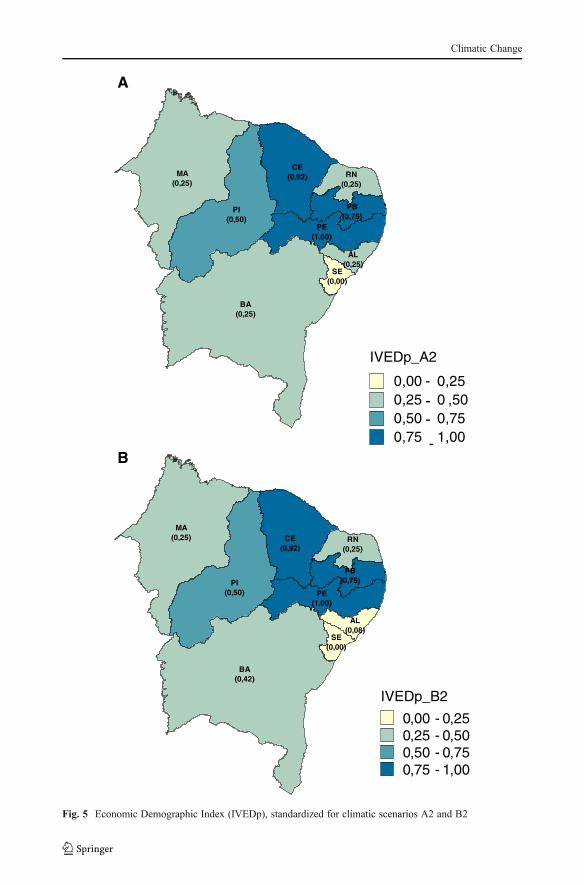
As for the component indices, we observe that, for the economic-demographic sector, adecrease in the GDP was projected for each State, under both scenarios (Barbieri et al.2010). The same is expected for the employment level, measured as the percent variation for theperiod 2005–2030. The States to be affected the most are Paraiba (PB); Pernambuco (PE) andCeará (CE). (Fig. 4). In relation to the projected migration for most States (PI,CE,RN,PB,PE,BA)the expected number of emigrants will be greater than the baseline scenario, under both A2 andB2 scenarios.
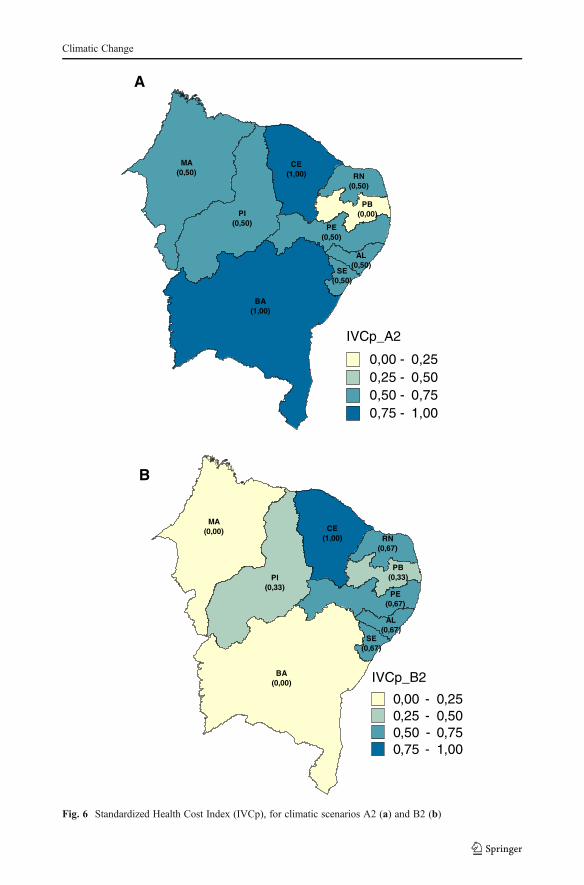
The Health Care Cost Index calculated has shown that for both outpatient care andhospital costs there will be an increase under scenario A2 in all States, except for Paraíba(PB) (Fig. 1).
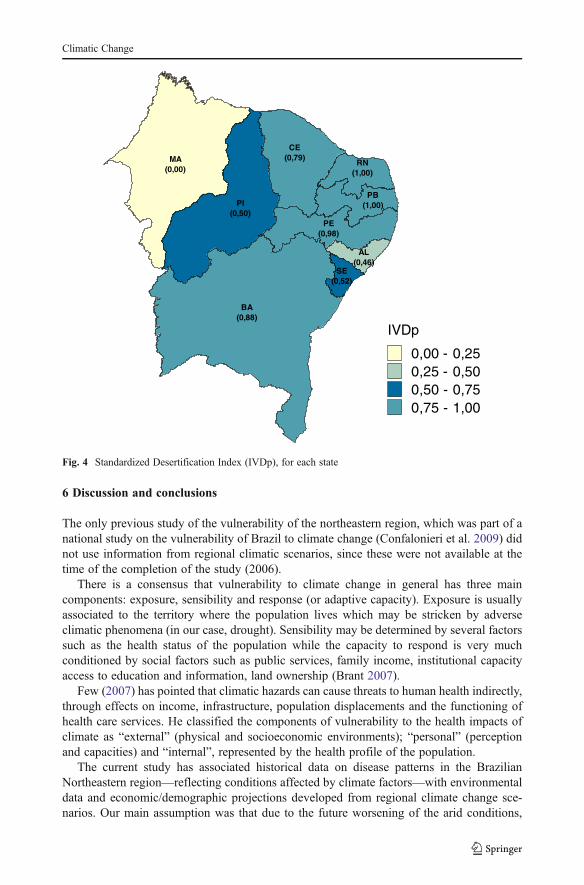
For the assessment of desertification vulnerability the states of Rio Grande do Norte (RN)and Paraíba (PB) showed over 30 % of their territory with “High” level of desertification, afact which has contributed to their high values for the IVDs (Fig. 3).
The State of Maranhão (MA), in the western part of the region has presented the worsehealth situation (IVSp) while the best situation was observed for the State of Pernambuco(PE). It should be stressed the special case of the State of Maranhão: although it is includedin the Northeastern region it is not part of the semi-arid environment since it is situated in atransition zone to the Amazon region (the Mid North area).
IVSp
0,00 - 0,250,25 - 0,500,50 - 0,750,75 - 1,00
Fig. 3 Standardized Health Vulnerability Index (IVSp), for each northeastern state
Climatic Change
6 Discussion and conclusions
The only previous study of the vulnerability of the northeastern region, which was part of anational study on the vulnerability of Brazil to climate change (Confalonieri et al. 2009) didnot use information from regional climatic scenarios, since these were not available at thetime of the completion of the study (2006).
There is a consensus that vulnerability to climate change in general has three maincomponents: exposure, sensibility and response (or adaptive capacity). Exposure is usuallyassociated to the territory where the population lives which may be stricken by adverseclimatic phenomena (in our case, drought). Sensibility may be determined by several factorssuch as the health status of the population while the capacity to respond is very muchconditioned by social factors such as public services, family income, institutional capacityaccess to education and information, land ownership (Brant 2007).
Few (2007) has pointed that climatic hazards can cause threats to human health indirectly,through effects on income, infrastructure, population displacements and the functioning ofhealth care services. He classified the components of vulnerability to the health impacts ofclimate as “external” (physical and socioeconomic environments); “personal” (perceptionand capacities) and “internal”, represented by the health profile of the population.
The current study has associated historical data on disease patterns in the BrazilianNortheastern region—reflecting conditions affected by climate factors—with environmentaldata and economic/demographic projections developed from regional climate change sce-narios. Our main assumption was that due to the future worsening of the arid conditions,
SE(0,52)
AL(0,46)
MA(0,00)
CE(0,79)
RN(1,00)
PB(1,00)
PE(0,98)
BA(0,88)
PI(0,50)
IVDp
0,00 - 0,250,25 - 0,500,50 - 0,750,75 - 1,00
Fig. 4 Standardized Desertification Index (IVDp), for each state
Climatic Change
RN(0,25)
PB(0,75)
PE(1,00)
AL(0,25)
SE(0,00)
BA(0,25)
CE(0,92)
PI(0,50)
MA(0,25)
BA(0,42)
SE(0,00)
AL(0,08)
PE(1,00)
PB(0,75)
RN(0,25)
CE(0,92)
PI(0,50)
MA(0,25)
A
B
IVEDp_A2
0,00 - 0,250,25 - 0 ,500,50 - 0,750,75 - 1,00
IVEDp_B2
0,00 - 0,250,25 - 0,500,50 - 0,750,75 - 1,00
Fig. 5 Economic Demographic Index (IVEDp), standardized for climatic scenarios A2 and B2
Climatic Change
AL(0,50)
PE(0,50)
SE(0,50)
MA(0,50)
BA(1,00)
PB(0,00)
RN(0,50)
CE(1,00)
PI(0,50)
BA(0,00)
SE(0,67)
AL(0,67)
PE(0,67)
PB(0,33)
RN(0,67)
CE(1,00)
PI(0,33)
MA(0,00)
A
B
IVCp_B2
0,00 - 0,250,25 - 0,500,50 - 0,750,75 - 1,00
IVCp_A2
0,00 - 0,250,25 - 0,500,50 - 0,750,75 - 1,00
Fig. 6 Standardized Health Cost Index (IVCp), for climatic scenarios A2 (a) and B2 (b)
Climatic Change
water and food shortages will impact negatively on the health situation and will causemigrations that shall determine a spatial redistribution of disease cases and increase thepressure on health care services in major cities.
The approach for the assessment of State and regional vulnerability to climate change wasthe use of composite indicators that reflect the complex situation associated to a state ofworsening of the arid conditions: economic losses / food insecurity/ migrations/ health.
The inclusion of data related to desertification was considered important due to itslinkages with climate—in this case, projected reduction in precipitation—and its impactson the suitability of land for subsistence cultivation, a major determinant of migration.
The information from the projected climatic anomalies was used indirectly for thedevelopment of the General Vulnerability Index since its direct impacts were assessed forthe economic and demographic component only.
The results here obtained can help the decision making process, on a comparative basis inthe region, related to policies for the protection of the population from the impacts of achanging climate. It is well known that human population health is the result of the interplayof a number of factors ranging from social processes, to environmental conditions, whichinclude climate variability and change. The synthetic general vulnerability index aggregatedifferent indicators useful for policy development focused on climate impacts but eachcomponent of the index could also be used separately to inform public policies targeted tospecific sectors (eg. health protection; control of desertification ).
In the context of this study some strategies may be pointed out as part of adaptationpolicies to projected impacts of climate change, namely:
a- Intensification of actions for the control of endemic infectious diseases prevalent in theregion. This should include active epidemiological surveillance aimed at migratingpopulations
b- Interventions to promote food security since a critical decrease in food production isexpected to be the main mechanism to drive people out of rural areas affected by drought.
c- Long range health care planning focused on spatial change in morbidity and mortalitypatterns. This would involve a better primary care structure at the district level andpreparations for a possible increase in the demand for tertiary care in larger cities.
Table 1 Standardized values for the IVG and its components, by state
State IVG IVS IVD IVED IVC
A2 B2 – – A2 B2 A2 B2
MA 0,2 0 1 0 0,25 0,25 0,5 0
PI 0,28 0,23 0,4 0,5 0,5 0,5 0,5 0,33
CE 1 1 0,66 0,79 0,92 0,92 1 1
RN 0,19 0,31 0,46 1 0,25 0,25 0,5 0,67
PB 0 0,2 0,7 1 0,75 0,75 0 0,33
PE 0,8 0,89 0 0,98 1 1 0,5 0,67
AL 0,55 0,57 0,13 0,46 0,25 0,08 0,5 0,67
SE 0,12 0,23 0,56 0,52 0 0 0,59 0,67
BA 0,75 0,37 0,73 0,88 0,25 0,42 1 0
MA Maranhão; PI Piauí; CE Ceará; RN Rio Grande do Norte; PB Paraíba; PE Pernambuco; AL Alagoas; SESergipe; BA Bahia
Climatic Change
PI(0,28)
BA(0,75)
CE(1,00) RN
(0,19)
PB(0,00)
SE(0,12)
AL(0,55)
PE(0,80)
MA(0,20)
CE(1,00)
SE(0,23)
AL(0,57)
PE(0,89)
RN(0,31)
PB(0,20)
MA(0,00)
PI(0,23)
BA(0,37)
B
A
IVGp_A2
0,00 - 0,250,25 - 0,500,50 - 0,750,75 - 1,00
IVGp_B2
0,00 - 0,250,25 - 0,500,50 - 0,750,75 - 1,00
Fig. 7 Standardized General Vulnerability Index (IVGp), for each State, under scenarios A2 (a) and B2 (b)
Climatic Change
d- Specific policies directed at the reduction of the need for rural to urban migration, suchas the conservation and provision of water resources and government-sponsored tem-porary jobs to reduce the intensity of rural migrations.
References
Abraham EM, Eekman GB (2006) Indicadores de La desertificación para América del Sur, ArgentinaAmbrizzi T, Rocha R, Marengo JA et al (2007) Cenários regionalizados de clima no Brasil e América do Sul,
para o século XXI: Projeções de clima futuro usando três modelos regionais. São PauloBaettig M, Wild M, Imboden DM (2007) A climate change index: where climate change may be most
prominent in the 21st century. Geophys Res Lett 34(1), L01705Barbieri AF, Domingues E, Queiroz BL et al (2010) Climate change and population migration in Brazil’s
northeast: scenarios for 2025–2050. Popul Environ 31:344–370Barreto MP (1967) Movimento migratório e sua importância na epidemiologia das doenças parasitárias no
Brasil. Rev Soc Bras Med Trop 1(3):91–102Brant S (2007) Assessing vulnerability to drought in Ceará, Northeastern Brazil. Dissertation, University
MichiganBrooks N, Adger WN, Kelly PM (2005) The determinants of vulnerability and adaptive capacity at the
national level and the implications for adaptation. Glob Environ Chang 15:151–163Chou SC, Marengo JA, Lyra A et al (2011) Downscaling of South America present climate driven by 4-
member HadCM3runs. Clim Dyn 38(3/4):635–653Coelho AEL, Adair JG, Mocellin JSR (2004) Psychological responses to drought in northeastern Brazil
Interamer. J Phycol 38(1):95–103Confalonieri UEC (2003) Variabilidade climática, vulnerabilidade social e saúde no Brasil. São Paulo Terra
Livre 19-I(20):193–204Confalonieri UEC, McMichael AJ (2007) Global environmental change and human health. Science plan and
implementation strategy. ESSP Report nº 4: http://www.gechh.unu.edu/Final_GECHH_SP_UPDATED.pdf.Access 10 March 2012
Confalonieri UEC, Menne BR, Ebi KL et al (2007) Human health. In: Parry ML (ed) Climate change 2007:Impacts, adaptation and vulnerability. Contribution of Working Group II to the Fourth Assessment Reportof the Intergovernmental Panel on Climate Change. Cambridge University Press, Cambridge, pp 391–431
Confalonieri UEC, Marinho DP, Rodriguez RR (2009) Public Health Vulnerability to climate change inBrazil. Clim Res 40:175–186
Few R (2007) Health and climatic hazards: framing social research on vulnerability, response and adaptation.Glob Environ Chang 17:281–295
Franke CR, Ziller M, Staubach C et al (2002) Impact of the El Niño/. Southern oscillation on visceralleishmaniasis. Braz Emerg Infect Dis 8(9):914–917
Magalhães AR, Glantz MH (1992) Socioeconomic impacts of climate variations and policy responses inBrazil. UNEP/ SEPLAN/ Fundação Esquel, Brasilia, p 155
Marengo JA (2009) Vulnerability, impacts and adaptation (VIA) to climate change in the Semi-Arid region ofBrazil. In: Brazil and climate change: vulnerability, impacts and adaptation. Brasilia CGEE, pp 137–164
Marengo JA, Nobre CA, Salatiet E et al (2007) Caracterização do clima atual e definição das alteraçõesclimáticas para o território brasileiro ao longo do século XXI: sumário técnico. São Paulo: CPTEC/INPE;IAG/USP; Rio de Janeiro: FBDS, pp 54
Marengo JA, Ambrizzi T, Rocha RP et al (2009) Future change of climate in South America in the late twenty-first century: intercomparison of scenarios from three regional climate models. Clim Dyn 35(6):1073–1097
Marengo JSC, Chou G, Kay L et al (2011) Development of regional future climate change scenarios in SouthAmerica using the Eta CPTEC/HadCM3 climate change projections: Climatology and regional analysesfor the Amazon, São Francisco and the Paraná River Basins. Clim Dyn. doi:10.1007/s00382-011-1155-5
Marques AC (1979) Migrações Internas e Grandes Endemias. Rev Brasil Malariol D Trop 31:137–149Marques AC (1987) Human Migration and the spread of malaria in Brazil. Parasitol Today 3:166–170Moss RH, Malone EL, Ramachander S et al (2001) Vulnerability to climate change: A quantitative approach.
Pacific Northwest Nat. Lab., U.S. Dept of Energy, pp 88Naudê W, McGillivray M, Rossouw S (2008) Measuring the vulnerability of subnational regions. United
Nations University – UNU – WIDER Research Paper Nº 2008/54 pp 28
Climatic Change
Oliveira-Galvão, ALC (2001) de Reconhecimento da susceptibilidade ao desenvolvimento de processos dedesertificação no nordeste brasileiro, a partir da integração de indicadores ambientais. Tese (Doutorado).Instituto de Geociências, universidade de Brasília, Brasília, pp 280
Ribot JC, Najam A, Watson G et al (1996) Climate variation, vulnerability and sustainable development in theSemi-arid tropics. In: Ribot JC (ed) Climate variability, climate change and social vulnerability in thesemi-arid tropics. Cambridge University Press, Cambridge, pp 13–51
Schuschny A, Soto H (2009) Methodological guide. Design of composite indicators for sustainable develop-ment. UN – CEPAL/GTZ, Santiago
Tauil PL (1982) Informações básicas necessárias para identificar os riscos potenciais para a saúde no curso dasmigrações humanas: fatores epidemiológicos. In: SUCAM. Doenças e migrações humanas. Brasília:Centro de Documentação/Ministério da Saúde, pp 150–180
Thornton PK, Jones PG, Owiyo T et al (2006) Mapping climate vulnerability and poverty in Africa. Report toILRI, Nairobi
Warrick R (2000) Strategies for Vulnerability and adaptation assessment in the context of National Commu-nications. Paper presented at 2nd AOSIS Workshop on Climate Change Negotiations. Apia Samoa 31July–3 August
Climatic Change


![Japanese II Book - Northeastern Illinois University · 2018-11-06 · German Greek Haitian Creole Hebrew Indonesian Italian Japanese Korean Lithuanian Ojibwe Polish Portuguese [Brazilian]](https://img.dokumen.tips/doc/110x75/5e7bfbddd1c40d4ee93cdd8c/japanese-ii-book-northeastern-illinois-university-2018-11-06-german-greek-haitian.jpg)


![Variations on A Brazilian Northeastern Folk Tune [Opus 25] · PDF fileI first played some classical pieces I fell in love with them and changed to piano ... Variations on A Brazilian](https://img.dokumen.tips/doc/110x75/5a7136db7f8b9a98538cb3bf/variations-on-a-brazilian-northeastern-folk-tune-opus-25wwwfree-scorescompdfbrazilian-northeastern-folk-tune-15524pdfpdf.jpg)


![Northeastern Brazilian marine atmospheric corrosion ... · Northeastern Brazilian marine atmospheric corrosion performances of ... in this case, sorted by NBR 14643/01 [4] and t4,](https://img.dokumen.tips/doc/110x75/5be3a87709d3f2d7048b9a8d/northeastern-brazilian-marine-atmospheric-corrosion-northeastern-brazilian.jpg)