Embed Size (px)
Citation preview

Social Behaviour and Crop Raiding in Chacma Baboons of the
Suikerbosrand Nature Reserve
Govan Pahad
A Dissertation submitted to the Faculty of Science, University of the
Witwatersrand, Johannesburg, in fulfilment of the requirements for the
degree of Master of Science
Johannesburg
October 2010

ii
Declaration
I declare that this dissertation is my own unaided work. It is being submitted for the degree
Master of Science to the University of the Witwatersrand, Johannesburg. It has not been
submitted before for any degree or examination to any other university.
________________________
Govan Pahad
October 2010

iii
Abstract
Conflict between baboons and humans is a common occurrence in many places where
baboons exist in close proximity to cultivated land. This study examines patterns of raiding by
baboons, farmer retaliation, and potential behavioural responses of baboons to that retaliation
in and around the Suikerbosrand Nature Reserve, South Africa. Recent years have seen a
rising baboon population and increasing complaints from farmers in the area about baboons
raiding their farmland, leading to concerns that the population may have outgrown the
resources available within the reserve.
This study consists of three parts: an examination of patterns of space use by baboons,
using data from GPS collars fitted to one baboon in each of 10 troops in the reserve; an
examination of the behaviour of baboons in 9 of these troops, using data gained though direct
observation of troops within the reserve; and an examination of patterns of raiding and farmer
retaliation, using data from questionnaires sent to land owners surrounding the reserve.
The data revealed that the troops appeared to be responding to resource scarcity and
the opportunity to raid in a variety of ways. Some troops appeared to be raiding farmland
intensively on short forays out of the reserve, while using the reserve as a refuge, indicated by
small amounts of time spent outside the reserve, high levels of overlap between troops and
low levels of foraging within the reserve. Other troops appeared to be shifting their home
ranges out of the reserve to forage on fallow land, while also raiding farmland to some extent,
indicated by large amounts of time spent outside the reserve, low levels of overlap between
troops, and low levels of foraging within the reserve. Two of the troops studied apparently did
not raid, as they never left the reserve.
Data from the questionnaires suggest that, while raiding is stimulated by food scarcity
in the dry season, baboons raid maize and beans whenever available, seemingly preferring
these crops over natural forage. While some farmers are responding to raiding with lethal
retaliation against baboons, the effects of this on the social structure of the troops are unclear
due to low sample sizes of behavioural data.
This study demonstrates some of the behavioural responses of baboons to raiding and
farmer retaliation, and some of the different responses available to baboon troops facing a
scarcity of natural food together with the opportunity to raid farmland. Based on my findings,
I also provide recommendations to farmers and the Suikerbosrand management aimed at
reducing baboon human conflict in the area.
iv
Acknowledgements
I would like to thank my supervisor, Neville Pillay, whose help and advice have been
instrumental in the completion of this project. I would also like to thank my lab partners, as
well as all the waifs and strays who wandered through our corner of the of the APES
department in search of fresh coffee and conversation, your frequent distractions made the
writing of this thesis possible.
Thank also to the Gauteng Department of Agriculture Conservation and Environment,
Suikerbosrand Nature Reserve, for allowing me to stay in their reserve and study their
baboons, to Johnny Hennop, for his help in contacting farmers around the reserve and to the
farmers themselves, whose responses added an important perspective to my study.
Finally, thanks to Africa Wildlife Tracking for access to the GPS data collected from the
baboon‟s collars and the National Research Foundation for their financial support.
Animal Ethics clearance number: AESC2006/46/2A
v
Table of Contents
Page
Declaration ii
Abstract iii
Acknowledgements iv
Table of Contents v
List of Figures viii
List of Tables ix
Chapter 1: Introduction 1
1.1 Chacma Baboons 1
1.1.1 Appearance 1
1.1.2 Habitat 1
1.1.3 Social organisation and social behaviour 1
1.1.4 Inter-and intra-troop dynamics 3
1.1.5 Reproduction 4
1.1.6 Mortality 5
1.1.7 Anti-predator behaviour 6
1.1.8 Foraging 7
1.2 Raiding 7
1.2.1 Baboons and other large mammals as pests 7
1.2.2 Potential effects of raiding and farmer retaliation on baboon
troops 10
1.2.3 Stress 11
1.3 Baboons at Suikerbosrand Nature Reserve and rationale for this study 12
1.4 Aims 14
1.5 Hypotheses and predictions 14
1.5.1 Space use 14

vi
1.5.2 Behaviour 17
1.5.3 Responses by farmers 19
Chapter 2: Materials and Methods 20
2.1. Study site 20
2.2. Cell-phone telemetry collars 22
2.3. Baboon census 22
2.4. Space use 22
2.4.1 Data Collection 22
2.4.2 Data analysis 23
2.5 Behaviour 24
2.5.1 Data collection 24
2.5.2 Data analysis 26
2.6 Information from farmers 27
2.6.1 Data collection 27
2.6.2. Data analysis 27
Chapter 3: Results 29
3.1 GPS data 29
3.1.1 Time spent outside the reserve 30
3.1.2 Troop size 33
3.1.3 Space use area 34
3.1.4 Monthly space use overlap 35
3.1.5 Space use shifts 37
3.2. Behaviour 38
3.2.1 Aggression, self-grooming and mating 41
3.2.2 Foraging 41
3.2.3 Vigilance, motor play and socio-positive behaviour 41
3.3 Questionnaire surveys 42
3.3.1 Raiding by baboons 43
3.3.2 Reactions of farmers 45

vii
Chapter 4: Discussion and Recommendations 47
4.1 Space use and raiding 47
4.1.1 Recap of Aims and Predictions 47
4.1.2 Time outside the reserve 47
4.1.3 Troop size 49
4.1.4 Monthly space use area and monthly space use overlap 49
4.1.5 Space use shifts 50
4.1.6 Conclusions 50
4.2 Behaviour 50
4.2.1 Recap of aims and predictions 50
4.2.2 Aggression 51
4.2.3 Self-grooming 51
4.2.4 Mating 52
4.2.5 Foraging 52
4.2.6 Other behaviours 52
4.2.7 Conclusions 53
4.3 Questionnaire survey 53
4.3.1 Recap of aims and predictions 53
4.3.2 Patterns of raiding 53
4.3.3 Patterns of retaliation 54
4.4 Overall conclusions 55
4.5 Recommendations 55
4.6 Future studies 56
References 58
Appendix 1 65

viii
List of Figures
Page
Figure 1 Chacma baboon population sizes in the Suikerbosrand Nature Reserve from
its proclamation (1972) to the last census (2006). 13
Figure 2 Map of the Suikerbosrand showing habitat types. 21
Figure 3 Questionnaire survey sent to farmers around the Suikerbosrand Nature
Reserve. 28
Figure 4 Map of the Suikerbosrand showing troop home ranges. 30
Figure 5 Percentage time spent outside the reserve by a) leavers and b) occasional
leavers for each month from March 2006 to February 2007. 32
Figure 6 The number of baboons counted in 12 baboon troops in the Suikerbosrand
Nature Reserve during the census in 2006. 33
Figure 7 Representative map of the monthly space use of troop AS42. 34
Figure 8 Mean monthly space use areas (km2) for 10 baboon troops in the
Suikerbosrand Nature Reserve. 35
Figure 9 Mean monthly space use overlap with other troops for 10 baboon troops in
the Suikerbosrand Nature Reserve. 36
Figure 10 The percentage of possible combinations of monthly space use areas that
are significantly different for 10 baboon troops in the Suikerbosrand Nature Reserve. 38
Figure 11 Total proportion of the time that each of 9 baboon troops spent on
a) foraging and socio-positive behaviour and b) aggression, self-grooming, mating,
vigilance and motor play. 40
Figure 12 Number of times that raiding was reported in each month by farmers in
the vicinity of Suikerbosrand Nature Reserve. 45

ix
List of Tables
Page
Table 1 Percentage of time spent outside of the reserve by 10 baboon troops in
Suikerbosrand Nature Reserve. 31
Table 2 The number of other troops each troop overlapped with and total % space
use overlap for each troop from March 2006 to February 2007 in the Suikerbosrand
Nature Reserve. 36
Table 3 Results of Spearman rank correlations comparing space use overlap and time
spent outside the reserve for 10 baboon troops in the Suikerbosrand Nature Reserve. 37
Table 4 The number of sampling sessions, baboon minutes and total minutes of
observation time for each of 10 baboon troops in the Suikerbosrand Nature Reserve. 39
Table 5 Summary of answers to questions relating to farmer‟s losses caused by
baboons in the vicinity of Suikerbosrand Nature Reserve. 44
Table 6 Summary of answers to questions relating to farmers' reactions to raiding by
baboons in Suikerbosrand Nature Reserve. 46

1
Chapter 1: Introduction
1.1 Chacma baboons
1.1.1 Appearance
Chacma baboons (Papio hamadryas ursinus) are a subspecies of savanna baboon, and
are common throughout much of southern Africa. These large, diurnal, terrestrial monkeys
have dog-like heads with deep-set eyes beneath prominent brow ridges, black, hairless
muzzles and ears, and the males have razor sharp canines up to 5cm in length (Estes, 1991).
Their fur is coarse, short and varies in colour (i.e. shades of dark brown, often blackish in
patches, depending on the population; Estes, 1991; Smithers, 1983). Their limbs are long,
sturdy and roughly even in length, with short, wide hands and feet with stubby digits, and
their tails (approximately equal in length to their head and body) are held semi-erect (Estes,
1991; Smithers, 1983).
1.1.2 Habitat
Due to the benefits of their individual large size and strength, as well as their complex
social structure (and the benefits of foraging efficiency and predator defence it provides),
chacmas, like other savanna baboons, have managed to colonize the full range of savanna
habitats between true grassland and true forest (Estes, 1991). However, they may also be
limited by their need for refuges in which to sleep during the night, such as large, often thorny
trees or high, rocky outcrops (Smithers, 1983) and by the availability of water (Hamilton,
1985).
1.1.3 Social organisation and social behaviour
Chacma baboon troops vary in size from less than 10 to approximately 200 individuals
(Henzi et al., 1997). This allows for group defence against predators (Cowlishaw, 1994). It
also promotes the cultural transmission of information (e.g. feeding habits; Camberfort,
1981).
Females remain in their natal group whereas males tend to disperse upon reaching
adulthood (Weingrill et al., 2000) and will often change troop several times during their lives
(Estes, 1991). Within a troop, access to food and, amongst males, to mates is determined by
dominance hierarchies (Hamilton & Busse, 1982; Alberts et al., 2006). Female rank is fairly
stable and is usually perpetuated trans-generationally due to maternal intervention in the

2
disputes of their offspring (Cheney, 1977). Male rank is more unstable, with high ranking
males frequently losing their status to younger immigrants (Hamilton & Bulger, 1990).
Social cohesion is maintained by various affiliative interactions, the most noticeable of
which is grooming, which is especially important in male-female and female-female
relationships (Palombit et al., 1997; Barrett et al., 1999; Weingrill et al., 2000; Barrett et al.,
2002). In male-female interactions, reciprocal grooming is used to establish temporary bonds
during consortship (Weingrill et al., 2000) and during the infancy of a female's offspring,
when male “friends” help to protect infants against infanticidal males (Palombit et al., 1997).
Amongst females, grooming can be reciprocal or can be exchanged for other favours such as
tolerance and reduced aggression from a more dominant female or being allowed to handle
another female's infant (Barrett et al., 1999; Barrett et al., 2002; Henzi & Barrett 1999; Henzi
& Barrett, 2002). Reciprocal grooming results in long term relationships between females,
usually between close kin but sometimes between unrelated females of similar age or rank
(Silk et al., 1999; Silk et al. 2006a; Silk et al. 2006b). The sociality of females has been found
to positively correlate with infant survival (Silk et al., 2003).
Aggression is also a common and important feature of chacma baboon sociality and is
used in the determination of rank by both males and females (Hamilton & Bulger, 1990;
Cheney, 1977). Male-male aggression can be especially severe and can lead to damaging
fights and even death (Brain, 1992). Females sometimes support close kin in conflict
situations by vocalising their support (Wittig et al., 2007) or, more rarely, through physical
intervention (Silk et al., 2004). Male chacmas, however, do not appear to form coalitions
(Henzi et al., 1999), despite the presence of this behaviour in other subspecies of savanna
baboon (Noë & Sluijter, 1995). Aggression by males against females and their infants is also
common, although this is primarily associated with the rise to dominance of new, immigrant
males (Pereira, 1983; Beehner et al., 2005). Rates of male-male aggression have also been
found to increase during changes in the male hierarchy (Bergman et al., 2005).
There is evidence that the social behaviour of chacma and other savanna baboons is
culturally acquired. For example, in one troop of olive baboons (Papio hamadryas anubis)
living in the Masai Mara reserve of Kenya, a more peaceful social environment emerged after
the most aggressive males in the troop were killed by an outbreak of bovine tuberculosis
contracted from a rubbish dump. Ten years later, these behavioural conditions persisted even
though none of the males present in the troop a decade earlier remained. New males joining
the troop were therefore adopting its unique culture (Sapolsky & Share, 2004). In another
study, chacma baboons in the Suikerbosrand Nature Reserve, South Africa, temporarily split

3
into subtroops during the winter, leading to more exclusive mating habits. Later, when the
presence of a leopard in the reserve for several years prevented subtrooping, the tendency
towards pair bonding remained, with males and females mating with fewer of the potential
mates available than would normally be expected (Anderson, 1989).
1.1.4 Inter-and intra-troop dynamics
Troop size and organisation and inter-troop relationships are fairly flexible in baboons
and are known to change in response to environmental pressures, indicating behavioural
plasticity. Home range size has been found to increase with both troop size and resource
scarcity (Barton et al., 1992). This influence of resource density means that the population
density of chacma baboons can vary dramatically, from 3.5 baboons / km2 in the Namib
desert, Namibia, to 43.2 baboons / km2 in the Okavango delta, Botswana (Hamilton et al.,
1976).
Troop size also varies considerably due to fission-fusion processes, with chacma
baboon troops ranging from 4 baboons in the Drakensberg, South Africa (Henzi et al., 1997),
to 128 baboons in the Okavango delta, Botswana (Hamilton et al., 1976). Fission is generally
driven by the withdrawal of low ranking females from a troop due to competition for food, or
by males separating due to competition for mates (Ron, 1996). On the other hand, high
predation pressure encourages baboons to remain in large troops for protection (Henzi et al.,
1997). Barton et al. (1996) suggest that increased predation pressure should result in larger,
multi-male groups for increased vigilance and predator defence, while increased within-group
competition for food should result in groups with more conflict, grooming and coalitions
between females, since female dominance hierarchies become more important for individual
resource acquisition. Therefore, chacma baboons in areas of low predation pressure will break
up into smaller troops to minimise within group competition for food, while those in areas of
high predation pressure will form larger troops, where within group competition is likely to
increase.
There is some empirical support for this hypothesis. In areas of the Drakensberg where
predation pressure is low and resources are scarce, chacma troops fission at low numbers,
forming troops containing an average of 22 individuals (Barton et al., 1996; Henzi et al.,
1997), characterised by strong male-female bonds, with almost no female coalitions (Byrne
et. al., 1990). In the Okavango Delta, however, where predation pressure is higher (Cheney et.
al., 2004), troops contain an average of 79 individuals (Hamilton et al. 1976) and adult

4
females form strong kinship alliances based on well-differentiated grooming relationships
(Silk et. al., 1999).
Chacma baboons are generally non-territorial between troops and have overlapping
home ranges (Anderson, 1981). However, territoriality can develop under particular
environmental conditions. Two troops living in a Namib Desert canyon formed a defended
boundary near a waterhole and troops in the Okavango Swamp floodplain in Botswana, where
resource and population densities were high, defended small territories along well defined
boundaries (Hamilton et al., 1975; Hamilton et al., 1976). These studies suggest that chacma
baboons can develop territorial behaviour when resource distribution or density favours
resource defence.
1.1.5 Reproduction
Single infants are born after a six month gestation period (Smithers, 1983). Infants
remain in constant contact with their mother for 6-8 months, after which they are weaned
(Smithers, 1983). At first, the infant clings to its mother's underside, but later moves to her
back and by two months it is able to walk, though it still usually rides on her rump (Estes,
1991). Yearling baboons are fairly independent, and even forage on their own, although
mortality rates are high if the mother is killed, and it appears that young are dependent on the
mother for up to two years (Estes, 1991).
Females become reproductively active by five years of age (Chance & Jolly, 1970).
Males, though sexually mature by five years of age, can only compete with the larger males
for access to females once they have grown to their full size and strength at seven to 10 years
of age (Chance & Jolly, 1970).
Females have an average menstrual cycle of 36 days (Estes, 1991). The sexual skin of
the female swells and becomes bright pink during oestrus to advertise their receptivity (Estes,
1991). This sexual swelling is at its maximum for 10 days of the cycle, fading 2-3 days after
ovulation (Estes, 1991). Females usually start cycling again 10-12 months (minimum 5
months) after parturition and then go through about 4-5 non-receptive cycles before they can
conceive again, resulting in a potential inter-birth interval of 11/2-2 years (Estes 1991). It has
been found, however, that after periods of extreme heat or drought, female savanna baboons
are less likely to cycle, less likely to conceive if they cycle, and less likely to have successful
pregnancies if they conceive, and that females in larger groups were even less likely to
conceive during droughts (Beehner et al., 2006), suggesting that the rate of reproduction can
be depressed by high population density and adverse environmental conditions.

5
During the receptive phase of a female's cycle, she forms a temporary consort
relationship (based on mutual grooming) with one or several males with whom she will mate
frequently (Palombit et al., 1997; Weingrill et al., 2000). Male mating and reproductive
success follows a rank based priority of access, which is related to both male dominance
hierarchy and female choice, as females prefer high ranking males (Bercovitch, 1991;
Weingrill et al., 2000). Lower ranking males will therefore usually only be able to mate if
many females are receptive at once (Weingrill et al., 2000). This is even more pronounced in
chacma baboons than in other savanna baboons, as lower ranking chacma males do not seem
to form coalitions to compete with higher ranking males, as occurs in other subspecies of
savanna baboons (Noë & Sluijter, 1995; Henzi et al., 1999).
Chacma males can be paternal but also have a tendency towards infanticide (Palombit
et al., 1997; Weingrill, 2000). New immigrant males which rise to dominance often commit
infanticide that causes lactating females to return to sexual receptivity, and may also induce
miscarriage through harassment of pregnant females (Pereira, 1983; Beehner et al., 2005).
Therefore, lactating females often form short term friendships with one or two of the males
with which they mated, which then defend the infants from other, infanticidal males (Palombit
et al., 1997). Female chacmas produce copulation calls which are louder and longer when
they are closer to ovulation (Henzi, 1996) which may act to advertise the paternity of likely
fathers, making them more likely to provide paternal care. In addition to reducing infanticide
risk, other forms of paternal care include 'babysitting', which increases the survivorship of
young, and intervening on behalf of offspring in agonistic disputes (Anderson, 1992; Buchan
et al., 2003).
1.1.6 Mortality
Although the risk of predation seems to have a big influence on the behaviour of
baboons and is considered to be one of the primary causes of group-living in baboons (Barton
et al., 1996), it is uncertain as to whether predation has a significant impact on baboon
populations, since direct evidence is not available (Cowlishaw, 1994). In 'Social Groups of
Monkeys, Apes and Men', published in 1970, Chance and Jolly wrote “No direct attack [on
savanna baboons] has been reported, except by a hyena on an isolated male” (pp. 70).
However, Cowlishaw (1994) found considerable evidence for predation on baboons by
drawing data from studies of the predators themselves, rather than of baboons, and found that
the dominant predators of baboon populations across Africa were leopard (Panthera pardus),
lion (Panthera leo) and hyena (Crocuta crocuta, Hyeana brunnea, Hyaena vulgaris) in order

6
of importance. Also mentioned as having been observed to attack and/or feed on baboons
were chimpanzees (Pan troglodytes), domestic/feral dogs (Canis familiaris), silver backed
jackals (Canis mesomelas), black eagles (Aquila verreauxii), tawny eagles (Aquila rapax),
crocodiles and pythons (most likely Nile crocodiles, Crocodylus niloticus, and African rock
pythons, Python sebae, though species names were not provided). In addition, Cowlishaw
(1994) found that leopards, by far the most significant predators, are more likely to take adults
than juvenile baboons and are more likely to take males than females. A recent study on
chacmas in the Okavango Delta found that the majority of deaths among females and
juveniles were due to predation (Cheney et al., 2004).
Infant mortality among baboons is often very high (Brain, 1992). Mortality of
immature savanna baboons is highest when environmental conditions are unfavourable and
mortality of immature females, in particular, is also higher when the troop size is large,
especially for females born to low ranking mothers (Rhine et. al. 1988). This suggests that
infant mortality is density dependant. The primary causes of infant mortality among chacma
baboons include tick infestation, kidnapping by adult females (Brain, 1992) and infanticide by
adult males (Tarara, 1987; Cheney et al., 2004).
While no reports of adult females being killed by other baboons could be found, males
often die from canine inflicted wounds during male–male aggression (Brain, 1992).
In areas where baboons come into contact with humans, they face added dangers.
Baboons living near agricultural land often raid farms, which can result in lethal retaliation
from farmers (e.g. shooting, trapping and poisoning; Chance & Jolly, 1970; Naughton-Treves,
1997; Holmern et al., 2007). Another potential danger associated with human activity is
roadkill. For example, a study in Tanzania found that roadkill accounted for 10% of annual
mortality in a troop of yellow baboons (Papio hamadryas cynocephalus; Drews, 1995).
1.1.7 Anti-predator behaviour
At night, baboons sleep in trees or on cliffs to avoid predators (Chance & Jolly, 1970).
While out foraging during the day, baboons are very vigilant, especially when moving through
cover that could conceal a predator, during which times tension increases within the group,
resulting in an increase in vigilance and group cohesion (Altmann & Altmann, 1970). If
danger is detected, a warning bark is issued to alert the troop (Estes, 1991). Baboons will
climb trees and rocks to escape danger when possible but will also mob predators and have
been documented killing leopards (Estes, 1991) and even ganging up against lions (Saayman,
1971).
7
The foraging behaviour of baboons is also sensitive to predation risks. Baboons may
avoid a particular area or become hypersensitive to danger signals in an area as a result of a
recent experience with a predator, and repeated experiences may result in more long term
shifts in habitat preference and avoidance (Altmann & Altmann, 1970). In a study of a desert
population of chacma baboons, individuals spent more time in relatively low risk, food poor
habitats and less time in relatively high risk, food rich habitats than would be expected based
simply on ideal free distribution, indicating a modification of foraging habits based on the
fear of predation (Cowlishaw, 1997a); resting and grooming were also reserved almost
exclusively for the low risk habitats. In another study, these baboons used refuges intensively
where available, but in areas where refuges were scarce they foraged and then left the area as
quickly as possible (Cowlishaw, 1997b).
1.1.8 Foraging
Chacma baboon foraging behaviour and diet are incredibly diverse. They have been
recorded eating grasses, seeds, roots, leaves, flowers, bark, gums, mushrooms, fruits, pods,
shoots, bulbs, tubers, lizards, insects, spiders, scorpions, ants, slugs, hares, the young of small
antelope, shellfish (on the Cape Peninsula) as well as raiding farmland for agricultural crops
such as maize, sorghum and peanuts, orchard crops such as pawpaws and bananas and even
domestic animals such as chickens, lambs and young goats (Smithers, 1983). Again, in
foraging, as in other aspects of baboon ecology, learning from others in the social group is
important for foraging (Camberfort, 1981). One study found that once a new food source has
been discovered, most commonly by juveniles, the discovery spreads rapidly through the rest
of the troop (Camberfort, 1981). In another study, adults prevented younger individuals from
accessing fruit experimentally drugged with cynalin until it was ignored altogether
(Fletemeyer, 1978).
In a study of the Suikerbosrand baboons over the same period as this study, Segal
(2008) found that baboons had a broad diet in the dry season (a mix of fruit and seeds, plant
matter, invertebrates and maize) but had a narrower diet at other times of the year, relying
primarily on new leaf growth in the early rainy season and on fruit and seeds in the late rainy
season.

8
1.2 Raiding
1.2.1 Baboons and other large mammals as pests
Large mammals will often forage on agricultural land, and human-animal conflict is a
common problem in many places where farmland abuts protected or otherwise natural land,
most notably throughout Africa and Asia (Sukumar, 1990; Naughton-Treves, 1997; Kharel,
1997; Hoare, 1999). In Asia, large mammals that feed on crops and livestock include
primates, such as maroon langurs (Presbytis rubicunda), long-tailed macaques (Macaca
fasicularis), pig-tailed macaques (Macaca nemestrina) and orang-utans (Pongo pygmaeus);
carnivores such as sun-bears (Helarcto malayanus), Himalayan black bears (Ursus
thibetanus), leopards (Panthera pardus), civets (Paradoxurus sp.), leopard cats (Felis
bengalensis) weasels/ martens (Mustela sp.) and otters (Lutra sp.); ungulates such as bearded
pigs (Sus barbatus) and sambar deer (Cervus unicolor); and porcupines (Hystrix brachyura)
and Asian elephants (Elephas maximus) (Kharel, 1997; Salafsky, 1993; Sukumar, 1990). In
Africa, livestock predation is primarily due to baboons (Papio hamadryas), leopard, lion
(Panthera leo) and spotted hyena (Crocuta crocuta) (Butler, 2000; Kolowski & Holekamp,
2006; Holmern et al., 2007), while the main species for the raiding of agricultural land are
African elephant (Loxodonta africana), primates such as baboons, redtail monkeys
(Cercopithecus ascanius), vervet monkeys (Cercopithecus aethiops), and chimpanzees (Pan
troglodytes) and bushpigs (Potamochoerus sp.), with antelope species such as red duiker
(Cephalophus sp.) and bushbuck (Tragelaphus scriptus) and crested porcupines (Hystrix
africae-australis) also contributing to the problem (Naughton-Treves, 1997; Naughton-Treves
et al., 1998; Hoare, 1999; Saj et al., 2001; Sitati et al., 2003).
Therefore, baboons are known to be responsible for feeding on both livestock and
crops. Livestock predation due to baboons is considerably varied. In Gokwe communal land
in Zimbabwe, chacma baboons were found to be responsible for 52% of the livestock killed,
with lions and leopards responsible for 34% and 12% respectively (Butler, 2000). In villages
adjacent to the Serengeti National Park, Tanzania, yellow baboons were only responsible for
0.4% of kills, with spotted hyenas responsible for 98% (Holmern et al., 2007); and in villages
adjacent to the Masai Mara National Reserve, Kenya, baboons were not known to take
livestock at all (Kolowski & Holekamp, 2006). Where baboons do predate on livestock, they
generally take chickens, lambs and young goats rather than the adult sheep and cattle that
lions and leopard are known to kill (Smithers, 1983; Butler, 2000).
Raiding of crops by baboons is more common. Olive baboons are known crop raiders,
and several studies of raiding around the forest reserves of Kibale National Park and Budongo

9
Forest Reserve in Uganda provide information about their preferences (Naughton-Treves,
1997; Naughton-Treves et al., 1998; Hill, 2000). Olive baboons were not only considered to
be the worst crop raiding animals by farmers around Kibale, they were also responsible for
the greatest overall area of crop damage (Naughton-Treves, 1997). The most favoured crop of
these baboons was found to be maize, followed by sweet potatoes and then groundnuts
(Naughton-Treves, 1997). These baboons fed on maize throughout its life cycle, eating
seedlings, inflorescence, pith and fruit, and would feed on the fruit when available, regardless
of the abundance of forest fruit (Naughton-Treves et al., 1998). They also fed on a greater
variety of crops than other primates, taking root and tuber crops that other primates ignored
(Naughton-Treves et al., 1998).
Chacma baboons are also known as crop raiders (Falls, 1993). Around Kibale National
Park, Uganda, crop losses to olive baboons were confined almost entirely to within 200m of
the forest edge (Naughton-Treves, 1997) while around the Suikerbosrand Nature Reserve,
South Africa, chacma baboons cause damage on farmland and in towns up to 40 km from the
reserve (Falls, 1993). This is most likely because the forest-farmland border (Kibale) is a
more severe edge than the savanna-farmland border (Suikerbosrand), allowing the chacmas to
roam farther from the reserve in relatively familiar habitat.
The raiding behaviour of large mammals can be viewed as an extension of their
foraging strategies (Sukumar, 1990). Carnivores have been found to take more livestock at
times when prey densities are low in their natural environment (Kolowski & Holekamp, 2006)
and crop raiders such as primates and elephants are known to shift to foraging on agricultural
land when crop availability provides improved foraging opportunities (Naughton-Treves et
al., 1998; Sukumar, 1990).
Although natural food scarcity, overpopulation and the intrusion of agricultural land
are thought to provide incentives to large mammals, such as elephants and primates, to raid
farmland or to increase the level of raiding, large mammals are also known to continue
raiding farmland even when natural forage is not scarce, due to the higher productivity,
palatability and nutritive value of crop species compared to wild plants (Sukumar, 1990; Falls,
1993; Strum 1994; Naughton-Treves et al., 1998). In a study of crop raiding by olive baboons,
redtail monkeys and chimpanzees around Kibale National Park, Uganda, it was found that all
three species raided banana plantations less often when forest fruit was plentiful, but would
take maize whenever it was available, regardless of natural fruit availability (Naughton-
Treves et al., 1998). This suggests that maize was more appealing to these baboons than any
natural alternative, perhaps due to its high carbohydrate content. It also suggests that, when

10
equally valuable wild alternatives are plentiful, such as with the fruit, baboons would rather
not raid. This may be due to the threat of 'predation' from farmers.
In another study, troops of olive baboons that did not have previous experience with
human food generally appeared very reluctant to raid, despite the expansion of agriculture in
the area (Strum, 1994). These troops responded to the loss of natural foraging land in a variety
of ways, from enlarging or shifting home ranges or reducing troop sizes to raiding as a backup
strategy or raiding as the primary foraging strategy (Strum, 1994). This suggests a flexible
response to raiding behaviour, with different troops responding to the same situation in
different ways.
On a global scale, crop losses due to large mammals are insignificant compared to
those caused by invertebrates and rodents (Naughton-Treves, 1997). On a local scale,
however, crop losses due to large mammals can be a serious problem for the livelihood of
farmers, especially small land holders and subsistence farmers (Naughton-Treves, 1997). A
study on crop losses to large mammals around Kibale National Park, Uganda found that these
losses only amounted to 7% of planted fields within 450 metres of the park boundary, but, due
to the localised nature of raiding events, 7% of farmers lost over 50% of their planted maize
and cassava (Naughton-Treves, 1997). Such losses naturally lead to bad feelings among
farmers towards the animals responsible, and often towards the parks that protect them
(Kharel, 1997; Naughton-Treves, 1997). Baboons are often considered dangerous as well as
just crop raiders and were described as crafty and a menace to women and children by farmers
around Kibale (Naughton-Treves, 1997). Foraging on farmland by large mammals therefore
often results in lethal retaliation (Falls, 1993; Naughton-Treves, 1997; Holmern et al., 2007).
Not surprisingly, greater losses to raiding animals leads to an increase in the approval of lethal
retaliation, while effective steps to reduce raiding have been found to lead to a reduced desire
for retaliation (Holmern et al., 2007).
1.2.2 Potential effects of raiding and farmer retaliation on baboon troops
Foraging in areas of human land use can expose baboons to a range of dangers such as
cars (Drews, 1995), new diseases (Sapolsky & Share, 2004), domestic dogs (Cowlishaw,
1994) and humans themselves (Naughton-Treves, 1997; Falls, 1993). Foraging on agricultural
land has been found to increase growth and reproduction due to increased foraging efficiency
and food quality, and to increase death and injury due to retaliation from farmers (Strum,
1994). Farmers will often shoot baboons (Falls, 1993) and will use traps, snares and poison to
kill baboons foraging on their land (Naughton-Treves, 1997).

11
Shooting can also alter the composition of baboon troops (Chance & Jolly, 1970). This can
have potentially serious implications for the troop, especially if farmers target large males,
thereby frequently removing the alpha males and shifting the demography of the troop to be
more female biased. It has been found that male savanna baboons prefer to immigrate into
troops that have a higher proportion of females than the population average (Henzi et al.,
1998). A troop that constantly loses adult males could therefore experience an increase in
immigrant males. This is likely to increase aggression within the troop, as immigrant males
not only alter the troop's existing dominance hierarchy (Hamilton & Bulger, 1990), leading to
an increase in male-male aggression (Bergman et al., 2005), they also often use infanticide as
a reproductive strategy (Busse & Hamilton, 1981). It has also been found that male baboons
in troops with relatively few males will often aggressively herd females and infants away
from other troops to prevent new males from joining (Henzi et al., 1998).
1.2.3 Stress
Despite its advantages, social living can also be a source of stress in many primate
species (Abbott et al., 2003). This is often assessed by the measurement of glucocorticoid
hormones in faecal samples. In chacmas, changes in the male hierarchy (which also correlated
with increased male-male aggression) have been found to increase glucocorticoid levels in
males (Bergman et al., 2005) and the rise to dominance of immigrant males has been found to
increase glucocorticoid levels in lactating and pregnant females, especially in those that did
not have male “friends” to guard against infanticide (Beehner et al., 2005). Increased
glucocorticoid levels were also found in females that lost close kin to predation (Engh et al.,
2006). While such stress occurs naturally within baboon troops, it is likely to be increased if
retaliation from farmers increases mortality and rank instability within a troop.
Responses to stress generally involve some sort of displacement / self directed
behaviours. Maestripieri et al. (1992) found that scratching, self-grooming, yawning and body
shaking were the most commonly reported displacement activities in non-human primates,
and that these tended to occur in situations of psycho-social stress. Castles et al. (1999) found
that these same behaviours plus self touching can be used as a measure of relationship
uncertainty in female olive baboons. Interestingly, females which were stressed due to the loss
of close kin responded by increasing their rate of social grooming and number of grooming
partners (Engh et al., 2006). While this could be seen as an attempt to replace lost social
alliances, it has also been suggested that social grooming, especially amongst close kin, can
reduce stress levels in primates, as subordinates in primate species that have opportunities for

12
social support have lower levels of the stress hormone cortisol than those that do not (Abbott
et al., 2003).
1.3 Baboons at Suikerbosrand Nature Reserve and rationale for this study
The Suikerbosrand Nature Reserve (hereafter referred to as Suikerbosrand) is a small
nature reserve with adjoining farmland, situated in close proximity to several residential areas.
Chacma baboons, the only non-human primates on the reserve, are frequently seen in the
areas surrounding the reserve and complaints are often received from farmers that their farms
are being raided by baboons (Falls, 1993). The baboons are also becoming problematic at
camp sites within the reserve where they raid dustbins and steal food. This increase in
foraging in farmland and areas of human habitation has lead to concerns that the baboon
population may have grown too large to be sustained by the food available naturally within
the reserve, especially since there are almost no natural predators of baboons present in the
reserve. Baboons can utilise a wide variety of natural foods, including plants, invertebrates
and small vertebrates (Smithers, 1983). It is feared that an unnaturally high population density
maintained by a partial reliance on food acquired from humans will adversely affect the plant
and animal species diversity of the reserve, the maintenance of which is one of the primary
goals of the management of Suikerbosrand according to their tourist brochure (Gauteng
Nature Conservation, 1997). It is also possible that a reliance on raiding and aggressive
retaliation from humans (such as the shooting of baboons by farmers) may have negative
effects on the behaviour of the baboons. Another concern is the possibility of injury to people
if interactions between humans and baboons continue. The Suikerbosrand management is
therefore eager to find an appropriate strategy to manage the baboon population or to restrict
their raiding behaviour.
Historically, baboons in the Suikerbosrand area were contiguous with baboon
populations across the highveld (Falls, 1993). However, when Voortrekker farmers settled in
the area around 1850, they regarded the baboons as pests and actively hunted them in an effort
to exterminate the problem (Falls, 1993). Baboons in the area only survived in the interior of
what is now the Suikerbosrand Nature Reserve as it was too mountainous for agriculture
(Falls, 1993). The baboon population in the Suikerbosrand has therefore been isolated for at
least 100 years, with the closest neighbouring population today being in the Magaliesburg,
about 150 km away (Falls, 1993). The reserve was declared in 1972, protecting the baboons in
the Suikerbosrand and allowing their population to grow (Falls, 1993). While baboons have
always raided farmland close to Suikerbosrand, there has been an increase in the number of

13
complaints since 1992, as well as complaints from farmers that did not previously have
baboons on their land (Falls, 1993). This may be due to a reduction in the number of live-in
farmers compared to weekend and tenant farmers, which may have resulted in farms being
less well guarded, making raiding an easier option for baboons. Suikerbosrand management
have also suggested that overpopulation may be forcing the baboons to raid farmland (J.
Hennop, pers. comm.).
Falls (1993) provided a population graph for baboons in the Suikerbosrand, based on
earlier censuses from 1974. He suggested that after a period of exponential growth, the
population had stabilised at around 650 baboons. However, a 2006 census of the baboon
population carried out by the Suikerbosrand management estimated that the population had
since grown to around 770 (Figure 1). If Falls (1993) was correct, it seems that an increase in
foraging outside the Suikerbosrand has allowed the population to increase beyond the
carrying capacity of the reserve. Another possibility however, is that the population has been
increasing steadily since the early 1980s.
Figure 1 Chacma baboon population sizes in the Suikerbosrand Nature Reserve from its
proclamation (1972) to the last census (2006).
In an effort to better understand the biology of the baboons, the Suikerbosrand
management fitted selected baboons with cell-phone telemetry collars in order to track the
movement of the troops. There are also channels of communication open between the reserve
management and farmers in surrounding areas (J. Hennop, pers. comm.), making it possible
1970 1980 1990 2000 2010
250
300
350
400
450
500
550
600
650
700
750
800
year
num
ber
of bab
oons

14
that the farmers will be willing to provide information from their perspective about the
baboon pest problem. This provided a valuable opportunity to examine baboon raiding
behaviour in more detail than is normally possible.
1.4 Aims
I studied the chacma baboons in the Suikerbosrand Nature Reserve to ascertain which
troops were raiding farmland, reasons for their raiding farmland, and what affect raiding was
having on their social behaviour.
My study had three broad areas of investigation.
1. Space use. I used information from the GPS collars and a census to examine space use
by the chacma baboon troops over a year (March 2006 to February 2007). In
particular, I measured several parameters: time spent outside the reserve, troop size,
monthly space use area, monthly space use overlap with other troops and seasonal
shifts in space use to assess which troops are raiding farmland, and which troops, if
any, are leaving the reserve due to resource scarcity.
2. Behaviour. I observed the behaviour of raiding and non-raiding troops (classified
based on the space use data) inside the reserve to detect differences between them. The
aim was to establish the effects of raiding and farmer retaliation on the social
behaviour of raiding troops.
3. Farmers. I used questionnaire surveys to obtain responses from farmers about their
losses to baboons, patterns of raiding and responses of farmers to raiding. The aim of
was to investigate how much raiding is taking place, the seasonality of raiding and
preferred crops of the baboons, as well as to assess the levels of farmer retaliation to
the baboons.
1.5 Hypotheses and predictions
For the GPS data on space use and the behavioural data, hypotheses concerning the
implications of parameters examined are given, the basis for them is explained and several
resulting predictions are given.
1.5.1 Space use
General patterns of space use by baboon troops should give an indication of which
troops are raiding farmland. Various predictions can be made based on the assumption that
15
farmland provides improved foraging opportunities at the cost of increased risk from farmers.
The basis for these predictions is outlined below.
Time outside
Time spent outside the reserve will identify troops that leave the reserve and thus have
the opportunity to raid. Leaving the reserve, however, does not necessarily mean that a troop
is raiding farmland. As much of the land around the reserve is not actually cultivated, some
troops may be foraging on fallow land around the reserve rather than on cultivated farmland.
These troops would still be exposed to many dangers not present in the reserve and since
baboon troops tend to avoid high risk areas as much as possible (Altmann & Altmann, 1970;
Cowlishaw, 1997a & b), they should have no incentive to risk venturing outside unless
resources were scarce inside the reserve, perhaps suggesting that the baboon population has
grown too large for the reserve to support.
Troops may also raid farmland but spend relatively little time outside the reserve.
Troops that are raiding farmland are likely to use the reserve as a refuge, foraging on farmland
as quickly as possible and then retreating to the reserve for other activities such as rest and
socialising. This is a documented response of chacma baboons to areas which are both
dangerous and resource rich (Cowlishaw, 1997b). Therefore, if troops are raiding farmland
close to the reserve, they may still spend most of their time inside the reserve.
Seasonal patterns
The amount a troop shifts spatially during the year and the seasonal patterns in the
amount of time it spends outside the reserve will help to reveal the foraging strategies of the
troop. Troops that are managing to find enough food in one area throughout the year will not
have to shift their location. Troops that are raiding farmland seasonally and / or leaving the
reserve seasonally to avoid periods of food scarcity within the reserve will shift spatially to a
larger extent over the year.
Evidence that troops spend more time out of the reserve in the early dry season when
maize (the main crop grown around the reserve) is ripe will suggest that troops are leaving the
reserve to raid farmland. On the other hand, evidence that more time is spent outside the
reserve during the late dry season (when resources are most scarce) will suggest that troops
are leaving the reserve at least partly owing to resource scarcity.

16
Troop size
Baboons form larger troops under higher predation pressure to increase vigilance and
group defence (Barton et al., 1996; Henzi et al., 1997), and therefore raiding troops are
expected to be larger than non-raiding troops. Also, the availability of plentiful agricultural
food should reduce within group competition for food, one of the primary causes of fission of
troops (Ron, 1996).
Monthly space use area and overlap
Home range size depends strongly on the availability of resources (Barton et al.,
1992). The increased density of food resources on agricultural land should therefore allow
baboon troops that are raiding farmland to decrease their monthly space use area and / or to
increase their monthly space use overlap with other troops. They may also overlap more with
other troops at times of the year when they spend more time outside the reserve, assuming
that more time outside the reserve indicates more raiding.
Troops that are leaving the reserve due to overpopulation and are not raiding farmland,
on the other hand, would be expected to take advantage of the lower density of baboons
outside the reserve by using larger areas of land and / or overlapping less with other troops.
These troops may also overlap less with other troops at times of the year when they spend
more time outside of the reserve.
Predictions
1. Raiding troops will spend more time outside the reserve in the early dry season when
maize ripens. They will be larger than non-raiding troops and will have smaller
monthly space use areas and / or will overlap more with other troops. They should
overlap even more with other troops at times of the year when they spend more time
outside the reserve. They will also shift their location more throughout the year than
troops that do not leave the reserve.
2. Troops that are leaving the reserve due to resource scarcity will spend more time
outside the reserve in the late dry season. They will be larger than troops that do not
leave the reserve. If they are not also raiding farmland they will have larger monthly
space use areas and / or will overlap less with other troops and they should overlap
even less with other troops at times of the year when they spend more time outside the
reserve. They will also shift their location more throughout the year than troops that do
not leave the reserve.

17
3. Non-raiding troops that do not leave the reserve will be smaller than other troops and
will have intermediate monthly space use areas and overlaps with other troops
(intermediate meaning between raiding troops and troops foraging on fallow land).
They will shift their location less throughout the year than other troops.
1.5.2 Behaviour
Behavioural differences between raiding and non-raiding troops will provide an
indication of how troops are responding to raiding and farmer retaliation. Various predictions
can be made based on the assumption that farmland provides improved foraging opportunities
at the cost of increased risk from farmers. The basis for these predictions is outlined below.
Aggression
The shooting of baboons (especially large males) by farmers is likely to disrupt the
social hierarchy, which is known to result in increased aggression within a troop (Pereira,
1983; Beehner et al., 2005; Bergman et al., 2005). Aggression should therefore be more
frequent in raiding troops than in non-raiding troops.
Vigilance
Although vigilance is known to increase as a result of predation, this tends to be area
specific, with baboons being more vigilant in areas where they have previously experienced
predation (Altmann & Altmann, 1970). Also, Cowlishaw (1997b) found that chacmas are a lot
less vigilant in a refuge than away from it. Therefore, dangers experienced outside the reserve
will not necessarily result in an increase in vigilance within the reserve.
Self-grooming
Glucocorticoid levels (an indicator of stress) increase in male and pregnant and
lactating female baboons in response to changes in the social hierarchy and the associated
increases in aggression (Beehner et al., 2005; Bergman et al., 2005). Glucocorticoid levels
also increase in female baboons that have lost close kin (Engh et al., 2006). As self-grooming
is thought to be an indicator of stress in primates (Maestripieri et al., 1992) and has been
found to indicate relationship uncertainty in olive baboons (Castles et al., 1999), it should be
more frequent in raiding troops than in non-raiding troops due to the loss of individuals and
the increased social instability.

18
Foraging
If raiding troops are using the reserve as a refuge, they should spend more time resting
and socialising inside the reserve, with a large proportion of their foraging taking place
outside the reserve (Cowlishaw, 1997a). Also, as the density of food is far higher on
agricultural land than on non-agricultural land, troops that are foraging on farmland should
need to spend a lot less time foraging overall. Foraging should therefore be less frequent
inside the reserve in raiding troops than in non-raiding troops.
Socio-positive behaviour
Social grooming, the primary component of socio-positive behaviour, can potentially
be affected by many factors, such that a simple response to raiding and farmer retaliation is
unlikely. If troops are using the reserve as a refuge, social grooming might be expected to be
more common in raiding troops when inside the reserve due to this behaviour occurring more
in low risk areas (Cowlishaw, 1997a). Also, female baboons respond to the loss of grooming
partners by increasing social grooming of others (Engh et al., 2006). On the other hand,
increased food availability may reduce female-female grooming as within group competition
for food is thought to be the main cause of female-female grooming and coalitions (Barton et
al., 1996). Overall, therefore, no major differences in social grooming can be predicted
between raiding and non-raiding troops.
Motor play
Play behaviour is known to decrease due to poor habitat quality and food shortages in
gelada baboons (Theropithecus gelada; Barrett et al., 1992) and in langur monkeys (Presbytis
entellus; Sommer & Mendoza-Granados, 1995). Play may therefore be lower in non-raiding
baboons if the natural food availability in the reserve is low. Play may also increase in raiding
troops if it is a behaviour reserved for low risk areas, as argued for grooming (above).
However, Cowlishaw (1997a) did not look at play behaviour in his study. Also, it is unknown
what the effects of social instability are on play behaviour. Therefore, no differences in motor
play can be predicted, especially since the low levels of this behaviour will make any trend
very difficult to detect.
Mating
Foraging on agricultural land has been found to increase growth and reproduction due
to increased foraging efficiency and food quality (Strum, 1994). Also, new immigrant males

19
which rise to dominance often commit infanticide to cause lactating females to return to
sexual receptivity, and may also induce miscarriage through the harassment of pregnant
females (Pereira, 1983; Beehner et al., 2005). Both of these trends should increase the amount
of time females spend in the receptive phase of their reproductive cycles in raiding troops,
thereby increasing the amount of mating in these troops. Levels of mating are therefore
predicted to be higher in raiding troops than in non-raiding troops.
Prediction
Inside the reserve, troops that raid farmland will have higher levels of aggression, self-
grooming and mating and lower levels of foraging than troops that do not raid farmland.
1.5.3 Responses by farmers
As the questionnaires provide largely qualitative data, specific predictions will not be
made. However, based on other studies of baboon-farmer conflict (Naughton-Treves, 1997;
Naughton-Treves et al., 1998), it is expected that maize farmers will be particularly affected
by baboons, and that this is likely to result in lethal retaliation. It is also expected that raiding
will increase during the early dry season when maize ripens and during the late dry season
when natural food is scarce, as baboons have been found to increase raiding due to both
natural food shortages and the availability of preferred crops such as maize (Naughton-Treves
et al., 1998).

20
Chapter 2: Materials and methods
2.1 Study site (Much of the information provided here was obtained from a tourist brochure:
Gauteng Nature Conservation, 1997).
This study was conducted over a year from March 2006 to February 2007 at the
Suikerbosrand Nature Reserve (Figure 2). The Suikerbosrand Nature Reserve is a protected
area of 133 km2 situated about 50 km south of Johannesburg. The reserve is surrounded by
commercial farmland (J. Hennop, pers. comm.). The reserve ranges between 1545-1917 m
above sea level, and is dominated by the Suikerbosrand mountain range. The average rainfall
is between 650-700 mm per year and the temperature varies from 10 to 32 °C in summer and
from 0 to 20 °C in winter. There is a range of vegetation types in the reserve, with grassland
dominating the mountain slopes and plains, and wooded patches common in the gorges. The
eastern edge of the reserve is mainly protea veld and there is an area of Acacia forest in the
south west corner, as well as patches of aloe forest scattered throughout the mountain slopes.
Rocky outcrops are very common among the mountain slopes and peaks. There is a vlei in the
south, a dam of about 200 by 100 m in the east, and several perennial rivers as well as
permanent water sources (provided for the wildlife) scattered throughout the reserve. An area
of land adjoining the northern edge of the reserve (an additional 65 km2) was purchased from
farmers from 2002 to 2004 and is being left to return to a wild state through natural
succession (J. Hennop, pers. comm.). During the period covered by this study, the existing
fence was not removed to incorporate this new land. 2006 was a comparatively wet year, with
713 mm of rainfall.
Gauteng Nature Conservation (1997) lists the large mammals present in the reserve as
eland, kudu, red hartebeest, zebra, black wildebeest, blesbok, oribi, leopard, brown hyena,
black backed jackal, baboon, porcupine, springbuck, reedbuck, grey rhebuck, mountain
reedbuck, common duiker, steenbok, aardwolf, silver fox, mongoose, genet and aardvark.
Although leopards are listed as present, no sign of leopard has been seen in the reserve for
over a decade (J. Hennop, pers. comm.). Gauteng Nature Conservation (1997) also lists black
eagles, a predator of baboons (Cowlishaw, 1994), as present in the reserve. In fact, there was a
single pair of black eagles in the reserve (J. Hennop, pers. comm.). Therefore, although there
are many potential competitors of baboons, there are no potential predators other than brown
hyena and a pair of black eagles. Natural predation of baboons in the reserve is therefore low
if present.

21
Figure 2 Top: Maps showing the location of Gauteng Province (in red) in South Africa
(Wikipedia) and the Suikerbosrand Nature Reserve (in green) in Gauteng (adapted from a
map of Gauteng from http://www.findandstay.co.za). Bottom: Map of the Suikerbosrand
Nature Reserve showing habitat types (adapted from a tourist map; Gauteng Nature
Conservation, 1997) with wooded areas in green, Acacia forest in yellow, Protea veld in
orange, aloe forest in purple, the dam in dark blue, the vlei in light blue and the tourist route
in red. The remainder of the reserve is grassland. The new land to the north has been left
blank.

22
2.2 Cell-phone telemetry collars
Towards the end of 2005, the Suikerbosrand Nature Reserve management, together
with the Gauteng Department of Agriculture, Conservation, Environment and Land Affairs,
set out to collar 12 baboons (1 in each of the 12 troops in the reserve) with cell-phone
telemetry collars purchased from Africa Wildlife Tracking (www.awt.co.za). For each troop, a
sample of about 5 to 10 baboons were caught in cage traps baited with vegetables. An adult
female was fitted with a cell-phone telemetry collar; females were selected as they are less
likely than males to change troops (Weingrill et al., 2000). The cell-phone telemetry collars
use a GPS (global positioning system) to calculate co-ordinates in degrees latitude and
longitude. These co-ordinates are sent via SMS to a GSM network. The data were accessed
via the Africa Wildlife Tracking website www.yrless.com. The collars were only active during
the day and the time interval between SMSs was set to 4 hours to conserve the battery life of
the collars. When cell-phone coverage was unavailable, each collar could store up to 240 GPS
co-ordinates to be sent off as soon as coverage improved (i.e. when collared individuals were
within the range of a cell phone mast). The collars had a battery life of approximately 18
months.
2.3 Baboon census
In October 2006, I participated in a census of the baboon population conducted by the
Suikerbosrand management. The technique used was a known group count (Matthews, 2005)
in which the radio telemetry collars were used to guide teams of counters to each of the
troops. The teams would then follow the troops until they had a clear view to count as many
of the individuals as possible.
2.4 Space use
2.4.1 Data Collection
The space use of the baboons was monitored using the GPS data provided by the
collars. For each troop, the movement of the female fitted with the collar was used as a
surrogate for the movement of the whole troop. GPS coordinates for one year (March 2006 to
February 2007) were downloaded from the Africa Wildlife Tracking website www.yrless.com.
ArcMap9 (ESRI 2004) a GIS software package, was used to overlay the GPS co-
ordinates of the troops onto a map of the Suikerbosrand and surrounding areas and Hawth‟s
Analysis Tools© (Beyer 2004) were used to analyse the data in ArcMap9. The Count Points in
Polygons tool was used to obtain the percentage of each troop‟s GPS co-ordinates that fell
23
inside the reserve. This information was used as an estimate of the percentage of time each
troop spent inside the reserve. The Create Minimum Convex Polygons tool was used to
generate home ranges for the troops. This tool constructs the smallest possible convex
polygon around a collection of points (in this case, the GIS co-ordinates for each troop). This
method was used since the areas utilised by the troops were convex. Because the areas utilised
by the troops shifted substantially throughout the year, they were calculated separately for
each month so as to provide a more accurate indication of the actual surface area being used
by the troops at any one time. The Polygon in Polygon Analysis tool was used to calculate the
percentages of space use overlap between troops for each month. The same tool was used to
calculate the percentages of space use overlap between each troop and itself during different
months. This provided a measure of the degree to which each troop shifted its space use area
during the year.
2.4.2 Data analysis
The total percentage of time spent inside and outside the reserve by different troops in
Suikerbosrand Nature Reserve was used to identify the troops that had opportunities to raid
farmland and troops were grouped into categories (leavers, non-leavers and occasional
leavers) based on this result. The percentage of time spent outside the reserve each month by
leavers and occasional leavers was analysed using Friedman tests to assess when during the
year troops representing these categories spent the most time outside the reserve.
Troop size (from the census) was compared to leaving category using a Spearman's
rank correlation to ascertain whether leaving correlated with an increase in troop size.
The mean monthly space use areas of the troops were compared to leaving category
using a Spearman rank correlation to ascertain whether leaving correlated with a decrease in
monthly space use area.
The mean monthly space use overlaps of the troops were compared to leaving
category, using a Spearman rank correlation to establish whether leaving correlated with an
increase in space use overlap between troops. The monthly space use overlaps of each troop
were also compared to the time spent outside the reserve each month, using Spearman rank
correlations to assess whether the space use overlap with other troops increased during
months when they spent more time outside the reserve.
The spatio-temporal shifts in the space use area of each troop were analysed by
constructing matrices of month x month intra-troop space use overlap for all troops. Adjusted
residuals of each troop's inter-monthly space use overlaps were calculated using Matman™

24
(De Vries et al., 1993). The analyses generated adjusted residuals of Z values, with
significance (p < 0.05) achieved at Z > 1.96 or < -1.96: with positive values indicating
overlaps occurring more than by chance and negative values indicate overlaps occurring less
than by chance. The percentage of possible combinations of monthly space use areas that
were found to be significantly different (overlap less than by chance) indicate the amount
each troop shifted its space use area over the year. Thus 100% would indicate that all monthly
space use areas of a troop occupied significantly different areas from all other monthly space
use areas; and 0% would indicate that no monthly space use areas of a troop occupied a
significantly different area from any other space use area. The percentages of significantly
different monthly space use areas for each troop were then compared to leaving category,
using a Spearman's rank correlation to establish whether leaving correlated with an increase in
the shifting of a troop's space use area.
The Friedman tests were performed using Instat. 3 (GraphPad Software,
www.graphpad.com) and the Spearman rank correlations were performed using Statistica 7.1
(Statsoft Inc, www.statsoft.com).
2.5 Behaviour
2.5.1 Data collection
The behaviour of the baboons was recorded for one year from March 2006 to February
2007. During this time, eight days per month were spent in the reserve observing the baboons.
The baboons were not observed outside the reserve. The troops were sampled
opportunistically, by driving round the reserve until a troop was spotted. The road in the
reserve follows a figure-of-eight one-way route, 66km long. I drove around the reserve at 40
km/h twice each day of sampling: once in the morning, starting half an hour after sunrise and
once in the afternoon, starting four hours before sunset. To avoid sampling the areas along the
beginning of the route before those along the end of the route every day, permission was
gained from the reserve management to drive the wrong way around the route on weekdays.
This was done for four days per month (or half of the sampling time). Individuals of troops
were observed directly using 8 x 40 binoculars; observations were made from a car on the
road. Although it is impossible to know the effects of the road and the car on the baboon
troops, this was chosen as the least invasive and disruptive way to observe them, as cars are a
very common sight in the reserve, and baboons would have been habituated to these. Scan
sampling (Altmann, 1974) was used, with troops being scanned every minute for 40 minutes
or until they moved out of sight. Although scan sampling may have under-estimated brief

25
behavioural events (like aggression) it was the only way to record all the behavioural
categories in large, free living troops, which could move in and out of sight. Scanning every
minute was used in order to get a better estimate of rarely occurring behaviours. All
individuals were included in the scan (males, females and juveniles).
The following behavioural categories were scored: aggression, socio-positive
behaviour, motor play, self-grooming, vigilance, foraging and mating. Aggression was scored
when one baboon chased, bit, hit or roughly pulled another. Socio-positive behaviour was
scored when baboons groomed each other or when one or more baboons engaged in play-
fighting or chasing. Social play could be distinguished from aggressive interactions by the
lack of screams from the participants and the lack of spectator interest from the rest of the
troop. Play-fights also tended to be less one-sided than real fights (pers. obs.). Motor play was
scored when a baboon ran to and fro‟ for no apparent reason, rather than running away from
danger or to food or to keep up with the troop. Object play, when a baboon handled an object
for no apparent reason, was only observed twice and was therefore included with motor play.
Self-grooming was scored when a baboon teased through its own fur. Vigilance was scored
when a baboon stood on its hind legs and scanned its surroundings, rather than just standing
up to see what a nearby baboon was doing or to watch a fight in progress. Foraging was
scored when a baboon was actively extracting food from the environment (e.g. digging food
up or pulling food off trees), putting food in its mouth or chewing. Mating was scored
whenever a male mounted a female.
Each time that the troop was scanned, the number of individuals involved in each of
the above behaviours was recorded. As instantaneous scanning was used, no baboon was
assigned more than one behaviour for the same minute, though baboons not performing any
of the above mentioned behaviours (e.g. just sitting or moving) were not assigned behaviours.
For each troop sampled, I also recorded an estimate of the average number of
individuals visible for each group scan during the sample, together with the direction of
movement of the troop, the GPS co-ordinates of the location and the time and date of the
sample.
To identify the troop under observation in each sample, the time, GPS co-ordinates
and the direction of troop movement were matched up against the information on troop
movement from the data obtained from the cell-phone telemetry collars. Only on two
occasions was a troop observed twice in one day: AS39 on 20/08/2006 at 8:45 am and at 3:25
pm; and AS41 on 11/06/2006 at 9:14 am and at 3:02 pm.

26
2.5.2 Data analysis
For each troop, to obtain the total proportion of time spent performing each behaviour,
the total frequency (number of occurrences) of each behaviour over all samples was divided
by the total number of 'baboon minutes' for which the troop was observed over all samples,
using the following formula:
P = F ∕ Bm [Bm = (m1 x n1) + (m2 x n2) + (m3 x n3)....]
where:
P is the total proportion of the time spent performing a behaviour by the baboons in a troop;
F is the total frequency of the behaviour over all samples for the troop (i.e. over all
observation sessions);
Bm is the total number of baboon minutes for which the troop was observed over all
observation sessions;
m is the duration of one observation session in minutes (m1 = duration of session 1; m2 =
duration of session 2 etc.); and n is the average number of baboons visible during each group
scan for each session (n1 = average number of baboons in sample 1; n2 = average number of
baboons in sample 2 etc.).
The number of baboon minutes in a sample was calculated by multiplying the number
of minutes in the observation session (equal to the number of times the troop was scanned) by
the average number of baboons visible during each group scan. The baboon minutes for each
session were added together to obtain the total number of baboon minutes for which each
troop was observed. 'Baboon minutes' is essentially the total number of behavioural
observations possible for each troop during the study, and is therefore the best indicator of
sampling effort across the troops.
These calculations provided the proportion of the total time for which each troop was
observed in which the baboons spent performing a behaviour of interest, with P = 1 indicating
that all the baboons in the troop were constantly performing the behaviour and P = 0
indicating that the behaviour was not performed at all.
The GPS data from the troops were used to give each troop a status (non-leaver, leaver
or occasional leaver) based on the amount of time it spent outside the reserve. The proportion
behavioural data were arcsine transformed and a multivariate analysis of variance
(MANOVA) was used to test if troop status (leavers, occasional leavers and non-leavers)
influenced behaviour, with the number of baboon minutes for which a troop was observed
included as a covariate. A MANOVA was used since the behaviours scored were not

27
independent. Tukey post hoc tests were used to identify which behaviours were contributing
to the differences between troops of different status when α<0.05. Analyses were performed
using Statistica 7.1 (Statsoft Inc, www.statsoft.com).
2.6 Information from farmers
2.6.1 Data collection
Questionnaire surveys were used to obtain information from farmers about patterns in
raiding behaviour and their responses to baboon raiding. The questionnaire was composed
jointly by myself and Johnny Hennop of the Suikerbosrand management, and included
questions useful to my study and questions of interest to the Suikerbosrand (Figure 3).
English and Afrikaans versions were sent to all of the 25 landowners within the Suikerbosrand
area.
2.6.2. Data analysis
Those questions with choices for answers (e.g. Question 6; Figure 3) where each
respondent chose only one option were analyzed using chi square tests, to analyse the
likelihood of some responses occurring more often than chance.
The rest of the responses in the questionnaire were analysed qualitatively.

28
Questionnaire on Baboon activity: (Please answer the questions below and post back in supplied envelope.)
1). What do you farm?
2). What size is your farm (in hectares)?
3). How much of your land is actually cultivated (in hectares)?
4). Do baboons ever raid your farm?
Yes: No:
5). During which months do baboons most often raid your farm?
6). How often do raids occur during peak times?
Daily: Every other day: Twice a week: Once a week:
Less than once a week:
7). When, during the day, do baboons usually raid your farm?
Morning: Mid-day: Afternoon: Night:
8). Is damage caused by solitary animals or do troops work together when raiding?
Solitary animals: Troops:
9). Approximately what areas worth of crops do you lose to baboons every year (in
hectares)?
10). What other damages except for crop raids do baboons cause through their raids e.g. fruit
trees, poultry, damages to infrastructure etc?
11). What are your estimated Financial losses due to baboon raids every year (in rands)?
12). Have any of the baboons on your property been noticed as being marked with collars?
Yes: No:
13). Have any baboons acted in a threatening manner towards family members or employees
and if so what were the circumstances?
Yes: No:
If yes, please explain:
14). Do you ever shoot baboons? If so, About how many baboons do you shoot every year?
None: 1 – 5: 6 – 10: 10 – 15: 15 – 20:
20 – 30: 30 – 40: more than 40:
15). Which baboons do you usually target?
Big males: Big females: Small males:
Small females: Infants: random individuals:
16). Does shooting baboons seem effective as a way of reducing amount they raid?
Not at all effective: Somewhat effective: Very effective:
17). Have you tried anything else to stop baboons raiding your farm? If so, what?
Nothing: Electric fences: Scarecrows: Dogs: Other:
If other, please explain:
18). How affective have these methods been?
Not at all effective: Somewhat effective: Very effective:
19). What is your opinion on the roll Nature Conservation should play in managing the
baboon population?
All answers are kept confidential.
The answering of this questionnaire will assist us in compiling and implementing a
“management plan” that will work towards the conservation of the ecosystem and manage the
effects that Baboons might have.
Figure 3 Questionnaire survey sent to farmers around the Suikerbosrand Nature Reserve.

29
Chapter 3: Results
3.1 GPS data
Of the 12 known troops in the Suikerbosrand Nature Reserve at the time of study, an
adult female in 11 troops was successfully collared. Of these 11, one collar malfunctioned and
another only worked for the second half of the study period (i.e. from September 2006).
Therefore, GPS data were available for 9 of the 12 troops from March 2006 to February 2007
and for a 10th
troop from September 2006 to February 2007.
The home ranges of the troops taken over the entire year varied from 15.7 km2 to 55.6
km2. However, monthly space use areas were much smaller, varying from 2.1 km
2 to 28 km
2.
This difference is due to the troops shifting their space use areas temporally and spatially.
There was a wide range in within-troop variation in space use area, with overlap between a
troop‟s space use area for one month compared to the same troop‟s space use area for a
different month ranging from 0% to 100%. Inter-troop overlap was also very variable with
some troops only overlapping a few percent with one or two other collared troops for a few
months of the year, and other troops sharing most of their space use area with several other
troops for most of the year. The troops also varied in the amount of time spent outside the
reserve, with some troops never leaving the reserve and others spending most of their time on
privately owned land.
Figure 4 shows the extent of each troop's home range, taken over the entire year in
order to display the general location of each troop. The troops' names (e.g. AS55) used below
were obtained from the names of the cell phone telemetry collars used to track them.
Although many troops were moving out onto farmland to the east, south and west of the
reserve, the new land in the north of the reserve was still largely unoccupied.

30
Figure 4 Map of the Suikerbosrand Nature Reserve showing minimum area convex polygons
constructed around all GPS data points throughout the year (March 2006 to February 2007)
for each of the 10 troops successfully monitored with GPS collars. AS33: orange; AS35:
purple; AS36: dark pink; AS39: yellow; AS41: light pink; AS42: dark green; AS43: light
green; AS44: light blue; AS45: blue; AS55: navy blue. Data for AS44 were only available for
6 months, from September 2006 to February 2007, and no data were available for AS40 as
this collar malfunctioned. The reserve boundary and the fence separating the new land are
shown in stippled black.
3.1.1 Time spent outside the reserve
Of the 10 troops for which GPS data were available, two of the troops never left the
reserve, five troops spent less than 5% of their time outside the reserve, and three troops spent
more than 40% of their time outside the reserve (Table 1). Based on these differences, troops

31
were assigned to one of three categories: leavers (L) - spent more than 40% of their time
outside the reserve; occasional leavers (O) - spent between 0 and 5% of their time outside the
reserve; and non-leavers (N) - never left the reserve during the study (Table 1). The amount of
time spent outside the reserve, however, did not necessarily correlate with time spent raiding
farmland so leaver troops did not necessarily spend more time raiding farmland than
occasional leaver troops.
Table 1 Percentage of time spent outside of the reserve by 10 baboon troops in Suikerbosrand
Nature Reserve (March 2006 – February 2007). The status of a troop was based on the
percentage of time spent outside the reserve.
Troop
identity
% time outside
the reserve Status
AS33 0.0 Non leaver
AS35 52.7 Leaver
AS36 74.1 Leaver
AS39 0.0 Non leaver
AS41 46.4 Leaver
AS42 3.3 Occasional leaver
AS43 4.3 Occasional leaver
AS44* 2.3 Occasional leaver
AS45 2.3 Occasional leaver
AS55 3.8 Occasional leaver
* Data for AS44 were available for only 6 months from September 2006
I predicted that troops leaving the reserve to raid farmland would spend more time
outside the reserve in the early dry season when maize ripens, and troops leaving the reserve
to forage on natural land would spend more time outside the reserve during the late dry
season, when food was scarce in the reserve. Although the seasonality of time spent outside
the reserve varied widely between troops (Figure 5a, b), the Friedman test revealed a
significant effect of month on the time spent outside for occasional leavers (Fr = 24.43; p =
0.011; n = 4) with the most time being spent outside in June, July, August, January and
February. (AS44 was omitted from analysis.) There was no significant effect of month on time
spent outside the reserve for leavers (Fr = 12.47; p = 0.330, n = 3).

32
Figure 5 Percentage time spent outside the reserve by a) leavers and b) occasional leavers for
each month from March 2006 to February 2007. Data for AS44 were available from
September 2006 only.
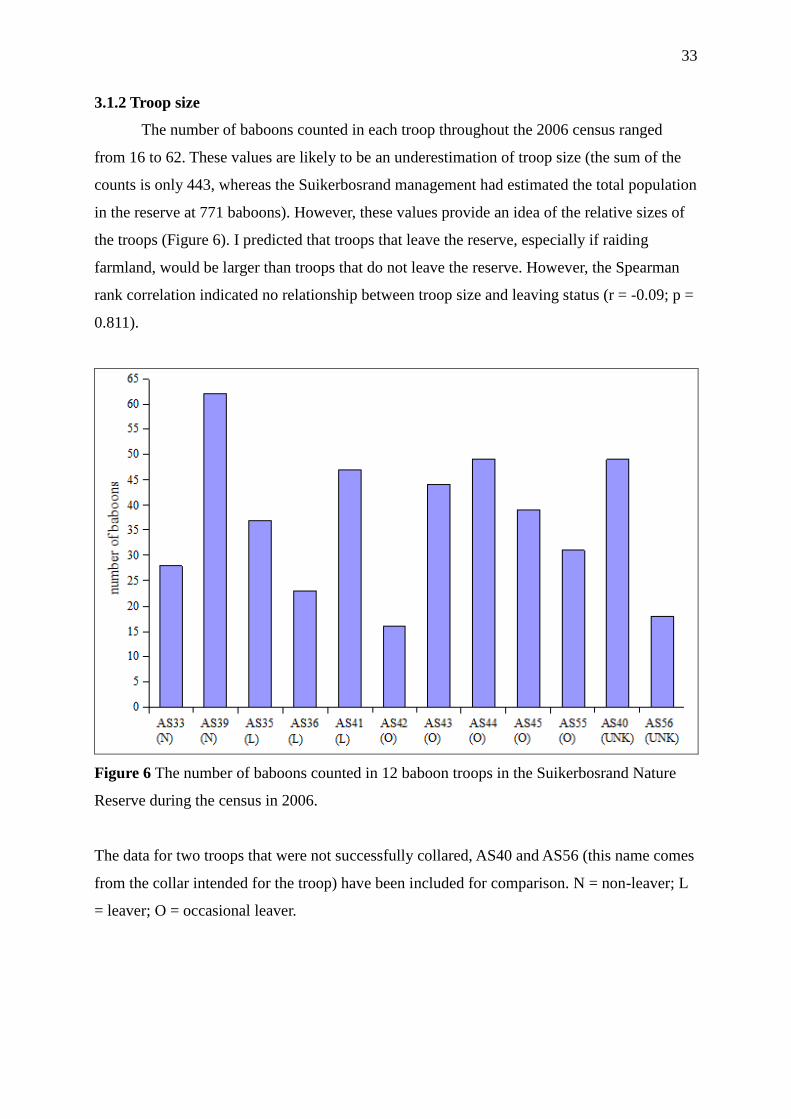
33
3.1.2 Troop size
The number of baboons counted in each troop throughout the 2006 census ranged
from 16 to 62. These values are likely to be an underestimation of troop size (the sum of the
counts is only 443, whereas the Suikerbosrand management had estimated the total population
in the reserve at 771 baboons). However, these values provide an idea of the relative sizes of
the troops (Figure 6). I predicted that troops that leave the reserve, especially if raiding
farmland, would be larger than troops that do not leave the reserve. However, the Spearman
rank correlation indicated no relationship between troop size and leaving status (r = -0.09; p =
0.811).
Figure 6 The number of baboons counted in 12 baboon troops in the Suikerbosrand Nature
Reserve during the census in 2006.
The data for two troops that were not successfully collared, AS40 and AS56 (this name comes
from the collar intended for the troop) have been included for comparison. N = non-leaver; L
= leaver; O = occasional leaver.

34
3.1.3 Space use area
As some of the troops shifted their space use areas substantially throughout the study
period, the home ranges as calculated for the whole year of sampling were larger than the
actual space used by the troops from day to day (Figure 7). Therefore, mean monthly space
use areas have been provided instead (Figure 8). I predicted that troops leaving the reserve to
raid farmland would have small monthly space use areas and troops leaving the reserve to
forage on fallow land would have large monthly space use areas. However, the Spearman rank
correlation indicated no relationship between mean monthly space use area and leaving status
(r = 0.165; p = 0.657).
Figure 7 Representative map of the monthly space use of troop AS42, an occasional leaver
troop. For troops such as this that shifted their areas of land use to a high degree throughout
the year, a home range taken over the whole year would considerably overestimate the area
utilized by the troop.

35
Figure 8 Mean (with standard error bars) monthly space use areas (km2) for 10 baboon troops
in the Suikerbosrand Nature Reserve. N = non-leaver; L = leaver; O = occasional leaver.
3.1.4 Monthly space use overlap
Inter-troop space use overlap was very variable with some troops only overlapping a
few percent with one or two other troops for a few months of the year, and other troops
sharing most of their space use areas with several other troops for most of the year (Table 2;
Figure 9). I predicted that troops leaving the reserve to raid farmland would have large space
use overlaps with other troops and troops leaving the reserve to forage on uncultivated land
should have small space use overlaps with other troops. The Spearman rank correlation did
show a significant correlation between space use overlap and leaving status (r = 0.651; p =
0.049), with occasional leavers overlapping with other troops the most and leavers
overlapping with other troops the least.

36
Table 2 The number of other troops that each troop overlapped with and total % space use
overlap for each troop, from March 2006 To February 2007 in the Suikerbosrand Nature
Reserve. Data for AS44 were only available from September 2006. N = non-leaver; L =
leaver; O = occasional leaver. Month AS33
(N)
AS35
(L)
AS36
(L)
AS39
(N)
AS41
(L)
AS42
(O)
AS43
(O)
AS44
(O)
AS45
(O)
AS55
(O)
no. % no. % no. % no. % no. % no. % no. % no. % no. % no. %
March 0 0 0 0 2 8 3 7 0 0 2 2 3 35 0 0 2 10
April 0 0 1 4 3 12 4 24 0 0 3 32 3 48 2 3 2 19
May 0 0 0 0 4 18 5 23 0 0 3 9 3 88 2 1 3 44
June 0 0 1 4 3 31 4 28 0 0 1 12 3 114 1 2 3 61
July 0 0 1 7 0 0 3 30 0 0 1 19 2 50 1 4 2 44
Aug 0 0 1 5 2 10 3 18 0 0 2 19 3 62 1 2 2 53
Sept 0 0 0 0 0 0 3 23 0 0 2 39 3 47 1 19 1 6 2 26
Oct 0 0 0 0 2 23 3 28 0 0 3 62 4 56 1 42 1 16 2 26
Nov 1 12 1 4 2 31 3 24 0 0 3 85 4 68 1 71 3 23 2 7
Dec 0 0 1 17 3 37 4 53 1 1 3 92 4 107 1 48 2 25 2 34
Jan 0 0 1 10 2 22 3 36 0 0 3 70 4 96 1 39 2 37 2 36
Feb 0 0 1 17 1 4 3 30 0 0 3 21 3 31 1 62 2 27 2 21
Figure 9 Mean (with standard error bars) monthly space use overlap with other troops for 10
baboon troops in the Suikerbosrand Nature Reserve. N = non-leaver; L = leaver; O =
occasional leaver.
I predicted that troops leaving the reserve to forage on uncultivated land would have
smaller space use overlaps with other troops at times of the year when they spent more time
outside the reserve, while troops leaving the reserve to raid farmland would have larger space
use overlaps at time of the year when they spent more time outside the reserve. Spearman
rank correlations found no relationship between space use overlap and the percentage of time
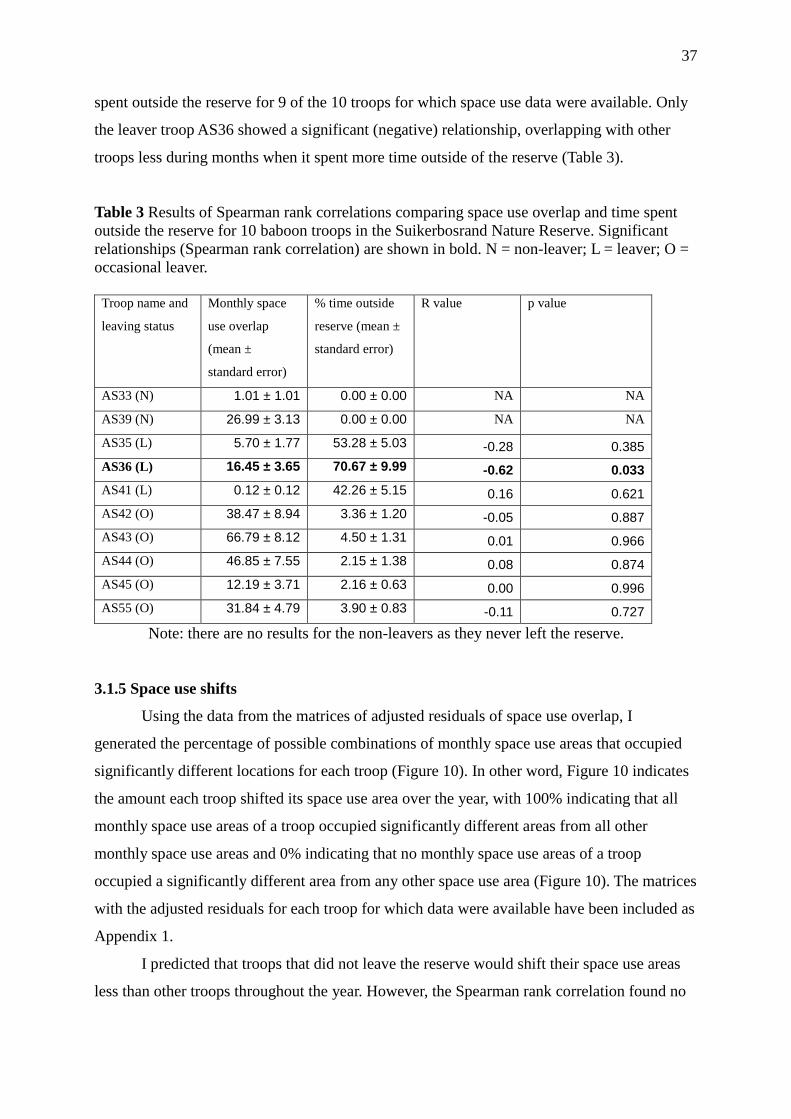
37
spent outside the reserve for 9 of the 10 troops for which space use data were available. Only
the leaver troop AS36 showed a significant (negative) relationship, overlapping with other
troops less during months when it spent more time outside of the reserve (Table 3).
Table 3 Results of Spearman rank correlations comparing space use overlap and time spent
outside the reserve for 10 baboon troops in the Suikerbosrand Nature Reserve. Significant
relationships (Spearman rank correlation) are shown in bold. N = non-leaver; L = leaver; O =
occasional leaver.
Troop name and
leaving status
Monthly space
use overlap
(mean ±
standard error)
% time outside
reserve (mean ±
standard error)
R value p value
AS33 (N) 1.01 ± 1.01 0.00 ± 0.00 NA NA
AS39 (N) 26.99 ± 3.13 0.00 ± 0.00 NA NA
AS35 (L) 5.70 ± 1.77 53.28 ± 5.03 -0.28 0.385
AS36 (L) 16.45 ± 3.65 70.67 ± 9.99 -0.62 0.033
AS41 (L) 0.12 ± 0.12 42.26 ± 5.15 0.16 0.621
AS42 (O) 38.47 ± 8.94 3.36 ± 1.20 -0.05 0.887
AS43 (O) 66.79 ± 8.12 4.50 ± 1.31 0.01 0.966
AS44 (O) 46.85 ± 7.55 2.15 ± 1.38 0.08 0.874
AS45 (O) 12.19 ± 3.71 2.16 ± 0.63 0.00 0.996
AS55 (O) 31.84 ± 4.79 3.90 ± 0.83 -0.11 0.727
Note: there are no results for the non-leavers as they never left the reserve.
3.1.5 Space use shifts
Using the data from the matrices of adjusted residuals of space use overlap, I
generated the percentage of possible combinations of monthly space use areas that occupied
significantly different locations for each troop (Figure 10). In other word, Figure 10 indicates
the amount each troop shifted its space use area over the year, with 100% indicating that all
monthly space use areas of a troop occupied significantly different areas from all other
monthly space use areas and 0% indicating that no monthly space use areas of a troop
occupied a significantly different area from any other space use area (Figure 10). The matrices
with the adjusted residuals for each troop for which data were available have been included as
Appendix 1.
I predicted that troops that did not leave the reserve would shift their space use areas
less than other troops throughout the year. However, the Spearman rank correlation found no

38
relationship between percentage of significantly different monthly space use areas and leaving
status (r = 0.30; p = 0.387).
Figure 10 The percentage of possible combinations of monthly space use areas that are
significantly different (Z > 1.96, p < 0.05) for 10 baboon troops in the Suikerbosrand Nature
Reserve. N = non-leaver; L = leaver; O = occasional leaver.
3.2. Behaviour
Of the10 troops for which GPS data were available, one of the leaver troops (AS35)
was not sampled, since its home range did not overlap with the road that I travelled in
Suikerbosrand Nature Reserve during my study. Therefore, I analysed behavioural data for
only 9 troops: 2 non-leavers, 2 leavers and 5 occasional leavers (Table 4). Most of the
occasional leavers (AS42, AS43, AS44 and AS55) were only observed during the second half
of the study period (September 2006 to February 2007) as their areas of space use only
overlapped with the road during this period.

39
Table 4 The number of sampling sessions, baboon minutes and total minutes of observation
time for each of 10 baboon troops in the Suikerbosrand Nature Reserve.
Troop
Identity Leaving Status
Number of
Sampling Sessions
Baboon
Minutes
Total
Minutes
AS33 Non-leaver 11 1845 146
AS39 Non-leaver 21 4380 388
AS35 Leaver 0 0 0
AS36 Leaver 5 892 62
AS41 Leaver 22 4852 298
AS42 Occasional Leaver 13 2000 191
AS43 Occasional Leaver 2 390 26
AS44 Occasional Leaver 7 1100 81
AS45 Occasional Leaver 4 510 42
AS55 Occasional Leaver 1 150 10
Overall, foraging was the most common behaviour exhibited by the baboons, with
troops spending around 15 to 40 % of their time foraging (Figure 11a). Socio-positive
interactions were the second most common, accounting for around 5 to 10 % of the time
(Figure 11a). Aggression was the third most common, accounting for around 1 to 3 % of the
time and self-grooming, mating, vigilance and motor play were rarely seen, with each
accounting for less than 1 % of the baboons‟ time (Figure 11b). Because there was such a
large difference in the amount that different behaviours were observed, the data for foraging
and socio-positive interactions (Figure 11a) has been displayed separately from the data for
the other behaviours (Figure 11 b) so that inter-troop differences in rare behaviours can be
seen.
The MANOVA revealed that the covariate, number of baboon minutes, had no
significant effect on the behaviour data (F1,5 = 130.46; p = 0.066). The leaving status of the
troops, however, did have a significant effect (F2,10 = 56.21 p = 0.018). Post hoc tests revealed
that this significance was primarily due to the data on foraging and on self-grooming. Leavers
displayed significantly more self-grooming than occasional leavers, with non-leavers falling
somewhere in between. Non-leavers displayed significantly more foraging than leavers, with
occasional leavers falling somewhere in between. Detailed comparisons of behaviours among
the troops (i.e. the post hoc analyses) are provided below.

40
Figure 11 Total proportion of the time that each of 9 baboon troops spent on a) foraging and
socio-positive behaviour and b) aggression, self-grooming, mating, vigilance and motor play.
Data for non-leavers are shown in blue, leavers in red and occasional leavers in yellow.
foraging socio-positive
0.00
0.05
0.10
0.15
0.20
0.25
0.30
0.35
0.40
0.45
a) Foraging and socio-positive behaviour
AS33
AS39
AS36
AS41
AS42
AS43
AS44
AS45
AS55
Pro
port
ion o
f tim
e s
pent
on e
ach b
ehavio
ur
41
3.2.1 Aggression, self-grooming and mating
Aggression, self-grooming and mating were all predicted to be more common in
raiding troops than in non-raiding troops due to lethal retaliation from farmers. Although the
levels of aggression observed for non-leavers were lower than those observed for the leavers
and most of the occasional leavers (Figure 11a), the difference was not significant. The results
therefore do not confirm this prediction. The two occasional leaver troops with low levels of
observed aggression (AS43 and AS55), were only observed for 2 and 1 sampling sessions, or
390 and 150 baboon minutes, respectively (Table 4).
Self-grooming was significantly different between leaving categories. However, while
leaver troops had high levels of self-grooming as predicted, occasional leavers had very low
levels of self-grooming and non-leavers had levels of self-grooming close to those of the
leavers (Figure 11b). The results therefore support the prediction for the leaver troops, but not
for the occasional leaver or non-leaver troops.
Although the levels of mating observed for the occasional leavers (except for troop
AS55) were higher than those observed for leavers and non-leavers (Figure 11b), there was no
significant difference in levels of mating between troops in the three categories. The results
therefore do not confirm this prediction. The occasional leaver troop with no observed mating
(AS55) was only observed for 1 sampling session or 150 baboon minutes (Table 4).
3.2.2 Foraging
Foraging was predicted to be more common in non-raiding troops than in raiding
troops due to intensive foraging outside the reserve by raiding troops. The results confirm this
prediction, with non-leavers displaying significantly more foraging than leavers, and with
occasional leavers falling somewhere in between (Figure 11a).
3.2.3 Vigilance, motor play and socio-positive behaviour
Vigilance, motor play and socio-positive behaviour were not predicted to differ
between raiding and non-raiding troops. Although the levels of vigilance observed for non-
leavers were lower than those observed for the leaver and most of the occasional leaver
troops, the difference was not significant (Figure 11b). The two occasional leaver troops with
low levels of observed vigilance (AS 43 and AS55), were only observed for 2 and 1 sampling
sessions, or 390 and 150 baboon minutes, respectively (Table 4).

42
Although there was quite a large variation in the levels of motor play between troops
(Figure 11b), there was no significant difference in levels of motor play between troops in the
three leaving status categories.
There was no difference in levels of socio-positive behaviour between troops in the
three categories (Figure 11a). Occasional leaver AS55, which displayed very high levels of
socio-positive behaviour, was only observed for 1 sampling session or 150 baboon minutes
(Table 4).
3.3 Questionnaire surveys
Of the 25 questionnaires distributed to land owners in the vicinity of the
Suikerbosrand Nature Reserve, 14 (56%) were returned. Of the19 questions in the
questionnaire, only 6 could be analysed using statistical tests (questions 4, 6, 13, 14, 16 and
18). These were the multiple choice questions for which respondents each chose only one
answer. The rest were considered qualitatively.
For question 4 (Do baboons ever raid your farm?), a significant majority (11 of 14) of
the respondents answered yes, indicating that most land owners in the area do get baboons on
their land (χ12 = 4.57; p = 0.033).
For question 6 (How often do raids occur during peak times?), 4 of the respondents
said daily, 2 said every other day, 1 said twice a week, 1 said once a week and 5 said less than
once a week. There was no significant trend in the answers to this question (χ42 = 3.62; p =
0.460).
For question 13 (Have any baboons acted in a threatening manner towards family
members or employees and if so what were the circumstances?), a significant majority (12 of
14) of the respondents answered no, indicating that the baboons do not pose a threat to people
(χ12 = 7.14; p = 0.008). Of the 2 that answered yes, 1 said only that his workers are scared of
the baboons and refused to go near them, while the other said that the baboons come close to
his house in a threatening way.
For question 14 (Do you ever shoot baboons? If so, about how many do baboons do
you shoot every year?), a significant majority (10 of 14) of the respondents answered none
(χ72 = 48.86; p = 0.000). Of the remaining 4 respondents, 3 answered between 1- 5 baboons
per year and one answered between 10 - 15 baboons per year.
For question 16 (Does shooting baboons seem effective as a way of reducing the
amount they raid?), 5 of the 7 respondents who answered the question answered somewhat
effective and the other two answered not at all effective. There was no significant trend in the

43
answers to this question (χ22 = 5.43; p = 0.066). Two of the respondents who claimed not to
shoot baboons answered this question as well, indicating inconsistency in the responses. Their
answers have been included here. One answered 'not at all effective' while the other answered
'somewhat effective'.
For question 18 (How effective have these methods [alternatives to shooting] been?), 2
of the respondents who answered this question chose not at all effective, 5 chose somewhat
effective and 2 chose very effective. There was no significant trend in the answers to this
question (χ22 = 2; p > 0.368). The alternate methods in question were electric fencing, dogs,
scarecrows and scaring baboons with loud noise and bright light.
3.3.1 Raiding by baboons
Most land owners reported that baboons do raid their farms, though losses tended to be
minimal (Table 5). Only maize and bean farmers sustained significant losses (numbers 3 &
10), though one maize farmer reported losing only garden fruit and eggs (number 14) and one
dairy farmer had milk machines broken by baboons (number 8). The maize and bean farms
(numbers 3 & 10) were raided daily, while most other plots were raided less often. Several
plots were raided mainly during winter for items such as garden fruit and vegetables (numbers
1, 4 & 14), garbage (number 6), animal fodder (number 7) and eggs (number 14). Others were
raided more throughout the year for items such as maize and beans (number 3) and water
(number 13). Others reported increased raiding when crops or fruit were ripe (numbers 5, 9 &
10). Garden fruit and vegetables and fodder were also reported by two land owners to be
raided mainly during the summer months (numbers 11 & 12). Overall, raiding was reported
throughout the year, with an increase in peak raiding reported during winter (Figure 12).
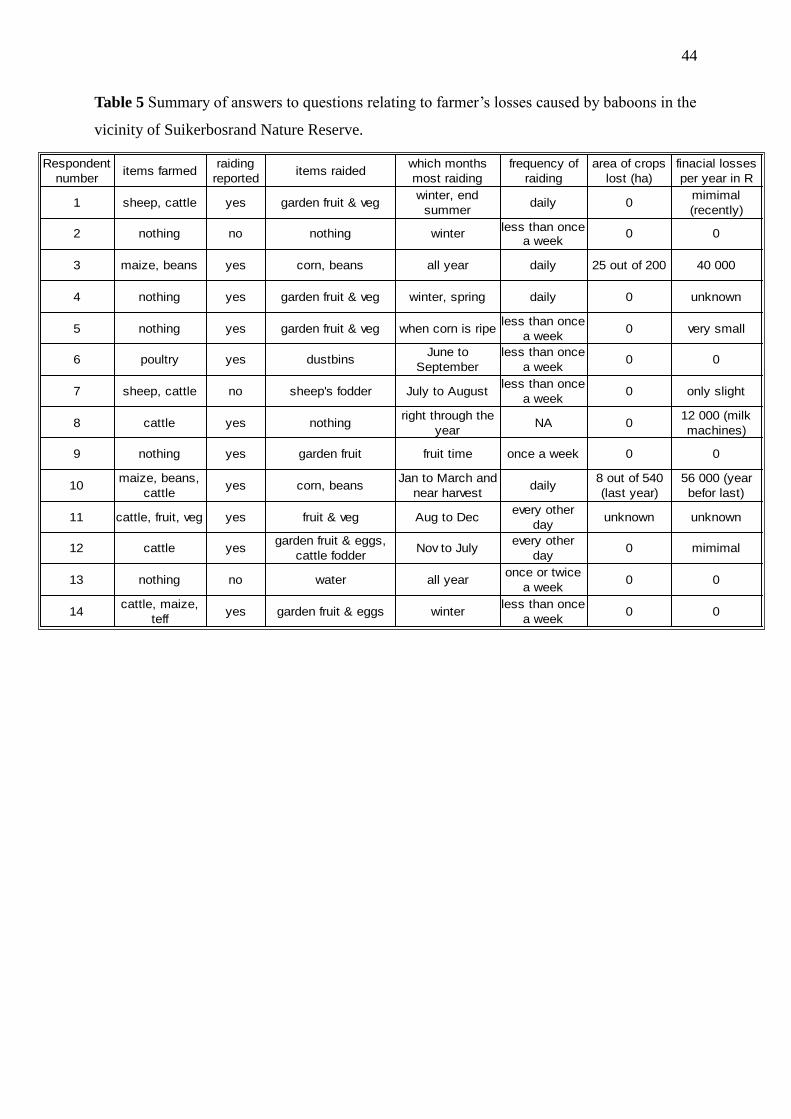
44
Table 5 Summary of answers to questions relating to farmer‟s losses caused by baboons in the
vicinity of Suikerbosrand Nature Reserve.
items farmed items raided
1 sheep, cattle yes garden fruit & veg daily 0
2 nothing no nothing winter 0 0
3 maize, beans yes corn, beans all year daily 25 out of 200 40 000
4 nothing yes garden fruit & veg winter, spring daily 0 unknown
5 nothing yes garden fruit & veg when corn is ripe 0 very small
6 poultry yes dustbins 0 0
7 sheep, cattle no sheep's fodder July to August 0 only slight
8 cattle yes nothing NA 0
9 nothing yes garden fruit fruit time once a week 0 0
10 yes corn, beans daily
11 cattle, fruit, veg yes fruit & veg Aug to Dec unknown unknown
12 cattle yes Nov to July 0 mimimal
13 nothing no water all year 0 0
14 yes garden fruit & eggs winter 0 0
Respondent
number
raiding
reported
which months
most raiding
frequency of
raiding
area of crops
lost (ha)
finacial losses
per year in R
winter, end
summer
mimimal
(recently)
less than once a week
less than once
a week
June to
September
less than once
a week
less than once
a week
right through the
year
12 000 (milk
machines)
maize, beans,
cattle
Jan to March and
near harvest
8 out of 540
(last year)
56 000 (year
befor last)
every other
day
garden fruit & eggs,
cattle fodder
every other
day
once or twice
a week
cattle, maize,
teff
less than once
a week

45
Figure 12 Number of times that raiding was reported in each month by farmers in the vicinity
of Suikerbosrand Nature Reserve. The data were in response to Question 5 (During which
months do baboons most often raid your farm?).
3.3.2 Reactions of farmers
Only four of the respondents reported shooting baboons. Others tried a variety of
alternative strategies to reduce raiding such as using guard dogs, electric fences, scarecrows
or using light and noise to scare away the baboons (Table 6). Both of the respondents who
said that the baboons were acting threateningly towards people reported shooting baboons
(numbers 3 & 5). Both of the farmers who were regularly suffering financial losses reported
shooting baboons (numbers 3 & 10). The only other person to report shooting baboons also
mentioned that six of his dogs were killed by baboons (number 11). Of the four who shot
baboons, three reported targeting large males (numbers 3, 5 & 11), one reported shooting
large females (number 3) and two reported shooting individuals randomly (numbers 3 & 10).
Shooting baboons was mostly reported as a partly effective way of reducing raiding, with one
farmer claiming that the baboon troop would stay away from his farm for a day to a week
after he shot one (number 10).
Four respondents reported using electric fencing to keep baboons out (numbers 1, 2, 3
& 6). They found this method to be anything from very effective to not at all effective. Seven
Jan Feb March April May June July Aug Sept Oct Nov Dec
0
1
2
3
4
5
6
7
8
9
10
no.
of
tim
es
month
report
ed a
s peak r
aid
ing t
ime

46
respondents reported using dogs to keep baboons away (numbers 1, 2, 4, 8, 9, 12 & 13).
Again, this was found to be anything from not at all effective to very effective, but mostly
partially effective. Also, four of the respondents reported having dogs attacked or killed by
baboons (numbers 6, 8, 9 & 11). Two respondents reported using light reflected from a mirror
and / or loud noises such as fire crackers to scare away baboons (numbers 11 & 14). This was
found to be somewhat effective. Finally, one respondent (number 9) reported using a
scarecrow to keep baboons away. This was not at all effective.
Table 6 Summary of answers to questions relating to farmers' reactions to raiding by baboons
in Suikerbosrand Nature Reserve.
no. no. shot target effective what else tried effective notes
1 no 0 NA NA very
2 0 no 0 random somewhat somewhat
3 40 000 10 to 15 not at all electic fencing not at all
4 unknown no 0 NA NA dogs somewhat
5 very small 1 to 5 big males somewhat nothing NA
6 0 no 0 NA NA electric fencing very dog savaged
7 only slight no 0 NA NA nothing NA
8 12 000 no 0 NA NA dogs NA dogs killed
9 0 no 0 NA NA not at all dogs killed
10 no 1 to 5 random somewhat nothing NA
11 unknown no 1 to 5 big males somewhat noise somewhat 6 dogs killed
12 mimimal no 0 NA somewhat dogs NA
13 0 no 0 NA NA dogs somewhat
14 0 no 0 NA NA noise & mirror somewhat
finacial losses
per year in R
seen as
threat
mimimal
(recently)
electic fencing,
dogs
electic fencing, dogs
yes (scare
workers)
big males, big
females, random
yes (come
near house)
scarecrows,
dogs
56 000 (prev.
year)
stay away for a day
or week when shot

47
Chapter 4: Discussion and Recommendations
4.1 Space use and raiding
4.1.1 Recap of Aims and Predictions
The primary aim of the space use aspect of this study was to use the GPS data to
investigate which troops were raiding farmland and to investigate which troops, if any, are
leaving the reserve due to resource scarcity. The data were also used to examine the behaviour
of leaving and non-leaving troops. Time spent outside the reserve was taken as a general
indication of the opportunity to raid farmland, and as either an indication of actual raiding or
the need to forage outside of the reserve due to resource scarcity within the reserve.
Troops leaving the reserve to raid were expected to display the following
characteristics: spending more time outside the reserve in the early dry season when maize is
ripe, forming larger troops, using smaller areas of land on a monthly basis and / or
overlapping more with other troops (especially at times of the year when they spend more
time outside the reserve) and shifting their space use areas to a large extent throughout the
year.
Troops leaving the reserve to forage on fallow land were expected to display the
following characteristics: spending more time outside the reserve in the late dry season when
resources are most scarce, forming larger troops (though not as large as raiding troops), using
larger areas of land on a monthly basis and /or overlapping less with other troops (especially
at times of the year when they spend more time outside the reserve) and shifting their space
use areas to a large extent throughout the year.
Non-raiding troops that were able to find sufficient food within the reserve were
expected to display the following characteristics: never leaving the reserve, forming smaller
troops, using intermediate sized areas of land on a monthly basis and overlapping with other
troops to an intermediate degree (intermediate meaning between that of raiding troops and
troops foraging on fallow land) and shifting their space use areas to a small extent throughout
the year.
4.1.2 Time outside the reserve
In terms of time spent outside the reserve, the 10 troops for which GPS data were
available grouped naturally into 3 distinct categories. 2 troops (classified as non-leavers)
never left the reserve, 5 troops (classified as occasional leavers) spent < 5 % of their time

48
outside the reserve and 3 troops (classified as leavers) spent between 45 and 75 % of their
time outside the reserve.
The non-leaver troops are therefore likely to be troops that did not raid and are able to
find enough food within the reserve. The other two categories of troops that did leave the
reserve are likely to be troops that either raid farmland or forage on fallow land due to
difficulty in finding sufficient resources within the reserve (or a combination of both of these).
The occasional leaver troops were the most likely candidates for troops that were leaving the
reserve specifically to raid farmland, as it is unlikely that troops would be able to sufficiently
supplement their diet to any significant extent by foraging on fallow land for <5 % of the
time. Cultivated land, however, could provide large quantities of food in very short periods of
time.
The leaver troops were the most likely candidates for troops that are foraging on
fallow land. As troops should not spend more time in the relatively high risk areas outside the
reserve than necessary, the large amount of time spent outside the reserve by leaver troops
suggests a foraging behaviour less efficient than the raiding of agricultural land. This does not
mean, however, that the leaver troops are not raiding farmland in addition to foraging on
fallow land.
These assumptions are supported by the findings of Segal (2008) who studied the diet
of the same troops over the same period as this study. She found that the faecal matter of the
two non-leaver troops averaged 0 and < 1 % maize over the year. The faecal matter of 4 of the
5 occasional leaver troops contained between 1 and 5 % maize, while that of the 5th
occasional leaver troop (AS42) contained almost 25 % maize. Of the 3 leaver troops,
sufficient faecal matter for analysis could only be gathered from 1 (AS41) which contained
about 3 % maize. This pattern also fits the findings of Cowlishaw (1997 a & b) that baboons
will avoid high risk areas if possible, and will forage on resource rich, high risk areas as
quickly as possible before leaving for safer areas.
The division of the Suikerbosrand troops into the 3 categories is similar to the finding
of Strum (1994) who found that olive baboon troops responded to a shortage of natural
foraging land in a variety of ways, from enlarging or shifting home ranges or reducing troop
sizes to avoid raiding, to raiding as a backup strategy or raiding as the primary foraging
strategy.
In terms of the seasonality of time spent outside the reserve, the occasional leavers
spent more time outside the reserve in the mid to late dry season and in the late rainy season
than at other times of the year. This is contrary to the expectation that occasional leavers

49
would spend more time outside the reserve in the early dry season when maize is ripe.
However, Segal (2008) found kernels of maize in the faecal matter of the troops throughout
the year, indicating that farmers do not securely store their grain after the harvest, making it
available long after the early dry season. It has also been found that baboons will feed on parts
of the maize plant throughout its life cycle, not only on the fruit (Naughton-Treves et al.,
1998). The increase in time spent outside during the late dry season may indicate that raiding
behaviour is being stimulated be periods of natural food scarcity, as has been found by
Naughton-Treves et al. (1998). Another possibility is that the abundant availability of maize in
the early dry season allows troops to raid more efficiently, thus requiring less time out of the
reserve during this part of the year.
There was no pattern to the seasonality of time spent outside the reserve by leaver
troops. This suggests that leaver troops are responding to the availability of agricultural food
and to natural food shortages in different ways, preventing a common pattern from emerging
across all leaver troops.
4.1.3 Troop size
There was no relationship between troop size and leaving status. This is contrary to
research suggesting that baboons form larger troops in response to greater predation pressure
(Barton et al., 1996; Henzi et al., 1997). This could be because the normal predator defence of
mobbing potential predators is unlikely to be effective against farmers with guns. Shooting of
baboons by farmers may also be limiting the growth of troops that raid farmland.
4.1.4 Monthly space use area and monthly space use overlap
Based on the tendency towards correlation between home range size and resource
availability (Barton et al., 1992), it was expected that troops that were raiding farmland would
need less space than those that were not, and that those troops that were foraging on fallow
land would use more space than those that were not. There was no relationship between
leaving status and monthly space use area. However, there was a relationship between leaving
status and monthly inter-troop overlap, with occasional leavers overlapping with other troops
the most and leavers overlapping with other troops the least. This supports the idea that
occasional leavers are primarily leaving the reserve to raid farmland, allowing them to overlap
with other troops to a large extent, while leavers are primarily leaving the reserve to forage on
fallow land and taking advantage of the lower density of baboons outside the reserve by
overlapping less with other troops.

50
I also predicted that the trend toward greater or smaller space use overlaps would
increase at times of the year when troops spent more time outside the reserve. There was,
however, only a relationship for leaver troop AS36, which showed a significant (negative)
relationship, overlapping with other troops less during months when it spent more time
outside of the reserve. This supports the idea that this troop may be benefiting from leaving
the reserve by decreasing its space use overlap with other troops. Why similar relationships
were not found with other troops is unclear, although the difference in time spent outside the
reserve at different times of the year for occasional leavers is so small as to make any
significant relationship unlikely.
4.1.5 Space use shifts
It was predicted that troops that did not leave the reserve would shift their space use
areas less than other troops throughout the year. However, there was no relationship between
the extent to which troops shifted their space use areas throughout the year and leaving status.
As there was no seasonal pattern to the time spent outside by leaver troops, it follows that
they would not necessarily need to shift their home ranges to a large extent throughout the
year. Also, the seasonal changes in time spent outside the reserve for occasional leavers were
so small that they too would not have necessarily needed to shift their home ranges to a large
extent.
4.1.6 Conclusions
The space use data suggest that the occasional leavers are leaving the reserve primarily
to raid farmland and are likely to be responsible for the majority of raiding taking place; and
the leavers are leaving the reserve primarily to forage on fallow land, but may also be
responsible for some of the raiding taking place.
Therefore, in the next section in which the behaviour of the baboons is examined in
relation to the raiding of farmland, the behavioural changes associated with raiding and
farmer retaliation are expected to be found to a large extent in occasional leaver troops and to
a lesser extent in leaver troops.
4.2 Behaviour
4.2.1 Recap of aims and predictions
The primary aim of the behaviour section of this study was to examine the behavioural
responses of the troops in the reserve to raiding and farmer retaliation. It was predicted that

51
troops that raid farmland would display higher levels of aggression, self-grooming and mating
and lower levels of foraging than troops that do not raid farmland. These changes were
expected to be found to a large extent in occasional leaver troops, to a lesser extent in leaver
troops, and not at all in non-leaver troops.
4.2.2 Aggression
There was no statistically significant difference in the levels of aggression displayed
by the troops. However, leaver and occasional leaver troops consistently displayed around
double the levels of aggression seen in non-leaver troops, with the exception of two of the
occasional leaver troops (AS43 and AS55), both of which were observed for very low
quantities of time. It seems likely that this lack of statistical significance is a factor of the
small sample sizes involved. This, however, cannot be determined without further study. If
present, an increase in aggression amongst leavers and occasional leavers could indicate an
increase in social instability due to the killing of individuals by farmers and an increase in the
immigration of new males (Pereira, 1983; Beehner et al., 2005; Bergman et al., 2005).
4.2.3 Self-grooming
Self-grooming was most common in leaver troops and least common in occasional
leaver troops. While the high levels of self-grooming in leaver troops was predicted, and may
indicate increased stress in these troops (Maestripieri et al., 1992), the very low levels of self-
grooming in occasional leavers and the high levels of self-grooming in non-leavers were
contrary to expectations. It may be that the use of the reserve as a refuge allows occasional
leavers to avoid farmer retaliation to a large extent, allowing them to gain the benefits of
raiding without the disadvantages. Another option, however, is that self-grooming is not an
accurate indicator of the sorts of stress being experienced. The sources of stress expected to
be experienced by raiding baboons (increased immigration of new males, loss of troop
members and increased social instability) have been related to increases in glucocorticoid
levels (Beehner et al., 2005; Bergman et al., 2005 & Engh et al. 2006) but not to increased
levels of self-grooming, which is merely considered to be a general indicator of stress in
primates (Maestripieri et al., 1992) and an indicator of relationship uncertainty in baboons
(Castles et al., 1999). Self-grooming may also be being affected by some other factor such as
parasite load, which also stimulates self grooming in primates (Zamma, 2002).

52
4.2.4 Mating
There were no statistically significant differences in the levels of mating displayed by
the troops. However, mating was consistently more common in occasional leavers than in
leavers and non-leavers, with the exception of occasional leaver troop AS55, which was only
observed on 1 occasion. The lack of significance may be due the low sample sizes involved,
or there may simply be no relationship between mating and raiding behaviour. If present, an
increase in mating among occasional leavers would most likely indicate an increase in growth
and reproduction due to increased foraging efficiency and food quality (Strum, 1994) or an
increase in female reproductive cycling due to harassment induced miscarriage and
infanticide by immigrant males (Pereira, 1983; Beehner et al., 2005).
4.2.5 Foraging
Foraging was most common in non-leaving troops and least common in leaving
troops, with occasional leavers occurring between them. The results therefore confirm the
prediction that raiding troops would spend less time foraging inside the reserve than non-
raiding troops due to an increase in raiding outside the reserve. Occasional leavers foraged
less than leavers. However, the leaver troops spent around half their time outside the reserve,
giving them plenty of time to make up their remaining food requirements foraging on both
fallow land and cultivated land. The occasional leavers, on the other hand, spent <5 % of their
time outside the reserve, yet still foraged less than non-leavers, suggesting that they were
foraging primarily on cultivated land when outside the reserve in order to make up their
remaining food requirements in a mere 2 - 5 % of their time. The behaviour of the occasional
leavers is similar to that observed by Cowlishaw (1997a & b) who found that troops would
forage intensively in resource rich, high risk area, while spending most of their time in low
risk areas.
4.2.6 Other behaviours
Although there were no significant differences in the levels of vigilance between
leaving categories, levels of vigilance observed for non-leavers were lower than those
observed for the leaver and occasional leaver troops, with the exception, once again, of the
two occasional leaver troops AS43 and AS55, both of which were observed for very short
times. If present, an increase in vigilance among leaver and occasional leaver troops could
indicate that a general fear of humans continued to affect them even inside the reserve, as

53
most vigilance observed was directed at hikers (pers. obs.). Observed levels of socio-positive
behaviour and motor play were roughly equal across the three leaving categories.
4.2.7 Conclusions
The behavioural data show that those troops (leaver and occasional leaver) indicated to
be raiding farmland by the space use data, are indeed foraging less than non-leavers within the
reserve, reinforcing the conclusion that these troops are potentially obtaining food elsewhere.
The evidence for behavioural changes related to farmer retaliation, however, is not strong.
While raiding and farmer retaliation may be resulting in increased aggression, mating and
even vigilance, none of these behaviours were significantly different among the troops. More
data would be needed in order resolve this matter. The data for self-grooming are more
obscure, with the occasional leavers (thought to be the group most responsible for raiding
farmland) displaying significantly less self-grooming than leavers and non leavers. This lack
of clear patterns suggests that levels of farmer retaliation and resulting social instability may
be fairly low.
4.3 Questionnaire survey
4.3.1 Recap of aims and predictions
The primary aim of this section of the study was to investigate raiding patterns of
baboons as experienced by farmers and to assess levels of farmer retaliation. It was expected
that maize would be especially targeted and that raiding would be most common in the early
and late dry season, due to the availability of maize and natural food shortages.
4.3.2 Patterns of raiding
Most farmers around Suikerbosrand Nature reserve did experience some level of
raiding. Only maize and bean farmers reported significant losses and these items tended to be
raided more frequently than other items as well as being raided throughout the year. Other
items such as garden fruit and vegetables, garbage, eggs and animal fodder were raided less
often, and mainly during the winter. Though most of the data could not be statistically
analysed, the general pattern that emerges is one of baboons raiding favoured crops (maize
and beans) whenever possible, with natural food shortages in the winter increasing the
frequency of raiding and the range of items raided.; and increased raiding of other items
during periods of natural scarcity and were capable of feeding on a wide range of
anthropomorphic food. This matches the findings of Naughton-Treves et al. (1998) who found

54
that baboons prioritised maize over natural forage, increased raiding of other items during
periods of natural scarcity and were capable of feeding on a wide range of anthropomorphic
food. Naughton-Treves et al. (1998) also found that baboons fed on maize throughout its life
cycle, eating seedlings, inflorescence, pith and fruit. This may explain why farmers reported
year-round losses of maize and beans. Also, Segal (2008) found kernels of maize in the faecal
matter of the troops throughout the year, indicating that farmers do not securely store their
grain after the harvest, making it available long after the early dry season. The information
from the farmers also supports the findings of Segal (2008) that the Suikerbosrand baboons
respond to the scarcity of food in the dry season by widening their diet.
It appears that the baboons were not acting in ways threatening to people, with the
only two claims of baboons behaving threateningly being indicative of a perceived, rather
than actual threat. This matches previous findings of baboons being seen in a somewhat
unrealistically negative light, such as being described as crafty, malicious and a menace to
women and children (Naughton-Treves, 1997). The baboons do, however, appear to pose a
very real threat to dogs, with many reports of pet dogs being killed volunteered by farmers in
their questionnaires.
4.3.3 Patterns of retaliation
Most farmers in the area claimed not to shoot baboons. While some farmers may be
reluctant to report the killing of baboons, a low level of farmer retaliation would help to
explain the weak evidence for behavioural changes predicted to result from it. On the other
hand, no farmers reported using traps or snares, despite the presence in the reserve of several
baboons with missing hands or feet (pers. obs.), suggesting an under-reporting of retaliation.
Though not statistically tested, the perception of baboons as dangerous, the suffering of large
financial losses and the loss of dogs all appear to increase the likelihood of farmers resorting
to lethal retaliation. This supports the findings of Holmern et al. (2007) that greater losses to
raiding animals leads to an increase in the approval of lethal retaliation. There also appeared
to be some tendency towards the targeting of large males, which would increase the social
disruption associated with the loss of troop members. In addition to shooting baboons, many
farmers reported a range of other techniques to prevent raiding, such as electric fencing, dogs
and scaring the baboons away with loud noises and bright lights. Although there was often a
wide range in the reported effectiveness of the same techniques being used by different
farmers, no techniques (including shooting) appear to be very effective. No farmers seem to
have found a reliable method of preventing raiding. This matches the experiences of farmers

55
elsewhere, such as around Kibale National Park in Uganda, where most farmers must guard
their crops constantly to prevent raiding by olive baboons and other large mammals
(Naughton-Treves, 1997).
4.4 Overall conclusions
My study suggests that the troops primarily responsible for raiding farmland around
the Suikerbosrand Nature reserve are the occasional leaver troops. These troops appear to be
using the reserve as a refuge, making short forays out of the reserve during which they forage
intensively on cultivated land. This is indicated by the small amount of time spent outside the
reserve by these troops, their low levels of foraging within the reserve and their high space
use overlaps with other troops. The leaver troops appear to be shifting their home ranges out
of the reserve to forage on fallow land, though they are also likely to be raiding farmland to
some extent. This is indicated by the large amount of time spent outside the reserve by these
troops, their low levels of foraging within the reserve, and their low space use overlaps with
other troops. Raiding behaviour is therefore present in most of the reserve's troops, as only
two of the troops studied did not seem to be responsible for any raiding at all.
The raiding behaviour appears to be driven by both the limited food supply within the
reserve and the preference of the baboons for certain crops (maize and beans) over naturally
available forage. This is indicated by the reports from farmers of the raiding of maize and
beans whenever they are available and the increased amounts and varieties of items reported
to be targeted by baboons in the dry season. The need for leaver troops to forage on non-
cultivated land outside the reserve despite the added risks involved also indicates that the
limited food supply within the reserve is affecting the troops.
Levels of lethal retaliation as reported by farmers are low, but nonetheless present.
Farmers also reported a tendency towards the targeting of large males.
The presence of behavioural changes in raiding troops related to farmer retaliation is
not clear. However, it is the author‟s opinion, based on the data available, that there is some
degree of social disruption in raiding troops resulting from the loss of troop members. Further
study would be necessary in order to clarify the matter.
4.5 Recommendations
Control techniques often work through increasing the costs and/or decreasing the
benefits of foraging in areas of human activity, so as to make foraging on natural land the
more appealing option (Strum, 1994). Such methods include shifting cultivars to something

56
less appealing to baboons (Naughton-Treves et al., 1998; Strum, 1994) and guarding crops
using lethal or non-lethal means to increase the risk of raiding and/or to reduce foraging
success on farmland (Falls, 1993; Naughton-Treves, 1997).
In areas where high populations of leaving animals are thought to be compounding the
problem, culling is often considered (Falls, 1993). Alternatives to large scale culling include
the selective killing of problem animals and the translocation of problem troops to areas far
from farmland (Falls, 1993); translocation has been successfully conducted with two wild
olive baboons troops (Strum, 2005). My study suggests that any such efforts should focus on
the occasional leaver troops, as these are likely to be responsible for the majority of raiding
behaviour. In the future, this „occasional leaving‟ behaviour, as well as low levels of foraging
within the reserve could indicate raiding behaviour. Radio telemetry and behavioural
observations could therefore be used as a way to identify problem troops.
The responses from farmers in this study indicate that some troops may be
preferentially raiding maize, regardless of the availability of non-anthropogenic food.
Reducing the baboon population is therefore unlikely to be a cure-all solution. Other solutions
that could be worth investigating include learned food aversion (Gill et al., 2000; Baker et al.,
2005; Baker et al., 2007; Cox et al., 2004; Nicolaus & Nellis, 1987; Zahorik et al., 1990) and
the switching of crop species grown (Parker & Osborn, 2006) or the guarding of crops
(Naughton-Treves, 1997) by farmers.
4.6 Future studies
In this study, the troops were grouped together into 3 categories (leavers, non-leavers
and occasional leavers) in order to examine trends relating to raiding behaviour. Future
studies could examine troops on an individual basis to provide a finer resolution of the
response of different troops to the opportunity to raid farmland around the Suikerbosrand. For
example, occasional leaver troop AS42 was found by Segal (2008) to have far higher
quantities of maize in its faeces than any other troop, and may be a prime candidate for
translocation.
If the reserve management requires troop specific data on troop raiding behaviour, it
would also be useful to question farmers about raiding by baboons and shooting of baboons
without the drawback of anonymity. In this study, anonymous questionnaires were sent to
farmers so that they would not be hesitant to admit to the shooting of baboons. This, however,
made it impossible to match up reports of raiding and farmer retaliation to specific farms, and
thereby to specific troops. If farmers were willing to provide such information without

57
anonymity, it would be possible to determine exactly which troops are responsible for the
varying amounts of raiding reported, and which troops are losing members to lethal retaliation
from farmers.
More extensive behavioural sampling would help to resolve the question of whether
the social order of troops is being disrupted due to farmer retaliation, as the data on
aggression, mating and vigilance remain inconclusive in this study due to the low sample
sizes involved. More accurate census data would also be useful in assessing the impacts of
farmer retaliation as the lack of reliable data on age and sex ratios in the last census made it
impossible to determine if these demographic parameters were being affected.
A longer term study would allow for a more detailed analysis of seasonal patterns in
raiding behaviour and of the environmental conditions (e.g. wet or dry years) that promote
raiding behaviour. It may also provide information on how baboon troops develop raiding
behaviour - Does raiding behaviour develop quickly or over many years? Does it spread
between neighbouring troops or does it arise spontaneously when the opportunity presents
itself?
Future studies could also focus on predation experienced by baboons, for example by
brown hyena and black eagles.
Finally, future studies could investigate alternatives to culling and relocation. Learned
food aversion trials could be carried out to test its effectiveness on baboons, and cost benefit
analyses could be used to examine the financial and practical feasibility of farmers switching
crop species or employing people to guard their crops.

58
References
Abbott, D. H., Keverne, E. B., Bercovitch, F. B., Shively, C. A., Mendoza, S. P., Saltzman,
W., Snowdon, C. T., Ziegler, T. E., Banjevic, M., Garland, T. Jr. & Sapolsky, R. M.
2003. Are subordinates always stressed? A comparative analysis of rank differences in
cortisol levels among primates. Hormones and Behaviour 43, 67-82.
Alberts, S. C., Buchan, J. C. & Altmann, J. 2006. Sexual selection in wild baboons: from
mating opportunities to paternity success. Animal Behaviour 72, 1177-1196.
Altmann, A. S. & Altmann, J. 1970. Baboon Ecology: African Field Research page 181. The
University of Chicago Press. Chicago, U.S.A.
Altmann, J. 1974. Observational study of behaviour: sampling methods. Behaviour 49, 227-
267.
Anderson, C. M. 1981. Intertroop relations of chacma baboons (Papio ursinus). International
Journal of Primatology 2, 285-310.
Anderson, C. M. 1989. The spread of exclusive mating in a chacma baboon population.
American Journal of Physical Anthropology 78, 355-360.
Anderson, C. M. 1992. Male investment under changing conditions among chacma baboons
at Suikerbosrand. American Journal of Physical Anthropology 87, 479-496.
Baker, S. E., Ellwood, S. A., Watkins, R. W. & Macdonald, D. W. 2005. A dose-response trial
with ziram-treated maize and free-ranging European badgers Meles meles. Applied
Animal Behaviour Science 93, 309-321.
Baker, S. E., Johnson, P. J., Slater, D., Watkins, R. W. & Macdonald, D. W. 2007. Learned
food aversion with and without an odour cue for protecting untreated baits from wild
mammal foraging. Applied Animal Behaviour Science 102, 410-428.
Barrett, L., Dunbar, R.I. & Dunbar, P. 1992. Environmental influences on play behaviour in
immature gelada baboons. Animal Behaviour 44, 111-115.
Barrett, L., Gaynor, D. & Henzi, S. P. 2002. A dynamic interaction between aggression and
grooming reciprocity among female chacma baboons. Animal Behaviour 63, 1047-
1053.
Barrett, L., Henzi, S. P., Weingrill, T., Lycett, J. E. & Hill, R. A. 1999. Market forces predict
grooming reciprocity in female baboons. Proceedings: Biological Sciences 266, 665-
670.

59
Barton, R. A., Byrne, R. W. & Whiten, A. 1996. Ecology, feeding competition and social
structure in baboons. Behavioral Ecology and Sociobiology 38, 321-329.
Barton, R. A., Whiten, A., Strum, S. C., Byrne, R. W. & Simpson, A. J. 1992. Habitat use and
resource availability in baboons. Animal Behaviour 43, 831-844.
Beehner, J. C., Bergman, T. J., Cheney, D. L., Seyfarth, R. M. & Whitten, P. L. 2005. The
effect of new alpha males on female stress in free-ranging baboons. Animal Behaviour
69, 1211-1221.
Beehner, J. C., Onderdonk, D. A., Alberts, S.C., Altmann, J. 2006. The ecology of conception
and pregnancy failure in wild baboons. Behavioural Ecology 17, 741-750.
Bercovitch, F. B. 1991. Mate selection, consortship formation, and reproductive tactics in
adult female savanna baboons. Primates 32, 437-452.
Bergman, T. J., Beehner, J. C., Cheney, D. L., Seyfarth, R. M. & Whitten, P. L. 2005.
Correlates of stress in free-ranging male chacma baboons, Papio hamadryas ursinus.
Animal Behaviour 70, 703-713.
Beyer, H.L. 2004. Hawth‟s Analysis Tools for ArcGIS. Available at
http://www.spatialecology.com/htools.
Brain, C. 1992. Deaths in a desert baboon troop. International Journal of Primatology 13,
593-599.
Buchan, J. C., Alberts, S. C., Silk, J. B. & Altmann, J. 2003. True paternal care in a multi-
male primate society. Nature 425, 179-181.
Busse, C. D. & Hamilton, W. J. 1981. Infant carrying by male chacma baboons. Science 212,
1281-1283.
Butler, J. R. A. 2000. The economic costs of wildlife predation on livestock in Gokwe
communal land, Zimbabwe. African Journal of Ecology 38, 23-30.
Byrne, R. W., Whiten, A. & Henzi, S. P. 1990. Social relationships of mountain baboons:
leadership and affiliation in a non-female-bonded monkey. American Journal of
Primatology 20, 313-329.
Camberfort, J. P. 1981. A comparative study of culturally transmitted patterns of feeding
habits in the chacma baboon Papio ursinus and the vervet monkey Cercopithecus
aethiops. Folia Primatologica 36, 243-263.
Castles, D. L., Whiten, A. & Aureli, F. 1999. Social anxiety, relationships and self-directed
behaviour among wild female olive baboons. Animal Behaviour 58, 1207-1215.
Chance, M. R. A. & Jolly, C. J. 1970. Social Groups of Monkeys, Apes and Men. Pg. 66-77.
Jonathan Cape LTD. London, U.K.
60
Cheney, D. L. 1977. The acquisition of rank and the development of reciprocal alliances
among free-ranging immature baboons. Behavioural Ecology and Sociobiology 2,
303-318.
Cheney, D. L., Seyfarth, R. M., Fischer, J., Beehner, J., Bergman, T., Johnson, S. E., Kitchen,
D. M., Palombit R. A., Rendall, D. & Silk, J. B. 2004. Factors affecting reproduction
and mortality among baboons in the Okavango Delta, Botswana. International Journal
of Primatology 25, 401-428.
Cowlishaw, G. 1994. Vulnerability to predation in baboon populations. Behaviour 131, 293-
304.
Cowlishaw, G. 1997a. Trade-offs between foraging and predation risk determine habitat use in
a desert baboon population. Animal Behaviour 53, 667-686.
Cowlishaw, G. 1997b. Refuge use and predation risk in a desert baboon population. Animal
Behaviour 54, 241-253.
Cox, R., Baker, S. E., Macdonald. D. W. & Berdoy, M. 2004. Protecting egg prey from
carrion crows: the potential of aversive conditioning. Applied Animal Behaviour
Science 87, 325-342.
De Vries, H., Netto, W. J. & Hanegraaf, P. L. H. 1993. Matman: A program for the analysis of
sociometric matrices and behavioural transition matrices. Behaviour 125: 157-175.
Drews, C. 1995. Road kills of animals by public traffic in Mikumi National-Park, Tanzania,
with notes on baboon mortality. African Journal of Ecology 33, 89-100.
Engh, A. L., Beehner, J. C., Bergman, T. J., Whitten, P. L., Hoffmeier, R. R., Seyfarth, R. M.
& Cheney, D. L. 2006. Behavioural and hormonal responses to predation in female
chacma baboons (Papio hamadryas ursinus). Proceedings of the Royal Society B –
Biological Sciences 273, 707-712.
ESRI ® ArcMapTM
9.0. 1999-2004. California, USA. www.esri.com
Estes, R. D. 1991. The Behaviour Guide to African Mammals: Including Hoofed Mammals,
Carnivores, Primates. Pages 509-519. University of California Press. Loss Angeles,
USA.
Falls, M. 1993. Population strength and distribution of chacma baboons (Papio ursinus) on
Suikerbosrand Nature Reserve. A dissertation submitted in partial satisfaction of the
requirements for the national diploma: Nature and Environmental Conservation.
(Unpublished).
Find and stay. http://www.findandstay.co.za

61
Fletemeyer, J. R. 1978. Communication about potentially harmful foods in free-ranging
chacma baboons, Papio ursinus. Primates 19, 223.
Gauteng Nature Conservation. 1997. Suikerbosrand Nature Reserve. Gauteng Department of
Agriculture, Conservation and Environment.
Gill, E. L., Whiterow, A. & Cowan, D. P. 2000. A comparative assessment of potential
conditioned taste aversion agents for vertebrate management. Applied Animal
Behaviour Science 67, 229-240.
GraphPad Software. 2003. GraphPad InStat. Version 3.00 for Windows 95. San Diego,
California. www.graphpad.com
Hamilton, W. J. 1985. Demographic consequences of a food and water shortage to desert
chacma baboons Papio ursinus. International Journal of Primatology 6, 451-462.
Hamilton, W. J. & Bulger, J. B. 1990. Natal male baboon rank rises and successful challenges
to resident alpha males. Behavioural Ecology and Sociobiology 26, 357-362.
Hamilton, W. J., Buskirk, R. E. & Buskirk, W. H. 1975. Chacma baboon tactics during
intertroop encounters. Journal of Mammalogy 56 857-870.
Hamilton, W. J., Buskirk, R. E. & Buskirk, W. H. 1976. Defence of space and resources by
chacma (Papio ursinus) baboons troops in an African desert and swamp. Ecology 57,
1267-1272.
Hamilton, W. J. & Busse, C. 1982. Social dominance and predatory behaviour of chacma
baboons. Journal of Human Evolution 11, 567-573.
Henzi, S. P. 1996. Copulation calls and paternity in chacma baboons. Animal Behaviour 51,
233-234.
Henzi, S. P. & Barrett, L. 1999. The value of grooming to female primates. Primates 40, 47-
59.
Henzi, S. P. & Barrett, L. 2002. Infants as a commodity in a baboon market. Animal
Behaviour 63, 915-921.
Henzi, S. P., Lycett, J. E. & Piper, S. E. 1997. Fission and troop size in a mountain baboon
population. Animal Behaviour 53, 525-535.
Henzi, S. P., Lycett J. E. & Weingrill, T. 1998. Mate guarding and risk assessment by male
mountain baboons during inter-troop encounters. Animal Behaviour 55, 1421-1428.
Henzi, S. P, Weingrill, T. & Barrett, L. 1999. Male behaviour and the evolutionary ecology of
chacma baboons. South African Journal of Science 95, 240-242.
Hill, C. M. 2000. Conflict of interest between people and baboons, Crop raiding in Uganda.
International Journal of Primatology 21, 299-315.

62
Hoare, R. E. 1999. Determinants of human-elephant conflict in a land-use mosaic. The
Journal of Aplied Ecology 36, 689-700.
Holmern, T., Nyahongo, J. & Røskaft, E. 2007. Livestock loss caused by predators outside the
Serengeti National Park, Tanzania. Biological Conservation 135, 518-519.
Kharel, F. R. 1997. Agricultural crop and livestock depredation by wildlife in Langtang
National Park, Nepal. Mountain Research and Developement 17, 127-134.
Kolowski, J. M. & Holekamp, K. E. 2006. Spatial, temporal, and physical characteristics of
livestock deperdations by large carnivores along a Kenyan reserve border. Biological
Conservation 128, 529-541.
Maestripieri, D., Shino, G., Aureli, F. & Troisi, A. 1992. A modest proposal: displacement
activities as an indicator of emotions in primates. Animal Behaviour 44, 967-979.
Matthews, W. 2005. Large herbivore population estimates for Tembe Elephant Park:
November 2005. Ezemvelo KwaZulu-Natal Wildlife, Unpublished Technical Report.
Naughton-Treves, L. 1997. Farming the forest edge: vulnerable places and people around
Kibale National Park, Uganda. Geographic Review 87, 27-46.
Naughton-Treves, L., Treves, A., Chapman, C & Wrangham, R. 1998. Temporal patterns of
crop-raiding by primates: linking food availability in croplands and adjacent forests.
Journal of Applied Ecology 35, 596-606.
Nicolaus, L. K. & Nellis, D. W. 1987. The first evaluation of the use of conditioned taste
aversion to control predation by mongooses upon eggs. Applied Animal Behaviour
Science 17, 329-346.
Noë, R. & Sluijter, A. A. 1995. Which adult male savanna baboons form coalitions?
International Journal of Primatology 16, 77-105.
Palombit, R. A., Seyfarth, R. M. & Cheney, D. L. 1997. The adaptive value of 'friendships' to
female baboons: experimental and observational evidence. Animal Behaviour 54, 599-
614.
Parker, G. E. & Osborn, F. V. 2006. Short communication. Investigating the potential for chilli
Capsicum annuum to reduce human-wildlife conflict in Zimbabwe. Oryx 40, 1-4.
Pereira, E. M. 1983. Abortion following the immigration of an adult male baboon (Papio
cynocephalus). American Journal of Primatology 4, 93-98.
Rhine, R. J., Wasser, S. K. & Norton, G. W. 1988. Eight-year study of social and ecological
correlates of mortality among immature baboons of Mikumi National Park, Tanzania.
American Journal of Primatology 16, 199-212.
63
Ron, T. 1996. Who is responsible for fission in a free-ranging troop of baboons? Ethology
102, 128-133.
Salafsky, N. 1993. Mammalian use of a buffer zone agroforestry system bordering Gunung
Palung National Park, West Kalimantan, Indonesia. Conservation Biology 7, 928-933.
Saayman, G. S. 1971. Baboons' responses to predators. African Wildlife 25, 46-49.
Saj, T. L., Sicotte, P. & Paterson, J. D. 2001. The conflict between vervet monkeys and
farmers at the forest edge in Entebbe, Uganda. African Journal of Ecology 39, 195-
199.
Sapolsky, R. M. & Share, L. J. 2004. A pacific culture among wild baboons: its emergence
and transmission. PLoS Biol 2: e106 doi:10.1371/journal.pbio.0020106
Segal, C. 2008. Foraging behaviour and diet in chacma baboons in Suikerbosrand Nature
Reserve. A dissertation submitted to the Faculty of Science, University of the
Witwatersrand, Johannesburg in fulfilment of the requirements for the degree of
Master of Science.
Silk, J. B., Alberts, S. C. & Altmann, J. 2003. Social bonds of female baboons enhance infant
survival. Science 14, 1231-1234.
Silk, J. B., Alberts, S. C. & Altmann, J. 2004. Patterns of coalition formation by adult female
baboons in Amboseli, Kenya. Animal Behaviour 67, 573-582.
Silk, J. B., Alberts, S. C. & Altmann, J. 2006b. Social relationships among adult female
baboons (Papio cynocephalus) II. Variation in the quality and stability of social bonds.
Behavioral Ecology and Sociobiology 61, 197-204.
Silk, J. B., Altmann, J. & Alberts, S. C. 2006a. Social relationships among adult female
baboons (Papio cynocephalus) I. Variation in the strength of social bonds. Behavioral
Ecology and Sociobiology 61, 183-195.
Silk, J. B., Seyfarth, R. M. & Cheney, D. L. 1999. The structure of social relationships among
female savanna baboons in Moremi Reserve, Botswana. Behaviour 136, 679-703.
Sitati, N. W., Walpole, M. J., Smith, R. J. & Leader-Williams, N. 2003. Predicting spatial
aspects of human-elephant conflict. The Journal of Applied Ecology 40, 667-677.
Smithers, R. H. N. 1983. The Mammals of the Southern African Subregion. Pg. 146-150.
University of Pretoria. Pretoria, South Africa.
Sommer, V. & Mendoza-Granados, D. 1995. Play as indicator of habitat quality: a field study
of langur monkeys (Presbytis entellus). Ethology 99, 177-192.
StatSoft, Inc. 2004. STATISTICA (data analysis software system), Version 7.1.
www.statsoft.com

64
Strum, S. C. 1994. Prospects for management of primate pests. Revue D Ecologie-la Terre et
la Vie 49, 295-306.
Strum, S. C. 2005. Measuring success in primate translocation: a baboon case study.
American Journal of Primatology 65, 117-140.
Sukumar, R. 1990. Ecology of the Asian elephant in southern India. II. Feeding habits and
crop raiding patterns. Journal of Tropical Ecology 6, 33-53.
Tarara, E. B. 1987. Infanticide in a chacma baboon troop. Primates 28, 267-270.
Weingrill, T. 2000. Infanticide and the value of male – female relationships in mountain
chacma baboons. Behaviour 137, 337-359.
Weingrill, T., Lycett, J. E. & Henzi, S. P. 2000. Consortship and mating success in chacma
baboons (Papio cynocephalus ursinus). Ethology 106, 1033-1044.
Wikipedia. http://www.wikipedia.org
Wittig, R. M., Crockford, C., Seyfarth, R. M. & Cheney, D. L. 2007. Vocal alliances in
chacma baboons (Papio hamadryas ursinus). Behavioural Ecology and Sociobiology
61, 899-909.
Zahorik, D. M., Houpt, K. A. & Swartzman-Andert, J. 1990. Taste-aversion learning in three
species of ruminants. Applied Animal Behaviour Science 26, 27-39.
Zamma, K. 2002. Grooming site preferences determined by lice infection among Japanese
macaques in Arashiyama. Primates 43, 41-49.

65
Appendix 1
Adjusted residuals of matrices of inter-monthly, intra-troop space use overlap
Adjusted Residual of Matrix for non-leaver troop AS33
Adjusted Residuals of Matrix for leaver troop AS35
March April May June July Aug Sept Oct Nov Dec Jan Feb Total
March * 2.11 2.15 1.28 1.95 0.40 0.17 -0.06 0.87 -0.10 0.39 0.56 0.40
April 2.13 * 1.50 1.35 1.23 0.25 0.00 0.69 0.36 0.49 1.05 0.90 0.56
May 2.13 1.46 * 1.10 2.83 0.17 0.34 -0.40 1.63 -0.62 -0.06 0.16 0.20
June 1.28 1.32 1.09 * 1.94 0.55 0.29 0.33 0.47 0.38 1.02 0.95 0.07
July 1.92 1.17 2.84 1.84 * 0.38 -0.18 -0.64 1.54 -0.58 -0.11 0.01 -0.09
Aug 0.37 0.14 0.08 0.63 0.38 * 2.08 1.75 1.05 1.40 0.45 1.07 0.06
Sept -0.02 -0.30 0.19 0.25 -0.44 2.15 * 1.41 1.16 2.19 1.31 1.12 -0.28
Oct 0.05 0.81 -0.37 0.56 -0.57 1.79 1.47 * 0.84 2.05 1.28 1.61 0.44
Nov 0.77 0.06 1.78 0.34 1.67 0.91 1.05 0.56 * 0.01 -0.11 0.32 -0.94
Dec -0.16 0.48 -0.82 0.51 -0.71 1.46 2.18 2.10 0.26 * 2.42 1.52 0.05
Jan 0.31 1.06 -0.26 1.09 -0.27 0.40 1.29 1.17 0.06 2.36 * 1.69 -0.27
Feb 0.51 0.87 0.00 1.01 -0.13 1.03 1.10 1.52 0.45 1.43 1.68 * -0.09
Total -0.02 -0.22 -0.39 0.41 -0.40 0.14 0.48 -0.65 0.41 -0.18 0.14 0.38 0.12
Adjusted Residuals of Matrix for non-raider troop AS33
March April May June July Aug Sept Oct Nov Dec Jan Feb Total
March * 3.52 1.68 0.28 1.37 1.23 -0.76 -3.04 -3.68 -1.32 2.59 4.75 0.32
April 3.72 * 1.76 0.77 1.00 1.24 -0.56 -1.73 -1.51 -0.28 1.54 3.19 0.26
May 1.52 1.81 * 1.74 2.04 1.06 0.83 -0.42 -0.28 -0.79 -0.34 1.37 -0.49
June -0.46 0.60 1.55 * 0.37 0.78 1.68 1.36 0.86 0.62 1.11 0.72 -0.24
July 1.03 0.88 1.96 0.35 * 1.68 1.78 1.04 1.00 0.11 -1.41 -0.64 -0.68
Aug 0.79 1.16 1.07 0.90 1.61 * 1.36 0.22 1.20 0.88 0.32 0.34 0.34
Sept -1.53 -0.59 0.79 1.62 1.56 1.24 * 2.79 2.45 1.64 0.05 -0.98 -0.13
Oct -3.12 -1.21 -0.04 1.14 0.85 0.21 2.29 * 5.11 3.11 -0.18 -1.55 -0.65
Nov -3.28 -0.81 0.21 0.90 0.92 1.06 2.05 4.92 * 3.36 -0.37 -1.42 0.06
Dec -1.65 -0.16 -0.23 0.64 0.28 0.73 1.42 3.15 3.46 * 1.47 -0.23 0.24
Jan 2.02 1.33 0.16 1.16 -0.59 0.46 0.31 -0.02 -0.45 1.67 * 2.89 0.60
Feb 4.66 2.92 1.36 0.94 -0.16 0.49 -0.69 -1.76 -1.96 -0.16 3.34 * 0.57
Total -2.61 0.58 1.26 1.00 0.79 0.67 0.56 -0.77 -1.28 0.21 -0.22 0.02 0.20
Adjusted Residuals of Matrix for raider troop AS35

66
Adjusted Residuals of Matrix for leaver troop AS36
Adjusted Residuals of Matrix for non-leaver troop AS39
Adjusted Residuals of Matrix for leaver troop AS41
March April May June July Aug Sept Oct Nov Dec Jan Feb Total
March * 2.64 1.45 0.63 -2.29 0.20 -0.84 0.91 0.95 2.43 2.15 1.09 -0.02
April 2.64 * 2.36 0.48 -2.05 0.06 -1.18 0.76 0.83 2.76 1.74 0.43 -0.30
May 2.02 2.86 * 5.98 -7.08 3.07 -5.66 0.31 1.44 3.52 0.42 -1.16 -0.96
June 0.70 0.62 5.84 * -3.44 3.10 -3.05 0.30 1.48 1.51 0.15 -0.46 -0.76
July -1.32 -1.13 -4.30 -1.92 * -0.68 11.83 1.77 0.82 -2.10 0.11 2.52 1.04
Aug 0.35 0.30 2.33 2.71 -0.67 * -1.10 1.45 1.71 0.71 0.25 0.38 0.40
Sept -1.28 -1.41 -4.91 -2.64 14.49 -1.70 * 1.76 -0.28 -2.64 -0.44 3.25 -0.70
Oct 0.31 0.23 -0.92 -0.32 3.29 0.89 3.40 * 0.76 -0.03 0.60 2.05 0.43
Nov 0.54 0.48 0.47 1.05 1.61 1.42 0.34 0.95 * 0.94 1.02 0.83 -0.01
Dec 2.58 2.89 3.14 1.59 -3.44 0.85 -2.63 0.81 1.53 * 1.70 0.15 0.10
Jan 1.94 1.59 -0.29 0.04 0.51 0.04 0.44 1.09 1.28 1.34 * 1.85 0.48
Feb 0.41 -0.13 -2.40 -1.07 4.49 -0.41 5.40 1.89 0.56 -0.72 1.32 * 0.34
Total -0.44 -0.19 -3.93 -0.95 0.86 -1.18 2.05 2.16 1.41 -1.34 -0.31 1.92 0.05
Adjusted Residuals of Matrix for raider troop AS36
March April May June July Aug Sept Oct Nov Dec Jan Feb Total
March * 3.29 1.53 -0.09 0.69 -0.48 0.83 0.94 1.18 -0.28 0.50 -0.02 -0.61
April 3.27 * 1.65 -0.36 0.45 0.03 0.77 0.73 1.31 -0.01 0.54 0.34 -0.36
May 1.62 1.74 * 0.66 0.76 0.59 0.29 0.25 0.84 0.67 1.34 1.15 0.22
June 0.08 -0.22 0.74 * 1.89 2.68 -0.83 -1.07 -0.32 1.67 1.69 1.48 -0.33
July 0.78 0.54 0.74 1.70 * 1.86 0.28 0.29 0.74 0.84 0.46 1.35 0.16
Aug -0.01 0.38 0.77 2.33 1.87 * 0.44 0.08 0.84 0.97 0.58 1.50 0.77
Sept 0.80 0.75 0.35 -0.47 0.34 0.27 * 4.03 2.20 0.05 -0.15 0.44 0.26
Oct 0.88 0.74 0.35 -0.58 0.37 0.00 4.00 * 2.20 0.11 -0.07 0.49 0.29
Nov 1.08 1.19 0.72 -0.27 0.66 0.57 2.45 2.46 * 0.28 -0.01 0.64 0.26
Dec -0.25 0.02 0.67 1.66 0.89 0.90 -0.21 -0.17 0.26 * 3.03 1.50 -0.37
Jan 0.57 0.60 1.45 1.76 0.41 0.33 -0.65 -0.57 -0.22 3.19 * 1.29 -0.48
Feb 0.15 0.46 1.15 1.35 1.38 1.46 0.45 0.48 0.76 1.40 1.19 * 0.41
Total 0.27 0.39 0.44 -0.44 0.28 -0.76 -0.54 -0.74 0.29 0.21 0.44 0.37 0.21
Adjusted Residuals of Matrix for non-raider troop AS39
March April May June July Aug Sept Oct Nov Dec Jan Feb Total
March * 2.25 1.40 0.81 1.13 -0.47 -0.10 1.24 0.09 0.14 -0.48 0.66 -0.59
April 2.06 * 2.37 0.84 1.74 1.34 0.21 0.01 -0.05 0.23 -0.14 0.62 0.08
May 1.37 2.59 * 1.17 0.89 0.57 0.71 0.40 0.34 0.63 0.30 0.70 0.23
June 0.91 1.12 1.36 * -0.39 -0.49 1.40 1.20 1.51 1.40 1.27 0.60 0.15
July 0.55 1.06 0.40 -0.36 * 7.14 -0.14 -0.61 -0.50 -0.16 -0.22 0.13 -0.10
Aug -0.23 0.82 0.34 -0.17 5.94 * 0.01 -0.28 -0.28 0.01 -0.05 -0.40 -0.08
Sept -0.16 0.36 0.84 1.41 0.04 -0.05 * 1.62 1.58 1.48 1.66 0.69 0.00
Oct 1.48 0.07 0.47 1.25 -0.93 -0.81 1.70 * 1.88 1.17 1.80 1.35 -0.03
Nov 0.08 0.05 0.44 1.61 -0.66 -0.75 1.68 1.90 * 1.80 2.12 1.36 0.03
Dec 0.08 0.34 0.71 1.39 -0.06 -0.12 1.47 1.11 1.69 * 1.45 1.02 -0.20
Jan -0.56 -0.02 0.42 1.32 -0.06 -0.15 1.70 1.76 2.04 1.51 * 1.80 0.13
Feb 0.78 0.93 0.89 0.69 0.64 -0.77 0.76 1.31 1.29 1.08 1.73 * 0.25
Total -0.90 0.42 0.20 0.21 0.91 -0.35 -0.09 0.20 0.00 0.00 -0.17 -0.57 -0.13
Adjusted Residuals of Matrix for raider troop AS41

67
Adjusted Residuals of Matrix for occasional leaver troop AS42
Adjusted Residuals of Matrix for occasional leaver troop AS43
Adjusted Residuals of Matrix for occasional leaver troop AS44
March April May June July Aug Sept Oct Nov Dec Jan Feb Total
March * 4.14 8.62 6.57 3.38 -2.16 -3.43 -2.27 -3.76 -2.91 -2.99 -0.42 -0.76
April 3.71 * 6.78 3.09 4.88 -3.63 -1.48 -1.58 -1.03 -0.75 -3.28 0.75 1.12
May 7.12 6.83 * 7.33 4.83 -3.56 -4.18 -2.74 -4.10 -3.17 -3.27 0.72 0.44
June 5.30 2.86 6.97 * 3.82 0.34 -3.04 -1.42 -3.50 -2.53 -1.28 0.58 1.43
July 3.10 4.82 4.88 3.97 * 0.79 -2.14 -1.05 -2.12 -1.55 -2.21 0.82 1.12
Aug -0.24 -2.08 -1.72 0.96 1.41 * 1.28 1.87 0.76 0.81 2.41 1.09 0.83
Sept -2.16 -1.48 -4.27 -3.26 -1.69 1.70 * 3.76 5.28 4.48 3.78 1.52 -0.18
Oct -1.41 -2.06 -3.02 -1.64 -0.82 2.46 3.59 * 3.84 3.00 2.75 1.85 -0.21
Nov -2.72 -1.04 -4.52 -4.18 -1.86 0.82 5.55 4.17 * 5.49 4.01 1.27 -0.63
Dec -2.02 -0.85 -3.54 -3.08 -1.34 0.72 4.62 3.22 5.43 * 3.55 1.34 -0.24
Jan -2.75 -5.10 -4.46 -1.88 -2.87 4.02 4.09 3.02 4.16 3.70 * 1.93 -2.50
Feb 0.13 0.67 1.05 0.70 1.16 0.61 0.89 1.55 0.62 0.83 1.59 * 0.31
Total 2.54 0.40 1.41 1.92 2.70 -3.61 -2.09 -0.24 -2.06 -0.89 -1.31 1.96 0.73
Adjusted Residuals of Matrix for occasional raider troop AS42
March April May June July Aug Sept Oct Nov Dec Jan Feb Total
March * 2.37 1.32 0.21 0.82 0.23 0.62 0.90 0.35 1.54 0.40 0.48 0.17
April 2.45 * 1.26 0.51 0.61 0.17 0.93 1.33 0.21 0.42 0.42 0.41 -0.33
May 1.36 1.33 * 1.77 1.14 1.07 0.94 1.09 0.42 0.04 0.38 0.10 0.33
June 0.20 0.60 1.71 * 1.25 1.21 0.59 0.40 1.02 0.22 1.24 1.14 0.25
July 0.70 0.57 1.03 1.22 * 1.84 1.01 0.91 0.84 0.24 0.13 0.53 -0.43
Aug 0.11 0.20 0.98 1.19 1.81 * 1.02 0.79 0.97 0.82 0.89 0.79 -0.04
Sept 0.49 0.94 0.83 0.47 1.05 1.02 * 2.16 1.46 0.26 0.14 0.43 -0.30
Oct 0.85 1.38 1.02 0.25 0.95 0.78 2.16 * 1.36 0.54 -0.05 -0.08 -0.30
Nov 0.20 0.19 0.23 0.96 0.86 0.94 1.41 1.31 * 1.05 0.84 1.30 -0.24
Dec 1.48 0.55 0.06 0.26 0.45 0.88 0.45 0.65 1.09 * 1.96 1.61 0.36
Jan 0.45 0.58 0.40 1.21 0.40 0.95 0.39 0.24 0.92 1.92 * 2.03 0.49
Feb 0.47 0.51 0.08 1.10 0.66 0.83 0.56 0.14 1.28 1.60 2.07 * 0.22
Total -0.29 0.17 -0.35 -0.20 0.55 0.30 0.53 0.46 0.41 -0.44 -0.60 -0.35 0.19
Adjusted Residuals of Matrix for occasional raider troop AS43
Sept Oct Nov Dec Jan Feb Total
Sept * 5.52 6.59 -0.80 -1.61 -3.14 -0.83
Oct 5.92 * 6.01 0.18 -0.92 -2.24 -0.10
Nov 6.73 5.75 * 0.00 -1.35 -3.15 -0.22
Dec -0.82 0.61 0.14 * 5.00 5.13 0.50
Jan -1.88 -0.70 -1.64 5.30 * 7.93 0.35
Feb -2.90 -1.36 -2.99 5.86 8.13 * 0.16
Total -0.34 0.77 -0.09 0.98 0.59 -2.05 -0.14
Adjusted Residuals of Matrix for occasional raider troop AS44

68
Adjusted Residuals of Matrix for occasional leaver troop AS45
Adjusted Residuals of Matrix for occasional leaver troop AS55
March April May June July Aug Sept Oct Nov Dec Jan Feb Total
March * 1.78 1.14 1.45 0.56 -0.46 -1.06 -0.06 0.64 1.88 2.52 1.42 0.01
April 1.80 * 2.63 1.63 0.40 -1.24 -1.63 -0.24 0.67 2.12 1.96 1.15 -0.07
May 1.30 2.60 * 1.57 0.12 -1.86 -0.12 2.04 1.44 1.55 -1.21 0.45 -0.10
June 1.46 1.61 1.48 * 0.77 -0.54 -0.18 0.39 0.50 0.95 1.27 1.25 -0.25
July 0.60 0.33 -0.22 0.81 * 2.15 1.53 0.59 1.33 0.53 1.09 1.28 0.49
Aug -0.42 -1.39 -2.48 -0.50 2.10 * 7.16 1.66 1.14 -0.67 -0.23 0.45 -0.10
Sept -0.60 -1.28 -0.12 0.15 1.60 6.54 * 5.16 1.49 -1.12 -3.86 -1.23 0.32
Oct 0.28 0.00 2.09 0.66 0.80 1.73 5.17 * 2.62 0.29 -4.57 -1.09 0.41
Nov 0.64 0.57 1.32 0.49 1.29 1.14 1.38 2.68 * 0.85 -0.62 0.00 0.19
Dec 1.89 2.13 1.45 0.96 0.50 -0.68 -1.63 -0.03 0.86 * 2.45 1.62 -0.11
Jan 2.43 2.02 -0.79 1.48 1.34 0.29 -3.07 -3.63 0.12 2.38 * 3.68 -0.18
Feb 1.41 1.09 0.14 1.23 1.24 0.42 -1.80 -1.65 -0.01 1.61 4.28 * -0.58
Total 0.99 0.17 -1.34 0.72 1.19 0.57 -0.67 -0.66 1.24 0.75 -3.37 0.44 0.03
Adjusted Residuals of Matrix for occasional raider troop AS45
March April May June July Aug Sept Oct Nov Dec Jan Feb Total
March * 2.27 0.82 -0.45 -0.17 -0.56 0.14 0.72 1.27 1.68 0.81 1.07 -0.83
April 2.32 * 1.25 0.09 0.22 0.04 0.51 0.89 1.20 1.36 0.49 1.26 0.21
May 1.00 1.37 * 2.58 1.82 1.78 0.23 0.04 -0.10 -0.22 -0.13 0.56 -0.23
June -0.16 0.23 2.57 * 2.34 2.67 0.70 -0.07 0.11 -0.91 1.41 0.09 0.20
July -0.15 0.11 1.84 2.37 * 2.48 0.86 0.23 0.13 -0.47 0.57 0.28 -0.53
Aug -0.44 0.03 1.81 2.70 2.46 * 1.22 0.60 0.13 -0.70 0.69 0.34 -0.12
Sept 0.31 0.51 0.30 0.53 0.85 1.11 * 2.35 0.75 0.06 1.08 1.72 0.05
Oct 0.83 0.85 0.10 -0.24 0.27 0.50 2.25 * 1.35 0.86 0.66 1.88 -0.09
Nov 1.32 1.14 0.09 0.03 0.27 0.17 0.72 1.31 * 2.27 1.45 1.16 0.45
Dec 1.53 1.27 0.22 -0.42 0.08 -0.15 0.35 0.93 2.04 * 0.91 0.95 0.38
Jan 1.02 0.62 0.18 1.21 0.69 0.71 1.11 0.81 1.57 0.96 * 0.97 0.65
Feb 1.17 1.24 0.53 -0.11 0.30 0.25 1.64 1.89 1.18 0.88 0.83 * 0.06
Total 0.29 0.22 0.53 -0.48 0.36 0.05 0.23 0.29 0.15 -1.55 -0.43 0.53 0.20
Adjusted Residuals of Matrix for occasional raider troop AS55