Embed Size (px)
Citation preview
American Journal of Primatology 8:113-l25 (1985)
Demography of Amboseli Baboons, 1963-1983 JEANNE ALTMANNl, GLENN HAUSFATER', AND STUART A. ALTMANN' Department of Biubgy, University of Chicago, Chicago, and Institute of Primate Research,
h'utional Museums of Kenya, Nairobi, and Department ofBiolngy, University of Missouri- Columbia
Repeated censuses of a population of yellow baboons (Pupio ~ynocephalri~s) in Amboseli National Park, Kenya, revealed a decrease from over 2,500 animals in 1963-1964 to 123 individuals in 1979, or from a density of about 73 to 1.8 baboons per kmz over a 15-year period. Median group size de- creased from 43 in 1964 to 27 in 1979. The largest and smallest goups declined the most; groups near the median have maintained fairly stable size and age distributions. The population seemed to have stabilized by 1983 at approximately 150 animals in six groups (median group size 28; density 2.2/'km2). Although baboon population and group size appeared to be stable during 1963-1964, the age distribution and demographic parameters (age- specific mortality and natality for one social group) during that year indi- cate that the population decline had already started. The rate of population decline was greatest in the 1964-1969 period and remained appreciable during the next 5 years. The decline of the baboon population was paralleled by that of other Amboseli savannah woodland mammalian species and took place during a period of very high mortality of fever trees (Acacia xanthoph- loea) and extensive invasion of the area by halophytes, a transition brought on by rising ground water and consequent elevation of the soil salinity zone. In this and several other primate populations, mortality of infants and juveniles appears to be the demographic variable most sensitive to environ- mental change.
Key words: baboons, demography, populations, mortality, habitat change, Papio cynaoephalus
INTRODUCTION Demographic analysis occupies a pivotal position in the study of naturalistic
behavior. The demographic composition of animal populations affects their behavior, ecological relationships, and social organization. These, in turn, alter population composition through their influences on the basic demographic processes: birth, death, and migration [see Altmann & Altmann, 1979; Cohen et al, 19791. The following report summarizes demographic changes in a population of yellow baboons
Received July 5, 1984; revision accepted October 22, 1984.
Address reprint rcqucsts to Jeanne Altmann, Allee Laboratory of Animal Behavior, 940 East 57th Street, Chicago, IL 60637.
0 1985 Alan R. Liss, Inc.
114 / Altmann, IIausfater, and Altrnann
(Papio cynocephalus) over a 20-year period, 1963-1983. These data not only provide background for our studies on the behavior and ecology of these primates but also document responses of this population to major changes in the habitat.
The study area consists of semiarid, short-grass savannah and lies primarily within Amboseli National Park, Kenya. In Amboseli, mean annual rainfall at 01 Tukai during 1971-1979 averaged only 407 mm (16 inches). Despite this low annual rainfall, however, there remained several perennial waterholes and swamps in the area, fed from underground by run-off from nearby Mt. Kilimanjaro. These water sources, along with their associated flora, make possible a concentration of wildlife that the area could not otherwise sustain.
In the grass-acacia savannah surrounding and beyond these water sources, two tree species predominate. Fever trees (Acacia xanthophloea) grow primarily in lower, moister soils, commonly near swamps and waterholes. In the early 1960s, abundant fever trees formed an extensive woodland in the study area. On higher ground, fever trees are replaced by the more widely scattered umbrella trees (Acacia tortzli.9). These two species of acacia trees, their associated shrubs and forbs, and the grass- lands that interdigitate with and surround them provide numerous sources of food and shelter for the baboons and for many other animals as well [Altmann & Altmann, 19701.
The Amboseli region has been characterized by marked and rapid ecological changes; these constitute the environmental context within which changes in ba- boon numbers occurred. Following a severe drought of 1960-1961, unusually heavy rains during several subsequent years raised the water table in the area until it reached a maximum in 1974. The elevated water table served to enlarge the swamps and waterholes, so that aquatic and swamp-edge vegetations and their associated fauna became more abundant. However, the rising water table also lifted a salt zone in the soil until these salts, and even in some places the water itself, invaded the root zone of many of the fever trees [Western, 1973; Western & Van Praet, 19731. One result was a massive die-off of the fever trees in the area. For example, fever tree mortality was 28% per annum during 1973-74 and 10% per annum one year later [Altmann, 19771. Another result was that various salt-tolerant plants, such as Suaeda monoica and Psilolemma jaegeri, became more abundant. These halophytes are all less palatable to baboons than the plants that have been displaced and are less nutritious (S. Altmann, unpublished manuscript). They provide the baboons with neither shade nor roosting sites.
During this transformation of the Amboseli habitat, the baboon population underwent a major decline, which was paralleled by marked decreases in the popu- lations of vervet monkeys and of several other woodland and grassland mammals [Struhsaker, 1973, 1976; Western & Sindiyo 1972, Western & Van Praet, 19731. In short, Amboseli has, in just a few years, been transformed from a woodland/grass- land complex supporting a large baboon population into a much less suitable xero- morphic, halophytic open savannah community [Western, 1973; Western & Van Praet, 19731.
The present paper provides an analysis of the change in the Amboseli baboon population. In presenting the results, we shall describe changes over time in several indicators, such as group size and the ratio of immatures to matures, that are related to the demographic state of the population. It should be emphasized, however, that each of these demographic indicators by itself tells only part of the demographic story, as does any of the demographic parameters, such as mortality rates. For example, total population size may remain constant for a year, but changes in age- specific rates of natality or mortality during that year may mean that the population is entering a period of major decline or growth [see, eg, Fisher, 1958, p 30; Keyfitz, 19681. Likewise an increase in rates of natality may not be a sign of impending
Amboseli Baboon Demography I 115
growth but rather an indication of population decline if the higher natality rates are the result of higher infant mortality leg, Altmann et al, 19781. Therefore, in attempt- ing to understand the dynamics of the Amboseli baboon population, we shall com- pare not only the relative number of individuals in various age-sex classes but, when possible, the age-specific rates of natality and mortality.
METHODS Censuses
A partial census of 15 baboon groups (mean group size 80; median 70) was carried out in Amboseli by DeVore and Washburn [1963) during 1959. Our first research in Amboseli was conducted during 1963-1964. That study and a series of subsequent studies by us and our colleagues provided census data on Amboseli baboons for the years 1963-1964,1969, and continuously since 1971.
ow basic method for censusing groups that we are not studying on a daily basis is described in Altmann and Altmann [1970]. We have, for purposes of analysis, utilized the census taken closest to August 1 for each such group. August 1 has been taken as the annual census date because the birth peak in Amboseli baboons typically occurs in June and July, and to a lesser extent August. By obtaining censuses at the beginning of August we include most infants that are born and miss the fewest that might otherwise be lost to early mortality. Because baboon females have a visible “pregnancy sign,” namely a reddening of the paracallosal skin [Altmann, 19701, these censuses also permit a good estimation of the number of females who have not yet given birth on that date but who will do so in the next 4 months. Thus a count on August 1 of all infants with natal black or color-change coats plus all pregnant females will provide a value that is about 90% of the births for that year and will provide a reasonably good natality measure for comparison among years.
In addition to annual censuses on all groups within the study area, the present analyses depend on daily longitudinal records of natality, mortality, and maturation in the primary study groups. Such longitudinal demographic and reproductive data from identified individuals and groups have rarely been obtained for any wild animals.
For any group being studied on a nearly daily basis, our method is to record, on each day of observation, the presence or absence of each of the baboons, which are individually identified, and the reproductive condition of each adult female. We record physical assessments of new infants as soon after birth as possible and make periodic evaluations of physical maturation. We have obtained such data for one group, Alto’s Group, since 1971, and on a second, Hook’s Group, since 1981.
Age Classes Observers who have not worked with known-age primates in the field have
uniformly underestimated the age of immature wild primates and overestimated the age of mature individuals that are beginning to exhibit characteristics of aging [Altmann et al, 19811. Although between-habitat differences in the maturation and aging of wild primates remain a real possibility, the major difference in recorded primate maturation rates occurs between unprovisioned wild populations and those that are provisioned or captive, and evidence for this difference is increasing as data become available from long-term studies of several primate species leg Altmann et al, 1981; Harcourt et al, 1981; Mori, 1979; Pusey, 1978; Sigg et al, 1982; Sugiyama & Ohsawa, 19821.
Longitudinal field data on physical maturation of known-age yellow baboon individuals formed the basis of major revisions of age estimates for those age classes [Altmann et al, 1977, 19811. The classes and age estimates used in the analyses presented here closely follow those of our 1981 paper with those modifications needed
116 / Altmann, Hausfater, and Altmann
for censusing of unknown individuals [see Altmann et al, i981, pp. 394-396 for details].
The first age class, that of young (black or color-change) infants, includes indi- viduals through 8 months of age. In order to assure the greatest confidence in year- to-year and group-to-group comparisons of the population data reported here, the older (brown) infant and young juvenile categories have been combined into a single class running from 8 months to 3 three years of age; for brevity, in the text we refer to this as the young Juvenile class. A classification problem that remains is the boundary between younger and older juveniles, for which there are no highly conspicuous morphological markers.
The older juvenile class extends from 3 years to 5 112 years, at which age some females experience their first conceptions and males can be seen to have scrota1 bulges and canines that extend beyond the masticatory surface of the tooth row. Beyond this age, females usually produce infants fairly regularly and are recorded in censuses as adults. Males, however, probably rarely father infants until a few years later, when they achieve adult size and dominance status. As a consequence, they are recorded as subadults for about another 2 or 3 years.
Natality and Mortality For the comparisons that follow, we have used, as the baseline, the rates of
maturation and the age-specific rates of natality and mortality obtained for Alto’s Group in the years 1971-1979 [Altmann 1980, Altmann et al, 1981; unpublished data]. That period was one of either slight or no decline in the size of Alto’s Group. Beyond that, these age-specific rates of birth and death lead, as will be described below, to a stationary population.
Available life-table data indicate neither a sex bias in overall natality nor a differential mortality by sex among infants or young juveniles. Among older juve- niles mortality may be higher in males but the data are not yet sufficient to determine that with reasonable confidence. We shall assume in what follows that half of all the individuals less than 5 112 years old are females.
RESULTS The annual census results for 1963-1964 through 1983 appear in Figure 1. In
Figures 2-4, the census records, plotted as age pyramids, are presented for each of the three groups present in the study area throughout that period at as close to 5- year intervals as possible, starting in 1969. In the pyramids the height of each age class is scaled to the number of years spanned by that class, and the width represents the number of individuals per 1-year age group within that class. In constructing the age pyramids we assumed a maximum life span of 20 years.
Total Size of Population During 1963-1964, repeated censuses of several groups revealed no obvious
change in the population size of about 2,500 animals in 51 groups, and the small sample sizes available from the one intensively studied group that year provided estimates of natality that were within the range of limited comparative data in the literature [see Altmann & Altmann, 19701.
Nonetheless the overall size of the baboon population had declined to approxi- mately 255 animals in eight groups when we returned in 1969, for an apparent 90% decline in the 5 years from 1964 to 1969 and a per annum decrease of 46% (ie, r = 54) during that period. Expressed in terms of changes in.density, the results are even more spectauclar. because we have covered a larger area in our censuses since 1964. From 1964 to 1969, the population density fell from about 73 to 3.7 baboons per km2, suggesting a loss of 95% of the population.
Amhoseli Baboon Demography / 117
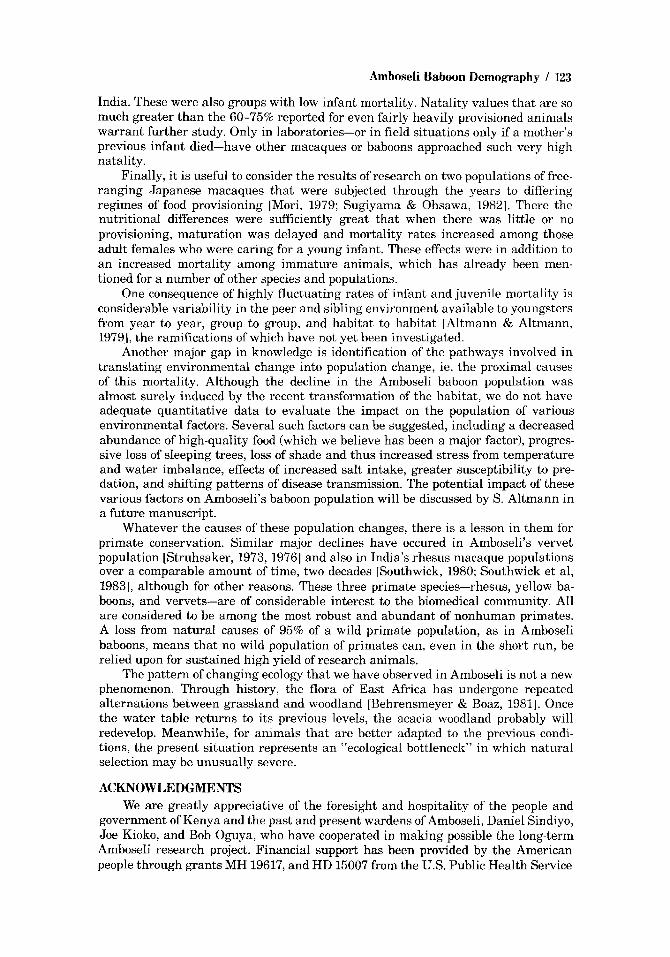
i I Legend ALTO'S GROUP
10 STUD'S GROUP
' G OTHER GROUPS
a HIGHTAIL'S GROUP
0 - 1 l ~ I ~ I ~ I ' I ' , , l ~ I ' I ~ I I ,
1964 1966 1968 1970 1972 1974 1976 1978 1980 1982 1984
Year
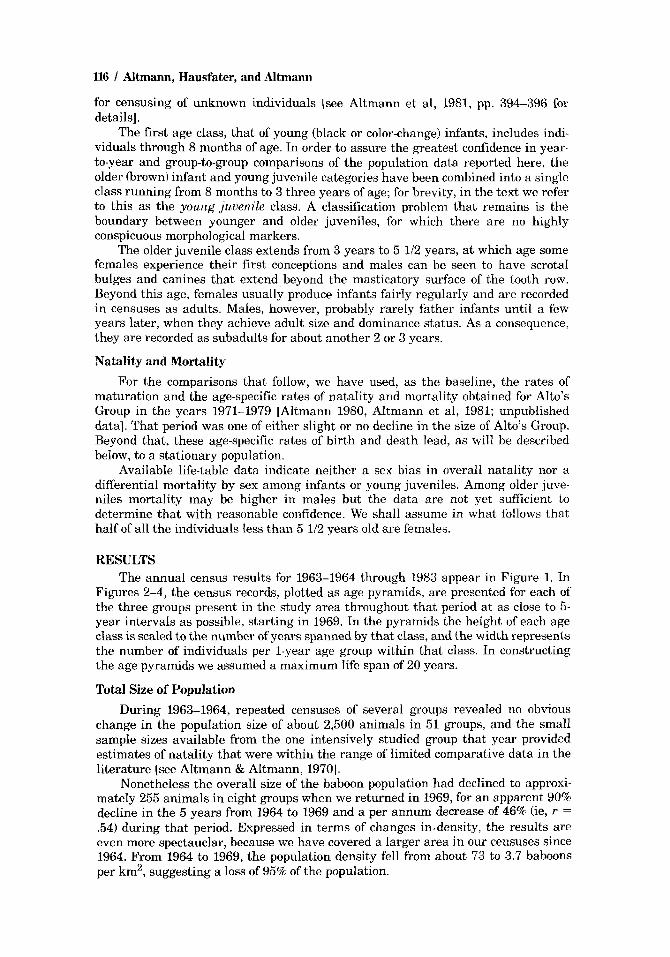
Fig. 1. Size of Amboseli haboon groups from 1963-1964 through 1983. See text for details.
As the population size decreased, so too did the number of groups, though not as markedly; that is, group size decreased also. Mean group size was 51 (median 43) in 1963-1964 and approximately 31 (median 23) in 1969. Thus in 1969 there were far fewer groups and these groups were smaller in size than groups in 1963-1964, but they were larger in size than one would have expected from the decline in total number of individuals.
Between 1969 and 1971 the baboon population dropped from 255 animals in eight &TOUPS to 215 animals in seven groups (3.14 animals per km')), a decline of 16% over the 2-year period (r = 0.92 on a per annum basis); ie, the rate of decline had decreased (Fig. 1). Since 1971, and particularly since 1974, the rate of population decline has decreased further. As of 1979, there were 123 baboons in the area, at a density of 1.8 baboons per km2. This indicates an annual mean of r = 0.93 during 1971-1979, an improvement over earlier values but nonetheless indicating an an- nual loss rate of almost 7%. From 1979 to 1983 there has been a slight increase in the population, to about 150 individuals, suggesting an end to the decline. Popula- tions density as of 1983 was 2.2 individuals per km2.
This relative improvement varied considerably from group to group and from year to year. Unlike most groups, Alto's Group showed no consistent change. It is possible that this is partly due to some unintended reduction in predation afyorded by the frequent presence of observers studying Alto's Group, although that certainly has not made them immune: more than once they have been attacked by leopards while an observer was OP foot among them. Moreover, we have only recently begun detailed observations on Hook's Group, yet their demographic profile has been quite good for a number of years. The smallest and largest Amboseli groups seem to have experienced greater rates of decline than have those groups of intermediate size,
118 / Altmann, Hausfater, and Altmann
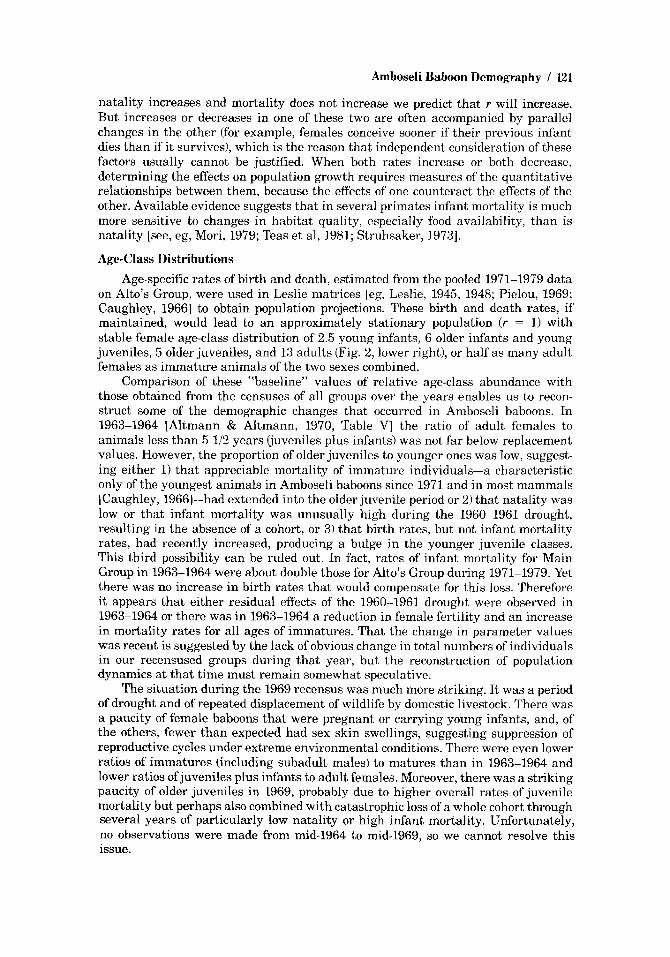
ALTO'S Group Average
1969
1 subodult
older juveniles older infonts
block infants-- Q +young juveniles 'I
Averoae 1978- (979 j,
1974-1975
i L 3
Stoble shooe
'-. 5
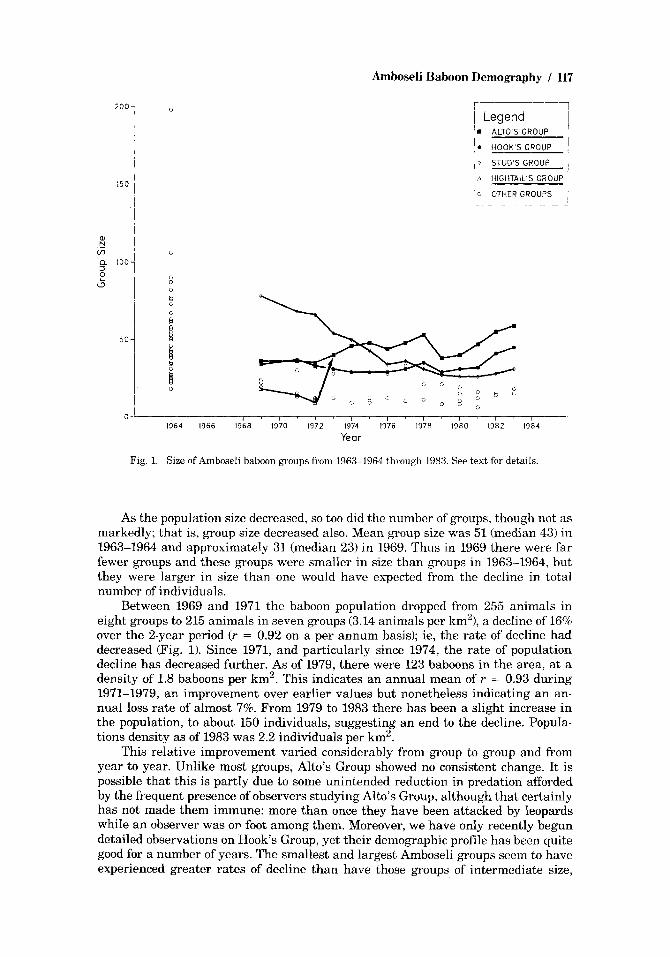
Fig. 2. Age-sex-class pyramids for Alto's Group at 5-year intervals and stable age-sex distribution (lower right) calculated from age-and-sex-specific natality and mortality values available for this group. The height of each rectangle is proportional to the number of years spanned by that age class; the width represents the number of individuals per 1-year age group within that class. The total number of individuals in the age class, proportional to the area, is given within each rectangle. See Methods and Altmann et a1 119811 for a discussion of these age classes.
but, unfortunately, it has not been possible with available personnel and resources to obtain data on natality and mortality for the former two. It is possible that the small groups have decreased and disappeared due to group emigration out of the study area or to fusion with other groups in the study area rather than because of' low rates of natality relative to mortality and that the large groups have decreased due to emigration within or out of the area. However, the demographic parameters examined (see below) suggest that it is unlikely that migration and fusion account for all of the changes. In any case, the trend in group size (Fig.1) and the one known group fusion (a small group fused with Alto's Group in late 1972) suggest that for a given habitat there may be an optimal group size in the sense that rates of natality and mortality are better for individuals in groups near the modal size than for individuals in larger or smaller groups.
Adult Replacement It is useful to discuss population replacement in terms of females only. Baboons
are particularly suited to such treatment: They are large mammals with long interbirth intervals, little paternal care, virtually no female migration, but rela- tively frequent male migration.
Amboseli Baboon Demography I 119
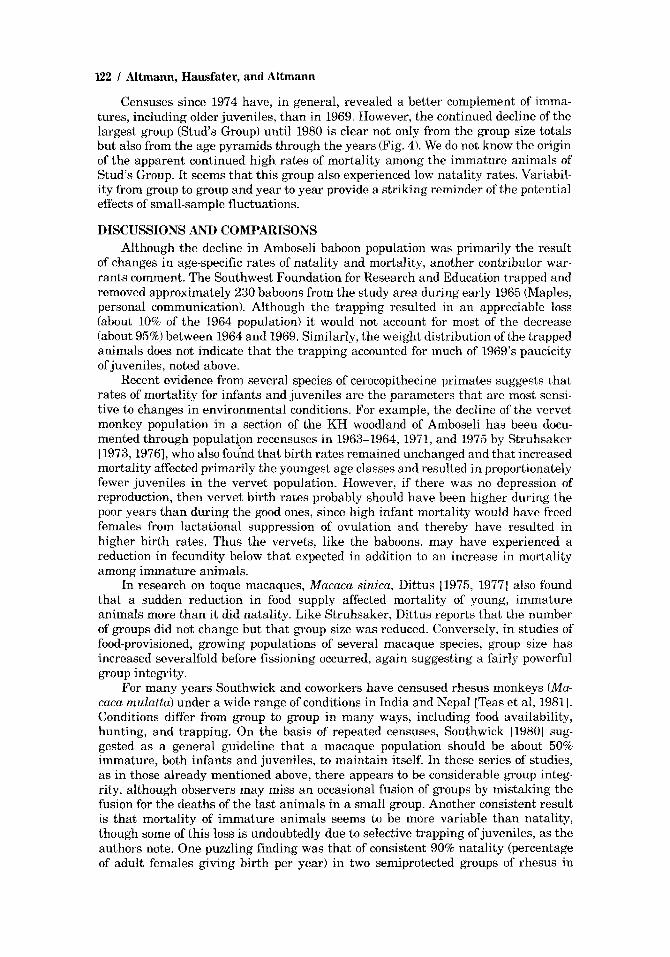
HOOK’S Group I969 I974
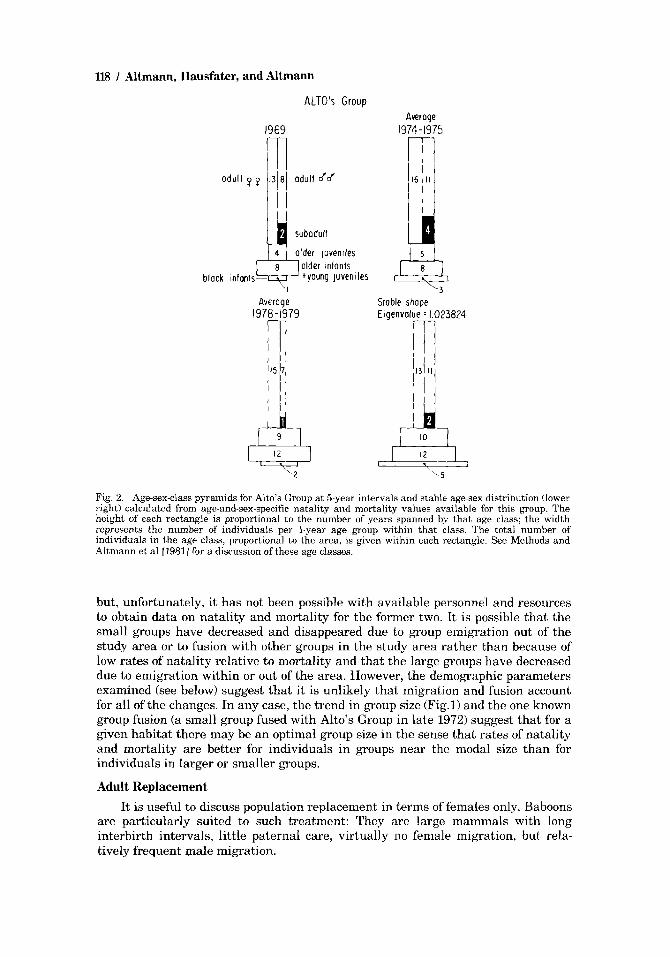
Fig. 3. Age-and-sex-class pyramids for Hook‘s Group at 5-year intervals. Symbols and conventions as in Figure 2.
One of the best single measures of whether a population is replacing itself is whether or not the number of maturing females entering the adult class is equal to the number leaving through death. This figure, combined with those for natality and infant mortality, provides a fairly good index of the demographic “health” of the population.
Since 1963, adult female mortality in Amboseli has been 10-15% per annum. It was approximately 13% for Main Group in 1963-1964. For Alto’s Group since 1971 it has been approximately 12% but with rates apparently a function of age and reproductive state [Altmann, 19801. Based on an older juvenile class (i2) that spans almost 2.5 years, and assuming that approximately half of the class will be females, and that there is very little mortality within this age class [Altmann, 19801, we expect that per annum 0.5 (U2.5) or 1/5 of the class of j2’s will add to the class of adult females. If one-tenth of the adult female class dies each year and one-fifth of the older juvenile class replaces it, then an older juvenile class that is one-half the size of the adult female class is one that would provide replacement but not growth. Of course, lower rates of adult female mortality or a higher proportion of females among the juveniles would mean that a smaller juvenile class would be adequate to
120 I Altmann, Hausfater, and Altmann
STUD’S Group
1969
LO W
Average 1974 - I975
‘2
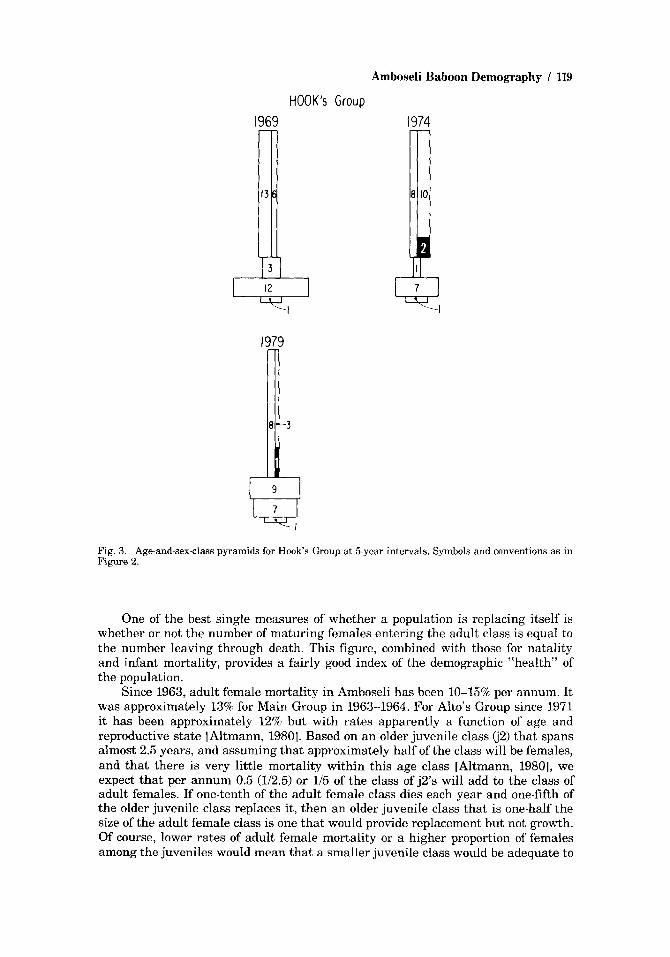
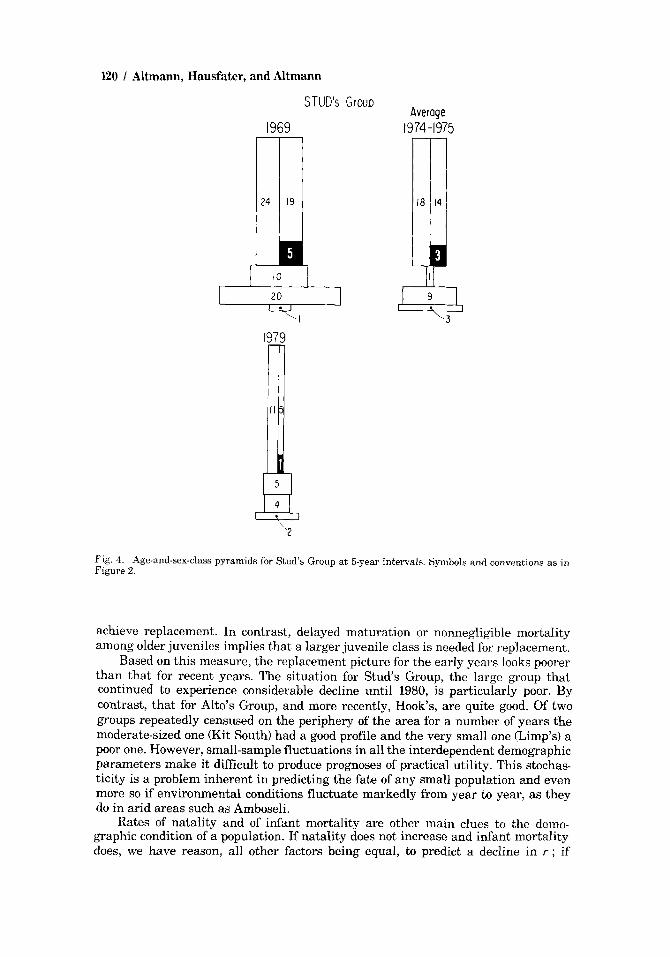
Fig. 4. Age-and-sex-class pyramids for Stud‘s Group at 5-year intervals. Symhols and conventions as in Figure 2.
achieve replacement. In contrast, delayed maturation or nonnegligible mortality among older juveniles implies that a larger juvenile class is needed for replacement.
Based on this measure, the replacement picture for the early years looks poorer than that for recent years. The situation for Studs Group. the large group that continued to experience considerable decline until 1980, is particularly poor. By contrast, that for Alto’s Group, and more recently, Hook’s, are quite good. Of two groups repeatedly censused on the periphery of the area for a number of years the moderate-sized one (Kit South) had a good profile and the very small one (Limp’s) a poor one. However, small-sample fluctuations in all the interdependent demographic parameters make it difficult to produce prognoses of practical utility. This stochas- ticity is a problem inherent in predicting the fate of any small population and even more so if environmental conditions fluctuate markedly from year to year, as they do in arid areas such as Amboseli.
Rates of natality and of infant mortality are other main clues to the demo- graphic condition of a population. If natality does not increase and infant mortality does, we have reason, all other factors being equal, to predict a decline in r ; if
Amboseli Baboon Demography / 121
natality increases and mortality does not increase we predict that r will increase. But increases or decreases in one of these two are often accompanied by parallel changes in the other (for example, females conceive sooner if their previous infant dies than if it survives), which is the reason that independent consideration of these factors usually cannot be justified. When both rates increase or both decrease, determining the effects on population growth requires measures of the quantitative relationships between them, because the effects of one counteract the effects of the other. Available evidence suggests that in several primates infant mortality is much more sensitive to changes in habitat quality, especially food availability, than is natality [see, eg, Mori, 1979; Teas et al, 1981; Struhsaker, 19731.
Age-Class Distributions Age-specific rates of birth and death, estimated from the pooled 1971-1979 data
on Alto’s Group, were used in Leslie matrices [eg, Leslie, 1945, 1948; Pielou, 1969; Caughley, 19661 to obtain population projections. These birth and death rates, if maintained, would lead to an approximately stationary population ( r = 1) with stable female age-class distribution of 2.5 young infants, 6 older infants and young juveniles, 5 older juveniles, and 13 adults (Fig. 2, lower right), or half as many adult females as immature animals of the two sexes combined.
Comparison of these “baseline” values of relative age-class abundance with those obtained from the censuses of all groups over the years enables us to recon- struct some of the demographic changes that occurred in Amboseli baboons. In 1963-1964 [Altmann & Altmann, 1970, Table V] the ratio of adult females to animals less than 5 112 years (juveniles plus infants) was not far below replacement values. However, the proportion of older juveniles to younger ones was low, suggest- ing either 1) that appreciable mortality of immature individuals-a characteristic only of the youngest animals in Amboseli baboons since 1971 and in most mammals [Caughley, 1966I-had extended into the older juvenile period or 2) that natality was low or that infant mortality was unusually high during the 1960-1961 drought, resulting in the absence of a cohort, or 3) that birth rates, but not infant mortality rates, had recently increased, producing a bulge in the younger juvenile classes. This third possibility can be ruled out. In fact, rates of infant mortality for Main Group in 1963-1964 were about double those for Alto’s Group during 1971-1979. Yet there was no increase in birth rates that would compensate for this loss. Therefore it appears that either residual effects of the 1960-1961 drought were observed in 1963-1964 or there was in 1963-1964 a reduction in female fertility and an increase in mortality rates for all ages of immatures. That the change in parameter values was recent is suggested by the lack of obvious change in total numbers of individuals in our recensused groups during that year, but the reconstruction of population dynamics at that time must remain somewhat speculative.
The situation during the 1969 recensus was much more striking. It was a period of drought and of repeated displacement of wildlife by domestic livestock. There was a paucity of female baboons that were pregnant or carrying young infants, and, of the others, fewer than expected had sex skin swellings, suggesting suppression of reproductive cycles under extreme environmental conditions. There were even lower ratios of immatures (including subadult males) to matures than in 1963-1964 and lower ratios of juveniles plus infants to adult females. Moreover, there was a striking paucity of older juveniles in 1969, probably due to higher overall rates of juvenile mortality but perhaps also combined with catastrophic loss of a whole cohort through several years of particularly low natality or high infant mortality. Unfortunately, no observations were made from mid-1964 t o mid-1969, so we cannot resolve this issue.
I22 I Altmann, Hausfater, and Altrnann
Censuses since 1974 have, in general, revealed a better complement of imma- tures, including older juveniles, than in 1969. However, the continued decline of the largest group (Stud's Group) until 1980 is clear not only from the group size totals but also from the age pyramids through the years (Fig. 4). We do not know the origin of the apparent continued high rates of mortality among the immature animals of Stud's Group. It seems that this group also experienced low natality rates. Variabil- ity from group to group and year to year provide a striking reminder of the potential effects of small-sample fluctuations.
DISCUSSIONS AM) COMPARISONS Although the decline in Amboseli baboon population was primarily the result
of changes in age-specific rates of natality and mortality, another contributor war- rants comment. The Southwest Foundation for Research and Education trapped and removed approximately 230 baboons from the study area during early 1965 (Maples, personal communication). Although the trapping resulted in an appreciable loss (about 10% of the 1964 population) it would not account for most of the decrease (about 958) between 1964 and 1969. Similarly, the weight distribution of the trapped animals does not indicate that the trapping accounted for much of 1969's paucicity of juveniles, noted above.
Recent evidence from several species of cerocopithecine primates suggests that rates of mortality for infants and juveniles are the parameters that are most sensi- tive to changes in environmental conditions. For example, the decline of the vervet monkey population in a section of the KH woodland of Amboseli has been docu- mented through populatjon recensuses in 1963-1964, 1971, and 1975 by Struhsaker [1973,1976], who also found that birth rates remained unchanged and that increased mortality affected primarily the youngest age classes and resulted in proportionately fewer juveniles in the vervet population. However, if there was no depression of reproduction, then vervet birth rates probably should have been higher during the poor years than during the good ones, since high infant mortality would have freed females from lactational suppression of ovulation and thereby have resulted in higher birth rates. Thus the vervets, like the baboons, may have experienced a reduction in fecundity below that expected in addition to an increase in mortality among immature animals.
In research on toque macaques, Macaca sinica, Dittus [1975, 19771 also found that a sudden reduction in food supply affected mortality of young, immature animals more than it did natality. Like Struhsaker, Dittus reports that the number of groups did not change but that group size was reduced. Conversely, in studies of food-provisioned, growing populations of several macaque species, group size has increased severalfold before fissioning occurred, again suggesting a fairly powerful group integrity.
For many years Southwick and coworkers have censused rhesus monkeys (Ma- caca mulatta) under a wide range of conditions in India and Nepal [Teas et al, 19811. Conditions differ from group to group in many ways, including food availability, hunting, and trapping. On the basis of repeated censuses, Southwick 119801 sug- gested as a general guideline that a macaque population should be about 50% immature, both infants and juveniles, to maintain itself. In these series of studies, as in those already mentioned above, there appears to be considerable group integ- rity, although observers may miss an occasional fusion of groups by mistaking the fusion for the deaths of the last animals in a small group. Another consistent result is that mortality of immature animals seems to be more variable than natality, though some of this loss is undoubtedly due to selective trapping of juveniles, as the authors note. One puzzling finding was that of consistent 90% natality (percentage of adult females giving birth per year) in two semiprotected groups of rhesus in
Amboseli Baboon Demography I 123
India. These were also groups with low infant mortality. Natality values that are so much greater than the 60-7572 reported for even fairly heavily provisioned animals warrant further study. Only in laboratories-or in field situations only if a mother’s previous infant died-have other macaques or baboons approached such very high natality.
Finally, it is useful to consider the results of research on two populations of free- ranging Japanese macaques that were subjected through the years to differing regimes of food provisioning [Mori, 1979; Sugiyama & Ohsawa, 19821. There the nutritional differences were sufficiently great that when there was little or no provisioning, maturation was delayed and mortality rates increased among those adult females who were caring for a young infant. These effects were in addition to an increased mortality among immature animals, which has already been men- tioned for a number of other species and populations.
One consequence of highly fluctuating rates of infant and juvenile mortality is considerable variability in the peer and sibling environment available to youngsters from year to year, group to group, and habitat to habitat [Altmann & Altmann, 19791, the ramifications of which have not yet been investigated.
Another major gap in knowledge is identification of the pathways involved in translating environmental change into population change, ie, the proximal causes of this mortality. Although the decline in the Amboseli baboon population was almost surely induced by the recent transformation of the habitat, we do not have adequate quantitative data to evaluate the impact on the population of various environmental factors. Several such factors can be suggested, including a decreased abundance of high-quality food (which we believe has been a major factor), progres- sive loss of sleeping trees, loss of shade and thus increased stress from temperature and water imbalance, effects of increased salt intake, greater susceptibility to pre- dation, and shifting patterns of disease transmission. The potential impact of these various factors on Amboseli’s baboon population will be discussed by S. Altmann in a future manuscript.
Whatever the causes of these population changes, there is a lesson in them for primate conservation. Similar major declines have occured in Amboseli’s vervet population [Struhsaker, 1973, 19761 and also in India’s rhesus macaque populations over a comparable amount of time, two decades [Southwick, 1980; Southwick et al, 19831, although for other reasons. These three primate species-rhesus, yellow ba- boons, and vervets-are of considerable interest to the biomedical community. All are considered to be among the most robust and abundant of nonhuman primates. A loss from natural causes of 95% of a wild primate population, as in Amboseli baboons, means that no wild population of primates can, even in the short run, be relied upon for sustained high yield of research animals.
The pattern of changing ecology that we have observed in Ambuseli is not a new phenomenon. Through history, the flora of East Africa has undergone repeated alternations between grassland and woodland [Behrensmeyer & Boaz, 19811. Once the water table returns to its previous levels, the acacia woodland probably will redevelop. Meanwhile, for animals that are better adapted to the previous condi- tions, the present situation represents an “ecological bottleneck” in which natural selection may be unusually severe.
ACKNOWLEDGMENTS We are greatly appreciative of the foresight and hospitality of the people and
government of Kenya and the past and present wardens of Amboseli, Daniel Sindiyo, Joe Kioko, and Bob Oguya, who have cooperated in making possible the long-term Amboseli research project. Financial support has been provided by the American people through grants MH 19617, and HD 15007 from the U.S. Public Health Service
124 I Altmann, Hausfater, and Altmann
and BNS 78-09178 from the National Science Foundation. We have been assisted in data analysis and manuscript preparation by J. Luft, D. Malamud, and J. McIver. David Western provided helpful comments on an earlier draft. In our absence from Amboseli, censuses have been maintained by our students and colleagues working on the project. We are grateful for the contributions to the present data set of J. Friedman, R. Jansma, R. Mututua, R. and B. Noe, M. Pereira, A. Samuels, C. Saunders, F. Sa ido , J. Shodand, J. Silk, S. Sloane, P. Stacey, D. Stein, J. Stelzner, - D. Takacs, and especially J. Walters.
REFERENCES
Altmann, J. BABOON MOTHERS AND TN- FANTS. Cambridge, MA, Harvard Univer- sity Press, 1980.
Altmann, J.; Altmann, S.; Hausfater, G. Pri- mate infant’s effects mother’s future repro- duction. SCIENCE 201:1028-1030,1978.
Altmann, J.; Altmann, S.; Hausfater, G.; McCuskey, S. Life history of yellow ba- boons: Physical development, reproductive parameters and infant mortality. PKI- MATES 18:315-330, 1977.
Altmann, J.; Altmann, S.; Hausfater, G. Physical maturation and age estimates in yellow baboons, Papio cynocephalus, in Am- boseli National Park, Kenya. AMERICAN JOURNAL OF PRIMATOLOGY 1389-399, 1981.
Altmann, S.A. The pregnancy sign in savan- nah baboons. LABORATORY ANIMAL UI- GEST 6(3):7-10, 1970.
Altmann, S.A. THE ACACIA WOODLAND OF AMBOSELI NATIONAL PARK: CUR- RENT STATUS AND FUTURE PROS- PECTS. Report submitted to the Director, Kenya National Parks, 1977.
Altmann, S.A.; Altmann, J . BABOON ECOLOGY: AFRICAN FIELD RE- SEARCH. Chicago, University of Chicago Press, 1970.
Altrnann, S.A.; Altmann, J. Demographic constraints on behavior and social organi- zation, pp. 47-63 in PRIMATE ECOLOGY AND HUMAN ORIGINS I S . Bernstcin, E.O. Smith cds. New York, Garland, 1979.
Behrensmeyer, A.K.; Boaz, I1.D. Late Pleistocene geology and paleontology of Amboseli National Park, Kenya. PALEAOECOLOGY OF AFRICA 13:175- 188,1981.
Caughley, G. Mortality patterns in animals. ECOLOGY 47:906-918,1966.
Cohen, M.N.; Malpass, R.S.; Klein, H.G., eds. BIOSOCIAL MECHANISMS OF POPU- LATION REGULATION. New Haven, Yale University Press, 1979.
DeVore, I.; Washburn, S.L. Baboon ecology and human evolution, pp, 335-367 in A@- RICAN ECOLOGY AND HUMAN EVO- LUTION, F.C. Howell; F. Rourliere, eds, Chicago, Aldine, 1963.
Dittus. W.P.J. P o d a t i o n dvnamics of the to-
OF PRIMATES R.H. Tuttle, ed. The Hague, Mouton, 1975.
Dittus, W.P.J. The social regulation of popu- lation density and age-sex distribution in the toque monkey. BEHAVIOUR 63281- 322, 19?7.
Fisher, R.A. THE GENETICAL THEORY OF NATURAL SELECTION. Oxford. Oxford University Press, 1958.
Harcourt, A.H.; Fossey, D.; Stewart, K.J.; Watts, D.P. Reproduction in wild gorillas and some comparisons with chimpanzees, pp. 59-70 in THE GREAT APES OF AF- RICA R.V. Short; B.J. Weir eds. (JOURNAL OF REPHODUCTION & FERTILITY. Sun- plement No. 28). Cambridce. Journals of Rk- production and Fertility ctd., 1981.
Kevfit,z. N.N. INTRODUCTION TO THE MATHEMATICS OF POPULATION. h a d - ing, MA, Addison-Wesley, 1968.
Leslie, P.H. On the use of matrices in certain population mathematics. BIOMETRIKA 33183-212, 1945.
Leslie, P.H. Some further notes on the use of matrices in population mathematics. BIOMETRIKA 35:212-245,1948.
Mori, A. Analysis of population changes by measurement of body weight in the Ko- shima troop of Japanese monkeys. PRI MATES 20:371-398,1979.
Pielou, E.C. AN INTRODUCTION TO MATHEMATICAL ECOLOGY. New York, John Wiley & Sons, 1969.
Pusey, A. THE PHYSICAL AND SOCIAL DEVELOPMENT OF WILD ADOLES- CENT CHIMPANZEES (PAN TROGLO DYTES SCXWEINFURTHIn PhD thesis, Stanford University, 1978.
Sigg, H.; Stolba, A.; Abbelglen, J.-J.; Dasser, V. Life history of hamadryas baboons: physical development, infant mortality, re- productive parameters and family relation- ships. PRIMATES 23: 473-487,1982.
Southwick, C.H. Rhesus monkey populations in India and Nepal: Patterns of growth, de- cline, and natural regulation, pp. 151-170 in BIOSOCIAL MECHANISMS OF POPU- LATION REGULATION M.N. Cohen, et al, eds. New Haven, Yale University Press, 1980.
Southwick, C.H.; Siddiai, M.F., Oppenhei- que monkey, M&ca sinica, pp, 125-151 in mer, J.R. Twenty-year-changes in -rhesus SOCIOECOLOGY AND PSYCHOLOGY monkey populations in agricultural areas of

Amboseli Baboon Demography I 125
northern India. ECOLOGY 64:434-439, of rhesus monkey populations in Kat- 1983. mandu, Nepal. FOLIA PRIMATOLOGICA
Struhsaker, T.T. A recensus of vervet mon- 35:117-123,1981. keys in the Masai-Amboseli Game Reserve, Western, D. THE STRUCTURE, DYNAM- Kenya. ECOLOGY 54930-932,1973. ICS, AND CHANGES OF THE AMBOSELI
Struhsaker, T.T. A further decline in nun1 ECOSYSTEM. PhD thesis, University of bers of Amboseli vcrvet monkeys. BIOTRO- Nairobi, 1973. PICA 81211-214,1976. Western, D.; Sindiyo, D.M. The status of the
Sugiyama, Y.; Ohsawa, H. Population dy- Amboseli rhino population. EAST AFRI- namics of Japanese monkeys with special CAN WILDLIFE JOURNAL 10:43-57, reference to the effect of artificial feeding. 1972. FOLIA PRIMATOLOGlCA 39:238-263, Western, D.; Van Praet, C. Cyclical changes 1982. in the habitat and climate of an east Afri-
Teas, J.; Richie, T.L.; Taylor, H.G.; Siddiqi, can ecosystem. NATURE 241:104-106,1973. M.F.; Southwick, C.H. Natural regulation