Embed Size (px)
Citation preview

Glasgow Theses Service http://theses.gla.ac.uk/
Smith, Gordon William Graham (2011) Biofouling of dental handpieces. PhD thesis. http://theses.gla.ac.uk/3075/ Copyright and moral rights for this thesis are retained by the author A copy can be downloaded for personal non-commercial research or study, without prior permission or charge This thesis cannot be reproduced or quoted extensively from without first obtaining permission in writing from the Author The content must not be changed in any way or sold commercially in any format or medium without the formal permission of the Author When referring to this work, full bibliographic details including the author, title, awarding institution and date of the thesis must be given

Biofouling of Dental Handpieces
Gordon William Graham Smith
BSc Hons. MRes
Submitted in fulfilment of the requirements for the degree of
Doctor of Philosophy
School of Medicine
College of Medical, Veterinary and Life Sciences
© Gordon William Graham Smith, August 2011

II
Abstract
Dental handpieces (HP’s) are used during semi-critical and critical dental
procedures that imply the HP must be sterile at the point of use. The aim of this
study was to undertake a quantitative and qualitative analysis of dental HP
contamination to inform the development of HP cleaning. Preliminary validation
work on protein desorbtion methods and protein detection assays resulted in
boiling in 1% sodium dodecylsulphate (SDS) and the o-phthaldialedhyde (OPA)
assay (sensitivity 5 µg/ml) selected for further use in this study. A quantitative
and qualitative analysis of HP microbial and protein contamination was then
undertaken. Before decontamination, bacteria were isolated from high speed
HP’s (n=40) (median 200 cfu, range 0-1.9x10⁴ CFU/instrument), low speed
HP’s(n-40) (median 400 cfu, range 0-1x10⁴ CFU/instrument) and surgical HP’s
(n=20) (median 1x10³, range 0-3.7x10⁴ CFU/instrument). A range of oral bacteria
were identified in addition to Staphylococcus aureus and Propionibacterium
acnes. Protein was detected from high speed HP’s (median 1.3, range 0- 210g),
low speed HP’s (median 15.41 µg, range 0 - 448 µg) and surgical HP’s (median
350 µg, range 127.5– 1,936 µg) before decontamination. Serum albumin and
salivary mucin were identified on surgical HP’s before decontamination. Calcium
based deposits and contaminants trapped in lubricating oil were also detected
using scanning electron microscopy (SEM) and energy dispersive x-ray analysis
(EDX). The efficacy of detergents and a HP cleaning solution at cleaning HP
contaminants was assessed in vitro with a standard test soil and disruption of
biofilms with a range of cleaning efficacies noted from each cleaning solution
tested. Alkaline detergents caused a significant biomass disruption of P. acnes
biofilms compared to ROH2O alone. HP cleaning solution resulted in fixation of
the biofilm and blood to the surface. The efficacy of novel HP cleaning machines
was also assessed using a test soil based on the data generated in this study.
Efficacy varied between devices tested with one demonstrating efficient protein
removal in all but 1 HP location. The data presented describes a quantitative
and qualitative assessment of common contaminants of HP’s, mainly bacteria,
salivary mucin and serum albumin. In-vivo biofouling levels of HP’s are several
fold lower than standard test soil formulations and consideration should be given
to use of HP test soil based on in-vivo data to validate HP cleaning processes.
The data generated in this thesis should aid in designing dental HP test soils and
cleaning regimens.

III
Table of Contents
1 Chapter 1: Introduction .............................................................. 1
1.1.1 Historical Perspective ....................................................... 2
1.1.2 Restorative dentistry ........................................................ 2
1.1.3 Introduction and history of dental handpiece development .......... 2
1.1.4 Handpiece types ............................................................. 5
1.1.5 Relationship between handpiece structure and contamination ...... 6
1.1.6 Internalisation of HP contaminants ....................................... 6
1.1.7 Dental unit waterline contamination ..................................... 7
1.1.8 Bacterial contamination of dental handpieces .......................... 8
1.1.9 Viral contamination of dental handpieces ............................... 9
1.1.10 Contamination of surgical power tools .................................. 10
1.1.11 Contamination of rotary power tools .................................... 10
1.1.12 Contamination of ultrasonic power tools ............................... 11
1.1.13 Laser handpiece contamination .......................................... 12
1.2 Surface interaction of instrument contaminants ........................... 12
1.2.1 Protein adsorption onto surfaces ......................................... 13
1.2.2 The importance of protein structure .................................... 13
1.2.3 The importance of protein concentration .............................. 14
1.2.4 Effect of solution pH and temperature .................................. 14
1.2.5 Adsorption of prion proteins to stainless steel surfaces .............. 15
1.2.6 Adsorption of bacteria to a surface ...................................... 16
Biofilm structure ..................................................................... 18
1.3 Decontamination and maintenance of dental handpieces ................. 18
1.3.1 Handpiece lubricating oil .................................................. 20
1.3.2 Definition of terms ......................................................... 21
1.3.3 Factors influencing cleaning efficacy and the implications of protein
adsorption and biofilm formation on cleaning efficacy ........................ 22
1.3.4 Current instrument cleaning methods ................................... 25
1.3.5 Validation of cleaning processes ......................................... 27
1.3.6 Indirect methods ............................................................ 27
1.3.7 Semi- quantitative protein assays ........................................ 27
1.3.8 Ninhydrin assay ............................................................. 27
1.3.9 Biuret and bicinchoninic acid assay ...................................... 29
1.3.10 O-phthaldialdehyde assay ................................................. 29

IV
1.3.11 Direct methods .............................................................. 30
1.3.12 Direct visualisation of contamination by behaviour of water ........ 30
1.3.13 Direct visual examination ................................................. 30
1.3.14 SYPRO® Ruby staining and visualisation................................. 31
1.3.15 Analytical methods ......................................................... 31
1.3.16 Scanning Electron Microscopy, Energy Dispersive X- Ray Analysis and
Auger Spectroscopy .................................................................. 33
1.3.17 X-ray photoelectron spectroscopy ....................................... 34
1.3.18 Time of flight secondary ion mass spectrometry ...................... 34
1.3.19 Fourier transform infrared spectroscopy and Ramen spectroscopy . 34
1.3.20 Implications of cleaning validation on defining cleanability ......... 35
1.3.21 Cleaning and disinfection of dental handpieces ....................... 37
1.3.22 Sterilization of dental handpieces ....................................... 37
1.3.23 Alternative sterilization methods for dental handpieces ............. 39
1.4 Objectives of the study ......................................................... 41
2 Chapter 2: Materials and Methods ................................................. 42
2.1 General Reagents and Equipment ............................................. 43
2.1.1 General reagents ........................................................... 43
2.1.2 Instruments sampled in this study ....................................... 43
2.1.3 Decontamination methods used in this study .......................... 47
2.2 Microbiological assessment..................................................... 52
2.2.1 Type strains used in this study ........................................... 52
2.2.2 Preparation of microbiological growth media .......................... 53
2.2.3 Culture of microorganisms ................................................ 53
2.2.4 Instrument sampling - standard microbial culture ..................... 54
2.2.5 Identification of microorganisms ......................................... 54
2.2.6 Instrument sampling – molecular detection (PCR) ..................... 56
2.3 Protein quantification and analysis ........................................... 57
2.3.1 Quantitative protein sampling ............................................ 57
2.3.2 Protein sample precipitation ............................................. 58
2.3.3 Sodium dodecyl sulphate polyacrylamide gel electrophoresis ....... 59
2.3.4 Gel staining .................................................................. 60
2.3.5 Mass spectrometry data analysis ......................................... 61
2.3.6 Western blot................................................................. 61
2.3.7 Indirect enzyme linked immunosorbent assay .......................... 62

V
2.4 Surface analysis .................................................................. 63
2.4.1 Surface analysis techniques ............................................... 63
2.5 Surface cleaning studies ........................................................ 64
2.5.1 Optimising cleaning parameters .......................................... 64
2.5.2 Cleaning system ............................................................. 65
2.5.3 Biofilm cleaning model .................................................... 65
2.6 Data analysis ..................................................................... 67
3 Chapter 3: Assessment of Assays for Detection of Protein Contamination .. 68
3.1 Introduction ...................................................................... 69
3.2 Results ............................................................................ 71
3.2.1 Sensitivity and linear range of protein assays .......................... 71
3.2.2 Protein concentration of unknown biological samples ................ 78
3.2.3 Effect of handpiece lubricating oil and alcohol on protein detection
assays 81
3.2.4 In situ comparison of automated versus manual cleaning of
instruments ........................................................................... 82
3.3 Discussion ......................................................................... 88
4 Chapter 4: Quantitative and Qualitative Analysis of Microbial Contamination
of Dental Handpieces ..................................................................... 94
4.1 Introduction ...................................................................... 95
4.2 Results ............................................................................ 97
4.2.1 Relationship between bacterial colony forming units and optical
density 97
4.2.2 Minimum inhibitory concentration of handpiece lubricating oil and
cleaning solution ..................................................................... 99
4.2.3 Sensitivity of extraction methods ....................................... 101
4.2.4 Microbial contamination of Glasgow Dental Hospital dental
handpieces ........................................................................... 103
4.2.5 Microbial contamination of repair facility dental handpieces ...... 109
4.2.6 16S PCR of handpiece eluents ........................................... 115
4.3 Discussion ........................................................................ 121
5 Chapter 5: Quantitative and Qualitative Analysis of Protein Contamination of
Dental Instruments ....................................................................... 127
5.1 Introduction ..................................................................... 128
5.2 Results ........................................................................... 130

VI
5.2.1 Validation of protein extraction methods .............................. 130
5.2.2 Validation of protein precipitation methods .......................... 133
5.2.3 Sensitivity of SDS-PAGE staining ......................................... 135
5.2.4 Effect of handpiece lubricating oil on SDS- PAGE ..................... 137
5.2.5 Sensitivity of Antibody Staining and Western Blot .................... 138
5.2.6 Detection of salivary amylase from saliva samples ................... 141
5.2.7 Protein contamination of dental forceps............................... 142
5.2.8 Protein contamination of dental handpieces .......................... 148
5.3 Discussion ........................................................................ 159
6 Surface Analysis of Dental Handpiece Parts. .................................... 166
6.1 Introduction ..................................................................... 167
6.2 Results ........................................................................... 169
6.2.1 Scanning electron microscopy ........................................... 169
6.2.2 Scanning electron microscopy and energy dispersive x ray analysis
174
6.2.3 Epifluorescent scanning analysis ........................................ 190
6.2.4 Discussion ................................................................... 197
7 Chapter 7: Assesment of handpiece cleaning processes, chemicals and
equipment. ................................................................................ 204
7.1 Introduction ..................................................................... 205
7.2 Results ........................................................................... 207
7.2.1 Water quality and detergent properties ............................... 207
7.2.2 Effect of cleaning time on blood removal from stainless steel discs
209
7.2.3 Effect of reverse osmosis water temperature on the removal of
blood from a stainless steel disc .................................................. 212
7.2.4 Effect of agitation speed on the removal of blood from a stainless
steel disc ............................................................................. 215
7.2.5 Efficacy of blood removal by detergents at room temperature .... 218
7.2.6 Efficacy of detergents at blood removal at manufacturers
recommended temperature ....................................................... 220
7.2.7 Efficacy of detergents at P. acnes biofilm removal .................. 226
7.2.8 Efficacy of in vivo handpiece cleaning processes ..................... 235
7.3 Discussion ........................................................................ 240
8 Chapter 8: Discussion ............................................................... 250

VII
8.1 Introduction ..................................................................... 251
8.2 Implications of findings ........................................................ 251
8.2.1 Impact of research ........................................................ 252
8.2.2 Handpiece contamination – test soil development and implications
for cleaning process ................................................................ 253
8.2.3 Handpiece contamination – cross contamination risks ............... 256
8.2.4 Limitations of the study .................................................. 257
8.3 Future work ..................................................................... 258
VIII
List of Tables
Table 1-1 Early methods of HP sterilization adapted from Appleton. J 1924. .... 4
Table 1-2 Details of washer disinfector cleaning stages .......................... 26
Table 1-3 Examples of analytical methods used for cleaning validation. Taken
from Handbook for Cleaning/Decontamination of Surfaces adapted from
Smulders et al. 2007 ...................................................................... 32
Table 1-4 Cleaning validation standards described by standards and scientific
literature ................................................................................... 36
Table 2-1 Source and details of instruments sampled in this study. ........... 44
Table 2-2 Details of podiatry instrument decontamination processes ............. 48
Table 2-3 Details of GDH CSSD decontamination process. .......................... 49
Table 2-4 Ingredients of cleaning solutions listed on MSDS sheets ................. 51
Table 2-5 Details of bacterial and fungal strains used in this study ............ 52
Table 3-1 Concentration of salivary protein concentration detected by each
protein assay. .............................................................................. 79
Table 3-2 Concentration of serum albumin protein detected by each protein
assay. ........................................................................................ 79
Table 3-3 Protein concentration of defibrinated horse blood. ..................... 80
Table 3-4 Estimated protein concentrations of 3 unknown protein samples. .... 80
Table 4-1 MIC of HP maintenance solutions. ......................................... 100
Table 4-2 Percentage recovery of each extraction method at recovering S.
epidermidis. .............................................................................. 102
Table 4-3 Isolated organisms identified from each HP part ........................ 108
Table 4-4 Number of P.acnes types isolated from GDH dental HP’s .............. 109
Table 4-5 Isolated organisms identified from each HP part ........................ 114
Table 4-6 Number of P.acnes types isolated from repair facility dental HP’s ... 115
Table 4-7 Number of bacteria isolated from used,unprocessed samples using
culture techniques and DNA concentration extracted from samples. ............ 116
Table 4-8 Number of bacteria isolated from decontaminated turbine samples
using culture techniques and DNA concentration extracted from samples. ..... 117
Table 4-9 Number of bacteria isolated from decontaminated spray channel
samples using culture techniques and DNA concentration extracted from
samples. ................................................................................... 118

IX
Table 4-10 Number of bacteria isolated from decontaminated surgical gear
samples using culture techniques and DNA concentration extracted from
samples. ................................................................................... 119
Table 5-1 Efficacy of protein extraction techniques and detergents. ............ 131
Table 5-2 Recovery of protein by each precipitation method. .................... 133
Table 5-3 Protein isolated from used, unprocessed and decontaminated
forceps samples. ......................................................................... 143
Table 5-4 Protein identified from used, unprocessed dental forceps ............ 147
Table 5-5 Protein contamination of used, unprocessed HP’s. ..................... 150
Table 5-6 Protein contamination of decontaminated HP’s. ........................ 150
Table 5-7 Salivary amylase concentration detected using ELISA in precipitated
used, unprocessed and decontaminated HP samples. .............................. 157
Table 5-8 Proteins identified from used, unprocessed surgical handpiece
samples. ................................................................................... 158
Table 6-1 Protein detected on HP parts using EFSCAN analysis. The table also
contains protein previously isolated from HP parts using the method described in
section 5.2.25 for comparison. ......................................................... 193
Table 7-1 Properties of H2O used in the study ....................................... 207
Table 7-2 Parameters of sampled detergents ........................................ 208
Table 7-3 Blood removal from a stainless steel surface with time ................ 211
Table 7-4 Effect of ROH2O temperature on the percentage of blood removal .. 214
Table 7-5 Effect of agitation speed on the percentage and median blood removal
from a stainless steel surface........................................................... 217
Table 7-6 Mean percentage and protein removed by each detergent at 22°C and
50°C ........................................................................................ 223
Table 7-7 Mean percentage and protein removed by each detergent at 22°C and
38°C ........................................................................................ 225
Table 7-8 Protein isolated from TA-98 HP’s before and after cleaning. ......... 237
Table 7-9 Protein isolated from WA-99 HP’s before and after cleaning.......... 238
Table 7-10 Protein contamination of WS-75 HP’s before and after cleaning .... 239
Table 8-1 Details of test soils for validation of surgical instrument cleaning and
proposal for new dental HP test soil. Taken from BS-ISO/TS part 5 .............. 255

X
List of Figures
Figure 1-1 Simplified diagram of a high speed HP. The diagram displays the air
line that provides rotary power to the turbine and the water line that provides
water for cooling. The air drive circuit provides compressed air to drive the
turbine. The shank of the bur is inserted into the turbine and revolves with it. . 6
Figure 1-2 Internalisation of contaminants. Negative air pressure is created when
the HP turbine is stopped which causes the internalisation of contaminants into
the air and water circuits. Adapted from (Matsuyama et al., 1997) ................ 7
Figure 1-3 Adsorption of bacteria to a medical device. Initial binding is
dependent on the presence of host proteins. Bacteria are able to bind host
proteins using specific receptors and upon contact with a surface produce the
biofilm ECM. Additional bacterial cells can attach to the biofilm matrix
structure. Adopted from (Rohde et al., 2010). ....................................... 17
Figure 1-4 Critical control points for instrument decontamination. Dental HP’s
and other instruments require cleaning, disinfection, inspection and
sterilization. Each critical control point is essential to the decontamination of
surgical instruments. Sourced from Sterile Services Provision Review Group first
report: The Glennie Framework.(NHS Scotland, 2001). ............................. 19
Figure 1-5 Adaptation of the Sinners circle detailing the effects of 4 variables on
cleaning efficacy. Changing 1 variable can alter the need for other variables to
create an efficacious cleaning process. A recent addition to the Sinners circle is
the water quality. Adapted from (Smulders et al., 2007) ........................... 22
Figure 1-6 Reaction of ninhydrin molecules with amino acids forms Ruhemanns
purple. Ninhydrin exists in equilibrium in a keto (1) and hydrated form (2). The
Schiffs base of a reacting amine causes condensation of the central carbonyl in
the keto form. The Schiffs base then forms a dipolar speies (6) and (7) by
decarboxylation. The transfer of a proton then allows the formation of an
intermediate aldimine (8). This aldimine is hydrolysed to an aldehyde and 2 –
amino intermediate (9) which can condense with another molecule of ninhydrin
to make Ruhemann’s purple (10) (Friedman and Williams, 1974).................. 28
Figure 2-1 HP parts sampled in this study. The turbine from TA-98 high speed
HPs (a), the spray channel from WA-56 Lt HP’s (b) and gears from S11 surgical
HP’s (c), sampled in this study .......................................................... 45
Figure 2-2 Podiatry instruments sampled in this study. Pear burs (top), Blacks’
files (middle) and Diamond deb files (bottom), sampled in this study. ........... 46

XI
Figure 3-1 BSA and salivary mucin standard curves detected by the OPA assay
diluted in RO H2O. A 2 mg/ml solution of BSA and salivary mucin were prepared
by dissolving 20 mg in 10 ml of RO H2O. A standard curve of protein
concentrations 1, 5,10,20,50,100 µg/ml of protein was prepared in RO H2O. A
blank control of RO H2O was also included in standard curves. The data shown is
the mean of 3 readings from 3 experiments ± StEM. A BSA concentration of 5
µg/ml resulted in significantly (p<0.05) larger values than the negative control
and a salivary mucin concentration of 20 µg/ml resulted in significantly (p<0.01)
larger values than the negative control. The r2 value of the slope was calculated
as 0.97 for the BSA standard curve and 0.8 for the salivary mucin standard curve.
............................................................................................... 72
Figure 3-2 BSA and salivary mucin standard curves detected by the BCA assay
diluted in RO H2O. A 2 mg/ml solution of BSA and salivary mucin were prepared
by dissolving 20 mg in 10 ml of RO H2O. A standard curve of protein
concentrations 1, 5, 10, 20, 50, 100 µg/ml of protein was prepared in RO H2O.
The data shown is the mean of 3 readings from 3 experiments ± the StEM. A BSA
concentration of 5 µg/ml resulted in significantly (p<0.001) larger OD570 than the
negative control and a salivary mucin concentration of 10 µg/ml resulted in
significantly (p<0.01) larger OD570 than the negative control. The r2 value of the
slope was calculated as 0.99 for the BSA standard curve and 0.86 for the salivary
mucin standard curve. .................................................................... 73
Figure 3-3 BSA and salivary mucin standard curves detected by the ninhydrin
assay diluted in RO H2O. A 2 mg/ml solution of BSA and salivary mucin were
prepared by dissolving 20 mg in 10 ml of RO H2O. A standard curve of protein
concentrations 1, 5, 10, 20, 50 and 100 µg/ml of protein was prepared in RO
H2O. The BSA standard curve is indicated with a black line and the salivary mucin
standard curve is indicated with a red line. The data shown is the average of 3
readings from 3 experiments ± the StEM. A BSA concentration of 10 µg/ml
resulted in significantly (p<0.01) larger OD570 than the negative control and a
salivary mucin concentration of 20 µg/ml resulted in significantly (p<0.001)
larger OD570 than the negative control. The r2 value was calculated as 0.98 for
the BSA standard curve and 0.97 for the salivary mucin standard curve. ........ 74
Figure 3-4 Linear range of the BCA assay when detecting BSA. BSA concentrations
of 50, 100, 250, 500, 1000, 1500, 2000, 2500 µg/ml were sampled. The data

XII
shown is the mean of 3 readings from 3 experiments ± the StEM. A linear
relationship (r2=0.92) was calculated up to 1000 µg/ml. ............................ 75
Figure 3-5 Linear range of the ninhydrin assay when detecting BSA. BSA
concentrations of 50, 100, 250, 500, 1000, 1500, 2000, 2500 µg/ml were
sampled. The data shown is the mean of 3 readings from 3 experiments ± the
StEM. A linear relationship (r2=0.96) was observed up to 500 µg/ml. ............. 76
Figure 3-6 Linear range of the OPA assay when detecting BSA. BSA
concentrations of 50, 100, 250, 500, 1000, 1500, 2000, 2500 µg/ml were
sampled. The data shown is the mean of 3 readings from 3 experiments ± the
StEM. A linear relationship (r2=0.97) was observed up to 2500 µg/ml. ............ 77
Figure 3-7 Residual protein isolated from all instruments after reprocessing by
both methods. Protein was desorbed from all instruments by immersion in 1%
(v/v) SDS and sampled using the OPA assay.. The distribution of data was
confirmed using a Kolmogorov Smirnov test, and data was compared using a
Mann-Whtiney U test with the significance determined using a 2-tailed Monte
Carlo estimation. Significantly less protein is recovered from instruments
reprocessed using the CDU method (***= p<0.001) compared to instruments
reprocessed using the LDU (Table 2.2). The mean of datasets is represented by a
horizontal line. ............................................................................ 84
Figure 3-8 Total residual protein recovered from individual Pear burs
reprocessed by both methods. Protein was desorbed from all instruments by
immersion in 1% (v/v) SDS and sampled using the OPA assay. The distribution of
data was confirmed using a Kolmogorov Smirnov test, and data was compared
using a Mann-Whtiney U test with the significance determined using a 2 tailed
Monte Carlo estimation. Significantly less protein is recovered from instruments
reprocessed using the CDU method (***= p<0.001) compared to instruments
reprocessed using the LDU (Table 2.2). The mean of datasets is represented by
a horizontal line. .......................................................................... 85
Figure 3-9 Total residual protein recovered from individual Blacks files
reprocessed by both methods. Protein was desorbed from all instruments by
immersion in 1% (v/v) SDS and sampled using the OPA assay. The distribution of
data was confirmed using a Kolmogorov Smirnov test, and data was compared
using a Mann-Whitney U test with the significance determined using a 2 tailed
Monte Carlo estimation. No significant difference was found on protein

XIII
recovered from instruments reprocessed using the CDU method and the LDU
(Table 2.2). The mean of datasets is represented by a horizontal line. ......... 86
Figure 3-10 Total residual protein recovered from individual Diamond deb files
reprocessed by both methods Protein was desorbed from all instruments by
immersion in 1% (v/v) SDS and sampled using the OPA assay. The distribution of
data was confirmed using a Kolmogorov Smirnov test, and data was compared
using a Mann-Whitney U test with the significance determined using a 2-tailed
Monte Carlo estimation. Significantly more protein was detected on instruments
reprocessed using the LDU process (***=p<0.001) than instruments reprocessed
using the CDU process (Table 2.2). The mean of datasets is represented by a
horizontal line. ............................................................................ 87
Figure 4-1 Relationship between S.epidermidis CFU/ml and OD. Cultures of S.
epidermidis were diluted to appropriate OD values, diluted and cultured to
determine the CFU/ml of each OD. An increase in OD results in an increase in
CFU/ml. ..................................................................................... 98
Figure 4-2 Relationship between P. aeruginosa CFU/ml and OD. Cultures of P.
aeruginosa were diluted to appropriate OD values, diluted and cultured to
determine the CFU/ml of each OD. An increase in OD results in an increase in
CFU/ml. ..................................................................................... 98
Figure 4-3 Number of bacteria isolated from each HP part. Internal HP parts
were sampled for bacteria before and after decontamination including
sterilization. Each part was cultured for aerobic and facultative anaerobic
isolates. Before decontamination, surgical HP gears contained the most bacteria
with a median of 1x10³ CFU compared to a median of 200 and 400 CFU for used
unprocessed turbines and spray channels respectively. After decontamination
(Table 2.2), no bacteria were isolated in turbines and surgical gears whilst a
median of 30 CFU of bacteria was isolated from decontaminated spray channels
which was a significant reduction (**p<0.01). The mean of datasets is
represented by a horizontal line. ...................................................... 104
Figure 4-4 Total number of isolates from high speed turbines. Bacteria were
identified using diagnostic microbiology. All isolates were from used,
unprocessed samples. The majority of bacteria isolated were CONS with a total
of 3.8x10⁴ isolates followed by Gram negative bacilli with a total of 7.5x10³
isolates and unidentified fungi with a total of 3.3x10³ isolates from all turbines
sampled. S. aureus, oral Streptococci and P. acnes were isolated in smaller

XIV
numbers with a total of 5x10² S. aureus, 2x10² oral Streptococci, and 3.8x10² P.
acnes. ...................................................................................... 105
Figure 4-5 Total number of isolates from low speed spray channels. Bacteria
were identified using diagnostic microbiology techniques. Isolates from used,
unprocessed handpieces are highlighted by gray bars and isolates from
decontaminated HP’s are represented by white coloured bars. Before
decontamination, the majority of bacteria isolated were CONS with a total of 3
x104 CFU and unidentified fungi with a total of 3.6x10³ CFU from all spray
channels. After decontamination (Table 2.2), CONS were reduced to 1x10² CFU
whilst no reduction in Gram negative bacilli or P. acnes was observed. ......... 106
Figure 4-6 Total number of isolates from surgical gears. Bacteria isolated were
identified using diagnostic microbiology techniques. All isolates were from used,
unprocessed HP’s. The majority of bacteria isolated were coagulase negative
staphylococci (CONS) with a total of 1.7x10⁵ CFU followed by unidentified fungi
with a total of 8.5x10⁴, Streptococci with a total of 4.3x10⁴ CFU and S. aureus
with a total of 1.2x10⁴ from all surgical gears sampled. Gram +ve bacilli and P.
acnes were isolated in smaller numbers with a total, 3.5x10³ Gram positive
bacilli and 6.3x10³ P. acnes. ............................................................ 107
Figure 4-7 Number of bacteria isolated from each repair facility HP part. Internal
HP parts were sampled for aerobic and facultative anaerobic isolates. The
turbine of high speed HPs, the spray channel of the low speed HP and the gear of
surgical HPs were sampled. Each part was cultured for aerobic and facultative
anaerobic isolates. A single surgical gear had the highest numbers of bacteria
with a value of 3x10⁴ CFU. The mean of datasets is represented by a horizontal
line. ........................................................................................ 110
Figure 4-8 Number of Isolates from TA-98 HP’s from repair facility. Bacteria
isolated from the high speed turbines were identified using diagnostic
microbiology techniques. The majority of bacteria isolated were CONS with a
total of 8.5x10⁵ CFU isolated and Gram positive bacilli with a total of 2x10⁴ CFU
from all turbines sampled. Gram negative bacilli and P. acnes were isolated in
smaller numbers with a total of 20 CFU for Gram -ve bacilli and 1x10³ P. acnes
isolated. ................................................................................... 111
Figure 4-9 Number of Isolates from TA-97 HP’s from repair facility. Bacteria
isolated from the high speed turbines were identified using diagnostic
microbiology techniques. The majority of bacteria isolated were coagulase

XV
negative staphylococci (CONS) with a total of 5.6x10⁴ CFU and Gram positive
bacilli with a total of 2x10⁴ CFU from all turbines sampled. Streptococcal spp.
and P. acnes were isolated in smaller numbers with a total of 1.2x10² CFU for
Streptococcal spp. and 1.6x10² P. acnes isolated. ................................. 112
Figure 4-10 Number of isolates from Topair HP’s from repair facility. Bacteria
isolated from the high speed turbines were identified using diagnostic
microbiology techniques. The majority of bacteria isolated were coagulase
negative staphylococci (CONS) with a total of 4.9x10⁴. P. acnes were isolated in
smaller numbers with a total of 2x10² CFU. .......................................... 113
Figure 4-11 16S PCR of used, unprocessed HP’s. Eluents from surgical HP’s before
(a) and after the GDH decontamination process (b) (Table 2-3 Details of GDH
CSSD decontamination process. were sampled for the presence of 16S DNA. A
single band representing the presence of 16S DNA is observed in the positive
control (lane 3) and each HP sample dilution (06372 lanes 4,5,6) (06374 lanes
7,8,9) (06508 lanes 10,11, 12). No bands are visible in the negative control (lane
2) or the HP negative control (lanes 13, 14, 15). Band sizes are indicated in bp
by the 100bp ladder (lane 1). .......................................................... 120
Figure 5-1 Recovery of BSA from SSS’s using different cleaning solutions and
methods. Samples from SSS’s inoculated with BSA and extracted using each
method were separated using 4-12% Bis-Tris gels. Gel (a) was stained with
Coomassie blue and gel (b) was stained using SYPRO® Ruby. BSA inoculated and
dried on SSS’s was recovered by boiling and sonication in 1% (v/v) SDS (a) Both
boiling (lanes 3, 4, 5) and sonication (lanes 7, 8, 9) in 1% (v/v) SDS recover BSA
fractions indicated by arrows from SSS’s. No protein was visible in the negative
control SSS eluents (lane 2 and lane 6). Lane 1 contains the protein size ladder
for comparison with the closest size to the fraction V BSA protein indicated in
kDa. BSA was also recovered by sonication in 1% (v/v) Decon®90 and 1% (v/v)
SDS (b) Both 1% (v/v) Decon®90 (lanes 3,4,5) and 1% (v/v) SDS (lanes 7, 8, 9)
recover BSA from the surface as shown by comparison to the positive control
(lane 1). No protein is visible in the negative control disc eluents (lanes 2 and 6).
.............................................................................................. 132
Figure 5-2 Precipitation of BSA by different methods. Samples of precipitated 50
µg/ml BSA solutions were separated using 4-12% Bis-Tris gels. Gel (a) and gel (b)
were stained using silver stain and gel (c) was stained using SYPRO® Ruby. BSA
was precipitated using TCA and acetone (a) BSA fraction V indicated by arrows

XVI
was recovered by acetone precipitation (lanes 4, 5, 6) and TCA precipitation
(lanes 8, 9. 10). No protein was observed in the negative controls (Lanes 2, 3, 7).
Lane 1 contains the protein ladder with sizes indicated in kDa for comparison.
BSA was also precipitated using Amicon® filtration (b) precipitated the BSA
solutions at varying concentrations (lanes 4,5,6). No protein was observed in the
negative controls (lane 3) An unprecipitated 50 µg/ ml BSA positive control was
included for comparison (lane 2) and lane 1 contains the protein ladder with
sizes indicated in kDa for size comparison. Both acetone and StrataClean™ Resin
precipitated BSA (c). Acetone (lanes 4, 5, 6) and StrataClean™ Resin (lanes 8, 9,
10) precipitated BSA though at varying concentrations. No protein was observed
in the negative controls (lanes 3 and 7). A 50 µg BSA positive control was
included for comparison (lane 2) and lane 1 contains the protein ladder with
sizes indicated in kDa for size comparison. .......................................... 134
Figure 5-3 Sensitivity of protein detection stains at detecting BSA. BSA of
decreasing concentrations were loaded into a 4-12 % Bis Tris gel and stained with
coomassie brilliant blue and sliver stain whilst decreasing concentrations of
salivary mucin samples were loaded into a 3-8% Tris Acetate gel was used to
determine the sensitivity of PAS staining. For coomassie blue staining (a),
protein was observed in the 100 µg/ml sample (lane 4), 10 µg/ml sample (lane
5), 1 µg/ml sample (lane 6). No protein was detected in the 0.1 µg/ml (lane 7),
0.01 µg/ml (lane 8), 0.001 µg/ml (lane 9), or the 0.0001 µg/ml (lane 10). No
protein was detected in the negative control (lane 2). Lane 1 contained the
protein ladder for size comparison and lane 3 contained a salivary amylase
positive control. For silver staining (b) protein is observed in the 100 µg/ml
sample (lane 4), 10 µg/ml sample (lane 5), 1 µg/ml sample (lane 6) the 0.1
µg/ml (lane 7), 0.01 µg/ml (lane 8), 0.001 µg/ml (lane 9), and the 0.0001 µg/ml
(lane 10). No protein was detected in the negative control (lane 2). Lane 1
contained the protein ladder for size comparison. For PAS staining (c), salivary
mucin was observed at concentrations of 1 mg/ml (lane 3), 100 µg/ml (lane 4),
10 µg/ml (lane 5). No protein was detected in the negative control (lane 2). The
protein ladder for size comparison was included in lane 1 with sizes indicated in
kDa .......................................................................................... 136
Figure 5-4 Effect of lubricating oil on protein observation by SDS – PAGE. BSA
solutions were diluted in 50% solution of lubricating oil and the eluents
separated in a 4-12 % Bis Tris gel was stained using SYPRO® Ruby. BSA is visible

XVII
in solutions of 1% (v/v) SDS (lanes 8-10) and lubricating oil (lanes 4-6) and the
positive control of a 100 µg BSA solution in ROH2O (lane 2). No protein is
observed in the negative controls (lanes 3,7). Lane 1 contained the protein
ladder for size comparison with sizes indicated in kDa. ............................ 137
Figure 5-5 Sensitivity of salivary amylase detection using antibody probing.
Decreasing concentrations of salivary amylase were added to a PVDF membrane
and probed with rabbit anti human IgG followed be secondary probing with goat
anti rabbit IgG antibodies conjugated with alkaline phosphatase. The membranes
were stained with BCIP/NBT solution. Protein was detected from the 0.1, 1, 10,
and 48 µg/ml solutions. No protein was detected on the 0.01 µg/ml solution and
the negative control of 50 µg/ml BSA. ................................................ 139
Figure 5-6 Sensitivity of Western blot. Decreasing concentrations of salivary
amylase, serum albumin and saliva samples were separated using SDS PAGE,
transferred to a PVDF membrane and probed using alkaline phosphatase
conjugated antibodies. Salivary amylase (a) indicated with arrows was detected
in the 40 µg/ml sample (lane 2), the 20 µg/ml sample (lane 3), the 1 µg/ml
sample (lane 4) and the 0.1 µg/ml sample (lane 5). No salivary amylase was
detected in the 0.01 µg/ml sample (lane 6), 0.001 µg/ml sample (lane 7), 0.0001
µg/ml (lane 8) and the negative control of 100 µg/ml BSA (lane 10). Lane 1
contained the protein ladder for size comparison. Serum albumin (b) indicated
with arrows was detected in the 100 µg/ml sample (lane 4), the 10 µg/ml sample
(lane 5), the 1µg/ml sample (lane 6) the 0.1 µg/ml sample (lane 7), and the 0.01
µg/ml sample (lane 8). No serum albumin was detected in the 0.001 µg /ml
sample (lane 9), 0.0001 µg/ml sample (lane 10) and the negative controls of 1%
(v/v) SDS (lane 2) and 40 µg/ml of salivary amylase, (lane 3). The salivary mucin
(c) antibody detected salivary mucin in a neat and a 1/10 dilution of
unprocessed saliva (Lanes 3, 4) and a neat solution of processed saliva (Lane 7).
No mucin was detected in the 1/100 dilution or 1/1000 dilution (Lanes 5, 6) or
the 1/10, 1/100, 1/1000 dilution of the prepared saliva (Lanes 8, 9, 10) or the
negative control (lane 2). ............................................................... 140
Figure 5-7 Detection of salivary amylase from saliva samples. Unstimulated saliva
samples were separated using SDS PAGE before transfer to a PVDF membrane
and probing with antibodies conjugated to alkaline phosphatase. Salivary
amylase indicated with arrows was detected in all neat saliva samples (lane 5, 7,
9), a dilute sample (lane 8), and the 40 µg/ml positive control (lane 4). No

XVIII
salivary amylase was detected in the 1% (v/v) SDS negative control (lane 2) and
the 100 µg/ml BSA control (lane 3). The protein ladder was present in lane 1
with sizes indicated in kDa for comparison. .......................................... 141
Figure 5-8 Protein content of used, unprocessed dental forceps. A sample of the
eluent from 4 used, unprocessed forceps was precipitated by StrataClean™ resin
and the protein content viewed by staining with coomassie blue (a) (lanes 4 – 7).
The proteins were compared to a protein ladder (lane 1) with sizes in kDa
indicated. Bands representing proteins of different sizes were found on 3 forceps
samples (Lanes 4-6) (c). A band of 66 kDa corresponding to 100 µg/ml BSA was
observed in the positive control (lane 2) and no bands were observed in the
negative control (lane 3). The samples were also stained with SYPRO® Ruby (b)
and bands were observed from each of the forceps samples (lane 4-7) and the
100 µg/ml BSA positive control (lane 3). No bands were observed in the negative
control (Lane 2). Lane 1 contains the protein ladder with sizes indicated in kDa.
.............................................................................................. 144
Figure 5-9 Protein contamination of decontaminated forceps. A sample of the
eluent from 6 decontaminated forceps was precipitated by Amicon filtration
and the protein content viewed by staining with silver stain (a). The proteins
were compared to a protein ladder (lane 1) with sizes in kDa indicated. Protein
bands were evident in two forceps samples (lanes 3 and 4). No protein is found
in an additional 3 samples (lanes 5, 6, 7). The 100 µg/ml BSA positive control
was in lane 2 and the protein ladder in lane 1 with sizes indicated in kDa for
comparison. A sample of the eluent from 6 decontaminated forceps was
precipitated by StrataClean™ resin and the protein content viewed by staining
with silver stain (b). The proteins were compared to a protein ladder (lane 1)
with sizes in kDa indicated. No protein was evident in the forceps samples (lanes
5, 6, 7, 8, 9, 10). No protein was found in the negative controls (lanes 3, 4).
Protein was observed in the 100 µg/ml BSA positive control (lane 2). The bands
from the decontaminated forceps samples were confirmed by peak analysis (c).
.............................................................................................. 145
Figure 5-10 Detection of serum albumin and salivary amylase in used,
unprocessed and decontaminated forceps samples. A total of 4 used,
unprocessed forceps samples and 3 decontaminated forceps samples were
sampled for serum albumin using probing with antibodies conjugated with
alkaline phosphatase. Serum albumin (a) was detected in 4 used, unprocessed

XIX
samples (lanes 4, 5, 6, and 7) and the 100 µg/ml BSA positive control (lane 2).
No serum albumin was detected in decontaminated samples (limit of detection
0.01 µg/ml) (lanes 8, 9, 10). No salivary amylase (b) was detected in 4 used,
unprocessed samples (lanes 4, 5, 6, and 7) or the decontaminated samples (lanes
8, 9, 10) (limit of detection 20 µg/ml). Salivary amylase was detected in the 40
µg/ml positive control (lane 3). ........................................................ 146
Figure 5-11 Quantitative protein analysis of dental HP parts. Internal HP parts
were sampled for protein before and after decontamination. The turbine of the
high speed HP, the spray channel of the low speed HP and the gear of the
surgical HP were sampled. Before decontamination, surgical HP gears contained
the most protein with a median of 350 µg. This was significantly (***=p<0.001)
reduced after decontamination to a median of <5 µg. A median of 1.3 µg of
protein was isolated from high speed turbines before decontamination and
reduced to a median of 0 µg after decontamination. For spray channels, a
median of 15.41 µg of protein was isolated before decontamination which was
significantly (p<0.05) reduced to 0 µg of protein after decontamination. ....... 151
Figure 5-12 Protein contamination of used, unprocessed HP’s. Eluents from used,
unprocessed turbines, low speed spray channels, and surgical gears were
precipitated together using an amicon filter and the gel stained with silver stain.
Protein was observed in the high speed turbine samples with 3 distinct bands
present (lane 5), (the low speed spray channel samples with 2 distinct bands
present (lane 7), and the surgical gears where 9 distinct bands were present
(lane 9) (a). No protein was observed in the negative controls (lane 3, 4, 6, 8).
Lane 2 consisted of the 100 µg/ml BSA positive control and lane 1 contained the
protein ladder with the sizes in kDa for comparison. The bands from the surgical
gears (b) and the turbines (c) were confirmed with peak analysis. .............. 152
Figure 5-13 PAS staining for mucopolysachharides in dental HP’s. Eluents from
used, unprocessed turbines, low speed spray channels, and surgical gears were
precipitated together using an amicon filter and the gel stained with PAS
reagent. Mucopolysaccharide was detected in the surgical HP gear (lane 9) and
the 100 µg/ml salivary mucin control (lane 2). No protein was detected in the
negative controls (lanes, 3,4,5,6) or the high speed HP turbines (lane 7) and the
low speed HP spray channels (lane 8). The Himark™ protein ladder was included
for size comparison (lane 1). ........................................................... 153

XX
Figure 5-14 Protein contamination of decontaminated dental HP’s. Eluents from
decontaminated turbines, low speed spray channels, and surgical gears were
precipitated together using an amicon filter. Protein was observed in the
surgical gears (lane 9) with 2 distinct bands visible (b). No protein bands were
observed in the high speed turbines (lane 5), spray channels (lane 7) and or the
negative controls (lane 3, 4, 6, 8). Lane 2 consisted of the BSA positive control
and lane 1 contained the protein ladder with the sizes in kDa for comparison. 154
Figure 5-15 Detection of salivary amylase in used, unprocessed HP samples. No
salivary amylase (limit of detection 20 µg/ml) was detected in the high speed
turbine samples (lane 8), the low speed spray channel samples (lane 9) and the
surgical gear samples (lane 10), or the negative controls (lanes 2, 4, 5, 6).
Salivary amylase was observed in the salivary amylase positive control (lane 3).
Lane 1 contains the protein ladder with sizes in kDa indicated for size
comparison. ............................................................................... 155
Figure 5-16 Detection of serum albumin in used, unprocessed handpiece
samples. Serum albumin was detected in the surgical gear samples (lane 9) and
the 100 µg/ml serum albumin positive control (lane 4). No serum albumin was
detected (sensitivity 0.01 µg/ml) in the negative controls (lanes 2, 3, 5, 6), the
high speed turbine samples (lane 7), or the low speed spray channel samples
(lane 8). Lane 1 contains the protein ladder for size comparison................. 156
Figure 5-17 Detection of salivary mucin in used, unprocessed handpiece samples.
Salivary mucin 5b was detected in the surgical gear samples (lane 9) and the
saliva controls (lanes 2, 3). No salivary mucin (limit of detection 1/10 dilution of
saliva) was detected in the negative controls (lanes 4, 6, 8), the high speed
turbine samples (lane 5), or the low speed spray channel samples (lane 7). Lane
1 contains the protein ladder for size comparison. ................................. 157
Figure 6-1 SEM images of a used, unprocessed high-speed turbine. The turbine
was imaged without prior fixation at 120x magnification (a) and 1000x (b). The
arrows indicate potential contaminants on the surface. ........................... 170
Figure 6-2 SEM imaging of TA-98 high speed turbine from a repair facility. The
biological material on the turbine surface was fixed and the turbine viewed at
15x magnification for an overview (a) and the blade was viewed at 1000x
magnification where contamination was observed on the surface (b).
Contamination was evident along the entire surface of the turbine blade at
3000x magnification (c). ................................................................ 171

XXI
Figure 6-3 Ball bearing cage of turbine from TA-98 high-speed turbine. The ball
bearing gear was visualised at 22x magnification after fixation of biological
material (a). Contamination was visible on the surface of the ball bearing gear at
1000x magnification (b). Contaminants were also viewed at 10000x magnification
(c). .......................................................................................... 172
Figure 6-4 SEM images of WA- 56 low speed gear from repair facility. The
biological material on the higher gear surface was fixed and the turbine viewed
at 22x magnification for an overview (a) and the blade was viewed at 1000 x
magnification where contamination was observed on the hollow parts of the gear
(b). Contamination was also evident along the entire surface of the turbine
blade at 3000x magnification (c). ...................................................... 173
Figure 6-5 High speed HP parts sampled using SEM and EDX analysis. Both high
speed turbines (a, b) and caps (c, d) were sampled using SEM and EDX analysis. A
microscopic view of the turbine is shown in (c) at 50x magnification and a
microscopic view of the cap is shown in (d) at 41x magnification. ............... 175
Figure 6-6 Surgical HP parts sampled using SEM and EDX analysis. Both surgical
HP gears (a, b) and the levers (c, d) were sampled using SEM and EDX analysis. A
microscopic view of the spring of the gear is shown in (c) at 44x magnification
and a microscopic view of the internal part of the lever is shown in (d) at 47x
magnification. ............................................................................ 176
Figure 6-7 Low speed HP parts sampled using SEM and EDX analysis. Both low
speed higher gears (a, b) and lower gears (c, d) were sampled using SEM and EDX
analysis. A microscopic view of the gear is shown in (c) at 50x magnification and
a microscopic view of the end of the lower gear is shown in (d) at 55x
magnification. ............................................................................ 177
Figure 6-8 Typical elemental analysis of HP surface contaminants by EDX
analysis. All contaminants were broadly placed into 4 categories, organic
contamination (a) indicated by the carbon and oxygen peaks, calcium based
contamination (b) indicated by a calcium peak, sulphur based contamination (c)
indicated by carbon, oxygen, and sulphur peaks and carbon based contamination
(d) indicated by a carbon peak. Each contaminant was found on all surfaces
scanned. ................................................................................... 178
Figure 6-9 Typical elemental analysis of HP metallic surfaces by EDX analysis.
Surfaces in the vicinity of contamination were analysed as controls. Metallic
elements including chromium (a) found on the lower gear, aluminium (b) found

XXII
on the high speed turbine, and iron (c) found on the surgical gear and high speed
caps. ........................................................................................ 179
Figure 6-10 Examples of contaminants found on used, unprocessed high speed
turbines. All contaminants previously described were found in the high speed
turbine ball bearing cage before decontamination. Organic contamination is
shown in (a) at 213x magnification, lubricating oil trapped contamination is
shown in (b) at 376 x contamination, a calcium contaminant shown in (c) at 1703
x magnification and sulphur based contamination is shown in (d) at 1700x
magnification. ............................................................................ 180
Figure 6-11 Examples of contaminants found on decontaminated high speed
turbines. All contaminants previously described were found in the high speed
turbine ball bearing cage before decontamination. Organic contamination is
shown in (a) at 1238x magnification, lubricating oil trapped contamination is
shown in (b) at 208 x contamination, a calcium contaminant shown in (c) at 676
x magnification and sulphur based contamination is shown in (d) at 162x
magnification. ............................................................................ 181
Figure 6-12 Examples of contaminants found on used, unprocessed high speed
caps. Organic contaminants previously described were found on the high speed
cap before decontamination. Organic contamination is shown in (a) at 812 x
magnification and in (b) at 1623 x magnification.................................... 182
Figure 6-13 Examples of contaminants found on decontaminated high speed
caps. Organic contaminants previously described were found on the high speed
cap before decontamination. Organic contamination is shown in (a) at 201 x
magnification and in (b) at 162 x magnification. .................................... 182
Figure 6-14 Examples of contaminants found on used, unprocessed surgical
gears. All contaminants previously described were found in the gear before
decontamination. Organic contamination is shown in (a) at 206 x magnification,
lubricating oil trapped contamination is shown in (b) at 790 x contamination, a
calcium contaminant shown in (c) at 817 x magnification and sulphur based
contamination is shown in (d) at 206 x magnification. ............................. 183
Figure 6-15 Examples of contaminants found on decontaminated surgical gears.
All contaminants previously described were found on the spring before
decontamination. Organic contamination is shown in (a) at 83 x magnification,
lubricating oil trapped contamination is shown in (b) at 1356 x contamination, a

XXIII
calcium contaminant shown in (c) at 175 x magnification and sulphur based
contamination is shown in (d) at 85 x magnification. ............................... 184
Figure 6-16 Examples of contaminants found on used, unprocessed surgical
levers. All contaminants previously described were found on the lever in contact
with the gear before decontamination. Organic contamination is shown in (a) at
181 x magnification, lubricating oil trapped contamination is shown in (b) at 726
x contamination, a calcium contaminant shown in (c) at 175 x magnification and
sulphur based contamination is shown in (d) at 359 x magnification. ............ 185
Figure 6-17 Examples of contaminants found on decontaminated surgical levers.
Contaminants previously described were found on the lever in contact with the
gear before decontamination. Organic contamination is shown in (a) at 400 x
magnification, sulphur based contamination is shown in (b) at 1600 x
magnification and lubricating oil trapped contamination is shown in (c) at 400x
magnification. No calcium based contamination was observed. .................. 186
Figure 6-18 Examples of contaminants found on used, unprocessed low speed
upper gears. All contaminants previously described were found in the high speed
turbine ball bearing gear before decontamination. Organic contamination is
shown in (a) at 1504 x magnification, lubricating oil trapped contamination is
shown in (b) at 376 x contamination, a calcium contaminant shown in (c) at 1504
x magnification and sulphur based contamination is shown in (d) at 188 x
magnification. ............................................................................ 187
Figure 6-19 Examples of contaminants found on used, unprocessed low speed
lower gears. All contaminants previously described were found in the low speed
lower gear before decontamination. Organic contamination is shown in (a) at 190
x magnification, lubricating oil trapped contamination is shown in (b) at 760 x
contamination, a calcium contaminant shown in (c) at 380 x magnification and
sulphur based contamination is shown in (d) at 380 x magnification. ............ 188
Figure 6-20 Examples of contaminants found on decontaminated low speed lower
gears. All contaminants previously described were found on the low speed lower
gear after decontamination. Organic contamination is shown in (a) at 44 x
magnification, lubricating oil trapped contamination is shown in (b) at 190 x
contamination, a calcium contaminant shown in (c) at 190 x magnification and
sulphur based contamination is shown in (d) at 380 x magnification. ............ 189
Figure 6-21 EFSCAN analysis of BSA standards on stainless steel discs. BSA of
differing concentrations was applied to 316 stainless steel disc and analysed.

XXIV
Each peak represents protein contamination on the surface. The data is
representative of 6 discs of each concentration. .................................... 191
Figure 6-22 Standard curve of BSA scanned using EFSCAN. BSA of differing
concentrations was added to 316 stainless steel discs and scanned. An increase
in BSA protein concentration results in a linear increase in fluorescence. Data
shown is the mean of 6 discs ± the StEM. ............................................. 192
Figure 6-23 EFSCAN analysis of low speed HP spray channel surfaces. Low speed
HP spray channels (a) that were unused were sampled using EFSCAN analysis (b).
Spray channels were also sampled after use and before decontamination (c) and
after decontamination (d). Peaks represent protein on the surface. No peaks are
visible in the new, unused sample. The graphs are representative of 3 spray
channel samples. ......................................................................... 194
Figure 6-24 EFSCAN analysis of high speed HP turbine surfaces. High speed HP
turbines (a) that were unused were sampled using EFSCAN analysis (b). Turbines
were also sampled after use before decontamination (c) and after
decontamination (d). Peaks represent protein on the surface. Significantly lower
peaks are visible in the new, unused sample. The graphs are representative of 3
turbine samples. .......................................................................... 195
Figure 6-25 EFSCAN analysis of high speed HP cap surfaces. High speed HP caps
(a) were sampled unused using EFSCAN analysis (b). Caps were also sampled
after use before decontamination (c) and after decontamination (d). Peaks
represent protein on the surface. Significantly smaller peaks are visible in the
new, unused sample (b). The graphs are representative of 3 cap samples. ..... 196
Figure 7-1 Effect of cleaning time on the removal of citrated blood from a
stainless steel surface. The effect of cleaning time on blood removal from a
stainless steel surface was assessed by measuring the protein desorbed using the
BCA assay. The agitation speed was kept constant at 25 20°C tilts/min and was
assessed at ambient room temperature (22°C). An increase in cleaning time
results in an increase in protein removal from the surface with significantly (* =
p<0.05) more blood removal observed between 5 to 10 min. The data shown is
the mean of results from, 3 discs from 3 experiments and the StEM. The control
shows the initial blood protein concentration applied to the stainless steel disc.
.............................................................................................. 210
Figure 7-2 Effect of water temperature on the removal of citrated blood from a
stainless steel surface The effect of ROH2O temperature on blood removal from

XXV
a stainless steel surface was assessed by measuring the protein desorbed using
the BCA assay. The agitation speed was kept constant at 25 tilts/min at 20°C
and samples were taken after 5 min. An increase in cleaning time results in an
increase in protein removal from the surface with significantly (* = p<0.05) more
blood removal observed between 5- 10 min. The data shown is the mean of
results from, 3 discs from 3 experiments and the StEM. The control shows the
initial blood protein concentration applied to the stainless steel disc ........... 213
Figure 7-3 Effect of agitation speed on the removal of citrated blood from a
stainless steel surface. The effect of agitation speed on blood removal from a
stainless steel surface was assessed by measuring the protein desorbed using the
BCA assay. Samples were taken after 5 min and assessed at ambient room
temperature (22°C) An increase in agitation speed results in an increase in
protein removal from the surface with significantly (* = p<0.05) more blood
removal observed when the speed is increased from 0 to 25 tilts/min and when
the speed is increased from 25 tilts/ min to 45 tilts/ min (***p<0.001). The data
shown is the mean of results from, 3 discs from 3 experiments and the StEM. The
control shows the initial blood protein concentration applied to the stainless
steel disc. .................................................................................. 216
Figure 7-4 Comparison of blood protein removal by cleaning solutions. The
efficacy of cleaning solutions at removing blood removal from SSS’s after 5 min
of cleaning was assessed by measuring the protein desorbed using the BCA assay.
All cleaning solutions were compared to blood removal by tap H2O which is
represented by the baseline of the graph. Samples were assessed at ambient
room temperature (22°C) and the agitation speed was set at 25 20°C tilts/min.
All cleaning solutions were compared to the blood protein removed by tap H2O.
No cleaning solutions removed significantly more blood than ROH2O alone though
HiBi® Scrub and W & H cleaning solution remove significantly (***= p<0.001) less
protein. Haemo-sol® detergent removed the most blood protein of the cleaning
solutions sampled. Tap H2O removed less protein than RO H2O though this was
not significant. The data shown is the mean of results from, 3 discs from 3
experiments and the StEM. ............................................................. 219
Figure 7-5 Effect of detergent manufacturers suggested temperature on the
percentage blood removal by detergents. The efficacy of detergents at blood
removal from stainless steel surfaces after 5 min cleaning at room temperature
(grey bars) and 50°C (white bars) with the agitation speed set to 25 20°C

XXVI
tilts/min was assessed by measuring the protein desorbed using the BCA assay.
Raising the solution and environmental temperature to 50 °C resulted in a
significant increase (*= p<0.05, ** = p<0.01) in ROH2O blood removal and
Rapidex® blood removal. Alconox® blood removal was increased but not
significantly. No difference was observed in the case of Haemo-sol® detergent.
The data shown is the mean of results from, 3 discs from 3 experiments and the
StEM. The control shows the initial blood protein concentration applied to the
stainless steel discs at each temperature. ........................................... 222
Figure 7-6 Effect of detergent manufacturers suggested temperature on the
percentage blood removal by detergents. The efficacy of detergents at blood
removal from stainless steel surfaces after 5 min cleaning at room temperature
(grey bars) and 38°C (white bars) with the agitation speed set to 25 20°C
tilts/min was assessed by measuring the protein desorbed using the BCA assay.
Raising the solution and environmental temperature to 38°C resulted in a
significant increase (*** = p<0.001) in Rapizyme® blood removal. ROH2O and
Endozime® blood removal was increased but not significantly. The data shown is
the mean of results from 3 discs from 3 experiments and the SEM. The control
shows the initial blood protein concentration applied to the stainless steel discs
at each temperature. .................................................................... 224
Figure 7-7 Total 72h P. acnes biofilm blank corrected biomass detected after
treatment with cleaning solutions. P. acnes isolates from dental HP’s were
grown for 72h anaerobically in a 96 well plate to form biofilms. The biofilms
were then exposed to cleaning solutions for 16 min and the biomass remaining
after 3 rinses with PBS was measured using 1% crystal violet staining. Biofilms
treated with Haemo-sol® have significantly (***= p<0.001) less biomass than RO
H2O alone. There was no significant difference between biofilms treated with
the PBS control and the W & H cleaning solution. Data shown is the spread of all
P. acnes isolates .......................................................................... 229
Figure 7-8 Total 72h S. epidermidis biofilm biomass detected after treatment
with cleaning solutions. S. epidermidis strain RP62A was grown for 72h
anaerobically in 96 well plates to form biofilms as a positive control for P. acnes
biofilm formation. The biofilms were then exposed to cleaning solutions for 16
min and the biomass remaining after 3 rinses with PBS was measured using 1%
crystal violet staining. Biofilms treated with Haemo-sol® detergent have
significantly (*= p<0.05) less biomass than when exposed to RO H2O alone. There
XXVII
was no significant difference between biofilm biomass treated with the PBS
control and the W & H cleaning alcohol. Data shown is the spread of all S.
epidermidis experiments. ............................................................... 230
Figure 7-9 Total 16h P.acnes biofilm biomass detected after treatment with
cleaning solutions P. acnes isolates from dental HPs were grown for 16h
aerobically in a 96 well plate to form biofilms. The biofilms were then exposed
to cleaning solutions for 16 min and the biomass remaining after 3 rinses with
PBS was measured using 1% crystal violet staining. Biofilms treated with
Alconox®, Haemo-sol® and Rapizyme® have significantly (***= p<0.001) less
biomass than exposure to ROH2O alone. There was no significant difference
between biofilms treated with the ROH2O control and the W & H cleaner. Data
shown is the spread of all P. acnes isolates. ......................................... 231
Figure 7-10 Total 16h S. epidermidis biofilm biomass detected after treatment
with cleaning solutions. S. epidermidis strain RP62A was grown for 16h
aerobically in 96 well plates to form biofilms as a positive control for P. acnes
biofilm formation. The biofilms were then exposed to cleaning solutions for 16
min and the biomass remaining after 3 rinses with PBS was measured using 1%
crystal violet staining. Biofilms treated with Haemo-sol® detergent have
significantly (*= p<0.05) less biomass than when exposed to RO H2O alone. There
was no significant difference between biofilms treated with the RO H2O control
and biofilms treated with Alconox®, Rapizyme® and the W & H cleaner. Data
shown is the spread of all S. epidermidis experiments. ............................ 232
Figure 7-11 Bacterial cell viability of 16h biofilms formed by P. acnes isolates
treated with cleaning solutions. Biofilms formed by P. acnes isolates from dental
handpieces were tested for bacterial cell viability after exposure to the cleaning
solutions and after 3 rinses with PBS by measuring alamarblue® reduction.
Biofilms treated with Alconox®, Haemo-sol® and W & H cleaner have
significantly (***= p<0.001) less viability than exposure to RO H2O alone.
Treatment with Rapizyme® also results in a significant (* = p<0.05) reduction in
cell viability. All detergents reduced cell viability to negative control levels.
Data shown is the spread of all P. acnes isolates. ................................... 233
Figure 7-12 Bacterial cell viability of 16h biofilms formed by S. epidermidis
RP62A treated with cleaning solutions. Biofilms formed by S. epidermidis were
tested for bacterial cell viability after exposure to the cleaning solutionsand
after 3 rinses with PBS by measuring alamarblue® reduction. Biofilms treated

XXVIII
with Alconox®, Haemo-sol®, Rapizyme® and W & H cleaner have significantly
(***= p<0.001) less viability than exposure to RO H2O alone. All detergents
reduced cell viability to negative control levels. Data shown is the spread of all
S. epidermidis experiments. ............................................................ 234

XXIX
Acknowledgements
This piece of work is dedicated to a number of people that have enhanced my
life and career.
I owe eternal gratitude to my supervisors Professor Andrew Smith and Dr Gordon
Ramage for their faith in giving me this great opportunity and for their constant
guideance in developing my scientific skills and completing this project. I feel I
have lifelong friends as well as supervisors.
I would like to thank Alexandra Pal, Dr Kay Schloe, Charles Meadows and Gavin
Knight of W & H for their support and for taking the time out to help with the
project and providing me with the tools I needed. I am also greatful for the
opportunity for the travel to Austria and getting to work in a completely new
culture and environment. I was looked after very well and always enjoyed my
visits.
I also acknowledge the contribution to my project and my life of my fellow PhD
students Anto Jose, Samuel Arion Curran, Jennifer Malcolm, Sanne Dolieslager,
John Paul Butcher and Leighann Sherry as well as numerous MRes students that
have made the lab and the McFarlane room a fun and educational place. I
couldn’t have asked for a better and more supportive lab group. I never cease to
be proud of us all sitting together and discussing a difficult journal club paper or
all taking time out to help someone with a lab problem. The nights out weren’t
bad either and it could sometimes be a second to none support structure.
I would also like to thank the level 9 academic staff including Dr Shauna
Culshaw, Dr Marcello Riggio, Dr David Lappin and Dr Chris Nile on level 9 who
were always on hand for nights out or for scientific advice.
I would like to thank the NHS and technical staff in the department for their
assistance during my project. They were sadly missed when they made the move
across the road.

XXX
I am very blessed with a number of great friends of which Christopher Jenkins,
Iain Dougan, Stewart McAulay, Daryl Strain, Alan Creevy, Ryan Marwaha and
Andy McNicoll all deserve a mention. They have all been very understanding with
the increased demands of a PhD student and I am grateful that I am always in
their thoughts for any nights out, fun times and even just to meet up for a chat.
Special thanks must go to my mum Carolyn Miller my stepdad John Miller and my
brother Stuart who have again been very understanding and nothing but loving
and supportive to my studies throughout my life. I would also like to thank my
mum for remembering who I am in those times I do manage to see her.
Equally special thanks should also go to my dad Dr Ken Smith, my stepmum Dr
Gillian Lees and my step sisters Stacie and Lauren who I am fortunate enough to
have not just as family members, but as scientific, legal and acountancy
advisors. Their constant love and support has been a great help throughout my
life and my career.
I finally must give a special mention to Miss Gi Yin Tang who has bared the brunt
of my work ethic and lack of a social life. I will always be indebted to her for
dragging me out for fun times even when my instinct was to have another night
of writing. I think I would have gone insane without her constant love, patience
and support. She is a reminder everyday of just how blessed I am in life.

XXXI
Author's declaration
I declare that, except where explicit reference is made to the contribution of
others, that this thesis is the result of my own work and has not been submitted
for any other degree at the University of Glasgow or any other institution.
Signature:..................................................
Printed name:.............................................

XXXII
Abbreviations
The following abbreviations are used throughout this thesis:
g mircrogram
m micrometer
M micromolar
ANOVA analysis of variance
ATCC American type culture collection
AWD automatic washer disinfector
BA blood agar
BCA bicinchoninic acid
BCIP 5-bromo-4-chloro-3-indolyl phosphate
BSA bovine serum albumin
CaCl2 calcium chloride
CDC centers for disease control
CDU central decontamination unit
CFU colony forming units
CJD Creutzfeldt- Jakob disease
CO2 carbon dioxide
CONS coagulase negative Staphylococci
CSSD central sterile service department
Cu Copper
DMSO dimethyl sulfoxide
DNA deoxyribose nucleic acid
ECM extracellular matrix
EDTA ethylenediaminetetraacetic acid
EDX energy dispersive x-ray analysis
EFSCAN epifluorescent scanning
ELISA enzyme-linked immunosorbent assay
EtOH ethylene oxide
FAA facultative anaerobic agar
FT – IR transform fourier infrared spectroscopy
FU fluorescent units
g gram
GDH Glasgow dental hospital

XXXIII
h hours
H2O water
HBV hepatitis B
HIV human immunodeficiency virus
HMDS bis(trimethylsilyl)amine
HSA human serum albumin
HP handpiece
kDa kilodaltons
LDU local decontamination unit
M molar
MES 2-(N-morpholino) ethanesulfonic acid
mg milligram
MH Mueller Hinton
MIC minimum inhibitory concentration
min minutes
ml millilitre
mm millimeter
mM millimolar
MRSA methicillin resistant Staphylococcus aureus
MS mass spectrometry
NaOH Sodium hydroxide
NBT nitro blue tetrazolium chloride
NCTC National Collection of Type Cultures
ng nanogram
nm nanometer
nM nanomolar
OD optical density
OPA o-phthaldialedhyde
PAGE polyacrylamide gel electrophoresis
PAS periodic acid Schiff
PBS phosphate buffered saline
PBST phosphate buffered saline/tween 20
PCR polymerase chain reaction
pg picogram
PrPC host prion protein
XXXIV
PrPSC abnormal prion protein
PT power tool
PVDF polyvinylidene fluoride
RC rich clostridium
RO reverse osmosis
RPM revolutions per minute
RPMI Roswell Park Memorial Institute
s seconds
SAB sabouraud
SDS sodium dodecyl sulphate
SEM scanning electron microscopy
SSD sterile services department
SSS stainless steel sections
StEM standard error of the mean
TCA tricholoracetic acid
ToF SIMS time of flight secondary ion mass spectrometry
UK United Kingdom
UV ultraviolet
YPD yeast peptone dextrose

Chapter 1
1 Chapter 1: Introduction

Chapter 1 2
1.1.1 Historical Perspective
Dentistry, the treatment of hard and soft tissues of the oral cavity, can trace its
origins to the Neolithic era where evidence of flint tools used for drilling of
carious teeth has been found (Bennike and Fredebo, 1985). A record of dentistry
is evident throughout recorded human history, including the ancient Mayan and
Egyptian civilizations. In Medieval Europe, dental barbers were the practitioners
of dentistry, and not until the 18th century, with the writings of Pierre Fauchard,
that dentistry became a specialised profession based on scientific principles to
allow the advancement of knowledge and technique (Ring, 1985). In the modern
era, dentistry is separated into eight specialities concerned with different
aspects of dental surgery and practice: Periodontology, Orthodontics, Oral
Surgery, Oral Pathology, Prosthodontics, Paedodontics, Dental Public Health,
and Endodontics.
1.1.2 Restorative dentistry
Restorative dentistry is concerned with the restoration of the damaged tooth
and encompasses a number of specialities. The best available methods for
restorative dentistry at the turn of the century involved devitalisation of the
tooth followed by the application of an ill fitting, unsightly silver amalgam or
gold foil (Ring, 1985). Advancements in restoration have centred on tighter
fitting implants that do not require an excess of cement to hold it in place; and
the introduction of crowns and composite filling materials that provide an
aesthetic, unnoticeable restoration of the tooth (Ring, 1985).
1.1.3 Introduction and history of dental handpiece development
An important tool that has aided the development of restorative dentistry is the
handpiece (HP). The HP is a small drill that is used for the removal of enamel or
carious tissue from the tooth to allow implantation. The HP provides high speed
rotary power through a turbine to a metal bur for tooth drilling. Developments
in the HP have allowed more intricate procedures to be performed with
increased patient comfort. The history of the development of dental HP’s has
been reviewed extensively (Dyson and Darvell, 1993a, Dyson and Darvell, 1993b)

Chapter 1 3
and the review highlights the rationale behind HP development and the many
developments that have led to the development of current models. The creation
of the modern HP was not a linear process and many developments occurred
simultaneously such as the introduction of the fluid driven and the foot driven
HP in the late 1860’s (Dyson and Darvell, 1993a). The focus for further
development of the HP was driven by the desire for easier control of the HP and
the need for faster rotational speeds to increase patient comfort by reducing the
time of operations and to take advantage of bur development (Dyson and
Darvell, 1993a). These speeds could not be achieved by fluid or manually and
the development of higher speed HP’s capable of speeds of 10,000 revolutions
per minute (RPM) occurred in 1911 (Dyson and Darvell, 1993a). The top
rotational speed of HP’s had increased to 100,000 RPM in 1956 and to 300,000
RPM in 1958 with the invention of the Borden Air Rotor, considered to be the
first modern high speed HP (Dyson and Darvell, 1993b). The high speeds of
modern HP’s create a significant level of friction on the bur and the tooth
surface potentially causing tooth and tissue damage. The development of cooling
systems based on the spray of water onto the surface occurred in 1956 (Dyson
and Darvell, 1993b). This system was inside the HP which also made control of
the HP easier for the dentist. In the modern era, HP’s can be subdivided by the
rotary speeds of the HP and therefore the functions of the HP.
With the development of HP’s, methods of sterilization have also been
developed. One of the earliest reviews into dental HP sterilization was
undertaken by Appleton. J in 1924, which described all methods that had been
published and used at the time (Table 1-1). This review is of interest due to the
number of methods highlighted that are suggested by authors in more recent
times (Silverstone and Hill, 1999, Kolstad, 1998).

Chapter 1 4
Table 1-1 Early methods of HP sterilization adapted from Appleton. J 1924.
Author and Year
Method
Witthaus
(1902)
Hot air at 200°C
Anderson
(1908)
Heating in mineral machine oil from 120 -150°C
Marshall
(1913)
Removal of sleeve and sterilization by boiling. The rest of the
instrument sterilized by placing in gasoline and storage in 95%
alcohol. Alternative of dried formaldehyde vapours.
Hasseltine
(1915)
Boiling water or 80°C in a water bath containing 0.25% NAOH.
Excess water removed by alcohol.
Brown (1917) Apply absolute alcohol with a cotton swab
Ash (1918) Wiping handpiece with alcohol and sterilizing in the
autoclave. Alternative of boiling in water with ―a little green
soap‖.
Schaefer
(1918)
Wipe before use with a cloth wet with alcohol or a dilute
phenol solution or boiled in a soap solution
Vallak (1918) Immerses in 10% Lysol for 15 min.
Gadge (1919) Boiled in 1% sodium bicarbonate then placed in a test tube
with 95% alcohol
Appleton
(1924)
Immerse completely in mineral oil at 185°C for 5 min. Wipe
off oil with sterile towel.

Chapter 1 5
1.1.4 Handpiece types
HP’s can broadly be divided into high speed, low speed and surgical HP’s. The
high speed HP revolves at speeds of 250,000 revolutions per minute (RPM) and is
used to cut hard materials such as tooth enamel, porcelain and metal fillings
(Kidd et al., 2003). The development of the high speed HP with a high rotational
speed was driven by the need to take advantage of developments in cutting burs
and to reduce discomfort during surgery that was caused by vibrations (Cherry et
al., 1974).
The modern air turbine HP can be fitted with a fibre optic light to aid visibility
and a water line that allows the passage of water to cool the tooth surface and
bur upon excessive heat generation (Christensen, 1999) (Figure 1-1). The high
speed HP has less torque than the low speed HP; a consequence of the higher
speed of rotation (Watson et al., 2000). It is for these reasons that low speed
HPs are used for some procedures in dentistry. Low speed HPs can be subdivided
into straight and contra angle depending on the area of access. Straight HP’s are
typically used for trimming temporary crowns and the contra angle HP is used
for the removal of dentine or carious dentine and the drilling of pin holes (Kidd
et al., 2003). Low speed HPs are capable of speeds approaching that of the high
speed HP. Surgical HPs are also designed to be straight or have a contra angle
for different operating areas and are less complicated to disassemble to assist in
cleaning and decontamination. Surgical HPs are used to undertake a variety of
procedures including wisdom tooth removal, bone modelling, apical resection
and neurosurgery. The use of any HP for cutting of the tooth surface results in
the generation of heat and the use of an internal spray channels allow the
passage of water from the dental unit water line and onto the bur and surface to
allow cooling of the surface.

Chapter 1 6
Figure 1-1 Simplified diagram of a high speed HP. The diagram displays the air
line that provides rotary power to the turbine and the water line that provides
water for cooling. The air drive circuit provides compressed air to drive the
turbine. The shank of the bur is inserted into the turbine and revolves with it.
1.1.5 Relationship between handpiece structure and
contamination
The workings of the HP, specifically the air derived rotary power and the spray
channels for the supply of cooling water, result in contamination of the dental
HP. Early studies showing internal contamination of the HP involved the visual
detection of purple dye in internal sections after the operation of HP’s in a
purple dye solution (Checchi et al., 1998, Lewis and Boe, 1992). These studies
highlighted the principal that contaminants are internalised during HP use. This
dye could also be released from the HP upon further use.
1.1.6 Internalisation of HP contaminants
A source of contamination of any HP that utilises air is internalisation of outside
contaminants. When a HP is deactivated, the deceleration of the turbine and
negative pressure causes the internalisation of any external contaminant (Figure
1-2)

Chapter 1 7
Figure 1-2 Internalisation of contaminants. Negative air pressure is created
when the HP turbine is stopped which causes the internalisation of contaminants
into the air and water circuits. Adapted from (Matsuyama et al., 1997)
Internalisation of contaminants results in contamination of the air line and the
internal components of the HP (Lewis and Boe, 1992). The contaminants
internalised are dependent on the environment and in the oral cavity may
include blood, bacteria, and human tissue. Several systems and devices are
common in HPs to prevent negative pressure and can result in a reduction, but
not full prevention, of internalised contaminants (Hu et al., 2007b) .
1.1.7 Dental unit waterline contamination
The dental unit which supplies air and water to the HP has its own water supply.
If this is not regularly maintained it can result in the growth of pathogenic
bacteria (Montebugnoli et al., 2004). These can take the form of planktonic cells
and as a biofilm on the tubing of the HP and the dental water line (Whitehouse
et al., 1991). The polysaccharide matrix of the biofilm protects the bacterial
cells from antibiotic agents. In a dental unit, these biofilms have been found to
contain Pseudomonas aeruginosa and Legionella pneumophila, which can result
in morbidity and mortality upon exposure.

Chapter 1 8
The contamination of the dental unit water line and the subsequent use of water
in the HP can also create an aerosol containing bacteria which may cause
infection of dentists and their assistants as well as the patients (Bennett et al.,
2000). Dental workers have been found to have antibodies against common
contaminants of the dental unit, showing external distribution of these
pathogens (Reinthaler et al., 1988).
The characterisation of contaminants of the HP, or the ―biofouling‖, defined by
the Biofouling journal as the protein, microbial and fungal contamination, has
been the subject of many studies. The focus of these studies has been on the
survival and transmission of bacteria and viruses.
1.1.8 Bacterial contamination of dental handpieces
Bacteria are detectable inside the HP structure with the contamination of air
driven low speed HPs containing prophy angle attachments being studied by Chin
et al. 2006. The aim of the study was to assess the survival and the movement of
Geobacillus stearothermophilus between the prophy angle to the HP, and the HP
to the prophy angle. The study confirmed the survival and movement of the
spores from the prophylaxis angle to the HP motor on 20% of samples and from
the motor to the phophylaxis angle on 40% of samples. The test spores are used
for autoclave testing and do not represent a clinical contaminant or a clinical
situation and for this reason the same group also assessed the presence of
bacteria in low speed HP’s and prophy angle attachments during HP use (Herd et
al., 2007). The authors found that, the low speed HP’s had a range of 0-6300
colony forming units (CFU)/ml and 75% of HP’s used on 20 patients were
contaminated. The swabbing method has been highlighted as inefficient by
previous studies (Lipscomb et al., 2006b) and recovery rates have been found to
be 19% (Angelotti et al., 1964). This may underestimate the contamination of
low speed HP’s in these studies.
Other studies into bacterial contamination of dental HP’s was conducted by
flushing decontaminated HP’s and flushing HP’s that had been used on patients
with sterile saline through the spray channel and head of the HP (Kellett and

Chapter 1 9
Holbrook, 1980). The authors isolated a range of 0-90 CFU/ml from
decontaminated HP’s and a range of 3.6 x10³ – 29 x103 CFU/ml before
decontamination. The organisms identified were similar to bacteria found in HP
sprays with Staphylococci, including S. aureus, Pseudomonas spp and Bacillus
spp all isolated. The flushing method employed in the study may not remove all
contaminants of the HP and validation of the method would determine how
much bacteria can be recovered by this method.
Bacterial contaminants of the HP can also originate from dental unit water line
where it can exit the HP in the form of an aerosol spray. These aerosols are
capable of spreading contaminants throughout the dental surgery. Attempts to
determine the contaminants in aerosols have focused on the bacterial
contaminants (Al Maghlouth et al., 2004, Rautemaa et al., 2006, Bennett et al.,
2000). The bacterial content of aerosols has been identified as oral Streptococci,
indicating contamination from the mouth, Staphylococci including S. aureus (Al
Maghlouth et al., 2004), and Gram-negative Pseudomonas species that indicate
contamination from the water line. Bennett et al. indicate an increased risk of
respiratory problems of dental staff exposed to bacteria in the dental HP spray.
Pathogenic bacteria including Legionella have been hypothesised to be
transmitted by this route due to the association with dental treatment and the
increase in Legionella antibodies in dental staff (Reinthaler et al., 1988).The
distance of aerosol spread was assessed by Rautemma and colleagues by placing
agar plates in different locations around dental surgeries. The study found
positive cultures of bacteria in all the areas up to 2 metres away from the
patient and more bacteria than is found in an empty room (Rautemaa et al.,
2006).
1.1.9 Viral contamination of dental handpieces
The survival of pathogenic viruses in the HP has been investigated by the use of
the detection of viral DNA (Hu et al., 2007b) and a bacteriophage model (Lewis
et al., 1992). One study showed the contamination of high speed HPs with
hepatitis B virus (HBV) (Hu et al., 2007b). The HP was operated on 40 HBV
positive patients that had been split into a gingivitis group and control group.
Different parts of the HP were sampled and viral contamination was determined

Chapter 1 10
by the polymerase chain reaction (PCR). Viral DNA was detected in all locations
sampled including the ports of the air and water line. HPs that were exposed to
HBV patients with gingivitis had more isolations of viral DNA and that the use of
an anti retraction valve had no effect on the presence of viral DNA. Human
Immunodeficiency Virus (HIV) DNA has also been recovered from HP’s after use
on HIV positive patients (Lewis and Boe, 1992). The presence of viral DNA may
not indicate the presence of viral particles, but indicates that HPs used on
infected patients can potentially result in the contamination of the HP with viral
particles. A bacteriophage model used in the Lewis and Boe 1992 study showed
that whole viral particles were able to survive upon internalisation inside the
HP.
1.1.10 Contamination of surgical power tools
The evolution of the dental HP has also resulted in the invention of other
surgical power tools (PT’s). Examples include surgical drills, ultrasonic dental
scalers, and HP’s that function using a laser. During routine use, these
instruments are also contaminated with biological material (Baggish et al., 1991,
Leslie et al., 2003, Sagi et al., 2002) depending on operating site. The
reprocessing of surgical PT’s after use is recommended by the Medical Device
Directive 2002 and manufacturers of each device are required to provide
validated reprocessing methods. Concerns have been raised over the
effectiveness of decontamination procedures due to the complexity of some
instruments and the balance struck between instrument maintenance and the
elimination of contamination (Silverstone and Hill, 1999). It is important to know
the location and nature of contamination in routinely used PT’s before
decontamination processes to understand the biological and chemical challenges
to these processes. Surgical PT’s can be broadly grouped into rotary, ultrasonic
and laser PT’s. The contaminants and the methods used to identify them may
also be applied to dental HP studies.
1.1.11 Contamination of rotary power tools
The presence of bacteria in the exhaust air of an orthopaedic drill was
highlighted by Sagi et al. 2002. The results showed the presence of skin

Chapter 1 11
organisms such as coagulase negative staphylococci (CONS) and S. aureus which
are associated with nosocomial infections of orthopaedic surgery (Sagi et al.,
2002). Bone dust contamination during temporal bone dissection has been shown
to contain neurological material which may indicate the potential for
contamination with prion protein that is resistant to sterilization (Scott et al.,
2001). This may occur during any neurosurgical procedure involving bone. After
decontamination, studies on athroscopic shavers have detected protein and DNA
contamination though this was not identified. An evaluation by Kobayashi et al.
using energy dispersive X-ray analysis (EDX), fourier transform infrared
spectroscopy and Auger microscopy revealed collagen and hydroxyl proteins
after decontamination by high pressure water flow, ultrasonic cleaning, and
sterilization using ethylene oxide (Kobayashi et al., 2009).
1.1.12 Contamination of ultrasonic power tools
Ultrasonic PT’s are utilised in a variety of specialties including dentistry (Schlee
et al., 2006), ophthalmology (Vargas et al., 2004), orthopaedics (Labanca et al.,
2008), and neurosurgery. Applications include the removal of calculus deposits
from teeth (Jotikasthira et al., 1992), the destruction of tumours the cutting of
bone and soft tissue (Schlee et al., 2006) and the treatment of cataracts in the
eye (Vargas et al., 2004).
The studies on the contamination of ultrasonic PTs have been concerned with
contamination causing phacoemulsification endophthalmitis in patients (Leslie et
al., 2003, Dinakaran and Kayarkar, 2002). This condition can lead to loss of sight
of the affected eye and has been attributed to the growth of bacteria
introduced through contaminated ocular solutions or PT’s (Eifrig et al., 2003,
Leslie et al., 2003). A study on the contamination of 32 ultrasonic PT’s found
bacteria, fungi, blood cells, proteinaceous material, and lens capsule fragments
from previous operations in 12 of 38 PT’s (Leslie et al., 2003). The contaminants
were also assessed using electron microscopy. All ultrasonic PT’s had been
decontaminated to‖ hospital standards‖ and an automated washing system did
not remove all contaminants. A further study on ophthalmic instrument
contamination found debris on 3 HP’s although the debris was only identified
visually. A study of tip contamination with lens protein found that common lens
Chapter 1 12
proteins were not detected after cleaning processes involving rinsing with
―irrigating solution‖ and flushing with demineralised water and 70% ethanol
followed by flushing with air from a high pressure pistol and sterilization by
autoclaving (Nuyts et al., 1999). Protein was detected by Coomassie blue
staining and Western blots for the common lens proteins αA- crystallin,
vimentin, and MP26 (Nuyts et al., 1999). The lack of protein found may be due
to the sensitivity of the coomassie blue technique and the specificity of Western
blot for detecting specific proteins. Use of a more sensitive protein gel stain
such as silver stain may result in the detection of protein. Cases of
endophthalmitis have also been linked to the presence of P. aeruginosa that was
present in the internal channels of a phacoemulsifier (Zaluski et al., 1999, Eifrig
et al., 2003).
1.1.13 Laser handpiece contamination
Laser HP’s are utilised in the field of dermatology, ophthalmology (Fine et al.,
2002), and neurosurgery for the destruction of skin and tissue (Garden et al.,
2002). Due to contact of the HP to the operating site during a procedure, whole
cells and cellular debris has been found adhering to laser HP’s after use (Wolf et
al., 1991) and have been associated with the contact transmission of herpes
simplex virus (Solomon et al., 2006). The formation of laser generated aerosols
has been shown to transmit papillomaviruses in studies with cows (Garden et al.,
2002) and would indicate the potential of transmission of human
papillomaviruses. HIV DNA has been found in the aerosol but showed no
infectivity when inoculated with human cells (Garden et al., 2002, Baggish et
al., 1991). Viable bacteria including CONS, Neisseria spp and Corynebacterium
have also been detected in aerosols in a pilot study (Capizzi et al., 1998).
1.2 Surface interaction of instrument contaminants
With knowledge of the contaminants of surgical HP’s and PT’s that must be
removed during the decontamination process, knowledge of the interactions of
these contaminants with an instrument surface may inform decontamination
processes that allow removal. The adsorption of protein to surfaces is dependent
on multiple factors.

Chapter 1 13
1.2.1 Protein adsorption onto surfaces
Protein adsorption to surfaces is a problem in many areas from the dairy industry
to surgical implants and medical instruments. It is possible for proteins to bind
to any surface and the binding is an irreversible process (Van Tassel et al.,
1998). Protein contamination of surfaces must therefore be removed through
the reversal of these interactions by the cleaning process. Understanding the
exact processes for protein adsorption onto surfaces can help develop the
rationale for cleaning processes and develop alternative methods for the
removal of protein contamination. The factors that have been determined to
have an effect on protein adsorption to a solid surface are the protein structure,
protein concentration, electrostatic interaction, pH of solution, hydrophobicity,
and temperature of solution.
1.2.2 The importance of protein structure
Proteins are composed of a series of 21 amino acids linked by peptide bonds of
which the arrangement is known as the primary structure (Creighton, 1993).
Each amino acid can be grouped by the side chain which can be positively or
negatively charged, polar neutral, or hydrophobic (Creighton, 1993). The
composition of amino acids and the interactions of the side chains determine the
secondary and tertiary protein structure and protein function. The secondary
structure describes the number and distribution of α helices, β sheets, and turns
that are stabilised by hydrogen bonding and the tertiary structure describes the
spatial relationship between all the amino acids including the formation of a
hydrophobic core and the overall shape of the protein (Creighton, 1993).
Proteins can be broadly placed into three categories, globular, fibrous, and
membrane (Creighton, 1993).
Protein structure defines the interaction of a particular protein with other
proteins, quaternary structure, and the interaction of proteins with surfaces.
Protein structure can also change depending on the environment, for example an
aqueous environment causes non-polar amino acid residues to reside in the
interior of the protein due to the hydrophobic nature and a change in pH will
cause a change in amino acid side chain charge and therefore change the
Chapter 1 14
interaction of the amino acid chains (Creighton, 1993). Acidic amino residues
have also been shown to have increased affinity to stainless steel and the
binding of peptides can mostly be attributed to these residues (Imamura et al.,
2003). Proteins can be roughly divided into ―hard‖ and ―soft‖ proteins depending
on the internal stability of the structure which is governed by hydrophobic
residues (Norde and Favier, 1995). Soft proteins are more likely to denature on a
surface than hard proteins (Kubiak-Ossowska and Mulheran). Protein molecules
may also undergo conformational changes that allow the most efficient flat
contact binding to the surface (Kubiak-Ossowska and Mulheran).
1.2.3 The importance of protein concentration
An increase in protein concentration results in an increase in the amount of
protein that adsorbs onto a surface (Roach et al., 2005). When the protein is
present at a higher concentration, the protein adsorbed at the surface is unable
to spread if another protein molecule is present in close proximity to the surface
(Roach et al., 2005). At higher concentrations, more protein molecules will be
present to adsorb to the surface and therefore will stop proteins spreading over
a surface area (Roach et al., 2005).
1.2.4 Effect of solution pH and temperature
Proteins are charged molecules with the net charge being determined by the
amino acid composition (Section 1.2-2). The protein net charge is also
dependent on the pH of the surrounding solution with the positively charged
hydrogen ions interacting with the amino acids as the pH decreases (Creighton,
1993). Altering the solution pH may reverse the interactions of the protein with
the surface by causing change in both protein and surface charges. It is known
that decreasing the pH below the isoelectric point of the metal oxide surface,
such as that found in medical instrumentation, results in a positively charged
surface which changes to neutral and finally a negative charge when the pH is
above the isoelectric point (Kittaka, 1974). Therefore, an alkaline solution will,
in most cases, result in a net charge of proteins and surfaces being negative
which act to repel the protein from the surface (Fukuzaki et al., 1995).

Chapter 1 15
Generally, an increase in temperature results in an increase in protein
adsorption (Desroches et al., 2007). This effect is dependent on an increased
rate of structural rearrangement of proteins. A heat denatured protein may have
an increased amount of amino acid residues exposed that increase the binding to
the surface (Arnebrant et al., 1986). This phenomenon is not observed for all
proteins with plasma albumin showing an increase in desorption of the protein
upon higher temperatures. For plasma albumin, an increase in temperature
resulting in an increase in adsorption is observed when the pH is increased above
the isoelectric point (Norde et al., 1986).
1.2.5 Adsorption of prion proteins to stainless steel surfaces
The only protein reported to cause disease is the prion protein that is the
causative agent of Creutzfeldt Jacob disease (CJD) (Will et al., 1996). The prion
protein is an abnormal form of the host prion protein (PrPC) into the abnormal
prion protein (PrPSC). This causes alteration in the secondary structure including
the conversion of an α helices prevalent structure to that of a β sheet structure
found in the abnormal form (Eghiaian et al., 2004). Fear of the contamination of
surgical instruments by prion proteins and the subsequent transmission of CJD
drives a lot of research into protein contamination of instruments (Bernoulli et
al., 1977). The prion protein is also resistant to steam sterilization and the
cleaning process is therefore important to remove this protein (Kast, 1976).
Knowledge of the interaction of the prion protein with surfaces may inform the
development of cleaning processes.
Prion protein is found to bind preferentially to nickel and molybdenum which are
both prevalent in 316L medical grade stainless steel (Luhr et al., 2009). This is
common with other proteins which have specific metal binding sites including
human serum albumin (HSA) which has a site between two domains rich in
aspartic acid and glutamic acid residues which allow for metal ion binding (Bal
et al., 1998, Clarke et al., 2007). The prion protein is known to also contain
metal binding sites which may allow it to behave similarly to serum albumin
(Jackson et al., 2001). An increased amount of PrPsc is found to adsorb to the
surface with an increased drying time and an increased resistance to detergent
removal (Secker et al.). This is common for other proteins as the removal of

Chapter 1 16
water results in hydrophobic core amino acids moving to the outside of the
protein which can increase the interaction with the surface.
Whilst the effect of prion protein structure and surface dryness is clear, there
has been no research examining the effects of electrostatic interaction, protein
concentration, temperature and pH on adsorption. These factors have all been
shown to have an effect on protein adsorption and research into these factors
may further inform the removal of prion proteins from instrument surfaces.
1.2.6 Adsorption of bacteria to a surface
The first event in any contamination of a biomaterial is through the adsorption
of protein to the surface (Sakiyama et al., 2004). Through this, bacteria can
adsorb to the proteins on the surface using specific binding factors (Tegoilia and
Cooper, 2002, Piroth et al., 2008) (Figure 1-3). Bacteria have been known to
initially adsorb to a surface and start producing extracellular material and form
what is known as a biofilm (Costerton et al., 1978). After initial adsorption,
bacteria can adsorb to the actual biofilm structure using specific receptors
(Heilmann et al., 1996) A biofilm is defined as a microbially derived sessile
community characterised by cells that are irreversibly attached to a substratum,
an interface or each other (Donlan and Costerton, 2002). These biofilms can
form on static surfaces or in a system of flowing water such as a dental unit
waterline or dental HP. Biofilms formed under a flow system are found to be
more rigid and harder to remove than static biofilms which has implications for
biofilm removal inside an HP spray channel which is exposed to a high flow rate
(Vrouwenvelder et al., 2010).
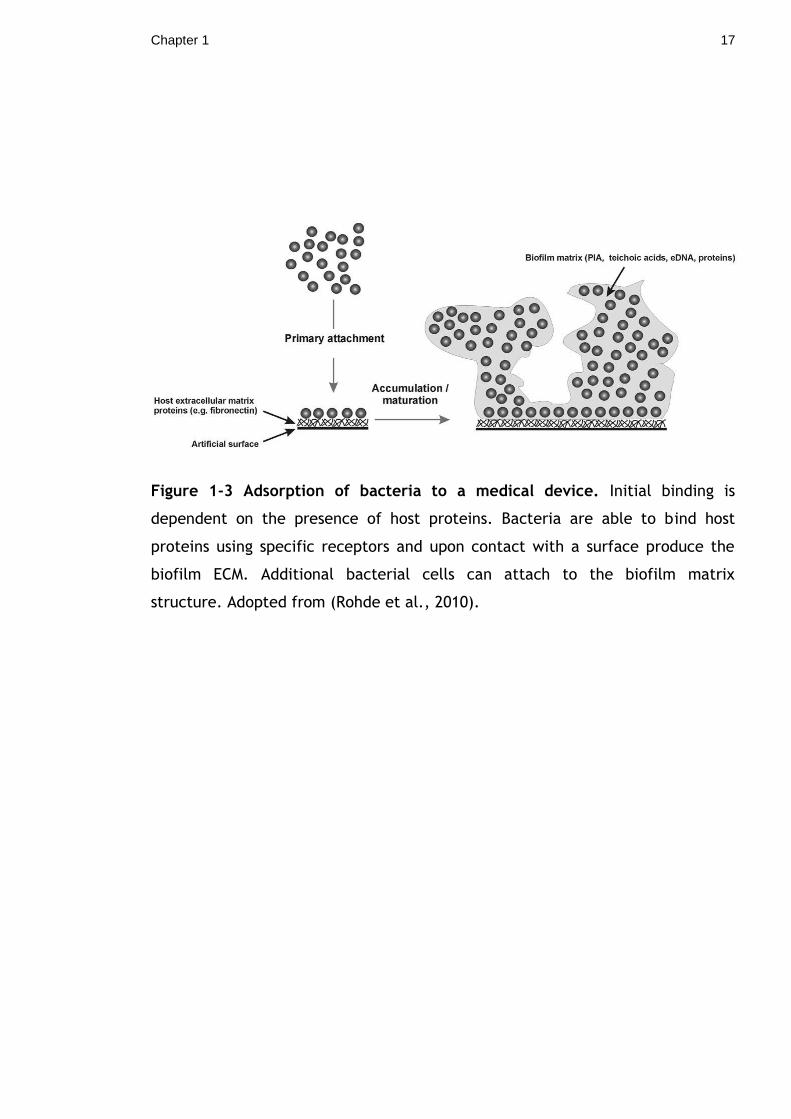
Chapter 1 17
Figure 1-3 Adsorption of bacteria to a medical device. Initial binding is
dependent on the presence of host proteins. Bacteria are able to bind host
proteins using specific receptors and upon contact with a surface produce the
biofilm ECM. Additional bacterial cells can attach to the biofilm matrix
structure. Adopted from (Rohde et al., 2010).

Chapter 1 18
Biofilm structure
Biofilms are composed of individual cells, extracellular matrix (ECM), and
extracellular spaces (Lawrence et al., 1991). The composition and amount of
exopolymeric material compared to individual cells is dependent on the species
of bacteria present in the biofilm including differences with Gram negative and
Gram positive bacteria (Bridier et al., Lawrence et al., 1991). Biofilms in nature
tend to be multispecies depending on what bacteria are present and can adsorb
to the structure (Marsh, 1994). Studies into the structure of S. epidermidis ECM
has shown it is composed of teichoic acids, various proteins and DNA (Heilmann
et al., 1996, Qin et al., 2007) whilst other bacteria such as Escherichia coli have
been shown to produce cellulose as the main constituent (Zogaj et al., 2001) and
polysaccharides are also a common constituent of ECM (Wozniak et al., 2003).
All structures have a dual role of providing structural support and adsorption of
bacterial cells to the matrix and the surface (Qin et al., 2007).The ECM also
contains extracellular channels that allow the passage of liquid and gas all
through the biofilm structure by the formation of channels (de Beer et al.,
1994). This allows the transport of nutrients to cells and transport of waste
products out of the biofilm allowing the survival of bacteria all through the
structure (Robinson et al., 1984).
1.3 Decontamination and maintenance of dental
handpieces
Invasive surgical instruments including the dental HP require decontamination
after use to remove and inactivate the contaminants (Lewis et al., 1992). The
decontamination of instruments requires several critical control points
highlighted by the instrument decontamination circle (Figure 1-4).

Chapter 1 19
Figure 1-4 Critical control points for instrument decontamination. Dental HP’s
and other instruments require cleaning, disinfection, inspection and
sterilization. Each critical control point is essential to the decontamination of
surgical instruments. Sourced from Sterile Services Provision Review Group first
report: The Glennie Framework.(NHS Scotland, 2001).

Chapter 1 20
In addition, HP’s require additional maintenance in the form of lubrication of
the internal parts (Hegna et al., 1978). Whilst not part of any decontamination
process, this ensures the continued working of the HP by reducing the friction
between gear movements. Lubrication is recommended before and after
decontamination by different manufacturers (Weightman and Lines, 2003) and is
undertaken in the Glasgow Dental Hospital (GDH) before sterilization (Section
2.1.3). The efficacy of the cleaning and sterilization of dental HP’s has been
studied in vitro using known contaminants and in vivo using routine sampling.
1.3.1 Handpiece lubricating oil
A contaminant which is part of routine HP maintenance is the lubricant oil. The
gears and the metallic parts of the HP require lubrication to prolong the life of
the HP and to reduce friction during HP use. Different manufacturers
recommend different lubrication procedures including before and after the
sterilization process. Lubricating oil can act as a contaminant in two ways; it has
been reported to protect contaminants from steam sterilization, and it can act
as a contaminant itself (Lewis and Arens, 1995, Pong et al., 2005).
Lubricating oil discharge from a HP has been investigated by Pong and colleagues
by visualising dyed red oil and comparing the weights of the HP before and after
discharge (Pong et al., 2005). The greatest level of oil discharge was found in
the first 5 minutes and a detectable amount of oil was being discharged after 40
minutes(Pong et al., 2005). The discharge of HP lubricant can have an adverse
affect on dental procedures and may, in some cases, be toxic to the patient
(Knight et al., 1999) . Further study of this area should focus on the discharge of
HP lubricant after a typical sterilization process. A coloured dye which levels
could be measured using a spectrophotometer would give quantifiable levels of
oil discharge. Weight can be a variable measurement depending on the time of
day that it is measured and may affect the results.
Chapter 1 21
1.3.2 Definition of terms
The definition of each critical control point is important to determine the
standards that must be attained for a product or process used in each
decontamination stage. Cleaning is defined by the EN –ISO-15883-1:2006
standard as ―removal of contamination from an item to the extent necessary for
its further processing and its intended subsequent use‖. For the validation of
routine instrument cleaning, visual analysis using magnification of the
instrument is employed after cleaning to ensure that no visible soil is present on
the surface (Lipscomb et al., 2008). For the validation of cleaning processes, the
EN–ISO-15883:2006 requires the prior soiling of instruments with various test
soils and no reaction with defined protein assays to class an instrument as
―clean‖. The disinfection of any instrument requires a reduction, but not
elimination, of microorganisms using cleaning solutions. A disinfectant solution
should cause a 5 log reduction of a starting culture of 1.5 – 5x10⁸ CFU/ ml P.
aeruginosa, S. aureus, or Enterococcus hirae and a log reduction in viral titres of
poliovirus or adenovirus upon 60 min contact time in a suspension test. Bacteria
are measured using culture techniques and remaining viral titres are determined
through the measurement of cell culture infectivity with remaining viral
particles. Sterilization is defined by the BS- EN- ISO 11737 – 1:2006 standard as a
process that results in a probability of less than 1 in a million of a single
―finished‖ product containing a viable organism. The validation of a sterilization
process relies on the inactivation of G. stearothemophilus spores due to the heat
resistant properties of the bacterium (Ren et al.).

Chapter 1 22
1.3.3 Factors influencing cleaning efficacy and the implications of
protein adsorption and biofilm formation on cleaning
efficacy
The efficacy of cleaning is determined by numerous factors detailed by the
Sinners circle (Figure 1-5). These parameters include the temperature of the
cleaning solution, the cleaning solution used, the amount of time that cleaning
occurs for, the amount of mechanical energy that is used for the cleaning
process and the water quality (Smulders et al., 2007). Altering a variable may
have a detrimental effect on cleaning or may allow comparative cleaning even
when other variables are changed.
Figure 1-5 Adaptation of the Sinners circle detailing the effects of 4 variables
on cleaning efficacy. Changing 1 variable can alter the need for other variables
to create an efficacious cleaning process. A recent addition to the Sinners circle
is the water quality. Adapted from (Smulders et al., 2007)

Chapter 1 23
An increase in cleaning time and mechanical work results in a total increase in
cleaning force applied to the surface. Therefore the cleaning efficacy will
increase as a result. Increasing the temperature of a solution results in an
increase in available energy and therefore may allow absorption energies to be
overcome, however an increase in temperature also results in denaturation of
proteins and may increase the rate of adsorption to the surface (Arnebrant et
al., 1986). Exposing prion protein adsorbed to stainless steel wires to distilled
water (H2O) at 90°C is found to remove less prion protein than distilled H2O at
the lower temperatures of 50- 60°C (Lemmer et al., 2004). Each cleaning
process must therefore involve a cleaning temperature that gives the ideal
combination of increased protein removal without causing greater adsorption.
At a basic level, reversing protein interactions from a surface by cleaning occurs
through dilution of the surface in a solution (Norde, 1986). If dilution with a
solvent alone does not result in protein removal, the cleaning process usually
incorporates various cleaning solutions or detergents of varying compositions
that have different pH and recommended working temperatures (Norde, 1986).
Detergents can roughly be divided into surfactants, alkaline detergents and
enzymatic detergents. Alkaline detergents can both denature proteins and
reverse the adsorption of proteins to surfaces by altering surface charge.
Enzymatic detergents rely on various protease enzymes to breakdown the
structures of contaminants. These enzymes have higher efficacy at a specific
temperature and pH due to possessing specific binding sites (Lawson et al.,
2007). Surfactants contain both a hydrophobic and hydrophilic parts that can
denature proteins and disassociating protein aggregates. The choice of cleaning
solutions is important as some have been found to fix proteinacious
contamination to a surface such as glutaraldehyde and alcohol have been shown
to fix proteinacious contamination such as blood to surfaces upon exposure
(Prior et al., 2004, Kampf et al., 2004, Nakata et al., 2007). Whilst these
cleaning solutions may be suitable for disinfecting bacteria, the solutions are not
suitable for removing protein contamination.
During use, multiple proteins will adsorb to any given instrument surface each
with different structures and compositions (Tsai et al., 2011). The most
abundant protein will be the first to bind to the surface due to the laws of mass

Chapter 1 24
transport but upon prolonged exposure these proteins may be superseded by
other proteins or may have interacted with other proteins to form a complex
(Desroches et al., 2007). It is therefore hard to predict the optimum cleaning
process that will remove every protein and even harder to predict a reaction
that would simultaneously disrupt the multiple reactions of the protein with the
surface. Using a detergent may also reverse adsorption by changing the surface
charges though may also denature the protein (Sakiyama et al., 2004), and in
combination with a higher temperature, encourage absorption to the surface
(Norde, 1986). Using an enzymatic detergent with a neutral pH may not result in
protein desorption though the action of the enzyme may overcome any
disadvantage associated with a neutral solution pH.
A study into the effect of different cleaning solutions has shown the effect of
different chemicals and processes on the desorption of prion protein from
stainless steel wires has highlighted the different modes of actions of cleaning
solutions (Lemmer et al., 2004). By detecting prion protein using Western blot, it
can be shown if a cleaning solution is removing the prion protein or denaturing
the protein. The alkaline solutions sodium hydroxide (NaOH) and sodium
hypochloride both denatured the protein and caused removal from the stainless
steel surface (Lemmer et al., 2004). This effect was found to be more
efficacious when at a concentration of 0.5M and temperature of 55°C is used
showing the importance of combining various factors to obtain the greatest
cleaning efficacy (Lemmer et al., 2004). A commercial alkaline cleaner also
resulted in protein denaturation and removal (Lemmer et al., 2004). Guanidine
thiocyanate, a protein denaturing agent (Suryaprakash and Prakash, 2000), was
found to have no significant effect on protein denaturing or removal from the
surface (Lemmer et al., 2004). A solution of 4M urea, used for protein
precipitateon, also resulted in detachment but not inactivation of the protein
(Lemmer et al., 2004). A sodium dodecyl sulphate (SDS) solution was found to
exhibit protein denaturation and removal from the surface (Lemmer et al.,
2004). A wide variety of cleaning solutions are therefore able to detach and
denature prion protein and other proteins through various modes of action and
the selection of detergents should be considered depending on their uses.
The formation of biofilms is associated with increased survivability of bacterial
cells (Coenye et al., 2007) and decreased susceptibility to antimicrobial agents

Chapter 1 25
due to the physical and chemical protection offered by the matrix (Campanac et
al., 2002). The presence of biofilms on medical instrumentation presents a cross
contamination issue due to the periodic shedding of bacterial cells and their
retention in any complete biofilm matrix. Biofilm resistance to detergents can
come from reaction of the cleaning agent with the structure or by the changes in
cellular metabolism associated with biofilm growth (Campanac et al., 2002).
Since proteins and biofilm can both be present on the surface, it is important to
design the cleaning solution and procedure to reverse protein adsorption and
disrupt biofilm structure.
1.3.4 Current instrument cleaning methods
Currently, the recommended cleaning processes for instrument, including dental
instruments, are using a manual wash or an automated process such as a sonic
bath or automatic washer disinfector (AWD). Manual cleaning has been called
―the least effective method‖ by the British dental journal A12 advice sheet and
Automatic cleaning processes are preferred due to their reproducibility and the
ability to be validated to ensure the process is being followed consistently
(Smith et al., 2009). For automated processes, the ultrasonic cleaner causes
desorption of contaminants through the use of ultrasound waves passing through
a liquid, which creates partial vacuum bubbles that collapse at high temperature
and pressure. Since the bubbles are small in size, this only results in the removal
of contamination. An ultrasonic cleaner is not suitable for dental HP’s due to
damage to the ball bearing gears. The AWD creates a high pressured jet of water
and cleaning solution of varying temperatures and times (Table 1-2). The
combination of high temperatures, high cleaning forces and the incorporation of
a cleaning solution combine to clean the surface of instruments. Some AWD’s
also feature specialised attachments to ensure the internal cleaning of dental
HP’s or other instruments with narrow lumens (Walker et al., 2010).
Recent studies have shown that the AWD does not always result in the most
efficacious cleaning process for all instruments when using protein
contamination as a measurement (Vassey et al., 2011). The validation of
cleaning processes is now considered.

Chapter 1 26
Table 1-2 Details of washer disinfector cleaning stages
Manufacturer Cleaning stages
Belimed Automated
Washer Disinfector with
Dr Weigert Neodisher
Mediclean Fort detergent.
Pre wash
7 min – 25.7 °C
Wash
15 min 51 sec – 57.7°C
1st Rinse/ 2nd Rinse
1 min 59 sec – 57.9 °C / 2
min – 58.2 °C
Thermal Rinse
6 min 27 sec 93.2 °C
Drying
22 min 9 sec 90.9 °C

Chapter 1 27
1.3.5 Validation of cleaning processes
Whilst the standard requirement of cleaning is the non detection of protein using
semi quantitative protein assays, more sensitive protein detection methods have
recently been described in the literature (Lipscomb et al., 2006b, Baxter et al.,
2009). This has raised the issue as to how efficacious a protein assay has to be to
declare that an instrument is clean (Lipscomb et al., 2006a). A total of 3 broad
methods can be utilised for the inspection of instruments and the validation of
cleaning, indirect, direct, and analytical methods.
1.3.6 Indirect methods
Indirect methods do not take a direct measurement of contamination of the
surface and include gravimetric measurements, the weighing of surfaces before
and after the cleaning process; ultraviolet (UV) spectroscopy that measures
contaminants with an absorption spectra in the UV range and the use of an
optical particle counter that can measure the size and number of particles in a
solution that has been used to extract contamination from a surface. Other
indirect methods involve detection of proteins by chemical reaction.
1.3.7 Semi- quantitative protein assays
The BS-EN-ISO-15883 standard recommends 3 semi - quantitative protein assays
for the validation of reprocessing of endoscopes; the ninhydrin assay, the biuret
assay, and the o – phthaldialdehyde (OPA) assay. Each of these assays reacts
with a different part of the protein structure to elicit a colour change and a
positive reaction with one of the assays indicates a failure in the process.
1.3.8 Ninhydrin assay
The ninhydrin assay involves the reaction of a ninhydrin molecule with α amino
acids in the protein structure to form Ruhemmans purple (Figure 1-6) (Meyer,
1957). Ruhemanns purple can be observed visually or by measuring by
spectrophotometry at an OD of 570nm (Lipscomb et al., 2006b).

Chapter 1 28
Figure 1-6 Reaction of ninhydrin molecules with amino acids forms
Ruhemanns purple. Ninhydrin exists in equilibrium in a keto (1) and hydrated
form (2). The Schiffs base of a reacting amine causes condensation of the central
carbonyl in the keto form. The Schiffs base then forms a dipolar speies (6) and
(7) by decarboxylation. The transfer of a proton then allows the formation of an
intermediate aldimine (8). This aldimine is hydrolysed to an aldehyde and 2 –
amino intermediate (9) which can condense with another molecule of ninhydrin
to make Ruhemann’s purple (10) (Friedman and Williams, 1974).

Chapter 1 29
The sensitivity of ninhydrin for protein detection has shown to be 9.25 µg
(Lipscomb et al., 2006a) and 5 µg when analysed in solution (Baxter et al.,
2006). A ninhydin method has been utilised in a study of decontaminated
instrument protein contamination which detected a range 0 – 1173 µg of protein
from different instruments used for different procedures after the
decontamination process (Baxter et al., 2006).
1.3.9 Biuret and bicinchoninic acid assay
The biuret assay involves the reduction of copper sulphate (Cu (II)) by the
protein peptide backbone in an alkaline solution to Cu (I) to form a purple
compound that, as with Ruhemmans purple, can be visualised or measured by
spectrophotometry. Bicinchoninic acid (BCA) can be added to the reaction to
chelate with Cu (I) and increase the sensitivity of the reaction of a Cu (I) – BCA
violet coloured complex and an increase in sensitivity of detection (Smith et al.,
1985). The biuret and the BCA reaction can be sensitive to reducing agents
(Milton and Mullen, 1992), copper chelators (Walker, 1994), and hydrogen
peroxide (Baker, 1991).
1.3.10 O-phthaldialdehyde assay
The OPA assay is based on the reaction of OPA detergent in the presence of an
alkaline solution and thiol compound such as mercaptoethanol with amines of
the protein or amino acid (Roth, 1971). The product formed can be detected by
absorbance or fluorescence at an excitation wavelength of 338 nm and emission
wavelength of 455 nm (Zhu et al., 2009). The OPA assay is not sensitive to
detergents or the reducing agents and metal chelators that interfere with the
BCA assay which makes it suitable for detecting protein from locations where
other assays are not suitable. The OPA assay has previously been used for
surgical instrument contamination studies (Smith et al., 2005).

Chapter 1 30
1.3.11 Direct methods
The suitability of Ninhydrin and Biuret tests for the detection of contamination
has come under criticism due to the lack of sensitivity (Lipscomb et al., 2006a).
At the aforementioned sensitivities, neither assay would detect an infectious
dose of prion protein (Lipscomb et al., 2006a). The swabbing technique has also
been shown to have varying efficacies at removing contamination from a surface
with as low as 19 % recovery (Angelotti et al., 1964). For these reasons, direct
methods of detecting surface contamination have been proposed to increase
sensitivity and to overcome the problems with sample extraction. These would
allow a direct measurement of contamination on a surface rather than a small
sample or extraction.
1.3.12 Direct visualisation of contamination by behaviour of water
The properties of water on flat surfaces can be used to detect hydrophobic films
of contamination. Water will flow over flat surfaces free of these contaminating
films and will gather around any hydrophobic films. This technique is not
suitable for rough or ridged surfaces. The contact angle of a water droplet
resting on a solid surface is influence by surface contamination. A water droplet
will have a low contact angle between the droplet and surface if the surface is
free of organic films, coatings and contaminants and a high contact angle of 90°
when these contaminants are present (Smulders et al., 2007).
1.3.13 Direct visual examination
The method utilised in Sterile Service Departments (SSD’s) for inspection of
instrument cleanliness is a magnified visual examination of the instrument which
does not detect low levels of contamination or colourless contamination
(Lipscomb et al., 2006b). The use of black light will detect any contaminants on
a surface that fluoresce in the presence of ultraviolet light which can detect 1
mg/cm2 of fluorescent contaminants.
Chapter 1 31
1.3.14 SYPRO® Ruby staining and visualisation
SYPRO® Ruby stain is composed of an organic compound bound to ruthenium as
a fluorophore. The stain interacts with the amino acids lysine, arginine, and
histidine (Lopez et al., 2000) which can limit binding and detection of certain
proteins. The bound complex is detected using epifluorescence microscopy and
has a reported sensitivity of 85 pg/mm2 of protein (Lipscomb et al., 2006b)
though this is based on operator observations. This method has been used to
validate washer disinfector removal steps of prion protein (Howlin et al.) and to
detect protein contamination on instruments that had been through a washer
disinfector cleaning process (Lipscomb et al., 2008). The use of SYPRO® Ruby in
this study highlighted the inadequacy of visual analysis at detecting low
concentrations of proteinacious material.
1.3.15 Analytical methods
Direct and indirect methods do not identify any of the contaminants of a
surface. For the identification of surface contaminants to the atomic level, a
number of analytical methods are employed (Table 1-3). These methods have
been used previously to study surgical instrument contamination, examining
contamination in the dairy industry, and for tracing contaminants in the
electronics industry. All methods described are capable of detecting atoms at
varying surface depths. Examples of analytical methods are now considered.

Chapter 1 32
Table 1-3 Examples of analytical methods used for cleaning validation. Taken
from Handbook for Cleaning/Decontamination of Surfaces adapted from
Smulders et al. 2007
Technique Analysis
Depth
Chemical
information
Detection
limit and
resolution
References
X-Ray
Photoelectron
Spectroscopy/
Electron
Spectroscopy
2-10 nm Elemental,
functional
groups,
oxidation state
0.1 atom %
3 µm
(Mouhyi et
al., 1998)
Time of flight
mass
spectrometry
1-2 nm Elemental,
molecular,
functional
groups,
isotopical
Parts per
million/ parts
per billion
100 nm
(Boyd et
al., 2001)
Auger Electron
Spectroscopy
2-10 nm Elemental
(oxidation
state)
0.1% atom
10 nm
(Kobayashi
et al.,
2009)
Fourier
transform
Infrared
Spectroscopy
0.5- 5 µm Molecular,
functional
groups
1 % atom
0.5 µm
(Kobayashi
et al.,
2009)
Energy
dispersive X ray
analysis used
with scanning
electron
microscopy
0.5 – 5 µm Elemental 0.1-0.5 wt%
0.5 µm
(Baxter et
al., 2006)

Chapter 1 33
1.3.16 Scanning Electron Microscopy, Energy Dispersive X- Ray
Analysis and Auger Spectroscopy
Scanning electron microscopy (SEM) produces detailed images of a surface
structure and contaminants. Electrons are fired at the surface structure from a
filament through a vacuum and electromagnetic lenses are used to focus the
electron beam to a diameter of 100 Ä. Primary and secondary electrons
scattered from a surface are collected by an electron collector and processed by
a photomultiplier and videoamplifier. The current reaching the electron
collector is dependent on the number of electrons that is emitted from a point
in the sample. This attribute allows the generation of a light and dark image
that correlates with the topography of the sample. For the identification of any
contaminants viewed on a surface, SEM can be combined with EDX analysis to
detect elements down to beryllium. Emitted electrons from the microscope
cause ionisation of sample atoms and the ejection of an electron from the inner
shell, when an outer shell electron fills the gap the excess energy is emitted as
an X- ray photon and this energy can be used to characterise the atoms present.
SEM and EDX analysis has been utilised in a study of decontaminated instrument
contamination (Baxter et al., 2006). SEM images of reprocessed surgical
instruments of varying surface complexity revealed visible contamination with
EDX carbon, nitrogen, oxygen, and sulphur that indicated the presence of
protein on the instruments.
A similar method for detecting surface contamination is Auger Spectroscopy.
This method also relies on an electron beam ejecting electrons from the surface
contaminants inner shells. An outer shell electron fills the inner shell and causes
the release of an Auger electron that can be used to identify the surface
contaminants. This method has been used to detect contaminants on
arthroscopic shavers after decontamination (Kobayashi et al., 2009).

Chapter 1 34
1.3.17 X-ray photoelectron spectroscopy
X-ray photoelectron spectroscopy (XPS) provides quantitative chemical
information of a surface by identifying the chemical composition and the
chemical states of elements. The surface is exposed to a controlled dose of X-ray
energy to release photoelectrons that can be used to identify elements. If any
element is bonded to another on the surface, the peak is altered to allow a more
complete chemical analysis. This technique has been used to measure the
cleanability of stainless steel contaminated with starch using spray cleaning and
mechanical cleaning (Boyd et al., 2001).
1.3.18 Time of flight secondary ion mass spectrometry
Time of flight mass spectrometry (ToF – SIMS) can detect contamination to the
atomic level to the order of parts per million. The ToF- SIMS technique involves
the pulsing of a primary ion gallium, gold, or a bismuth ion, onto a sample
surface in an ultrahigh vacuum. The collision of the primary ions with the
surface results in the emission of molecules and atoms from the sample. The
emitted molecules are analysed using Mass Spectrometry. ToF – SIMS analysis is
best utilised with a negative control surface to put the surface analysis into
context. The ToF SIMS technique has been used to examine the cleanability of
stainless steel surfaces in the dairy industry (Boyd et al., 2001).
1.3.19 Fourier transform infrared spectroscopy and Ramen
spectroscopy
Fourier transform infrared spectroscopy (FT –IR) and ramen spectroscopy identify
chemical components, molecules and functional groups on a surface by
measuring molecular vibrations. FT IR spectroscopy is based on the absorbance
of infrared light by the sample and comparison to the absorbance profile of
known molecules. Ramen spectroscopy is also based on the reaction of
molecules with infrared light but involves measuring the scattering of the light
by the molecule and the measurement of the scattering. FT-IR is known to be
more sensitive to polar bonds and Ramen spectroscopy for nonpolar bonds.

Chapter 1 35
These methods have previously been used to detect contamination of
membranes in the dairy industry (Daufin et al., 1991).
1.3.20 Implications of cleaning validation on defining cleanability
Each cleaning validation process has differing sensitivities of protein or
contamination that can be detected (Table 1-3). The European standard EN-ISO-
15883 defines clean as a negative reaction with 1 of 3 protein assays (Table 1-4)
implying that any protein contamination of a lower concentration is acceptable.
Further work by Lipscomb et al. (2006) indicated that the minimum sensitivities
of the Ninhydrin assay and the BCA assay are 9.25 µg/10mm2 and 6.7 µg/10mm2
respectively and protein contamination below this concentration would be
acceptable. In the scientific literature, a supplement published in Zentral
sterilization in 2008 for dental HP’s suggests a minimum protein concentration of
200 µg/instrument which is also recommended by Murdoch et al. (2006) for
surgical instruments as a level of acceptable cleanliness.To further put protein
contamination into context, Lipscomb et al. (2006) state that the concentrations
of 9.25 µg/ml of protein could be equivalent to 1014 prion infectious units and a
concentration 1 µg of protein is equivalent to 1014 protein molecules (Baxter et
al., 2006, Lipscomb et al., 2006a). Both processes require the desorption of
protein from the surface before sampling, which is subject to many variables
depending on the sensitivity of the extraction method, which may result in
protein contamination being left on the surface (Lipscomb et al., 2006a). Due to
these concerns, more sensitive methods have been developed for cleaning
validation that involve direct sampling of the surface (Lipscomb et al., 2006b,
Baxter et al., 2009). Both techniques can detect lower concentrations than the
BS-EN-ISO -15883 standard (Table 1-4) and if these techniques were adopted as
cleaning standards then an instrument protein concentration of over 85 pg/mm2
or 0.5 µg/mm2 would be deemed unclean and would require further
reprocessing or disposal. Determining a definintion of ―clean‖ that is achievable
with current cleaning methods and be of a level to eliminate cross
contamination risks is an important task for decontamination science.

Chapter 1 36
Table 1-4 Cleaning validation standards described by standards and scientific
literature
Study or Standard Minimum definition of clean
BS-EN-ISO -15883 part 1
2 mg/m2 protein detected by ninhydrin
assay
30-50 µg/ml protein detected by BCA
assay
0.003 µmol sensitive amino acids
detected by OPA assay
Zentralsterilisation Supplement
published Oct 2008
200 µg/dental HP
Lipscomb et al. 2006
9.25 µg /10mm2 Ninhydrin
6.7 µg/10mm2 Biuret test
Murdoch et al. 2006 200 µg/instrument
Baxter et al. 2009
0.5 µg/mm2
Lipscomb et al. 85 pg/mm2

Chapter 1 37
1.3.21 Cleaning and disinfection of dental handpieces
A recent survey of dental HP cleaning in UK practices has found that the
majority of practices wiped the external part of the HP with a cloth impregnated
with disinfectant with no internal cleaning taking place (Smith et al., 2009).
Internal cleaning of the HP has been validated by a study of forced air purging of
the internal components of HP’s which resulted in an increase in efficacy of
ethylene oxide sterilization of B. subtilis spores and S. mutans bacteria (Pratt et
al., 1999). No bacteria were isolated from HP’s that had been purged when
compared to HP’s that were flushed with air and water from the dental unit
alone. The study also showed that no bacteria were isolated after steam
sterilization no matter what cleaning technique was employed. A herpes simplex
model study was used to determine the survivability of viral particles upon
disinfection (Epstein et al., 1995). The presence of viral particles was
determined by examining the death of human fibroblasts upon exposure to
samples from the HP. The study showed the retention of viruses in the HP after
no disinfection, and external disinfection but internal disinfection of the lumens
with glutaraldehyde resulted in no viral retention. Whilst glutaraldehyde is no
longer appropriate for HP disinfection due to toxicity (Sagripanti and Bonifacino,
2000), this study showed the retention and expulsion of viral particles by HP’s
and highlighted the importance of internal disinfection in preventing cross
infection. The herpes simplex model utilises an oral isolate which is an
occupational dental hazard and is in the same category of germicidal resistance
in the Spaulding system as HIV (Epstein et al., 1995) and is therefore not
appropriate for assessing viricidal activity according to the BS-EN-ISO-14776
standard.
1.3.22 Sterilization of dental handpieces
Any method for sterilization of the HP must be able to be performed routinely in
a dental clinic, have a short turnaround time, will not result in patient exposure
to toxic chemicals during HP use, not result in damage to the HP and should
deliver a sterilization efficacy detailed by BS- EN- ISO 11737 – 1:2006 in all HP
locations including the internal lumens. Currently, the majority of practices in
the UK utilise steam sterilization with 89% utilising a non-vacuum instrument

Chapter 1 38
sterilizer and 21% wrapping the HP upon sterilization (Smith et al., 2009).
Vacuum sterilizers have been recommended for HP sterilization due to the
forced air removal stage removing air from the internal lumens to allow for
steam penetration (Medical Devices Agency, 2006) . Vacuum sterilization also
allows sterilization of wrapped instruments to ensure sterility continues until at
the point of use (Weightman and Lines, 2003). Tabletop vacuum sterilizers are
available and the use of wet heat ensures that the HP is not exposed to toxic
chemicals. The efficacy of vacuum steam sterilizers compared to non-vacuum
steam sterilizers has been shown by Andersen and coworkers (1999) by
inoculating HP’s with 3x10⁵ G. stearothermophilus and 1.4x10⁶ Streptococcus
salivarius and sterilized HP’s using 4 non vacuum and 1 vacuum sterilizer. No G.
Stearothermophilus was detected from HP’s upon sterilization using the vacuum
sterilizer and growth was observed in HP’s sterilized with non vacuum sterilizers
(Andersen et al., 1999). S. salivarius was detected after sterilization using a
non- vacuum sterilizer when no cleaning and lubrication had been undertaken
before sterilization. Cleaning with a KaVo Rotaspray II resulted in the elimination
of S. salivarius in 4 non vacuum sterilizers and 1 vacuum sterilizer (Andersen et
al., 1999). The study highlighted the importance of cleaning before
decontamination and the increased efficacy of the vacuum sterilizer though this
may have been due to the wrapping of instruments for non-vacuum sterilizers
which would not allow steam penetration of the instruments. The efficacy of non
vacuum sterilizers on sterilizing B. stearothermophilus inside HP’s was also
assessed by Edwardsson et al. 1983 by inoculation of HP’s in multiple locations.
HP’s not exposed to lubricating oil required sterilization at 134°C for 15 min to
inactivate spores whilst HP’s exposed to lubricating oil required sterilization
times of 20 min at 134°C. Lubricating oil containing formaldehyde reduced this
sterilization time to 10 min at 134°C. Steam sterilization is known to have a
detrimental effect on the HP by corrosion of the instrument and alternatives to
steam sterilization have been sought (Angelini, 1992, Wirthlin et al., 1981).

Chapter 1 39
1.3.23 Alternative sterilization methods for dental handpieces
A study into sterilization of HP’s was undertaken using a synthetic compressor
lubricating oil heated to 150°C -160°C in a deep fat fryer (Silverstone and Hill,
1999). Oil heated to 150°C failed to sterilize G. steraothermophilus spores
inoculated on test HP’s after 75 min of heating though oil heated to 160°C
resulted in sterilization of the spores after 45 min heating (Silverstone and Hill,
1999). This is significantly longer than the 3 min of sterilization currently used in
steam sterilizers and will have an impact on the number of instruments available
for a dental practitioner. The authors also noted the presence of oil in the HP’s
after ―weeks‖ of use which may pose a health risk if oil enters the patient oral
cavity. (Silverstone and Hill, 1999).
Ethylene oxide (EtOH) at room temperature has recently been suggested as an
alternative sterilization method for HP’s due to being less corrosive than steam
sterilization due to the lower temperatures involved (Parker and Johnson, 1995,
Pratt et al., 1999). EtOH was first patented as a sterilizing agent in 1937 when
the antimicrobial properties of the gas were first noted (Gross and Dixon, 1937).
Exposure to EtOH causes alkyation of proteins and oxidative stress to inhibit
cellular metabolism and has been used to sterilize luminated devices that cannot
be steam sterilized (Phillips and Kaye, 1949, Ujeyl et al., 1978). The ability of
EtOH to sterilize HP’s has been assessed by Parker and Johnson (1995) and Pratt
et al. (1999). Parker and Johnson (1995) found that exposure to EtOH did not
result in the sterilization of HP’s inoculated with Streptococcus mutans. These
HP’s included unused HP’s and HP’s that had been in clinical practice and
significantly more S. mutans was isolated from the HP’s previously used in
practice (Parker and Johnson, 1995). The authors state that the presence of
protein and other contaminants may stop the penetration of gas and that it is
not suitable for a sterilizing agent for HP’s. Pratt et al. found that EtOH only
sterilizes HP’s if they have undergone a cleaning step with forced air purging of
the internal lumens (Pratt et al., 1999). Sterilization by EtOH also requires
forced air purging to ensure no gas is present in the HP and therefore requires a
vacuum stage which increases the turnaround time for instruments. Due to
toxicity, the EtOH device also requires trained operators and a negative pressure

Chapter 1 40
room to stop gas leaks (Andersen, 1971). This may make it impractical for dental
practitioners due to the expense and space issues.
The Chemiclave is a sterilization method based on formaldehyde and alcohol
vapours (Kolstad, 1998). The study by Kolstad in 1998 showed that this method
was unable to sterilize B. stearothermophilus in the small lumens of both low
and high speed HP’s and the author recommended that any dental surgery using
a Chemiclave immediately change to a steam sterilizer(Kolstad, 1998)

Chapter 1 41
1.4 Objectives of the study
In the light of previous knowledge of HP contamination, continuing concerns
over risks of cross-contamination between patients and the emergence of variant
CJD and technological improvements in understanding of medical device
contamination, it is timely to re-appraise the biofouling of dental HP’s after use.
The main aim of this thesis was to collaborate with a dental HP manufacturer to
provide a quantitative and qualitative appraisal of HP biofouling after use in
order to develop an appropriate test soil for the development of cleaning
processes and prototype HP cleaning devices.
In order to achieve these aims, the work was divided into the following research
questions:
1. Quantitative and qualitative analysis of microbial contamination of dental
HP parts.
2. Quantitative and qualitative analysis of protein contamination of dental
HP parts.
3. Propose a dental HP specific test soil
4. Undertake a detailed surface analysis of used HP parts.
5. Assessment of the efficacy of cleaning chemicals
6. Undertake assessments into the cleaning efficacy of established and
prototype HP cleaning processes and devices.

Chapter 2
2 Chapter 2: Materials and Methods
Chapter 2 43
2.1 General Reagents and Equipment
2.1.1 General reagents
All chemicals were obtained from Sigma Aldrich (Poole, Dorset UK), and all
proteomic and molecular biology reagents were obtained from Invitrogen
(Paisley, Strathclyde, UK), unless otherwise stated. All blood products were
acquired from E & O laboratories (Bonnybridge UK). All microbiological media
was obtained from Oxoid (Hampshire UK). Reverse osmosis water (ROH2O) was
acquired from a Purelab Prima DV 34 unit (Elga water, Glasgow, Scotland). For
cleaning validation studies sections made of 314l medical grade stainless steel
square discs measured 10 mm by 10 mm and a thickness of 1mm were used. For
epifluorescent scanning (EFSCAN) analysis, a sheet of 316l stainless steel was cut
into 5mm discs and the discs were immersed in 2% (v/v) Triton X-100 detergent
(Bio-Rad Hertfordshire, UK). Lubricating oil and cleaning solution used in this
study was manufactured for use with the Assistina HP cleaning machine and
were provided by W & H Dentalwerk.
2.1.2 Instruments sampled in this study
Dental and podiatry instruments sampled in this study are presented in Table
2-1, and Figure 2-1 and Figure 2-2. Dental instruments were obtained from the
Glasgow Dental Hospital (GDH) central sterile service department (CSSD) and the
W&H St Albans repair facility, and all podiatry instruments were obtained from
podiatry clinics and the central decontamination unit at Cowlairs Glasgow. All
dental HP’s sampled were manufactured by W & H Dentalwerk (Burmoos,
Austria) and all podiatry instruments were manufactured by Timesco Instruments
(Edinburgh, UK). Upon reception to the CSSD after use, dental HP’s were
transported in a sterile plastic bag to a laminar flow cabinet and sampled
immediately. The cap of each high speed HP was removed using a specialized
tool, and the turbine (Figure 2-1) removed from the head into a sterile universal
tube using a sterile pipette tip. Each low speed HP was dismantled and the spray
channel (Figure 2-1) separated from the HP using a sterile pipette tip, which was
then placed into a sterile 25 ml centrifuge tube. Each surgical HP was manually

Chapter 2 44
dismantled and the inner gear (Figure 2-1) removed directly into a sterile 25 ml
centrifuge tube. For all sampling from GDH and the repair facility, a new unused
HP of each type was subjected to the decontamination process at the GDH CSSD
(Table 2-3), and the parts sampled as above as negative controls. Repair facility
HP’s were processed on site at the facility under a bunsen burner to ensure
sterility.
Table 2-1 Source and details of instruments sampled in this study.
Chapter
reference
Source Instruments sampled
3,4 GDH CSSD TA-98 high speed HP’s
WA-56 Lt low speed HP’s
S11 surgical HP’s
Extraction forceps
3 St Albans repair
facility
TA-98 high speed HP’s
TA-97 high speed HP’s
Topair high speed HP’s
WA-56 Lt low speed HP’s
S11 surgical HP’s
4 Podiatry clinics Pear burs
Blacks files
Diamond deb files

Chapter 2 45
Figure 2-1 HP parts sampled in this study. The turbine from TA-98 high speed
HPs (a), the spray channel from WA-56 Lt HP’s (b) and gears from S11 surgical
HP’s (c), sampled in this study

Chapter 2 46
Figure 2-2 Podiatry instruments sampled in this study. Pear burs (top), Blacks’
files (middle) and Diamond deb files (bottom), sampled in this study.

Chapter 2 47
2.1.3 Decontamination methods used in this study
Instruments sampled after decontamination were subjected to a
decontamination process dependent on the source of the instruments (Table 2-2,
Table 2-3). For the assessment of the cleaning efficacy of novel HP cleaning
machines, a total of 4 seperate processes from 2 seperate machines were
sampled.

Chapter 2 48
Table 2-2 Details of podiatry instrument decontamination processes
Cleaning process Podiatry LDU Podiatry CDU
Equipment Hygena Ultrawave
ultrasonic bath
Getinge Automated
Washer Disinfector
Detergent Sonozyme- solution
changed twice daily
Dr Weigert Neodisher
MediClean Forte
Cleaning time/
temperature
6 min/35°C Pre rinse – 4 min 38
sec/Start 31°C End
34.9°C
Main wash - 7 min 20
sec/Start 60.5°C, End
62.8°C
Hot water rinse – 2
min/Start 91.4°C, End
92.6°C
Disinfection – 1 min 30
sec 37
Drying – 22 min 22
sec/Start 82.3°C, End
87.2°C
Validated Tests and
documentation
supplied by
manufacturer
(Ultrawave)
Washer disinfector by
trust engineer to
protocols defined in
SHTM2030
Sterilization
Process
Equipment Little sister 3 Type N
(Non vacuum)
Getinge Type B (Vacuum
sterilizer)
Method Steam sterilization Steam sterilization

Chapter 2 49
Table 2-3 Details of GDH CSSD decontamination process.
Process Equipment Process
Cleaning and
Disinfection Process
Belimed Automated
Washer Disinfector with
Dr Weigert Neodisher
detergent.
Pre wash
7 min – 25.7 °C
Wash
15 min 51 sec – 57.7°C
1st Rinse/ 2nd Rinse
1 min 59 sec – 57.9 °C / 2
min – 58.2 °C
Thermal Rinse
(Disinfection)
6 min 27 sec 93.2 °C
Drying
22 min 9 sec 90.9 °C
HP maintenance Assistina (W & H) 35 sec cleaning solution
and lubricating oil
Sterilization Belimed Vacuum
Sterilizer
134 °C 3 min

Chapter 2 50
2.1.4 Cleaning solutions used in this study
A total of 3 enzymatic, 3 alkaline detergents, an HP cleaning solution and a hand
wash were used in this study (Table 2-4).

Chapter 2 51
Table 2-4 Ingredients of cleaning solutions listed on MSDS sheets
Cleaning
solution
Type Ingredients
Alconox Alkaline Sodium Bicarbonate
Sodium (C10 – C16) Alkylbenzene Sulfonate
Sodium Tripolyphosphate
Tetrasodium Pyrophosphate
Sodium Carbonate
Sodium Alcohol Sulphate
Haemosol Alkaline Sodium Carbonate
Sodium Tripolyphosphate
Urea
Diethanolamine
Surfactant
Rapdiex Alkaline Biodegradable alkyl sulphates
Inorganic surface active agents
Dye
Alcohol
Rapizyme Enzymatic Surface active agents
Enzymes
Dyes
Alcohol
Endozime Enzymatic 2- Propanol
Enzymes
Sonozyme Enzymatic Polyexamethylene Biguanide Hydrochloride
Limonene
N N- Didecyl-N-methyl-poly(oxyethyl)ammonium propionate
Sodium N-lauryl B-Iminodipropionate
Ethoxylated Isotridecanol
Hibiscrub Handwash Chlorhexidine Diacetate Hydrate
HP Cleaner
HP cleaner
N-Propanol
Ethanol

Chapter 2 52
2.2 Microbiological assessment
2.2.1 Type strains used in this study
All bacterial and fungal type strains used in this study are detailed in Table 2-5.
These strains were used for validation and cleaning efficacy experiments.
Table 2-5 Details of bacterial and fungal strains used in this study
Bacterial or fungal strain Source or reference
Staphylococcus epidermidis National Collection of Type Cultures
(NCTC) Health protection agency
11047
Escherichia coli American Type Culture Collection
(ATCC) 25922
Enterococcus faecalis ATCC 29212
Staphylococcus aureus ATCC 25923
Pseudomonas aeruginosa ATCC 27853
Candida albicans ATCC 90028
Streptococcus mutans NCTC 10449
Streptococcus sanguinis ATCC 10043

Chapter 2 53
2.2.2 Preparation of microbiological growth media
All media was sterilized in a vacuum sterilizer before use and before the
addition of blood products. All media was prepared according to the
manufacturers instructions. For the culture of bacterial strains, blood agar (BA)
was prepared by adding Columbia blood agar base and 5% (v/v) defibrinated
horse blood to ROH2O. Fastidious anaerobic agar (FAA) was prepared by adding
fastidious anaerobic agar base and 5% (v/v) defibrinated horse blood to ROH2O.
Sabouraud dextrose (SAB) agar was made by adding SAB powder to ROH2O.
Mueller Hinton (MH) broth was prepared by dissolving MH powder in ROH2O.
Mannitol Salt Agar (MSA) was prepared by dissolving mannitol salt powder in
ROH2O. For the culture of fungal strains, Yeast Peptone Dextrose (YPD) broth
was prepared by dissolving YPD powder in ROH2O and Roswell Park Memorial
Institute (RPMI) broth was prepared by dissolving RPMI powder in ROH2O.
Phosphate buffered saline (PBS) was made by dissolving 1 tablet (Fisher
Scientific, Longborough, UK) in 100 ml of ROH2O. To prepare agar plates, 20 ml
of agar was poured into sterile Petri dishes (Sterilin, Caerphilly UK) and dried in
a laminar flow cabinet for 30 min.
2.2.3 Culture of microorganisms
All microorganisms were maintained at -80oC in Pro-tect bacterial preservers
(Technical Service Consultants Limited, Heywood, UK) for the duration of the
study. For the culture of bacteria, a Pro-tect bead was streaked to produce
single colonies on a BA plate, or SAB agar plate for C. albicans, and incubated
overnight at 37°C, or 30°C for C. albicans. For a bacterial culture, a single
colony was inoculated into 10 ml of MH broth in a sterile Universal tube (Sterilin,
Caerphilly UK) and incubated overnight at 37°C at 200 RPM in a KS40001
incubator (IKA™, Staufen Germany). For a C. albicans culture, a single colony
was inoculated into 10 ml of YPD broth in a 25 ml sterile universal tube and
incubated overnight at 200 RPM at 30°C in a KS40001 incubator (IKA™, Staufen
Germany).

Chapter 2 54
2.2.4 Instrument sampling - standard microbial culture
Each HP part was immersed in sterile PBS and each tube was inserted into a
Fisherbrand® 11021 sonic bath (Fisher Scientific, Loughborough UK) filled with
ROH2O, and each part subjected to sonication for 5 min at 35 kHz. The
instrument part was then removed and the sample retained for analysis.
2.2.5 Identification of microorganisms
2.2.5.1 Isolation of handpiece isolates
A 100 µl turbine eluent sample and 200 µl samples of surgical gear eluent and
spray channel eluent was plated onto 2 BA plates, 2 SAB agar plates, and 2 FAA
agar plates using a sterile spreader. The BA and SAB agar plates were incubated
for 72 h in 5% carbon dioxide (CO2) in a 37°C incubator (Binder,Tuttlingen
Germany). The FAA plates were incubated anaerobically in an anaerobic cabinet
(Don Whitley Scientific Shipley UK) at 37°C for 7 days. Colonies isolated from BA
and SAB agar plates were subcultured onto a new BA plate and SAB agar plate,
respectively, to make pure cultures. Colonies isolated from FAA plates were
subcultured onto a fresh BA plate and FAA plate to identify obligate anaerobes.
2.2.5.2 Gram stain of isolates
A single colony was spread on 5 µl of sterile PBS. The colony was then fixed onto
a glass microscope slide and the slide was coated in 0.5% (w/v) crystal violet
solution for 1 min and the slide rinsed with tap H2O before being coated in
Grams iodine for 1 min. The Grams iodine was rinsed with tap H2O and the slide
then de-stained by coating in acetone (Fisher Scientific) for 2-3 sec. The acetone
was rinsed using tap H2O and the slide coated with carbol fuschin for 1 min. The
colony morphology was determined by viewing in a microscope (Olympus Essex,
UK) under oil immersion at 100 x magnification.

Chapter 2 55
2.2.5.3 Catalase testing of isolates
Catalase testing was performed on all Gram-positive cocci using the ID Colour
Catalase test (Biomerieux Marcy l’Etoile, France) according to manufacturers’
instructions. S. aureus was used as a positive control and E. faecalis was used as
a negative control.
2.2.5.4 Identification of organisms by API® strip
Colonies that were identified as Gram positive cocci and catalase negative were
identified using the RapidID 32 Strep API® strip (Biomerieux Marcy l’Etoile,
France), according to manufacturers’ instructions. Colonies identified as Gram
positive bacilli were identified using API® 50C. The results of the API® strips were
used to identify isolates based On the API® strip biochemical profiles.
2.2.5.5 Identification of organisms by mannitol salt agar and coagulase test
Colonies identified as Gram positive cocci and catalase positive were
subcultured onto a mannitol salt agar (MSA) plates and subjected to a
STAPHaurex coagulase test (Oxoid Hampshire, UK). S. aureus was used as a
positive control and S. epidermidis was used as a negative control. All colonies
with a positive coagulase test and a positive reaction on the MSA plates were
identified as S. aureus. All colonies with a negative coagulase test and MSA test
were identified as coagulase negative Staphylococci (CONS).
2.2.5.6 Identification of P.acnes isolates
Colonies with pyramidal morphology were identified as P. acnes using the Rapid
ID 32A API® strip (Biomerieux Marcy l’Etoile, France). Each P.acnes isolate was
sent for molecular typing at Queens University Belfast (McDowell et al., 2005).

Chapter 2 56
2.2.6 Instrument sampling – molecular detection (PCR)
2.2.6.1 Processing of handpiece samples for DNA extraction
HP eluents were added into 10 ml syringes (Fisher Scientific, Loughborough, UK)
and passed through a cellulose acetate filter of 0.2 µm pore size (Fisher
Scientific, Loughborough, UK). The filters were then inserted into a sterile 2 ml
Micro tube (Sarstedt, Leicester UK). Each filter was then immersed in 200 µl of
lysis buffer (20 mM Tris-Cl, 2mM sodium EDTA, 1.2% Triton X, 20 mg/ml) and
incubated at 37°C in a heat block (Grant instruments, Cambridge, UK) for 30
min. After incubation, 25 µl of proteinase K and 200 µl of Buffer AL from the
DNeasy Blood and Tissue kit (Qiagen, Crawley, United Kingdom) was added to
each filter and incubated at 56°C in a heat block for 30 min.
The eluent was removed and processed using the Gram positive DNA DNeasy
Blood and Tissue kit extraction protocol. A total of 50 µl of AE buffer was added
to the column membrane and incubated at ambient room temperature for 1h.
The column was then centrifuged at 9971 g and a further 50 µl of AE buffer was
added to the membrane. DNA concentration was then quantified using a
NanoDrop (Labtech International UK, Ringmer, UK). A 1.5 µl volume of RNAse
free water (Qiagen, Crawley United, Kingdom) was added to calibrate the
machine followed by a 1.5 µl volume of AE buffer as a blank control. A 1.5 µl
sample was then added to quantify the concentration of DNA.
2.2.6.2 Selection of primers
The 16S primers 27F (Hayashi et al., 2004) (CAGGCCTAACACATGCAAGTC) and
1387R (Marchesi et al., 1998) (GGGCGGWGTGTACAAGGC) with annealing
temperatures of 60°C were utilised. A basic local alignment search tool (BLAST)
search of the sequences was performed on the NCBI website to ensure sequence
homology with the 16S ribosome.

Chapter 2 57
2.2.6.3 16S Polymerase Chain Reaction
Each DNA sample was diluted to 1 ng/ml in DNAse free H2O (Sigma, Dorset UK).
A positive control was also diluted and a negative control of DNAse free H2O was
also processed. A 1 µl sample of DNA was added to 22.8 µl of ReddyMix™ and 0.1
µl of each primer 27F and 1387R both at concentrations of 50 µM/µl. The
reaction tubes were inserted into a PCR MyCycler™ (Bio-Rad Hertfordshire, UK)
and operated for one cycle of 95°C for 2 min followed by 35 cycles of 95°C for 1
min, 60°C for 1 min and 72°C for 1 min 30 sec and an extension cycle at 72°C for
10 min.
2.2.6.4 Agarose gel electrophoresis
A 5 µl solution of 10 mg/ml of ethidium bromide was added to a 100 ml 2 %
(w/v) agarose gel. Each sample was added to a well of the gel and 2 µl of 100bp
ladder (New England Biolabs) was added for size comparison. The gel tank was
plugged into a BioRad power pack and operated at 100v for 60 min. The gel was
photographed in a BioRad XR+ Gel doc using ultraviolet light.
2.3 Protein quantification and analysis
2.3.1 Quantitative protein sampling
2.3.1.1 Bicinchoninic acid assay
The bicinchoninic acid (BCA) reagent was prepared by adding 1 part of the BCA
solution B (Pierce Biotechnology, Rockford USA) to 50 parts of BCA solution A
(Pierce Biotechnology, Rockford USA). For determination of protein
concentration, 100 µl of protein sample was added to 1 ml of the BCA reagent.
Samples were incubated for 1h at 60oC in a water bath (Grant Instruments,
Cambridgeshire, UK) and were then cooled to room temperature. A 300 µl
sample was added to a Costar™ clear, flat bottomed 96 well plate and all
samples were analysed using a Sunrise™ plate reader at OD 570.

Chapter 2 58
2.3.1.2 Ninhydrin assay
For the ninhydrin assay, a 500 µl sample of 2% (v/v) ninhydrin solution was added
to 500 µl of protein sample. Samples were incubated for 10 min at 60oC, and
were cooled to room temperature. A 300 µl sample was added to a Costar™
clear, flat bottomed 96 well plate and all samples were analysed using a
Sunrise™ plate reader at OD 570 (Starcher, 2001).
2.3.1.3 Ophthaldialdehyde assay
The OPA reagent was prepared by adding 40 mg of phthaldialdehyde dissolved in
1 ml of methanol (BDH Laboratory Supplies, Leicester, UK) to a solution of 100
mg of mercaptoethanesulfonate dissolved in 50 ml of 0.1M pH 9.2 sodium
tetraborate. A 20µl protein sample was added to a Costar™ dark flat bottomed
96 well plate (Sigma, Dorset, UK) and 300 µl of OPA reagent was added to each
sample. The samples were incubated for 3 min at ambient room temperature
before being sampled using an Omega Fluostar plate reader (BMG Labtech,
Aylesbury UK) at excitation wavelength 355 nm and emission wavelength 460
nm(Zhu et al., 2009).
2.3.2 Protein sample precipitation
2.3.2.1 Precipitation of protein using acetone
Four volumes of -20°C acetone was added to 1 volume of protein solution and
incubated for 1 hour at -20°C. The samples were then centrifuged at 2215 g in a
MSE Centaur 1 centrifuge (Sanyo, Loughborough, UK) for 35 min and the protein
pellet re-suspended in 1 ml of 1% (v/v) SDS (Jiang et al., 2004).
2.3.2.2 Precipitation of protein using Trichloroacetic acid
Trichloroacetic acid (TCA) solution was made by adding 500 grams of TCA
powder to 350 ml of ROH2O. For precipitation, 1 volume of TCA solution was
added to 4 volumes of protein sample and incubated for 10 min at 4°C. The
samples were centrifuged at 9971 g for 5 min and the supernatant removed. The
protein pellet was then washed in 200 µl of ice cold acetone and centrifuged at

Chapter 2 59
9971 g for 5 min. The pellet was washed a further two times in acetone and the
samples were added to a heat block (Grant, Cambridge UK) at 95°C to drive off
the remaining acetone (Jiang et al., 2004). The pellet was then resuspended in 1
ml of 1% (v/v) SDS.
2.3.2.3 Precipitation of protein using StrataCleanTM Resin
A 10 µl aliquot of StrataClean™ resin (Agilent Technologies, Texas USA) was
added to 1 ml of protein solution and centrifuged at 614 g for 1 min and the
supernatant removed (Koch-Nolte et al., 1996). The resin pellet was
resuspended in 1 ml of 1% SDS (v/v) or NuPAGE™ sample buffer.
2.3.2.4 Precipitation of protein using an Amicon® filter
Amicon® 15 K filter units were acquired from Fisher Scientific Longborough UK.
Protein samples were loaded into the Amicon® filter unit and centrifuged at
2215 g for 45 min according to manufacturers instructions. The retentate and
the filtrate were both removed for analysis.
2.3.3 Sodium dodecyl sulphate polyacrylamide gel
electrophoresis
Samples were mixed with an equal volume of NuPAGE™ sample buffer and
heated for 10 min at 70°C. Each sample was then centrifuged in a MSE
Microcentaur (Sanyo Loughborough, UK) at 9971 g for 2 min. Running buffer was
made by diluting 20 x NuPAGE® 2-(N-morpholino) ethanesulfonic acid (MES)
running buffer to make a 1 x solution. For the sampling of salivary mucin,
running buffer was made by diluting 20 x NuPAGE tris-acetate buffer to make a
1x solution. An XCell SureLock Mini-Cell™ gel case was filled with 200 ml of
running buffer in the inner chamber and 600 ml of running buffer in the outer
chamber. For the detection of salivary mucin, a pre-cast 3-8% NuPAGE® Novex®
Tris Acetate gel and for all other sampling a pre-cast 4-12% NuPAGE® Novex® Bis
Tris gel was used. Each gel was inserted into the tank and the wells washed 3
times with running buffer. A maximum of 20 µl samples were loaded into each

Chapter 2 60
well and 0.5 µl of BenchMark™ protein ladder was loaded for size comparison.
The gel tank was connected to a Powerpac 300 power pack (Bio-Rad,
Hertfordshire, UK) and operated at 200V for 35 min for Bis Tris gels and 150v for
1 h for Tris -Acetate gels.
2.3.4 Gel staining
2.3.4.1 Staining of gel by Coomassie Blue
Coomassie blue solution was made by dissolving 0.25 g of coomassie brilliant
blue G- 250 powder per 100 ml of methanol: acetic acid solution comprising 500
ml of methanol, 400 ml of ROH2O and 100 ml of glacial acetic acid (BDH
Laboratory Supplies, Leicester UK) (Sambrook. J and Russel. W.D, 2006). For
staining, the gel was immersed in 100 ml of coomassie brilliant blue solution on
a rocking platform for 4 h at room temperature. The gel was then destained in a
methanol: acetic acid solution until bands were visible (Sambrook. J and Russel.
W.D, 2006). Gels were photographed in a XR+ Gel doc (Bio- Rad, Hertfordshire
UK).
2.3.4.2 Staining of gel by SYPRO® Ruby
The gel was removed from the outer casing and immersed in 100 ml of SYPRO®
ruby stain for 3 h before being destained in 100 ml of a solution of 10% (v/v)
methanol and 7% (v/v) acetic acid in ROH2O for 1 h. The gel was viewed using an
XR+ Gel doc using ultraviolet light (Bio- Rad, Hertfordshire, UK).
2.3.4.3 Staining of gel by Silver Staining
The gel was removed from the outer casing and stained using the Silverquest™
silver stain kit according to the manufacturer instructions. Gels were imaged in a
XR+ Geldoc (Bio-Rad, Hertfordshire, UK).

Chapter 2 61
2.3.4.4 Staining of gel by periodic acid Schiff reagent
For periodic acid Schiff (PAS) staining, the gel was removed from the outer
casing and immersed in 100 ml of fixative solution comprising a 40% (v/v)
ethanol and 7% (v/v) acetic acid in ROH2O for 30 min. The solution was then
replaced and the gel fixed overnight. The gel was then immersed in fresh
fixative solution 4x for 30 min with fresh fixative solution each time. The gel was
then immersed in a solution of 1% (w/v) periodic acid and 3% (v/v) acetic acid
for 60 min before being washed 10x for 10 min in ROH2O. The gel was then
stained with Schiff’s Reagent for 60 min in the dark. Gels were photographed in
a XR+ Gel doc (Bio-Rad, Hertfordshire, UK).
2.3.5 Mass spectrometry data analysis
Each protein band was sent for mass spectrometry (MS) analysis at the Glasgow
University Proteomics facility. The MS/MS spectra were used for interrogation of
the human and bacterial proteome database using Mascot software
(http://www.matrixscience.com). A protein was considered a good
identification if 2 or more peptides had an individual ion score over 58 which
indicates significant homology (p<0.05) to a protein listed in the database
(Romero et al., 2010).
2.3.6 Western blot
Transfer buffer was prepared by dissolving 10 mM Tris base, 100 mM glycine, and
25 ml methanol in 975 ml of ultrapure ROH2O. Blocking solution was made by
dissolving 10% non-fat milk powder (Malvern St Albans UK) in Tris buffered saline
(TBS) buffer (50 mM Tris- HCl, 150 mM NaCl). Wash buffer was made by
dissolving 0.1% Tween® 20 in Tris- ethylenediaminetetraacetic acid (EDTA) -NaCl
buffer (25 mM Tris base, 1 mM EDTA, 150 mM NaCl). A solution of 5-Bromo-4-
chloro-3-indolyl phosphate, nitro blue tetrazolium (BCIP NBT) was made by
dissolving a SIGMAFAST™ BCIP NBT tablet in 10 ml in ultrapure H2O.
Each sample was sampled by SDS PAGE (Section 2.3.3) and all gels included a
10µl sample of MagicMark™ XP pre-stained protein ladder for size comparison.
The gel case was opened and a piece of filter paper pre- soaked in transfer

Chapter 2 62
buffer was then placed on top of the gel. The PVDF membrane was soaked in
100% methanol for 30 sec and then immersed in transfer buffer for 3 min. The
membrane was then placed on top of the gel and air bubbles removed. A piece
of pre soaked filter paper was then placed on top of the membrane and 2
blotting pads, soaked in transfer buffer, were placed on both sides of the
membrane sandwich and the assembly was added to the X- cell II™ Blot Module.
The blot module was inserted into an Xcell SureLock Mini-Cell™ and the
membrane assembly was immersed in 200 ml of transfer buffer and the outer
core was filled with 600 ml of ROH2O. The gel tank was connected to a power
pack (Bio-Rad, Hertfordshire, UK) and operated at 30V for 1 h. The membrane
was immersed in 100 ml blocking solution and incubated for 1 h on a tilting
platform. The membrane was then inserted into a 50 ml Corning centrifuge tube
and immersed in a 10ml solution of primary antibody diluted in wash buffer and
1% (v/v) blocking solution. Each membrane was incubated for 1 h at 37°C in a
hybridisation oven (Hybaid Thermo Scientific, Leicestershire, UK and washed or
4x 5 min in wash buffer. The membranes were then inoculated with 10 ml of
secondary antibody for 1 h in the hybridisation oven at 37°C. The membranes
were then washed a further 4 x for 5 min in wash buffer. Each membrane was
then immersed in 10 ml of BCIP NBT solution and incubated until the alkaline
phosphatase representing bound antibody was visible. The membranes were
imaged using an XR+ Gel doc (Bio- Rad, Hertfordshire UK) and the presence of
protein bands in each lane was determined using Quantity one® gel
interpretation software (Bio Rad version 4.6.7).
2.3.7 Indirect enzyme linked immunosorbent assay
Samples and standards for the enzyme linked immunosorbent assay (ELISA) were
diluted in PBST. For the ELISA, a 100 µl sample of 1:1000 dilution of capture
antibody (Pierce biotechnology Rockford USA) was added to each well of a
Immuno 96 Microwell™ clearplates (Fisher scientific Longborough, UK) and
incubated at 4°C overnight. The plate was then given 5x washes in PBS and 10%
tween 20 (PBST) and incubated in blocking solution at room temperature (5%
milk powder in PBST) for 1h. The plate was then given 5x washes in PBST and the
samples were then added to the plates and incubated for 90 min at room
temperature. The plate was then given 5x washes in PBST and a 100 µl sample of
Chapter 2 63
1:1000 dilution of secondary antibody was added to the plate and incubated at
room temperature for 90 min. The plate was then given 5x washes in PBST and a
100 µl sample of a 1:100000 dilution of the detection antibody was added to
each well and incubated for 90 min at room temperature. The plate was then
given 5x washes in PBST and a 100 µl sample of tetramethylbenzidine was added
to each well. The plate was incubated in the dark for 30 min and when a blue
colour had developed, the reaction was stopped by 100 µl of 0.12M of HCl. The
plate was then read in an Omega Fluostar plate reader (BMG Labtech, Aylesbury
UK) at an absorption wavelength of 450 nm and a reference wavelength of 630
nm.
2.4 Surface analysis
2.4.1 Surface analysis techniques
All 316l stainless steel discs sampled were cleaned by sonication at 35kHz for 15
min in 1% Triton X and then subjected to 15 min sonication in HPLC grade RO
H2O (Fisher Scientific Longborough, UK) to ensure no residual contaminants were
present. The discs were then dried in a drying cabinet at 37°C.
2.4.1.1 Scanning electron microscopy
For fixing, the sample was immersed in fixative, comprised of 2 %
paraformaldehyde, 2 % gluteraldehyde, 0.15M sodium cacodylate, and 0.15 %
alcian blue, for 22h. The fixative was then removed and replaced with 0.15M
sodium cacodylate. The samples were then given 3 further washes in 0.15M
sodium cacodylate buffer for 5 min per wash before immersion in a 1:1 solution
of 1% osmium tetroxide: 0.15M sodium cacodylate for 60 min. The samples were
then rinsed 3 times for 5 min in distilled water and immersed in 0.5 % uranyl
acetate for 60 min in the dark. The samples were then rinsed in distilled water
and then dehydrated by immersion 2 times for 5 min in 30% alcohol, 2 times for
5 min in 50% alcohol, 2 times for 5 min in 70% alcohol, 2 times for 5 min in 90%
alcohol, 4 times for 5 min in absolute alcohol and 2 times for 5 min in dried
absolute alcohol. The samples were then immersed in hexamethyldisilazane
(HMDS) 2x for 5 min. The samples were moved to a new 24 well plate and placed

Chapter 2 64
in a dessicator overnight to allow the sample to dry. Each sampled to be viewed
was sputter- coated with gold and viewed under a JEOL JSM-6400 scanning
electron microscope at 12 x and 100 x magnification.
2.4.1.2 Energy dispersive X-ray analysis
For EDX analysis, images of parts were taken using a Philips XL30CP instrument
operating at 20 kV. For any surface contaminants, EDX analysis was performed
using an integrated Isis 300 X-ray analyser (Oxford instruments, Oxford, UK).
Each contaminant was subjected to elemental analysis to a depth of 3 µm using
an X- ray fluorimeter capable of detecting elements of atomic number greater
than 6.
2.4.1.3 Epifluorescent analysis
EFSCAN analysis was undertaken at the University of Edinburgh chemistry
department in collaboration with Dr Helen Baxter and Professor Robert Baxter.
Each part was mounted on a computer controlled motorized x-y translation stage
(Ocean optics, Ostfildern Germany) and each part excited at 468nm fibre optic
diode (Richardson et al., 2004). The fluorescent signal was measured using a
photon counting fluorescence spectrometer (Jobin-Yvon-Horiba Fluoromax-P)
and the data analysed using the LabView program (National Instruments, Austin
TX, USA) (Baxter et al., 2009, Richardson et al., 2004)
2.5 Surface cleaning studies
2.5.1 Optimising cleaning parameters
2.5.1.1 Preparation of stainless steel sections
Each stainless steel section (SSS) was immersed in 0.1M sodium hydroxide
(NaOH) pH 9.2 and boiled at for 10 min at 100°C in a water bath (Grant
instruments) to remove residual contaminants from the discs. The discs were
Chapter 2 65
then rinsed with methanol (BDH laboratories, Leicester UK) and dried in a
laminar flow cabinet for 1 h (Imamura et al., 2003).
2.5.1.2 Test Soil
The test soil used was the Swedish test soil detailed by the BS EN ISO–15883-5:
2006. The soil was made by adding 1 ml of 0.1M calcium chloride (CaCl2) (Difco
Oxford UK) to 9 ml of citrated horse blood (Ransjo et al., 2001).
2.5.1.3 Inoculation of stainless steel sections
A total of 3 SSS’s were inoculated with 30 µl of solution of recalcified horse
blood. SSS’s were inoculated with 30 µl of 0.1M CaCl2 for negative controls. Each
inoculated SSS was dried for 16 h at ambient room temperature representing the
time it can take for instruments to be reprocessed in a sterilization department
(Plinston et al., 2007). Each disc was inserted into a separate well on a clear 24
well plate. For each experimental run, the control comprised a protein assay for
30 µl of citrated blood diluted in 1ml of RO H2O. The percentage removal was
expressed as the amount recovered from the experiment wash compared to the
protein detected in the control.
2.5.2 Cleaning system
The 24 well plate containing inoculated stainless steel discs was placed on the
measured centre of a Grant PMR – 30 rocking platform. Each well containing a
disc was filled with 1 ml of the appropriate cleaning solution. The experiment
consisted of 3 discs and the experiment repeated 3 times.
2.5.3 Biofilm cleaning model
2.5.3.1 Culture of microorganisms
A total of 20 P. acnes strains isolated from used, unprocessed s11 W &H surgical
HPs from the Glasgow dental hospital (GDH) and 19 P. acnes isolates isolated
from decontaminated s11 surgical HPs from the St Albans repair facility were
revived from Protect beads (Biomerieux Marcy l’Etoile, France). A single bead

Chapter 2 66
was plated onto FAA and incubated anaerobically for 24 h at 37°C. S.
epidermidis strain (RP62A) was cultured onto BA and incubated overnight at
37°C under 5 % CO2. A single colony of each P. acnes strain and the S.
epidermidis was added to 50 ml of reinforced clostridial (RC) broth that had
been pre-reduced by boiling for 30 min. Of the GDH isolates, a total of 13
cultures were incubated overnight at 37°C anaerobically and 7 cultures were
incubated overnight aerobically at 37°C. Of the repair facility isolates a total of
11 cultures were incubated overnight at 37°C anaerobically and 8 cultures were
incubated overnight at 37°C aerobically.
2.5.3.2 Preparation of biofilms
The OD of each culture was taken using a spectrophotometer (Fisherbrand
Longborough, UK). Each culture was diluted in RC broth to an O.D of 0.2
representing 1x10⁸ CFU of bacteria. A total of 6, 300 µl samples of each isolate
were added to separate wells of a clear Costar 96 well flat=bottomed plate
(Sigma Aldrich, Dorset UK). Separate plates were used for each cleaning
solution. Each plate was placed on a PMR tilting platform (Grant Instruments
Cambridge, UK) at moderate speed (18 rpm) and incubated for 72 h
anaerobically at 37°C or for 16 h aerobically at 37°C. RC media was added to
each plate as a negative control. RC broth was changed every 24 h in each well
for the 72h biofilms.
2.5.3.3 Detergent treatment of biofilms
For 72 h biofilms, a 1% (v/v) solution of Haemo-sol® detergent and undiluted W
& H cleaning solution were sampled. For 16 h biofilms, a 1% (v/v) solution of
Alconox®, Haemo-sol® and Rapizyme® and an undiluted W & H cleaning solution
were sampled. The media was removed from each well and the plate air dried
for 20 min. Each well was washed three times in sterile phosphate buffered
saline (PBS) and a 300 µl sample of the appropriate cleaning solution was added
to each well and incubated at room temperature for 16 min, which is the length
of time an instrument is exposed to detergent during some automated washing
process. After exposure, the supernatant was removed and the wells rinsed a
further 3 times in sterile PBS. Samples were compared to a positive, untreated
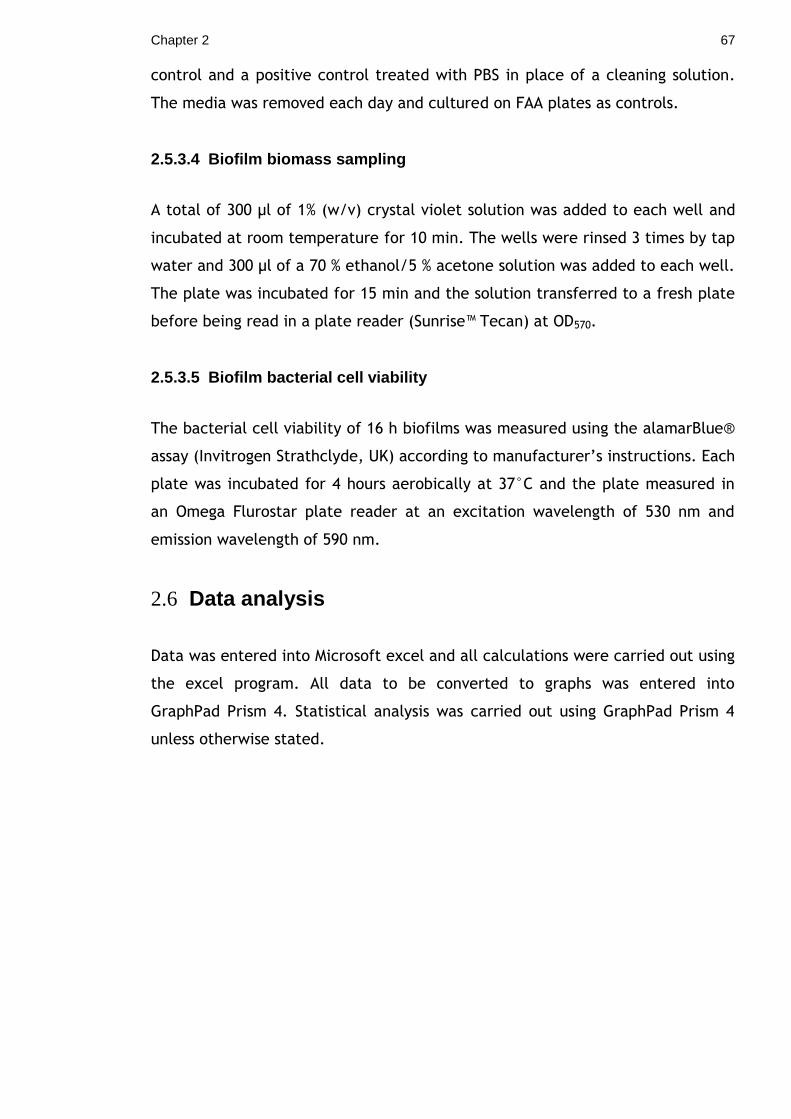
Chapter 2 67
control and a positive control treated with PBS in place of a cleaning solution.
The media was removed each day and cultured on FAA plates as controls.
2.5.3.4 Biofilm biomass sampling
A total of 300 µl of 1% (w/v) crystal violet solution was added to each well and
incubated at room temperature for 10 min. The wells were rinsed 3 times by tap
water and 300 µl of a 70 % ethanol/5 % acetone solution was added to each well.
The plate was incubated for 15 min and the solution transferred to a fresh plate
before being read in a plate reader (Sunrise™ Tecan) at OD570.
2.5.3.5 Biofilm bacterial cell viability
The bacterial cell viability of 16 h biofilms was measured using the alamarBlue®
assay (Invitrogen Strathclyde, UK) according to manufacturer’s instructions. Each
plate was incubated for 4 hours aerobically at 37°C and the plate measured in
an Omega Flurostar plate reader at an excitation wavelength of 530 nm and
emission wavelength of 590 nm.
2.6 Data analysis
Data was entered into Microsoft excel and all calculations were carried out using
the excel program. All data to be converted to graphs was entered into
GraphPad Prism 4. Statistical analysis was carried out using GraphPad Prism 4
unless otherwise stated.

Chapter 3
3 Chapter 3: Assessment of Assays for Detection
of Protein Contamination

Chapter 3 69
3.1 Introduction
Invasive surgical instruments are contaminated by protein during routine use
that may inhibit instrument sterilization (Nakata et al., 2007). Residual protein
must therefore be removed by cleaning, the critical control stage of the
decontamination process before sterilization can take place (Alfa et al., 2006,
Weightman and Lines, 2003). It is for this reason that protein contamination is
used as a measurement for the efficacy of cleaning processes, and the European
standard ISO–EN-15883:2006 part 1 provides details on the construction of test
devices, test soils and protein detection methods to assess the efficacy of
washer disinfectors. The protein detection methods named in the standard are
the ninhydrin assay, the BCA assay, and the OPA assay. Each assay binds to a
different part of the protein structure to create different measurable products.
The ninhydrin assay is based on the binding of a ninhydrin molecule to an α
amino acid in a protein to produce Ruhemman’s purple which can be detected
using spectrophotometry (Meyer, 1957). The BCA assay is based upon the
reaction of a protein peptide backbone with copper sulphate in an alkaline
solution (Smith et al., 1985). This process is more sensitive when bicinchoninic
acid is added to chelate with cupric sulphate reduced by the peptide backbone
(Smith et al., 1985). The third recommended method is the reaction of OPA
detergent, in the presence of a fluorescent reagent such as
mercaptoethanosulphanate, with amines in the protein known as the OPA assay
(Roth, 1971). A fluorescence reaction is reported to be a more sensitive method
of detection than spectrophotometry (Verjat et al., 1999).
For the validation of bioanalytical assays, the Food and Drug Administration
(FDA) has detailed experiments to ensure that the assay is able to deliver
accurate measurements (Food and Drug Administration, 2001). These
experiments allow recording of the sensitivity, specificity, and ability to
accurately detect the concentration of unknown substances.
To ensure the aforementioned assays can be used to detect instrument protein
contamination, it is important to undertake the experiments detailed by the FDA
guidelines to ensure the accuracy and reproducibility of results. The aim of this
study was therefore to determine the sensitivity, specificity, and the ability to
calculate the protein concentration of common instrument contaminants. The

Chapter 3 70
protein assay was then assessed in an in situ study by detecting protein
contamination from decontaminated podiatry instruments.

Chapter 3 71
3.2 Results
3.2.1 Sensitivity and linear range of protein assays
For the assessment of the linear range and the sensitivity of the protein assays, a
2 mg/ml solution of bovine serum albumin (BSA) and mucin from the bovine
submaxillary gland (salivary mucin) were prepared by dissolving 20 mg in 10 ml
of RO H2O. A standard curve of protein concentrations 1, 5,10,20,50,100 µg/ml
of protein was prepared in RO H2O. A blank control of RO H2O was also included
in standard curves. To determine the linear range of each protein assay, BSA
concentrations of 50, 100, 250, 500, 1000, 1500, 2000, 2500 µg/ml were
sampled. The r2 value of each graph was calculated using the GraphPad Prism 4
linear regression calculation and the sensitivity was determined using a Kruskal -
-Wallis test of all data points in the graph. The sensitivity was determined as the
data of the protein concentration that was significantly more than the data of
the negative control.
For all assays an increase in BSA protein concentration resulted in a
corresponding linear increase in fluorescent units (FU’s) for the OPA assay
(r2=0.97) (Figure 3-1), and optical density570 OD570 for the ninhydrin (r2=0.98)
(Figure 3-2) and BCA assays (r2=0.99) (Figure 3-3). The OPA and BCA assays had a
minimum sensitivity of 5 µg/ml BSA whilst the ninhydrin assay had a minimum
sensitivity of 10 µg/ml. An increase in salivary mucin concentration resulted in
an increase in FU’s for the OPA assay (r2=0.8) (Figure 3-1) and OD570 for the BCA
assay (r2=0.86) (Figure 3-2) and the ninhydrin assay (r2=0.97) (Figure 3-3), though
a smaller straight line slope than was observed in BSA. The limit of detection
was calculated as 20 µg/ml for the OPA and ninhydrin assays and 10 µg/ml for
the BCA assay. For the BCA assay a linear relationship (r2=0.92) exists from
concentration of 0-1000 µg/ml of protein (Figure 3-4). For the ninhydrin assay, a
linear relationship (r2=0.96) exists to 0-500 µg/ml of protein (Figure 3-5) and the
OPA assay has a linear relationship with BSA concentration from 0-2000 µg/ml
(r2=0.97) (Figure 3-6).

Chapter 3 72
Figure 3-1 BSA and salivary mucin standard curves detected by the OPA assay
diluted in RO H2O. A 2 mg/ml solution of BSA and salivary mucin were prepared
by dissolving 20 mg in 10 ml of RO H2O. A standard curve of protein
concentrations 1, 5,10,20,50,100 µg/ml of protein was prepared in RO H2O. A
blank control of RO H2O was also included in standard curves. The data shown is
the mean of 3 readings from 3 experiments ± StEM. A BSA concentration of 5
µg/ml resulted in significantly (p<0.05) larger values than the negative control
and a salivary mucin concentration of 20 µg/ml resulted in significantly (p<0.01)
larger values than the negative control. The r2 value of the slope was calculated
as 0.97 for the BSA standard curve and 0.8 for the salivary mucin standard curve.

Chapter 3 73
Figure 3-2 BSA and salivary mucin standard curves detected by the BCA assay
diluted in RO H2O. A 2 mg/ml solution of BSA and salivary mucin were prepared
by dissolving 20 mg in 10 ml of RO H2O. A standard curve of protein
concentrations 1, 5, 10, 20, 50, 100 µg/ml of protein was prepared in RO H2O.
The data shown is the mean of 3 readings from 3 experiments ± the StEM. A BSA
concentration of 5 µg/ml resulted in significantly (p<0.001) larger OD570 than the
negative control and a salivary mucin concentration of 10 µg/ml resulted in
significantly (p<0.01) larger OD570 than the negative control. The r2 value of the
slope was calculated as 0.99 for the BSA standard curve and 0.86 for the salivary
mucin standard curve.
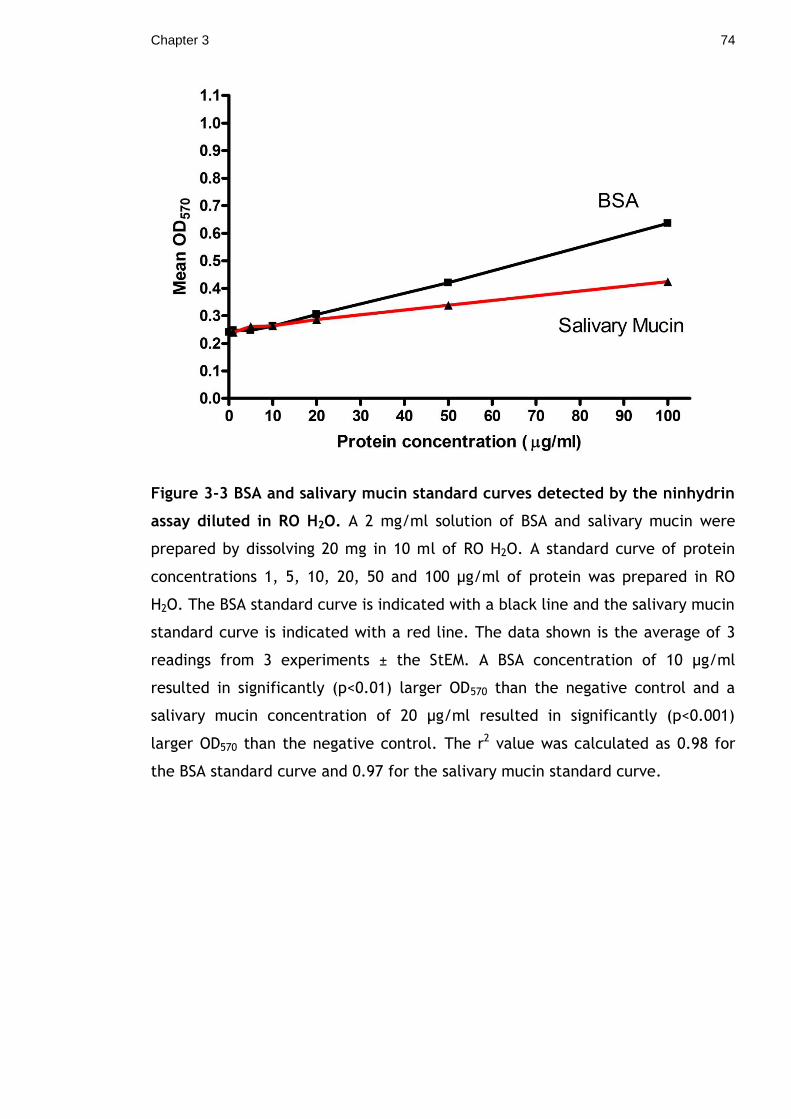
Chapter 3 74
Figure 3-3 BSA and salivary mucin standard curves detected by the ninhydrin
assay diluted in RO H2O. A 2 mg/ml solution of BSA and salivary mucin were
prepared by dissolving 20 mg in 10 ml of RO H2O. A standard curve of protein
concentrations 1, 5, 10, 20, 50 and 100 µg/ml of protein was prepared in RO
H2O. The BSA standard curve is indicated with a black line and the salivary mucin
standard curve is indicated with a red line. The data shown is the average of 3
readings from 3 experiments ± the StEM. A BSA concentration of 10 µg/ml
resulted in significantly (p<0.01) larger OD570 than the negative control and a
salivary mucin concentration of 20 µg/ml resulted in significantly (p<0.001)
larger OD570 than the negative control. The r2 value was calculated as 0.98 for
the BSA standard curve and 0.97 for the salivary mucin standard curve.

Chapter 3 75
Figure 3-4 Linear range of the BCA assay when detecting BSA. BSA
concentrations of 50, 100, 250, 500, 1000, 1500, 2000, 2500 µg/ml were
sampled. The data shown is the mean of 3 readings from 3 experiments ± the
StEM. A linear relationship (r2=0.92) was calculated up to 1000 µg/ml.

Chapter 3 76
Figure 3-5 Linear range of the ninhydrin assay when detecting BSA. BSA
concentrations of 50, 100, 250, 500, 1000, 1500, 2000, 2500 µg/ml were
sampled. The data shown is the mean of 3 readings from 3 experiments ± the
StEM. A linear relationship (r2=0.96) was observed up to 500 µg/ml.

Chapter 3 77
Figure 3-6 Linear range of the OPA assay when detecting BSA. BSA
concentrations of 50, 100, 250, 500, 1000, 1500, 2000, 2500 µg/ml were
sampled. The data shown is the mean of 3 readings from 3 experiments ± the
StEM. A linear relationship (r2=0.97) was observed up to 2500 µg/ml.

Chapter 3 78
3.2.2 Protein concentration of unknown biological samples
Unstimulated saliva was collected separately from 3 male volunteers. Each
sample was centrifuged for 15 min at 9971 g in a MSE Microcentaur (Sanyo
Loughborough, UK) and the supernatant removed. The supernatants were
combined and mixed by vortexing. A 1/10 dilution was made in RO H2O and a
sample taken for the ninhydrin, OPA, and BCA assay. Bovine serum, with a
reported protein concentration of 45 – 60 mg/ml, was diluted 1/100 in RO H2O
and samples taken for each of the assays. Defibrinated horse blood was diluted
1/1000 in RO H2O and samples taken for each assay.
Salivary protein concentration was detected as 1.8 mg/ml when sampled with
the BCA assay and 1.3 mg/ml with the ninhydrin assay. The OPA assay detected
the protein concentration of the saliva samples as 3.9 mg/ml (Table 3-1). For
bovine serum, the protein concentration was detected as 53 mg/ml by the OPA
assay, 49 mg/ml by the BCA assay and 37 mg/ml for the ninhydrin assay (Table
3-2). For defibrinated horse blood, the OPA assay detected the protein
concentration as 121 mg/ml, the BCA assay as 119 mg/ml and the ninhydrin
assay as 276 mg/ml (Table 3-3). For unknown BSA concentrations, the OPA assay
detected a 20 µg/ml solution was detected as a median of 23.07 µg/ml , a 60
µg/ml solution was detected as 62.64 µg/ml and a 80 µg/ml solution was
detected as 80.79 µg/ml (Table 3-4).
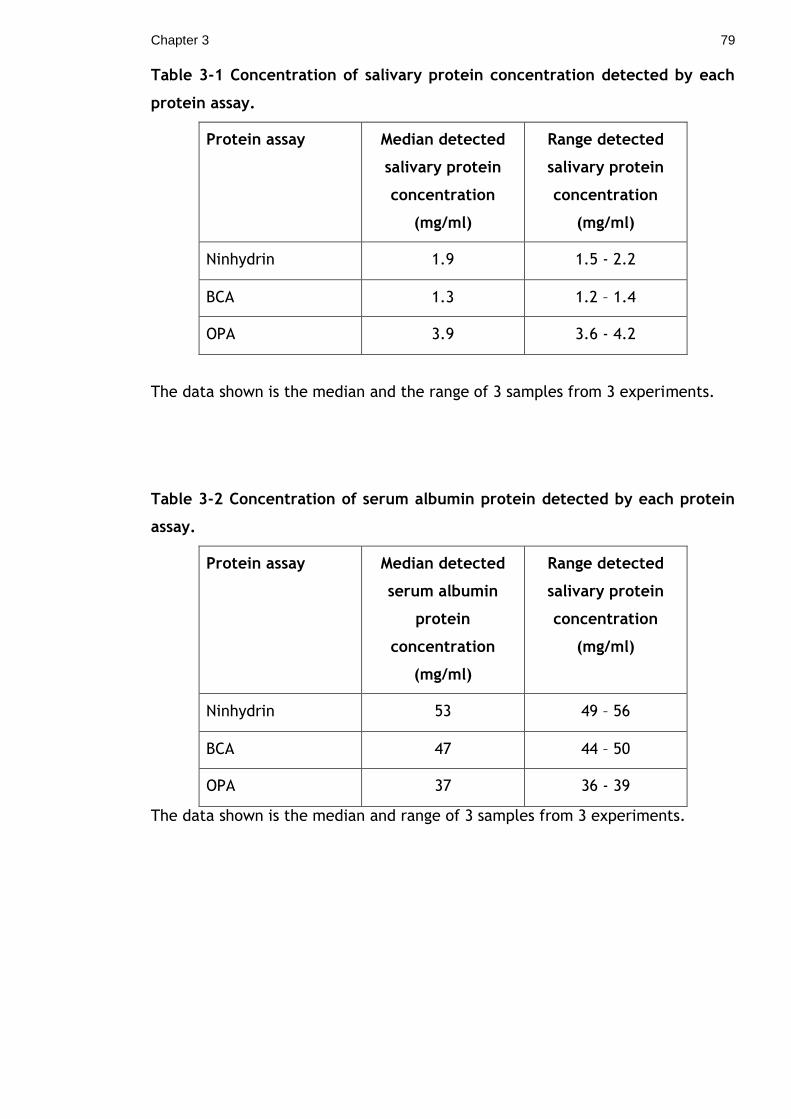
Chapter 3 79
Table 3-1 Concentration of salivary protein concentration detected by each
protein assay.
Protein assay Median detected
salivary protein
concentration
(mg/ml)
Range detected
salivary protein
concentration
(mg/ml)
Ninhydrin 1.9 1.5 - 2.2
BCA 1.3 1.2 – 1.4
OPA 3.9 3.6 - 4.2
The data shown is the median and the range of 3 samples from 3 experiments.
Table 3-2 Concentration of serum albumin protein detected by each protein
assay.
Protein assay Median detected
serum albumin
protein
concentration
(mg/ml)
Range detected
salivary protein
concentration
(mg/ml)
Ninhydrin 53 49 – 56
BCA 47 44 – 50
OPA 37 36 - 39
The data shown is the median and range of 3 samples from 3 experiments.
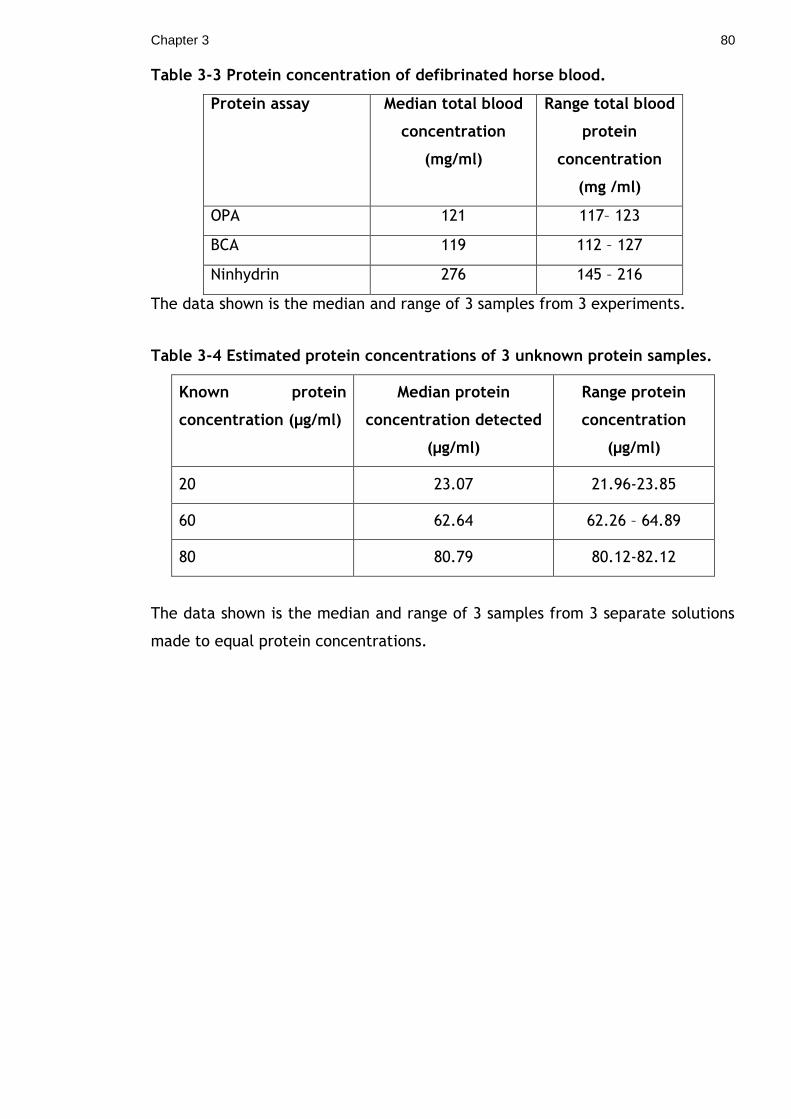
Chapter 3 80
Table 3-3 Protein concentration of defibrinated horse blood.
Protein assay Median total blood
concentration
(mg/ml)
Range total blood
protein
concentration
(mg /ml)
OPA 121 117– 123
BCA 119 112 – 127
Ninhydrin 276 145 – 216
The data shown is the median and range of 3 samples from 3 experiments.
Table 3-4 Estimated protein concentrations of 3 unknown protein samples.
Known protein
concentration (µg/ml)
Median protein
concentration detected
(µg/ml)
Range protein
concentration
(µg/ml)
20 23.07 21.96-23.85
60 62.64 62.26 – 64.89
80 80.79 80.12-82.12
The data shown is the median and range of 3 samples from 3 separate solutions
made to equal protein concentrations.

Chapter 3 81
3.2.3 Effect of handpiece lubricating oil and alcohol on protein
detection assays
To determine the effect of lubricating oil and alcohol, the BCA assay was
sampled with a 100 µl sample of HP lubricating oil (W & H, St Albans, UK) and
100 µl of HP cleaning solution (W & H, St Albans, UK). A sample of RO H2O and
100 µg/ml of BSA were also sampled as controls. The experiment was repeated
with the ninhydrin assay with 500 µl volumes and the OPA assay with a 20 µl
volume of each solution. For the BCA assay and the ninhydrin assay, both W&H
manufactured lubricating oil and cleaning solution alone resulted in OD570 values
significantly (p<0.001) more the ROH2O negative control. For the OPA assay, no
significant difference was found between the ROH2O negative control and the
lubricating oil and cleaning solution.

Chapter 3 82
3.2.4 In situ comparison of automated versus manual cleaning of
instruments
For assessment of the OPA assay at detecting instrument protein, a total of 378
podiatry instruments decontaminated using an LDU and a CDU (Table 2-2)
process were assessed for protein contamination. A total of 126 pear burs, 126
Blacks files and 126 Diamond Deb files (Figure 2-2) were collected for the study
after single use and randomly allocated into two groups for reprocessing. The
first group was subjected to routine cleaning and sterilization by LDU’s (Table
2-2) and the second group were subjected to reprocessing by the CDU at
Cowlairs (Table 2-2). Individual Blacks and Diamond Deb files were placed in a
sterile plastic bag (Seward, UK), whilst each Pear bur was added to a sterile 25
ml Universal tube (Corning, UK). Residual protein was desorbed from each
instrument by immersion in a standardised volume of 1% (v/v) SDS (Sigma UK),
and for Pear burs only the working end was immersed. Each instrument was
subjected to sonication at 35 kHz for 30 min in an ultrasonic bath (Thermofisher
Fisherbrand® 11021) (Smith et al., 2005) and the protein desorbed measured
using the OPA assay (Section 2.3.1.3) compared to a BSA standard curve (Section
3.2.1).
A total of 58/63 Pear burs, 48/63 Blacks files and 31/63 Diamond Deb files
reprocessed by CDU contained greater than 5 µg/instrument of detectable
protein. Protein was also detected in 62/63 Pear burs, 53/63 Black files, and
56/63 Diamond Deb files reprocessed by LDU (Figure 3-7). Instruments
reprocessed by the CDU (median 21 µg/instrument range <5 -5705
µg/instrument) had significantly less residual protein than instruments
reprocessed by the LDU (median 117 µg/instrument range <5 – 6344
µg/instrument) when all three instruments were grouped (p<0.001 (Figure 3-7).
For individual instruments, the median quantity of protein detected on Pear burs
(Figure 3-8) reprocessed by CDU was significantly lower (median 11
µg/instrument range <5-161.7 µg/instrument) than those by LDU (median 77
µg/instrument, range <5–1403 µg/instrument p<0.001). The median quantity of
protein detected on Blacks files (Figure 3-9) reprocessed by CDU (median 64.52
µg/instrument, range <5-1113 µg/instrument) exhibited no significant difference

Chapter 3 83
compared to protein detected on Blacks files by LDU (median 50.81
µg/instrument, range <5-633.5 µg/instrument). The median quantity of protein
detected on Diamond Deb files (Figure 3-10) reprocessed by CDU was
significantly lower (median <5 µg/instrument, range <5 – 5705 µg/instrument)
than Diamond deb files reprocessed by LDU (median 711.8 µg/instrument, range
<5 – 6344 µg/instrument) (p<0.05). However, residual protein was still detected
from these instruments, as the mean of these was 512 µg/instrument for CDU
reprocessing compared to 1159 µg/instrument for LDU reprocessing, indicating
that a small proportion of CDU samples contained elevated levels of residual
protein.

Chapter 3 84
Figure 3-7 Residual protein isolated from all instruments after reprocessing
by both methods. Protein was desorbed from all instruments by immersion in 1%
(v/v) SDS and sampled using the OPA assay.. The distribution of data was
confirmed using a Kolmogorov Smirnov test, and data was compared using a
Mann-Whtiney U test with the significance determined using a 2-tailed Monte
Carlo estimation. Significantly less protein is recovered from instruments
reprocessed using the CDU method (***= p<0.001) compared to instruments
reprocessed using the LDU (Table 2.2). The mean of datasets is represented by a
horizontal line.

Chapter 3 85
Figure 3-8 Total residual protein recovered from individual Pear burs
reprocessed by both methods. Protein was desorbed from all instruments by
immersion in 1% (v/v) SDS and sampled using the OPA assay. The distribution of
data was confirmed using a Kolmogorov Smirnov test, and data was compared
using a Mann-Whtiney U test with the significance determined using a 2 tailed
Monte Carlo estimation. Significantly less protein is recovered from instruments
reprocessed using the CDU method (***= p<0.001) compared to instruments
reprocessed using the LDU (Table 2.2). The mean of datasets is represented by
a horizontal line.

Chapter 3 86
Figure 3-9 Total residual protein recovered from individual Blacks files
reprocessed by both methods. Protein was desorbed from all instruments by
immersion in 1% (v/v) SDS and sampled using the OPA assay. The distribution of
data was confirmed using a Kolmogorov Smirnov test, and data was compared
using a Mann-Whitney U test with the significance determined using a 2 tailed
Monte Carlo estimation. No significant difference was found on protein
recovered from instruments reprocessed using the CDU method and the LDU
(Table 2.2). The mean of datasets is represented by a horizontal line.

Chapter 3 87
Figure 3-10 Total residual protein recovered from individual Diamond deb
files reprocessed by both methods Protein was desorbed from all instruments
by immersion in 1% (v/v) SDS and sampled using the OPA assay. The distribution
of data was confirmed using a Kolmogorov Smirnov test, and data was compared
using a Mann-Whitney U test with the significance determined using a 2-tailed
Monte Carlo estimation. Significantly more protein was detected on instruments
reprocessed using the LDU process (***=p<0.001) than instruments reprocessed
using the CDU process (Table 2.2). The mean of datasets is represented by a
horizontal line.
Chapter 3 88
3.3 Discussion
Cleaning validation of washer disinfectors rely on the detection of protein using
the ninhydrin, the BCA and the OPA assays. This standard defines an acceptable
cleaning level as below the detection limit of one of three assays, which are
stated as 2 mg/m2 for the ninhydrin assay, 30 – 50 µg for BCA, and 0.003 µmol of
OPA sensitive amino groups for the OPA assay (BS-EN-ISO-15883, 2006). The
validation of protein assays can be accomplished using the FDA bioanalytical
guidelines, which detailed the experiments performed in this study, i.e.
assessing the sensitivity. The range of detection of the assays, the ability to
detecting common dental instrument protein contamination, and the
interference by common HP maintenance solutions that may be present during
HP sampling (Food and Drug Administration, 2001).
BSA is commonly used as protein standards to compare unknown protein samples
(Smith et al., 2005), especially for detecting blood contamination (Doumas,
1975) which is a common contaminant of the instruments sampled and is present
in all test soils described by the BS-EN ISO -15883:2006.
The BCA and the OPA assays showed a sensitivity of 5 µg/ml of protein and the
ninhydrin assay had a sensitivity of 10 µg/ml. This was the minimum BSA
concentration that did not result in an OD significantly greater than the negative
control. Based on the difference in sample volumes required for each reaction,
the OPA assay can detect 100 ng of protein, the BCA assay can detect a
minimum of 0.5 µg of protein and the ninhydrin assay can detect a minimum of 5
µg of protein. The sensitivity of the BCA assay was identical to that stated by the
manufacturer (Pierce Biotechnology, 2009) and in previous studies (Smith et al.,
1985). The ninhydrin assay has a reported sensitivity of 9.75 µg when used as a
kit relying on swabbing and visual analysis of the swabs (Lipscomb et al., 2006a).
This figure is similar to the sensitivity observed in this study. The OPA assay has
a reported sensitivity of 1.2 ng of protein (Hammer and Nagel, 1986) and 3.6
µg/ml (Verjat et al., 1999) depending on the method of protein preparation and
the size of sample. The figure obtained by Verjat et al. (1999) was similar to
that observed in this study.

Chapter 3 89
The range of protein detected by each protein assay impacts the concentrations
of protein that can be detected by each assay. The OPA assay had the longest
linear range of 0 – 2500 µg being detected. Since this assay relies on relative
FU’s for protein measurement, it is possible to adjust the protein standards to
appropriate concentrations when larger protein concentrations are expected.
The range of the BCA assay in this study was detected as 0 - 1000 µg/ml, which
is lower than that stated by the manufacturer, 0 - 2000 µg/ml. This study
altered the method by halving the manufacturer total recommended reagent
which had no impact in sensitivity of the assay, but may have impacted on the
reaction products available. The linear range of the ninhydrin assay was the
smallest of the assays sampled.
The ability of each assay to detect salivary mucin, a common salivary protein
was also assessed (Liu et al., 1998). Each assay underestimated the
concentration of salivary mucin shown by the change of sensitivity and line slope
for salivary mucin standard curves. This change in sensitivity may have
implications for detecting salivary protein contamination on instruments.
Salivary mucin is the main constituent of mucins and undergoes post-
translational glycosylation, making any mucin resistant to proteolysis and
therefore may also inhibit the reaction with the protein assays. The BCA and the
ninhydrin assay can detect salivary mucin at a smaller concentration of 10 µg/ml
than the OPA assay, which detects salivary mucin at 20 µg/ml.
The ability of the protein assays to detect common instrument contaminants was
assessed. The protein concentration of each sample was unknown for the
purposes of the study. For the determination of protein concentration of human
saliva, the OPA assay detects a higher level of protein concentration than the
BCA and the ninhydrin assay. Human salivary protein concentration has been
calculated as 1.8 mg/ml (Lamanda et al., 2007), 1.07 mg/ml (Narhi et al.,
1994), and 6.68 mg/ml (Agha-Hosseini et al., 2006). Each of the findings was
assessed by the Bradford assay, based on the binding of Coomassie dye to the
amine groups of the protein (Bradford, 1976). Salivary protein concentration has
many variables that would have an effect on salivary protein studies including
age, sex, saliva stimulation, diet, and health. The findings from this study from
the ninhydrin and the BCA assay are similar to those reported by Lamanda

Chapter 3 90
(2007), although the OPA assay calculates the same salivary samples as having
double the protein concentration. This may be due to cross reactivity with a
salivary component and this phenomenom may lead to an over estimation of
salivary protein concentration by the OPA assay.
The ability of each assay to detect blood protein and serum protein
concentration was assessed. Blood contamination can also be detected using the
Kastle-Meyer test and visual contamination (Lowe et al., 2002, Zuhlsdorf and
Martiny, 2005) though these methods do not allow quantitative measurement of
the blood proteins. The BS-EN-ISO-15883:2006 standard relies on visual
contamination and the detection of any blood protein using the 3 protein assays.
The OPA and the BCA assay both detected a similar protein concentration when
defibrinated horse blood though the ninhydrin assay estimates the blood protein
contamination as double that of the other assays. The haemoglobin in blood is
known to interfere with the ninhydrin assay, which may be due to the presence
of interfering substances in the blood solution (Burzynski, 1969). The protein
concentration of bovine serum is reported between 45 to 75 mg/ml as detected
by the Biuret reaction by the manufacturer. All protein assays detect a protein
concentration within these limits and the BCA and OPA assay both detect similar
protein concentrations. For the unknown BSA concentrations only the OPA assay
was assessed due to its sole suitability for assessing HP contamination. All the
concentrations were detected within the 15% of the known protein
concentration further validating the suitability of the OPA assay for HP protein
analysis.
Lubricating oil and cleaning alcohol, both essential parts of HP maintenance,
both react when in contact with the BCA and the ninhydrin assay. This implies
that each solution contains a chemical that cross reacts with both of the assays.
The BCA assay will show a positive reaction in the presence of any copper
chelating agent such as dimethyl sulfoxide (DMSO) or any agent that changes the
pH of the BCA reagent (Smith et al., 1985). The ninhydrin assay can also react
with aldehydes, ketones, keto acids, and monosaccharide’s (Schilling et al.,
1963), which result in a false positive reaction. The lubricating oils specific
composition is not known, however, the material safety data sheet (MSDS)
indicates the presence of ester oils that contain amino acids that can react with

Chapter 3 91
the ninhydrin assay. The cross reaction with these products with the BCA and
the ninhydrin assay has implications for the use of these assays to detect protein
contamination in a HP. Lubricating oil and cleaning alcohol are part of routine
handpiece reprocessing and the positive reactions may falsely indicate protein
contamination. No such cross reactivity was found with the OPA assay,
indicating its sole suitability for assessing handpiece protein contamination.
The OPA assay was subsequently used to detect protein contamination of 3
different podiatry instruments, pear burs, Blacks files and diamond deb files
(Figure 2-2). Each instrument has a complex surface topography and each is
exposed to skin and protein during routine use. This makes them ideal
instruments for the validation of the OPA assay to detect protein contamination
from decontaminated instruments and validate 2 currently used podiatry
decontamination processes.
When all podiatry instruments were grouped, the CDU instruments were found to
contain significantly less residual protein than an identically sized group of
instruments reprocessed by the LDU. The reason for the difference in cleaning
efficacies between the CDU and the LDU are multifactorial and include a more
robust validation process for the automated washer disinfectors in use at the
CDU. Other factors include an increased cleaning process time in the CDU (11
min- CDU compared to 6 min - LDU), different cleaning chemistries used, the
differences in form of energy used in cleaning processes, and different
temperatures used during the wash stage.
Similar patterns of cleaning efficacy were observed within each group of
instruments with the exception of Blacks files, which may be due to the smaller
ridged surface area compared to the more complex surface topography
associated with the other instruments. This characteristic has been associated
with increased retention of contamination by surface analysis of endodontic files
which also have a ridged surface topography (Smith et al., 2002).
If using the BS-EN-ISO-15883 standard as a threshold for cleanliness for
reprocessed instruments, a total of 68/189 instruments reprocessed by CDU and
19/189 instruments reprocessed by the LDU would be deemed to be clean. The
Chapter 3 92
number of clean instruments may drop considerably if more sensitive analytical
procedures were employed.
The data reported herein highlights the superiority of the CDU process in terms
of cleaning efficacy at reprocessing more complex instruments and shows the
suitability of the OPA assay at detecting protein contamination isolated from
instruments. Previous studies have focused on the efficacy of CDU reprocessing
by assaying a range of surgical instruments containing residual protein that was
detected after reprocessing (Murdoch et al., 2006, Smith et al., 2005). The
protein content of different surgical instruments, including metzenbaum scissors
and forceps, ranged from 163 to 756 µg, which is similar to that reported herein
(Murdoch et al., 2006, Baxter et al., 2006). Similarly, a study on reprocessed
dental endodontic files, which have a complex surface topography, showed a
range of protein from 0.2 to 63.2 µg, similar to those levels observed on the Pear
burs (Smith et al., 2005).
In order to improve validation of instrument reprocessing from visual inspection
and published standards, techniques with greater quantitative sensitivity have
emerged. Examples include a fluorescent microscopy technique involving
visualisation of protein by SYPRO ruby staining capable of detecting 85 pg of
protein on a surface area of 1mm2 which is significantly lower than the
sensitivity of 5 µg/instrument reported in this study (Lipscomb et al., 2006b). A
standard for cleanliness when considering protein contamination should be
dependent on the procedures undertaken by the instrument. The total protein
recovered from the podiatry instruments would be equivalent to a large number
of prion infectious units (Lipscomb et al., 2006a).
Each protein assay has been assessed for its suitability at detecting common
dental contaminants. While each has its short comings, each assay is a cheap
method that can be reproduced in a sterile services department. The OPA
method validated in this study requires a small protein sample, a short
preparation time, identical sensitivity to commercial kits and has a longer linear
range than both the BCA commercial kit and the ninhydrin solution. The
ninhydrin and the BCA assay both failed the FDA bioanalytical standards due to
false positive reactions of the lubricating oil and alcohol cleaning solution of the

Chapter 3 93
dental HP. Constant work is needed to further validate and improve protein
detection tests to ensure the validated cleaning of instruments and to determine
cross contamination risks of all invasive surgical instruments.

Chapter 4
4 Chapter 4: Quantitative and Qualitative Analysis
of Microbial Contamination of Dental
Handpieces

Chapter 4 95
4.1 Introduction
During routine use, HP’s are contaminated from the external environment
through a variety of means, including negative pressure created by the
deceleration of the turbine when the air supply is stopped (Matsuyama et al.,
1997) and from the dental unit water line that provides cooling water to the burs
(Atlas et al., 1995). The HP contaminants internalised may be expelled during
subsequent re-use and may provide a cross-infection risk if decontamination
procedures are not undertaken. The reprocessing of HP’s is challenging due to
the complex internal structures, narrow lumens and lack of disassembly after
use (Lewis and Boe, 1992).
The oral cavity is home to a large number of bacteria which grow on the non
shedding tooth surface in the form of a biofilm (Paster et al., 2001), and the in-
vivo contamination of dental instruments and HP’s with bacteria has been
reported since the 1800’s and reviewed specifically for HP’s as early as 1924
(Miller, 1891, Appleton Jr and L, 1924). Since these early studies HP’s have been
developed with more diverse uses, and manufacturers have attempted to
implement design features to prevent the internalisation of contamination (Hu
et al., 2007b). New decontamination technologies such as washer disinfectors
and vacuum sterilizers have also provided automated, reproducible cleaning,
and sterilization for the internal HP parts (Andersen et al., 1999). Despite these
advances, bacteria have been reported to be isolated from HP’s prior to
decontamination in an in vivo study, conducted as recently as 2007 (Herd et al.,
2007). New techniques for the isolation and identification of bacteria have also
been developed that increase the sensitivity of recovery and can identify
bacteria that are non-culturable (Bjerkan et al., 2009).
It is important to determine the typical microbial contamination of routinely
used HP’s before and after the cleaning and sterilization process to understand
the current biological and chemical challenges to these processes. Knowledge of
the HP contaminants prior to decontamination will inform the development of
cleaning processes and chemicals whilst any contaminants remaining after
decontamination will inform on risk assessment and cross contamination issues.
Chapter 4 96
The aim of this study was to undertake a quantitative and qualitative analysis of
the bacterial contamination of the internal parts of used unprocessed and
decontaminated air turbine, low speed, and surgical HP’s from a dental hospital
and a HP repair facility utilising culture and culture independent techniques.

Chapter 4 97
4.2 Results
4.2.1 Relationship between bacterial colony forming units and
optical density
To determine the relationship between CFU and OD, S. epidermidis and P.
aeruginosa type strains (Table 2-5) were cultured as detailed in section 2.2.3.
Each culture was centrifuged at 2215g for 10 min in a MSE Centaur 1 centrifuge
(Sanyo Loughborough, UK), the supernatant was removed and the cells
resuspended in 10ml of sterile PBS. The OD of the resuspended culture was
determined using a Colorimeter model 45 spectrophotometer (Fisher Scientific,
Longborough UK) and the culture diluted to OD’s of 0.2, 0.25 and 0.3. Each OD
sample was given 3x 1/10 serial dilutions in sterile PBS and 3 x 10 µl samples of
each dilution were plated onto a BA plate and incubated aerobically overnight at
37°C.
An increase in OD resulted in an increase in CFU for S. epidermidis (Figure 4-1
and P. aeruginosa (Figure 4-2). An OD of 0.4 was equivalent to 1x10⁸ cfu for S.
epidermidis and 0.2 for P. aeruginosa.

Chapter 4 98
Figure 4-1 Relationship between S.epidermidis CFU/ml and OD. Cultures of S.
epidermidis were diluted to appropriate OD values, diluted and cultured to
determine the CFU/ml of each OD. An increase in OD results in an increase in
CFU/ml.
Figure 4-2 Relationship between P. aeruginosa CFU/ml and OD. Cultures of P.
aeruginosa were diluted to appropriate OD values, diluted and cultured to
determine the CFU/ml of each OD. An increase in OD results in an increase in
CFU/ml.

Chapter 4 99
4.2.2 Minimum inhibitory concentration of handpiece lubricating
oil and cleaning solution
To determine the minimum inhibitory concentration (MIC) of HP lubricating oil
and cleaning solutions, S. epidermidis, S. aureus, P. aeruginosa, S. mutans, S.
salivarius, S. sanguinis, and C. albicans type strains (Table 2-5) were cultured as
detailed in section 2.2.3. Each culture was centrifuged for 10 min at 2215 g in a
MSE Centaur 1 centrifuge (Sanyo Loughborough, UK) and resuspended in 10ml of
sterile PBS. Each microbial culture was diluted to equivalent of 1 x10⁵ CFU/ml
(Section 4.2.1). The C. albicans culture was given 2x 1/10 serial dilutions and 8
µl of the 1/100 dilution was added to a hemocytometer for cell counting. The C.
albicans culture was then diluted to a concentration of 1 x10⁴ CFU/ml. A total of
100µl of MH broth for sampling bacteria or RPMI broth for sampling C. albicans
was added to each well of 4 rows and columns 2-12 of a clear flat bottomed 96
well plate. A 100 µl sample of lubricating oil (W&H, Burmoos Austria) or cleaning
solution (W&H, Burmoos Austria) was added to column 1 of the 96 well plate and
given 9x 1/2 serial dilutions by adding 100 µl of the oil or alcohol to the 100 µl of
broth in column 2 and repeating up to column 10. A 100 µl sample of bacteria or
C. albicans was added to four rows of columns 1-10 and column 12 as a positive
control. Each plate was incubated overnight aerobically at 37 °C and the growth
of each well measured using a Sunrise™ plate reader (Tecan Mannedorf,
Swtizerland) at OD670.
Growth was observed for all strains when exposed to all concentrations of
lubricating oil. Cleaning solution had an inhibitory growth effect on all strains
tested (Table 4-1).

Chapter 4 100
Table 4-1 MIC of HP maintenance solutions.
Organism Lubricating oil MIC
(% Solution)
HP Cleaning Solution MIC
(% Solution)
S. epidermidis No Inhibition 6.25
S. aureus No Inhibition 6.25
P. aeruginosa No Inhibition 3.125
C. albicans No Inhibition 3.125
S. mutans No Inhbition 6.25
Data shown is representative of 3 replicates from 3 experiments.

Chapter 4 101
4.2.3 Sensitivity of extraction methods
To determine the sensitivity of extraction methods S. epidermidis of
concentrations 1x101, 1x10², 1x10³, 1x10⁴, 1x10⁵ and 1x10⁶ CFU/ml were
inoculated on the surface of decontaminated SSS (Section 2.5.1.1). Sterile PBS
was added to SSS’s as negative controls. Each SSS was dried for 2h in a laminar
flow cabinet. A total of 3 SSS’s were sampled by swabbing and 3 SSS’s of each
concentration sampled by sonication. For sonication, each SSS was added to a
sterile Bijoux tube (Sterilin, Caeriphilly UK) and each tube was inserted into a
Fisherbrand® 11021 sonic bath (Fisher Scientific, Loughborough UK) filled with
ROH2O and sonicated for 5 min at 35 kHz (Smith et al., 2005). For swabbing,
sterile swabs were soaked in sterile PBS and the SSS surfaces were swabbed for 5
sec which was the length of time needed to cover the surface 3 times. Each
swab head was then immersed in 1 ml of sterile PBS and vortexed for 5 min. The
eluents were then given 3 x 1/10 serial dilutions and a 10 µl sample of each
dilution was added to a BA plate and the plates incubated overnight at 37°C
under 5% CO2 (Binder, Tuttlingen Germany).
No growth was detected on the negative control samples. Swabbing of SSS’s
resulted in 67% less recovery of S. epidermidis than the sonication technique
(Table 4-2). For swabbing, no bacteria were recovered at a starting
concentration of x104 CFU’s and for sonication no bacteria were recovered from
a starting concentration of x102 CFU’s.
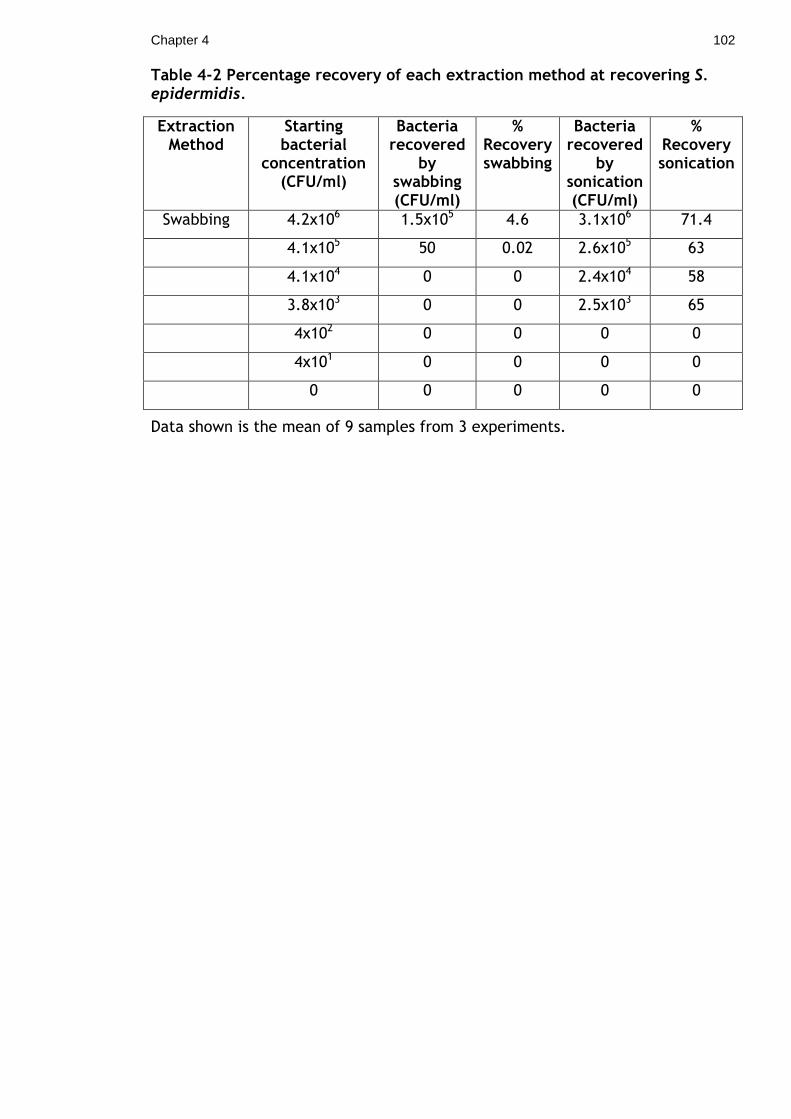
Chapter 4 102
Table 4-2 Percentage recovery of each extraction method at recovering S. epidermidis.
Extraction Method
Starting bacterial
concentration (CFU/ml)
Bacteria recovered
by swabbing (CFU/ml)
% Recovery swabbing
Bacteria recovered
by sonication (CFU/ml)
% Recovery sonication
Swabbing 4.2x10⁶ 1.5x10⁵ 4.6 3.1x10⁶ 71.4
4.1x10⁵ 50 0.02 2.6x10⁵ 63
4.1x10⁴ 0 0 2.4x10⁴ 58
3.8x10³ 0 0 2.5x10³ 65
4x10² 0 0 0 0
4x101 0 0 0 0
0 0 0 0 0
Data shown is the mean of 9 samples from 3 experiments.

Chapter 4 103
4.2.4 Microbial contamination of Glasgow Dental Hospital dental
handpieces
No bacteria were isolated from the negative controls. Before decontamination,
bacteria were isolated from a total of 38/40 turbines (median 200
CFU/instrument, range 0 – 1.9x10³ CFU/instrument), 37/40 spray channels
(median 400 CFU/instrument, range 0 – 1x10³ CFU/instrument), and 18/20
surgical gears (median 1x10³ CFU/instrument, range 0 – 3.7x10⁴ CFU/instrument)
(Figure 4-3). The majority of organisms isolated from each location were CONS
with oral streptococci, Staphylococcus aureus, Gram positive bacilli,
Pseudomonas spp. and Propionibacterium acnes (Figure 4-4, Figure 4-5, Figure
4-6, Table 4-3). ). A total of 11 P. acnes isolates from GDH HP’s were identified
by typing (Table 4-4). After decontamination, bacteria were isolated from 5
spray channels (median 30 CFU/instrument, range of 0 – 1.5x10²
CFU/instrument) (Figure 4-3). No bacteria were isolated from decontaminated
turbines and surgical gears.

Chapter 4 104
Figure 4-3 Number of bacteria isolated from each HP part. Internal HP parts
were sampled for bacteria before and after decontamination including
sterilization. Each part was cultured for aerobic and facultative anaerobic
isolates. Before decontamination, surgical HP gears contained the most bacteria
with a median of 1x10³ CFU compared to a median of 200 and 400 CFU for used
unprocessed turbines and spray channels respectively. After decontamination
(Table 2.2), no bacteria were isolated in turbines and surgical gears whilst a
median of 30 CFU of bacteria was isolated from decontaminated spray channels
which was a significant reduction (**p<0.01). The mean of datasets is
represented by a horizontal line.

Chapter 4 105
Figure 4-4 Total number of isolates from high speed turbines. Bacteria were
identified using diagnostic microbiology. All isolates were from used,
unprocessed samples. The majority of bacteria isolated were CONS with a total
of 3.8x10⁴ isolates followed by Gram negative bacilli with a total of 7.5x10³
isolates and unidentified fungi with a total of 3.3x10³ isolates from all turbines
sampled. S. aureus, oral Streptococci and P. acnes were isolated in smaller
numbers with a total of 5x10² S. aureus, 2x10² oral Streptococci, and 3.8x10² P.
acnes.

Chapter 4 106
Figure 4-5 Total number of isolates from low speed spray channels. Bacteria
were identified using diagnostic microbiology techniques. Isolates from used,
unprocessed handpieces are highlighted by gray bars and isolates from
decontaminated HP’s are represented by white coloured bars. Before
decontamination, the majority of bacteria isolated were CONS with a total of 3
x104 CFU and unidentified fungi with a total of 3.6x10³ CFU from all spray
channels. After decontamination (Table 2.2), CONS were reduced to 1x10² CFU
whilst no reduction in Gram negative bacilli or P. acnes was observed.
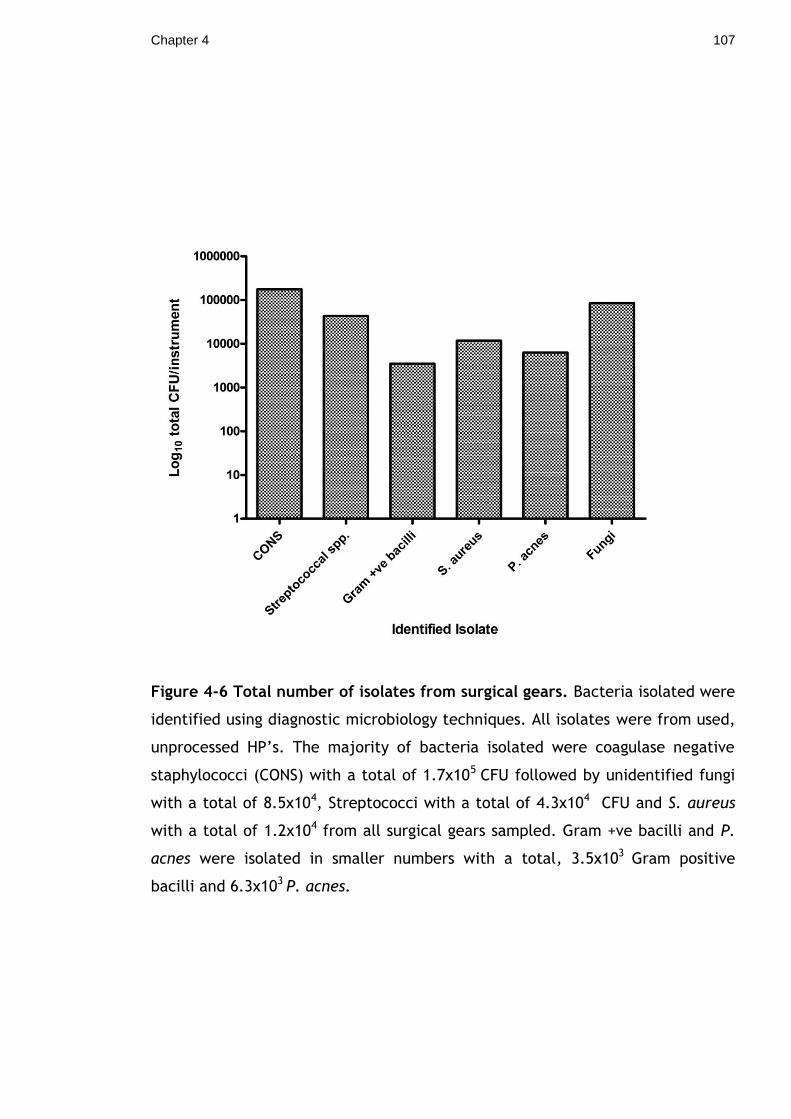
Chapter 4 107
Figure 4-6 Total number of isolates from surgical gears. Bacteria isolated were
identified using diagnostic microbiology techniques. All isolates were from used,
unprocessed HP’s. The majority of bacteria isolated were coagulase negative
staphylococci (CONS) with a total of 1.7x10⁵ CFU followed by unidentified fungi
with a total of 8.5x10⁴, Streptococci with a total of 4.3x10⁴ CFU and S. aureus
with a total of 1.2x10⁴ from all surgical gears sampled. Gram +ve bacilli and P.
acnes were isolated in smaller numbers with a total, 3.5x10³ Gram positive
bacilli and 6.3x10³ P. acnes.

Chapter 4 108
Table 4-3 Isolated organisms identified from each HP part
Handpiece part Identified organisms Number Isolated
(CFU/instrument)
Total Handpiece
Isolates
(CFU/instrument)
High speed
turbine
Leuconostoc spp.
Gamella morbillorum
Streptococcus mutans
Streptococcus gordonii
Pseudomonas stutzeri
Pseudomonas melocina
1x10²
1x10²
1x10²
1x10²
7x10³
1x10²
4.7x10⁴
Low speed
spray channel
Streptococcus
salivarius
Streptococcus oralis
Streptococcus mitis
Staphylococcus aureus
4.4x10³
2x10²
2x10²
4.6x10³
3.9x10⁴
Surgical gear Streptococcus
salivarius
Leuconostoc spp.
Streptococcous
sanguinis
Streptococcus gordonii
Streptococcus mitis
Streptococcus oralis
Streptococcus mutans
5.3x10²
5x10²
5.1x10³
1.8x10²
2.2x10⁴
1.4x10⁴
1x10⁴
2.4x10⁵

Chapter 4 109
Table 4-4 Number of P.acnes types isolated from GDH dental HP’s
P.acnes types Number of P.acnes
types isolates.
IA 1
IB 10
II 0
4.2.5 Microbial contamination of repair facility dental handpieces
A total of 24 W&H TA-98 high speed HP’s, 14 W&H TA-97, 4 W&H TopAir high
speed HP’s, 2 W&H WA56 low speed HP’s and 2 W&H S11 surgical HP’s were
sampled. These HP’s were sent for maintenance and repair and each included a
certificate indicating the HP had been through a decontamination process
though these decontamination processes were unknown.
No bacteria were isolated from the negative controls. Bacteria were isolated
from a total of 20/24 TA- 98 turbines (median 40 CFU/instrument, range 0 –
2.9x10³ CFU/instrument), 12/14 TA -97 turbines (median 140 CFU/instrument,
range 0 – 1.9x10³ CFU/instrument), 4 Topair turbines (median 50
CFU/instrument, range 20 – 140 CFU/instrument), 2 S11 gears (median 1.7x10³
CFU/ instrument, range 150 – 3.4x10³ CFU/instrument) and 2 WA 56 spray
channels (median 270 CFU/instrument, range 40 – 500 CFU/instrument) (Figure
4-8). The majority of organisms isolated from each HP location were CONS whilst
Gram positive bacilli including Bacillus spp, S. aureus, P. acnes and oral
Streptococci were also identified (Figure 4-8, Figure 4-9, Figure 4-10, Figure
4-11, Table 4-5). A total of 12 P. acnes isolates from repair facility HP’s were
identified by typing (Table 4-6).

Chapter 4 110
Figure 4-7 Number of bacteria isolated from each repair facility HP part.
Internal HP parts were sampled for aerobic and facultative anaerobic isolates.
The turbine of high speed HPs, the spray channel of the low speed HP and the
gear of surgical HPs were sampled. Each part was cultured for aerobic and
facultative anaerobic isolates. A single surgical gear had the highest numbers of
bacteria with a value of 3x10⁴ CFU. The mean of datasets is represented by a
horizontal line.

Chapter 4 111
Figure 4-8 Number of Isolates from TA-98 HP’s from repair facility. Bacteria
isolated from the high speed turbines were identified using diagnostic
microbiology techniques. The majority of bacteria isolated were CONS with a
total of 8.5x10⁵ CFU isolated and Gram positive bacilli with a total of 2x10⁴ CFU
from all turbines sampled. Gram negative bacilli and P. acnes were isolated in
smaller numbers with a total of 20 CFU for Gram -ve bacilli and 1x10³ P. acnes
isolated.

Chapter 4 112
Figure 4-9 Number of Isolates from TA-97 HP’s from repair facility. Bacteria
isolated from the high speed turbines were identified using diagnostic
microbiology techniques. The majority of bacteria isolated were coagulase
negative staphylococci (CONS) with a total of 5.6x10⁴ CFU and Gram positive
bacilli with a total of 2x10⁴ CFU from all turbines sampled. Streptococcal spp.
and P. acnes were isolated in smaller numbers with a total of 1.2x10² CFU for
Streptococcal spp. and 1.6x10² P. acnes isolated.

Chapter 4 113
Figure 4-10 Number of isolates from Topair HP’s from repair facility. Bacteria
isolated from the high speed turbines were identified using diagnostic
microbiology techniques. The majority of bacteria isolated were coagulase
negative staphylococci (CONS) with a total of 4.9x10⁴. P. acnes were isolated in
smaller numbers with a total of 2x10² CFU.

Chapter 4 114
Table 4-5 Isolated organisms identified from each HP part
Handpiece
type
Bacteria
identified
Number
Isolated (CFU)
Total Handpiece
Isolates (CFU)
S11 –
Surgical
Coagulase –ve
Staphylococci
3.4x10⁴ 3.4x10⁴
WA 56 Low
speed
S. sanguinis 20 5x10²
High speed
TA 98
Bacillus firmus,
Bacillus subtilis,
S. aureus
P. acnes
40
20
1.2x10²
2x10²
5.2x10³
High speed
TA 97
Bacillus pumis
Gamella
morbellorium
Streptococcus
anginosis
Lactococcus
lactis
2x10³
1x10²
1x10²
9.8x10²
2.7x10³

Chapter 4 115
Table 4-6 Number of P.acnes types isolated from repair facility dental HP’s
P.acnes types Number of P.acnes
isolates
IA 3
IB 8
II 1
4.2.6 16S PCR of handpiece eluents
Samples that had been previously sampled by culture were sampled using 16S
PCR (Section 2.2.6). DNA extracted from a swab of a feline oral cavity was used
as a positive control. For decontaminated samples, a used, unprocessed HP
sample was used as a positive control. Negative controls comprised ROH2O and
HP negative control eluents for all experiments (Section 4.2.4). No DNA was
detected in all negative controls (Table 4-7, Table 4-8, Table 4-9, Table 4-10).
For used, unprocessed samples, culture positive surgical HP eluents, all samples
contained 16S DNA (Figure 4-11, Table 4-7). For decontaminated turbines, all
culture negative samples contained 16S DNA Table 4-8, Figure 4-11). For
decontaminated spray channels, both culture positive and culture negative
samples all contained 16S DNA (Table 4-9). For decontaminated surgical gears,
culture negative samples all contained 16S DNA (Table 4-10).

Chapter 4 116
Table 4-7 Number of bacteria isolated from used,unprocessed samples using
culture techniques and DNA concentration extracted from samples.
HP serial
number
Blood agar
CFU/instrument
FAA agar
CFU/instrument
Concentration
DNA isolated
(ng /ml)
16S DNA
(+/-)
Negative
Control
(DNAse free
H2O)
0 0 0 -
Positive
Control
(Oral swab)
Not Sampled Not Sampled 224 +
06508 175 2.2x10³ 31.57 +
06374 1.4x10³ 875 53.78 +
18007 1x10³ 3 x10³ 82.3 +
18008 525 175 81 +
06372 1.9x10³ 7.5x10³ 107 +

Chapter 4 117
Table 4-8 Number of bacteria isolated from decontaminated turbine samples
using culture techniques and DNA concentration extracted from samples.
HP Serial
number
Blood agar
CFU/instrument
FAA agar
CFU/instrument
DNA
isolated
(ng/ml)
16S DNA
(+/-)
Positive
Control
1x10³ 3 x10³ 82.3 +
Negative
Control
(DNAse
free H2O)
Not Sampled Not Sampled 0 -
Turbine
Control
0 0 0.03 -
24643 0 0 2 +
07862 0 0 1.9 +
56960 0 0 2.8 +
19340 0 0 2.1 +
41517 0 0 2.3 +
56867 0 0 1.8 +
09234 0 0 4.1 +
54995 0 0 1.7 +
09639 0 0 1 +
57013 0 0 1.1 +

Chapter 4 118
Table 4-9 Number of bacteria isolated from decontaminated spray channel
samples using culture techniques and DNA concentration extracted from
samples.
HP Serial
number
Blood agar
CFU/instrument
FAA agar
CFU/instrument
DNA
isolated
(ng/ml)
16S DNA
(+/-)
HP
Positive
Control
1x10³ 3 x10³ 82.3 +
Negative
Control
(ROH2O)
Not Sampled Not Sampled 0 -
Spray
Channel
Control
0 0 0.2 -
53708 0 0 2 +
12385 0 0 1.9 +
05564 420 0 2.8 +
24613 0 0 2.1 +
57825 0 0 2.3 +
19359 240 0 1.8 +
21555 1560 600 4.1 +
03850 120 0 1.7 +
57828 60 0 1 +
58333 0 0 1.3 +

Chapter 4 119
Table 4-10 Number of bacteria isolated from decontaminated surgical gear
samples using culture techniques and DNA concentration extracted from
samples.
Serial
number
Blood agar
CFU/instrument
FAA agar
CFU/instrument
DNA isolated
(ng/ml)
16S DNA
(+/-)
Positive
Control
1x10³ 3 x10³ 82.3 +
Negative
Control
(ROH2O)
Not Sampled Not Sampled 0 -
Surgical
control
0 0 0.03 -
06365 0 0 2.1 +
18010 0 0 0.7 +
18008 0 0 1.8 +
06390 0 0 2.6 +
06500 0 0 1 +

Chapter 4 120
Figure 4-11 16S PCR of used, unprocessed HP’s. Eluents from surgical HP’s
before (a) and after the GDH decontamination process (b) (Table 2-3 Details of
GDH CSSD decontamination process. were sampled for the presence of 16S
DNA. A single band representing the presence of 16S DNA is observed in the
positive control (lane 3) and each HP sample dilution (06372 lanes 4,5,6) (06374
lanes 7,8,9) (06508 lanes 10,11, 12). No bands are visible in the negative control
(lane 2) or the HP negative control (lanes 13, 14, 15). Band sizes are indicated in
bp by the 100bp ladder (lane 1).

Chapter 4 121
4.3 Discussion
Dental HP’s can be used to undertake invasive procedures and although it is the
bur of the HP that is in direct contact with pulpal, gingival and alveolar bone;
the contaminants are internalised into the HP structure (Lewis et al., 1992). If
decontamination procedures are not carried out for internal areas, these
contaminants may be released during subsequent reuse in the form of an aerosol
that may come into contact with patients or healthcare professionals (Rautemaa
et al., 2006). It is for these reasons that the Centres for Disease Control (CDC)
recommend cleaning and heat sterilization of the HP after every patient as
―desirable‖ (CDC - Guidelines for infection control in dental healthcare settings
2003).
To partly justify this recommendation, it is important to determine the common
contaminants of HP’s during routine use. Bacteria are common contaminants of
medical and dental instrumentation and are capable of causing disease if
instruments are not sterilized (Chin et al., 2006). The ability to form a
protective biofilm matrix is associated with increased survivability (Donlan and
Costerton, 2002), resistance to decontamination procedures (Stewart et al.,
2001) and is of concern when instrument decontamination is considered.
Bacteria have been previously isolated from HP turbines, spray channels before
and after decontamination processes (Kellett and Holbrook, 1980) and gears of
low speed handpieces during routine use (Herd et al., 2007).
To access internal HP parts, dismantling is required which may be difficult
without specialist training and tools. Some parts are also challenging to access
without damage to the HP and ensure no contamination during sampling.
Previous studies have therefore relied on the application of swabbing of easily
accessible gears (Herd et al., 2007) or flushing sterile solution through an intact
HP to remove internal bacteria (Kellett and Holbrook, 1980). The sensitivity of
both methods was not stated though the swabbing technique has a variation of
reported sensitivities from 19% (Angelotti et al., 1964) to 87% (Buttner et al.,
2001) for spore recovery.

Chapter 4 122
This study utilised a sonication method which has been previously used for
desorption of bacteria from hip joints (Tunney et al., 1998), catheters (Gorman
et al., 1994), and stents (Keane et al., 1994). Validation work undertaken in this
study has shown that sonication represents an increase in sensitivity when
compared to swabbing methods used in previous studies (Bjerkan et al., 2009,
Herd et al., 2007). This is also reflected in the increased number and species of
bacteria isolated from each location when compared to previous studies with
Chin et al. (2006) isolating a median of 547 CFU and Kellet et al. (1980) isolating
a median of 1.1x10³ cfu /HP from the spray channel and the turbine by rinsing.
Whilst the sonication method can only sample the entire part rather than
targeting specific areas of the surface, the sonication method represents an
improvement in sensitivity and therefore more realistic numbers and species of
bacterial contamination of dental HP parts. The removal of bacteria from the
narrow lumened spray channel by sonication may not be as efficient as the
removal from a flat, open surface. Previous studies have utilised flushing of the
lumen with a sterile saline solution (Kellett and Holbrook, 1980)) and the
insertion of floss directly into the channels (Martiny and Simonis, 2009). The
sensitivity and reproducibility of these methods was not validated in the studies
and sampling of lumens may still present a difficulty.
Dental HP’s from the GDH were sampled before and after decontamination.
Validation experiments indicated that lubricating oil, present before and after
decontamination, did not affect the growth of a range of common HP
contaminants. Cleaning solution, used before the sterilization process, affects
the viability of microorganisms as would be expected due to the presence of
alcohol in the solution.
Before decontamination, HP’s were acquired after transport to the CSSD which
was not undertaken in aseptic conditions until transport to the laboratory. This
study was concerned with the challenge to the HP before decontamination
including any environmental bacteria. Sampling of the negative control HP’s
indicated that no bacteria isolated could be attributed to the passage through
the CSSD facility or by experimental processing. In the repair facility, aseptic
techniques were used due to the lack of a laminar flow cabinet. Negative
controls performed during sampling also indicate that processing using this
method resulted in no contamination from the environment.

Chapter 4 123
All HP’s sampled were selected to be the latest models available at the GDH to
partly standardise the age of the HP’s. Modern HP’s also have design features
such as the hygienic head system to prevent contamination entering the HP
head. Despite the presence of these systems, bacteria were still isolated from
each HP location sampled. Before decontamination, the majority of bacteria
isolated from each GDH HP were CONS which are associated with the oral cavity
and the environment (Jackson et al., 1999). These may cause opportunistic
infections and have previously been isolated from endodontic lesions (Niazi et
al., 2010). Viridians Streptococci including S. mutans, S. oralis and S. sanguinis
are associated with the oral cavity and dental caries (Hintao et al., 2007). The
identified Pseudomonas spp., P. stutzeri and P. mendocina have been previously
isolated from contaminated dental unit waterlines (Singh et al., 2003) and
associated with opportunistic infections (Noble and Overman, 1994, Zaluski et
al., 1999).
P. acnes has been associated from the oral cavity and human skin (McDowell et
al., 2005) where it can cause infections such as acne (Burkhart and Burkhart,
2006) or inflammatory disease in the body if it is present in the bloodstream
(Bayston et al., 2007a). P. acnes have also been associated with prosthetic hip
joint infections and endocarditis (Tunney et al., 1998, Vanagt et al., 2004). P.
acnes has also been isolated from endodontic lesions along with CONS (Niazi et
al., 2010), which has implications for the spread of dental infections. The
majority of P.acnes isolates from the repair facility and the GDH HP’s were type
I which is consistent with types previously isolated from dental infections such as
periodontitis (McDowell et al., 2005). The first differences between P. acnes
types were first characterised by differences in agglutination tests and
differences in cell wall sugars (Johnson and Cummins, 1972). Molecular typing of
the recA gene in isolates has further differentiated the isolates further into type
IA and type IB.It is hypothesised that different P. acnes types produce different
virulence factors with type IB strains associated with a greater expression of co
haemolytic cyclic adenosine monophosphate factor associated with haemolytic
activity (Valanne et al., 2005). A further study into the protein expression by P.
acnes types revealed only 2 proteins that are distinct for type I isolates, a
conserved hypothetical protein with homology to a Corynebacterium protein, an
unidentified protease, and a hypothetical protein specific to P. acnes (Holland et

Chapter 4 124
al., 2010). Whilst it is not clear if expression of these proteins results in greater
virulence, all P. acnes isolates produce proteins associated with tissue
destruction and inflammation (Holland et al., 2010). The surgical HP gear had
the most abundant number of microorganisms of the parts sampled which might
be due to the larger surface area of the gear and the fact that the surgical HP is
used to undertake more invasive procedures and therefore be exposed to more
microorganisms. It is interesting to speculate that the source of nosocomial
P.acnes and CONS causing endodontic infections could be incomplete
decontamination of dental HP’s.
After decontamination, Gram-negative bacilli were the predominant bacteria
isolated from low speed spray channels, and P. acnes were also isolated along
with a smaller number of CONS. This flora selected out by the decontamination
process might be due to the change in environment brought about by
decontamination, may have been flora particular to the HP’s sampled or may
have come from the HP lubricating oil if microorganisms are able to survive upon
exposure. Lubricating oil may not allow steam penetration of the HP and has
been shown to inhibit steam sterilization (Lewis and Boe, 1992). Whilst the spray
channel is not often required for routine low speed HP use and the number of
bacteria isolated were significantly reduced; the presence of bacteria indicate
the lack of a sterile instrument. The bacteria isolated are capable of causing
opportunistic disease and may contribute to cross infection between patients
and represent a marker of a failure in the decontamination process. This finding
requires further investigation including sampling of the environment or the
lubricating oil and a larger number of HP’s to determine if this is a false positive
or an indicator of a deficiency in the decontamination process.
The repair facility HP’s had significantly more CONS than the GDH HP’s. HP’s
sent for repair were sourced from both hospitals and dental practice and it was
not clear how HP’s from each location correlated with the results due to the
need for anonymity. Whilst each HP sent for repair came with documentation
stating that each device has been through a decontamination process, this could
not be verified and decontamination process may vary depending on the HP
source (Smith et al., 2009) Further studies into HP’s used and decontaminated in
dental practices may present different results to that found with GDH HP’s that
are decontaminated by the current best practices for instrument

Chapter 4 125
decontamination (Smith et al., 2009). The bacterial species isolated whilst being
similar to the GDH isolates, also contained more Bacillus spp., less Streptococcal
spp. and L. lactus that is associated with dental caries (Marchant et al., 2001).
The number of bacteria isolated clearly indicates a failure of decontamination
processes. All HP’s were not in working condition and any blockages may inhibit
routine cleaning processes or steam sterilization. The findings highlight the need
for routine HP maintenance to prevent the proliferation of bacteria.
The findings presented herein are similar to the only previous study to identify
HP microbial contamination with CONS, oral Streptococci, Pseudomonas spp and
Bacillus spp among the microorganisms isolated (Kellett and Holbrook, 1980).
The CONS isolates in this study were not identified beyond the species level and
consisted of any Gram positive cocci that were also catalase positive and
coagulase negative. Therefore CONS isolates represented a number of different
species though all with similar resistance to the decontamination process and
characteristics of survival in the environment. Fungi were also only identified to
species level before decontamination. The detection of no bacteria does not
mean that an HP is free of microorganisms and therefore sterile. The survey for
microorganisms may have been limited by the isolation methods used for culture
of organisms. The BA plates were found to grow mostly CONS, and FAA incubated
anaerobically that oral Streptococci and other organisms such as P. acnes were
observed. The use of other media may have allowed for the growth of other
microorganisms that are outcompeted by the fast growing Staphylococci. The
oral cavity is also home to fastidious or non culturable bacteria which would be
missed when culture techniques alone are employed (Hamlet, 2010). It is for this
reason that 16S PCR was employed that detects DNA sequences specific for
bacteria. For the GDH isolates, 16S PCR confirmed the presence of bacterial DNA
in culture positive samples for validation of the method which was also be
applied to culture negative samples. All decontaminated HP samples, including
culture negative samples, were positive for 16S DNA. The presence of 16S DNA
does not indicate viable bacteria and the use of real time PCR for specific
organisms will allow the measurement of gene expression and therefore the
viability of any targeted organisms (Hamlet, 2010).
The study did not attempt to identify viral DNA. The PCR techniques have also
been utilised previously to identify viral DNA from dental HP’s after operation on

Chapter 4 126
patients infected with HIV (Lewis and Boe, 1992) and hepatitis B (Hu et al.,
2007b). Again, the detection of viral DNA does not indicate the presence of
infectious viruses and the detection of viral DNA could be combined with cell
culture studies to measure infectivity of cells and therefore indicate the survival
of viruses (Epstein et al., 1995).
The results before HP reprocessing can inform development of HP
decontamination processes and can result in test soils comparable to in vivo
biofouling for HP reprocessing technologies. Of the current test soils accepted by
the European standard BS ISO/TS, only the German and American test soil
contains a bacterial challenge. The German test soil utilizes a culture of 1011
CFU/ml suspension of Enterococcus faecium and the American test soil contains
Bacillus atrophaeus spores. A test soil specific for dental HP’s could be designed
with knowledge of the bacterial species and counts detailed in this study and
provide a test challenge closer to that found in vivo for any new cleaning
technologies.
In conclusion, dental HP’s are contaminated with environmental and oral
bacteria before and after decontamination in hospital and repair facilities. The
presence of bacteria in HP’s after decontamination procedures is a concern and
routine decontamination procedures of dental HP’s may not be adequate if the
aim is to deliver a sterile instrument at the point of use. Further studies utilising
culture independent techniques would allow a more complete picture of HP
microbial contamination and further detail the cross infection risk to patients
and healthcare professionals.

Chapter 5 127
5 Chapter 5: Quantitative and Qualitative Analysis
of Protein Contamination of Dental Instruments

Chapter 5 128
5.1 Introduction
The decontamination processes of invasive medical instruments are under
constant review as new challenges to instrument reprocessing emerge
(Sehulster, 2004). Research into decontamination processes has recently
incorporated research into protein contamination of instruments (Lipscomb et
al., 2006b), rather than focusing on the presence or absence of bacteria alone
(Lewis et al., 1992). Protein contamination can increase the dissolution of metal
ions by complexing metal ions with proteins which causes corrosion of
instrument stainless steel (Williams et al., 1988, Kocijan et al., 2003). In
addition, residual protein conditioning film may promote the adhesion of
bacteria through specific adhesion receptors, such as fibronectin binding protein
found in Staphylococcus aureus (Piroth et al., 2008). Protein can also inhibit the
sterilization process if not removed during instrument cleaning (Parker and
Johnson, 1995).
The emergence of the heat and chemical resistant prion protein, the causative
agent of CJD, has highlighted the importance of research into protein
contamination of medical instruments. Protein contamination must be removed
by the cleaning stage of the instrument reprocessing cycle (Lipscomb et al.,
2007), as the subsequent disinfection and sterilization stages may fix protein
contamination onto the surface (Nakata et al., 2007). It is for this reason that
protein contamination is used as a marker for cleanliness of instruments and for
the validation of cleaning procedures and technologies. The European standard
BS-EN-ISO-15883 part 1 details protein assays for the detection of protein and a
failure of cleaning is indicated by a positive reaction with one of the assays.
Concerns have recently been raised as to the sensitivity of these protein tests
and how sensitive a test for protein cleanliness should be (Lipscomb et al.,
2006a).
A method of answering this question would be to undertake a qualitative analysis
of typical instrument protein contamination. Whilst quantitative data provides
some insight into instrument contamination levels, a qualitative analysis would
put this information into context by identifying common contaminants that must
be removed by the cleaning process and inform of any cross contamination risk

Chapter 5 129
derived from protein contamination. There is currently a lack of published
literature on qualitative analysis of instrument protein contamination.
A qualitative analysis is possible by desorption of protein from the instrument
followed by precipitation of the sample to allow viewing of the proteins by SDS
PAGE. The SDS–PAGE method allows the separation of protein by size to allow
identification by MS or Western blotting.
This study aimed to undertake validation work to develop a method that would
allow the extraction, precipitation and detection of protein from instrument
surfaces before employing these techniques to undertake a quantitative and
qualitative analysis of protein contamination of dental extraction forceps and
dental HP’s.

Chapter 5 130
5.2 Results
5.2.1 Validation of protein extraction methods
To assess the sensitivity of 1% (v/v) SDS solution, 1% (v/v) Decon® 90 (Decon®
Laboratories, Hove, UK) and a 0.1M NaOH solution (Fisher scientific,
Loughborough UK) at removing BSA from a SSS, a total of 9 prepared SSS’s
(Section 2.5.1.1) were inoculated with a 10 µl solution of 100 µg of BSA. These
were placed in a clear flat bottomed Costar™ 24 well plate and air dried for 16 h
at room temperature of 22°C representing the length of time instruments can be
left for central reprocessing (Plinston et al., 2007). Prepared SSS’s were
incolulated with 10 µl of ROH2O as controls. All SSS’s were inserted into sterile
Bijoux tubes (Sterilin, Caeriphilly UK). SSS’s inoculated with protein and a
negative control were immersed in 1 ml of 1% (v/v) SDS solution, 1 ml of 1%
(v/v) Decon™ 90 or 0.1M NaOH 0.1 pH 9.2. The remaining SSS’s and negative
control were immersed in Decon™ 90 solution (Smith et al., 2005). Bijoux tubes
containing 1% (v/v) Decon™ 90 and 1% (v/v) SDS were inserted into a
Fisherbrand® 11021 sonic bath (Fisher Scientific, Loughborough UK) filled with
ROH2O and sonicated for 30 min at 35 kHz (Smith et al., 2005). Tubes containing
0.1M NaOH and 1% (v/v) SDS was immersed in a water bath (Grant Instruments,
Cambridge UK) containing ROH2O and boiled for 10 min at 100°C (Imamura et
al., 2003). Each eluent was sampled for protein using the OPA assay (Section
2.3.1.3) and SDS- PAGE (Section 2.3.3).
No protein was isolated from the negative controls (n=3). Boiling in 1% (v/v) SDS
resulted in more protein recovery than 1% (v/v) Decon, 0.1M NaOH and
sonication in 1% (v/v) SDS (
Table 5-1). Boiling in 0.1M NaOH resulted in the least protein recovery of all
methods sampled. BSA recovery from the stainless steel surface by boiling and
sonication in 1% (v/v) SDS and sonication in 1% Decon was visualised by SDS-PAGE
with BSA being visible in all samples (Figure 5-1).

Chapter 5 131
Table 5-1 Efficacy of protein extraction techniques and detergents.
Detergent Extraction Process Median protein
recovery (µg/ml)
Range of
protein
recovery
(µg/ml)
1 % (v/v) SDS Sonication 80 63.7 – 94.9
Boiling 87 82 – 94
1 % (v/v)
Decon®90
Sonication 57 22.8 – 77.8
0.1M NaOH Boiling 53 50 – 66.5
The data shown is the median of three experiments.

Chapter 5 132
Figure 5-1 Recovery of BSA from SSS’s using different cleaning solutions and
methods. Samples from SSS’s inoculated with BSA and extracted using each
method were separated using 4-12% Bis-Tris gels. Gel (a) was stained with
Coomassie blue and gel (b) was stained using SYPRO® Ruby. BSA inoculated and
dried on SSS’s was recovered by boiling and sonication in 1% (v/v) SDS (a) Both
boiling (lanes 3, 4, 5) and sonication (lanes 7, 8, 9) in 1% (v/v) SDS recover BSA
fractions indicated by arrows from SSS’s. No protein was visible in the negative
control SSS eluents (lane 2 and lane 6). Lane 1 contains the protein size ladder
for comparison with the closest size to the fraction V BSA protein indicated in
kDa. BSA was also recovered by sonication in 1% (v/v) Decon®90 and 1% (v/v)
SDS (b) Both 1% (v/v) Decon®90 (lanes 3,4,5) and 1% (v/v) SDS (lanes 7, 8, 9)
recover BSA from the surface as shown by comparison to the positive control
(lane 1). No protein is visible in the negative control disc eluents (lanes 2 and 6).

Chapter 5 133
5.2.2 Validation of protein precipitation methods
To assess the protein recovery of each precipitation method (Section 2.3.2.1,
Section 2.3.2.2, Section 2.3.2.3, Section 2.3.2.4), a total of 3 x 2 ml 50 µg/ml
solutions of BSA in 1% (v/v) SDS were sampled for each precipitation method
representing the sample volume that HP turbines are immersed (Section 2.2.4).
A 2ml solution of 1% (v/v) SDS was also prepared as a negative control. The
solutions were each precipitated and protein sampled using the OPA assay
(Section 2.3.1.3) and SDS PAGE (Section 2.3.3).
The Amicon® Filter method resulted in the recovery of the most median protein
of all the methods sampled and the TCA method recovered the least median
protein (Table 5-2). The precipitation of BSA by acetone, TCA, StrataClean™
resin and Amicon® filtration were visualised using SDS–PAGE (Figure 5-2).
Table 5-2 Recovery of protein by each precipitation method.
Precipitation method Median protein recovered
(µg/ml)
Range protein
recovered (µg/ml)
Acetone 15.1 8.6 – 24
TCA 13 10 – 15
StrataClean® Resin 23.9 19.5 – 24.2
Amicon® Filter 30.1 29.8- 31.8
Data shown is the median of 3 experiments.

Chapter 5 134
Figure 5-2 Precipitation of BSA by different methods. Samples of precipitated
50 µg/ml BSA solutions were separated using 4-12% Bis-Tris gels. Gel (a) and gel
(b) were stained using silver stain and gel (c) was stained using SYPRO® Ruby.
BSA was precipitated using TCA and acetone (a) BSA fraction V indicated by
arrows was recovered by acetone precipitation (lanes 4, 5, 6) and TCA
precipitation (lanes 8, 9. 10). No protein was observed in the negative controls
(Lanes 2, 3, 7). Lane 1 contains the protein ladder with sizes indicated in kDa for
comparison. BSA was also precipitated using Amicon® filtration (b) precipitated
the BSA solutions at varying concentrations (lanes 4,5,6). No protein was
observed in the negative controls (lane 3) An unprecipitated 50 µg/ ml BSA
positive control was included for comparison (lane 2) and lane 1 contains the
protein ladder with sizes indicated in kDa for size comparison. Both acetone and
StrataClean™ Resin precipitated BSA (c). Acetone (lanes 4, 5, 6) and
StrataClean™ Resin (lanes 8, 9, 10) precipitated BSA though at varying
concentrations. No protein was observed in the negative controls (lanes 3 and
7). A 50 µg BSA positive control was included for comparison (lane 2) and lane 1
contains the protein ladder with sizes indicated in kDa for size comparison.
Chapter 5 135
5.2.3 Sensitivity of SDS-PAGE staining
To determine the sensitivity of each protein staining technique (Section 2.3.4.1,
Section 2.3.4.3, Section 2.3.4.4),BSA was diluted serial ten fold from 10-5 to 100
µg/ml in 1% (v/v) SDS and a 20 µl sample of each concentration was processed
for SDS PAGE (Section 2.3.3). To determine the sensitivity of PAS staining,
salivary mucin was also diluted serial ten fold from 10-5 to 100 µg/ml. Each gel
was stained with Coomassie blue staining (Section 2.3.4.1), silver stain (Section
2.3.4.3) and PAS staining (Section 2.3.4.4) to determine the sensitivities of both
staining methods. Sensitivity was determined using Quantity One® software (Bio-
Rad version 4.6.7) to determine the presence of contrast peaks indicating the
presence of protein bands.
Coomassie blue staining sensitivity for detecting salivary amylase was calculated
as 0.2 µg of protein (Figure 5-3 [a]). Silver staining had a sensitivity of 0.02 ng
of BSA (Figure 5-3 [b]). Periodic acid Schiff reagent stained a total of 0.2 µg of
salivary mucin protein (Figure 5-3 [c]).

Chapter 5 136
Figure 5-3 Sensitivity of protein detection stains at detecting BSA. BSA of
decreasing concentrations were loaded into a 4-12 % Bis Tris gel and stained with
coomassie brilliant blue and sliver stain whilst decreasing concentrations of
salivary mucin samples were loaded into a 3-8% Tris Acetate gel was used to
determine the sensitivity of PAS staining. For coomassie blue staining (a),
protein was observed in the 100 µg/ml sample (lane 4), 10 µg/ml sample (lane
5), 1 µg/ml sample (lane 6). No protein was detected in the 0.1 µg/ml (lane 7),
0.01 µg/ml (lane 8), 0.001 µg/ml (lane 9), or the 0.0001 µg/ml (lane 10). No
protein was detected in the negative control (lane 2). Lane 1 contained the
protein ladder for size comparison and lane 3 contained a salivary amylase
positive control. For silver staining (b) protein is observed in the 100 µg/ml
sample (lane 4), 10 µg/ml sample (lane 5), 1 µg/ml sample (lane 6) the 0.1
µg/ml (lane 7), 0.01 µg/ml (lane 8), 0.001 µg/ml (lane 9), and the 0.0001 µg/ml
(lane 10). No protein was detected in the negative control (lane 2). Lane 1
contained the protein ladder for size comparison. For PAS staining (c), salivary
mucin was observed at concentrations of 1 mg/ml (lane 3), 100 µg/ml (lane 4),
10 µg/ml (lane 5). No protein was detected in the negative control (lane 2). The
protein ladder for size comparison was included in lane 1 with sizes indicated in
kDa

Chapter 5 137
5.2.4 Effect of handpiece lubricating oil on SDS- PAGE
To determine the effect of HP lubricating oil has on SDS-PAGE, a total of 3 BSA
solutions were diluted to a concentration of 100 µg/ml in 1% (v/v) SDS alone or
in a 1:1 solution of lubricating oil and 1% (v/v) SDS. Each solution was sampled
for SDS PAGE (Section 2.3.3) and stained with SYPRO® ruby stain (2.3.4.2).
BSA was detected in the 1:1 lubricating oil 1 % (v/v) SDS solutions and the 1%
(v/v) SDS solutions (Figure 5-4).
Figure 5-4 Effect of lubricating oil on protein observation by SDS – PAGE. BSA
solutions were diluted in 50% solution of lubricating oil and the eluents
separated in a 4-12 % Bis Tris gel was stained using SYPRO® Ruby. BSA is visible
in solutions of 1% (v/v) SDS (lanes 8-10) and lubricating oil (lanes 4-6) and the
positive control of a 100 µg BSA solution in ROH2O (lane 2). No protein is
observed in the negative controls (lanes 3,7). Lane 1 contained the protein
ladder for size comparison with sizes indicated in kDa.
1 2 3 4 5 6 7 8 9 10
60 kDa
1 2 3 4 5 6 7 8 9 10
60 kDa

Chapter 5 138
5.2.5 Sensitivity of Antibody Staining and Western Blot
To determine the sensitivity of antibody probing and determine the most
sensitive antibody concentration, salivary amylase was 10 fold serially diluted in
1% (v/v) SDS to concentrations of 0.01, 0.1, 1, 10, and 48 µg/ml and a 10 µl
sample of each concentration was added to a polyvinylidene fluoride (PVDF)
membrane and dried for 2h at room temperature The strips were also inoculated
with a 10 µl sample of 50 µg/ml of BSA as a negative control. Serum albumin was
10 fold serially diluted in 1% (v/v) SDS to concentrations of 0.01, 0.1, 1 and 100
µg/ml and a 20 µl sample of each concentration was added to a PVDF
membrane. The strip was also inoculated with 20 µg sample of salivary amylase
as a negative control. The strip was probed with antibodies and developed using
BCIP/NBT solution (Section 2.3.6). To determine the sensitivity of the Western
blot technique, samples of salivary amylase were diluted to concentrations of
10-4 to 20 and 40 µg/ml, human serum albumin was 10 fold serially diluted from
a concentration of 10-4 to 100 µg/ml and for the sensitivity of the salivary mucin
Western blot, unstimulated saliva was processed as in Section 3.2.2 and was
diluted 10-4, unprocessed saliva was also diluted 10-4 with all dilutions sampled.
A minimum protein amount of 0.002 µg of salivary amylase (Figure 5-5) and
0.0002 µg of serum albumin was detected using antibody probing and alkaline
phosphatise staining. The total salivary amylase detected was 0.02 µg (Figure 5-6
[a]) and a total of 0.002 µg (Figure 5-6 [b]) of serum albumin was detected by
Western blot. A minimum of a 1/10 dilution of unprocessed saliva and the
undiluted processed saliva was also detected (Figure 5-6 [c]).
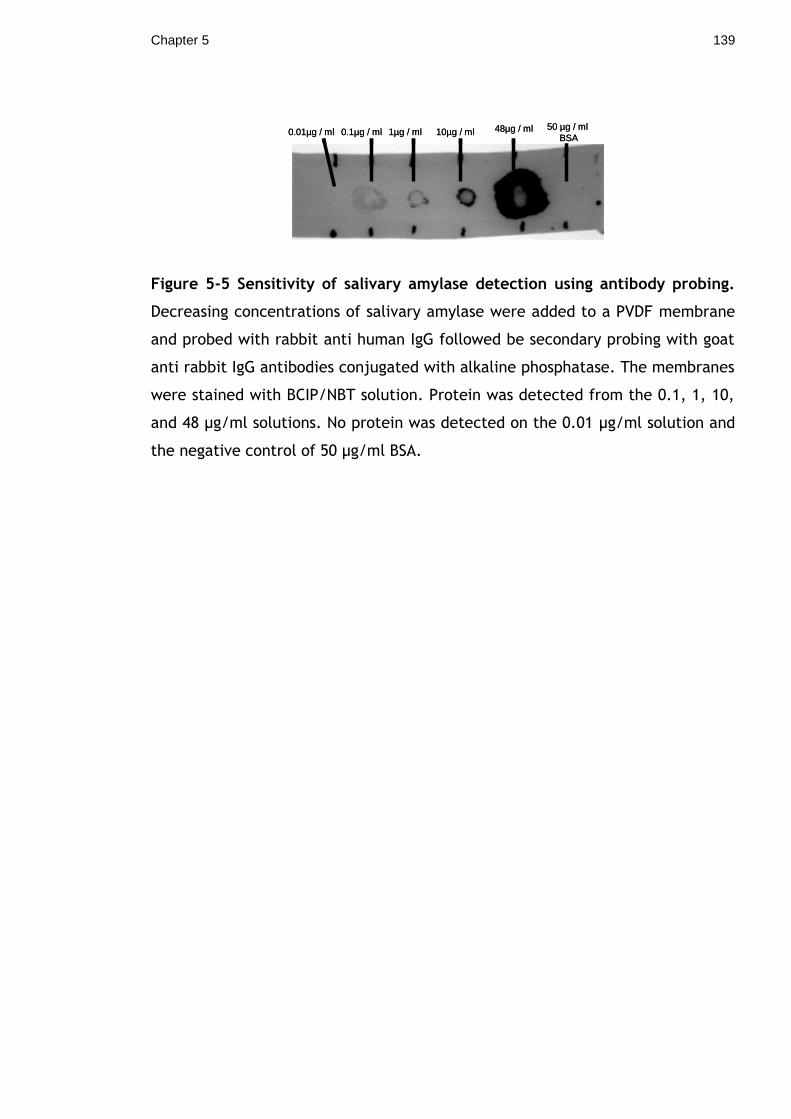
Chapter 5 139
Figure 5-5 Sensitivity of salivary amylase detection using antibody probing.
Decreasing concentrations of salivary amylase were added to a PVDF membrane
and probed with rabbit anti human IgG followed be secondary probing with goat
anti rabbit IgG antibodies conjugated with alkaline phosphatase. The membranes
were stained with BCIP/NBT solution. Protein was detected from the 0.1, 1, 10,
and 48 µg/ml solutions. No protein was detected on the 0.01 µg/ml solution and
the negative control of 50 µg/ml BSA.
50 µg / ml
BSA48µg / ml
Salivary amylase
10µg / ml 1µg / ml 0.1µg / ml 0.01µg / ml 50 µg / ml
BSA48µg / ml
Salivary amylase
10µg / ml 1µg / ml 0.1µg / ml 0.01µg / ml

Chapter 5 140
Figure 5-6 Sensitivity of Western blot. Decreasing concentrations of salivary
amylase, serum albumin and saliva samples were separated using SDS PAGE,
transferred to a PVDF membrane and probed using alkaline phosphatase
conjugated antibodies. Salivary amylase (a) indicated with arrows was detected
in the 40 µg/ml sample (lane 2), the 20 µg/ml sample (lane 3), the 1 µg/ml
sample (lane 4) and the 0.1 µg/ml sample (lane 5). No salivary amylase was
detected in the 0.01 µg/ml sample (lane 6), 0.001 µg/ml sample (lane 7), 0.0001
µg/ml (lane 8) and the negative control of 100 µg/ml BSA (lane 10). Lane 1
contained the protein ladder for size comparison. Serum albumin (b) indicated
with arrows was detected in the 100 µg/ml sample (lane 4), the 10 µg/ml sample
(lane 5), the 1µg/ml sample (lane 6) the 0.1 µg/ml sample (lane 7), and the 0.01
µg/ml sample (lane 8). No serum albumin was detected in the 0.001 µg /ml
sample (lane 9), 0.0001 µg/ml sample (lane 10) and the negative controls of 1%
(v/v) SDS (lane 2) and 40 µg/ml of salivary amylase, (lane 3). The salivary mucin
(c) antibody detected salivary mucin in a neat and a 1/10 dilution of
unprocessed saliva (Lanes 3, 4) and a neat solution of processed saliva (Lane 7).
No mucin was detected in the 1/100 dilution or 1/1000 dilution (Lanes 5, 6) or
the 1/10, 1/100, 1/1000 dilution of the prepared saliva (Lanes 8, 9, 10) or the
negative control (lane 2).

Chapter 5 141
5.2.6 Detection of salivary amylase from saliva samples
A 5 ml solution of unstimulated saliva was collected from 3 human male
volunteers separately. Each sample was centrifuged for 15 min at 9971 g and the
supernatant removed. Each sample was given a 1:10 dilution and samples
sampled using SDS-PAGE (Section 2.3.3). The salivary samples were then probed
for the presence of salivary amylase using Western blot (Section 2.3.6).
Salivary amylase was detected from 3 saliva samples and 1 dilute saliva sample
(Figure 5-7).
Figure 5-7 Detection of salivary amylase from saliva samples. Unstimulated
saliva samples were separated using SDS PAGE before transfer to a PVDF
membrane and probing with antibodies conjugated to alkaline phosphatase.
Salivary amylase indicated with arrows was detected in all neat saliva samples
(lane 5, 7, 9), a dilute sample (lane 8), and the 40 µg/ml positive control (lane
4). No salivary amylase was detected in the 1% (v/v) SDS negative control (lane
2) and the 100 µg/ml BSA control (lane 3). The protein ladder was present in
lane 1 with sizes indicated in kDa for comparison.
Chapter 5 142
5.2.7 Protein contamination of dental forceps
A total of 10 used and unprocessed extraction forceps and 30 decontaminated
extraction forceps were provided by the CSSD department of the GDH. Forceps
were transported in a sterile specimen bag to the laboratory for sampling.
The working end of each set of forceps was inserted into a 50 ml centrifuge tube
containing 5 ml of 1% (v/v) SDS. Each tube was added to a boiling water bath
(Grant instruments, Cambridge UK) and boiled for 10 min. A 20 µl sample was
taken for quantitative analysis using the OPA assay (Section 2.3.1.3) A total of 20
samples were added together and precipitated using an Amicon® filter (Section
2.3.2.4). A further 10 samples were individually precipitated using StrataClean™
resin (Section 2.3.2.3). Precipitated samples were sampled using SDS-PAGE
(Section 2.3.3). Gels were stained with silver stain (Section 2.3.4.3) and
Coomassie blue (Section 2.3.4.1). The presence of protein bands was confirmed
using a peak analysis by Quantity one® software (Bio-Rad version 4.6.7). Protein
bands stained with Coomassie blue were sent for analysis by MS at the Glasgow
University proteomics facility (Section 2.3.5). Samples were also analysed for
the presence of salivary amylase and serum albumin by Western blot (Section
2.3.6).
Protein was isolated from all used unprocessed forceps (median 603 µg, range 39
– 2761 µg) and 16 decontaminated forceps (median 17, range 0 – 82) (Table 5-3).
Significantly (p<0.05) more protein was recovered from unprocessed forceps
than decontaminated forceps. For the qualitative analysis, a total of 13 protein
bands representing different sized proteins were observed in all used,
unprocessed samples (Figure 5-8 [a] ) and 19 bands were observed when the
samples were stained with SYPRO Ruby (Figure 5-8 [b], Figure 5-8 [c]). A total of
2 protein bands were observed in decontaminated forceps samples when gels are
stained with silver stain (Figure 5-9 [a], Figure 5-9 [c]) and no protein was
observed in 5 decontaminated (Table 2-3) forceps samples precipitated with
StrataClean™ Resin (Figure 5-9 [b]). A total of 17 proteins were identified using
MS (Table 5-4). Serum albumin was identified in all used, unprocessed samples
(Figure 5-10 [a]) and salivary amylase was not detected in any samples (limit of

Chapter 5 143
detection 20 µg/ml) (Figure 5-10 [b]). No protein could be identified from
decontaminated samples.
Table 5-3 Protein isolated from used, unprocessed and decontaminated forceps samples.
Forceps Median protein
concentration/
device (µg)
Range protein
concentration
(µg/device)
Decontaminated (n = 30) 16.83 0 – 81.95
Unprocessed (n = 10) 603 38.5 – 2760.5

Chapter 5 144
Figure 5-8 Protein content of used, unprocessed dental forceps. A sample of
the eluent from 4 used, unprocessed forceps was precipitated by StrataClean™
resin and the protein content viewed by staining with coomassie blue (a) (lanes 4
– 7). The proteins were compared to a protein ladder (lane 1) with sizes in kDa
indicated. Bands representing proteins of different sizes were found on 3 forceps
samples (Lanes 4-6) (c). A band of 66 kDa corresponding to 100 µg/ml BSA was
observed in the positive control (lane 2) and no bands were observed in the
negative control (lane 3). The samples were also stained with SYPRO® Ruby (b)
and bands were observed from each of the forceps samples (lane 4-7) and the
100 µg/ml BSA positive control (lane 3). No bands were observed in the negative
control (Lane 2). Lane 1 contains the protein ladder with sizes indicated in kDa.

Chapter 5 145
Figure 5-9 Protein contamination of decontaminated forceps. A sample of the
eluent from 6 decontaminated forceps was precipitated by Amicon filtration
and the protein content viewed by staining with silver stain (a). The proteins
were compared to a protein ladder (lane 1) with sizes in kDa indicated. Protein
bands were evident in two forceps samples (lanes 3 and 4). No protein is found
in an additional 3 samples (lanes 5, 6, 7). The 100 µg/ml BSA positive control
was in lane 2 and the protein ladder in lane 1 with sizes indicated in kDa for
comparison. A sample of the eluent from 6 decontaminated forceps was
precipitated by StrataClean™ resin and the protein content viewed by staining
with silver stain (b). The proteins were compared to a protein ladder (lane 1)
with sizes in kDa indicated. No protein was evident in the forceps samples (lanes
5, 6, 7, 8, 9, 10). No protein was found in the negative controls (lanes 3, 4).
Protein was observed in the 100 µg/ml BSA positive control (lane 2). The bands
from the decontaminated forceps samples were confirmed by peak analysis (c).

Chapter 5 146
Figure 5-10 Detection of serum albumin and salivary amylase in used,
unprocessed and decontaminated forceps samples. A total of 4 used,
unprocessed forceps samples and 3 decontaminated forceps samples were
sampled for serum albumin using probing with antibodies conjugated with
alkaline phosphatase. Serum albumin (a) was detected in 4 used, unprocessed
samples (lanes 4, 5, 6, and 7) and the 100 µg/ml BSA positive control (lane 2).
No serum albumin was detected in decontaminated samples (limit of detection
0.01 µg/ml) (lanes 8, 9, 10). No salivary amylase (b) was detected in 4 used,
unprocessed samples (lanes 4, 5, 6, and 7) or the decontaminated samples (lanes
8, 9, 10) (limit of detection 20 µg/ml). Salivary amylase was detected in the 40
µg/ml positive control (lane 3).
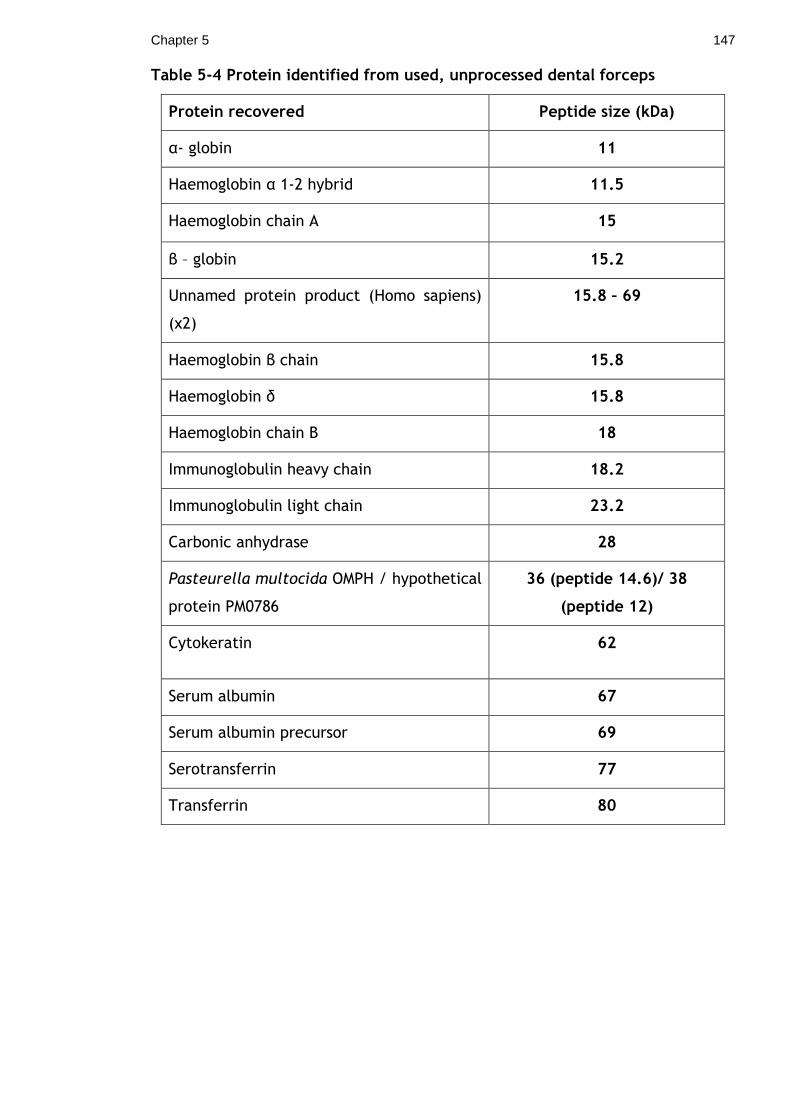
Chapter 5 147
Table 5-4 Protein identified from used, unprocessed dental forceps
Protein recovered Peptide size (kDa)
α- globin 11
Haemoglobin α 1-2 hybrid 11.5
Haemoglobin chain A 15
β – globin 15.2
Unnamed protein product (Homo sapiens)
(x2)
15.8 – 69
Haemoglobin β chain 15.8
Haemoglobin δ 15.8
Haemoglobin chain B 18
Immunoglobulin heavy chain 18.2
Immunoglobulin light chain 23.2
Carbonic anhydrase 28
Pasteurella multocida OMPH / hypothetical
protein PM0786
36 (peptide 14.6)/ 38
(peptide 12)
Cytokeratin 62
Serum albumin 67
Serum albumin precursor 69
Serotransferrin 77
Transferrin 80

Chapter 5 148
5.2.8 Protein contamination of dental handpieces
A total of 30 W&H TA-98 high speed HP’s, 30 W&H WA-56 low speed HP’s, and 25
W&H S11 surgical HP’s were provided by the GDH CSSD department before
decontamination (Table 2-3). In addition, a total of 20 W&H TA-98 high speed
HP’s, 20 W&H WA-56 low speed HP’s and 10 W&H S11 surgical were provided
after decontamination (Table 2-3). Each HP was processed as detailed in Section
2.1.2. Each HP turbine was immersed in 2 ml of 1% (v/v) SDS, each spray channel
was immersed in 8 ml of 1% (v/v) SDS and each surgical gear was immersed in 15
ml of 1% (v/v) SDS. Each tube was added to a boiling water bath (Grant
instruments, Cambridge, UK) and boiled for 10 min. A 20 µl sample was taken for
quantitative analysis using the OPA assay (Section 2.3.1.3). For used unprocessed
HP’s the eluents of 20 high speed turbines, 20 low speed spray channels and 15
surgical gears were added together and precipitated using Amicon® filters
(Section 2.3.2.4). The retentate of each HP part was kept for analysis. For
decontaminated HP’s, the eluents from 20 high speed turbines, 20 low speed
spray channels and 10 surgical gears were precipitated using Amicon® filters
(Section 2.3.2.4). Precipitated samples were sampled using SDS-PAGE (Section
2.3.3). Gels were stained with silver stain (Section 2.3.4.3) and Coomassie blue
(Section 2.3.4.1). The presence of protein bands was confirmed using a peak
analysis by Quantity One® software (Bio-Rad version 4.6.7). Protein bands
stained with Coomassie blue were sent for analysis by MS at the Glasgow
University proteomics facility (Section 2.3.5). Samples were also analysed for
the presence of salivary amylase and serum albumin by Western blot (Section
2.3.6).
Protein contamination was isolated from 17/30 high-speed turbines, 22/30 of
low speed spray channels, and 20/20 of surgical S11 gears (Table 5-5, Figure
5.11). Before decontamination, the surgical gear contained significantly (p
<0.001) more protein than the high speed turbines and low speed spray
channels. No significant difference was observed between protein isolated from
low speed spray channels and high speed turbines. After decontamination (Table
2-3), protein was significantly (p<0.001) reduced in surgical gears and spray
channels (p<0.05) (Table 5-6, Figure 5-11). After precipitation of samples,
protein and mucopolysaccharide bands were observed in each used unprocessed

Chapter 5 149
instruments (Figure 5-12[a][b][c],Figure 5-13) and decontamined surgical gears,
(Figure 5-14 [a][b][c]).For Western blot analysis,salivary amylase was not
detected in any used, unprocessed and decontaminated sample (limit of
detection 20 µg/ml) (Figure 5-15). Serum albumin and salivary mucin 5b was
identified in the used, unprocessed surgical HP gears but not in the high speed
turbines or low speed spray channels (Figure 5-16, Figure 5-17). An ELISA was
conducted on all HP samples using a rabbit anti- human salivary amylase
antibody as the capture antibody, a sheep anti-human salivary amylase antibody
as the secondary antibody and a goat anti-rabbit IgG antibody conjugated with
horseradish peroxidise was used as the detection antibody. Salivary amylase was
detected in all used, unprocessed samples (Table 5-7) and no salivary amylase
was detected in decontaminated samples (Table 5-7). A total of 11 proteins
were identified by MS (Table 5-8).

Chapter 5 150
Table 5-5 Protein contamination of used, unprocessed HP’s.
Handpiece part Median protein
concentration
(µg/device)
Range protein
concentration
(µg/device)
Precipitated
concentration
(µg/ml)
High speed
turbine (n = 30)
1.3 <5 – 210 45.6
Low speed spray
channel (n = 30)
15.41 <5– 55.4 31.8
Surgical gear
(n=25)
350 127.5 – 1936 194.8
Precipitated samples consisted of 20 high speed turbines eluents, 20 low speed
spray channel eluents, and 15 surgical gear eluents.
Table 5-6 Protein contamination of decontaminated HP’s.
Handpiece
Part
Median
protein
concentration
(µg/device)
Mean protein
concentration
(µg/device)
Range protein
concentration
(µg/device)
Precipitated
concentration
(µg/ml)
High speed
turbine (n =
20)
0 6.4 <5– 18 0.96
Low speed
spray
channel (n =
20)
0 11.1 <5 – 103 10.6
Surgical
gear (n=10)
0 3.2 <5 – 64.5 51
Precipitated samples consisted of 20 high speed turbines eluents, 20 low speed
spray channel eluents, and 15 surgical gear eluents.

Chapter 5 151
Figure 5-11 Quantitative protein analysis of dental HP parts. Internal HP parts
were sampled for protein before and after decontamination. The turbine of the
high speed HP, the spray channel of the low speed HP and the gear of the
surgical HP were sampled. Before decontamination, surgical HP gears contained
the most protein with a median of 350 µg. This was significantly (***=p<0.001)
reduced after decontamination to a median of <5 µg. A median of 1.3 µg of
protein was isolated from high speed turbines before decontamination and
reduced to a median of 0 µg after decontamination. For spray channels, a
median of 15.41 µg of protein was isolated before decontamination which was
significantly (p<0.05) reduced to 0 µg of protein after decontamination.

Chapter 5 152
Figure 5-12 Protein contamination of used, unprocessed HP’s. Eluents from
used, unprocessed turbines, low speed spray channels, and surgical gears were
precipitated together using an amicon filter and the gel stained with silver stain.
Protein was observed in the high speed turbine samples with 3 distinct bands
present (lane 5), (the low speed spray channel samples with 2 distinct bands
present (lane 7), and the surgical gears where 9 distinct bands were present
(lane 9) (a). No protein was observed in the negative controls (lane 3, 4, 6, 8).
Lane 2 consisted of the 100 µg/ml BSA positive control and lane 1 contained the
protein ladder with the sizes in kDa for comparison. The bands from the surgical
gears (b) and the turbines (c) were confirmed with peak analysis.

Chapter 5 153
Figure 5-13 PAS staining for mucopolysachharides in dental HP’s. Eluents from
used, unprocessed turbines, low speed spray channels, and surgical gears were
precipitated together using an amicon filter and the gel stained with PAS
reagent. Mucopolysaccharide was detected in the surgical HP gear (lane 9) and
the 100 µg/ml salivary mucin control (lane 2). No protein was detected in the
negative controls (lanes, 3,4,5,6) or the high speed HP turbines (lane 7) and the
low speed HP spray channels (lane 8). The Himark™ protein ladder was included
for size comparison (lane 1).

Chapter 5 154
Figure 5-14 Protein contamination of decontaminated dental HP’s. Eluents
from decontaminated turbines, low speed spray channels, and surgical gears
were precipitated together using an amicon filter. Protein was observed in the
surgical gears (lane 9) with 2 distinct bands visible (b). No protein bands were
observed in the high speed turbines (lane 5), spray channels (lane 7) and or the
negative controls (lane 3, 4, 6, 8). Lane 2 consisted of the BSA positive control
and lane 1 contained the protein ladder with the sizes in kDa for comparison.

Chapter 5 155
Figure 5-15 Detection of salivary amylase in used, unprocessed HP samples.
No salivary amylase (limit of detection 20 µg/ml) was detected in the high speed
turbine samples (lane 8), the low speed spray channel samples (lane 9) and the
surgical gear samples (lane 10), or the negative controls (lanes 2, 4, 5, 6).
Salivary amylase was observed in the salivary amylase positive control (lane 3).
Lane 1 contains the protein ladder with sizes in kDa indicated for size
comparison.

Chapter 5 156
Figure 5-16 Detection of serum albumin in used, unprocessed handpiece
samples. Serum albumin was detected in the surgical gear samples (lane 9) and
the 100 µg/ml serum albumin positive control (lane 4). No serum albumin was
detected (sensitivity 0.01 µg/ml) in the negative controls (lanes 2, 3, 5, 6), the
high speed turbine samples (lane 7), or the low speed spray channel samples
(lane 8). Lane 1 contains the protein ladder for size comparison.

Chapter 5 157
Figure 5-17 Detection of salivary mucin in used, unprocessed handpiece
samples. Salivary mucin 5b was detected in the surgical gear samples (lane 9)
and the saliva controls (lanes 2, 3). No salivary mucin (limit of detection 1/10
dilution of saliva) was detected in the negative controls (lanes 4, 6, 8), the high
speed turbine samples (lane 5), or the low speed spray channel samples (lane 7).
Lane 1 contains the protein ladder for size comparison.
Table 5-7 Salivary amylase concentration detected using ELISA in precipitated
used, unprocessed and decontaminated HP samples.
Sample State Salivary amylase
concentration detected
(µg / ml)
Turbine Used, unprocessed 1.8
Decontaminated 0
Spray Used, unprocessed 2.9
Decontaminated 0
Surgical Used unprocessed 6.1
Decontaminated 0

Chapter 5 158
Table 5-8 Proteins identified from used, unprocessed surgical handpiece
samples.
Protein recovered Peptide size (kDa)
50S Ribosomal protein 11.5
Alpha globin 13.5
Haemoglobin chain D 15.8
Haemoglobin subunit beta 15.8
Haemoglobin subunit ε 15.8
Haemoglobin beta chain 15.8
Haemoglobin beta 15.8
Haemoglobin chain B 18
Serum albumin 67
Hypothetical protein (Homo sapiens) 69
Conserved hypothetical protein
Paracoccidiodes brasilineus
119
Chapter 5 159
5.3 Discussion
A qualitative analysis of instrument protein contamination is essential to
determine cross infection risks and to help inform the development of cleaning
processes and chemicals. This study presents validation work on the extraction
and sampling of protein contamination and utilises a method for the qualitative
analysis of instrument protein contamination. This study has added advantage
over previous investigations that have sacrificed instruments during protein
extraction (Baxter et al., 2006). In contrast, this study involved taking HP’s
directly from the GDH supply chain, thus minimising cost and unnecessary waste.
Previous work into the analysis of instrument residual protein contamination has
been mostly limited to quantitative studies (Smith et al., 2005, Murdoch et al.,
2006, Baxter et al., 2006, Vassey et al., 2011) . Studies are concerned with the
validation and monitoring of cleaning processes as protein is used as a marker of
cleanliness. Smith et al. (2005) studied the protein contamination of endodontic
files decontaminated in dental practice using different methods for cleaning.
Cleaning files using manual washing alone resulted in a median of 4.9 µg of
protein present, and cleaning with a manual wash and ultrasonic bath resulted in
a median of 5.6 µg of protein present (Smith et al., 2005). For dental
instruments, a survey of the efficacy of washer disinfectors and ultrasonic baths
on cleaning various dental instruments found protein on instruments before and
after the decontamination process with a median of 5.75 µg of protein isolated
after cleaning using a washer disinfector (Vassey et al., 2011). A study by
Murdoch et al. (2006) on the protein contamination of hospital decontaminated
instrument trays showed that 17% of instruments sampled had protein
concentrations above an arbitrary cut off value of 200 µg with one instrument
containing 45 mg of protein. A similar study on instrument trays was carried out
by Baxter et al. (2006) whom isolated a median of 267 µg/instrument from 5
instrument trays containing a total of 120 instruments.
These studies all state in their conclusions that the presence of protein may
constitute a cross contamination risk (Smith et al., 2005, Baxter et al., 2006).
The only protein that is capable of causing disease is the prion protein, the
causative agent of CJD (Arakawa et al., 1991) and all the aforementioned studies

Chapter 5 160
mention CJD as the driving force behind the measurement of protein
contamination (Smith et al., 2005). Whilst a quantitative analysis of protein
contamination can give an indication of contamination, it is impossible to put
these protein concentrations into context without a qualitative analysis of
protein contamination.
Studies into qualitative analysis of instrument protein have been conducted on
ophthalmic phacoemulsification tips (Nuyts et al., 1999) and orthodontic bands
(Benson and Douglas, 2007). Nuyts et al. (1999) utilised Coomassie blue for
general staining and Western Blot for specific lens proteins to validate cleaning
procedures. No lens proteins were detected even if no cleaning procedure was
applied (Nuyts et al., 1999). Whilst the sensitivity of detection was calculated as
48 ng, the sensitivity of the extraction method was not stated and this may be
the reason for the lack of protein isolated. A study into the presence of serum
albumin and salivary protein on orthodontic bands found that each protein was
found on 50% of bands after cleaning (Benson and Douglas, 2007). This study
used ELISA though no quantitative data was measured (Benson and Douglas,
2007). The application of some of the aforementioned methods, in conjunction
with quantitative analysis (Chapter 3), can build a complete picture of
instrument protein contamination.
For all validation work a total of 3 proteins were used for the validation of
coomassie blue and silver staining. BSA was used as a model protein representing
serum albumin, the most abundant protein in blood which is a common
contaminant of the instruments sampled (Desroches et al., 2007), salivary
amylase as the most abundant protein in human saliva (Hu et al., 2007a), and
salivary mucin has a glycosylated structure containing mostly sugars that is
abundant in the oral cavity (Liu et al., 1998). Only salivary mucin was used for
the validation of PAS staining as this method stains sugars which are not
abundant on BSA and salivary amylase proteins (Ramasubbu et al., 1996, Sugio et
al., 1999). To determine the sensitivity of salivary mucin Western blotting,
human saliva was used due to the unavailability of purified human salivary mucin
protein.

Chapter 5 161
For protein desorption, the solutions and processes used were initially selected
for their use in previous studies (Smith et al., 2005), recommendations by BS—EN
ISO-15883 part 1, and for the lack of corrosive properties. Some protein removal
solutions may also denature the protein and not allow visualisation of proteins
by SDS PAGE. The protein not recovered may remain on the surface or may be
due to protein denaturation not allowing measurement. The most efficacious
method for protein recovery sampled, through measurement of the OPA assay,
was boiling in 1% (v/v) SDS validated by SDS PAGE and the OPA assay. SDS is an
anionoic surfactant that is recommended by the BS-EN-ISO-15883 part 1 for
desorption of protein from a test piece surface. SDS denatures the secondary
and tertiary structure of proteins forming the proteins into rod shapes (Weber
and Kuter, 1971). A molecule of SDS can associate with the peptide backbone of
the protein and applies a negative charge, the strength of which is based on the
protein size (Weber and Osborn, 1969). The boiling of the SDS solution increases
binding to the protein molecule, which may account for the increase in removal
when compared to sonication. A solution of 0.1M NaOH was sampled due to its
application for the inactivation of prion proteins (Bauman et al., 2006). A
solution of NaOH is an alkaline solution that causes hydrolysis of the proteins and
reverses the interaction of the protein adsorbed to the stainless steel surface
(Bauman et al., 2006, Desroches et al., 2007). This occurs through the alteration
of the electrostatic charge of the protein residues and reduces the electrostatic
attraction of the surface (Sakiyama et al., 2004). A solution of 0.1M NaOH was
found to cause corrosion of HP turbines showing the unsuitability for HP
sampling. Decon®90 is also an alkaline detergent with a pH of 10.4 which has
been used for the desorption of protein in previous instrument contamination
studies (Smith et al., 2005). The Decon®90 detergent may have a similar mode
of action to the sodium hydroxide though the exact composition of the detergent
is unknown. The quantitative data was combined with SDS-PAGE to visualise the
protein recovered as the OPA assay relies on the reaction with primary amines, a
denatured protein may still cause a positive reaction if parts of the structure of
are still intact (Roth, 1971). Each gel showed that BSA fraction V was isolated
with each cleaning solution though 0.1M NaOH was not sampled using SDS-PAGE
due to the aforementioned corrosion of turbines.

Chapter 5 162
Staining of gels was undertaken by coomassie blue, Silverquest® silver stain, and
SYPRO® Ruby staining representing an organic dye, a silver stain and a
fluorescent stain. The sulfonic groups of Coomassie blue dye binds to the protein
molecule by electrostatic and hydrophobic binding to basic amino acids such as
lysine, arginine and histidine residues in the protein (Compton and Jones, 1985,
Congdon et al., 1993). Coomassie blue stain has a reported sensitivity of 0.5 µg
of protein (Candiano et al., 2004) which is comparable to the 0.2 µg of protein
found in the validation work. Whilst the insensitivity of Coomassie blue staining
may result in an incomplete picture of the protein contamination, the reversible
interactions allow compatibility for further downstream protein identification
mass spectrometry (Candiano et al., 2004). Use of the Silverquest® silver stain
results in an increased sensitivity of protein detection to less than 0.02 ng of
protein which is comparable to previous results (Rabilloud, 1992). The staining is
due to the reaction of silver ions to metallic silver by the protein molecule in
the presence of formaldehyde. The silver staining kit uses less formaldehyde
than other silver staining techniques to enable MS compatibility though the low
concentration of proteins did not allow identification of silver stained bands by
mass spectrometry. SYPRO ruby is a ruthenium based fluorescent stain that has
reported sensitivities comparable to silver staining. The stain binds to lysine,
arginine, and histidine residues and can be visualised using ultraviolet light
(Lopez et al., 2000), though this is not the optimum method for visualisation.
Precipitation of samples was necessary due to the comparatively large sample
volumes and smaller protein concentrations compared to classical proteomic
studies and other elements in the sample such as lubricating oil or metallic
fragments that may affect the purity of the sample (Aguilar et al., 1999). Initial
work with non-precipitated HP samples did not reveal any protein bands despite
positive reactions with the OPA assay. The efficacy of each method was assessed
using a volume of protein solution used for immersion of a high-speed turbine
and a protein concentration based on a value that has been isolated from used,
unprocessed HP’s. A total of 4 precipitation methods were assessed each with
different mechanisms. Amicon® ultra centrifugal filters were found to recover
the most protein of the methods sampled. Previous studies into the efficiency of
the protein precipitation methods have shown that precipitation with TCA
precipitation recovering 24% of protein and acetone precipitation recovering 69%

Chapter 5 163
of rat brain protein (Fic et al., 2010). Whilst the TCA precipitation efficiency
was similar to the value in this study, the acetone precipitation recovery was
more than was recovered in this study. This may be due to the increased starting
protein concentration or the increased number of proteins in the samples as
each precipitation technique has different effects on different proteins (Zellner
et al., 2005). For ultracentrifugation methods, the filters trap proteins with a
size larger than 15 kDa in a filter in a smaller volume of solution, StrataClean™
resin acts through direct interaction of the resin with protein hydroxyl groups
whilst acetone precipitation causes aggregation of proteins through dehydration
of any water molecules (Simpson and Beynon, 2009) and TCA exposure results in
the unfolding of the protein through disruption of the electrostatic interactions
by the trichloroactetate ions (Sivaraman et al., 1997). Filtration was the only
method sampled that does not result in protein binding or modification of
protein structure for downstream identification by mass spectrometry and
coupled with the comparatively high rate of recovery was ideal for processing of
HP samples (Jiang et al., 2004, Simpson and Beynon, 2009).
Dental extraction forceps were used as a model instrument to test the
quantitative and qualitative methods for measuring protein contamination due
to many factors. The forceps are directly exposed to blood and saliva
contamination during routine use which indicate that more protein will be
present than the dental HP, and the working end of forceps contains a rough
surface structure that may trap protein and inhibit removal by cleaning
processes (Smith et al., 2005). The forceps also have direct access to
contamination and do not require dismantling. Previous studies have detected
residual protein on decontaminated forceps with a median of 17 µg/instrument
and a range of 0 – 213 µg/instrument (Murdoch et al., 2006). Work by Vassey et
al. (2011) into used, unprocessed and decontaminated dental instruments from
dental practices found a median of 462 µg which was reduced to 27 µg of protein
upon cleaning using an AWD (Vassey et al., 2011). These values are comparable
to those found in this study. These studies did not attempt to identify these
proteins using qualitative analysis. In this study, a total of 16 protein
contaminants of used, unprocessed dental extraction forceps were identified
using mass spectrometry and serum albumin was detected using Western blot.
The majority of identified proteins were associated with human blood or saliva

Chapter 5 164
including serum albumin, carbonic anhydrase and haemoglobin chains and
proteins from P. multocida which indicate the presence of bacteria (Rose and
Mathai, 1977, Hortin, 2006, Hu et al., 2007a). Western blot, with a sensitivity of
0.02 µg of amylase protein, did not detect salivary amylase from forceps samples
before or after decontamination. Studies have shown that whilst amylase is the
most abundant protein in saliva (Hu et al., 2007a), it is present at
concentrations of 20 µg/ml of saliva (Sivakumar et al., 2009). This is lower than
the positive control of the sample used which was 40 µg/ml from a purified
solution and the amount of saliva coated on forceps may contain a lower level of
amylase than the limit of detection of the assay. Use of more sensitive
chemoluminescence Western blot detection methods may allow the detection of
lower concentrations of amylase due to the increased sensitivity of detection
associated with this method compared to alkaline phosphatase (Falk and Elliott,
1985). The ELISA method has previously been utilised to detect salivary amylase
from orthodontic bands and is more sensitive than the Western blot method
which may indicate that amylase could be detected using these methods (Benson
and Douglas, 2007). Protein was detected in two decontaminated forceps
samples without visible blood contamination when silver stain was applied but
the low concentration did not allow identification by mass spectrometry.
Comparison to the protein bands found in used, unprocessed samples show the
proteins in the size range are carbonic anhydrase and the outer membrane
proteins of P. multocida, though it is not possible to conclude that these are the
remaining proteins without further tests.
This was the first study to examine residual protein contamination of dental HP’s
where prior research has primarily focused on microbial contamination (Herd et
al., 2007, Kellett and Holbrook, 1980). The complexity of the internal HP
structure has focused attention on the efficacy of the HP cleaning process and
the ability to remove protein from internal locations associated with microbial
contamination. Residual protein was detected in each HP part with the largest
amount of protein being isolated from the surgical HP gear, which has the
largest surface area and is used for more invasive procedures. The lowest
amount of protein was isolated from turbines, which have the smallest surface
area. Protein contamination was also evident in SDS PAGE gels after sample
pooling though protein could only be detected from turbines and spray channels

Chapter 5 165
when silver stain is applied. In common with the extraction forceps, the surgical
HP gears contained several bands representing different sized blood proteins of
detectable concentration with serum albumin being detected in this sample by
Western blot. Serum albumin was also detected using MS in addition to 8 blood
proteins, a fungal protein and a ribosomal protein. No salivary amylase was
detected in any sample using Western blot though the ELISA reaction showed the
presence of a small concentration of salivary amylase in all used, unprocessed
samples.
In conclusion, the methods highlighted can be utilised to undertake a
quantitative and qualitative analysis of instrument protein contamination and fill
a large gap in instrument contamination knowledge. The main weakness of the
qualitative analysis, mainly the inability to identify small concentrations of
protein, must be overcome as any contaminants left after decontamination may
present a cross infection risk. The precipitation of more instrument eluent to
increase the concentration of common contaminants or the application of more
sensitive proteomic identification techniques may overcome these shortcomings.
The technique relies on the desorption of protein from the surface and is only as
sensitive to how much can be removed from the surface. This work should be
combined with surface analysis of instruments to construct a complete picture of
instrument contamination before and after the decontamination process. The
methods in combination can also validate different instrument cleaning
processes and highlight any improvements that need to be made in processes or
cleaning solutions if certain proteins remain after decontamination.

Chapter 6 166
6 Chapter 6: Surface Analysis of Dental Handpiece
Parts.

Chapter 6 167
6.1 Introduction
The inspection stage of the instrument decontamination process is essential to
detect any failures of the cleaning process which is visible soil that will not be
removed by subsequent sterilization and may also inhibit the sterilization
process (Amaha and Sakaguchi, 1954, Lipscomb et al., 2008) . The current
method utilised routinely in SSD’s relies on a visual inspection to ensure that the
instrument is not damaged and to detect any contaminants that are visible to
sight including haemoglobin in blood (Lipscomb et al., 2008). Previous research
into instrument contamination has also utilised visual analysis by illumination
and magnification and also relied on desorption of contamination from the
surface through the application of surface swabbing or flushing of the instrument
for the removal of contaminants from the instrument surface for analysis (Smith
et al., 2005, Herd et al., 2007). These visual and desorption methods are also
recommended by the European standard BS-EN-ISO-15883 part 1 to validate the
efficacy of cleaning processes. Concerns have been raised at the sensitivity and
limits of detection of both methods (Lipscomb et al., 2006b, Baxter et al.,
2006), and of the contamination that remains on the surface of the instrument
during sampling that would not be detected. The contaminants observed will
also depend on the analysis being performed on the instrument samples whilst
other residual contamination may get overlooked.
In the previous chapters of this study, identification of contaminants has relied
on desorption of the contaminants from the surface. This has a calculated
efficacy of 67% of bacteria removed (Chapter 4) and 87% of protein (Chapter 5).
The remaining contaminants on the surface require analysis to build a complete
picture of instrument contamination. Surface analysis techniques are
increasingly being utilised to provide a microscopic view of instrument surfaces
(Baxter et al., 2006). These techniques can visualise bacterial cells and other
tissue debris whilst methods also exist that allow for the identification of these
contaminants at the elemental level (Lipscomb et al., 2006b). Other techniques
allow for a quantitative analysis of any biological material present on the
surface without the need for the removal of contamination (Baxter et al., 2006),
or the treatment of the instrument with any chemicals that may cause damage
to sampled instruments.

Chapter 6 168
The aim of this study was to undertake a detailed surface analysis of dental HP
parts before and after decontamination procedures to detect contamination on
the surface. This study aimed to provide a detailed visualisation of the surface
to detect contaminants invisible to routine visual analysis and to undertake a
quantitative analysis of protein contamination without relying on the desorption
of protein surface.

Chapter 6 169
6.2 Results
6.2.1 Scanning electron microscopy
A high speed turbine was analysed for surface contamination using scanning
electron microscopy without prior fixation. Additionally, a high-speed turbine
and low-speed upper gear from St Albans repair facility underwent sample
fixation for biological material before analysis (Section 2.4.1.1).
The SEM analysis without prior fixative showed contamination on the turbine
blade (Figure 6-1 [a] [b]). A turbine from a WA- 56 high speed HP (Figure 6-2 [a])
and an upper gear of a WA – 56 low speed HP (Figure 6-3[a]) were subjected to
sample fixation (Section 2.4.1.1) to allow the detection of biological material
using the SEM. Contamination, including bacteria was present on the blade of
the high speed turbine (Figure 6-2 [b][c]) and the ball bearing gear (Figure 6-3
[a],[b],[c]). Contamination was also visible on the low speed gear (Figure 6-4
[a], [b],[c]).

Chapter 6 170
Figure 6-1 SEM images of a used, unprocessed high-speed turbine. The turbine
was imaged without prior fixation at 120x magnification (a) and 1000x (b). The
arrows indicate potential contaminants on the surface.

Chapter 8 171
Figure 6-2 SEM imaging of TA-98 high speed turbine from a repair facility.
The biological material on the turbine surface was fixed and the turbine viewed
at 15x magnification for an overview (a) and the blade was viewed at 1000x
magnification where contamination was observed on the surface (b).
Contamination was evident along the entire surface of the turbine blade at
3000x magnification (c).

Chapter 6 172
Figure 6-3 Ball bearing cage of turbine from TA-98 high-speed turbine. The
ball bearing gear was visualised at 22x magnification after fixation of biological
material (a). Contamination was visible on the surface of the ball bearing gear at
1000x magnification (b). Contaminants were also viewed at 10000x magnification
(c).

Chapter 6 173
Figure 6-4 SEM images of WA- 56 low speed gear from repair facility. The
biological material on the higher gear surface was fixed and the turbine viewed
at 22x magnification for an overview (a) and the blade was viewed at 1000 x
magnification where contamination was observed on the hollow parts of the gear
(b). Contamination was also evident along the entire surface of the turbine
blade at 3000x magnification (c).

Chapter 6 174
6.2.2 Scanning electron microscopy and energy dispersive x ray
analysis
A total of 3 used unprocessed and 3 decontaminated (Table 2.2) high speed
turbines, 1 used unprocessed and 1 decontaminated high speed caps, 1 used
unprocessed surgical gear and 1 decontaminated surgical gear, 1 used
unprocessed surgical lever and 1 decontaminated surgical lever, and 1 repair
facility high gear and 1 used, unprocessed high gear were analysed. Parts from
unused HP’s that had been through a decontamination process were sampled as
negative controls.
For the high speed HP’s, contamination was detected on the high speed turbines
(Figure 6-5 [a] [b]), and the used, unprocessed and decontaminated high speed
caps (Figure 6-5 [c],[d]). For surgical HP’s, contamination was detected on gears
(Figure 6-6 [a],[b],[c],[d]), and used, unprocessed levers (Figure 6-6 [c],[d]). For
low speed HPs, contamination was detected on used, unprocessed higher gears
(Figure 6-7 [a],[b]) and used, unprocessed and decontaminated lower gears
(Figure 6-7 [c],[d]).
Contamination was subdivided into organic contamination indicated by dominant
carbon and oxygen peaks (Figure 6-8 [a]), calcium deposits indicated by
dominant calcium, oxygen and carbon peaks (Figure 6-8 [b]), sulphur organic
contamination indicated by dominant carbon, oxygen and sulphur peaks (Figure
6-8 [c]) and lubricating oil trapped contaminants indicated by a carbon based
peak with visible contaminants in contact (Figure 6-8 [d]). Analysis of non-
contaminated surfaces adjacent to contamination revealed metallic elements
with different composition to each contaminant (Figure 6-9). All contaminant
groups were detected on high speed turbines before and after decontamination
(Figure 6-10 [a],[b],[c],[d], Figure 6-11[a],[b],[c],[d])); surgical gears before and
after decontamination (Figure 6-14 [a],[b],[c],[d], Figure 6-15 [a],[b],[c],[d]);
surgical levers before decontamination (Figure 6-16 [a],[b],[c],[d]); low speed
upper gears before decontamination (Figure 6-18 [a],[b],[c],[d]) and low speed
upper gears before and after decontamination (Figure 6-19 [a],[b],[c],[d],Figure
6-20 [a],[b],[c],[d]).). Only organic contamination was found on high speed caps
before and after decontamination (Figure 6-12 [a],[b], Figure 6-13[a],[b]) and

Chapter 6 175
only organic contamination, lubricating oil trapped contaminants and sulphur
based contaminants were found on decontaminated surgical levers (Figure 6-17
[a],[b],[c]).
Figure 6-5 High speed HP parts sampled using SEM and EDX analysis. Both high
speed turbines (a, b) and caps (c, d) were sampled using SEM and EDX analysis. A
microscopic view of the turbine is shown in (c) at 50x magnification and a
microscopic view of the cap is shown in (d) at 41x magnification.

Chapter 6 176
Figure 6-6 Surgical HP parts sampled using SEM and EDX analysis. Both surgical
HP gears (a, b) and the levers (c, d) were sampled using SEM and EDX analysis. A
microscopic view of the spring of the gear is shown in (c) at 44x magnification
and a microscopic view of the internal part of the lever is shown in (d) at 47x
magnification.

Chapter 6 177
Figure 6-7 Low speed HP parts sampled using SEM and EDX analysis. Both low
speed higher gears (a, b) and lower gears (c, d) were sampled using SEM and EDX
analysis. A microscopic view of the gear is shown in (c) at 50x magnification and
a microscopic view of the end of the lower gear is shown in (d) at 55x
magnification.

Chapter 6 178
Figure 6-8 Typical elemental analysis of HP surface contaminants by EDX
analysis. All contaminants were broadly placed into 4 categories, organic
contamination (a) indicated by the carbon and oxygen peaks, calcium based
contamination (b) indicated by a calcium peak, sulphur based contamination (c)
indicated by carbon, oxygen, and sulphur peaks and carbon based contamination
(d) indicated by a carbon peak. Each contaminant was found on all surfaces
scanned.

Chapter 6 179
Figure 6-9 Typical elemental analysis of HP metallic surfaces by EDX analysis.
Surfaces in the vicinity of contamination were analysed as controls. Metallic
elements including chromium (a) found on the lower gear, aluminium (b) found
on the high speed turbine, and iron (c) found on the surgical gear and high speed
caps.
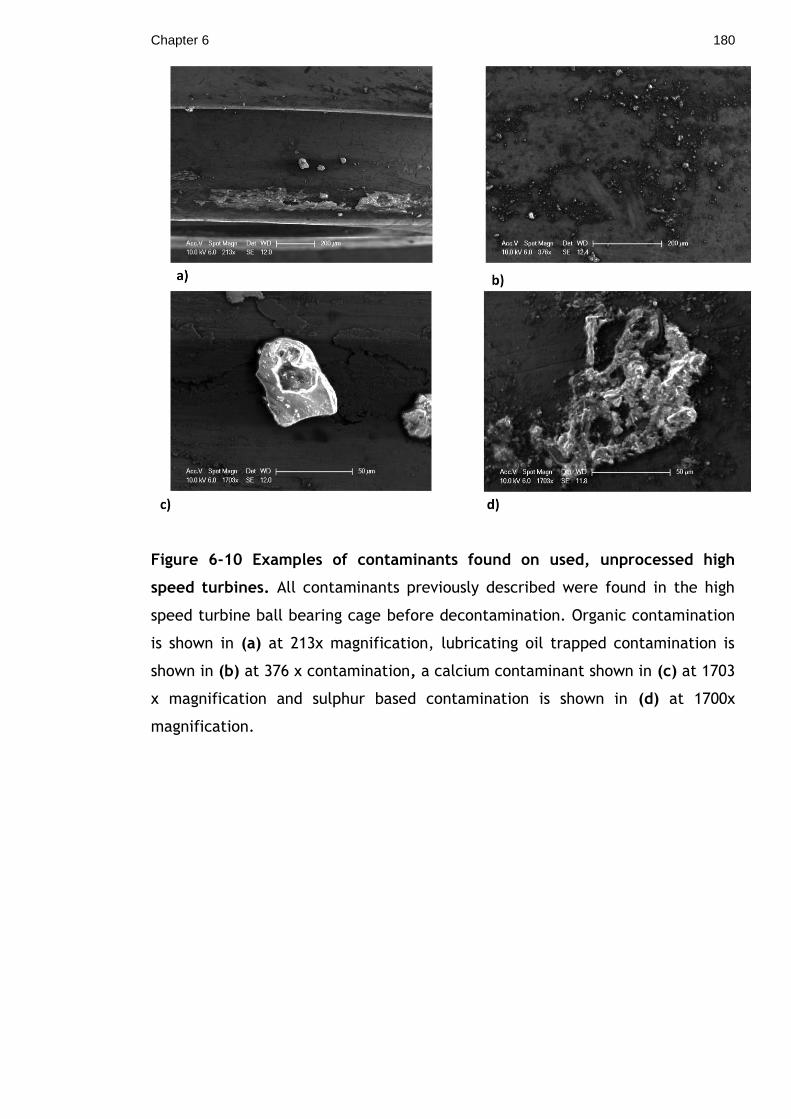
Chapter 6 180
Figure 6-10 Examples of contaminants found on used, unprocessed high
speed turbines. All contaminants previously described were found in the high
speed turbine ball bearing cage before decontamination. Organic contamination
is shown in (a) at 213x magnification, lubricating oil trapped contamination is
shown in (b) at 376 x contamination, a calcium contaminant shown in (c) at 1703
x magnification and sulphur based contamination is shown in (d) at 1700x
magnification.

Chapter 6 181
Figure 6-11 Examples of contaminants found on decontaminated high speed
turbines. All contaminants previously described were found in the high speed
turbine ball bearing cage before decontamination. Organic contamination is
shown in (a) at 1238x magnification, lubricating oil trapped contamination is
shown in (b) at 208 x contamination, a calcium contaminant shown in (c) at 676
x magnification and sulphur based contamination is shown in (d) at 162x
magnification.
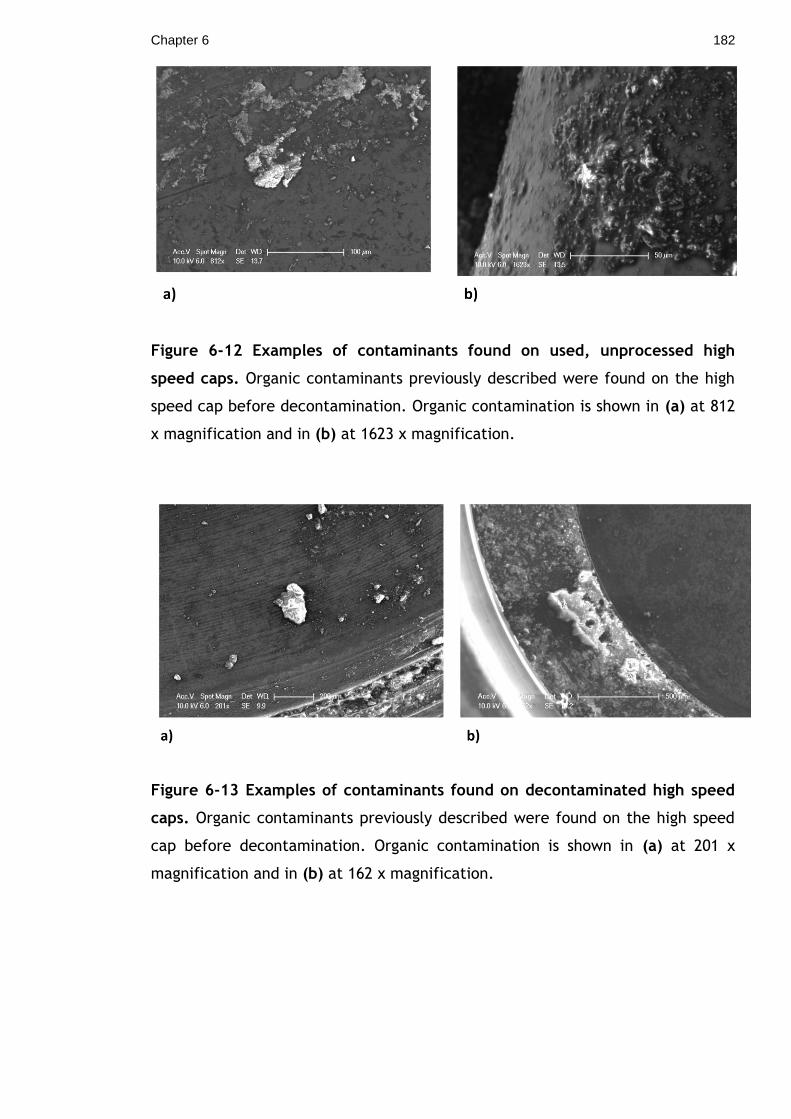
Chapter 6 182
Figure 6-12 Examples of contaminants found on used, unprocessed high
speed caps. Organic contaminants previously described were found on the high
speed cap before decontamination. Organic contamination is shown in (a) at 812
x magnification and in (b) at 1623 x magnification.
Figure 6-13 Examples of contaminants found on decontaminated high speed
caps. Organic contaminants previously described were found on the high speed
cap before decontamination. Organic contamination is shown in (a) at 201 x
magnification and in (b) at 162 x magnification.

Chapter 6 183
Figure 6-14 Examples of contaminants found on used, unprocessed surgical
gears. All contaminants previously described were found in the gear before
decontamination. Organic contamination is shown in (a) at 206 x magnification,
lubricating oil trapped contamination is shown in (b) at 790 x contamination, a
calcium contaminant shown in (c) at 817 x magnification and sulphur based
contamination is shown in (d) at 206 x magnification.

Chapter 6 184
Figure 6-15 Examples of contaminants found on decontaminated surgical
gears. All contaminants previously described were found on the spring before
decontamination. Organic contamination is shown in (a) at 83 x magnification,
lubricating oil trapped contamination is shown in (b) at 1356 x contamination, a
calcium contaminant shown in (c) at 175 x magnification and sulphur based
contamination is shown in (d) at 85 x magnification.

Chapter 6 185
Figure 6-16 Examples of contaminants found on used, unprocessed surgical
levers. All contaminants previously described were found on the lever in contact
with the gear before decontamination. Organic contamination is shown in (a) at
181 x magnification, lubricating oil trapped contamination is shown in (b) at 726
x contamination, a calcium contaminant shown in (c) at 175 x magnification and
sulphur based contamination is shown in (d) at 359 x magnification.

Chapter 6 186
Figure 6-17 Examples of contaminants found on decontaminated surgical
levers. Contaminants previously described were found on the lever in contact
with the gear before decontamination. Organic contamination is shown in (a) at
400 x magnification, sulphur based contamination is shown in (b) at 1600 x
magnification and lubricating oil trapped contamination is shown in (c) at 400x
magnification. No calcium based contamination was observed.

Chapter 6 187
Figure 6-18 Examples of contaminants found on used, unprocessed low speed
upper gears. All contaminants previously described were found in the high speed
turbine ball bearing gear before decontamination. Organic contamination is
shown in (a) at 1504 x magnification, lubricating oil trapped contamination is
shown in (b) at 376 x contamination, a calcium contaminant shown in (c) at 1504
x magnification and sulphur based contamination is shown in (d) at 188 x
magnification.

Chapter 6 188
Figure 6-19 Examples of contaminants found on used, unprocessed low speed
lower gears. All contaminants previously described were found in the low speed
lower gear before decontamination. Organic contamination is shown in (a) at 190
x magnification, lubricating oil trapped contamination is shown in (b) at 760 x
contamination, a calcium contaminant shown in (c) at 380 x magnification and
sulphur based contamination is shown in (d) at 380 x magnification.

Chapter 6 189
Figure 6-20 Examples of contaminants found on decontaminated low speed
lower gears. All contaminants previously described were found on the low speed
lower gear after decontamination. Organic contamination is shown in (a) at 44 x
magnification, lubricating oil trapped contamination is shown in (b) at 190 x
contamination, a calcium contaminant shown in (c) at 190 x magnification and
sulphur based contamination is shown in (d) at 380 x magnification.
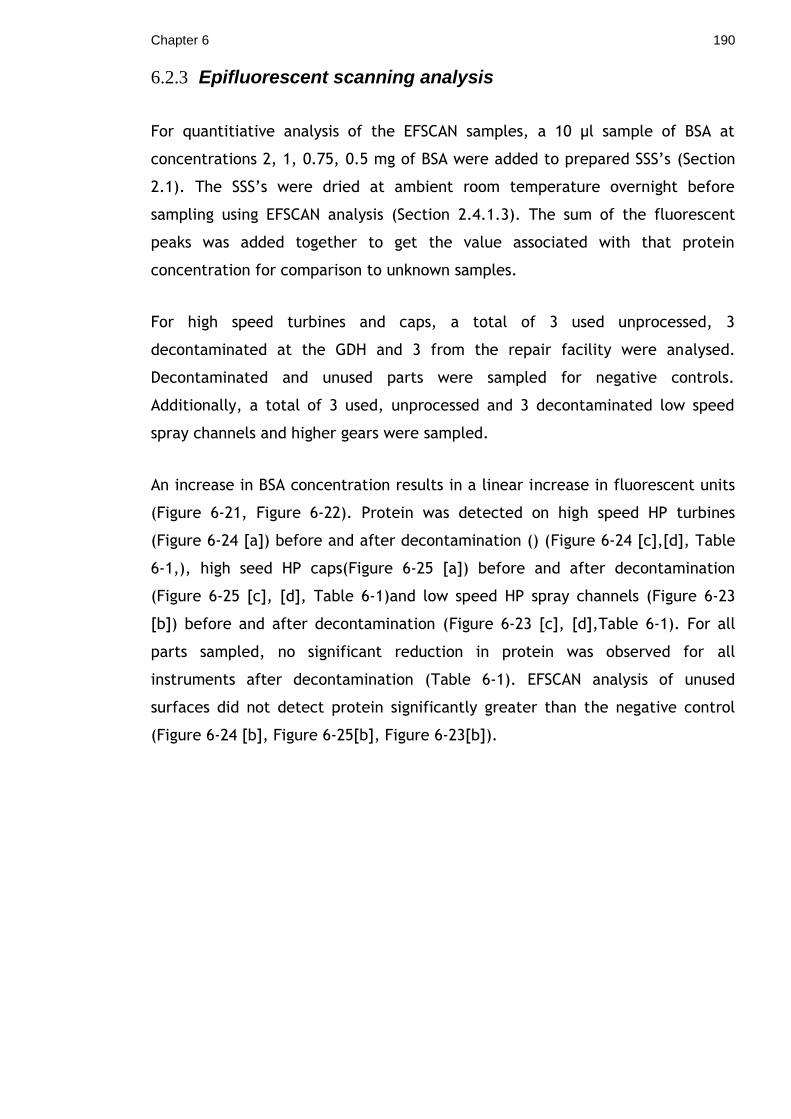
Chapter 6 190
6.2.3 Epifluorescent scanning analysis
For quantitiative analysis of the EFSCAN samples, a 10 µl sample of BSA at
concentrations 2, 1, 0.75, 0.5 mg of BSA were added to prepared SSS’s (Section
2.1). The SSS’s were dried at ambient room temperature overnight before
sampling using EFSCAN analysis (Section 2.4.1.3). The sum of the fluorescent
peaks was added together to get the value associated with that protein
concentration for comparison to unknown samples.
For high speed turbines and caps, a total of 3 used unprocessed, 3
decontaminated at the GDH and 3 from the repair facility were analysed.
Decontaminated and unused parts were sampled for negative controls.
Additionally, a total of 3 used, unprocessed and 3 decontaminated low speed
spray channels and higher gears were sampled.
An increase in BSA concentration results in a linear increase in fluorescent units
(Figure 6-21, Figure 6-22). Protein was detected on high speed HP turbines
(Figure 6-24 [a]) before and after decontamination () (Figure 6-24 [c],[d], Table
6-1,), high seed HP caps(Figure 6-25 [a]) before and after decontamination
(Figure 6-25 [c], [d], Table 6-1)and low speed HP spray channels (Figure 6-23
[b]) before and after decontamination (Figure 6-23 [c], [d],Table 6-1). For all
parts sampled, no significant reduction in protein was observed for all
instruments after decontamination (Table 6-1). EFSCAN analysis of unused
surfaces did not detect protein significantly greater than the negative control
(Figure 6-24 [b], Figure 6-25[b], Figure 6-23[b]).

Chapter 6 191
Figure 6-21 EFSCAN analysis of BSA standards on stainless steel discs. BSA of
differing concentrations was applied to 316 stainless steel disc and analysed.
Each peak represents protein contamination on the surface. The data is
representative of 6 discs of each concentration.

Chapter 6 192
Figure 6-22 Standard curve of BSA scanned using EFSCAN. BSA of differing
concentrations was added to 316 stainless steel discs and scanned. An increase
in BSA protein concentration results in a linear increase in fluorescence. Data
shown is the mean of 6 discs ± the StEM.

Chapter 6 193
Table 6-1 Protein detected on HP parts using EFSCAN analysis. The table also
contains protein previously isolated from HP parts using the method described in
section 5.2.25 for comparison.
Handpiece Part Median Protein Concentration
detected (µg/part)
Range Protein Concentration
detected (µg/part)
Median Protein Previously
Detected by SDS extraction and
the OPA assay (µg / part)
High Speed Turbine Used, unprocessed
10.17 (n=3) 7.7 – 13.56 1.3 (n=20)
High Speed Turbine Decontaminated
15.75 (n=3) 13.2 – 20.54 0 (n=20)
High Speed Turbines Repair Facility
10.43 (n=3) 5.7 – 18.01 3.4 (n=20)
High Speed Caps Used, unprocessed
5.2 (n=3) 4.2 – 9.6 Not previously sampled
High Speed Caps Decontaminated
6.2 (n=3) 2.6 – 6.6 Not previously sampled
High Speed Caps New
0 (n=1) 0 – 0 Not previously sampled
Spray channels Used, unprocessed
8.7 (n=3) 4.6 – 11.94 15.41 (n=20)
Spray channels, Decontaminated
2.9 (n=3) 2.3 – 10 0 (n=20)
Spray channels, new
0 (n=3) 0 – 0 0 (n=20)

Chapter 6 194
Figure 6-23 EFSCAN analysis of low speed HP spray channel surfaces. Low
speed HP spray channels (a) that were unused were sampled using EFSCAN
analysis (b). Spray channels were also sampled after use and before
decontamination (c) and after decontamination (d). Peaks represent protein on
the surface. No peaks are visible in the new, unused sample. The graphs are
representative of 3 spray channel samples.

Chapter 6 195
Figure 6-24 EFSCAN analysis of high speed HP turbine surfaces. High speed HP
turbines (a) that were unused were sampled using EFSCAN analysis (b). Turbines
were also sampled after use before decontamination (c) and after
decontamination (d). Peaks represent protein on the surface. Significantly lower
peaks are visible in the new, unused sample. The graphs are representative of 3
turbine samples.

Chapter 6 196
Figure 6-25 EFSCAN analysis of high speed HP cap surfaces. High speed HP
caps (a) were sampled unused using EFSCAN analysis (b). Caps were also sampled
after use before decontamination (c) and after decontamination (d). Peaks
represent protein on the surface. Significantly smaller peaks are visible in the
new, unused sample (b). The graphs are representative of 3 cap samples.

Chapter 6 197
6.2.4 Discussion
Methods to determine the efficacy of the cleaning process are under constant
validation and review as the cleaning step increases in importance and with
increasing concern of the sensitivity of current detection methods (Baxter et al.,
2006, Lipscomb et al., 2006a). Surface analysis methods provide an accurate
representation of the cleanliness of the surface rather than relying on a visual
analysis or desorbing contamination from the instrument surface both of which
may have limited sensitivity (Lipscomb et al., 2006b).
To complement the previous work determining the contamination of dental HP
parts (Chapter 5, Chapter 6), surface analysis techniques were undertaken to
overcome several shortcomings with the previously used methods. These are the
characterisation of contaminants that cannot be removed, the identification of
additional contaminants that were not previously sampled and to determine the
specific locations of contaminants. Surface analysis was also conducted on HP
parts that had not been previously sampled. The high speed HP cap has been
found to be contaminated through negative pressure along with the turbine and
the air and water lines (Matsuyama et al., 1997). The high speed HP caps had
not previously been sampled as the caps were impossible to immerse without
contacting the outer end of the cap which may be exposed to environmental
contamination not associated with HP use. Surface analysis techniques allowed
sampling of the inside of the cap and therefore only contamination through HP
use would be visualised. For these reasons, the bottom of the surgical HP lever,
which is in contact with the surgical HP gear during use, was also sampled using
surface analysis. The survey of HP’s was also extended to locations not
previously associated with HP contamination including the higher and lower gear
of the low speed HP.
SEM analysis can provide images of the surface to a resolution that can identify
individual bacteria. Without prior fixation of the instrument part, contamination
is difficult to characterise as visibility of SEM samples is reliant on the sample
being conductive to the electron beam (Anderson, 1951). Fixation requires
exposure of the instrument part including sodium cacodylate and glutaraldehyde
which means that the HP part must be sacrificed to view biological material. A

Chapter 6 198
turbine and a higher gear from the repair facility were found to have
contamination on the surface. The source of the turbines and gears was unknown
and therefore the routine HP decontamination process used was not known. All
HP’s sent to the repair facility came with documentation indicating that a
decontamination process had been undertaken before sending and upon receipt
had been sterilized using a vacuum sterilizer. Contamination was noted along
the surface of the high speed turbine blade and the ballbearing gear cases. This
contamination cannot be quantified or identified and fixation may alter the
structure of contaminants. Whilst most of the contaminants examined in detail
were the size and morphology of bacilli and cocci bacteria, the smaller
contamination coating the surface of the turbine may be proteinacious in
nature. The fact that contamination was located in all areas of the HP turbine
shows the importance of a cleaning process that can clean the turbine blades
but also access the ball bearing gears which are in direct contact with the inner
structure of the HP head. Contamination was also located on the low speed
higher gear despite there being no similar negative pressure due to the low
speed HP being powered by electricity. No study has repeated the experiment of
Lewis et al. (1992) visualising the entry of blue oil into the internal low speed HP
parts (Lewis and Boe, 1992) but studies have shown both the in vitro and in vivo
contamination of low speed HP’s therefore showing the movement of
contamination into the internal areas of the low speed HP (Chin et al., 2006,
Herd et al., 2007). Contamination was found on the smooth surface and the
complex ridged parts indicating that surface structure does not affect the
adsorption of contamination.
To overcome the problem of contaminant identification, EDX analysis was used
to identify the elemental contaminants of gross contamination. Only elements
with more outer electrons than carbon can be detected due to the movement of
electrons from the outer shell to the inner shell of the atom after the removal of
inner shell electrons by the electron beam. Movement of the electron causes an
emission of X-rays, which is specific for each atom and can therefore identify
each atom in a sample. Contaminants were found on every surface sampled
including HP parts that had been through the GDH decontamination process
(Section 2.1.14, Table 2.2) and the pattern of contamination was similar to
previous instrument studies using EDX to measure instrument contamination with

Chapter 6 199
contamination existing as small pockets (Baxter et al., 2006). The main
difference for HP contamination compared to previous studies was the presence
of lubricating oil which was spread over much of the surfaces. Lubricating oil is
part of routine HP maintenance and controversy exists for the ability of the
lubricating oil to trap contaminants and to inhibit the sterilization process (Lewis
and Boe, 1992) (Edwardsson et al., 1983). Whilst this method cannot completely
identify contaminants, the presence of certain elements such as carbon, sulphur
and oxygen may indicate the presence of organic contamination such as proteins
(Baxter et al., 2006). It is impossible to use the data of the number of
contaminants on each surface to undertake a quantitative measurement of
protein. Whilst spots of organic contamination are present on all surfaces, it is
unclear if this represents a failure of cleaning processes according to BS-EN-ISO-
15883 part 1 or if the contaminants present a cross contamination risk. The SEM
and EDX method is useful for showing the location of contaminants on the
surfaces and may inform development of HP’s if there are particular locations on
the surface that are more contaminated than others. This was noted for the high
speed HP where more contaminants were present on the ball bearing gear than
the turbine blade and the surgical gear where the entire spring was covered in
contamination.
A method that can combine surface analysis with quantitative data is through
the EFSCAN analysis. By scanning BSA standards dried onto stainless steel
surfaces, a standard curve can be constructed similar to that used for
quantitative protein assays (Chapter 3). Whilst a linear relationship between
protein concentration and FU’s was observed, the EFSCAN method was not
assessed for sensitivity, specificity, and the ability to calculate the protein
concentration of common instrument contaminants as detailed by the FDA
bioanalytical standards (Chapter 3). The results of new, unused, decontaminated
HP parts showed a reaction with the HP surface including lubricating oil that was
not significantly larger than the negative control which partly validates the
EFSCAN method for use on HP’s.
The sensitivity of the EFSCAN analysis was calculated as 5 µg of BSA protein. The
sensitivity of the technique can be improved by the addition of fluorecsin
isothiocyanate to the proteins on the surface which bonds to the thiol groups of
proteins to give a stronger fluorescent signal (Baxter et al., 2009). This process

Chapter 6 200
was not undertaken with dental HP’s to avoid any issue with toxicity upon the
return of the HP to the GDH population.
Despite being less sensitive than the OPA assay (Chapter 3), more protein was
observed on each HP part than the median protein isolated from separate parts
sampled using the methods detailed in chapter 6 though the protein
concentration isolated for high speed HP turbines and low speed HP spray
channels was within the range of protein isolated in chapter 6. This may be due
to the protein that is remaining on the surface that is unable to be desorbed
using the methods detailed in chapter 6 and this may indicate that dental HP
parts contain more residual protein contamination than had been previously
estimated. Each turbine and spray channel was only scanned on one side due to
the contamination of the instrument part that may occur from placement on the
taped surface, the protein concentration on each instrument part may therefore
be underestimated. The reading for the spray channels represent the surface of
the spray channel rather than the inside of the narrow lumens and lumens would
have to be cut open and sacrificed if the internal contamination was to be
characterised. There was little difference in protein contamination of
instrument parts that had been subjected to a decontamination process though
it was unknown what the starting protein concentration of each instrument was
before decontamination.
EFSCAN and EDX analysis has previously been utilised to undertake a quantitative
analysis of instrument contamination of ophthalmic micro forceps and stainless
steel curved artery forceps before and after decontamination using gas-plasma
treatment (Baxter et al., 2009). The starting protein concentration of
ophthalmic micro forceps was calculated as 1.8 µg or a total of 13.1 FU’s and a
total of 30.2 FU’s were found on curved artery forceps. These FU’s were reduced
to 0.030 FU’s for ophthalmic micro forceps and 0.017 FU’s upon gas plasma
decontamination and indicated a removal of over 99% of bound protein from the
surface (Baxter et al., 2009). A similar sudy detailing the passage of a dental HP
through a decontamination process would allow the measurement of the efficacy
of HP decontamination technologies. This would allow a comparison of
instrument surfaces allowing knowledge of the initial contamination and the
calculation of how much protein has been removed from the surface as well as
visualisation of areas that retain more contamination.

Chapter 6 201
Previous studies using surface analysis to characterise decontamination on a
surface have involved visualisation using a number of methods including
episcopic differential interference contrast/epifluorescence microscopy and
SYPRO® Ruby analysis (Lipscomb et al., 2006c), Auger spectroscopy (Kobayashi
et al., 2009), Ramen spectroscopy, FT-IR spectroscopy (Kobayashi et al., 2009),
and ToF- SIMS (Boyd et al., 2001). These contamination studies incorporate
surgical instruments and the validation of cleaning processes in other industries
such as the dairy industry (Daufin et al., 1991) and the electronics industry
(Martin et al., 1999).
Most of the methods highlighted above rely on the bombardment of a sample
with an excitation agent and reading the specific reaction of any contaminants
upon excitation. Auger spectroscopy, like EDX analysis, relies upon an electron
beam to knock out an inner shell electron which causes the movement of
electrons from an outer shell and the emission of an auger electron that is
specific to each atom (Hofmann, 1979). Ramen and FT-IR spectroscopy rely on
the reaction with infrared light with Ramen spectroscopy measuring the
scattering of infrared light by the surface and FT-IR spectroscopy measuring the
emission of light upon stimulation of the surface with infrared light (Wallach et
al., 1970, Becker and Farrar, 1972) . ToF -SIMS relies on the bombardment of the
surface with an ion in an ultrahigh vacuum. This causes the scattering of
secondary ions of atoms on the surface. These ions can then be analysed using
mass spectrometry by calculating the time for the ions to reach the detector.
This ―time of flight‖ is compared to the known ―time of flight‖ of atoms
(Fitzgerald and Smith, 1995). Epifluorescence microscopy relies on the detection
of SYPRO® Ruby stain which interacts with the amino acids lysine, arginine, and
histidine to allow for the visualisation of proteins on the surface with an
estimated sensitivity of 85 pg/mm2 of protein (Lipscomb et al., 2006b, Lopez et
al., 2000).
A study into the protein contamination of instruments detected with SYPRO
Ruby® after cleaning with an AWD (Lipscomb et al., 2006c). A contamination
scale was devised with the maximum protein detected being more than 4.2 µg of
protein down to a scale of 0-42 ng of protein based on operator visualisation
(Lipscomb et al., 2006c). All instruments sampled, tissue forceps, scissors, towel

Chapter 6 202
clips, needle holders, haemostats, were found to have contamination indexes
between 3-4 indicating that the protein observed on the surface was between
0.42 to 4.2 µg which the authors indicated showed a ―poor‖ standard of cleaning
(Lipscomb et al., 2006c). Contamination of artheroscopic blades decontaminated
using high pressure water flow, ultrasonic cleaning and sterilized using ethylene
oxide was measured using FT-IR and Auger spectroscopy (Kobayashi et al., 2009).
The study found contaminants including collagen, proteins, hydrocarbons,
calcium carbonate, hydroxyapetite, esters, and fatty acids (Kobayashi et al.,
2009). Whilst it is clear that contaminants remain on the surface after
decontamination, the authors state that the impact of these contaminants on
infection control requires further study (Kobayashi et al., 2009). The study also
highlighted the more detailed identification of contaminants through FT –IR
spectroscopy compared to EDX analysis as only an elemental analysis was
possible using EDX (Kobayashi et al., 2009).
Though the ToF SIMS technique has not been used for surgical instrument
contamination, the technique has been previously used to determine the
cleanability of stainless steel contaminated with milk powder using a brush or a
spray cleaning technique (Boyd et al., 2001). The spray cleaning technique was
less efficacious at removing fatty acids than the brush technique though the
spray technique resulted in an increase in surface protein removal (Boyd et al.,
2001). This study shows the potential application of the ToF-SIMS technique to
instrument contamination.
These sensitive surface analysis techniques can be used for the validation of
cleaning processes. By sampling an instrument before and after decontamination
at specific sites where contamination is noted, the ability of the cleaning
process to remove these contaminants can be assessed. The definition of ―clean‖
may require readjustment as the increase in sensitivity of detection afforded by
these techniques allows for the detection of smaller concentrations of protein
and the cross contamination risk would have to be assessed. A combination of
quantitative surface analysis methods such as EFSCAN and qualitative methods
allowing for identification of these contaminants may help in this decision.

Chapter 6 203
In conclusion, contamination was detected in HP parts before and after
decontamination processes. A study into the cleanability of HP’s using
documented processes should be considered to note the effect the cleaning
process has on HP contamination. There exists a variety of surface analysis
techniques to provide a microscopic view and detailed identification of
instrument surface contaminants. In conjunction with previously described
techniques to desorb contamination from the surface (Chapter 4, Chapter 5), it
is possible to build a complete picture of instrument surface contamination.
Whilst it is possible to examine groups of used, unprocessed and decontaminated
instruments, the techniques are best used as part of validation of cleaning
processes to put contamination into context and to identify areas where
contamination remains to help inform development of instrument design or the
cleaning process (Baxter et al., 2009). Qualitative data can also help put
contaminants into context by determining any cross contamination risk or the
study. The increased sensitivity of the techniques may result in more ―failures‖
of the cleaning process and defining an acceptable standard when considering
sensitive surface analysis techniques should depend on the nature of the
contaminant (Lipscomb et al., 2006c).

Chapter 8 204
7 Chapter 7: Assesment of handpiece cleaning
processes, chemicals and equipment.

Chapter 7 205
7.1 Introduction
The cleaning stage of the instrument decontamination process is used to remove
inorganic and organic debris that may inhibit the subsequent disinfection and
sterilization processes. These contaminants can be as diverse as proteins and
complex bacterial biofilms. From the previous work in this study, it is clear that
HP’s are contaminated with bacteria and protein associated with blood
contamination (Chapter 4, Chapter 5).
The first stage of biofouling of medical instrumentation is the adsorption of
protein on the surface (Desroches et al., 2007). Bacteria can then adsorb to the
surface using specific receptors for human proteins such as fibrinogen (Tegoilia
and Cooper, 2002). When bacterial cells adsorb to a surface, cells can form a
matrix consisting of polysaccharides, protein nucleic acids and amphiphilic
compounds known as a biofilm (Costerton et al., 1978). The biofilm structure
provides a physical and chemical barrier for the bacterial cells against
antimicrobial agents and can also inhibit sterilization processes (Campanac et
al., 2002, Gibson et al., 1999). A biofilm also allows the retention and shedding
of bacterial cells if untreated. Cleaning solutions allow disruption of the biofilm
structure and removal of adsorbed protein (Gibson et al., 1999).
The parameters that affect cleaning efficacy are summarised in the Sinners
circle, and these include the temperature of the cleaning solution, the cleaning
solution used, the amount of time that cleaning occurs for, and the amount of
mechanical energy that is used for the cleaning process (Smulders et al., 2007).
Changing a variable may have a detrimental impact on cleaning outcomes or may
result in more efficacious cleaning.
Whilst most variables can only increase or decrease, changing the cleaning
solution and the water quality may have multiple affects on the cleaning
process. Detergents often have complex and unknown formulations and have
different active compounds. Concerns have been raised over the effect of
certain cleaning solutions on contaminant removal with some studies
demonstrating the fixing of blood and protein to surfaces (Prior et al., 2004,
Nakata et al., 2007). The water quality may also affect the cleaning process with

Chapter 7 206
dissolved solids and the hardness of the water having an effect on cleaning
efficacy. The parameters of water are dependent on the water source and may
impact on the efficacy of cleaning at different locations.
Previous work into cleaning efficacy has utilised either the in vivo process or
involved the development of models based on various cleaning parameters. For
some complex models, it is difficult to determine what effect the cleaning
solution is having on cleaning efficacy (Alfa et al., 2006). A simpler cleaning
model can measure the direct effects of the detergent on the surface to justify
the expense of including them in a cleaning process.
For washer disinfector cleaning validation, the European standard BS- EN- ISO–
15883 parts 1-5 provide details on the construction of test devices and the
application of test soils to assess the efficacy of the washing processes. The test
soil applied is dependent on the instruments or materials to be reprocessed and
vary from defibrinated horse blood to complex formulations containing flour,
blood and bacteria (Zuhlsdorf and Martiny, 2005). The efficacy of the cleaning
process is measured using of 1 of 3 protein assays after desorption of residual
protein from the test pieces or instruments.
The aim of this chapter was to first develop and utilise simple in-vitro cleaning
models to study the effect of alteration of cleaning parameters on the efficacy
of blood removal from a stainless steel surface including the sampling of
cleaning solutions recommended by the dental clinical effectiveness program.
These detergents were then assessed for the ability to disrupt biofilms formed
by dental HP isolates in vitro. The cleaning efficacy of novel HP cleaning
machines was also assessed through the application of a protein based test soil
on 3 different HP’s that was based on typical HP protein contaminants (Chapter
5).

Chapter 7 207
7.2 Results
7.2.1 Water quality and detergent properties
Tap water was obtained from the Glasgow Dental Hospital on the day of the
experiment. The water and detergent qualities were measured using a PCSTestr
35 (Eutech instruments Nijkerk Holland). The pH, conductivity, salinity and total
dissolved solids of each water sample were determined (Table 7-1). A total of 3
alkaline detergents, 3 enzymatic detergents, a handwash and a dental HP
cleaning solution were sampled in the experiment along with 0.1M NaOH (Table
7-2).
Table 7-1 Properties of H2O used in the study
H2O source pH
Conductivity
(µS)
Salinity
(ppm)
Total dissolved
solids (ppm)
Tap (n=3) 6.41 63.7 35.6 46.2
Reverse
Osmosis(n=3) 5.49 2.3 12.5 3.6

Chapter 7 208
Table 7-2 Parameters of sampled detergents
Detergent Manual
Ultra
Sonic AWD Dosage
Temp
Specified pH
Alconox® Yes Yes No
10g
detergent/1l
H2O
H2O = cold,
warm or hot 9.5
Endozime®
AW+® Yes Yes Yes
34ml
detergent/8l
H2O H2O = warm 7.13
Haemo-
sol® Yes Yes No
20g
detergent/
5l H2O
H2O = warm
(50˚C) 10.5
HiBi®
Scrub N/A N/A N/A N/A N/A 5
Rapidex® N/A N/A N/A
1 sachet
(28g)
detergent
H2O = 50˚C
(20˚C-70˚C
acceptable) 11
Rapizyme® Yes Yes Yes
10ml
detergent/
5l H2O H20 = 38˚C 7.24
Sonozyme® No Yes No
1 sachet
(25ml)/ 8l
H2O N/A 5.5
0.1M NaOH N/A N/A N/A N/A N/A 9.3
N/A Denotes no instructions for use in machines or in cleaning processes.

Chapter 7 209
7.2.2 Effect of cleaning time on blood removal from stainless
steel discs
The effect of agitation time on blood removal was assessed by setting the
rocking platform to a moderate speed of 25, 20° tilts/min and 100 µl samples
were taken at 1, 5, 10, 15, and 20 min. Samples were also taken of negative
control discs at each time point. The experiment consisted of 3 discs and the
experiment repeated 3 times. For statistical analysis, data was compared using a
one way analysis of variance (ANOVA).
A median total protein concentration of 3.2 mg was added to each disc. An
increase in time resulted in an increase in blood removal (Figure 7-1,Table 7-3
Blood removal from a stainless steel surface with time). A median of 201 µg of
protein was isolated after 1 min of agitation, 528 µg after 5 min agitation, 1963
µg after 10 min agitation, 2681 µg after 15 min agitation and 3211 µg after 20
min agitation. Significantly (p<0.05) more blood is removed between 5 and 10
min though no significant difference is observed between the other time points.
Over 90 % of blood protein is removed after 20 min of cleaning. No protein was
isolated from the negative control discs.

Chapter 7 210
Figure 7-1 Effect of cleaning time on the removal of citrated blood from a
stainless steel surface. The effect of cleaning time on blood removal from a
stainless steel surface was assessed by measuring the protein desorbed using the
BCA assay. The agitation speed was kept constant at 25 20°C tilts/min and was
assessed at ambient room temperature (22°C). An increase in cleaning time
results in an increase in protein removal from the surface with significantly (* =
p<0.05) more blood removal observed between 5 to 10 min. The data shown is
the mean of results from, 3 discs from 3 experiments and the StEM. The control
shows the initial blood protein concentration applied to the stainless steel disc.

Chapter 7 211
Table 7-3 Blood removal from a stainless steel surface with time
Time (min)
Mean % Blood
removed
Median Blood
Protein
Removed (µg)
Range Blood
Protein
Removed (µg)
1 13 201 0 – 1044
5 26 528 362.4 – 1875
10 55 1963 1032 – 2676
15 80 2681 1976 – 3348
20 94 3211 2593 – 3411
Positive control 3235 3190 – 3421
Negative control <5 <5

Chapter 7 212
7.2.3 Effect of reverse osmosis water temperature on the removal
of blood from a stainless steel disc
For the effect of ROH2O temperature on blood removal, the tilting platform was
set to 25, 20°tilts/min and each well containing a disc was inoculated with 1 ml
of RO H2O at the temperatures of 22°C, 38°C and 50°C. The tilting platform was
inserted into a KS40001 incubator (IKA®, Staufen Germany) at the appropriate
temperature and a 100 µl sample was taken after 5 min. Samples were also
taken of negative control discs for each temperature. The experiment consisted
of 3 discs for each temperature of water sampled. For statistical analysis, data
was compared using a one way ANOVA.
A median of 4.2 mg of protein was added to each stainless steel disc. An
increase in ROH2O temperature results in an increase in blood removal (Figure
7-2,Table 7-4). A median of 1638 µg (range 915 – 1904 µg) of protein was
removed after 5 min when the ROH2O temperature was 22°C , 2155 µg (range
1387 – 2996 µg) of protein was removed at a temperature of 37°C and a median
of 2656 µg (range 1328 – 3778) was removed at a temperature of 50°C
Significantly (p<0.01) more blood is removed when the RO H2O temperature is
raised from 22°C to 50°C (Figure 7-2,Table 7-4). No significant difference was
noted when the RO H2O temperature was raised from 22°C to 38°C. No protein
was isolated from the negative controls.

Chapter 7 213
Control 22 38 500
500
1000
1500
2000
2500
3000
3500
4000
4500
**
RO H2O Temperature (C)
Mean
pro
tein
co
ncen
trati
on
(
g/m
l)
Figure 7-2 Effect of water temperature on the removal of citrated blood from
a stainless steel surface The effect of ROH2O temperature on blood removal
from a stainless steel surface was assessed by measuring the protein desorbed
using the BCA assay. The agitation speed was kept constant at 25 tilts/min at
20°C and samples were taken after 5 min. An increase in cleaning time results in
an increase in protein removal from the surface with significantly (* = p<0.05)
more blood removal observed between 5- 10 min. The data shown is the mean of
results from, 3 discs from 3 experiments and the StEM. The control shows the
initial blood protein concentration applied to the stainless steel disc

Chapter 7 214
Table 7-4 Effect of ROH2O temperature on the percentage of blood removal
RO H2O
Temperature
Mean % Blood
Removed
Median Blood
Protein
Removed (µg)
Range Blood
Protein
Removed (µg)
22˚C 35 1638 915- 1904
37˚C 50 2155 1387 – 2996
50˚C 60 2656 1328 – 3778
Positive Control 4029 4029 – 4309
Negative Control <5 <5

Chapter 7 215
7.2.4 Effect of agitation speed on the removal of blood from a
stainless steel disc
Each well containing a disc was immersed in 1 ml of RO H2O. To assess the effect
of agitation speed, the rocking platform was set at 0, 25, and 45, 20° tilts/min
and 100 µl samples were taken at 5 min. Samples were also taken of negative
control discs for each agitation speed. The experiment consisted of 3 discs for
every agitation speed sampled and the experiment repeated 3 times. For
statistical analysis, data was compared using a one way ANOVA.
A median of 3.1 mg of protein was added to each stainless steel disc. An
increase in agitation speed results in an increase in blood removal (Figure 7-3,
Table 7-5). A median of 374 µg (range 80 – 765 µg) of protein was removed when
no agitation speed was applied, a median of 1158 µg (range 628.5- 1567 µg) was
removed when a 25 tilts/min agitation speed was applied and a median of 2448
µg (range 1508 – 2818 µg). Increasing the agitation speed to 25 tilts/min results
in significantly (p<0.05) more blood removal than when no agitation speed was
applied and significantly (p<0.001) more blood is removed when the agitation
speed is increased from 25 tilts/min to 45 tilts/min. No protein was isolated
from the negative controls.

Chapter 7 216
Figure 7-3 Effect of agitation speed on the removal of citrated blood from a
stainless steel surface. The effect of agitation speed on blood removal from a
stainless steel surface was assessed by measuring the protein desorbed using the
BCA assay. Samples were taken after 5 min and assessed at ambient room
temperature (22°C) An increase in agitation speed results in an increase in
protein removal from the surface with significantly (* = p<0.05) more blood
removal observed when the speed is increased from 0 to 25 tilts/min and when
the speed is increased from 25 tilts/ min to 45 tilts/ min (***p<0.001). The data
shown is the mean of results from, 3 discs from 3 experiments and the StEM. The
control shows the initial blood protein concentration applied to the stainless
steel disc.

Chapter 7 217
Table 7-5 Effect of agitation speed on the percentage and median blood
removal from a stainless steel surface.
Agitation
Speed
Mean % Blood
Protein
Removed
Median Blood
Protein
Removed (µg)
Range Blood
Protein
Removed (µg)
0 13 374 80 – 765
25 36 1158 628 – 1567
45 73 2448 1508 – 2818

Chapter 7 218
7.2.5 Efficacy of blood removal by detergents at room
temperature
Each sampled detergent was diluted according to manufacturer’s instructions in
RO H2O and the cleaning parameters were set at a room temperature solution of
22 OC with the tilting platform set to 25, 20° tilts/min and a 100 µl sample taken
after 5 min. Detergents were also assessed at the manufacturers recommended
temperatures and compared to RO H2O at the same temperatures. For statistical
analysis, the protein removed by each detergent was compared to the protein
removed by tap H2O using a one way ANOVA.
A median of 3.7 mg of blood protein was added to each stainless steel disc. The
total blood protein removed by 9 cleaning solutions was compared with total
blood protein removal by tap H2O alone (Figure 7-4). For each experiment,
ROH2O removal of blood was also assessed at the same time. No solutions
removed significantly more blood than the ROH2O control which removed a
median of 1421 µg of protein (range 516- 1901 µg) including 0.1M NaOH which
removed a median of 1691 µg (range 1170 – 2183 µg). Of all the cleaning
solutions sampled, Haemo-sol® removed the most blood protein with a median
of 2070 µg (range 1314 – 3624 µg) removed (Figure 7-5). HiBi Scrub® removed
significantly (p<0.001) less blood protein with a median of 0 µg (range 0 – 641
µg) than ROH2O (Figure 7-5). For the alkaline detergents, Alconox® removed the
least amount of blood protein of the detergents with a median of 927 µg (range
137 – 1730 µg) and Rapidex® removed a median of 1585 µg (range 1020 – 2405)
of blood protein (Figure 7-5). Of the enzymatic detergents, Sonozyme® removed
the most blood protein with a median of 1907 µg (range 1248 – 2754) Rapizyme®
removed a median of 975 µg (range 245 – 2816 µg) of blood protein and
Endozime® detergent removed a median of 1421 µg (range 694 – 1984 µg). Tap
H2O removed less blood protein than ROH2O with a median of 1356 µg (range 845
– 2176) removed.

Chapter 7 219
Figure 7-4 Comparison of blood protein removal by cleaning solutions. The
efficacy of cleaning solutions at removing blood removal from SSS’s after 5 min
of cleaning was assessed by measuring the protein desorbed using the BCA assay.
All cleaning solutions were compared to blood removal by tap H2O which is
represented by the baseline of the graph. Samples were assessed at ambient
room temperature (22°C) and the agitation speed was set at 25 20°C tilts/min.
All cleaning solutions were compared to the blood protein removed by tap H2O.
No cleaning solutions removed significantly more blood than ROH2O alone though
HiBi® Scrub and W & H cleaning solution remove significantly (***= p<0.001) less
protein. Haemo-sol® detergent removed the most blood protein of the cleaning
solutions sampled. Tap H2O removed less protein than RO H2O though this was
not significant. The data shown is the mean of results from, 3 discs from 3
experiments and the StEM.

Chapter 7 220
Efficacy of detergents at blood removal at manufacturers
recommended temperature
Each sampled detergent was diluted according to manufacturer’s instructions in
RO H2O and the tilting platform set to 25, 20° tilts/min and a 100 µl sample
taken after 5 min. Detergents were also assessed at the manufacturers
recommended temperatures and compared to RO H2O at the same temperatures.
For statistical analysis, the protein removed by each detergent at manufacturers
recommended temperature was compared to protein removed by detergents at
room temperature using a one way ANOVA.
A median of 3.1 mg of protein was applied to each stainless steel disc at 22°C
and 50°C. When the environmental and the ROH2O temperature was increased to
50°C, ROH2O removed a median of 2761 µg (range 2296 – 3000 µg) blood protein
compared to a median of 1380 µg (range 0 – 1901 µg) blood protein at 22°C.
Alconox® detergent removed a median of 1817 µg (range 798 – 2296 µg) blood
protein compared to a median of 927 µg (range 137 – 1731 µg) of blood protein
at 22°C. Haemo-sol® detergent removed a median of 2401 µg (range 1622 – 2776
µg) blood protein compared to a median of 2070 µg (range 1314 – 3024 µg) of
blood protein at 22°C (Figure 7-5,Table 7-6). Rapidex® detergent removed a
median of 2476 µg (range 1428 – 3375 µg) blood protein compared to a median of
1585 µg (range 1020 – 2405 µg) of blood protein at 22°C (Figure 7-5,Table 7-6).
Rapidex® detergent removed significantly (p<0.05) more blood protein at 50°C
than at 22°C (Figure 7-5,Table 7-6). A significant (p < 0.01) increase in
percentage blood removal also occurred in ROH2O alone when the temperature
was increased (Figure 7-5,Table 7-6). Alconox® and Haemo-sol® removed more
blood protein at 50°C compared to 22°C though no significant difference was
noted (Figure 7-5,Table 7-6). No protein was isolated from the negative controls.
When the environmental and solution temperature was raised to 38°C, RO H2O
removed a median of 2155 µg (range 1387 – 2996 µg) of blood protein compared
to a median of 1380 µg (range <5 – 1901 µg) (Figure 7-6,Table 7-7). Endozime®
detergent removed a median of 1893 µg (range 798 – 2296 µg) blood protein
compared to a median of 1421 µg (range 137 – 1731 µg) of blood protein at 22°C
(Figure 7-6,Table 7-7). Rapizyme® detergent removed a median of 2311 µg

Chapter 7 221
(range 1879 – 3050 µg) blood protein compared to a median of 975 µg (range 245
– 2581 µg) of blood protein at 22°C (Figure 7-6, Table 7.12). Endozime® removed
significantly (p<0.001) more blood protein at 38°C than 22°C (Figure 7-6,Table
7-7). No significant difference in percentage blood removal was noted between
Rapizyme® and RO H2O at both temperatures (Figure 7-6,Table 7-7).

Chapter 7 222
Figure 7-5 Effect of detergent manufacturers suggested temperature on the
percentage blood removal by detergents. The efficacy of detergents at blood
removal from stainless steel surfaces after 5 min cleaning at room temperature
(grey bars) and 50°C (white bars) with the agitation speed set to 25 20°C
tilts/min was assessed by measuring the protein desorbed using the BCA assay.
Raising the solution and environmental temperature to 50 °C resulted in a
significant increase (*= p<0.05, ** = p<0.01) in ROH2O blood removal and
Rapidex® blood removal. Alconox® blood removal was increased but not
significantly. No difference was observed in the case of Haemo-sol® detergent.
The data shown is the mean of results from, 3 discs from 3 experiments and the
StEM. The control shows the initial blood protein concentration applied to the
stainless steel discs at each temperature.
.

Chapter 7 223
Table 7-6 Mean percentage and protein removed by each detergent at 22°C
and 50°C
Cleaning Solution
Mean % Blood
removed
Median Blood
Protein
Removed (µg)
Range Blood
Protein
Removed (µg)
RO H2O 22°C 36 1380 <5 – 1901
RO H2O 50°C 87 2761 2296 – 3000
Alconox® 22°C 33 927 137 – 1731
Alconox® 50°C 58 1817 799 – 2296
Haemo-sol® 22°C 71 2070 1314 – 3624
Haemo-sol® 50°C 71 2401 1622 – 2776
Rapidex® 22°C 53 1585 1020 – 2405
Rapidex® 50°C 82 2476 1428 – 3375
Positive Control 22°C 3104 3023 -3157
Positive Control 50°C 3180 2970 – 3284
Negative Control 22°C <5 <5
Negative Control 50°C <5 <5

Chapter 7 224
Figure 7-6 Effect of detergent manufacturers suggested temperature on the
percentage blood removal by detergents. The efficacy of detergents at blood
removal from stainless steel surfaces after 5 min cleaning at room temperature
(grey bars) and 38°C (white bars) with the agitation speed set to 25 20°C
tilts/min was assessed by measuring the protein desorbed using the BCA assay.
Raising the solution and environmental temperature to 38°C resulted in a
significant increase (*** = p<0.001) in Rapizyme® blood removal. ROH2O and
Endozime® blood removal was increased but not significantly. The data shown is
the mean of results from 3 discs from 3 experiments and the SEM. The control
shows the initial blood protein concentration applied to the stainless steel discs
at each temperature.

Chapter 7 225
Table 7-7 Mean percentage and protein removed by each detergent at 22°C
and 38°C
Cleaning Solution
Mean %
Blood
removed
Median Blood
Protein
Removed
(µg)
Range Blood
Protein
Removed
(µg)
RO H2O 22°C 36 1380 <5 – 1901
RO H2O 38°C 79 2155 1378 – 2996
Endozime® 22°C 45 1421 137 – 1731
Endozime® 38°C 58 1893 798 – 2296
Rapizyme® 22°C 37 975 245 – 2581
Rapizyme® 38°C 75 2311 1879 – 3050
Positive Control 22°C 3104 3023 -3157
Positive Control 50°C 3161 3063 – 3551
Negative Control 22°C <5 <5
Negative Control 50°C <5 <5

Chapter 7 226
7.2.6 Efficacy of detergents at P. acnes biofilm removal
A total of 20 P. acnes isoates including 1 1A types, 10 1B types isolated from
GDH HP’s (Section 4.2.4) and 19 P. acnes isolates including 3 IA types, 8 1B types
and 1 II type isolated from HP’s from the St Albans repair facility (Section 4.2.5)
were resurrected from Pro-tect beads. A single bead was plated onto FAA agar
and incubated anaerobically for 24 h at 37°C. Staphylococcus epidermidis strain
was cultured onto blood agar and incubated overnight at 37 °C under 5% CO2. A
single colony of each P. acnes strain and the S. epidermidis was added to 50 ml
of reinforced clostridial (RC) broth that had been pre-reduced by boiling for 30
min. Of the GDH isolates, a total of 13 cultures were incubated overnight at
37°C anaerobically and 7 cultures were incubated overnight aerobically at 37°C.
Of the repair facility isolates a total of 11 cultures were incubated overnight at
37°C anaerobically and 8 cultures were incubated overnight at 37°C aerobically.
The optical density (OD460) of each culture was taken using a spectrophotometer
(Fisherbrand). Each culture was diluted in RC broth to an O.D of 0.2 representing
1x10⁸ cfu of bacteria. A total of 6, 300 µl samples of each isolate were added to
separate wells of a clear Costar 96 well flat bottomed plate (Sigma Aldrich
Dorset UK). Separate plates were used for each cleaning solution. Each plate was
placed on a PMR tilting platform (Grant Instruments Cambridge, UK) at moderate
speed (18 RPM) and incubated for 72 h anaerobically at 37°C or for 16h
aerobically at 37°C. RC media was added to each plate as a negative control. RC
broth was changed every 24h in each well for the 72h biofilms.
For 72h biofilms, a 1% (v/v) solution of Haemo-sol® detergent and undiluted W &
H cleaning solution were sampled. For 16h biofilms, a 1% (v/v) solution of
Alconox®, Haemo-sol® and Rapizyme® and an undiluted W & H cleaning solution
were samped. The media was removed from each well PBS and a 300 µl sample
of the appropriate cleaning solution was added to each well and incubated at
room temperature for 16 min which is the length of time an instrument is
exposed to detergent during some automated washing process (Section 2.1.3).
After exposure, the supernatant was removed and the wells rinsed a further 3
times in sterile PBS. Samples were compared to a positive, untreated control

Chapter 7 227
and a positive control treated with PBS in place of a cleaning solution. The
media was removed each day and cultured on FAA plates as controls.
For biomass sampling, a total of 300 µl of 1% (w/v) crystal violet solution was
added to each well and incubated at room temperature for 10 min. The wells
were rinsed 3 times by tap water and 300 µl of a 70 % ethanol/ 5 % acetone
solution was added to each well. The plate was incubated for 15 min and the
solution transferred to a fresh plate before being read in a plate reader
(Sunrise™ Tecan) at OD570. The bacterial cell viability of 16h biofilms was
measured using the alamarBlue® assay (Invitrogen Paisley UK) according to
manufacturer instructions. Each plate was incubated for 4 hours aerobically at
37 °C and the plate measured in an omega flurostar plate reader at an
excitation wavelength of 530 nm and emission wavelength of 590 nm.
A total of 23/28 P. acnes isolates sampled were formed biofilms under 72h
anaerobic conditions and a total of 13/15 isolates sampled formed biofilms
under 16h aerobic conditions with the biomass resulting in a crystal violet OD570
reading significantly greater than the negative control (Holmberg et al., 2009).
After growth for 72 h and upon exposure to cleaning solutions, Haemo-sol®
detergent significantly (p <0.001) reduced the P. acnes biofilm biomass to a
median of 0.6 (range 0.4 – 1.2) compared to exposure to RO H2O where the
biomass was a median of 0.9 (range 0.4 – 1.6) (Figure 7-7). Exposure to W &H
cleaning solution resulted in a biomass median of 0.9 (range 0.5 – 1.507) (Figure
7-7). After 72h growth of the S. epidermidis RP62A strain the biofilm biomass
was calculated as a median OD570 of 1.1 (range 0.5 – 2) after exposure to PBS
when the data from all experiments was combined (n=18) (Figure 7-8). Haemo-
sol® significantly (p<0.05) reduced the biomass to a median OD570 of 0.4 (range
0.2 -1.6) compared to exposure to ROH2O which upon exposure reduced the
biomass to a median of 0.78 (range 0.4 – 1.8) (Figure 7-8). No significant
reduction of biomass was observed upon exposure to W & H cleaning solution
with a median of 1.1 (range 0.4 – 1.9) observed (Figure 7-8).
After 16h growth, the biomass of the P. acnes isolates was a median of 0.9
(range 0.4 – 1.6) (Figure 7-9). This was significantly reduced by Alconox®,
Haemo-sol® and Rapizyme® (p<0.001) compared to exposure to RO H2O alone

Chapter 7 228
which reduced the biomass to a median of OD570 0.5 (range 0.1 – 1.7) (Figure
7-9). Upon exposure tocleaning solutions, Alconox® reduced the biofilm biomass
to a median OD570 of 0.2 (range 0.008 – 1.447), Haemo-sol® reduced the biomass
to a median OD570 of 0.3 (range 0.02 -1.5) and Rapizyme® reduced the biomass
to a median OD570 of 0.2 (range 0.02 – 0.8) (Figure 7-9). W & H cleaning solution
did not result in a significant reduction of biofilm biomass with exposure
resulting in a median OD570 of 1.0 (range 0.3 – 1.7) (Figure 7-9).
After 16h growth, the untreated S. epidermidis biomass from all experiments
was calculated as a median OD570 of 1.3 (range 0.8 – 1.5) (Figure 7-10). This was
reduced, though not significantly to a median OD570 of 1.179 (range 1.0 – 1.3)
when exposed to the ROH2O control (Figure 7-10). Exposure of the biofilm to
Haemo-sol® detergent resulted in a significant (p <0.05) reduction in the biofilm
biomass to a median OD570 to 0.3 (range 0 – 0.9) (Figure 7-10). Exposure to
Alconox® (median OD570 0.3, range 0 – 1.264) and Rapizyme detergent (median
OD570 0.5, range 0.1 – 1.2) resulted in a reduction in biomass though this was not
significant (Figure 7.11). W & H cleaning solution (median OD570 0.89, range 0.4 –
1.3) did not result in a reduction of biofilm biomass (Figure 7-10).
The cell viability of untreated and treated P. acnes and S. epidermidis biofilms
grown after 16h was assessed by measurement of the FU’s caused by the
reduction of alamarBlue® by live bacteria. For P. acnes biofilms, exposure to
ROH2O resulted in a non significant decrease in alamarBlue® reduction (median
101892 FU, range 39149 – 203732 FU) compared to the untreated control
(median 231628 FU, range 149029 – 259453 FU) (Figure 7-11). Exposure to
Alconox® (median 8818 FU, range 4308 – 44651), Haemo-sol® (median 10599 FU,
range 4293 -42039 FU) and W&H cleaning solution (median 9288FU, range 4430 –
41558 FU) resulted in a significant (p<0.001) decrease in alamarBlue® reduction
by biofilms (Figure 7-11). Exposure to Rapizyme® (median 17390 FU, range 4602
– 125952) also resulted in a significant (p<0.05) decrease in alamarBlue®
reduction (Figure 7-11). All detergents decreased the alamarBlue® reduction to
negative control levels (Figure 7-11).
For S. epidermidis biofilms, exposure to ROH2O resulted in no change in
alamarBlue® reduction (median120175 FU, range 106797 – 141772 FU) compared

Chapter 7 229
to the untreated control (median 107990 FU, range 104838– 149006 FU) (Figure
7-12). Exposure to Alconox® (median 5028 FU, range 4892 – 9411), Haemo-sol®
(median 4777 FU, range 4617 - 7133 FU), Rapizyme® (median 7284 FU, range
4889 – 35345) and W&H cleaning solution (median 4948 FU, range 4686– 5412 FU)
resulted in a significant (p<0.001) decrease in alamarBlue® reduction by biofilms
(Figure 7-12). All detergents decreased the alamarBlue® reduction to negative
control levels.
Figure 7-7 Total P. acnes biofilm biomass after treatment of cleaning
solutions. P. acnes isolates from dental HP’s were grown for 72h anaerobically
in a 96 well plate to form biofilms. The biofilms were then exposed to cleaning
solutions for 16 min and the biomass remaining after 3 rinses with PBS was
measured using 1% crystal violet staining. Biofilms treated with Haemo-sol® have
significantly (***= p<0.001) less biomass than RO H2O alone. There was no
significant difference between biofilms treated with the PBS control and the W
& H cleaning solution. Data shown is the spread of all P. acnes isolates

Chapter 7 230
Figure 7-8 Total 72h S. epidermidis biofilm biomass detected after treatment
with cleaning solutions. S. epidermidis strain RP62A was grown for 72h
anaerobically in 96 well plates to form biofilms as a positive control for P. acnes
biofilm formation. The biofilms were then exposed to cleaning solutions for 16
min and the biomass remaining after 3 rinses with PBS was measured using 1%
crystal violet staining. Biofilms treated with Haemo-sol® detergent have
significantly (*= p<0.05) less biomass than when exposed to RO H2O alone. There
was no significant difference between biofilm biomass treated with the PBS
control and the W & H cleaning alcohol. Data shown is the spread of all S.
epidermidis experiments.

Chapter 7 231
Figure 7-9 Total 16h P.acnes biofilm biomass detected after treatment with
cleaning solutions P. acnes isolates from dental HPs were grown for 16h
aerobically in a 96 well plate to form biofilms. The biofilms were then exposed
to cleaning solutions for 16 min and the biomass remaining after 3 rinses with
PBS was measured using 1% crystal violet staining. Biofilms treated with
Alconox®, Haemo-sol® and Rapizyme® have significantly (***= p<0.001) less
biomass than exposure to ROH2O alone. There was no significant difference
between biofilms treated with the ROH2O control and the W & H cleaner. Data
shown is the spread of all P. acnes isolates.

Chapter 7 232
Figure 7-10 Total 16h S. epidermidis biofilm biomass detected after
treatment with cleaning solutions. S. epidermidis strain RP62A was grown for
16h aerobically in 96 well plates to form biofilms as a positive control for P.
acnes biofilm formation. The biofilms were then exposed to cleaning solutions
for 16 min and the biomass remaining after 3 rinses with PBS was measured using
1% crystal violet staining. Biofilms treated with Haemo-sol® detergent have
significantly (*= p<0.05) less biomass than when exposed to RO H2O alone. There
was no significant difference between biofilms treated with the RO H2O control
and biofilms treated with Alconox®, Rapizyme® and the W & H cleaner. Data
shown is the spread of all S. epidermidis experiments.

Chapter 7 233
Figure 7-11 Bacterial cell viability of 16h biofilms formed by P. acnes isolates
treated with cleaning solutions. Biofilms formed by P. acnes isolates from
dental handpieces were tested for bacterial cell viability after exposure to the
cleaning solutions and after 3 rinses with PBS by measuring alamarblue®
reduction. Biofilms treated with Alconox®, Haemo-sol® and W & H cleaner have
significantly (***= p<0.001) less viability than exposure to RO H2O alone.
Treatment with Rapizyme® also results in a significant (* = p<0.05) reduction in
cell viability. All detergents reduced cell viability to negative control levels.
Data shown is the spread of all P. acnes isolates.
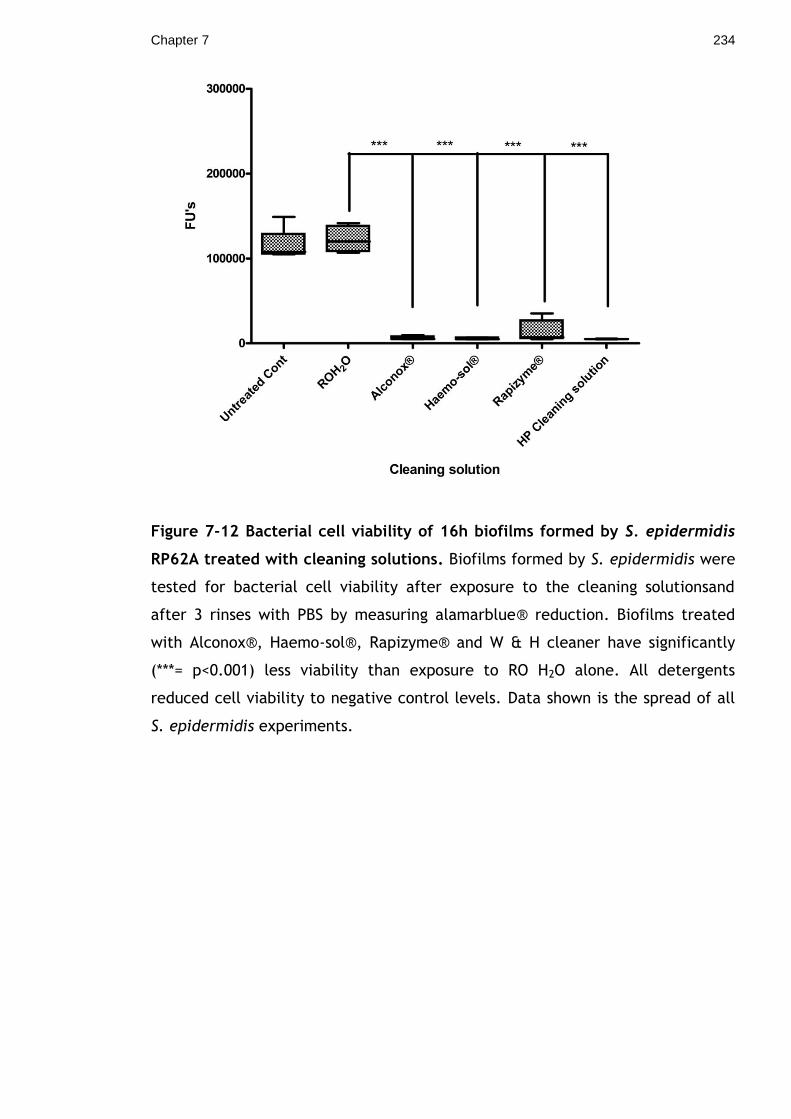
Chapter 7 234
Figure 7-12 Bacterial cell viability of 16h biofilms formed by S. epidermidis
RP62A treated with cleaning solutions. Biofilms formed by S. epidermidis were
tested for bacterial cell viability after exposure to the cleaning solutionsand
after 3 rinses with PBS by measuring alamarblue® reduction. Biofilms treated
with Alconox®, Haemo-sol®, Rapizyme® and W & H cleaner have significantly
(***= p<0.001) less viability than exposure to RO H2O alone. All detergents
reduced cell viability to negative control levels. Data shown is the spread of all
S. epidermidis experiments.

Chapter 7 235
7.2.7 Efficacy of in vivo handpiece cleaning processes
For the validation of the HP cleaners, A total of 7 WA- 99 contra angle HP’s, 7 TA
– 98 high speed HP’s, and 7 WS-75 surgical HP’s were sampled for each cleaning
process. Of these, 3 of each HP were used as positive controls defined as a
soiled HP that had not been subjected to cleaning and 1 of each HP was used as
a negative control defined as an unsoiled handpiece put through each cleaning
process. The HP test soil was based on the Swedish test soil detailed in BS
ISO/TS consisting of citrated horse blood recalcified with O.1M CaCl2 by adding a
total of 100 µl of CaCl2 was added to 900 µl of citrated blood(Zuhlsdorf et al.,
2002). The blood protein concentration was based on the maximum protein
concentration found on each handpiece part during the handpiece study
(Chapter 5). Each dilution was performed in a solution of 400 µg/ml of salivary
mucin representing the estimated physiological concentration in human saliva
(Rayment et al., 2000). For the high speed TA- 98 HP’s and the contra-angle WA
– 99 HP’S, the blade of the turbine and the internal surface of the push button
were inoculated with 20 µl of test soil equivalent to 20 µg of blood protein
diluted in salivary mucin and each spray channel was contaminated by 10 µl of
test soil in each tube equivalent to 40 µg of blood protein diluted in salivary
mucin. The outer sleeve was contaminated with 50 µl of test soil. Additionally
the middle gear of the WA-99 HP’s was contaminated with 20 µl of test soil
equivalent to 20 µg of blood protein diluted in salivary mucin. For the WS – 75
HP’s, the turbine and the middle gear was contaminated with 20 µl of test soil
equivalent to 60 µg of blood protein diluted in salivary mucin and the outer
sleeve was contaminated with 50 µl of test soil equivalent to 150 µg of blood
protein diluted in salivary mucin. HP’s were then dried at ambient room
temperature of 25°C for 15 min prior to cleaning with process 2 and for 60 min
prior to cleaning by process 1. After cleaning, each HP part was aseptically
dismantled and each component was added to a centrifuge tube and immersed
in a measured volume of 1% (v/v) SDS. Each tube was added to a boiling water
bath and boiled for 10 min at 100°C. For spray channel sampling, each lumen
was rinsed once with 1 ml of boiling 1 % (v/v) SDS for a total sample volume of 2
ml. Each sample was measured using the OPA assay with comparison to a BSA
standard curve.

Chapter 7 236
No protein was detected from the negative control parts. For the reprocessed
HP’s, residual protein was isolated from a turbine (21.88 µg) and spray channels
(54.5 µg) of 1 TA-98 HP (Table 7-8), the head gear of a WA-99 HP (76.4 µg) the
outer sleeve of a WA-99 HP (2.29 µg) (Table 7-9), and outer sleeves of 3 WS-75
HP’s and the middle gear of a WS-75 HP (median 370.4 range 321.4 – 387.6)
(Table 7-10). No protein was detected from 2 TA -98 HP’s and 2 WA-99 HP’s
(Table 7-8,Table 7-9). For the HP’s reprocessed using process 1-1, protein was
isolated from all WS-75 HP’s (Table 7-10). Protein was isolated from the 3
turbines (median 36.9 µg range 29.37 – 42.31 µg), the 2 middle gears (median
59.8 µg, range <5 – 89.66 µg), and 2 outer sleeves (median 126.3 µg, range <5 –
339.8 µg) of the WS -75 HP’s (Table 7-10). For the HP’s reprocessed using
process 1-2, protein was isolated from the turbine (91 µg) and the middle gear
(2.3 µg) of 1 WS- 75 HP (Table 7-10). When HP’s were reprocessed using process
1-3, protein was isolated from the headgear of 1 TA-98 HP (110.7 µg) (Table
7-8). No protein was isolated from the TA-98 HP’s and WA-99 HP’s reprocessed
with process 1-1 and 1-2 and no protein was isolated from WS-75 HP’s
reprocessed with process 1-3 (Table 7-8, Table 7-9,Table 7-10).

Chapter 7 237
Table 7-8 Protein isolated from TA-98 HP’s before and after cleaning.
HP Part
(n=3)
Median
Protein
before
reprocessi
ng (µg /
part)
Process 1 -1
Median
Protein
concentratio
n (µg / part)
Process 1-2
Median
Protein
concentrati
on (µg /
part)
Process 1-3
Median
Protein
concentrati
on (µg /
part)
Process 2
Median
Protein
concentrati
on (µg /
part)
TA-98
Turbine
and Head
gear
141.8
(Range
117.8 –
193.5)
<5 <5 <5
(Range <5 –
110.6)
<5
(Range <5 –
21.88)
TA-98
Spray
channel
107.3
(Range
77.62 –
135.9)
<5 <5 <5 <5
TA-98
Outer
Sleeve
216.1
(Range
130.9 –
326)
<5 <5 <5
<5
(Range <5 –
54.53)

Chapter 7 238
Table 7-9 Protein isolated from WA-99 HP’s before and after cleaning.
HP Part
(n=3)
Median Protein
before
reprocessing
(µg / part)
Process 1-1
Median
Protein
concentrati
on (µg /
part)
Process 1-2
Median
Protein
concentrati
on (µg /
part)
Process 1-3
Median
Protein
concentrati
on (µg /
part)
Process 2
Median
Protein
concentrati
on (µg /
part)
WA-99 Turbine and Head gear
192.7
Range (138.9 – 237.3)
<5 <5 <5 <5
(Range <5-76.15
WA-99 Middle Gear
147.4
Range (101.5-198.2)
<5 <5 <5 <5
WA-99 Spray channel
164.9
Range (114.8 – 298.2)
<5 <5 <5 <5
WA-99 Outer Sleeve
122.5
Range (101.2-183.5)
<5 <5 <5
<5
(Range 0 – 2.290)

Chapter 7 239
Table 7-10 Protein contamination of WS-75 HP’s before and after cleaning
HP Part
(n=3)
Median
Protein before
reprocessing
(µg / part)
Process 1-1
Median
Protein
concentrati
on (µg /
part)
Process 1-2
Median
Protein
concentrati
on (µg /
part)
Process 1-3
Median
Protein
concentrati
on (µg /
part)
Process 2
Median
Protein
concentrati
on (µg /
part)
WS- 75
Turbine
and
Head
gear
370.8
Range (187.3-
589.2)
36.91
(Range 29.37
-42.31)
<5
(Range <5 –
91.07)
<5 <5
WS-75
Middle
Gear
355.6
Range(117.8 –
567.4)
59.8
(Range <5-
89.66)
<5
(Range <5-
2.297)
<5 <5
(Range <5-
335.7)
WS-75
Outer
Sleeve
488.4
Range(403.9 –
600)
126.3
(Range <5 -
339.8)
<5 <5
370.4
(Range 321.4
– 387.6)

Chapter 7 240
7.3 Discussion
The cleaning of dental HP’s, like other surgical instruments, is necessary to
allow the removal of organic soil and protein contamination that may not be
removed or may inhibit the sterilization process (Lipscomb et al., 2007). These
include blood contamination and the bacterial biofilm. For dental HP’s, serum
albumin was detected in used, unprocessed HP samples which is the most
abundant protein in blood (Desroches et al., 2007) (Chapter 5). This finding,
along with visible blood on the HP’s, indicates that blood is a typical
contaminant of HP’s before reprocessing. The current decontamination method
used in the GDH first uses cleaning in an AWD followed by the Assistina cleaning
machine (Table 2-3). The Assistina utilises an alcohol based cleaning solution and
alcohol has been shown to fix any blood and protein to surfaces (Prior et al.,
2004). To represent blood contamination, the Swedish test soil recommended by
BS-ISO/TS for washer disinfector validation was used (Michels, 2008).
Bacteria growing on a surface are known to form a biofilm matrix to allow
adsorption and increased survivability of bacterial cells (Coenye et al., 2007).
The physical biofilm barrier is composed of proteins, DNA, and various structures
that may inhibit sterilization of the bacterial cells and therefore disruption of
the biofilm structure is carried out by the cleaning stage of the instrument
decontamination process (Mah and O'Toole, 2001, Das et al., 2009). In dental
HP’s the majority of bacteria isolated were CONS and P. acnes, and these were
isolated from various locations especially from the surgical HP (Chapter 4).
Therefore, an in vitro system was utilised to measure the disruption of biofilms
of P. acnes isolates and an S. epidermidis type strain known for the ability to
form biofilms and to represent the CONS (Buckingham-Meyer et al., 2007,
Polonio et al., 2001).
For the validation of in vivo cleaning processes, new HP cleaning machines were
evaluated for cleaning efficacy. A total of 4 processes were sampled and
compared to aid in product development. Process 1 has several cleaning stages
lasting over 1 min with water being used as a cleaning solvent and a disinfection
stage where detergent is introduced and process 2 involves a forced air
containing detergent and lubricating oil lasting 4 seconds through the spray
Chapter 7 241
channel and out of the head before the application of detergent onto the sleeve
of the HP for external cleaning.
For in vitro cleaning validation, the effect of the four cleaning parameters
described by the Sinners circle, cleaning time, temperature, force and cleaning
solutions on the removal of blood protein were assessed. This utilised an in vitro
tilting platform to provide an adjustable, reproducible cleaning force (Prior et
al., 2004). There is currently no European standard to test for cleaning efficacy
which meant this experiment was based on some of the instructions of BS-EN-
ISO-15883 1-6 to test cleaning efficacy. The test soil was selected to represent a
typical instrument contaminant as opposed to a harder to remove test soils
(Desbuquois et al., 2010). The blood was left on the surface for 16h to represent
the longest time it can take for an instrument to begin a decontamination cycle
(Prior et al., 2004). Previous studies have shown the effects of drying time on
cleanability of surfaces with a longer drying time representing a greater
challenge for cleanability (Lipscomb et al., 2007). Blood protein removal was
measured using the BCA assay, recommended by BS-EN–ISO-15883 part 1 to
determine the protein concentration in solution. Knowing the blood protein
concentration removed allows numerical and statistical comparison of blood
removal. Previous studies have utilised the ninhydrin assay for the measurement
of blood protein removal though this was to indicate the presence of protein
rather than a quantitative measurement (Nakata et al., 2007). A thermostable
adenylate kinase (tAK) has also been utilised for a quantitative analysis into the
efficacy of washer disinfectors by measuring the enzyme removal on stainless
steel (Hesp et al., 2010). Whilst this enzyme is represented as a model for prion
protein with similar structure and behaviour, it does not represent the multiple
proteins that are adsorbing to a surface in vivo (Hesp et al., 2010).
An increase in time and an increase in agitation speed result in an increase in
blood protein removal and both represented an increase on the total cleaning
force applied. An increase in the temperature of the cleaning solution results in
an increase in the blood removal from the surface. The temperatures sampled
represented ambient room temperature and elevated temperatures
recommended by the detergent manufacturer’s instructions (Table 7.1). In
previous studies, a higher temperature of cleaning solution causes protein

Chapter 7 242
denaturing and fixation to the surface (Crutwell, 2008, Desroches and Omanovic,
2008). These fixing effects in the case of the blood are observed at
temperatures of 75 OC and this effect is found not to occur at temperatures
closer to 60 OC (Crutwell, 2008).
The previous results from the studies of the 3 cleaning parameters were used to
assess the efficacy of detergents recommended by the Scottish dental clinical
effectiveness programme and additional detergents used in LDU’s (Table 7.1).
For further comparison, HiBi® Scrub, a chlorohexidine based antimicrobial hand
wash and an example of a solution that is used in some surgeries for instrument
cleaning was sampled along with 0.1M NaOH and W & H HP cleaning solution
(Smith et al., 2009). NaOH has been recommended for reprocessing of
instruments contaminated with the prion protein and W & H cleaning solution is
alcohol based and currently used to process HP’s (Kasermann and Kempf, 2003)
(Table 2.2). The sampling time of 5 min and the agitation speed selected
represent sub maximum levels of blood removal to allow comparison. The
efficacy of each detergent at removing blood protein was first assessed at room
temperature of 22oC followed by the detergent manufacturers recommended
temperatures if provided (Table 7-2). If a recommended temperature was not
provided, a temperature was selected based on the instructions available for
other detergents. For blood removal at room temperature, Haemo-sol®
detergent removed the most blood though no cleaning solutions removed
significantly more blood than the ROH2O controls. Both HiBi® Scrub and the W &
H cleaning solution removed significantly less blood highlighting the inadequacy
of these products as instrument cleaners. Whilst there was variation of the mean
percentage blood removal of the ROH2O controls between experiments, the
values were not statistically significant and changes in efficacy may have been
due to variations in starting blood protein concentration.
To explain the action of detergents, the addition of an alkaline solution has been
shown to reverse the interactions of serum albumin, the most abundant protein
in blood, with a stainless steel surface by reversing the charge of the oxide layer
that spontaneously forms on stainless steel (Sakiyama et al., 2004). Acidic
solution has been shown to promote adsorption of serum albumin and may
account for the low blood removal by the acidic HiBi® Scrub (Sakiyama et al.,

Chapter 7 243
2004). Chlorohexidine, the main constituent of HiBi® Scrub has also been shown
to precipitate the blood protein and not allow subsequent cleaning (Nakata et
al., 2007). The addition of H2O with a near neutral pH will also reduce
adherence of BSA and change the conformation of surface bound proteins by
internalising hydrophobic residues and increasing the surface area of bound
proteins (Sakiyama et al., 2004).
It is not clear if the differences in detergent efficacy are due to the composition
of the detergent due to the lack of information available from manufacturers.
Treatment with alkaline detergents resulted in more blood protein removal than
0.1M NaOH showing that just having an alkaline solution alone cannot account
for the cleanability shown. The detergents may also have different buffering
capacities to ensure a stable pH compared to 0.1M NaOH alone. Previous studies
have shown detergents are less effective at cleaning blood than water alone
(Zuhlsdorf et al., 2002) and that detergents can fix blood to surfaces (Nakata et
al., 2007). A study into the effect of detergents on blood showed the alteration
of blood protein by fixation to the surface or the formation of precipitated
protein (Nakata et al., 2007). Exposure to some detergents resulted in no
protein removal upon subsequent treatment with an enzymatic detergent though
blood was removed when no prior detergent immersion had taken place (Nakata
et al., 2007). Cleaning using a washer disinfector removed all blood and this was
attributed to the action of the water jets (Nakata et al., 2007). Knowledge of
the ingredients of detergents may inform the development of detergents that
can remove blood and protein contamination and improve the efficacy of the
cleaning process.
The HP isolates that were studied were P. acnes isolated from S11 surgical HP’s
before decontamination and S11 surgical and TA-98 high speed HP’s sent for
repair (Chapter 4). Since not all P. acnes isolates had been type identified at the
time of writing, no comparison was made between the type isolates and the
ability to grow biofilms. The HP’s for repair included documentation certificates
indicating that they had been through a decontamination process though this
could not be independently verified. A S. epidermidis strain was also sampled as
a control and a representative of CONS isolated from dental HP’s (Chapter 4). P.
acnes is associated with the oral cavity and human skin where it can cause

Chapter 7 244
benign inflammatory infections such as acne (Burkhart and Burkhart, 2007). P.
acnes has been associated with bloodstream infections, the contamination of
surgical implants and has been isolated from endodontic lesions (Ramage et al.,
2003). If HP’s used to treat these lesions were contaminated with P. acnes, the
dental HP may act as a source of cross infection.
Currently, there are no reports on the detergent or other cleaning solution
efficacy of removing P. acnes biofilms. Previous studies have focused on the
efficacy of antimicrobials due to the growth of P. acnes on internal prosthetic
hip joints and bone cement (Ramage et al., 2003). These studies have found that
bacteria were more resistant to antibiotics due to the structure and the slow
metabolic growth of bacteria which may not take up the antibiotic (Ramage et
al., 2003). Similar mechanisms are evident for detergent resistance with P.
aeruginosa biofilms resisting quarternary compounds by virtue of the ECM
substrate and S. aureus hypothesised to resist through metabolic changes
(Campanac et al., 2002). Further resistance mechanisms involve the
hydrophilicity of the ECM surfaces, which may stop interaction of compounds
with the ECM, and the inability of hydrophobic substances to pass through water
channels (Campanac et al., 2002).
The aim of this study was to measure first the ability for P. acnes isolates to
form biofilms under optimum and worst case scenario HP reprocessing conditions
(Prior et al., 2004) before measuring the efficacy of detergents at disrupting the
biofilm structure to allow the removal by subsequent rinses. This represents the
disinfection and rinsing stages of the decontamination process. Biofilms were
exposed to detergents for the same time as the disinfection stage of the
decontamination cycle of the washer disinfector used in the Glasgow Dental
School CSSD department (Table 2.2) and is the amount of time that
contaminants would be exposed to detergents
When P. acnes and S. epidermidis isolates were grown under worst case
instrument reprocessing conditions of 16h under aerobic conditions, all
detergents sampled aside from the W & H cleaning solution resulted in a
significant reduction in biofilm biomass when compared to RO H2O alone. Again,
the alkaline detergents Haemo-sol® and Alconox® were able to significantly

Chapter 7 245
remove more biomass than RO H2O alone as well as the enzymatic detergent
which acts by digesting large organic molecules into water soluble dispersible
fragments but is specific depending on the enzymatic target (Lequette et al.,
2010). The W & H cleaning solution again failed to remove any of the biofilm
material which further highlights the unsuitability of the W & H cleaning solution
as a disinfectant.
Whilst each detergent was effective in disrupting the biofilm to allow
subsequent removal, the W & H cleaning solution did not result in any change in
biofilm biomass after rinsing, showing the fixing of the biofilm structure to the
surface. This cleaning solution contains alcohol and this result is consistent with
previous studies that have shown protein fixation when alcohol is applied (Prior
et al., 2004). Haemo-sol® is an alkaline detergent and shows significant removal
of the biofilm structure. The hydrated structure of the biofilm is known to allow
small molecules such as alkaline detergents to move freely through the structure
which will allow disruption which may denature the biofilm proteins or reverse
the interactions of these proteins with the surface (Stewart et al., 2001).
The W & H cleaning solution reduced the bacterial cell viability to negative
control levels which shows the penetration through the biofilm structure as the
W &H cleaning solution does not remove the biofilm structure. Whilst the
alkaline detergents also reduced the cell viability, the effect of the biofilm
structure removal cannot be ruled out. The enzymatic detergent reduced cell
viability but not to the same levels as the other detergents. This might be due to
the neutral environment that the enzymatic detergent presents which will not
result in P. acnes cell death.
Previous work on the efficacy of biofilm removal by cleaning solutions has
studied the removal of S. aureus and P. aeruginosa with results showing
increased removal by alkaline and acidic detergents and no difference in biofilm
removal when a neutral detergent is applied. Whilst this is comparable to the
results from this study, the actual cleaning was undertaken at high pressure and
this may itself remove the biofilm without the application of detergent (Gibson
et al., 1999).
Chapter 7 246
Whilst the in vitro biofilm model has shown the efficacy of detergents at
removing biofilms made by HP isolates, the model is not a complete biofilm
model when in reference to dental HP’s. The plastic of the plates does not
represent the stainless steel handpiece surface which may have a different
interaction with the biofilm proteins and their removal by detergents. The
temperature to which the bacteria are exposed to in dental HP’s is variable with
heating coming during operation and cooling mediated by the dental unit
waterline and may affect the growth of cells and the composition of biofilms. A
surgical instrument biofilm may contain a number of different species which may
explain the P. acnes isolates that were unable to form biofilms in the in vitro
model.
For in vivo validation of HP cleaning, a novel test soil was applied based on
previous findings (Chapter 6). The test soil comprised citrated horse blood with
calcium chloride diluted in salivary mucin. Calcium chloride causes the citrated
blood to coagulate and is similar to the behaviour of blood contamination in vivo
(Crutwell, 2008). The addition of salivary mucin adds a protein associated with
the oral cavity. Mucins are glycosylated proteins that are present on all mucosal
surfaces and saliva (Rayment et al., 2000). The glycosylated structure gives
them a viscous consistency that makes the test soil harder to remove (Rayment
et al., 2000). The blood protein concentration was based on HP residual protein
levels quantified (Chapter 5)
The test soil was applied to areas that protein was isolated from (Chapter 5). A
number of internal parts and the external sleeve were inoculated to test the
efficacy of each cleaning process at cleaning both internally and externally. The
test soil was allowed to dry for 15 min for reprocessing using the future Assistina
and 60 min before process 1 reprocessing to represent manufacturers
instructions. The time of drying will have an impact on the adsorption of protein
to the surface and therefore the cleanability of the instruments. Longer drying
times have been found to make protein harder to remove during cleaning and
therefore the shorter drying time used for future Assistina challenging may have
resulted in a test soil that is easier to remove (Lipscomb et al., 2007).
A total of 3 different cleaning processes based on process 1 were sampled using
the system. These were not defined and it is therefore not possible to speculate

Chapter 7 247
on the differences between each process. Process 1-1 removed all protein
inoculated on TA -98 and WA-99 HP’s from all parts to limits below the
sensitivity of the assay which would pass the BS-EN-ISO 15883 part 1-6 standards.
For the WS -75 HP’s, protein is found on all locations due to the increased
protein concentration of the test soil. Similar findings were observed with
process 1-2 with the protein reduced to limits below the sensitivity of the assay
on the TA -98 and WA -99 HP parts. Protein was only isolated from 1 WS -75 HP
which is an improvement on process 1-1. Process 1-3 removed protein to below
the limits of the detection of the assay on all handpieces aside from 1 TA 98 HP
and represents the most efficacious cleaning process of all tested.
Process 2 was found to remove all protein from all spray channels sampled but
not the turbines of all TA -98 and WA-99 handpieces. This may be due to the
location of the turbine as the last part to be contacted by the spray. There is
also potential for contamination to be washed out the spray channels to settle
on the turbine and cap if not rinsed thoroughly. The presence of residual protein
on the outer sleeve also shows shortcomings in external cleaning. The surgical
WS-75 HPs still had 75 % of the initial soil on the outer sleeves showing very little
removal by process 2. The increase in test soil protein concentration and
therefore the increasing challenge could not be removed by the future Assistina
process.
The results suggest that process 1 is more effective at removing protein and
mucin deposits than process 2. This can be explained using the Sinners circle
which defines the key parameters of cleaning and their effects on the cleaning
process. These parameters are time, cleaning chemicals, cleaning force, and
temperature. Considering these factors, process 1 has a longer cleaning process,
a greater cleaning force and a higher temperature than process 2 and therefore
should present in theory a superior cleaning process. The cleaning chemicals are
demineralised water for process 1 and detergent for process 2. Whilst no
information is available on the composition of the detergent, the detergent may
also fix blood protein to the surface.
The procedure employed to test the cleaning efficacy represents a more
meaningful cleaning challenge due to the test soil based on typical HP
contaminants. The total blood protein was lower than estimated due to an
Chapter 7 248
inability to determine the initial concentration of blood protein. The salivary
mucin diluent increased the protein concentration close to the mean levels
previously isolated (Chapter 5). The components represent common HP
contaminants but does not represent a complete picture of these contaminants.
Bacteria are found before the decontamination process and any test soil may
also contain a microbial element to make the test soil more realistic and harder
to remove.
No single standard yet exists for ―acceptable‖ protein levels on reprocessed
instruments. The BS EN ISO–15883 part 1 defines an acceptable level as below
the detection limit of one of three protein assays which are stated as 2 mg/m2
for the Ninhydrin assay, 30 – 50 µg for the bicinchoninic acid assay, and 0.003
µmol of OPA sensitive amino groups for the OPA assay. Work undertaken by
Lipscomb and colleagues (2006) also determined the threshold of sensitivity for
similar reagents to be equivalent to 9.25 µg/ 10mm2for Ninhydrin and 6.7 µg/
10mm2 for the Biuret test (Lipscomb et al., 2006a). If this was to be regarded as
a threshold for cleanliness then both cleaning processes would fail this
validation. A protein concentration of 200 µg/HP has also been suggested in the
Zentral Steril 2008 Suppl Oct 16 as an upper limit threshold for cleanliness
though this represents a greater protein concentration than was found in the HP
research project and does not represent a realistic cleaning challenge.
It was not possible to undertake statistical analysis of the data due to the small
sample size and number of replicates. Whilst this pilot study gives some idea of
the efficacy of each cleaning process, firmer conclusions could be made by
sampling more HP’s.
These studies have described in vitro and in vivo systems to test the efficacy of
cleaning solutions at removing common HP contaminants. These methods can be
applied to the cleaning validation of other surgical instruments if the
contaminants are known and can be isolated. For HP’s, the study has also
highlighted the unsuitability of an alcohol based HP cleaner which fixes the
blood and biofilm and in the case of the biofilm, prevents subsequent removal.
Whilst ROH2O was as efficacious as detergents at removing blood protein,
alkaline detergents such as Haemo-sol® resulted in biofilm structure removal
and a reduction in bacterial cell viability. Due to the nature of P. acnes and the

Chapter 7 249
abundance in HPs, any HP decontamination process should include P. acnes
biofilm control measures. Further work is needed to characterise the
multispecies biofilms containing other bacteria isolated from dental handpieces
and methods of disrupting this biofilm to allow for HP decontamination.
For in vivo cleaning validation, all processes sampled were able to remove
protein from internal and external HP parts to varying degrees. Process 1-3
resulted in the most HP parts with no detectable protein. An increased sample
size for the same method will provide more robust conclusions and fully
determine the efficacy of the machines at cleaning dental HP’s.

Chapter 8 250
8 Chapter 8: Discussion

Chapter 8 251
8.1 Introduction
As early as 1924, Dental HP’s were recognised as an infection control problem
(Appleton Jr and L, 1924). This was before HP’s derived rotary power by
compressed air, had internal cooling systems based on the high pressure spray of
water and before the HP had a more complex internal structure involving
fibreoptic lights and other gears. After a public health scare in 1990 when
patients were infected with HIV after dental treatment (Lewis et al., 1992),
more focus was placed on decontamination procedures in dental clinics including
the use of steam sterilizers and it was around this time dental HP’s were
referred to as ―the weak link of infection control‖ when it was clear that
contamination was able to enter the internal areas of the HP during use (Lewis
et al., 1992). The source of HP contamination is from the oral cavity and the
dental unit water line (Abel et al., 1971, Lewis et al., 1992). These
contaminants can subsequently be released into patients when the compressed
air and cooling water is operated again (Lewis and Boe, 1992). It is clear that
despite advances in HP technology that aim to stop contamination entering such
as anti retraction valves (Ozawa et al., Hu et al., 2007b), contamination is still
able to enter the HP which has a more complex internal structure than in the
past (Herd et al., 2007) therefore both the external and internal structures must
be decontaminated after use.
The last published study into HP contamination in vivo was sampling low speed
HP’s for bacteria in 2007 (Herd et al., 2007). Therefore, contamination of HP’s
still occurs in more recent times.
8.2 Implications of findings
The aim of this study was to characterise the contamination of dental HP’s
before and after decontamination processes. To this end, the study
characterised bacteria and protein contaminants before undertaking a detailed
surface analysis of HP surfaces.

Chapter 8 252
8.2.1 Impact of research
Though the dental HP has been shown to be contaminated with bacteria in the
past, this study has found larger numbers of bacteria on each location and a
larger number of species was also isolated than in previous studies by using a
more sensitive extraction technique (Kellett and Holbrook, 1980, Dreyer and
Hauman, 2001) (Chapter 4). This has increased the knowledge of the typical
microbial contaminants and shown the advantages of sonication for the sampling
of instrument contamination (Kellett and Holbrook, 1980, Dreyer and Hauman,
2001).
The most important finding in this study was the characterisation of protein
contamination of dental HP’s. This is so far the only study on HP’s to apply
quantitative analysis of HP parts by using the OPA assay that is recommended by
BS-EN–ISO-15883 part 1 and used in previous instrument contamination studies
(Smith et al., 2005, Vassey et al.). The method selected for desorption of
protein was also based on BS-EN-ISO-15883 part 1 which recommends flushing of
instruments with 1% (v/v) SDS. The method of extraction was changed to boiling
of the sample to provide increased extraction efficiency and to allow
reproducibility of the method. It was also essential to pick a method that will
allow the protein to be visualised by SDS-PAGE with sacrifices made in protein
extraction efficiency compared to previous studies (Baxter et al., 2006). Protein
was found on all HP parts that had previously been shown to be contaminated by
bacteria mainly the turbine (Kellett and Holbrook, 1980) and the spray channel
(Dreyer and Hauman, 2001). Though the surgical HP inner gear has not previously
been sampled in previous studies, it was assumed that this would be
contaminated during use. The qualitative assessment of HP protein using SDS-
PAGE was possible with the surgical gears upon precipitation of the samples. The
main shortcoming with this method is that analysis is reliant on what
contamination can be removed from the surface. To overcome this, a detailed
surface analysis of HP surfaces using SEM, EDX analysis and a novel EFSCAN
technique (Chapter 6). Contamination was detected on every surface sampled,
including decontaminated surfaces. SEM and EDX analysis revealed additional
contaminants including calcium based residue and contamination trapped in
lubricating oil. Lubricating oil has been shown to inhibit sterilization of

Chapter 8 253
contaminants by not allowing steam penetration (Lewis et al., 1992, Hegna et
al., 1978). The EFSCAN analysis detected more median protein than had been
isolated when contamination was desorbed from the surface (Chapter 5).
8.2.2 Handpiece contamination – test soil development and
implications for cleaning process
Validation of washer disinfectors by the BS-EN-ISO-15883 part 1 requires the
removal of a specific test soil by each cleaning process. A total of 7 test soils
have been deemed suitable for testing cleaning of surgical instruments including
rigid endoscopes all of which have different ingredients and numbers of
ingredients. The soils can range from blood with clotting factors, such as in the
case of the Swedish and Austrian test soil, to a multi-ingredient soil such as the
German test soil containing semolina, butter, sugar, milk powder, and a
suspension of E. faecium (Table 8-1). Though some studies have shown the
reproducibility of the process in laboratory environments (Zuhlsdorf and Martiny,
2005), it is clear that the more complex a test soil, the harder it will be to
remove and a machine unable to remove the German test soil may still be
deemed suitable if it removes the less complex Austrian or Swedish test soil
(Desbuquois et al., 2010).
Decontamination standards often require a process that can remove and sterilize
the most difficult to remove soils and the most heat tolerant organisms. The
times and temperatures of sterilization processes are based on the killing of a G.
stearothermophilus spores that has greater heat resistance than microorganisms
encountered in the medical environment. If a cleaning process can remove a
formulation that represents more challenge than would be encountered during
routine use and the process can sterilize G. stearothermophilus spores then the
decontamination process will also clean and sterilize any challenge encountered
routinely. There have previously been calls for test soils that are specifically
designed for each instrument based on the highest concentration of
contaminants found in vivo (Alfa et al., 1999). To illustrate this debate, a recent
study of the cleanability of dental HP’s contaminated with the Edinburgh test
soil found that washer disinfectors were unable to clear the test soil from HP
turbines (Walker et al., 2010). Whilst legally this would imply that the washer

Chapter 8 254
disinfector used would be unsuitable for HP cleaning, the Edinburgh test soil may
contains an estimated 3.1 g of protein that is significantly larger concentration
than would be found in any HP sampled in this study. The use of a test soil that
contained similar protein concentrations to that found in vivo (turbines 210 µg,
spray channel 448 µg, surgical gear 1936 µg) may have resulted in the machine
removing protein below the limit of detection and therefore would be suitable
for routine cleaning of HP’s.
If a test soil for HP’s was to be developed, qualitative analysis showing the
presence of serum albumin and salivary mucin give an estimate of the
constituents. Serum albumin is the most abundant protein in blood and plasma
(Desroches et al., 2007) and that combined with the mass spectrometry analysis
of used, unprocessed surgical HP’s indicates that an HP test soil will consist of
blood. Salivary mucins are glycosylated proteins and a major constituent of
human saliva (Hu et al., 2007a) indicating that a blood and saliva combination
would make an appropriate test soil (Table 8-1)though the initial concentrations
of protein added would be dependent on the applied location. Identification of
the other proteins present in the HP eluent showed mainly blood constituents
that further justifies the inclusion of blood in the test soil.
Some test soils including the German and the American also have a microbial
constituent. This study indicates that the majority of bacteria from all locations
were CONS (turbine 4x10⁴ CFU, spray channel 3x10⁴ CFU, surgical gear 1.7x10⁵
CFU) and a representative CONS would be suitable for incorporation into the test
soil. Any test soil containing bacteria requires a 5 log reduction from a total
starting concentration of 1x10⁸ CFU, which is how much bacteria would be
present in a high speed and low speed HP test soil. The surgical gear has less
total bacteria and a 5 log reduction would remove all the bacteria which may
mean this minimum cleaning efficacy would require alteration. Surface analysis
of dental HP’s revealed contaminants immersed in lubricating oil (Chapter 7).
The addition of lubricating oil to instruments has long been thought to inhibit
sterilization of bacteria and removal of contaminants (Edwardsson et al., 1983).
The addition of lubricating oil to the test soil may provide a greater challenge
for contaminant removal though the object of the decontamination process is
not to remove lubricating oil.

Chapter 8 255
Knowledge of the HP contaminants allowed the development of in vitro models
to test the cleaning efficacy of cleaning solutions (Chapter 7). For blood
removal, no detergent based cleaning solution removed more blood than ROH2O
alone though alkaline and enzymatic detergents were able to reduce the biomass
of biofilms made by HP isolates. A solution manufactured specifically for HP
cleaning fixed the blood and the biofilm structure to the surface and its use
should be discontinued and replaced with an alkaline detergent which combined
significant biofilm biomass removal with blood removal comparable to ROH2O
alone. These tests can also be adapted to test the cleaning efficacy of other
contaminants or test the efficacy of other cleaning solutions.
Table 8-1 Details of test soils for validation of surgical instrument cleaning
and proposal for new dental HP test soil. Taken from BS-ISO/TS part 5
Country Constituents of test soil
Austrian Heparinized sheep blood coagulated with protamine
German test soils Sheep blood, E. faecium
Egg yolk, E. faecium
Semolina, butter, sugar, milk powder, E. faecium
Germany II Tetramethylbenzidine
hydrogen peroxide solution
bovine haemoglobin
Netherlands Bovine serum albumin fraction 5
porcine gastric mucin tye 3
bovine fibrinogen fraction 1
bovine thrombin
Sweden Citrated cattle blood coagulated with calcium chloride
United Kingdom Defibrinated horse blood/sheep blood, egg yolk, dehydrated hog mucin
Unites States of America
Protein/organic soil (user preference), B. atrophaeus endospores
Albumin, haemoglobin, fibrinogen, thrombin
Proposed dental HP test soil
Coagulase negative Staphylococci, P. acnes biofilms,
Citrated blood with CaCl2 (Turbine concentration 200 µg, Spray channel concentration 400 µg, Surgical HP concentration (2000 µg). Salivary mucin.

Chapter 8 256
8.2.3 Handpiece contamination – cross contamination risks
Very little bacteria and protein were isolated from HP’s after decontamination
using the GDH method (Section 5.2-10). No bacteria were isolated from turbines
and surgical gears after decontamination using our extraction method (Chapter
5). Despite surgical gears having significantly more bacteria than turbines and
spray channels before decontamination, surgical HP’s are designed for simple
disassembly to allow access of the inner gear for cleaning due to the invasive
procedures carried out by the surgical HP. Bacteria were found in significantly
smaller numbers in spray channels after decontamination. The bacteria
identified were P. acnes, CONS and Gram negative bacilli which are associated
with opportunistic infections of the oral cavity though these are not fatal
(Jackson et al., 1999, Fujii et al., 2009, Aragone et al., 1992). The bacteria were
not present in large numbers but the fact that bacteria are present indicates a
failure of the GDH sterilization process and requires further investigation
involving a larger sample size.
Refering to the BS-EN-ISO-15883 part 1 standard where a positive reaction with
the OPA assay indicates a failure of the decontamination process, a total of 7
turbines, 5 spray channels and 1 surgical gear would fail this cleaning validation.
The sensitivity of the OPA assay was calculated as 5 µg/ml of protein (Chapter 3)
and opinion differs as to the cross contamination risk associated with protein
cotamination (Lipscomb et al., 2006a). A protein based contaminant known to
cause disease is the prion protein that causes Creutzfeldt- Jakob disease (CJD)
which is a fatal neurodegenerative disease (Glatzel et al., 2003) whilst most
protein contamination will only be benign. The prion protein is resistant to
steam sterilization (Taylor and McConnell, 1988) and certain chemical
inactivation methods (Mould et al., 1965). The risk of direct CJD transmission
through dental procedures is rated as low according to recent department of
health guidelines (Department of Health, 2007) with an estimated risk
assessment and a study of oral and brain human tissue of CJD victims showed
that only the brain and trigeminal ganglion contained any detectable prion
protein (Head et al., 2003). No prion potein was detected in the alveolar nerve,
Chapter 8 257
dental pulp, gingiva, salivary gland or tongue that are more likely to be
contacted during dental surgery (Head et al., 2003). An animal model has shown
the transmission of prion protein through intradental injection of the left incisor
(Ingrosso et al., 1999). This represents a worst case scenario that shows that
transmission through this oral route is possible. This current study did not
attempt to identify the prion protein from HP samples but the presence of
internalised blood protein indicating blood protein may be of concern due to the
transmission of prion protein through blood transfusion (Flanagan and Barbara,
1996), (Llewelyn et al., 2004).
Surface analysis using SEM and EDX analysis reveals microscopic contamination
on surfaces that had been through decontamination processes (Chapter 7). The
impact of this contamination is unclear due to the limited identification of these
contaminants. One issue highlighted was the presence of contaminants
surrounded by lubricating oil which may have implications for the use of
lubricating oil before decontamination as it may trap contaminants and prevent
their removal. The use of lubricating oil should ideally follow the
decontamination process to allow contaminants to be removed.
8.2.4 Limitations of the study
The survey of HP contaminants using desorption (Chapter 4, Chapter 5) was
based on a few key HP parts such as the turbine that had been shown to be
susceptible to contamination in previous studies (Lewis and Boe, 1992). It is
conceivable that contamination may travel to other parts of the HP and be
missed by the survey, such as the internal gear of low speed HP’s(Chin et al.,
2006). These additional inner parts and gears would have no direct contact with
the patient even upon the passage of water or compressed air though an
argument can be made that the entire HP must be sterile to assure a sterile
instrument. The access of these parts would also require specialist dismantling
of the HP that would cause it to cease to function or require extensive repair.
Whilst swabbing of these parts could isolate bacteria and protein the current
study preferred an approach with increased sensitivity as opposed to swabbing
which has varying efficacies (Lipscomb et al., 2006a). Therefore a complete
picture of HP contamination was not possible in this survey.

Chapter 8 258
The HP’s sampled had to return to the general circulation of the GDH and
therefore could not be sacrificed for access to parts or to apply a more sensitive
protein removal technique or to utilise certain surface analysis techniques
involving chemical fixation of samples. Whilst this represented a cost saving for
the study the fact that contaminants may be missed cannot be ignored. Ideally,
a number of HP’s would be sacrificed to allow a more complete analysis
involving acid stripping or fixation of the instrument for visualisation of organic
contamination on a surface using SEM. The high cost of HP’s is a major obstacle
to any studies of this nature and an alternative would be to sacrifice certain HP
parts.
The bacteria isolated from HP’s did not incorporate or identify any non
culturable bacteria either due to their fastidious nature or the inability to grow
on the media selected. A larger selection of media and application of 16S PCR
sequencing will allow identification of additional isolates.
Protein isolated from 20 precipitated samples of turbines and spray channels
before decontamination was at too low a concentration to be identified by the
MS method (Chapter 6). Precipitation methods will inevitably result in a loss of
some protein (Chapter 6) though were essential for this study due to the large
sample volumes. The precipitation of more samples of turbines and spray
channels may allow for a higher concentration of protein that is able to be
identified by mass spectrometry. With the data available for the development of
an HP test soil, it is assumed that turbines and spray channels are exposed to
similar contaminants to the surgical gear albeit at lower protein concentrations.
8.3 Future work
Future work leading on from this research can be applied to study the
contamination and decontamination of both HP’s and other instruments. Dental
practitioners, whom may have varied decontamination processes (Smith et al.,
2009), provide the majority of dental services in the UK and the contaminants
encountered may provide a more realistic contamination for a test soil. This
would also inform on the optimum methods for the decontamination of dental
HP’s that can be applied to a dental practice setting that may not have the

Chapter 8 259
resources and space to set up a decontamination facility that exits in a larger
hospital.
A gap in this study was the sampling for viruses which are capable of being
internalised and survive inside the HP (Epstein et al., 1995). Some blood borne
viruses are capable of causing fatal disease if patient exposure occurs. For HP’s
in vivo, HIV and HBV DNA has been isolated after treatment of infected patients
(Hu et al., 2007b, Lewis and Boe, 1992). The DNA does not indicate if the virus is
viable and capable of causing disease. HP studies using PCR to highlight the
presence of DNA coupled with cell culture infectivity studies would identify the
potential viral contaminants as well as indicating the presence of viable viruses
(Epstein et al., 1995).
There exists a lack of validated data justifying the use of AWD’s for the cleaning
of dental HP’s which are recommended for routine decontamination. Whilst
WD’s are recommended as the gold standard for cleaning and is used in central
decontamination facilities (Smith et al., 2009), recent studies have shown that
they do not always result in an increase in protein removal when compared to
ultrasonic baths or other methods of cleaning (Vassey et al., 2011). Therefore to
justify guidelines for HP’s, the efficacy of WD’s should be measured much as the
vacuum sterilizer has been validated through scientific study (Andersen et al.,
1999). The surface analysis techniques detailed in this study can allow for the
sensitive validation of decontamination processes (Baxter et al., 2009). By
discovering and highlighting areas of the instrument that are contaminated
during use, the subsequent surface analysis of the same locations after cleaning
would show if the contaminants have been removed or if the cleaning process
would require redesign to access certain areas.
The presence of CONS and P. acnes isolates in decontaminated HP’s requires
further investigation to determine the cross contamination risk. Both CONS and
P.acnes have been isolated from endodontic pockets and are therefore
associated with dental infections (Niazi et al., 2010). The link between dental
HP’s and infections can be proven by isolating bacteria from both the HP and any
dental infection and sequencing any identical species recovered. This would

Chapter 8 260
confirm an origin of dental infections as inadequately decontaminated dental
HP’s.
The HP is a mechanical tool that has a complex internal structure and requires
lubrication to prolong the life of the HP and it is clear that both the structure
and the lubricating oil are inhibiting decontamination processes. Whilst the cross
contamination risk is still a long way from being fully explored, the design of
future HP’s should take decontamination into account. Recently, single use HP’s
have been developed to overcome the issues associated with decontamination of
dental HP’s.Whilst single use HP’s would eliminate the cross contamination risk
and the need for the development of decontamination processes; the cheap
material used in the construction may not allow it to undertake some processes.
The single use HP may also be associated with increased costs and increased
waste that would be generated may make a single use HP currently unworkable.
An alternative to single use HP’s can be a fundamental change in HP design. This
would require collaboration between researchers, HP manufacturers, engineers
and perhaps manufacturers of other surgical PT’s to inform development of an
HP that can deliver an instrument of equal performance, provide cooling of the
tooth surface, have as little moving parts as possible be easily dissasembled and
include ceramic ball bearings to reduce or eliminate the need for lubrication.
With this additional work, the dental HP may lose the unenviable title of the
―weak link of infection control‖.

261
Publications
Smith, G.W., Goldie, F., Long, S., Lappin, D.F., Ramage, G., & Smith, A.J.
(2011) Quantitative analysis of residual protein concentration of podiatry
instruments reprocessed through local and central decontamination units. J.Foot
Ankle Res, 4,2.
Abstracts
G.W.G. Smith, G. Ramage, A.J. Smith. Biofouling of Dental Handpieces. WFHSS, Crete, October 2009.
G.W.G. Smith, G. Ramage, A.J. Smith. Biofouling of Dental Handpieces / Reprocessing of podiatry instruments. LDU managers’ conference, Glasgow, May 2010.
G.W.G. Smith, G. Ramage, A.J. Smith. Analysis of Residual Protein on Unprocessed and Decontaminated Extraction Forceps, IADR, Barcelona, July 2010.
G.W.G. Smith, G. Ramage, A.J. Smith. Biofilm Formation by Propionibacterium acnes Isolated from Dental Handpieces, FIS, Edinburgh, November 2010.
G.W.G. Smith, H. Baxter, G. Ramage, A.J. Smith. Handpiece contamination- a Molecular Biology, Proteomics, and Surface Analysis Approach. IADR, San Diego, March 2011.

262
References
BS - EN - ISO 14776 Chemical disinfectants and antiseptics. Quantitative suspension test for the evaluation of bactericidal activity of chemical disinfectants for instruments used in the medical area. Test methods and requirements (Phase 2 / Step 1). 2003.
BS - EN - ISO 14776 Chemical disinfectants and antiseptics. Virucidal quantitative suspension test for chemical disinfectants and antiseptics used in human medicine . Test methods and requirements (phase 2, step 1). 2005.
Centres for Disease Control and Prevention. Guidelines for infection control in dental health care settings- 2003. Morbid Mortal Weekly, 52.
ISO/ TS 15883 Part 5 (2005) Washer- disinfectors - Part 5: Test soils and methods for demonstrating cleaning efficacy of washer-disinfectors.
(The) Management of Health and Safety at Work Regulations 1999. HMSO.
Medical Devices Agency. Sterlization, disinfection and cleaning of medical equipment: Guidance on decontamination from the microbiology advisory committee to Department of Health. London: The Stationery office. 2006. British Dental Association Advice Sheet A12.
ABEL, L. C., MILLER, R. L., MICIK, R. E. & RYGE, G. (1971) Studies on dental aerobiology. IV. Bacterial contamination of water delivered by dental units. J Dent Res, 50, 1567-9.
AGHA-HOSSEINI, F., DIZGAH, I. M. & AMIRKHANI, S. (2006) The composition of unstimulated whole saliva of healthy dental students. J Contemp Dent Pract, 7, 104-11.
AGUILAR, R. M., BUSTAMANTE, J. J., HERNANDEZ, P. G., MARTINEZ, A. O. & HARO, L. S. (1999) Precipitation of dilute chromatographic samples (ng/ml) containing interfering substances for SDS-PAGE. Anal Biochem, 267, 344-50.
AL MAGHLOUTH, A., AL YOUSEF, Y. & AL BAGIEH, N. (2004) Qualitative and quantitative analysis of bacterial aerosols. J Contemp Dent Pract, 5, 91-100.
ALFA, M. J., DEGAGNE, P. & OLSON, N. (1999) Worst-case soiling levels for patient-used flexible endoscopes before and after cleaning. Am J Infect Control, 27, 392-401.
ALFA, M. J., OLSON, N. & DEGAGNE, P. (2006) Automated washing with the Reliance Endoscope Processing System and its equivalence to optimal manual cleaning. Am J Infect Control, 34, 561-70.
AMAHA, M. & SAKAGUCHI, K. I. (1954) Effects of carbohydrates, proteins, and bacterial cells in the heating media on the heat resistance of Clostridium sporogenes. J Bacteriol, 68, 338-45.
ANDERSEN, H. K., FIEHN, N. E. & LARSEN, T. (1999) Effect of steam sterilization inside the turbine chambers of dental turbines. Oral Surg Oral Med Oral Pathol Oral Radiol Endod, 87, 184-8.
ANDERSEN, S. R. (1971) Ethylene oxide toxicity. A study of tissue reactions to retained ethylene oxide. J Lab Clin Med, 77, 346-56.

263
ANDERSON, T. F. (1951) Techniques for preservation of 3-dimensional structures in preparing specimens for electron microscopy. Trans. N.Y. Acad. Sci, 13, 130-133.
ANGELINI, E. (1992) Influence of sterilization on the corrosion resistance of high-speed dental handpieces. Quintessence Int, 23, 215-22.
ANGELOTTI, R., WILSON, J. L., LITSKY, W. & WALTER, W. G. (1964) Comparative evaluation of the cotton swab and Rodac methods for the recovery of Bacillus subtilis spore contamination from stainless steel surfaces. Health Lab Sci, 1, 289-96.
APPLETON JR & L, J. (1924) The Sterilization of the Handpiece. Dental Cosmos, 66, 861- 877.
ARAGONE, M. R., MAURIZI, D. M., CLARA, L. O., NAVARRO ESTRADA, J. L. & ASCIONE, A. (1992) Pseudomonas mendocina, an environmental bacterium isolated from a patient with human infective endocarditis. J Clin Microbiol, 30, 1583-4.
ARAKAWA, K., NAGARA, H., ITOYAMA, Y., DOH-URA, K., TOMOKANE, N., TATEISHI, J. & GOTO, I. (1991) Clustering of three cases of Creutzfeldt-Jakob disease near Fukuoka City, Japan. Acta Neurol Scand, 84, 445-7.
ARNEBRANT, T., BARTON, K. & AND NYLANDER, T. (1986) Adsorption of α-lactoalbumin and β-lactoglobulin on metal surfaces versus temperature. J. Colloid Interface Sci, 119.
ATLAS, R. M., WILLIAMS, J. F. & HUNTINGTON, M. K. (1995) Legionella contamination of dental-unit waters. Appl Environ Microbiol, 61, 1208-13.
BAGGISH, M. S., POIESZ, B. J., JORET, D., WILLIAMSON, P. & REFAI, A. (1991) Presence of human immunodeficiency virus DNA in laser smoke. Lasers Surg Med, 11, 197-203.
BAKER, W. L. (1991) Potential interference of hydrogen peroxide in the 2,2'-bicinchoninic acid protein assay. Anal Biochem, 192, 212-4.
BAL, W., CHRISTODOULOU, J., SADLER, P. J. & TUCKER, A. (1998) Multi-metal binding site of serum albumin. J Inorg Biochem, 70, 33-9.
BAUMAN, P. A., LAWRENCE, L. A., BIESERT, L., DICHTELMULLER, H., FABBRIZZI, F., GAJARDO, R., GRONER, A., JORQUERA, J. I., KEMPF, C., KREIL, T. R., VON HOEGEN, I., PIFAT, D. Y., PETTEWAY, S. R., JR. & CAI, K. (2006) Critical factors influencing prion inactivation by sodium hydroxide. Vox Sang, 91, 34-40.
BAXTER, H. C., RICHARDSON, P., CAMPBELL, G. A., KOVALEV, V. I., MAIER, R., BARTON, J. S., JONES, A., DELARGE, G., CASEY, M. & BAXTER, R. L. (2009) Application of epifluorescence scanning for monitoring the efficacy of protein removal by RF gas-plasma decontamination. NJP, 13.
BAXTER, R. L., BAXTER, H. C., CAMPBELL, G. A., GRANT, K., JONES, A., RICHARDSON, P. & WHITTAKER, G. (2006) Quantitative analysis of residual protein contamination on reprocessed surgical instruments. J Hosp Infect, 63, 439-44.
BAYSTON, R., ASHRAF, W., BARKER-DAVIES, R., TUCKER, E., CLEMENT, R., CLAYTON, J., FREEMAN, B. J. & NURADEEN, B. (2007a) Biofilm

264
formation by Propionibacterium acnes on biomaterials in vitro and in vivo: impact on diagnosis and treatment. J Biomed Mater Res A, 81, 705-9.
BAYSTON, R., NURADEEN, B., ASHRAF, W. & FREEMAN, B. J. (2007b) Antibiotics for the eradication of Propionibacterium acnes biofilms in surgical infection. J Antimicrob Chemother, 60, 1298-301.
BECKER, E. D. & FARRAR, T. C. (1972) Fourier transform spectroscopy. Science, 178, 361-8.
BENNETT, A. M., FULFORD, M. R., WALKER, J. T., BRADSHAW, D. J., MARTIN, M. V. & MARSH, P. D. (2000) Microbial aerosols in general dental practice. Br Dent J, 189, 664-7.
BENNIKE, P. & FREDEBO, L. (1985) [Dental treatment in the Stone Age]. Tandlaegebladet, 89, 459-65.
BENSON, P. E. & DOUGLAS, C. W. (2007) Decontamination of orthodontic bands following size determination and cleaning. J Orthod, 34, 18-24.
BERNOULLI, C., SIEGFRIED, J., BAUMGARTNER, G., REGLI, F., RABINOWICZ, T., GAJDUSEK, D. C. & GIBBS, C. J., JR. (1977) Danger of accidental person-to-person transmission of Creutzfeldt-Jakob disease by surgery. Lancet, 1, 478-9.
BJERKAN, G., WITSO, E. & BERGH, K. (2009) Sonication is superior to scraping for retrieval of bacteria in biofilm on titanium and steel surfaces in vitro. Acta Orthop, 80, 245-50.
BOYD, R. D., COLE, D., ROWE, D., VERRAN, J., PAUL, A. J. & WEST, R. H. (2001) Cleanability of soiled stainless steel as studied by atomic force microscopy and time of flight secondary ion mass spectrometry. J Food Prot, 64, 87-93.
BRADFORD, M. M. (1976) A rapid and sensitive method for the quantitation of microgram quantities of protein utilizing the principle of protein-dye binding. Anal Biochem, 72, 248-54.
BRIDIER, A., DUBOIS-BRISSONNET, F., BOUBETRA, A., THOMAS, V. & BRIANDET, R. The biofilm architecture of sixty opportunistic pathogens deciphered using a high throughput CLSM method. J Microbiol Methods, 82, 64-70.
BS-EN-ISO-15883 (2006) Washer- disinfectors- Part 1. General requirements, definitions and tests.
BUCKINGHAM-MEYER, K., GOERES, D. M. & HAMILTON, M. A. (2007) Comparative evaluation of biofilm disinfectant efficacy tests. J Microbiol Methods, 70, 236-44.
BURKHART, C. G. & BURKHART, C. N. (2007) Expanding the microcomedone theory and acne therapeutics: Propionibacterium acnes biofilm produces biological glue that holds corneocytes together to form plug. J Am Acad Dermatol, 57, 722-4.
BURKHART, C. N. & BURKHART, C. G. (2006) Genome sequence of Propionibacterium acnes reveals immunogenic and surface-associated genes confirming existence of the acne biofilm. Int J Dermatol, 45, 872.
265
BURZYNSKI, S. (1969) Investigations on unknown ninhydrin-reacting substances in human blood serum. I. Attempts at identification of 3 such substances. Experientia, 25, 490-1.
BUTTNER, M. P., CRUZ-PEREZ, P. & STETZENBACH, L. D. (2001) Enhanced detection of surface-associated bacteria in indoor environments by quantitative PCR. Appl Environ Microbiol, 67, 2564-70.
CAMPANAC, C., PINEAU, L., PAYARD, A., BAZIARD-MOUYSSET, G. & ROQUES, C. (2002) Interactions between biocide cationic agents and bacterial biofilms. Antimicrob Agents Chemother, 46, 1469-74.
CANDIANO, G., BRUSCHI, M., MUSANTE, L., SANTUCCI, L., GHIGGERI, G. M., CARNEMOLLA, B., ORECCHIA, P., ZARDI, L. & RIGHETTI, P. G. (2004) Blue silver: a very sensitive colloidal Coomassie G-250 staining for proteome analysis. Electrophoresis, 25, 1327-33.
CAPIZZI, P. J., CLAY, R. P. & BATTEY, M. J. (1998) Microbiologic activity in laser resurfacing plume and debris. Lasers Surg Med, 23, 172-4.
CHECCHI, L., MONTEBUGNOLI, L. & SAMARITANI, S. (1998) Contamination of the turbine air chamber: a risk of cross infection. J Clin Periodontol, 25, 607-11.
CHERRY, C., GIBBONS, M. & RONAYNE, J. (1974) The origins of the air-turbine dental handpiece. Br Dent J, 136, 469-72.
CHIN, J. R., MILLER, C. H. & PALENIK, C. J. (2006) Internal contamination of air-driven low-speed handpieces and attached prophy angles. J. Am. Dent. Assoc., 137, 1275-1280.
CHRISTENSEN, J. G. (1999) The high speed handpiece dilemma. JADA, 130, 1494-1496.
CLARKE, B., KINGSHOTT, P., HOU, X., ROCHEV, Y., GORELOV, A. & CARROLL, W. (2007) Effect of nitinol wire surface properties on albumin adsorption. Acta Biomater, 3, 103-11.
COENYE, T., PEETERS, E. & NELIS, H. J. (2007) Biofilm formation by Propionibacterium acnes is associated with increased resistance to antimicrobial agents and increased production of putative virulence factors. Res Microbiol, 158, 386-92.
COMPTON, S. J. & JONES, C. G. (1985) Mechanism of dye response and interference in the Bradford protein assay. Anal Biochem, 151, 369-74.
CONGDON, R. W., MUTH, G. W. & SPLITTGERBER, A. G. (1993) The binding interaction of Coomassie blue with proteins. Anal Biochem, 213, 407-13.
COSTERTON, J. W., GEESEY, G. G. & CHENG, K. J. (1978) How bacteria stick. Sci Am, 238, 86-95.
CREIGHTON, E., T. (1993) Protein: Structures and molecular properties, New York, W.H. Freeman and Company.
CRUTWELL, M. (2008) A Comparison of Surgical Instrument Test Soils Published in ISO/TS 15883-5. Zentralsterilisation - Central service, 16, 256-265.
DAS, S., KANAMOTO, T., GE, X., XU, P., UNOKI, T., MUNRO, C. L. & KITTEN, T. (2009) Contribution of lipoproteins and lipoprotein processing to

266
endocarditis virulence in Streptococcus sanguinis. J Bacteriol, 191, 4166-79.
DAUFIN, G., MERIN, U., LABBE, J. P., QUEMERAIS, A. & KERHERVE, F. L. (1991) Cleaning of inorganic membranes after whey and milk ultrafiltration. Biotechnol Bioeng, 38, 82-9.
DE BEER, D., STOODLEY, P. & LEWANDOWSKI, Z. (1994) Liquid flow in heterogeneous biofilms. Biotechnol Bioeng, 44, 636-41.
DEPARTMENT OF HEALTH (2007) Potential vCJD transmission risks via dentistry: an interim review.
DESBUQUOIS, C., RICHARD, M., KHAMMO, N., MCDONNELL, G. & PINEAU, L. (2010) Artificial Test Soils for Cleaning Efficacy Studies: An Evaluation. Zentralsterilisation - Central service, 256-265.
DESROCHES, M. J., CHAUDHARY, N. & OMANOVIC, S. (2007) PM-IRRAS investigation of the interaction of serum albumin and fibrinogen with a biomedical-grade stainless steel 316LVM surface. Biomacromolecules, 8, 2836-44.
DESROCHES, M. J. & OMANOVIC, S. (2008) Adsorption of fibrinogen on a biomedical-grade stainless steel 316LVM surface: a PM-IRRAS study of the adsorption thermodynamics, kinetics and secondary structure changes. Phys Chem Chem Phys, 10, 2502-12.
DINAKARAN, S. & KAYARKAR, V. V. (2002) Debris on processed ophthalmic instruments: a cause for concern. Eye, 16, 281-4.
DONLAN, R. M. & COSTERTON, J. W. (2002) Biofilms: survival mechanisms of clinically relevant microorganisms. Clin Microbiol Rev, 15, 167-93.
DOUMAS, B. T. (1975) Standards for total serum protein assays--a collaborative study. Clin Chem, 21, 1159-66.
DREYER, A. G. & HAUMAN, C. H. (2001) Bacterial contamination of dental handpieces. SADJ, 56, 510-2.
DYSON, J. E. & DARVELL, B. W. (1993a) The development of the dental high-speed air turbine handpiece. Part 1. Aust Dent J, 38, 49-58.
DYSON, J. E. & DARVELL, B. W. (1993b) The development of the dental high-speed air turbine handpiece. Part 2. Aust Dent J, 38, 131-43.
EDWARDSSON, S., SVENSATAR, G. & BIRKHED, D. (1983) Steam sterilization of air turbine dental handpieces. Acta. Odonto. Scand, 41, 321-326.
EGHIAIAN, F., GROSCLAUDE, J., LESCEU, S., DEBEY, P., DOUBLET, B., TREGUER, E., REZAEI, H. & KNOSSOW, M. (2004) Insight into the PrPC-->PrPSc conversion from the structures of antibody-bound ovine prion scrapie-susceptibility variants. Proc Natl Acad Sci U S A, 101, 10254-9.
EIFRIG, C. W., SCOTT, I. U., FLYNN, H. W., JR. & MILLER, D. (2003) Endophthalmitis caused by Pseudomonas aeruginosa. Ophthalmology, 110, 1714-7.
EPSTEIN, J. B., REA, G., SIBAU, L., SHERLOCK, C. H. & LE, N. D. (1995) Assessing viral retention and elimination in rotary dental instruments. J Am Dent Assoc, 126, 87-92.

267
FALK, B. W. & ELLIOTT, C. (1985) Fluorescent monitoring of proteins during sodium dodecyl sulfate-polyacrylamide gel electrophoresis and Western blotting. Anal Biochem, 144, 537-41.
FIC, E., KEDRACKA-KROK, S., JANKOWSKA, U., PIROG, A. & DZIEDZICKA-WASYLEWSKA, M. (2010) Comparison of protein precipitation methods for various rat brain structures prior to proteomic analysis. Electrophoresis, 31, 3573-9.
FINE, I. H., PACKER, M. & HOFFMAN, R. S. (2002) New phacoemulsification technologies. J Cataract Refract Surg, 28, 1054-60.
FITZGERALD, M. C. & SMITH, L. M. (1995) Mass spectrometry of nucleic acids: the promise of matrix-assisted laser desorption-ionization (MALDI) mass spectrometry. Annu Rev Biophys Biomol Struct, 24, 117-40.
FLANAGAN, P. & BARBARA, J. A. (1996) Prion disease and blood transfusion. Transfus Med, 6, 213-5.
FOOD AND DRUG ADMINISTRATION (2001) U.S Department of Health and Human Services - Guidance for Industry Bioanalytical Method Validation.
FRIEDMAN, M. & WILLIAMS, L. D. (1974) Stoichiometry of formation of Ruhemann's purple in the ninhydrin reaction. Bioorg. Chem, 3, 267-280.
FUJII, R., SAITO, Y., TOKURA, Y., NAKAGAWA, K. I., OKUDA, K. & ISHIHARA, K. (2009) Characterization of bacterial flora in persistent apical periodontitis lesions. Oral Microbiol Immunol, 24, 502-5.
FUKUZAKI, S., URANO, H. & NAGATA, K. (1995) Adsorption of Bovine Serum Albumin onto Metal Oxide Surfaces. Journal of Fermentation and Bioengineering 81, 163-167.
GARDEN, J. M., O'BANION, M. K., BAKUS, A. D. & OLSON, C. (2002) Viral disease transmitted by laser-generated plume (aerosol). Arch Dermatol, 138, 1303-7.
GIBSON, H., TAYLOR, J. H., HALL, K. E. & HOLAH, J. T. (1999) Effectiveness of cleaning techniques used in the food industry in terms of the removal of bacterial biofilms. J Appl Microbiol, 87, 41-8.
GLATZEL, M., ABELA, E., MAISSEN, M. & AGUZZI, A. (2003) Extraneural pathologic prion protein in sporadic Creutzfeldt- Jakob disease. N. Engl. J. Med, 349, 1812-1820.
GORMAN, S. P., ADAIR, C. G. & MAWHINNEY, W. M. (1994) Incidence and nature of peritoneal catheter biofilm determined by electron and confocal laser scanning microscopy. Epidemiol Infect, 112, 551-9.
GROSS, P. M. & DIXON, L. F. (1937) Method of Sterilizing. U.S Patent 2,037,439.
HAMLET, S. M. (2010) Quantitative analysis of periodontal pathogens by ELISA and real-time polymerase chain reaction. Methods Mol Biol, 666, 125-40.
HAMMER, K. D. & NAGEL, K. (1986) An automated fluorescence assay for subnanogram quantities of protein in the presence of interfering material. Anal Biochem, 155, 308-14.

268
HAYASHI, H., SAKAMOTO, M. & BENNO, Y. (2004) Evaluation of three different forward primers by terminal restriction fragment length polymorphism analysis for determination of fecal bifidobacterium spp. in healthy subjects. Microbiol Immunol, 48, 1-6.
HEAD, M. W., RITCHIE, D., MCLOUGHLIN, V. & IRONSIDE, J. W. (2003) Investigation of PrPres in dental tissues in variant CJD. Br Dent J, 195, 339-43; discussion 331.
HEGNA, I. K., KARDEL, K. & KARDEL, M. (1978) Autoclaving of lubricated dental instruments. Scand J Dent Res, 86, 130-4.
HEILMANN, C., SCHWEITZER, O., GERKE, C., VANITTANAKOM, N., MACK, D. & GÖTZ, F. (1996) Molecular basis of intracellular adhesion in the biofilm-forming Staphylococcus epidermidis. Mol. Microbiol, 24, 1013-1024.
HERD, S., CHIN, J., PALENIK, C. J. & OFNER, S. (2007) The in vivo contamination of air-driven low-speed handpieces with prophylaxis angles. J Am Dent Assoc, 138, 1360-5; quiz 1383.
HESP, J. R., POOLMAN, T. M., BUDGE, C., BATTEN, L., ALEXANDER, F., MCLUCKIE, G., O'BRIEN, S., WELLS, P., RAVEN, N. D. & SUTTON, J. M. (2010) Thermostable adenylate kinase technology: a new process indicator and its use as a validation tool for the reprocessing of surgical instruments. J Hosp Infect, 74, 137-43.
HINTAO, J., TEANPAISAN, R., CHONGSUVIVATWONG, V., RATARASAN, C. & DAHLEN, G. (2007) The microbiological profiles of saliva, supragingival and subgingival plaque and dental caries in adults with and without type 2 diabetes mellitus. Oral Microbiol Immunol, 22, 175-81.
HOFMANN, S. (1979) Surface and thin-film analysis: Concepts, capabilities and limitations. Talanta, 26, 665-73.
HOLLAND, C., MAK, T. N., ZIMNY-ARNDT, U., SCHMID, M., MEYER, T. F., JUNGBLUT, P. R. & BRUGGEMANN, H. (2010) Proteomic identification of secreted proteins of Propionibacterium acnes. BMC Microbiol, 10, 230.
HOLMBERG, A., LOOD, R., MORGELIN, M., SODERQUIST, B., HOLST, E., COLLIN, M., CHRISTENSSON, B. & RASMUSSEN, M. (2009) Biofilm formation by Propionibacterium acnes is a characteristic of invasive isolates. Clin Microbiol Infect, 15, 787-95.
HORTIN, G. L. (2006) The MALDI-TOF mass spectrometric view of the plasma proteome and peptidome. Clin Chem, 52, 1223-37.
HOWLIN, R. P., KHAMMO, N., SECKER, T., MCDONNELL, G. & KEEVIL, C. W. Application of a fluorescent dual stain to assess decontamination of tissue protein and prion amyloid from surgical stainless steel during simulated washer-disinfector cycles. J Hosp Infect, 75, 66-71.
HU, S., LOO, J. A. & WONG, D. T. (2007a) Human saliva proteome analysis. Ann N Y Acad Sci, 1098, 323-9.
HU, T., LI, G., ZUO, Y. & ZHOU, X. (2007b) Risk of hepatitis B virus transmission via dental handpieces and evaluation of an anti-suction device for prevention of transmission. Infect Control Hosp Epidemiol, 28, 80-2.

269
IMAMURA, K., KAWASAKI, Y., AWADZU, T., SAKIYAMA, T. & NAKANISHI, K. (2003) Contribution of acidic amino residues to the adsorption of peptides onto a stainless steel surface. J Colloid Interface Sci, 267, 294-301.
INGROSSO, L., PISANI, F. & POCCHIARI, M. (1999) Transmission of the 263K scrapie strain by the dental route. J Gen Virol, 80 ( Pt 11), 3043-7.
JACKSON, G. S., MURRAY, I., HOSSZU, L. L., GIBBS, N., WALTHO, J. P., CLARKE, A. R. & COLLINGE, J. (2001) Location and properties of metal-binding sites on the human prion protein. Proc Natl Acad Sci U S A, 98, 8531-5.
JACKSON, M. S., BAGG, J., GUPTA, M. N. & STURROCK, R. D. (1999) Oral carriage of staphylococci in patients with rheumatoid arthritis. Rheumatology (Oxford), 38, 572-5.
JIANG, L., HE, L. & FOUNTOULAKIS, M. (2004) Comparison of protein precipitation methods for sample preparation prior to proteomic analysis. J Chromatogr A, 1023, 317-20.
JOHNSON, J. L. & CUMMINS, C. S. (1972) Cell wall composition and deoxyribonucleic acid similarities among the anaerobic coryneforms, classical propionibacteria, and strains of Arachnia propionica. J Bacteriol, 109, 1047-66.
JOTIKASTHIRA, N. E., LIE, T. & LEKNES, K. N. (1992) Comparative in vitro studies of sonic, ultrasonic and reciprocating scaling instruments. J Clin Periodontol, 19, 560-9.
KAMPF, G., BLOSS, R. & MARTINY, H. (2004) Surface fixation of dried blood by glutaraldehyde and peracetic acid. J Hosp Infect, 57, 139-43.
KASERMANN, F. & KEMPF, C. (2003) Sodium hydroxide renders the prion protein PrPSc sensitive to proteinase K. J Gen Virol, 84, 3173-6.
KAST, R. E. (1976) Introduction to the scrapie diseases: self-replicating agents surviving standard autoclaving for an hour and 10% formalin for a year. Mater Med Pol, 8, 3-12.
KEANE, P. F., BONNER, M. C., JOHNSTON, S. R., ZAFAR, A. & GORMAN, S. P. (1994) Characterization of biofilm and encrustation on ureteric stents in vivo. Br J Urol, 73, 687-91.
KELLETT, M. & HOLBROOK, W. P. (1980) Bacterial contamination of dental handpieces. J Dent, 8, 249-53.
KIDD, E. A. M., SMITH, B. G. N. & WATSON, T. F. (2003) Pickard's Manual of Operative Dentistry, New York, Oxford University Press.
KITTAKA, S. (1974) Isoelectric point of Al2O3, Cr2O3 and Fe2O3. I. Effect of heat treatment. J. Colloid Interface Sci, 48.
KNIGHT, J. S., DRAUGHN, R. & EVANS, M. D. (1999) Effects of handpiece lubrication on resin-based composite bond strength to enamel. Am J Dent, 12, 116-8.
KOBAYASHI, M., NAKAGAWA, Y., OKAMOTO, Y., NAKAMURA, S. & NAKAMURA, T. (2009) Structural damage and chemical contaminants on reprocessed arthroscopic shaver blades. Am J Sports Med, 37, 266-73.

270
KOCH-NOLTE, F., PETERSEN, D., BALASUBRAMANIAN, S., HAAG, F., KAHLKE, D., WILLER, T., KASTELEIN, R., BAZAN, F. & THIELE, H. G. (1996) Mouse T cell membrane proteins Rt6-1 and Rt6-2 are arginine/protein mono(ADPribosyl)transferases and share secondary structure motifs with ADP-ribosylating bacterial toxins. J Biol Chem, 271, 7686-93.
KOCIJAN, A., MILOSEV, I. & PIHLAR, B. (2003) The influence of complexing agent and proteins on the corrosion of stainless steels and their metal components. J Mater Sci Mater Med, 14, 69-77.
KOLSTAD, R. A. (1998) How well does the Chemiclave sterlize handpieces? J. Am. Dent. Assoc., 129, 985-991.
KUBIAK-OSSOWSKA, K. & MULHERAN, P. A. (2010) Mechanism of hen egg white lysozyme adsorption on a charged solid surface. Langmuir, 26, 15954-65.
LABANCA, M., AZZOLA, F., VINCI, R. & RODELLA, L. F. (2008) Piezoelectric surgery: twenty years of use. Br J Oral Maxillofac Surg, 46, 265-9.
LAMANDA, A., CHEAIB, Z., TURGUT, M. D. & LUSSI, A. (2007) Protein buffering in model systems and in whole human saliva. PLoS ONE, 2, e263.
LAWRENCE, J. R., KORBER, D. R., HOYLE, B. D., COSTERTON, J. W. & CALDWELL, D. E. (1991) Optical sectioning of microbial biofilms. J Bacteriol, 173, 6558-67.
LAWSON, V. A., STEWART, J. D. & MASTERS, C. L. (2007) Enzymatic detergent treatment protocol that reduces protease-resistant prion protein load and infectivity from surgical-steel monofilaments contaminated with a human-derived prion strain. J Gen Virol, 88, 2905-14.
LEMMER, K., MIELKE, M., PAULI, G. & BEEKES, M. (2004) Decontamination of surgical instruments from prion proteins: in vitro studies on the detachment, destabilization and degradation of PrPSc bound to steel surfaces. J Gen Virol, 85, 3805-16.
LEQUETTE, Y., BOELS, G., CLARISSE, M. & FAILLE, C. (2010) Using enzymes to remove biofilms of bacterial isolates sampled in the food-industry. Biofouling, 26, 421-31.
LESLIE, T., AITKEN, D. A., BARRIE, T. & KIRKNESS, C. M. (2003) Residual debris as a potential cause of postphacoemulsification endophthalmitis. Eye, 17, 506-12.
LEWIS, D. L. & ARENS, M. (1995) Resistance of microorganisms to disinfection in dental and medical devices. Nat Med, 1, 956-8.
LEWIS, D. L., ARENS, M., APPLETON, S. S., NAKASHIMA, K., RYU, J., BOE, R. K., PATRICK, J. B., WATANABE, D. T. & SUZUKI, M. (1992) Cross-contamination potential with dental equipment. Lancet, 340, 1252-4.
LEWIS, D. L. & BOE, R. K. (1992) Cross-infection risks associated with current procedures for using high-speed dental handpieces. J Clin Microbiol, 30, 401-6.
LIPSCOMB, I. P., PINCHIN, H., COLLIN, R. & KEEVIL, C. W. (2007) Effect of drying time, ambient temperature and pre-soaks on prion-infected tissue contamination levels on surgical stainless steel: concerns over
271
prolonged transportation of instruments from theatre to central sterile service departments. J Hosp Infect, 65, 72-7.
LIPSCOMB, I. P., PINCHIN, H. E., COLLIN, R., HARRIS, K. & KEEVIL, C. W. (2006a) The sensitivity of approved Ninhydrin and Biuret tests in the assessment of protein contamination on surgical steel as an aid to prevent iatrogenic prion transmission. J Hosp Infect, 64, 288-92.
LIPSCOMB, I. P., SIHOTA, A. K., BOTHAM, M., HARRIS, K. L. & KEEVIL, C. W. (2006b) Rapid method for the sensitive detection of protein contamination on surgical instruments. J Hosp Infect, 62, 141-8.
LIPSCOMB, I. P., SIHOTA, A. K. & KEEVIL, C. W. (2006c) Comparative study of surgical instruments from sterile-service departments for presence of residual gram-negative endotoxin and proteinaceous deposits. J Clin Microbiol, 44, 3728-33.
LIPSCOMB, I. P., SIHOTA, A. K. & KEEVIL, C. W. (2008) Comparison between visual analysis and microscope assessment of surgical instrument cleanliness from sterile service departments. J Hosp Infect, 68, 52-8.
LIU, B., OFFNER, G. D., NUNES, D. P., OPPENHEIM, F. G. & TROXLER, R. F. (1998) MUC4 is a major component of salivary mucin MG1 secreted by the human submandibular gland. Biochem Biophys Res Commun, 250, 757-61.
LLEWELYN, C. A., HEWITT, P. E., KNIGHT, R. S., AMAR, K., COUSENS, S., MACKENZIE, J. & WILL, R. G. (2004) Possible transmission of variant Creutzfeldt-Jakob disease by blood transfusion. Lancet, 363, 417-21.
LOPEZ, M. F., BERGGREN, K., CHERNOKALSKAYA, E., LAZAREV, A., ROBINSON, M. & PATTON, W. F. (2000) A comparison of silver stain and SYPRO Ruby Protein Gel Stain with respect to protein detection in two-dimensional gels and identification by peptide mass profiling. Electrophoresis, 21, 3673-83.
LOWE, A. H., BAGG, J., BURKE, F. J., MACKENZIE, D. & MCHUGH, S. (2002) A study of blood contamination of Siqveland matrix bands. Br Dent J, 192, 43-5.
LUHR, K. M., LOW, P., TARABOULOS, A., BERGMAN, T. & KRISTENSSON, K. (2009) Prion adsorption to stainless steel is promoted by nickel and molybdenum. J Gen Virol, 90, 2821-8.
MAH, T. F. & O'TOOLE, G. A. (2001) Mechanisms of biofilm resistance to antimicrobial agents. Trends Microbiol, 9, 34-9.
MARCHANT, S., BRAILSFORD, S. R., TWOMEY, A. C., ROBERTS, G. J. & BEIGHTON, D. (2001) The predominant microflora of nursing caries lesions. Caries Res, 35, 397-406.
MARCHESI, J. R., SATO, T., WEIGHTMAN, A. J., MARTIN, T. A., FRY, J. C., HIOM, S. J., DYMOCK, D. & WADE, W. G. (1998) Design and evaluation of useful bacterium-specific PCR primers that amplify genes coding for bacterial 16S rRNA. Appl Environ Microbiol, 64, 795-9.
MARSH, P. D. (1994) Microbial ecology of dental plaque and its significance in health and disease. Adv Dent Res, 8, 263-71.

272
MARTIN, A. R., BAEYENS, M., HUB, W., MERTENS, P. W. & KOLBESEN, B. O. (1999) Cleaning of Silicone Wafers: Additives for the Prevention of Metal Contamination,. Microelectronic Eng., 45, 197-208.
MARTINY, H. & SIMONIS, A. (2009) Reprocessing of dental instruments and angle handpieces. WFHSS 2009 Oral presentation
MATSUYAMA, M., USAMI, T., MASUDA, K., NIIMI, N., OHTA, M. & UEDA, M. (1997) Prevention of infection in dental procedures. J Hosp Infect, 35, 17-25.
MCDOWELL, A., VALANNE, S., RAMAGE, G., TUNNEY, M. M., GLENN, J. V., MCLORINAN, G. C., BHATIA, A., MAISONNEUVE, J. F., LODES, M., PERSING, D. H. & PATRICK, S. (2005) Propionibacterium acnes types I and II represent phylogenetically distinct groups. J Clin Microbiol, 43, 326-34.
MEYER, H. (1957) The ninhydrin reaction and its analytical applications. Biochem J, 67, 333-40.
MICHELS, W. (2008) Test Soils and Test Methods. Prozesskontrolle Forum, 23-25.
MILLER, W. D. (1891) The Disinfection of Dental and Surgical Instruments. Dental Cosmos, 33, 514-526.
MILTON, J. D. & MULLEN, P. J. (1992) The effect of reducing and non-reducing sugars on the bicinchoninic acid reaction for protein determination. Clin Chim Acta, 208, 141-3.
MONTEBUGNOLI, L., CHERSONI, S., PRATI, C. & DOLCI, G. (2004) A between-patient disinfection method to control water line contamination and biofilm inside dental units. J. Hosp. Infect, 56, 297-304.
MOUHYI, J., SENNERBY, L., PIREAUX, J. J., DOUROV, N., NAMMOUR, S. & VAN RECK, J. (1998) An XPS and SEM evaluation of six chemical and physical techniques for cleaning of contaminated titanium implants. Clin Oral Implants Res, 9, 185-94.
MOULD, D. L., DAWSON, A. M. & SMITH, W. (1965) Scrapie in Mice. The Stability of the Agent to Various Suspending Media, Ph and Solvent Extraction. Res Vet Sci, 6, 151-4.
MURDOCH, H., TAYLOR, D., DICKINSON, J., WALKER, J. T., PERRETT, D., RAVEN, N. D. & SUTTON, J. M. (2006) Surface decontamination of surgical instruments: an ongoing dilemma. J Hosp Infect, 63, 432-8.
NAKATA, S., FUSHIMI, R., HANAMURA, R., NOGUCHI, S., UMESHITA, K., TAKASHINA, M. & KAWAMOTO, T. (2007) Interference of Blood with the Disinfectant Process Before Washing. Zentralsterilisation, 15, 438-448.
NARHI, T. O., TENOVUO, J., AINAMO, A. & VILJA, P. (1994) Antimicrobial factors, sialic acid, and protein concentration in whole saliva of the elderly. Scand J Dent Res, 102, 120-5.
NHS SCOTLAND (2001) NHS Scotland. Sterile Services Provision Review Group: first report - The Glennie Framework. Edinburgh: .

273
NIAZI, S. A., CLARKE, D., DO, T., GILBERT, S. C., MANNOCCI, F. & BEIGHTON, D. (2010) Propionibacterium acnes and Staphylococcus epidermidis isolated from refractory endodontic lesions are opportunistic pathogens. J Clin Microbiol, 48, 3859-69.
NOBLE, R. C. & OVERMAN, S. B. (1994) Pseudomonas stutzeri infection. A review of hospital isolates and a review of the literature. Diagn Microbiol Infect Dis, 19, 51-6.
NORDE, W. (1986) Adsorption of proteins from solution at the solid-liquid interface. Adv Colloid Interface Sci, 25, 267-340.
NORDE, W. & FAVIER, J. P. (1995) Structures and Stabilities of Adsorbed Proteins. J. Colloid. Interface. Sci, 169, 313-328.
NORDE, W., MACRITCHIE, F., NOWICKA, G. & LYKLEMA, J. (1986) Protein adsorption at solid-liquid interfaces: Reversibility and conformation aspects. J. Colloid Interface Sci, 112, 447-456.
NUYTS, R. M., VAN BOEKEL, M., BLOEMENDAL, H. & HIDDEMA, F. (1999) Detection of lens proteins in phaco tips after phacoemulsification. J Cataract Refract Surg, 25, 1510-4.
OZAWA, T., NAKANO, M. & ARAI, T. (2010) In vitro study of anti-suck-back ability by themselves on new high-speed air turbine handpieces. Dent Mater J, 29, 649-54.
PARKER, H. H. T. & JOHNSON, R. B. (1995) Effectiveness of ethylene oxide for sterilization of dental handpieces. J Dent, 23, 113-5.
PASTER, B. J., BOCHES, S. K., GALVIN, J. L., ERICSON, R. E., LAU, C. N., LEVANOS, V. A., SAHASRABUDHE, A. & DEWHIRST, F. E. (2001) Bacterial diversity in human subgingival plaque. J Bacteriol, 183, 3770-83.
PHILLIPS, C. R. & KAYE, S. (1949) The sterilizing action of gaseous ethylene oxide; a review. Am J Hyg, 50, 270-9.
PIERCE BIOTECHNOLOGY (2009) BCA protein assay reagent.
PIROTH, L., QUE, Y. A., WIDMER, E., PANCHAUD, A., PIU, S., ENTENZA, J. M. & MOREILLON, P. (2008) The fibrinogen- and fibronectin-binding domains of Staphylococcus aureus fibronectin-binding protein A synergistically promote endothelial invasion and experimental endocarditis. Infect Immun, 76, 3824-31.
PLINSTON, C., FERNIE, K., PRIOR, F. G. & SMITH, R. (2007) Electro-elution, a novel method to remove transmissible spongiform encephalopathy-associated PrPSc from stainless steel surgical instruments. J Hosp Infect, 66, 52-8.
POLONIO, R. E., MERMEL, L. A., PAQUETTE, G. E. & SPERRY, J. F. (2001) Eradication of biofilm-forming Staphylococcus epidermidis (RP62A) by a combination of sodium salicylate and vancomycin. Antimicrob Agents Chemother, 45, 3262-6.
PONG, A. S., DYSON, J. E. & DARVELL, B. W. (2005) Discharge of lubricant from air turbine handpieces. Br Dent J, 198, 637-40; discussion 627; quiz 648.

274
PRATT, L. H., SMITH, D. G., THORNTON, R. H., SIMMONS, J. B., DEPTA, B. B. & JOHNSON, R. B. (1999) The effectiveness of two sterlization methods when different precleaning tehniques are employed. J Dent, 27, 247-248.
PRIOR, F., FERNIE, K., RENFREW, A. & HENEAGHAN, G. (2004) Alcoholic fixation of blood to surgical instruments-a possible factor in the surgical transmission of CJD? J Hosp Infect, 58, 78-80.
QIN, Z., OU, Y., YANG, L., ZHU, Y., TOLKER-NIELSEN, T., MOLIN, S. & QU, D. (2007) Role of autolysin-mediated DNA release in biofilm formation of Staphylococcus epidermidis. Microbiology, 153, 2083-92.
RABILLOUD, T. (1992) A comparison between low background silver diammine and silver nitrate protein stains. Electrophoresis, 13, 429-39.
RAMAGE, G., TUNNEY, M. M., PATRICK, S., GORMAN, S. P. & NIXON, J. R. (2003) Formation of Propionibacterium acnes biofilms on orthopaedic biomaterials and their susceptibility to antimicrobials. Biomaterials, 24, 3221-7.
RAMASUBBU, N., PALOTH, V., LUO, Y., BRAYER, G. D. & LEVINE, M. J. (1996) Structure of human salivary alpha-amylase at 1.6 A resolution: implications for its role in the oral cavity. Acta Crystallogr D Biol Crystallogr, 52, 435-46.
RANSJO, U., ENGSTROM, L., HAKANSSON, P., LEDEL, T., LINDGREN, L., LINDQVIST, A. L., MARCUSSON, E. & RUDBACK, K. (2001) A test for cleaning and disinfection processes in a washer-disinfector. APMIS, 109, 299-304.
RAUTEMAA, R., NORDBERG, A., WUOLIJOKI-SAARISTO, K. & MEURMAN, J. H. (2006) Bacterial aerosols in dental practice - a potential hospital infection problem? J Hosp Infect, 64, 76-81.
RAYMENT, S. A., LIU, B., OFFNER, G. D., OPPENHEIM, F. G. & TROXLER, R. F. (2000) Immunoquantification of human salivary mucins MG1 and MG2 in stimulated whole saliva: factors influencing mucin levels. J Dent Res, 79, 1765-72.
REINTHALER, F. F., MASCHER, F. & STUNZNER, D. (1988) Serological examinations for antibodies against Legionella species in dental personnel. J Dent Res, 67, 942-3.
REN, Y., STROBEL, G., SEARS, J. & PARK, M. (2010) Geobacillus sp., a thermophilic soil bacterium producing volatile antibiotics. Microb Ecol, 60, 130-6.
RICHARDSON, P., JONES, A., BAXTER, R. L., BAXTER, H. C., WHITTAKER, G. & CAMPBELL, G. A. (2004) Towards fluorescence detection of protein residues on surgical instruments. . Proc SPIE, 5502, 291-294.
RING, M. E. (1985) Dentistry: An Illustrated History, New York, Harry N. Abrams, Inc.
ROACH, P., FARRAR, D. & PERRY, C. C. (2005) Interpretation of protein adsorption: surface-induced conformational changes. J Am Chem Soc, 127, 8168-73.

275
ROBINSON, R. W., AKIN, D. E., NORDSTEDT, R. A., THOMAS, M. V. & ALDRICH, H. C. (1984) Light and electron microscopic examinations of methane-producing biofilms from anaerobic fixed-bed reactors. Appl Environ Microbiol, 48, 127-36.
ROHDE, H., FRANKENBERGER, S., ZAHRINGER, U. & MACK, D. (2010) Structure, function and contribution of polysaccharide intercellular adhesin (PIA) to Staphylococcus epidermidis biofilm formation and pathogenesis of biomaterial-associated infections. Eur J Cell Biol, 89, 103-11.
ROMERO, I. C., MEHAFFY, C., BURCHMORE, R. J., DOBOS-ELDER, K., BRENNAN, P. & WALKER, J. (2010) Identification of promoter-binding proteins of the fbp A and C genes in Mycobacterium tuberculosis. Tuberculosis (Edinb), 90, 25-30.
ROSE, H. D. & MATHAI, G. (1977) Acute Pasteurella multocida pneumonia. Br J Dis Chest, 71, 123-6.
ROTH, M. (1971) Fluorescence reaction for amino acids. Anal Chem, 43, 880-2.
SAGI, H. C., DIPASQUALE, T., SANDERS, R. & HERSCOVICI, D. (2002) Compressed-air power tools in orthopaedic surgery: exhaust air is a potential source of contamination. J Orthop Trauma, 16, 696-700.
SAGRIPANTI, J. L. & BONIFACINO, A. (2000) Cytotoxicity of liquid disinfectants. Surg Infect (Larchmt), 1, 3-14.
SAKIYAMA, T., TOMURA, J., IMAMURA, K. & NAKANISHI, K. (2004) Adsorption characteristics of bovine serum albumin and its peptide fragments on a stainless steel surface. Colloids and Surfaces B: Biointerfaces, 33, 77-84.
SAMBROOK. J & RUSSEL. W.D (2006) The Condensed Protocols From Molecular Cloning: A Laboratory Manual, New York, Cold Spring Harbor Labarotory Press, Cold Spring Harbor
SCHILLING, E. D., BURCHILL, P. I. & CLAYTON, R. A. (1963) Anomalous reactions of ninhydrin. Anal Biochem, 5, 1-6.
SCHLEE, M., STEIGMANN, M., BRATU, E. & GARG, A. K. (2006) Piezosurgery: basics and possibilities. Implant Dent, 15, 334-40.
SCOTT, A., DE, R., SADEK, S. A., GARRIDO, M. C. & COURTENEY-HARRIS, R. G. (2001) Temporal bone dissection: a possible route for prion transmission? J Laryngol Otol, 115, 374-5.
SECKER, T. J., HERVE, R. & KEEVIL, C. W. (2011) Adsorption of prion and tissue proteins to surgical stainless steel surfaces and the efficacy of decontamination following dry and wet storage conditions. J Hosp Infect.
SEHULSTER, L. M. (2004) Prion inactivation and medical instrument reprocessing: challenges facing healthcare facilities. Infect Control Hosp Epidemiol, 25, 276-9.

276
SILVERSTONE, S. E. & HILL, D. E. (1999) Evaluation of sterilization of dental handpieces by heating in synthetic compressor lubricant. Gen Dent, 47, 158-60.
SIMPSON, D. M. & BEYNON, R. J. (2009) Acetone precipitation of proteins and the modification of peptides. J Proteome Res, 9, 444-50.
SINGH, R., STINE, O. C., SMITH, D. L., SPITZNAGEL, J. K., JR., LABIB, M. E. & WILLIAMS, H. N. (2003) Microbial diversity of biofilms in dental unit water systems. Appl Environ Microbiol, 69, 3412-20.
SIVAKUMAR, T., HAND, A. R. & MEDNIEKS, M. (2009) Secretory proteins in the saliva of children. J Oral Sci, 51, 573-80.
SIVARAMAN, T., KUMAR, T. K., JAYARAMAN, G. & YU, C. (1997) The mechanism of 2,2,2-trichloroacetic acid-induced protein precipitation. J Protein Chem, 16, 291-7.
SMITH, A., DICKSON, M., AITKEN, J. & BAGG, J. (2002) Contaminated dental instruments. J Hosp Infect 51, 233-235.
SMITH, A., LETTERS, S., LANGE, A., PERRETT, D., MCHUGH, S. & BAGG, J. (2005) Residual protein levels on reprocessed dental instruments. J Hosp Infect, 61, 237-41.
SMITH, G. W., SMITH, A. J., CREANOR, S., HURRELL, D., BAGG, J. & LAPPIN, D. F. (2009) Survey of the decontamination and maintenance of dental handpieces in general dental practice. Br Dent J, 207, E7; discussion 160-1.
SMITH, P. K., KROHN, R. I., HERMANSON, G. T., MALLIA, A. K., GARTNER, F. H., PROVENZANO, M. D., FUJIMOTO, E. K., GOEKE, N. M., OLSON, B. J. & KLENK, D. C. (1985) Measurement of protein using bicinchoninic acid. Anal Biochem, 150, 76-85.
SMULDERS, E., VON RYBINSKI, W., SUNG, E., RÄHSE, W., STEBER, J., WIEBEL, F. & NORDSKOG, A. (2007) Laundry Detergents. Ullmann's Encyclopedia of Industrial Chemistry.
SOLOMON, L. K., RASHID, A. & KHAN, K. (2006) Facial herpes simplex infection from possible cross contamination through the laser hand-piece following cutaneous laser resurfacing. J Plast Reconstr Aesthet Surg, 59, 309-11.
STARCHER, B. (2001) A ninhydrin-based assay to quantitate the total protein content of tissue samples. Anal Biochem, 292, 125-9.
STEWART, P. S., RAYNER, J., ROE, F. & REES, W. M. (2001) Biofilm penetration and disinfection efficacy of alkaline hypochlorite and chlorosulfamates. J Appl Microbiol, 91, 525-32.
SUGIO, S., KASHIMA, A., MOCHIZUKI, S., NODA, M. & KOBAYASHI, K. (1999) Crystal structure of human serum albumin at 2.5 A resolution. Protein Eng, 12, 439-46.
SURYAPRAKASH, P. & PRAKASH, V. (2000) Unfolding of multimeric proteins in presence of denaturants. A case study of helianthinin from Helianthus annuus L. Nahrung, 44, 178-83.
TAYLOR, D. M. & MCCONNELL, I. (1988) Autoclaving does not decontaminate formol-fixed scrapie tissues. Lancet, 1, 1463-4.

277
TEGOILIA, V. & COOPER, S. L. (2002) Staphylococcus aureus adhesion to self-assembled monolayers: effect of surface chemistry and fibrinogen presence. Colloid Surf. B: Biointerfaces, 24, 217 - 228.
TSAI, I. Y., TOMCZYK, N., ECKMANN, J. I., COMPOSTO, R. J. & ECKMANN, D. M. (2011) Human plasma protein adsorption onto dextranized surfaces: a two-dimensional electrophoresis and mass spectrometry study. Colloids Surf B Biointerfaces, 84, 241-52.
TUNNEY, M. M., PATRICK, S., GORMAN, S. P., NIXON, J. R., ANDERSON, N., DAVIS, R. I., HANNA, D. & RAMAGE, G. (1998) Improved detection of infection in hip replacements. A currently underestimated problem. J Bone Joint Surg Br, 80, 568-72.
UJEYL, A. K., WURBS, D., ADAM, W. & CLASSEN, M. (1978) Gas sterilization of fiber endoscopes. Endoscopy, 10, 71-4.
VALANNE, S., MCDOWELL, A., RAMAGE, G., TUNNEY, M. M., EINARSSON, G. G., O'HAGAN, S., WISDOM, G. B., FAIRLEY, D., BHATIA, A., MAISONNEUVE, J. F., LODES, M., PERSING, D. H. & PATRICK, S. (2005) CAMP factor homologues in Propionibacterium acnes: a new protein family differentially expressed by types I and II. Microbiology, 151, 1369-79.
VAN TASSEL, P. R., GUEMOURI, L., RAMSDEN, J. J., TARJUS, G., VIOT, P. & TALBOT, J. (1998) A Particle-Level Model of Irreversible Protein Adsorption with a Postadsorption Transition. J Colloid Interface Sci, 207, 317-323.
VANAGT, W. Y., DAENEN, W. J. & DELHAAS, T. (2004) Propionibacterium acnes endocarditis on an annuloplasty ring in an adolescent boy. Heart, 90, e56.
VARGAS, L. G., HOLZER, M. P., SOLOMON, K. D., SANDOVAL, H. P., AUFFARTH, G. U. & APPLE, D. J. (2004) Endothelial cell integrity after phacoemulsification with 2 different handpieces. J Cataract Refract Surg, 30, 478-82.
VASSEY, M., BUDGE, C., POOLMAN, T., JONES, P., PERRETT, D., NAYUNI, N., BENNETT, P., GROVES, P., SMITH, A., FULFORD, M., MARSH, P. D., WALKER, J. T., SUTTON, J. M. & RAVEN, N. D. (2011) A quantitative assessment of residual protein levels on dental instruments reprocessed by manual, ultrasonic and automated cleaning methods. Br Dent J, E14.
VERJAT, D., PROGNON, P. & DARBORD, J. C. (1999) Flourescence-assay on traces of protein on re-usable medical devices: cleaning efficiency. Int J Pharm, 179, 267-71.
VROUWENVELDER, J. S., BUITER, J., RIVIERE, M., VAN DER MEER, W. G., VAN LOOSDRECHT, M. C. & KRUITHOF, J. C. (2010) Impact of flow regime on pressure drop increase and biomass accumulation and morphology in membrane systems. Water Res, 44, 689-702.
WALKER, J. M. (1994) The bicinchoninic acid (BCA) assay for protein quantitation. Methods Mol Biol, 32, 5-8.
WALKER, J. T., ET AL (2000) Micorbial biofilm formation and contamination of dental-unit water systems in general dental practice

278
Appl Environ Microbiol, 66, 3363-3367.
WALKER, J. T., KINGSTON, R. & CHELL, K. (2010) Evaluation of washer disinfector for use in dental practices. IADR Barcelona 2010 Abstract and Poster Presentation.
WALLACH, D. F., GRAHAM, J. M. & OSEROFF, A. R. (1970) Application of laser Raman spectroscopy to the structural analysis of polypeptides in dilute aqueous solution. FEBS Lett, 7, 330-334.
WATSON, T. F., FLANAGAN, D. & STONE, D. G. (2000) High and low torque handpieces: cutting dynamics, enamel cracking and tooth temperature. Br Dent J, 188, 680-6.
WEBER, K. & KUTER, D. J. (1971) Reversible denaturation of enzymes by sodium dodecyl sulfate. J Biol Chem, 246, 4504-9.
WEBER, K. & OSBORN, M. (1969) The reliability of molecular weight determinations by dodecyl sulfate-polyacrylamide gel electrophoresis. J Biol Chem, 244, 4406-12.
WEIGHTMAN, N. C. & LINES, L. D. (2003) Problems with the decontamination of dental handpieces and other intra-oral dental equipment in hospitals. J Hosp Infect, 56, 1-5.
WHITEHOUSE, R. L., PETERS, E., LIZOTTE, J. & LILGE, C. (1991) Influence of biofilms on microbial contamination in dental unit water. J. Dent, 19, 290-295.
WILL, R. G., IRONSIDE, J. W., ZEIDLER, M., COUSENS, S. N., ESTIBEIRO, K., ALPEROVITCH, A., POSER, S., POCCHIARI, M., HOFMAN, A. & SMITH, P. G. (1996) A new variant of Creutzfeldt-Jakob disease in the UK. Lancet, 347, 921-5.
WILLIAMS, R. L., BROWN, S. A. & MERRITT, K. (1988) Electrochemical studies on the influence of proteins on the corrosion of implant alloys. Biomaterials, 9, 181-6.
WIRTHLIN, M. R., JR., SHKLAIR, I. L., NORTHERNER, R. A., SHELTON, S. W. & BAILEY, G. L. (1981) The performance of autoclaved high-speed dental handpieces. J Am Dent Assoc, 103, 584-7.
WOLF, R., BRENNER, S. & MESSER, G. (1991) Intact cells on the laser handpiece--a non-contact contamination. Acta Derm Venereol, 71, 347-8.
WOZNIAK, D. J., WYCKOFF, T. J., STARKEY, M., KEYSER, R., AZADI, P., O'TOOLE, G. A. & PARSEK, M. R. (2003) Alginate is not a significant component of the extracellular polysaccharide matrix of PA14 and PAO1 Pseudomonas aeruginosa biofilms. Proc Natl Acad Sci U S A, 100, 7907-12.
ZALUSKI, S., CLAYMAN, H. M., KARSENTI, G., BOURZEIX, S., TOURNEMIRE, A., FALIU, B., GULIAN, C. & GRIMONT, F. (1999) Pseudomonas aeruginosa endophthalmitis caused by contamination of the internal fluid pathways of a phacoemulsifier. J Cataract Refract Surg, 25, 540-5.
ZELLNER, M., WINKLER, W., HAYDEN, H., DIESTINGER, M., ELIASEN, M., GESSLBAUER, B., MILLER, I., CHANG, M., KUNGL, A., ROTH, E. & OEHLER, R. (2005) Quantitative validation of different protein

279
precipitation methods in proteome analysis of blood platelets. Electrophoresis, 26, 2481-9.
ZHU, D., SAUL, A., HUANG, S., MARTIN, L. B., MILLER, L. H. & RAUSCH, K. M. (2009) Use of o-phthalaldehyde assay to determine protein contents of Alhydrogel-based vaccines. Vaccine, 27, 6054-9.
ZOGAJ, X., NIMTZ, M., ROHDE, M., BOKRANZ, W. & ROMLING, U. (2001) The multicellular morphotypes of Salmonella typhimurium and Escherichia coli produce cellulose as the second component of the extracellular matrix. Mol Microbiol, 39, 1452-63.
ZUHLSDORF, B., EMMRICH, M., FLOSS, H. & MARTINY, H. (2002) Cleaning efficacy of nine different cleaners in a washer-disinfector designed for flexible endoscopes. J Hosp Infect, 52, 206-11.
ZUHLSDORF, B. & MARTINY, H. (2005) Intralaboratory reproducibility of the German test method of prEN ISO 15883-1 for determination of the cleaning efficacy of washer-disinfectors for flexible endoscopes. J Hosp Infect, 59, 286-91.