Embed Size (px)
Citation preview
Smart Grid, Smart City Distributed generation and storage trials
Robert Simpson, Ausgrid
26 November 2013
Smart Utilities Australia & New Zealand 2013
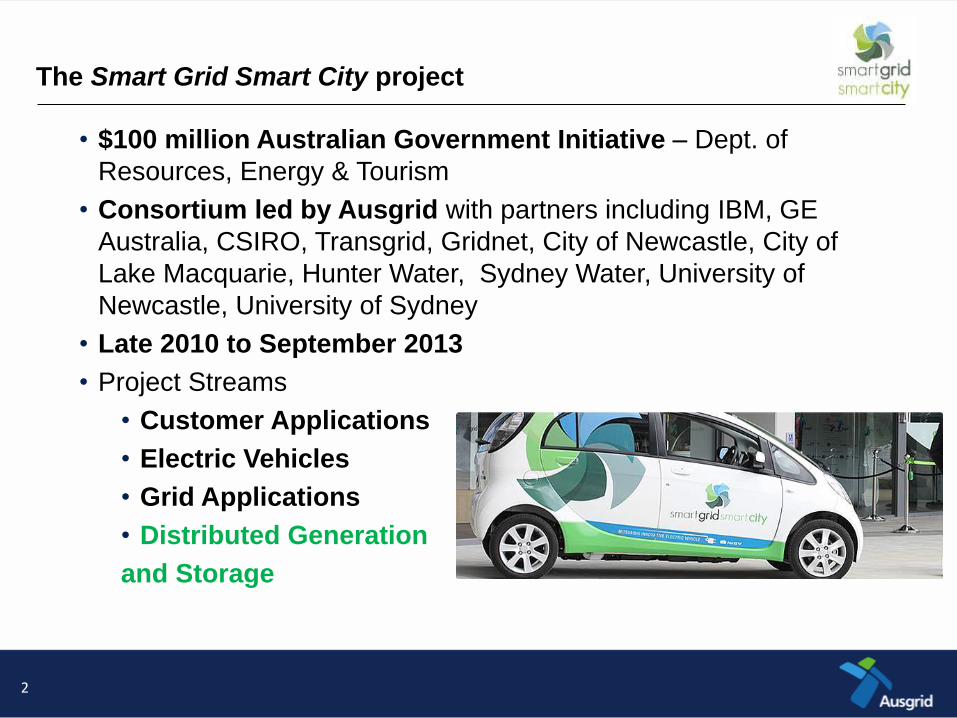
• $100 million Australian Government Initiative – Dept. of
Resources, Energy & Tourism
• Consortium led by Ausgrid with partners including IBM, GE
Australia, CSIRO, Transgrid, Gridnet, City of Newcastle, City of
Lake Macquarie, Hunter Water, Sydney Water, University of
Newcastle, University of Sydney
• Late 2010 to September 2013
• Project Streams
• Customer Applications
• Electric Vehicles
• Grid Applications
• Distributed Generation
and Storage
The Smart Grid Smart City project
2
• What is Distributed Generation and Distributed Storage?
• Trial objectives and overview
• Trial areas and technology overview
• Results from solar PV and wind trials
• Results from gas fuel cell trials
• Results from battery storage trials
• Lessons learnt
Overview
3
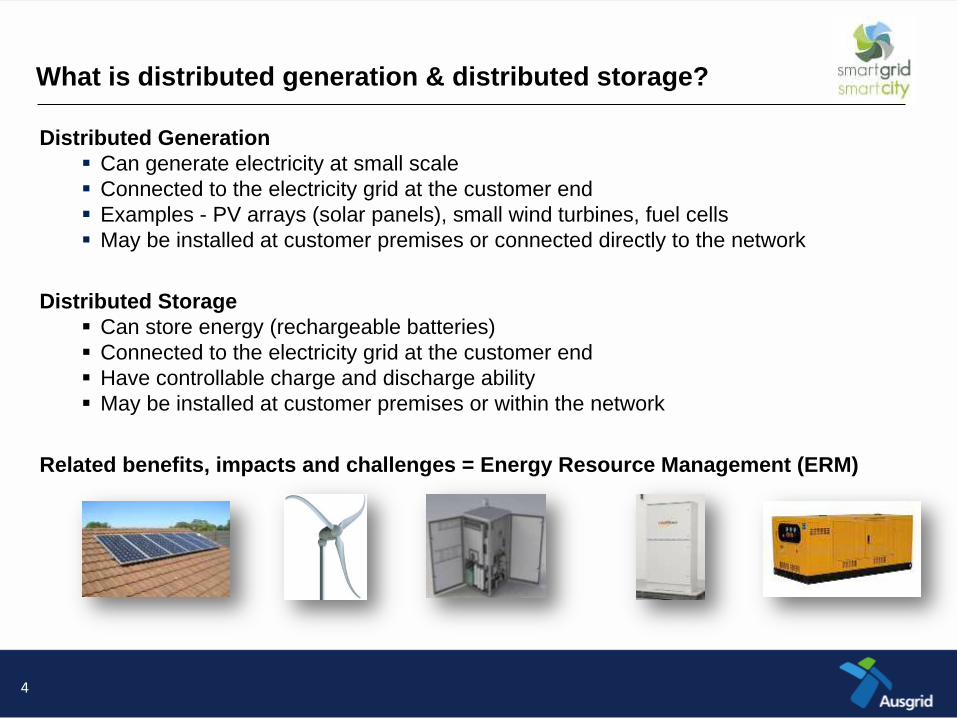
Distributed Generation
Can generate electricity at small scale
Connected to the electricity grid at the customer end
Examples - PV arrays (solar panels), small wind turbines, fuel cells
May be installed at customer premises or connected directly to the network
Distributed Storage
Can store energy (rechargeable batteries)
Connected to the electricity grid at the customer end
Have controllable charge and discharge ability
May be installed at customer premises or within the network
Related benefits, impacts and challenges = Energy Resource Management (ERM)
What is distributed generation & distributed storage?
4
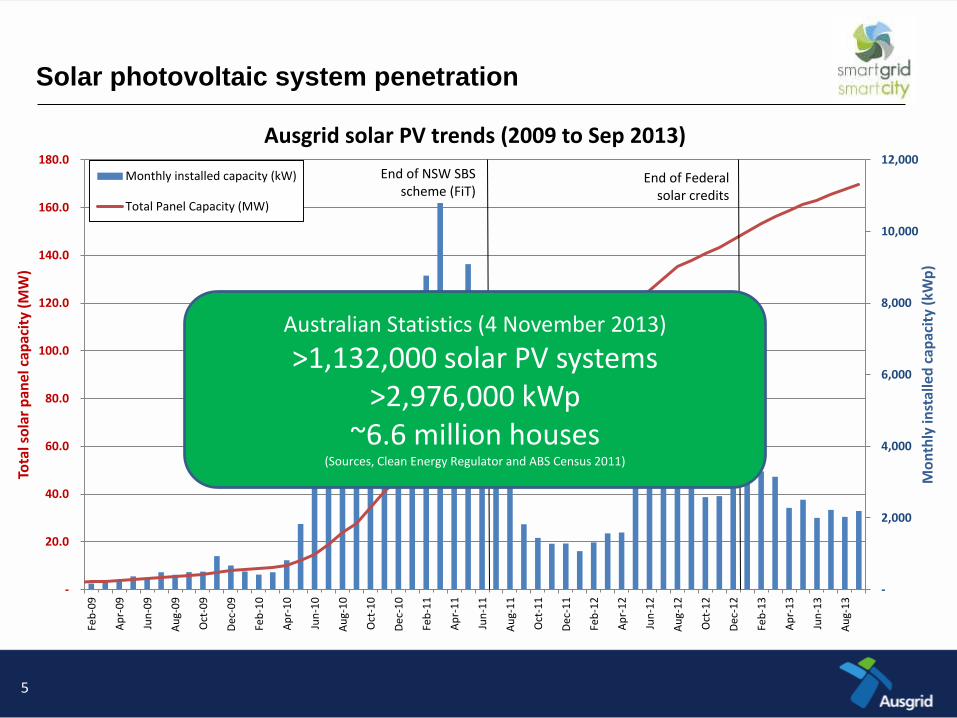
Solar photovoltaic system penetration
-
2,000
4,000
6,000
8,000
10,000
12,000
-
20.0
40.0
60.0
80.0
100.0
120.0
140.0
160.0
180.0
Feb
-09
Ap
r-0
9
Jun
-09
Au
g-0
9
Oct
-09
Dec
-09
Feb
-10
Ap
r-1
0
Jun
-10
Au
g-1
0
Oct
-10
Dec
-10
Feb
-11
Ap
r-1
1
Jun
-11
Au
g-1
1
Oct
-11
Dec
-11
Feb
-12
Ap
r-1
2
Jun
-12
Au
g-1
2
Oct
-12
Dec
-12
Feb
-13
Ap
r-1
3
Jun
-13
Au
g-1
3
Mo
nth
ly in
stal
led
cap
acit
y (k
Wp
)
Tota
l so
lar
pan
el c
apac
ity
(MW
)
Ausgrid solar PV trends (2009 to Sep 2013)
Monthly installed capacity (kW)
Total Panel Capacity (MW)
End of NSW SBS scheme (FiT)
End of Federal solar credits
Australian Statistics (4 November 2013)
>1,132,000 solar PV systems >2,976,000 kWp
~6.6 million houses (Sources, Clean Energy Regulator and ABS Census 2011)
5
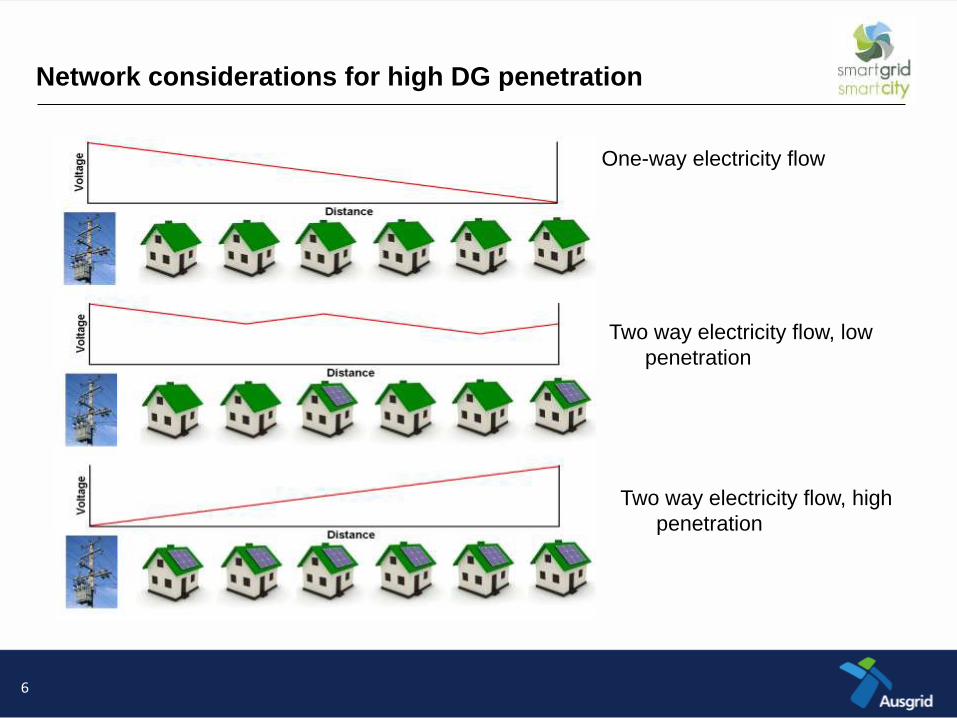
One-way electricity flow
Network considerations for high DG penetration
Two way electricity flow, low
penetration
Two way electricity flow, high
penetration
6
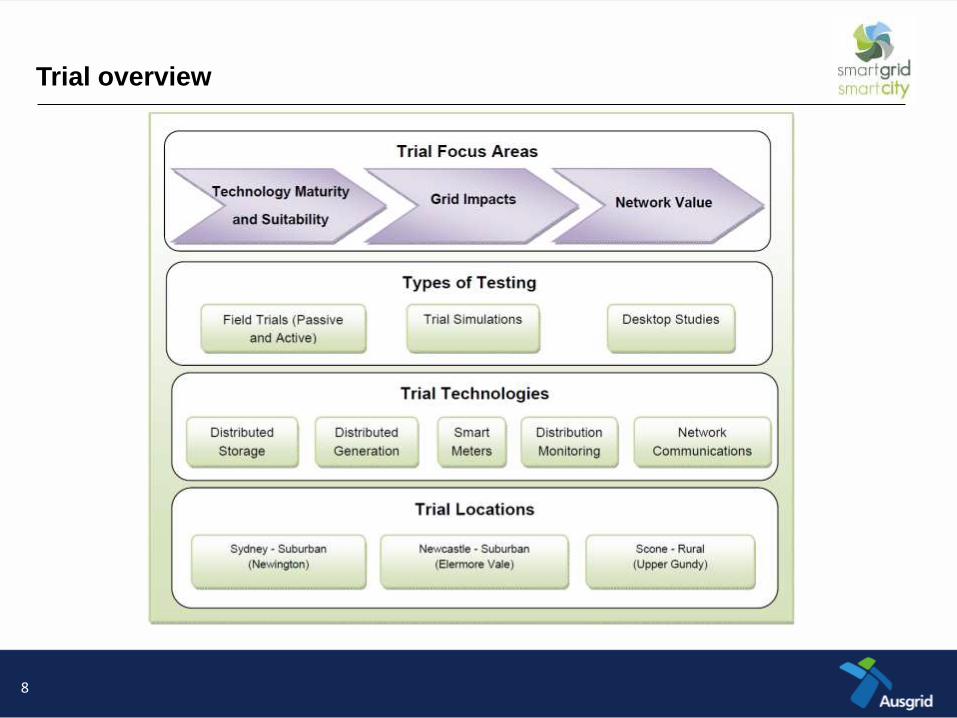
Trial overview
8
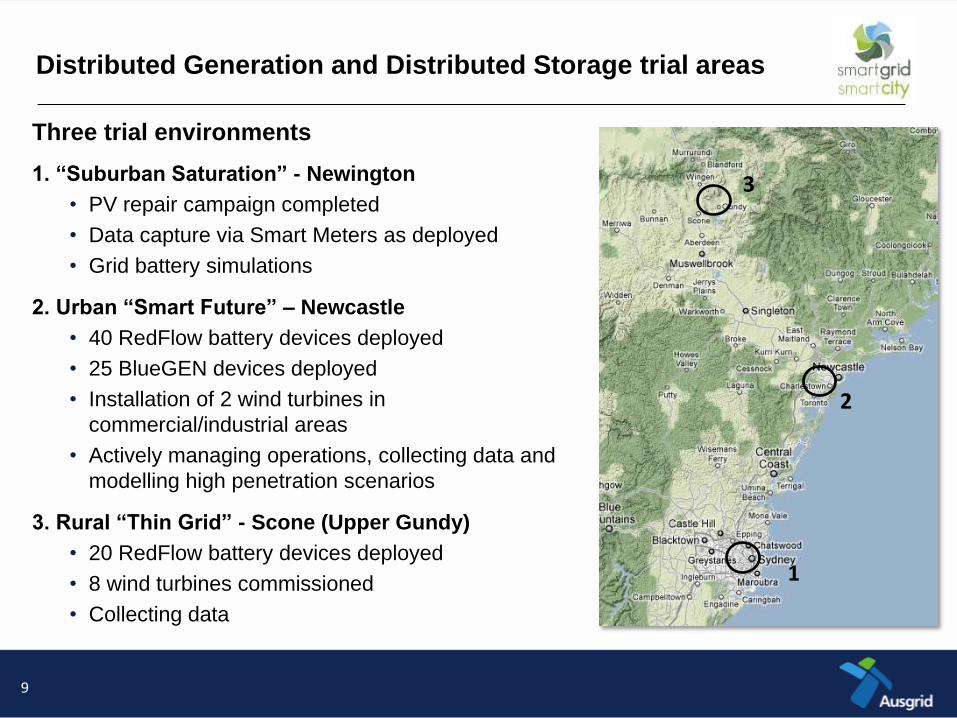
Three trial environments
1. “Suburban Saturation” - Newington
• PV repair campaign completed
• Data capture via Smart Meters as deployed
• Grid battery simulations
2. Urban “Smart Future” – Newcastle
• 40 RedFlow battery devices deployed
• 25 BlueGEN devices deployed
• Installation of 2 wind turbines in
commercial/industrial areas
• Actively managing operations, collecting data and
modelling high penetration scenarios
3. Rural “Thin Grid” - Scone (Upper Gundy)
• 20 RedFlow battery devices deployed
• 8 wind turbines commissioned
• Collecting data
Distributed Generation and Distributed Storage trial areas
9
1
2
3
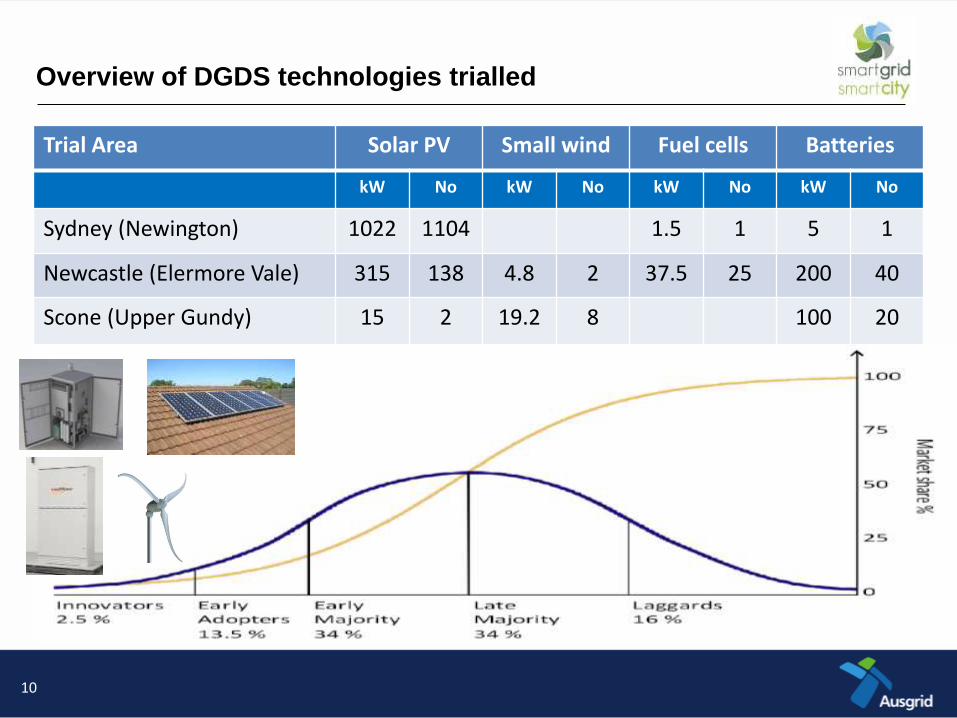
Overview of DGDS technologies trialled
Trial Area Solar PV Small wind Fuel cells Batteries
kW No kW No kW No kW No
Sydney (Newington) 1022 1104 1.5 1 5 1
Newcastle (Elermore Vale) 315 138 4.8 2 37.5 25 200 40
Scone (Upper Gundy) 15 2 19.2 8 100 20
10
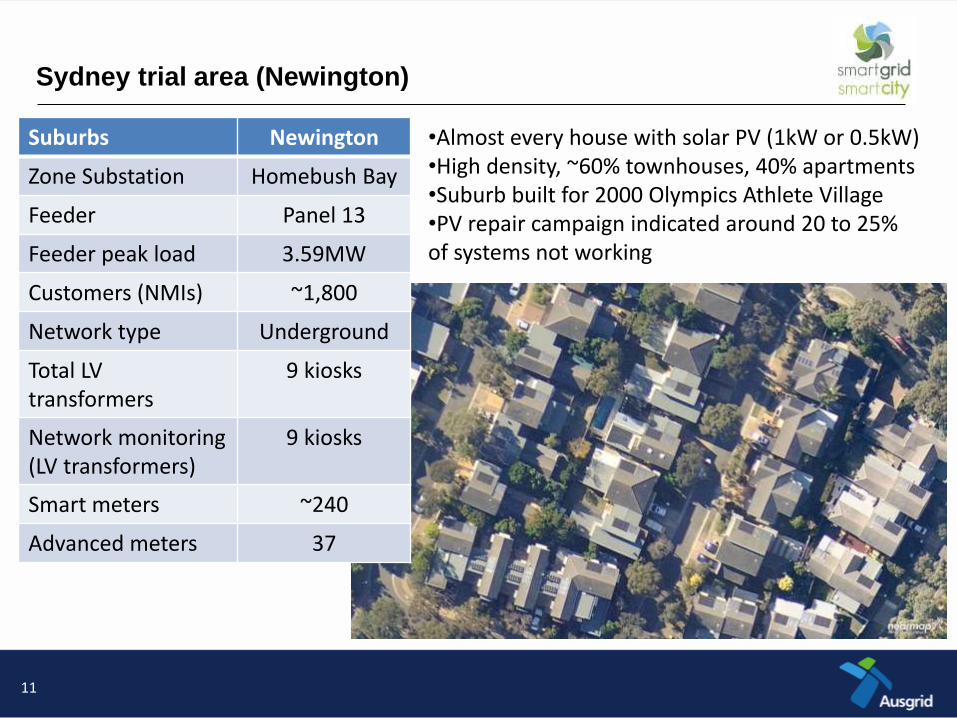
Sydney trial area (Newington)
Suburbs Newington
Zone Substation Homebush Bay
Feeder Panel 13
Feeder peak load 3.59MW
Customers (NMIs) ~1,800
Network type Underground
Total LV transformers
9 kiosks
Network monitoring (LV transformers)
9 kiosks
Smart meters ~240
Advanced meters 37
•Almost every house with solar PV (1kW or 0.5kW) •High density, ~60% townhouses, 40% apartments •Suburb built for 2000 Olympics Athlete Village •PV repair campaign indicated around 20 to 25% of systems not working
11
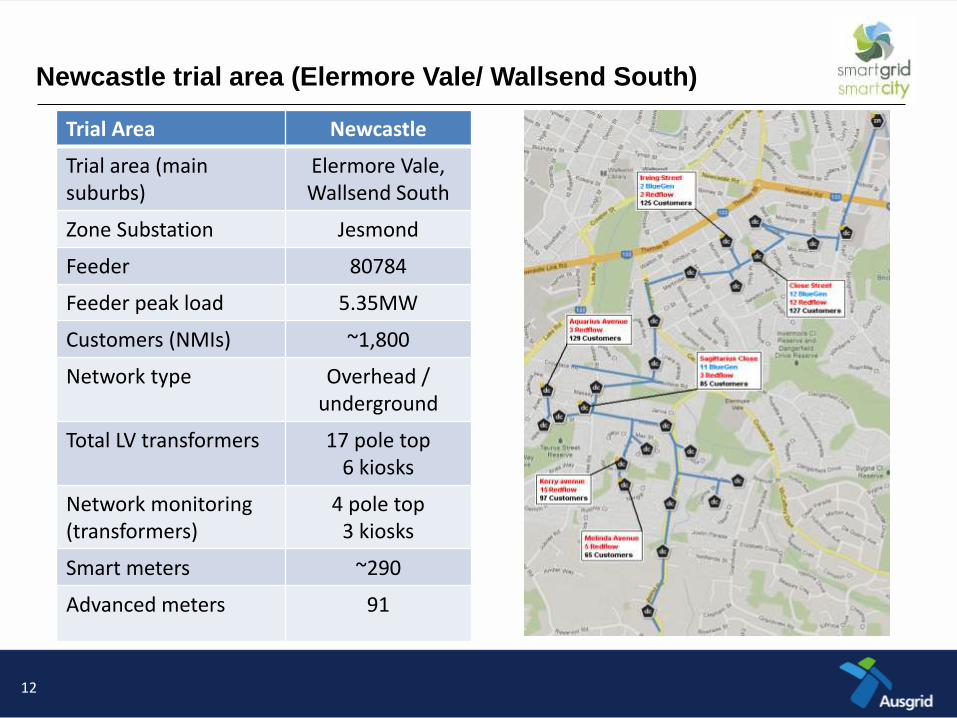
Newcastle trial area (Elermore Vale/ Wallsend South)
Trial Area Newcastle
Trial area (main suburbs)
Elermore Vale, Wallsend South
Zone Substation Jesmond
Feeder 80784
Feeder peak load 5.35MW
Customers (NMIs) ~1,800
Network type Overhead / underground
Total LV transformers 17 pole top 6 kiosks
Network monitoring (transformers)
4 pole top 3 kiosks
Smart meters ~290
Advanced meters 91
12
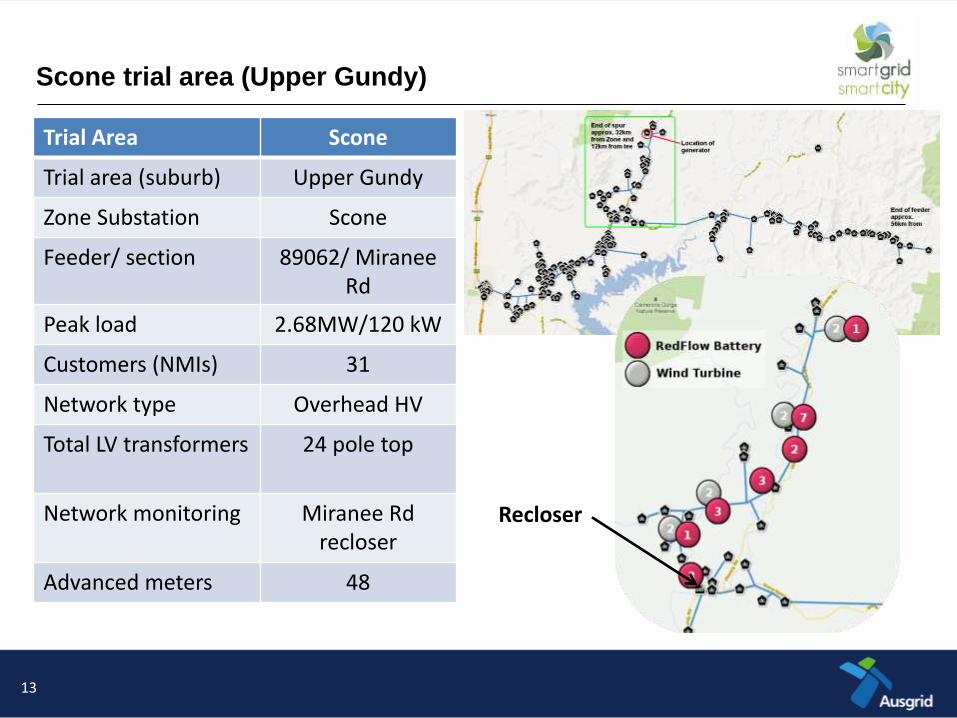
Scone trial area (Upper Gundy)
Trial Area Scone
Trial area (suburb) Upper Gundy
Zone Substation Scone
Feeder/ section 89062/ Miranee Rd
Peak load 2.68MW/120 kW
Customers (NMIs) 31
Network type Overhead HV
Total LV transformers 24 pole top
Network monitoring Miranee Rd recloser
Advanced meters 48
Recloser
13

Distributed Generation – Uncontrollable renewable sources
Solar Photovoltaics
Typically systems <10kW on residential roofs
Mature technology
Established installation and connection
policies and procedures
Small wind turbines
Very low penetration
More suitable for rural areas
10 x 2.4kW rated, tail-less small wind
turbines
14
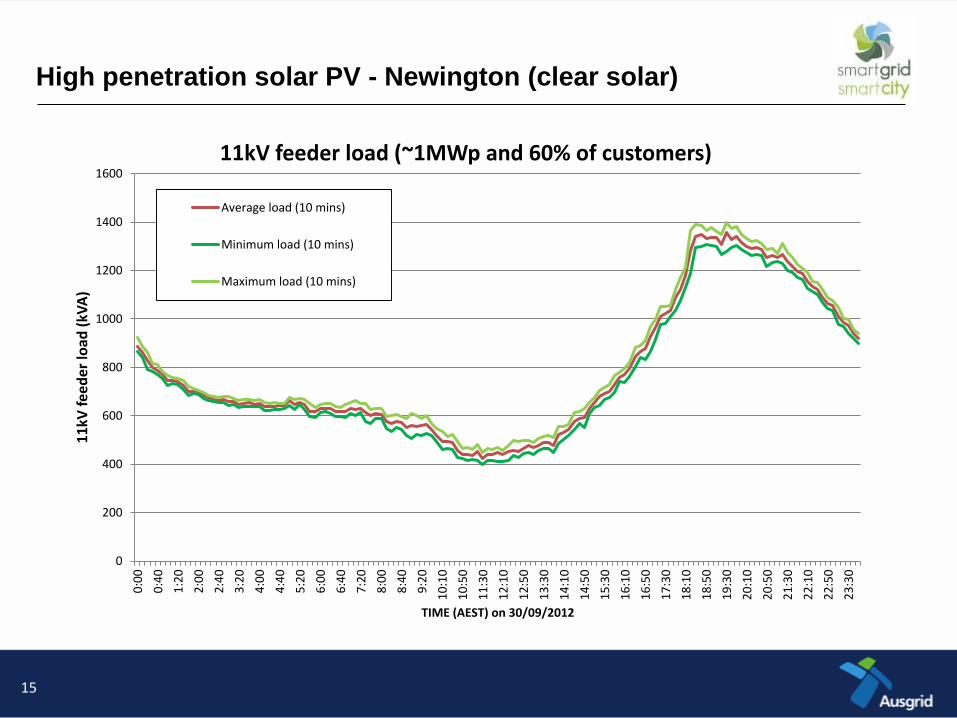
High penetration solar PV - Newington (clear solar)
0
200
400
600
800
1000
1200
1400
1600
0:0
0
0:4
0
1:2
0
2:0
0
2:4
0
3:2
0
4:0
0
4:4
0
5:2
0
6:0
0
6:4
0
7:2
0
8:0
0
8:4
0
9:2
0
10
:10
10
:50
11
:30
12
:10
12
:50
13
:30
14
:10
14
:50
15
:30
16
:10
16
:50
17
:30
18
:10
18
:50
19
:30
20
:10
20
:50
21
:30
22
:10
22
:50
23
:30
11
kV f
ee
de
r lo
ad (
kVA
)
TIME (AEST) on 30/09/2012
11kV feeder load (~1MWp and 60% of customers)
Average load (10 mins)
Minimum load (10 mins)
Maximum load (10 mins)
15
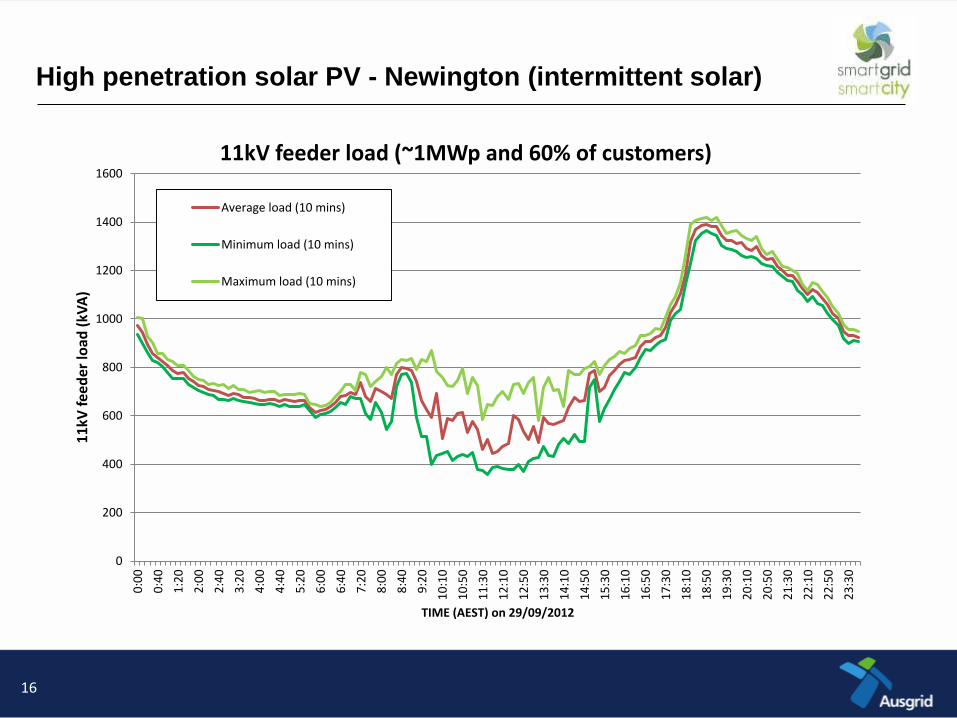
High penetration solar PV - Newington (intermittent solar)
0
200
400
600
800
1000
1200
1400
1600
0:0
0
0:4
0
1:2
0
2:0
0
2:4
0
3:2
0
4:0
0
4:4
0
5:2
0
6:0
0
6:4
0
7:2
0
8:0
0
8:4
0
9:2
0
10
:10
10
:50
11
:30
12
:10
12
:50
13
:30
14
:10
14
:50
15
:30
16
:10
16
:50
17
:30
18
:10
18
:50
19
:30
20
:10
20
:50
21
:30
22
:10
22
:50
23
:30
11
kV f
ee
de
r lo
ad (
kVA
)
TIME (AEST) on 29/09/2012
11kV feeder load (~1MWp and 60% of customers)
Average load (10 mins)
Minimum load (10 mins)
Maximum load (10 mins)
16
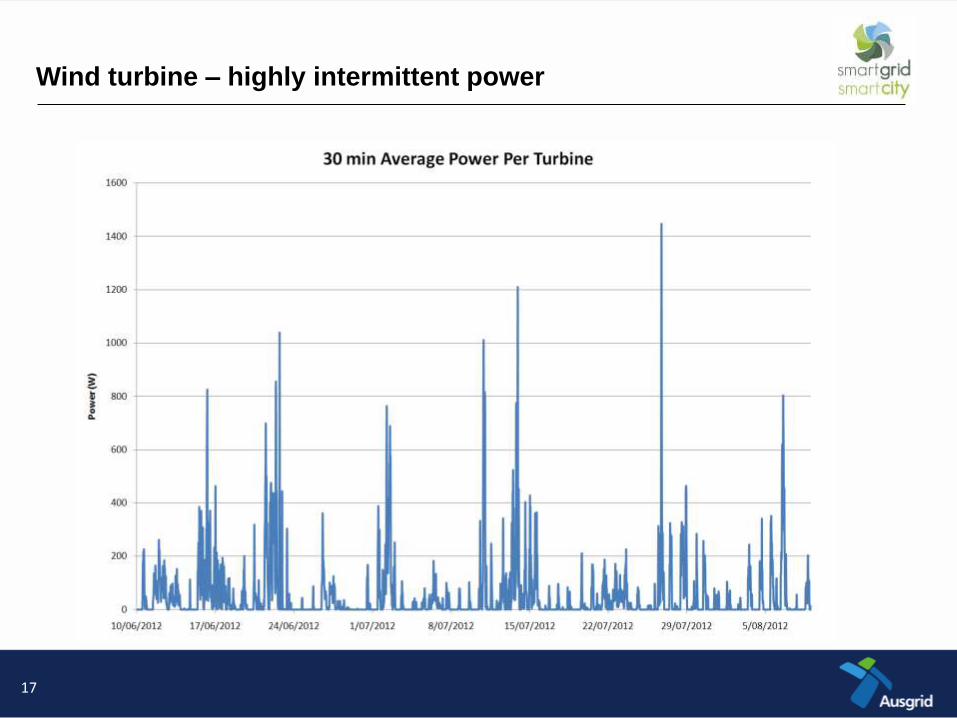
Wind turbine – highly intermittent power
17
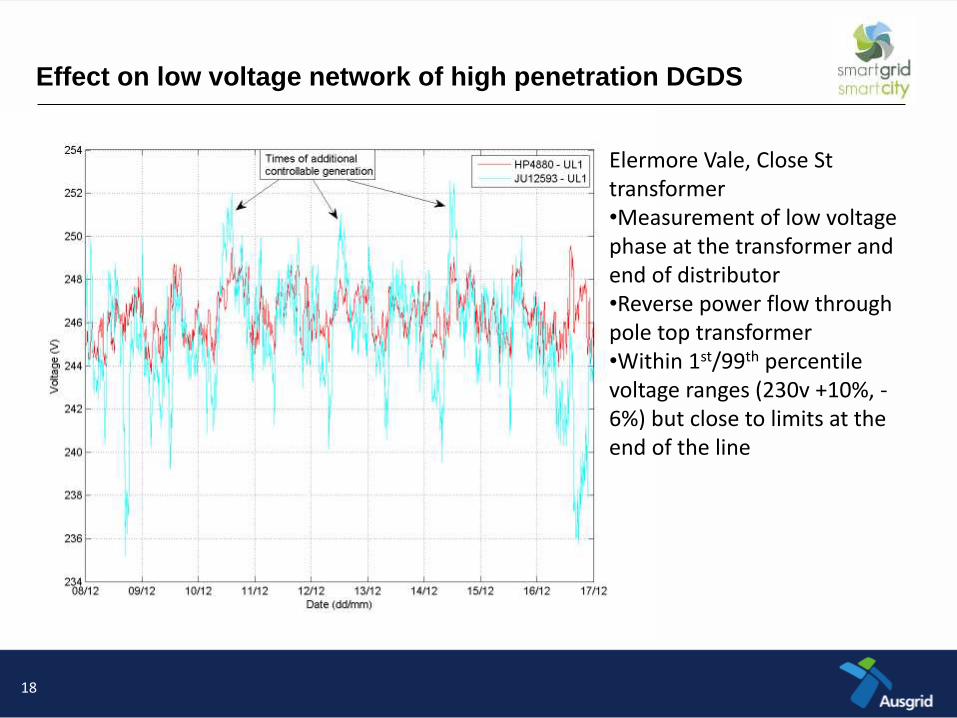
Effect on low voltage network of high penetration DGDS
Elermore Vale, Close St transformer •Measurement of low voltage phase at the transformer and end of distributor •Reverse power flow through pole top transformer •Within 1st/99th percentile voltage ranges (230v +10%, -6%) but close to limits at the end of the line
18
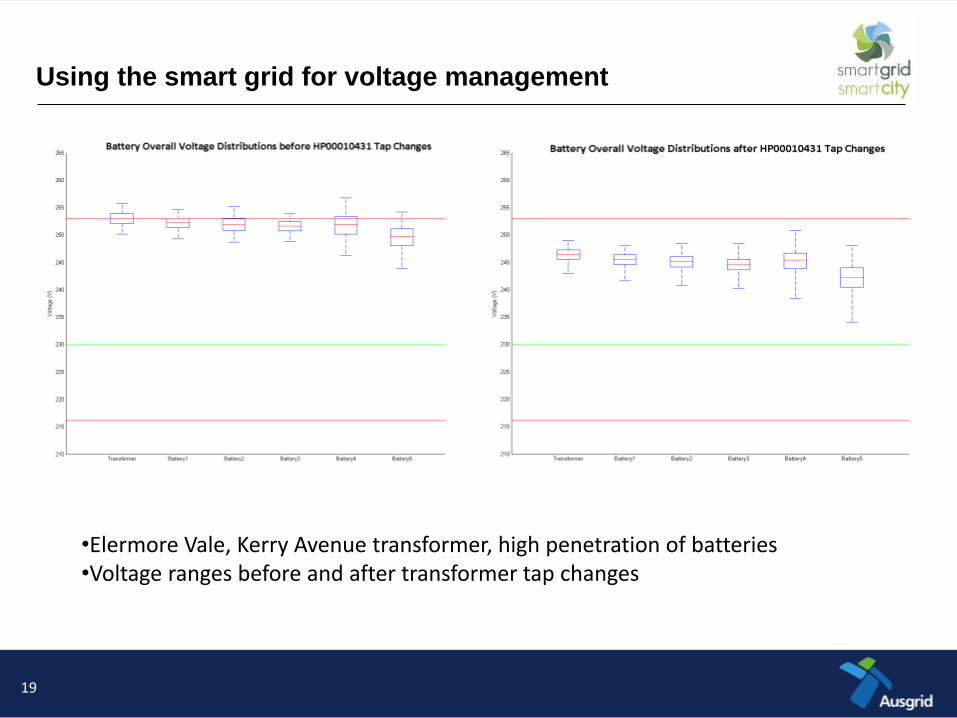
Using the smart grid for voltage management
•Elermore Vale, Kerry Avenue transformer, high penetration of batteries •Voltage ranges before and after transformer tap changes
19
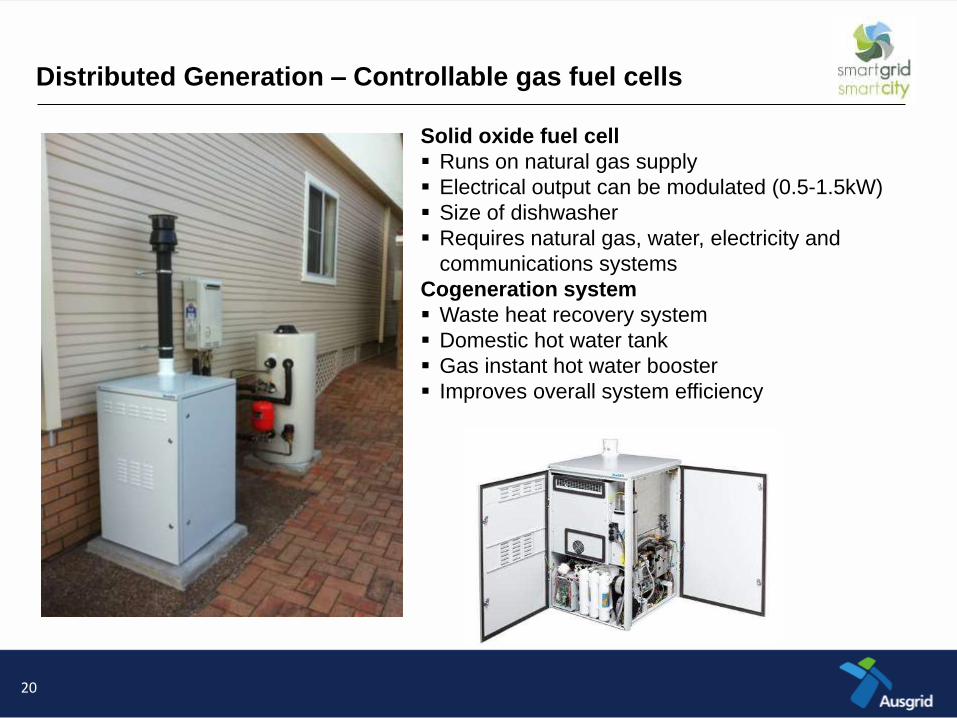
Distributed Generation – Controllable gas fuel cells
Solid oxide fuel cell
Runs on natural gas supply
Electrical output can be modulated (0.5-1.5kW)
Size of dishwasher
Requires natural gas, water, electricity and
communications systems
Cogeneration system
Waste heat recovery system
Domestic hot water tank
Gas instant hot water booster
Improves overall system efficiency
20
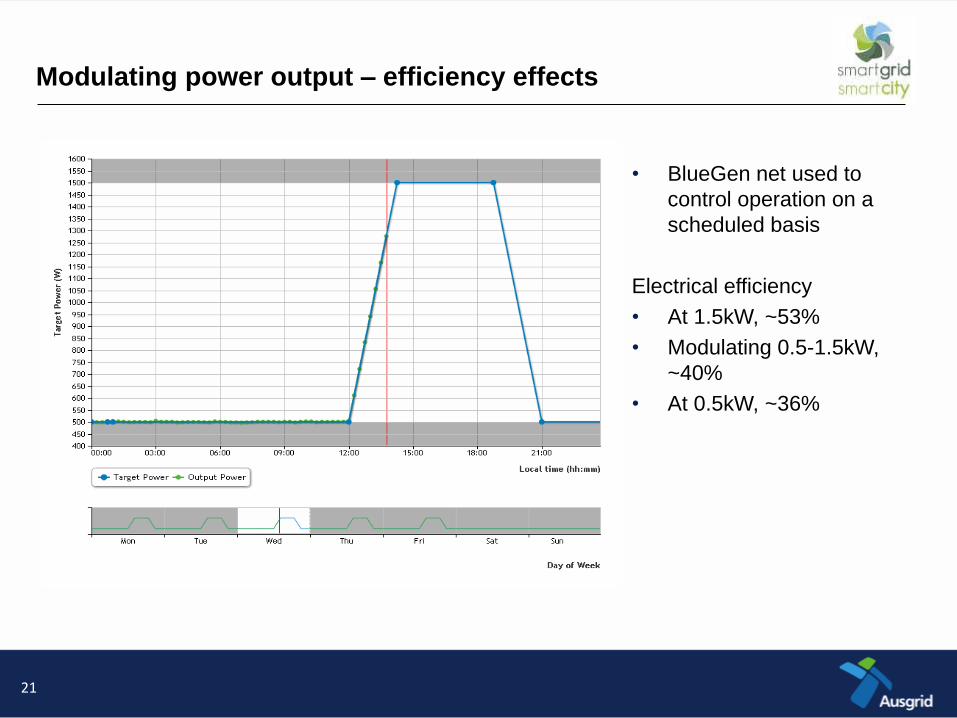
• BlueGen net used to
control operation on a
scheduled basis
Electrical efficiency
• At 1.5kW, ~53%
• Modulating 0.5-1.5kW,
~40%
• At 0.5kW, ~36%
Modulating power output – efficiency effects
21
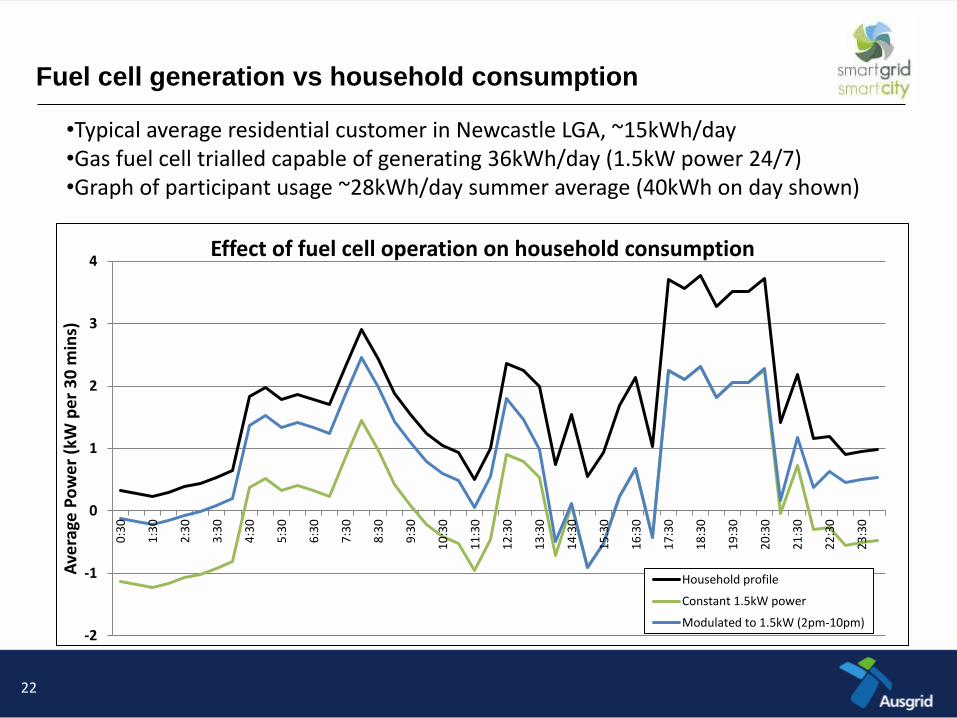
Fuel cell generation vs household consumption
-2
-1
0
1
2
3
4
0:3
0
1:3
0
2:3
0
3:3
0
4:3
0
5:3
0
6:3
0
7:3
0
8:3
0
9:3
0
10
:30
11
:30
12
:30
13
:30
14
:30
15
:30
16
:30
17
:30
18
:30
19
:30
20
:30
21
:30
22
:30
23
:30
Ave
rage
Po
we
r (k
W p
er
30
min
s)
Effect of fuel cell operation on household consumption
Household profile
Constant 1.5kW power
Modulated to 1.5kW (2pm-10pm)
•Typical average residential customer in Newcastle LGA, ~15kWh/day •Gas fuel cell trialled capable of generating 36kWh/day (1.5kW power 24/7) •Graph of participant usage ~28kWh/day summer average (40kWh on day shown)
22
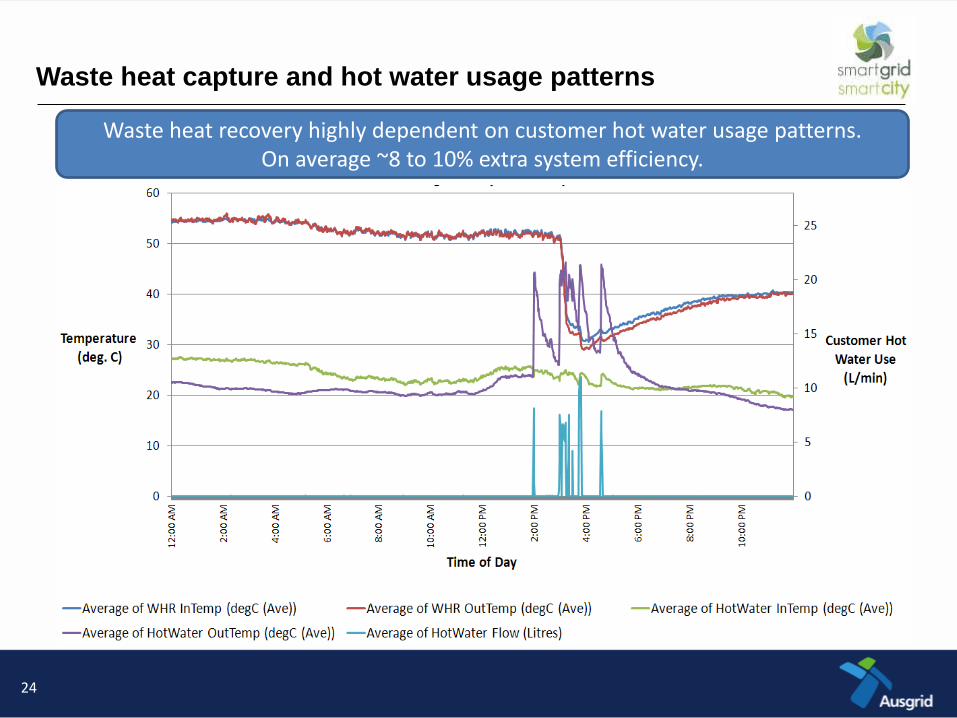
Waste heat capture and hot water usage patterns
Waste heat recovery highly dependent on customer hot water usage patterns. On average ~8 to 10% extra system efficiency.
24
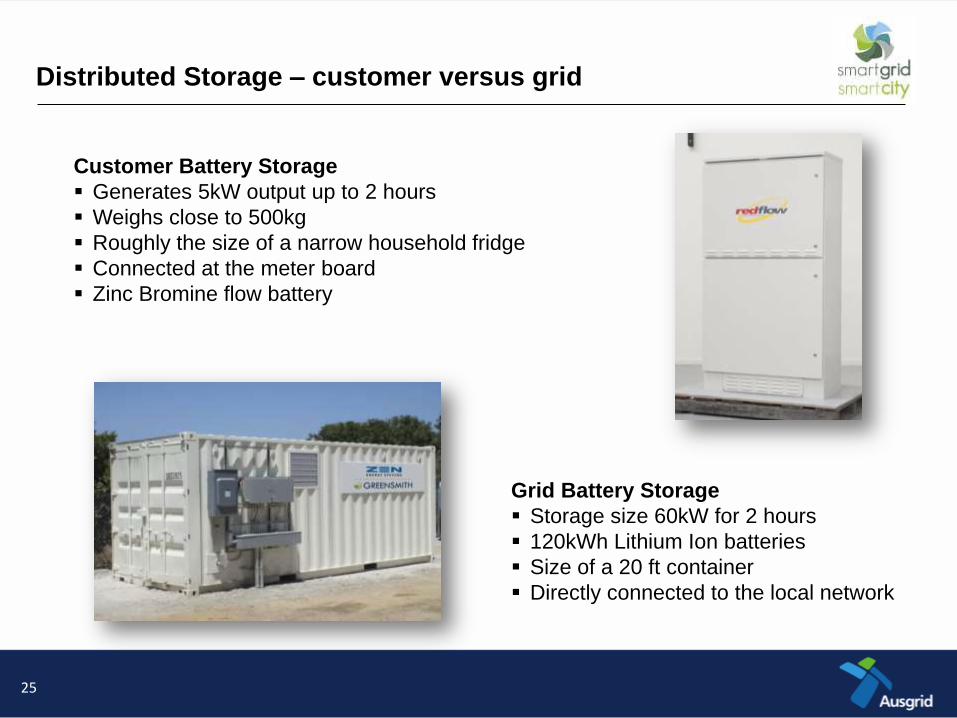
Distributed Storage – customer versus grid
Customer Battery Storage
Generates 5kW output up to 2 hours
Weighs close to 500kg
Roughly the size of a narrow household fridge
Connected at the meter board
Zinc Bromine flow battery
Grid Battery Storage
Storage size 60kW for 2 hours
120kWh Lithium Ion batteries
Size of a 20 ft container
Directly connected to the local network
25
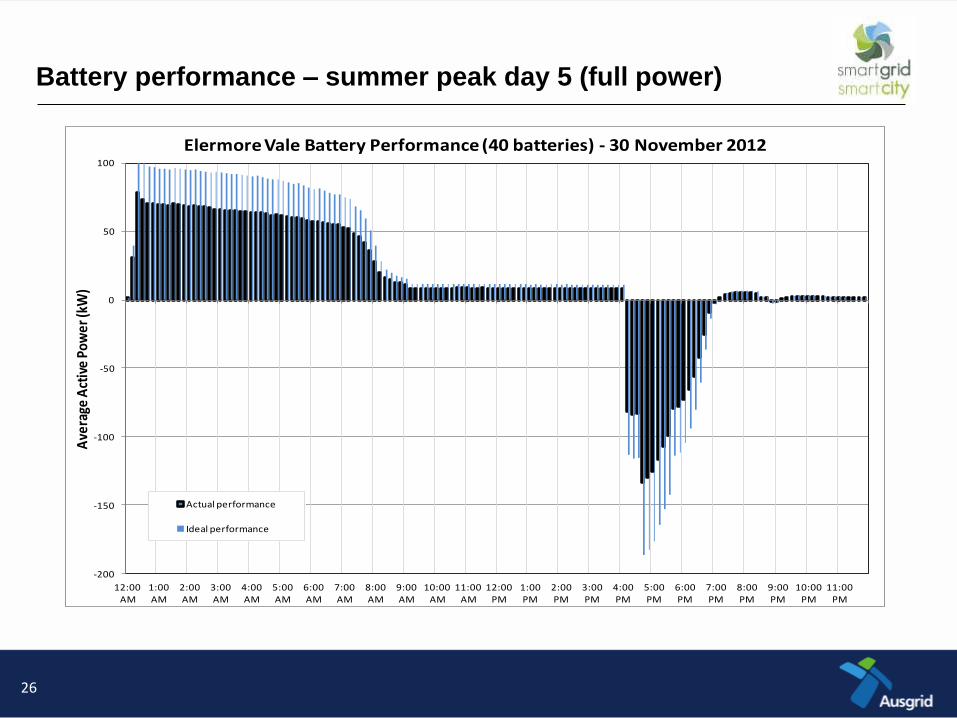
Battery performance – summer peak day 5 (full power)
-200
-150
-100
-50
0
50
100
12:00 AM
1:00 AM
2:00 AM
3:00 AM
4:00 AM
5:00 AM
6:00 AM
7:00 AM
8:00 AM
9:00 AM
10:00 AM
11:00 AM
12:00 PM
1:00 PM
2:00 PM
3:00 PM
4:00 PM
5:00 PM
6:00 PM
7:00 PM
8:00 PM
9:00 PM
10:00 PM
11:00 PM
Ave
rage
Act
ive
Pow
er (k
W)
Elermore Vale Battery Performance (40 batteries) - 30 November 2012
Actual performance
Ideal performance
26
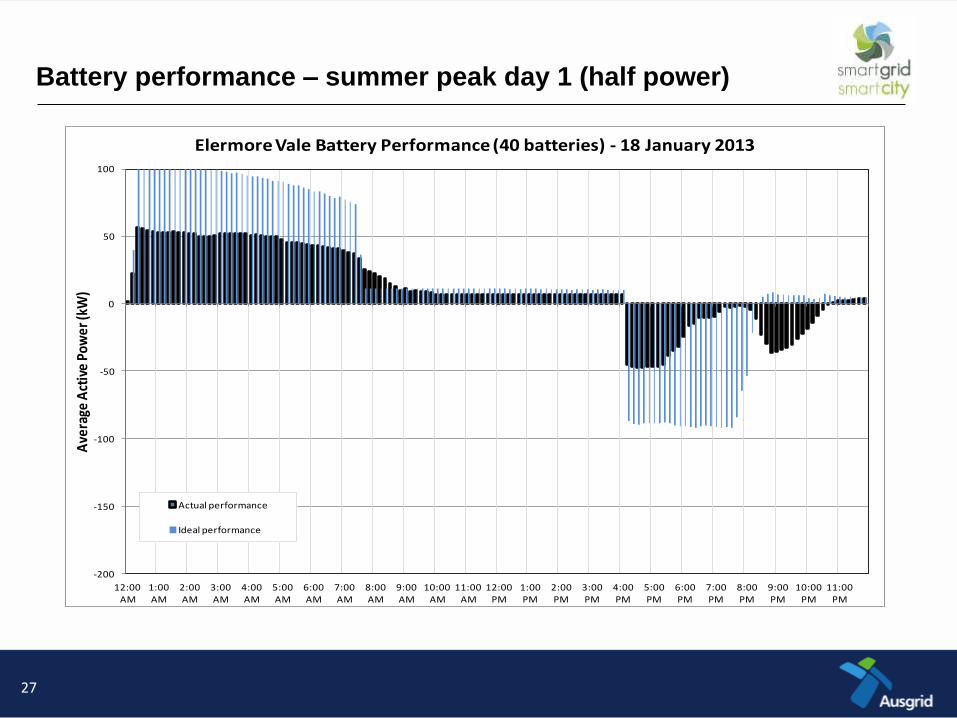
Battery performance – summer peak day 1 (half power)
-200
-150
-100
-50
0
50
100
12:00 AM
1:00 AM
2:00 AM
3:00 AM
4:00 AM
5:00 AM
6:00 AM
7:00 AM
8:00 AM
9:00 AM
10:00 AM
11:00 AM
12:00 PM
1:00 PM
2:00 PM
3:00 PM
4:00 PM
5:00 PM
6:00 PM
7:00 PM
8:00 PM
9:00 PM
10:00 PM
11:00 PM
Ave
rage
Act
ive
Pow
er (k
W)
Elermore Vale Battery Performance (40 batteries) - 18 January 2013
Actual performance
Ideal performance
27
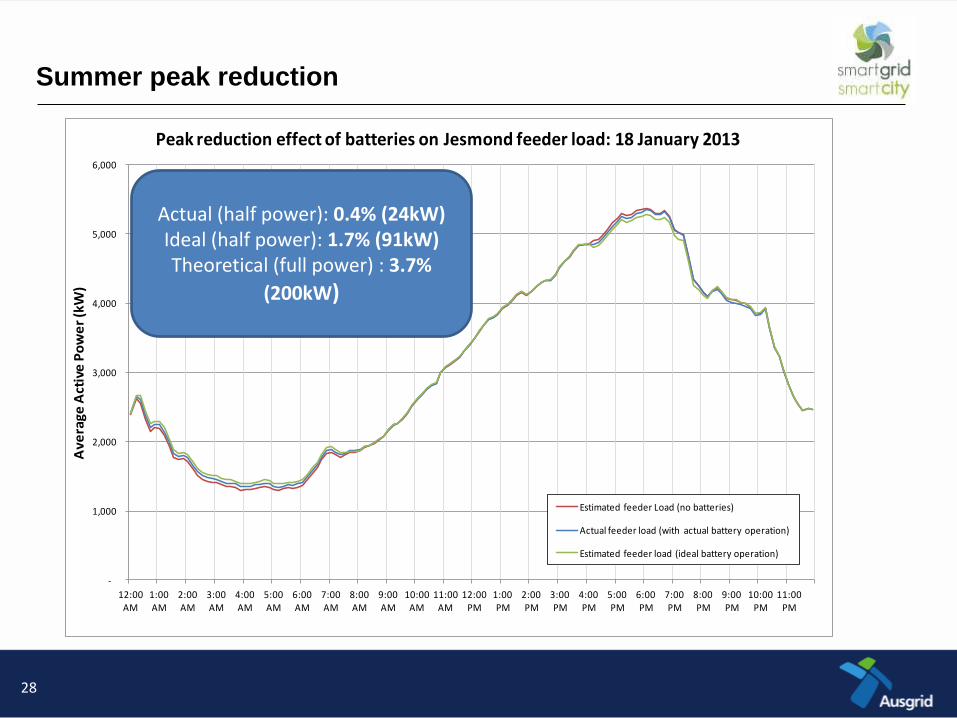
Summer peak reduction
-
1,000
2,000
3,000
4,000
5,000
6,000
12:00 AM
1:00 AM
2:00 AM
3:00 AM
4:00 AM
5:00 AM
6:00 AM
7:00 AM
8:00 AM
9:00 AM
10:00 AM
11:00 AM
12:00 PM
1:00 PM
2:00 PM
3:00 PM
4:00 PM
5:00 PM
6:00 PM
7:00 PM
8:00 PM
9:00 PM
10:00 PM
11:00 PM
Ave
rage
Act
ive
Po
we
r (k
W)
Peak reduction effect of batteries on Jesmond feeder load: 18 January 2013
Estimated feeder Load (no batteries)
Actual feeder load (with actual battery operation)
Estimated feeder load (ideal battery operation)
Actual (half power): 0.4% (24kW) Ideal (half power): 1.7% (91kW) Theoretical (full power) : 3.7%
(200kW)
28
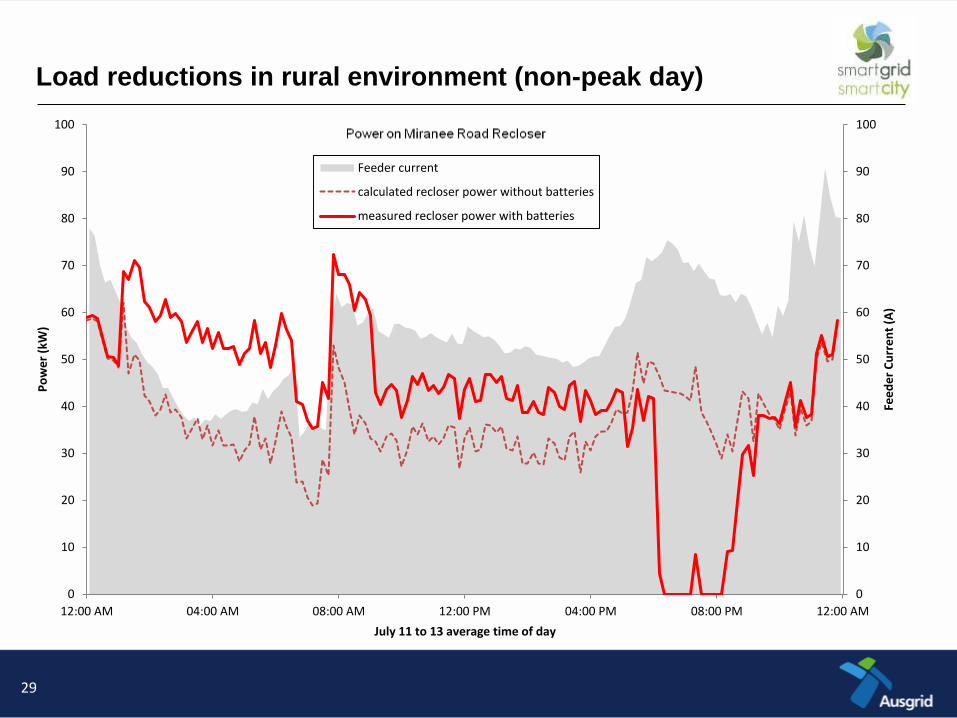
Load reductions in rural environment (non-peak day)
0
10
20
30
40
50
60
70
80
90
100
0
10
20
30
40
50
60
70
80
90
100
12:00 AM 04:00 AM 08:00 AM 12:00 PM 04:00 PM 08:00 PM 12:00 AM
Fee
de
r C
urr
en
t (A
)
Po
we
r (k
W)
July 11 to 13 average time of day
Feeder current
calculated recloser power without batteries
measured recloser power with batteries
29
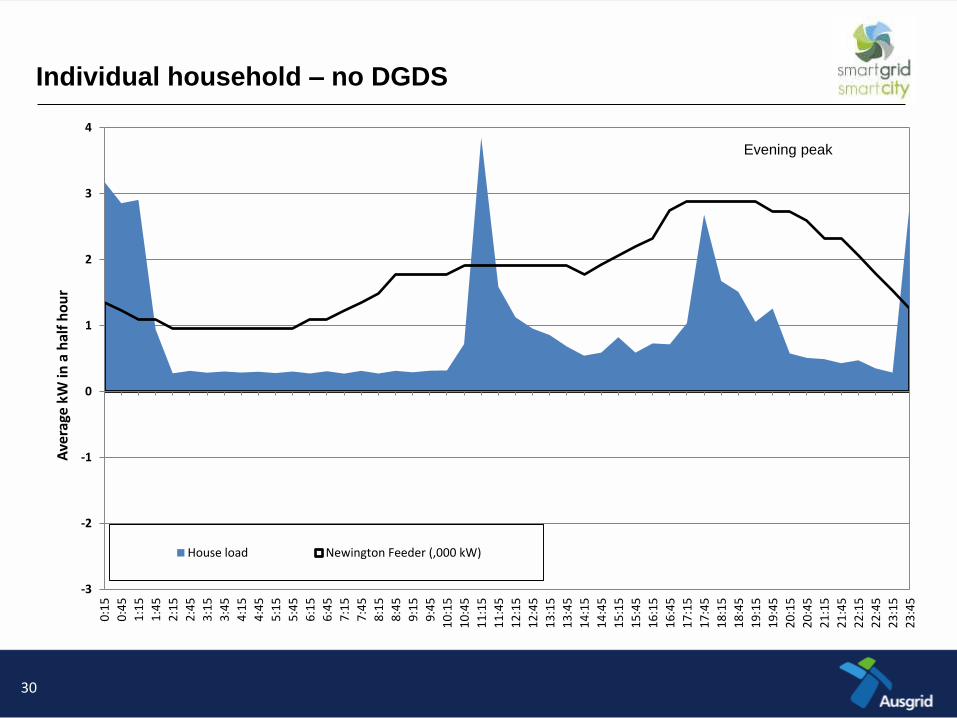
Individual household – no DGDS
-3
-2
-1
0
1
2
3
4
0:1
5
0:4
5
1:1
5
1:4
5
2:1
5
2:4
5
3:1
5
3:4
5
4:1
5
4:4
5
5:1
5
5:4
5
6:1
5
6:4
5
7:1
5
7:4
5
8:1
5
8:4
5
9:1
5
9:4
5
10
:15
10
:45
11
:15
11
:45
12
:15
12
:45
13
:15
13
:45
14
:15
14
:45
15
:15
15
:45
16
:15
16
:45
17
:15
17
:45
18
:15
18
:45
19
:15
19
:45
20
:15
20
:45
21
:15
21
:45
22
:15
22
:45
23
:15
23
:45
Ave
rage
kW
in a
hal
f h
ou
r
House load Newington Feeder (,000 kW)
Evening peak
30
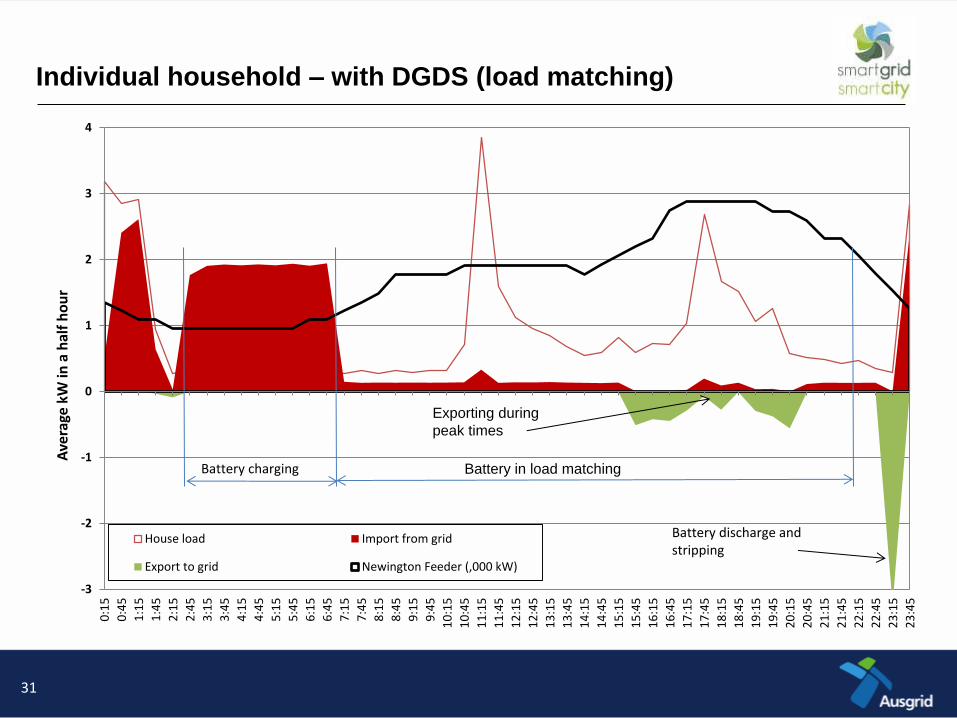
Individual household – with DGDS (load matching)
-3
-2
-1
0
1
2
3
4
0:1
5
0:4
5
1:1
5
1:4
5
2:1
5
2:4
5
3:1
5
3:4
5
4:1
5
4:4
5
5:1
5
5:4
5
6:1
5
6:4
5
7:1
5
7:4
5
8:1
5
8:4
5
9:1
5
9:4
5
10
:15
10
:45
11
:15
11
:45
12
:15
12
:45
13
:15
13
:45
14
:15
14
:45
15
:15
15
:45
16
:15
16
:45
17
:15
17
:45
18
:15
18
:45
19
:15
19
:45
20
:15
20
:45
21
:15
21
:45
22
:15
22
:45
23
:15
23
:45
Ave
rage
kW
in a
hal
f h
ou
r
House load Import from grid
Export to grid Newington Feeder (,000 kW)
Battery charging Battery in load matching
Battery discharge and stripping
Exporting during
peak times
31
• High penetration studies (Solar PV and wind)
• Key issues are voltage impacts & potential to change load profiles
• Impacts determined by network characteristics and settings (not just penetration)
• Small wind is restricted mainly to rural locations & has high output variability
• Rural (thin) networks more influenced by high penetrations
• Fuel cells
– Operation is more suited to customers with high consumption and base load
– Additional efficiency from waste heat capture is dependent on heating load characteristics
• Battery storage
– Distributed batteries can be controlled and utilised to reduce network peaks
– Battery operation, performance and key parameters are important in assessing suitability (eg. kWh/kW ratio)
– Advanced battery management/operation functions allow greater customer benefits
• Smart grid
– Network monitoring can assist in voltage management (including meters/devices)
– Standard control interfaces on DGDS may assist in dual benefits for customers and networks (AS4755 & AS4777)
Lessons learnt
32

Questions?
Find out more
www.smartgridsmartcity.com.au
Trial outcomes can also be found at the Information Clearing House
https://ich.smartgridsmartcity.com.au/
33