Embed Size (px)
Citation preview

Grand challenges: companies and universities working for a better society
Selected papers from Sinergie-SIMA Management Conference 2020 University of Pisa - Scuola Superiore Sant’Anna Pisa 7-8 September 2020
MAY-AUG
2021
VOL. 39
Issue 2
ISSN 0393-5108
ww
w.sijm
.it
Official Journal of Italian Society of Management
Vol. 39, Issue 2, 2021sinergie
sinergieitalian journal of management


Vol. 39Issue 2
N. 115
Grand challenges: companies and universities working for a better society
MAY-AUG
2021
The editing activity is sponsored by Consorzio Universitario di Economia Industriale e Manageriale - CUEIM - www.cueim.it
Journal accredited by
AIDEA
Sinergie Italian journal of management is published by Fondazione CUEIM, a foundation aiming to carry out and to promote scientific research, especially in the fields of business administration and of orga-nizations management, both profit and non profit.
Sinergie Italian Journal of Management is a peer-reviewed scholarly publication focusing on the principal trends in management studies.
Formerly Sinergie rivista di studi e ricerche
Published quarterly
Founded in 1983
ISSN 0393-5108
Open access at www.sijm.it
Indexed in Google Scholar, ACNP, ESSPER
Accepted for inclusion in Scopus (june 2021)
sinergieitalian journal of management
Official journal of Italian Society of Management
Peer reviewedjournal
Sinergie Italian journal of management is the official journal of SIMA, the Scientific Society of Italian Professors of Management, whose aim is to contribute to the development and dissemination of mana-gement knowledge in the academic, economic and social fields, on an excellence basis.
Questa testata è associata a

Sinergie Italian journal of managementformerlySinergie, rivista di studi e ricercheFounding Editor Giovanni Panati
Editor in chief Marta Ugolini, University of Verona, Italy
Co-Editor in chief Alberto Pastore, Sapienza University of Roma, Italy
Former EditorsGaetano M. Golinelli, Sapienza University of Roma, ItalyClaudio Baccarani, University of Verona, Italy
Honorary Board Lorenzo Caselli, Genova Gianni Cozzi, Genova Pietro Genco, Genova Ernestina Giudici, Cagliari Emanuele Invernizzi, Milano Gianni Lorenzoni, Bologna Giorgio Pellicelli, Torino Stefano Podestà, Milano Enzo Rullani, Venezia Sergio Sciarelli, Napoli Mario Scicutella, Bari Sergio Silvestrelli, Ancona Paolo Stampacchia, Napoli Giuseppe Tardivo, Torino Riccardo Varaldo, Pisa Dario Velo, Pavia
Associate Editors
Federico Brunetti, University of Verona, Italy Maria Colurcio, University of Catanzaro, Italy Charles Hofacker, Florida State University, USA
Umberto Martini, University of Trento, Italy Alfonso Vargas-Sanchez, University of Huelva, Spain Donata Vianelli, University of Trieste, Italy
Scientific Advisory Board
Gaetano Aiello, University of Firenze, Italy Ilan Alon, University of Agder, Norway Daniela Baglieri, University of Messina, Italy Camilla Barbarossa, Toulouse Business School, France Sergio Barile, Sapienza University of Roma, Italy Giuseppe Bertoli, University of Brescia, Italy Paolo Boccardelli, LUISS Guido Carli, Italy Enrico Bonetti, University of Campania Vanvitelli, Italy Stefano Bresciani, University of Torino, Italy Francesca Cabiddu, University of Cagliari, Italy Francesco Calza, University of Napoli Parthenope, ItalyMichelle Cano, University of Paisley, Scotland, UK Alfio Cariola, University of Calabria, Italy Matteo Caroli, LUISS Guido Carli, Italy Pier Paolo Carrus, University of Cagliari, Italy Sandro Castaldo, Bocconi University, Milano, Italy Mauro Cavallone, University of Bergamo, Italy Elena Cedrola, University of Macerata, Italy Ludovica Cesareo, Lehigh University, USA Peggy Chaudhry, Villanova University, USA Francesco Ciampi, University of Firenze, Italy Laura Costanzo, University of Southampton, UKAugusto D’Amico, University of Messina, Italy Daniele Dalli, University of Pisa, Italy Alfredo De Massis, University of Bolzano, Italy - Lancaster University, UKGiacomo Del Chiappa, University of Sassari, Italy Manlio Del Giudice, Link Campus University, Italy Angelo Di Gregorio, University of Milano Bicocca, Italy Alex Douglas, Editor The TQM Journal Bo Edvarsson, Karlstad University, Sweden Renato Fiocca, Catholic University of Milan, Italy
Vincenzo Formisano, University of Cassino and Southern Lazio, Italy Daniele Fornari, Cattolica del Sacro Cuore University, Piacenza, Italy Mariangela Franch, University of Trento, Italy Marco Frey, Sant’Anna School of Advanced Studies, Pisa, ItalyElena Giaretta, University of Verona, Italy Gianluca Gregori, Politecnica delle Marche University, Italy Anne Gregory, University of Huddersfield, UKMichael Heinlein, ESCP Europe, France Morten Huse, BI Norwegian Business School, University of Witten-Herdecke, Germany Gennaro Iasevoli, LUMSA University of Roma, Italy Francesco Izzo, University of Campania Vanvitelli, Italy Stanislav Karapetrovic, University of Alberta, Canada Hans Rudiger Kaufmann, Nicosia University, CyprusPhilip Kitchen, Salford University, UK Beatrice Luceri, University of Parma, Italy Amedeo Maizza, University of Salento, Italy Jacques Martin, ESOE, France Marcello Mariani, University of Bologna, Italy - University of Reading, UK Piero Mastroberardino, University of Foggia, Italy Alberto Mattiacci, Sapienza University of Roma, Italy Chiara Mauri, LIUCC Castellanza, Italy Gerardo Metallo, University of Salerno, Italy Angelo Miglietta, IULM University, Milano, Italy Tonino Minguzzi, University of Molise, Italy Andrea Moretti, University of Udine, Italy Patricia Moura e Sa, University of Coimbra, Portugal Fabio Musso, University of Urbino Carlo Bo, Italy Margherita Pagani, Emlyon, France

5
Scientific Advisory Board (continued from previous page)
Antigoni Papadimitriou, Johns Hopkins School of Education, Baltimore, Western Kentucky University,USA Riccardo Passeri, University of Firenze, Italy Tonino Pencarelli, University of Urbino Carlo Bo, Italy Lara Penco, University of Genoa, Italy Francesco Polese, University of Salerno, Italy Carlo Alberto Pratesi, Roma Tre University, Italy Yossi Raanan, Levinsky College of Education, Yaffa-Tel Aviv, Israel Angelo Renoldi, University of Bergamo, Italy Riccardo Resciniti, University of Sannio, ItalyMarco Romano, University of Catania, ItalySavino Santovito, University of Bari, Italy Carmela Elita Schillaci, University of Catania, Italy Alfonso Siano, University of Salerno, Italy
Federico Testa, University of Verona, Italy Steve Vargo, Hawaii University, USA Maria Vernuccio, Sapienza University of Roma, Italy Gian Mario Verona, Bocconi University, Milano, Italy Tiziano Vescovi, University of Cà Foscari, Venice, Italy Salvio Vicari, Bocconi University, Milano, Italy Roberto Vona, University of Napoli Federico II, Italy Vincenzo Zampi, University of Firenze, Italy Luca Zanderighi, University of Milano, Italy Lorenzo Zanni, University of Siena, Italy Cristina Ziliani, University of Parma, Italy Antonella Zucchella, University of Pavia, Italy
Coordinator of Editorial Review BoardAngelo Bonfanti, University of Verona, Italy
Editorial Review BoardFabio Cassia, University of Verona, Italy Paola Castellani, University of Verona, Italy Andrea Chiarini, University of Verona, Italy Nicola Cobelli, University of Verona, Italy Ilenia Confente, University of Verona, Italy Barbara Gaudenzi, University of Verona, Italy Chiara Rossato, University of Verona, Italy Ivan Russo, University of Verona, Italy Paola Signori, University of Verona, Italy Francesca Simeoni, University of Verona, Italy Vania Vigolo, University of Verona, Italy Francesca Conte, University of Salerno, ItalyAgostino Vollero, University of Salerno, Italy
Responsible EditorMarta Ugolini, University of Verona, Italy
Editorial assistantLaura Ciarmela - [email protected]
Publisher secretaryAda Rossi - [email protected]
Administration, subscription and advertisingAnnalisa Andriolo - [email protected]
Sinergie Italian Journal of ManagementVia Interrato dell’Acqua Morta, 26
37129 Verona (VR), ItalyTel. +39 045 597655
www.sijm.it


Grand challenges: companies and universities working for a better society
Selected papers from Sinergie-SIMA 2020 ConferencePisa 7-8 September 2020
Aphorisms pag. 9
Alberto PastoreFaust, the burst forth the career and publication ethics " 11
Best papers
Elisa Martinelli - Francesca De CanioCountry image dimensions and retail brand equity. A multi-cue analysis " 17
Stefano Romito - Angeloantonio Russo - Clodia VurroThe impact of sustainability orientation on firm propensity to ally " 37
Selected papers
Mariasole Bannò - Graziano Coller - Giorgia M. D’AlluraFamily firms, women, and innovation " 59
Sergio Barile - Irene Buzzi - Ernesto D’Avanzo - Francesca IandoloDecision trees to identify companies’ distress: the AI at work " 75
Letizia Lo Presti - Giulio Maggiore - Vittoria Marino Online public engagement is the New Deal! Along the distinctive pathway of Italian University " 95
Francesco Polese - Maria Vincenza Ciasullo -Raffaella MonteraValue co-creation in University-Industry collaboration.An exploratory analysis in digital research projects " 117
Annunziata Tarulli - Domenico Morrone - Pierluigi TomaExploring connections between vintage marketing and sustainability n the italian agri-food sector. An empirical analysis " 135
sinergieitalian journal of management
sinergieitalian journal of management Vol. 39, Issue 2, 2021

Useful information for readers e authors
Aims and scope pag. 155Peer review procedures " 157Access to journal content " 158Publishing ethics and publication malpractice statement " 159Author guidelines " 161Papers in Italian language " 164Subscription " 165
sinergieitalian journal of management Vol. 39, Issue 2, 2021

Aphorisms
1. Work without love is slavery. (Madre Teresa di Calcutta)
2. If you think adventures are dangerous, try routine: it’s lethal. (Paulo Coelho)
3. Take rest; a field that has rested gives a beautiful crop. (Ovidio)
4. Wherever you go, go with all your heart. (Confucio)
5. Why repeat the old errors, if there are so many new errors to commit? (Bertrand Russell)
sinergieitalian journal of management Vol. 39, Issue 2, 2021
sinergieitalian journal of management
ISSN 0393-5108 p. 9


11
Alberto PastoreFaust, the burst forth the career and publication ethics
Faust, the burst forth the career and publication ethics
Alberto Pastore
In my opinion, it is rewarding for all of us to observe how our community of Italian management scholars has significantly evolved in recent years.
Breaking free from the academic logic that ruled in the past, we have set up SIMA, our own representative and democratically elected scientific society of Italian management scholars; we have identified the values in which we recognize ourselves: openness, rigour, relevance, dissemination, ethics; we have nurtured a new organizational culture devoted to participation and service for the benefit of the scientific community; we have contributed, in a decisive manner, to configuring the newly expanded governance design of scientific societies in Italy dealing with accounting, management and organization studies. In this redesigning process, the AIDEA (Italian Academy of Economia Aziendale) was given a new role as the official representative with the responsibility of relating with institutions, professional bodies, and policymakers.
Within the institutional context, among other achievements, we have attained the formal recognition of the non-bibliometric nature of our discipline and the establishment of a dedicated organizational framework (GEV 13B) for the evaluation of research in the field of business studies.
As regards the Italian community of management scholars, we have exponentially improved our ability to fulfil rigorous and relevant research. Our scientific production standards have grown dramatically, placing our community in a prominent position not only among business disciplines but within the extensive area of economics and statistics studies (Area 13). Now we are fully participating in the scientific debate at an international level by collaborating and interacting with the most important scientific organizations worldwide. Our journals are firmly aligned with this international perspective, as underlined by the recent acceptance of Sinergie Italian Journal of Management in Scopus.
We have taken on the responsibility of leading the training of future generations and the life-long training of the managerial class; we have enhanced our connections with business companies, and we are leading in universities’ third mission and public engagement activities, as well as in management and service activities for our own universities.
While being pleased about this, we cannot forget that there are some very important issues that remain unsolved, as well as new emerging issues. Among these pending issues, the following stand out for their relevance: the matters of the value of research and the enhancement of its results; the search for the complete adequacy of evaluation and selection systems; respect for ethical principles in our profession, research and publication. The SIMA positioning paper “Job and career of the Management scholar”

focuses on these topics, among others, and can be retrieved for further information at www.societamanagement.it.
Regarding the first point, the value of research and the enhancement of its results, if we agree - and frankly it seems hard not to do so - that the ultimate purpose of our work is to create value for society and the economy, this means that when we carry out research we should produce studies and publications that have a tangible impact for the business environment and society, thus generating knowledge as a competitive resource. Therefore, we must critically reflect both on the contents and objectives of our research and on the channels and terms we use to disseminate our results. Within such a context, the risk of locking ourselves in the ivory tower and becoming autoreferential is very likely.
The second critical point concerns the adequacy of evaluation and selection systems, which represents a major issue. Here we must limit ourselves to underlining that the current systems in place are strongly unbalanced in favor of the dimension of research, to the detriment of other areas of the academic profession. With specific reference to the selection of professors at the Italian national qualification level - and even more so at the local level - the following burning questions emerge: How can a scholar’s be awarded in the absence of a teaching evaluation? How can a candidate’s research capacity be evaluated without discussing his or her scientific titles?
The third aspect involves respect for ethical principles in the profession, research and publication. Our scientific society SIMA has issued its own Code of Ethics, referring to the general aspects of the management professor’s activity that all us SIMA Associates are required to adhere to (we hereby suggest all members to carefully read the Code of Ethics).
Here, we will further explore our reflection on ethics applied to research and publication. It is a topic that has become increasingly relevant in recent times, leading the AIDEA to publish a brief note on “Ethics, Integrity and Responsibility of Authors in Publications”.
Let us consider the main critical issues on this matter by adopting the researcher’s perspective.
The first case concerns data falsification, which is about the collection of data and their manipulation to demonstrate a preconceived thesis. This behavior must be severely penalized, as it undermines the truthfulness of the results not only in the specific study at hand, but also in the stream of research that originates from it.
Another critical issue is plagiarism, which is a form of misappropriation of intellectual property. In our case, plagiarism consists in the use of ideas or portions of other scholars’ research output without authorization or failing to quote the original reference.
Duplicate publications can be assimilated to a form of self-plagiarism, i.e. the use of the same output / article in different publications, with or without relative references. This is on the same level of redundant publications, which replicate existing publications by recycling their hypotheses, results and conclusions, and simply integrating them by expanding the processed data. Both duplicate and redundant publications are considered unethical practices, as they infringe copyright law, “inflate”
sinergieitalian journal of management Vol. 39, Issue 2, 2021
12
13
the curricular credentials of authors, and bring confusion to the scientific community.
An extremely relevant and current issue concerns the potential distortion of selection and publication processes due to convergence or conflict of interest. Being part of an interest group - of evaluators and evaluated, clients, editors, reviewers and authors - and the presence of public and private conflicts of interest can produce alterations in decision-making processes inherent to the evaluation process. The consequences can be extremely serious both in terms of the incorrect consideration of real research quality and the dissemination of scientific results that are not adequately validated, as well as in terms of an unfair evaluation of researchers’ profiles, especially when their careers and possibilities of promotion are under assessment.
Another important aspect to consider is so-called “authorship”, i.e. the correct identification of authors who really contributed to a research project. As clearly highlighted in the aforementioned AIDEA document, some incontrovertible data reveal the emergence of problems such as the abnormal growth in the number of publications per single author and that of the number of authors per single publication. From an ethical point of view, the phenomena of “gift authorship”, as well as the multiplication and cross-subsidization of the signatures of publications, must be clearly avoided since these behaviours determine a falsification of researchers’ quality and scientific productivity. Furthermore, a single author’s intellectual and organizational contribution should exceed a minimum reasonable threshold for it to be included among the authors of a scientific product.
The choice of publication channel may also have ethical implications. As underlined in the SIMA positioning paper, the publication of research results must occur through channels characterized by transparency, seriousness, and professionalism. As far as scientific journals are concerned, it is strongly desirable to avoid publication in so-called “predatory journals”. Characterized by absent or unclear “aim & scope” sections, predatory journals operate with poor transparency, publish an exaggerated number of articles without carrying out an adequate selection and peer review procedure, and require significant financial contributions for submission and/or publication.
This examination of ethical principles applied to research and publication is certainly not exhaustive. Still, we believe it is enough, in the present context of discussion, to lead us to the concluding reflections of this editorial, labelled under the provocative title “Faust, the burst forward in careers and publications ethics”.
The Italian research evaluation system (VQR) and the scholarly evaluation system for career development purposes (ASN and local public exam) in place have taken on their own (perfectible!) connotations, and in these contexts the competitive dynamics among applicants have become increasingly strong. The tool of ASN median values that positively stimulated productivity in the academic community at the beginning, now manifests its intrinsic degeneration by projecting the threshold
Alberto PastoreFaust, the burst forth the career and publication ethics
sinergieitalian journal of management Vol. 39, Issue 2, 2021
14
of acceptance higher and higher, thus causing a potentially endless “quantitative” run-up, despite the quality and relevance of research.
However, the current fierce and sometimes distorted competition can lead researchers to obtain publications “for career purposes only”. This approach can cause highly harmful effects such as, for example, research with little relevance, research results that are not properly disseminated, the neglect of other dimensions of the profession (in particular teaching, but also third mission and service activity). Above all, the exertion of strong “contextual” pressures on morally less solid subjects can induce some researchers to approach unethical practices, such as those described above, in order to improperly and only apparently strengthen their scientific curricular profile.
In these cases, we want to specify the unethical and sometimes illegal profile of certain behaviours, which produce the effect of disowning meritocracy, harming our community and, when brought to evidence, directly harming the person concerned. In Goethe’s literary work, the protagonist Faust, a scholar of philosophy and science, sells his soul to Mephistopheles to obtain even greater power, youth and knowledge. Playing with the metaphor, we hope that no management scholar will be tempted to follow Faust’s example and that good research and publications that are rigorous, relevant and useful and are produced following ethical principles will always prevail.
The ethical sense of research and publication must be a solid and founding principle of our scientific community. From this perspective, our Sinergie - Italian Journal of Management is strongly committed to the affirmation of this principle.
Academic or professional position and contacts
Alberto PastoreCo-Editor in Chief Sinergie Italian Journal of Management Full Professor of ManagementSapienza University of Roma - Italye-mail: [email protected]
sinergieitalian journal of management
ISSN 0393-5108 DOI 10.7433/s115.2021.01
pp. 11-14

Best papers


17
Received18th February 2020
Revised 28th April 2020
Accepted 21st June 2021
Country image dimensions and retail brand equity. A multi-cue analysis1
Elisa Martinelli - Francesca De Canio
Abstract
Frame of the research: Today, retailers possess stronger brands with a high level of awareness and are increasingly going international. A better understanding of consumer-based brand equity (CBBE) from an international marketing perspective is required.
Purpose of the paper: To this aim, this study investigates the factors affecting retail brand equity (RBE) when a multi-cue approach is applied, that is: considering traditional RBE antecedents (e.g. retail brand awareness, retail brand image, retail perceived value) together with country image (CI) cues - in their cognitive and affective dimensions.
Methodology: A survey was carried out administering a structured questionnaire to a sample of consumers. A structural equation modeling (SEM) was employed to test the proposed model.
Findings: All the postulated relationships were verified, apart from the retail perceived value (RPV). Country image affects retail brand equity, but unexpectedly. While the cognitive image of the retailer’s country of origin exerts a negative effect, the affective country image impacts in a positive way.
Research limits: Despite the contribution to the retailing and international marketing literature, the research has some limitations. It is performed on a single retail brand and focused on Italian consumers only. Finally, this first study did not include any mediating or moderating variables.
Practical implications: International retailers, with particular attention to discounters, would understand the factors to leverage in order to boost their consumer-based brand equity.
Originality of the paper: So far, poor attention has been given to the effect of country image on retail brand equity. However, the retailer’s image develops not only in accordance with the service provided, but also in relation to the stereotypes connected with the retailer’s country of origin. Moreover, the study employs a multi-cue perspective, using traditional RBE antecedents together with CI dimensions.
Key words: retail brand equity; country image; brand awareness; brand image; discounter; SEM.
1 Although this contribution is the result of the joint work of the authors, it can be attributed to them as follows: Elisa Martinelli paid particular attention to the extension of paragraphs 1, 2, 3 and 6; Francesca De Canio contributed specifically to paragraphs 4, 5 and 7.

sinergieitalian journal of management Vol. 39, Issue 2, 2021
18
1. Introduction
The spread in international trade has facilitated the availability of brands from one country to consumers in other countries. Today, many companies have a global and multinational approach to their development. However, convergence and divergence in consumer behavior and cross-cultural issues continue to affect the tendency to grow internationally, in particular when retailing is concerned (De Mooij and Hofstede, 2002). Going international, retailers need to transfer, negotiate and adapt their business models to the local context as they embed themselves in different institutional environments (Burt et al., 2016). This acknowledgment is opening up new research avenues. To this concern, an area that requires supplementary studies is related to consumer-based brand equity (CBBE) from an international marketing perspective. Specifically, until now, to the best of our knowledge, no study has investigated the factors affecting retail brand equity (RBE) when the retail brand originates from a foreign country. To fill this gap, the current study focuses on the perception of origin at the brand level rather than on the actual origin at the product level as extant literature on the country-of-origin effect (COE) is mainly focused on (Roth and Diamantopoulos, 2009), contributing to field advancement.
The importance of the brand consists in shaping the consumers’ beliefs and attitudes and enters in the consumers’ conscience quickly and strongly. Some authors have highlighted the brand importance in the context of COE, proposing that the “origin” - in the country of origin research - should be conceptualized as a perceived brand origin (Pharr, 2005; Thakor and Kholi, 1996). Consumers appear to “place” products and services based on the perceived origin of the brand. Accordingly, the issue of how various facets of place influence brand equity (BE) is emerging as an interesting avenue for advancing the knowledge of origin effects.
In this study, we decided to use the origin with explicit reference to a brand in the retail sector. In fact, the sector in question has been hardly taken into consideration by the studies on the country-of-origin effect. However, the image of a retailer might develop not only in accordance with the retail service provided, but also in relation to the stereotypes concerned with the retailer’s country of origin. Yet, companies like Wal-Mart and Carrefour recall their origins, respectively American and French, while some others use an opposite approach applying an adaptation strategy in the purpose of “think globally, act locally”. But despite the strategic companies’ aims, are consumers impacted by a retailer’s country image when they value a retail brand? In synthesis, this is our main research question.
To this purpose, the current paper aims at exploring the effect of country image (CI) on the perceptions of consumers with respect to the perceived equity of an international retail brand. Specifically, this study is purposed at investigating the factors affecting RBE adopting a multi-cue approach where not only traditional RBE antecedents are concerned [e.g. retail brand awareness (RBA), retail brand image (RBI), retail perceived value (RPV)], but also country image (CI) cues are included, intended in a cognitive (CCI) as well as affective (ACI) conceptualization. This is fulfilled through a survey, administering a structured questionnaire to a sample of

19
Elisa Martinelli Francesca De CanioCountry image dimensions and retail brand equity. A multi-cue analysis
consumers, and then employing a structural equation modeling (SEM) to test the proposed model.
This paper intends to provide the following contributions. First of all, to extend the academic knowledge on the role of country image in the retail context. Generally speaking, the literature specifically aimed at exploring the COE in service settings reveals a shortage of studies (Ahmed et al., 2002; Berentzen et al., 2008; Martinelli and De Canio, 2019; Javalgi et al., 2001). The way in which consumers are affected by the COE depends on the product category (Ahmed and d’Astous, 1996), and this has been found enhanced when services are involved (Pecotich et al., 1996). Empirical works aimed at exploring the COE role when a service offer is involved, especially in the grocery retailing context (Kan et al., 2015) are required (Martinelli and De Canio, 2019). Second, even if a number of studies show that COE directly affects products brand equity (Buil et al., 2008; Pappu et al., 2006, 2007; Shocker et al., 1994; Thakor and Katsanis, 1997; Yasin et al., 2007) - even if recent studies found that BE dimensions could not be always clearly discriminated in all national contexts (Christodoulides et al., 2015) - no studies were addressed to the retail setting, at least to our knowledge. Hence, the present research is one of the first studies meant at examining the relationship between two sets of constructs: country image and retail brand equity.
Third, this work aims at developing the scientific knowledge on RBE at the retail company level rather than at the store or private label level, as the literature on the subject has mainly done so far. As a matter of fact, “conceptualisation of retail equity is still in want of consensus” (Rashmi and Dangi, 2016, p. 67) and further studies are required. This is even more important today, as the spread of multichannel retailing makes quite limited the exclusive focus on equity at the point-of-sale level. Into this perspective, the retail branding policies should be reviewed, extending to the retail corporate brand upper level. In this spirit, due to the difficulties associated with the measurement of the BE, scholars argued that the assessment of brand equity at the corporate level in the retail setting can pose further challenges compared to operating the same measurement with products instead of services (Ailawadi and Keller, 2004). From this point of view, the few studies in line with this perspective offer non-univocal measures and models often contradictory compared to the findings of the mainstream literature and do not include the COE as a RBE determinant. Last but not least, whilst previous research (e.g. Buil et al., 2008; Yoo and Donthu, 2001) applied the Aaker’s (1991) scale of consumer-based brand equity using cross-national data, the samples used were usually composed by students rather than real consumers, limiting the managerial return of findings. In this study, we collected data from real shoppers, to overcome this possible limitation.
For the remaining of the paper, we first review the relevant country image and retail brand equity literature, outlining then the conceptual model and the theoretical hypotheses postulated. A description of the methodology applied to collect and measure data, the sample features, and the empirical model and measure validity follow. We then outline and discuss the findings, highlighting the main theoretical and managerial

sinergieitalian journal of management Vol. 39, Issue 2, 2021
20
implications of our work. We conclude by presenting some study limitations and future avenues for further research.
2. Country image and retail brand equity: a literature review
The country-of-origin effect is considered as one of the most widely researched topics in international marketing (Magnusson et al., 2011; Pharr, 2005; Usunier, 2006).
The COO has been found to operate as an extrinsic cue able to influence the consumer decision-making process likewise the price and/or product guarantee. Consumers infer beliefs about product attributes because of the stereotypes that individuals possess about a certain country and the products originated from there (Han, 1989; Johansson, 1989; Knight and Calantone, 2000).
This body of research brought to the acknowledgment that a product’s COO affects product evaluations and purchasing behavior (Roth and Diamantopoulos, 2009; Verlegh and Steenkamp, 1999) depending on the level of consumer knowledge (Han, 1989). Indeed, this impressive consideration has developed also a fair amount of criticism that has drawn attention to a number of issues, such as the lack of theoretical development in the field (Bloemer et al., 2009), the presence of methodological bias (Bilkey and Nes, 1982; Samiee, 2010) and the usefulness of the effect in the real-world (Usunier, 2006, 2011).
The research focus has gradually evolved over time. Initially, the scholar attention was addressed to the evaluation of the global quality of the products with distinct origins (Bilkey and Nes, 1982; Han, 1989; Nagashima, 1970, 1977; Roth and Romeo, 1992), while then the focus passed on the multiple origin of products, so-called hybrid products (Chao, 1993), and was later centered on the country image conceptualization and measurement (Martin and Eroglu, 1993; Nebenzahl et al., 2003; Parameswaran and Yaprak, 1987). More recently, country equity (Pappu and Quester, 2010) and country branding (Marino and Mainolfi, 2010, 2013; Papadopoulos and Heslop, 2002) emerged as developing topics.
Country image is a construct defined at the macro and micro level (Heslop and Papadopoulos, 1993; Balboni et al., 2011). The macro country image summarizes the beliefs of individuals on the political, economic, and socio-cultural characteristics associated with the overall image of a country (Country Image) (Heslop and Papadopoulos, 1993). Conversely, the micro-country image refers to the perceptions and beliefs related to a specific product category produced in a certain country (Country related product image) (Johansson et al., 1985; Roth and Romeo, 1992). Most COE research measured “country” image through product rather than country measures (Han, 1989). Moreover, a line of research on the country image investigated its multi-dimensionality (Papadopoulos et al., 1990, 1993), identifying three components: a cognitive component, including consumers’ beliefs about the country’s industrial and technological advancement; an affective component, defining the consumers’ affective response to the country’s people; and a conative component, consisting

21
of the consumers’ desired level of interaction with the sourcing country. However, most empirical studies on country image have not considered its multi-dimensionality when operationalizing the construct (Johansson et al., 1985; Han, 1989; Knight and Calantone, 2000).
More recently, some scholars started to suggest that the focus of origin effect research should shift away from products and focus on brands (Thakor and Lavack, 2003; Pharr, 2005; Josiassen and Harzing, 2008; Usunier, 2011). Actually, if we go back to the definition of country image given by Nagashima (1970), it is possible to find a similarity with the way in which Keller (1993) defined customer-based brand equity: “What the two definitions share is the emphasis upon the perceptual nature of these images, which can lead to a great variation in what consumers actually associate with a given image”. (Andéhn et al., 2016, p. 227). As a cue‐based cognitive short‐cut, brand origin information is a place association reflecting the personal meaning about a brand stored in the consumers’ memory (Samiee et al., 2005).
In the last decade, retailers toughly increased the awareness and value of their brands. This has led scholars to pose more attention to retail brand equity: a number of studies started to focus on this matter (Swoboda et al., 2009; Jara and Cliquet, 2012; Swoboda et al., 2013; Swoboda et al., 2016; Londoño et al., 2016, 2017), providing preliminary support to the RBE construct and its antecedents. Although these contributions highlighted the growing interest in the topic of BE conceptualization within the application area of retailing, extant literature on RBE is mainly aimed at conceptualizing it at the store (Pappu and Quester, 2006; Gil-Saura et al., 2013) or at the private label levels (Das et al., 2012), ignoring that it is the retail corporate brand that should become the key study reference (Burt and Davies, 2010; Anselmsson et al., 2017). In fact, retail brand equity should be considered under three conceptual perspectives: (1) the equity associated with the retailer’s brand (e.g., Coop, Conad), (2) the equity associated with a specific retailer’s store; 3) the equity associated with the retailer’s store brand (e.g. Conad’s Sapori & Dintorni, ViviNatura, etc.). The young and not well-established literature on RBE is mainly focused on the second perspective, that is: measuring store equity, ending in neglecting an important level on which studies on RBE should be articulated. This is the study of the RBE at the retail corporate brand level, in the perspective of the “retailer as a brand” orientation (Ailawadi and Keller, 2004; Burt, 2000; Burt and Davies, 2010; Martinelli and De Canio, 2018). However, the few studies in line with this perspective report contradictory results. For example, Anselmsson et al. (2017) consider a conceptualization of RBE in terms of retail brand image measured in a multi-dimensional perspective, differently from the product branding literature in which the brand image is traditionally considered the antecedent of its value (Keller, 1993) and from other retail literature (Gil-Saura et al., 2013). More recently, studying the equity concept in a retailing channel, Londoño et al. (2016) identified awareness, quality and loyalty as formative indicators of equity, while Martinelli and De Canio (2018) proved that RBE acts as a mediator of BA and of retail perceived value in developing customer loyalty to the retail corporate brand. Yoo et al. (2000) examined the influence of marketing
Elisa Martinelli Francesca De CanioCountry image dimensions and retail brand equity. A multi-cue analysis

sinergieitalian journal of management Vol. 39, Issue 2, 2021
22
mix elements on CBBE, finding that store image, advertising, and price level increase the consumers’ perceptions of brand equity whereas frequent sales promotions destroy brand equity. However, empirical research on brand equity has focused largely on a single country’s data, resulting from neglecting international marketing issues and focusing on evaluations of brands almost only in the goods domain (Christodoulides et al., 2015).
To clarify the role of country image in the consumer-based retail brand equity formation, a structural model is proposed in the following paragraph.
3. Conceptual model and hypotheses
This paper explores consumer-based retail brand equity from an international marketing perspective. Specifically, our study is aimed at investigating the factors affecting RBE, adopting a multi-cue approach where not only traditional RBE antecedents are concerned (e.g. RBA, RBI, RPV), but also country image cues (i.e. cognitive and affective) are included. In our work RBE refers to the retail brand at the corporate level (Burt and Davies, 2010), while country image is defined as “the sum of beliefs and impressions people hold about places” (Kotler and Gertner, 2002, p. 251) and the local population (Laroche et al., 2005).
Brand awareness (BA) is fundamental to influence consumer behavior and boost sales. Keller (1993, p. 3) defined brand awareness as “related to the likelihood that a brand name will come to mind and the ease with which it does so”. This author stated that without being conscious and mindful of a brand, it is difficult to make it strong and favorable. BA has been found to positively stimulate BE (Keller, 1993) and store equity (Yoo et al., 2000; Hartman and Spiro, 2005; Pappu and Quester, 2006; Jinfeng and Zhilong, 2009; Anselmsson et al., 2017), as it reflects the level of recognition or recalls from a set of alternatives by the consumer. This effect emerges also when the retail corporate brand equity is studied (Martinelli and De Canio, 2018).
H1: Retail brand awareness (RBA) has a significant and positive effect on Retail Brand Equity (RBE)
According to Aaker (1991, p. 109), brand image is defined as “anything linked in memory to a brand, usually in some meaningful way”. In the retailing literature, consumers’ perception of a retailer’s image has been traditionally conceptualized and investigated in terms of store image (Morschett et al., 2005). Hartman and Spiro (2005) and Gil-Saura et al. (2013) found that a positive store image has a similar effect on store equity. The same relationship would be expected when the retail company brand is concerned. The following hypothesis is postulated:
H2: Retail brand Image (RBI) has a significant and positive effect on RBE.
Aaker (1991) proposes that brand equity creates value not only for the company but also for its customers. Perceived value was conceptualized as

23
the consumers’ assessment of the utility and expectations offered by retail stores (Zeithaml, 1988). Studies on consumer behavior have investigated the effects of perceived value, “but they have seldom analyzed the relationship between perceived value and retail brand equity” (Weindel, 2016, p. 288). Previous research investigated the impact of perceived value on BE (Lassar et al., 1995), and verified this relationship when store equity is studied too (e.g., Jinfeng and Zhilong 2009; Yoo et al. 2000; Gil-Saura et al., 2013), but also when the retail corporate brand equity is considered (Martinelli and De Canio, 2018). Consequently, we postulate to assess this link when retail brand equity is considered. The third hypothesis underpinning our conceptual model is as follows:
H3: Retail Perceived Value (RPV) has a significant and positive effect on RBE.
In the present study, the country image cue is considered as composed of two dimensions: the cognitive country image (CCI) and the affective country image (ACI) (Laroche et al., 2005; Roth and Diamantopoulos, 2009). The cognitive country image is considered in broad terms, as the stereotypes and beliefs that individuals hold on the political, economic, and socio-cultural characteristics associated with respect to a given country (Martin and Eroglu, 1993; Roth and Diamantopoulos, 2009). Traditionally, in fact, scholars investigated the origin effect on consumer evaluations as depending upon the perceived level of the general development of the country from which a product, service, or brand originates (Martin and Eroglu, 1993; Verlegh and Steenkamp, 1999; Roth and Diamantopoulos, 2009). This effect is sharable, as consumers might expect higher quality products and services as coming from a country they perceive to be more economically, socially and technologically evolved. Magnusson et al. (2011) explored the perceived country image of a product in relation to brand attitude and demonstrated a significant relationship regardless of the brand origin perceptions’ objective accuracy. As CCI has been proved to constitute a relevant factor in consumers’ evaluation and attitude formation toward brands in the manufacturing sector (Andéhn et al., 2016), we would like to test the same when a service offer is concerned.
The affective country image is defined as “the consumers’ affective responses (e.g. liking) to the country’s people” (Laroche et al., 2005, p. 99). In fact, the country of origin of a product, service, brand may evoke positive or negative feelings. Whether the consumer likes the product will then depend, at least in part, on his/her sentiments toward the associated national origin (Johansson, 1989; Knight and Calantone, 2000). The direct impact of the affective side of the country image on behavioral intentions was detected by Klein et al. (1998) and Villanueva and Papadopoulos (2003). However, to our knowledge, no studies investigated the impact of ACI on brand equity, as our fifth hypothesis posit, instead.
H4: Cognitive Country Image (CCI) has a significant and positive effect on RBE.
H5: Affective Country Image (ACI) has a significant and positive effect on RBE.
Elisa Martinelli Francesca De CanioCountry image dimensions and retail brand equity. A multi-cue analysis

sinergieitalian journal of management Vol. 39, Issue 2, 2021
24
The respondents’ age and sex were included in the model to further the results’ explanation.
Fig. 1: The theoretical model
Source: our elaboration
4. Methodology
4.1 Data collection
A survey was conducted among Italian consumers intercepted in the city center of three different towns located in North Italy. Interviewees were approached by three trained interviewers. The survey lasted two weeks and was accomplished during Spring 2019.
The first question posed by the interviewers was aimed at selecting the household responsible for grocery shopping. In case the approached individual neglected this role, the interviewer was instructed to thank him/her and pass to another potential interviewer.
The rest of the questionnaire was devoted to exploring country image perceptions and consumer-based brand equity in relation to the main discounter operating in Italy. This is a German discounter present since a long time in the country, selected also as it is a top retail-spender in advertising. Socio-demographics information on the respondents was collected too.
All the people in line with the first research design requirement were then asked with an open-ended question aimed at checking the perceived country of origin of the discounter observed, intended as the country in which the interviewee believes that the discounter’s headquarters are located, giving as sole information some of the almost thirty countries in which the discounter operates. This in order to collect a knowledgeable
Retail BrandAwareness
Retail BrandImage
Retail Perceived
Value
Retail BrandEquity
Cognitive Country Image
Affective Country Image
Control Variables: age, sex
25
sample and in line with the requirements suggested by Thakor and Kholi (1996). 85.8% of the respondents indicated Germany as the country of origin of the retail brand investigated, while only 1.5% indicated Italy; 5% indicated Norway, while 3% of the respondents believe in a French origin of the discounter. Other countries (Great Britain, Spain, Austria, Holland, and the United States) were marginally cited. Therefore, an accuracy rate of the country of origin detection is evident in our sample (Magnusson et al., 2011; Samiee et al., 2005).
4.2 Sample characteristics
In total, 400 completed and valid questionnaires were collected, but only 343 of them were processed, in order to focus only on the 85.8% of the respondents who recognized the correct country of origin of the discounter investigated.
The sample is mainly composed of women (64%). Younger shoppers (18-24 years old) represent 14.3% of the sample, while 24.5% of the respondents are included in the cluster 25-35 years old, and 28.3% the cluster of 36-50 years old. Adults (over 51-65 years) compose 23.3% of the sample and 9.6% of the sample are older than 65 years.
In terms of educational level, respondents are distributed as follows: 46.1% of the sample has a high school diploma while 13.7% a Bachelor’s Degree, and 12.8% a Master Degree. Moreover, 3.2% of the respondents got a Ph.D or others post-degrees while 21.3% of them possess a Middle School Diploma and 2.9% a Primary School Diploma.
4.3 Measurements
The measures used to fulfill the survey were derived from the extant international marketing literature on the country of origin and from the retailing literature on RBE (Tab. 1).
Following the recommended translation procedure, a double translation English-Italian and Italian-English was used to reduce translation errors. Interviewees were asked to evaluate construct measures on a 7 points Likert-scale (1= Strongly disagree; 7= Strongly agree).
Elisa Martinelli Francesca De CanioCountry image dimensions and retail brand equity. A multi-cue analysis

sinergieitalian journal of management Vol. 39, Issue 2, 2021
26
Tab. 1: Constructs, items, and original scales
Constructs Code Item Original Scale
Retail Brand Equity (RBE)
RBE1 If another retailer is not different from X in any way, it seems smarter to purchase in X’s stores.
Yoo et al. (2000)
RBE2 If there is another retailer as good as X, I prefer to buy in X
RBE3 Even if another retailer has same features as X, I would prefer to buy in X.
RBE4 It makes sense to buy in X’s stores instead of any other retailers’ stores, even if they are the same
Retail Brand Awareness (RBA)
RBA1 I know what X looks like
Yoo et al. (2000)
RBA2 I can quickly recall the symbol or logo of X
RBA3 I am aware of X’s brandRBA4 I can recognize X among other
competing brands
Retail Brand Image (RBI)
RBI1 X is committed to sustainable development
Adapted by Kremer and Viot (2012)
RBI2 X is concerned with the environmentRBI3 X fights for the customers’ interestsRBI4 X is close to customers
Retail Perceived Value (RPV)
RPV1 X’s employees are willing to help Adapted by Sweeney et al. (1997)
RPV2 X is good value for moneyRPV3 X has quick customer service to deal
with returns and complaints
Cognitive Country Image (CCI)
CCI1 Germany has high labor costs
Adapted by Martin and Eroglu (1993); Laroche et al., 2005
CCI2 Germany has a high level of industrialization
CCI3 Germany is a highly developed economyCCI4 Germany has an excellent level of
education
Affective Country Image (ACI)
ACI1 German people are likableLaroche et al., 2005ACI2 German people are trustworthy
ACI3 German people are hardworking Source: our elaboration
4.4 Empirical model and measure validity
Following the recommendations of Anderson and Gerbing (1988) a two-step approach is used to analyze the data: the measurement model is estimated to verify the relationship between dependent latent variables and their indicators (items); the structural model is subsequently estimated to measure paths between constructs (latent variables).
The convergence validity of the scales is assessed. In fact, all factor loadings are closer to the cut-off of 0.7 and significant (t-statistics > 9) (Hu and Bentler, 1999). Further, all the items reveal a high item-total correlation, indicating their capability to measure the investigated construct. Cronbach’s alphas (Table 2) are greater than .70 (de Vaus, 2002), confirming the good reliability of the measures. The Average Variance Extracted (AVE) and the Composite Reliability (CR) values assess the convergent validity of the constructs. In fact, both indicators are greater than the thresholds cited in

27
the relevant literature for all the constructs (AVE > 0.5 and CR>0.7; Fornell and Larcker, 1981) (Table 2).
Tab. 2: Statistic Descriptive of Items and Discriminant validity
Constructs Code Factor Loadings
T-statistics Cronbach’s α AVE CR
Retail Brand Equity (RBE)
RBE1 0.844 n.a. 0.956 0.802 0.957
RBE2 0.932 29.411RBE3 0.958 31.117RBE4 0.944 28.382
Retail Brand Awareness (RBA)
RBA1 0.770 n.a. 0.861 0.522 0.867RBA2 0.771 12.099RBA3 0.912 19.129RBA4 0.683 9.979
Retail Brand Image (RBI)
RBI1 0.765 n.a. 0.898 0.688 0.898RBI2 0.789 21.444RBI3 0.899 17.569RBI4 0.858 15.236
Retail Perceived Value (RPV)RPV1 0.971 n.a. 0.951 0.870 0.953RPV2 0.970 53.022RPV3 0.853 29.305
Affective Country Image (ACI)ACI1 0.873 n.a. 0.866 0.708 0.877ACI2 0.952 24.043ACI3 0.675 12.435
Cognitive Country Image (CCI)
CCI1 0.697 n.a. 0.828 0.557 0.834CCI2 0.718 11.609CCI3 0.821 10.349CCI4 0.745 11.425
Source: our elaboration
Applying the Fornell and Larcker criterion (1981) the discriminant validity of the measurement model is assessed. The square root of the average variance extracted for each construct is higher than the correlation between the construct and the others (Fornell and Larcker, 1981) (Table 3).
Tab. 3: Fornell-Larcker Criterion and Correlation Matrix
RBE RBA RBI RPV CCI ACI SEX AGERetail Brand Equity 0.895Retail Brand Awareness 0.524 0.722Retail Brand Image 0.597 0.535 0.830Retail Perceived Value 0.402 0.442 0.608 0.933Cognitive Country Image 0.070 0.257 0.265 0.169 0.747Affective Country Image 0.220 0.048 0.284 0.204 0.267 0.842Sex -0.054 -0.115 -0.084 -0.163 -0.057 -0.131 1.000Age 0.158 0.042 0.202 0.209 -0,021 0.039 -0.154 1.000
Note: Diagonal elements in bold are the square root of Average Variance Extracted (AVE).
Source: our elaboration
The structural model presents a good overall fit. The significant Satorra and Bentler chi-square χ2
(SB)(226)= 551.576, p < 0.00, and the
Elisa Martinelli Francesca De CanioCountry image dimensions and retail brand equity. A multi-cue analysis

sinergieitalian journal of management Vol. 39, Issue 2, 2021
28
significant Close-Fit RMSEA (RMSEA=0.0649, p-value= 0.0002) showing the possibility that the model does not mirror the pattern of covariance contained within the raw data, are compensating by a good value for the chi-square ratio χ2
(SB)/df (2.441). Two other indicators are used to assess the goodness of the model fit. The Bentler and Bonnet index (Normed Fit Index, NFI = 0.950) is considered acceptable as it is closer to the 0.90 value suggested by Byrne (2013). Moreover, the standardized root mean square residual (SRMR= 0.0480), lower than the cut-off of 0.05 posed by Byrne (2013), confirms the acceptable model fit, indicating a low value for the root mean square discrepancy between the observed correlations and the model-implied correlations.
5. Findings
The structural model shows an interesting predictive power in explaining retail brand equity (R2
(RBE)=0.449).Results of the paths between constructs, presented in Figure 2, show
that retail brand awareness and retail brand image positively influence retail brand equity confirming the first two hypotheses (RBARBE: β=0.342, t-value=6.098; RBIRBE: β=0.415, t-value=5.044). In particular, the retail brand image shows the strongest effect. The country image dimensions (i.e. cognitive and affective) show both a significant effect on retail brand equity. Nevertheless, while the affective country image positively influences retail brand equity - in line with our fifth hypothesis (ACIRBE: β=0.132, t-value=2.651), that it is consequently verified - the cognitive dimension of country image reports an opposite effect, negatively influencing retail brand equity, partially disconfirming our fourth hypothesis (CCIRBE: β=-0.158, t-value=3.009). Finally, no significant effect is found between retail perceived value and retail brand equity; accordingly, the third hypothesis is rejected. None of the control variables included in the model (i.e. age and sex) showed a significant effect on RBE.
Fig. 2: The measurement model
Source: our elaboration
Retail BrandAwareness
Retail BrandImage
Retail Perceived
Value
Retail Brand EquityR2=0.449
Cognitive Country Image
Affective Country Image
Note: ***p<0.01** P<0.05
*p<0.10
Age
Sex

29
6. Discussion
Findings evidenced that all the postulated relationships underpinning our structural model were verified, apart from the effect of retail perceived value that did not result as significant, differently from previous studies (Martinelli and De Canio, 2018). Retail brand image and retail brand awareness emerged as exerting the strongest effects in generating value to the retail brand, confirming the solid role of these factors in driving RBE, even when the retail corporate brand - and not the store brand - is involved. In this way, our study extends the main RBE results (Hartman and Spiro, 2005; Gil-Saura et al., 2013; Yoo et al., 2000) to an upper level, enlarging the scientific knowledge on the subject, in accordance with the most recent ongoing debate in this area (Swoboda et al., 2016). In addition, this work is the first to assess the role of country image in impacting RBE, opening up to new opportunities in extending the international marketing knowledge on the role of country image in a consumer-based perspective when services are involved. From this viewpoint, our findings focused on retailing, extending our empirical understanding: till now it has been mainly confined to other service sectors such as banking, airlines, insurance (Pecotich et al., 1996; Berentzen et al., 2008) and restaurants (Martinelli and De Canio, 2019). Moreover, as expected, country image directly affects brand equity confirming extant literature results (Buil et al., 2008; Pappu et al., 2006, 2007; Shocker et al., 1994; Thakor and Katsanis, 1997; Yasin et al., 2007). Both country image dimensions (i.e. cognitive and affective) show a significant effect on retail brand equity, but in unexpected ways. While the cognitive image of the country of origin of a retailer exerts a negative effect, affective country image impacts in a positive way. The former result has the effect of reducing the value that the consumer associates with the retail brand. Into this perspective, our findings are in line with some studies proving that origin effect can also negatively influence an individual’s attitude toward products or brands (Chu et al., 2010; Dakin and Carter, 2010). On the contrary, the affective side of a brand’s origin positively impacts RBE. To this concern, we have to remember that Laroche et al. (2005) evidenced that when the country image is mainly based on affect, its influence on product evaluation will be greater than its influence on product beliefs (attitude). This could be an explanation of the smaller effect exerted by ACI compared to the traditional RBE antecedents.
The results that emerged in this study are also useful from a managerial viewpoint. Managers of grocery retailing brands and professionals who deal with the sector must understand that RBE is clearly perceived by consumers and is a construct associated with the retail corporate level, which serves as an important intangible asset (Jinfeng and Zhilong, 2009). RBE is a key factor able to develop customer loyalty to the retailer (Martinelli and De Canio, 2018) and to enhance market share, financial performance and shareholder value (Keller, 1993; Londoño et al., 2017; Swoboda et al., 2013, 2016). However, a few are the retailers who have developed specific retail brand management departments in their headquarters, supported by adequate resources and competencies. The attention at the branding level is strongly placed on private labels, when instead our results suggest that
Elisa Martinelli Francesca De CanioCountry image dimensions and retail brand equity. A multi-cue analysis

sinergieitalian journal of management Vol. 39, Issue 2, 2021
30
this logic should be integrated into wider branding policies articulated on several levels, where the attention should be placed, above all, at the corporate level. Apart from this general requirement, the investigated German discounter is pursuing a positioning strategy aimed at supporting as much as possible its association with Italy; this is demonstrated by the creation of dedicated private labels, whose naming immediately leads to Italy; from the creation of a dedicated logo reporting Italian signs (e.g. the colors of the Italian flag; the football passion of Italians, etc.); by the commitment to have most of its products sourced from Italian suppliers. Despite this strategy, only 1.5% of the respondents associated the discounter brand with Italy, and the results emerged from the structural model show that the association with Germany in a cognitive way tends to reduce the value of the brand for Italian people. As this strategy is used in many other countries in which the discounter operates, maybe its rethinking would be worthwhile as it looks not advantageous for the brand to disguise its country of origin, as local people are aware of it. The company’s management should instead invest in boosting its brand image and persist in increasing its brand awareness. From this point of view, the discounter should continue to invest in TV advertising but also on social media in order to increase consumer confidence and its overall image. Stressing the trustworthy and hard-working side of German people in the communication messages rather than the country functional features would help in boosting retail brand equity.
To conclude, the results that emerged from our study might be useful to international retailers in general and to discounters in particular: they would better understand the factors to manage to leverage their brand equity between consumers.
7. Conclusions
This study contributes to the international marketing and retailing literature giving evidence that the country of origin influences brand equity not only when a manufacturing brand is concerned, but also whenever a retail brand is investigated. Moreover, our findings are particularly interesting for two main reasons: first, the dimensions of country image - affective and cognitive - do not exert the same effect on retail brand equity; second, the multi-cue approach here adopted can further our understanding of the antecedents of RBE when retailers are fulfilling an international development. The latter is a unique perspective in current literature.
Despite the contributions made by this work, a number of limitations are present, opening up for further studies on the topic.
First of all, the research focused on a single retail brand operating in the discount segment. A replication of the empirical analysis on grocery retail multiples (i.e. Carrefour) could improve our understanding and reinforce or differentiate our findings. This paves the way to another possible development of our work: repeating the research on retailers coming from different countries - that is: with a different origin - can rend more
31
robust the findings and can also bring to perform a multigroup analysis. Understanding if the effect of affective and cognitive CI is confirmed even when retailers with different origins are compared would consist in a substantial contribution to the topic.
Second, the study was performed on Italian customers. As the role of national culture was found to influence retail patronage and image (Kan et al., 2015), conducting a comparative work in other national contexts can lead scholars to catch cross-country cultural differences, helping international retailers to better deal with them.
Finally, the study although controlling for the respondents’ sex and age, did not include any mediating or moderating variables, even if we consider the shopping responsibility and the level of brand knowledge in selecting the sample investigated. In the next studies, it might be useful to control for further socio-demographics data regarding the respondents and consider factors such as the level of ethnocentrism and/or fit as moderators in order to get a more comprehensive understanding of consumer-based brand equity when international retailing takes place. Moreover, a more complex and articulated model where RBE can act as a mediator of the retailer’s performance, for instance, can strengthen the theoretical scope of the study and boost managerial implications.
References
AAKER D.A. (1991), Managing Brand Equity, The Free Press, New York. AHMED S.A., ASTOUS A.D. (1996), “Country-of-origin and brand effects: a
multidimensional and multi-attribute study”, Journal of International Consumer Marketing, vol. 9, n. 2, pp. 93-115.
AHMED Z.U., JOHNSON J.P., LING C.P., FANG T.W., HUI A.K. (2002), Country-of-origin and brand effects on consumers’ evaluations of cruise lines”, International Marketing Review, vol. 19, n. 3, pp. 279-302.
AILAWADI K., KELLER K.L. (2004), “Understanding retail branding: conceptual insights and research priorities”, Journal of Retailing, vol. 80, n. 4, pp. 331-342.
ANDÉHN M., NORDIN F., NILSSON M.E. (2016), “Facets of country image and brand equity: Revisiting the role of product categories in country of origin effect research”, Journal of Consumer Behaviour, vol. 15, n. 3, pp. 225-38.
ANDERSON JC., GERBING DW. (1988), “Structural Equation Modeling in Practice: A Review and Recommended Two-Step Approach”, Psychological Bulletin, vol. 103, n. 3, pp. 411-23.
ANSELMSSON J., BURT S., TUNCA B. (2017), “An integrated retailer image and brand equity framework: Re-examining, extending, and restructuring retailer brand equity”, Journal of Retailing and Consumer Services, vol. 38, pp. 194-203.
BALBONI B., GRAPPI S., MARTINELLI E., VIGNOLA M. (2011), “L’impatto del Made in Italy sul comportamento d’acquisto dei consumatori cinesi”, Micro and Macro Marketing, n. 3, pp. 445-62.
BERENTZEN J.B., BACKHAUS C., MICHAELIS M., BLUT M., AHLERT D. (2008), “Does “made in…” also apply to services? An empirical assessment of the country-of-origin effect in service settings”, Journal of Relationship Marketing, vol. 7, n. 4, pp. 391-405.
Elisa Martinelli Francesca De CanioCountry image dimensions and retail brand equity. A multi-cue analysis

BILKEY W.J., NES E. (1982), “Country-of-origin effects on product evaluations”, Journal of International Business Studies, vol. 13, n. 1, pp. 89-99.
BLOEMER J., BRIJS K., KASPER H. (2009), “The CoO-ELM model-a theoretical framework for the cognitive processes underlying country of origin-effects”, European Journal of Marketing, vol. 43, n. 1/2, pp. 62-89.
BUIL I., DE CHERNATONY L., MARTINEZ E. (2008), “A cross-national validation of the consumer-based brand equity scale”, Journal of Product and Brand Management, vol. 17, n. 6, pp. 384-392.
BUIL I., MARTÍNEZ E., DE CHERNATONY L. (2013), “The influence of brand equity on consumer responses”, Journal of Consumer Marketing, vol. 30, n. 1, pp. 62-74.
BURT S., DAVIES K. (2010), “From the retail brand to the retail-er as a brand: themes and issues in retail branding research”, International Journal of Retail and Distribution Management, vol. 38, n. 11/12, pp. 865-78.
BURT S., JOHANSSON U., DAWSON J. (2016), “International retailing as embedded business models”, Journal of Economic Geography, vol. 16, n. 3, pp. 715-47.
BYRNE B.M. (2013), Structural equation modeling with EQS: Basic concepts, applications, and programming, Routledge, London.
CHAO P. (1993, “Partitioning country of origin effects: consumer evaluations of a hybrid product”, Journal of International Business Studies, vol. 24, n. 2, pp. 291-306.
CHU P.Y., CHANG C.C., CHEN C.Y., WANG T.Y. (2010), “Countering negative country-of-origin effects: the role of evaluation mode”, European Journal of Marketing, vol. 44, n. 7/8, pp. 1055-76.
CHRISTODOULIDES G., CADOGAN J.W., VELOUTSOU C. (2015), “Consumer-based brand equity measurement: lessons learned from an international study”, International Marketing Review, vol. 32, n. 3/4, pp. 307-328.
DAKIN J.A., CARTER S. (2010), “Negative image: developing countries and country of origin-an example from Zimbabwe”, International Journal of Economics and Business Research, vol. 2, n. 3, pp. 166-86.
DAS G., DATTA B., GUIN K.K. (2012), “Impact of retailer personality on consumer-based retailer equity: An empirical study of retail brands”, Asia Pacific Journal of Marketing and Logistics, vol. 24, n. 4, pp. 619-39.
DE MOOIJ M., HOFSTEDE G. (2002), “Convergence and divergence in consumer behavior: implications for international retailing”, Journal of Retailing, vol. 78, n. 1, pp. 61-9.
DE VAUS D.A. (2002), Analyzing Social Science Data: 50 Key Problems in Data Analysis, Sage Publications, London.
FORNELL C., LARCKER D.F. (1981), “Evaluating structural equation models with unobservable variables and measurement error”, Journal of Marketing Research, vol. 18, n. 1, pp. 39-50.
GIL-SAURA I., RUIZ-MOLINA M.E., MICHEL G., CORRALIZA-ZAPATA A. (2013), “Retail brand equity: a model based on its dimensions and effects”, The International Review of Retail, Distribution and Consumer Research, vol. 23, n. 2, pp. 111-36.
HAN C.M. (1989), “Country image: halo or summary construct?”, Journal of Marketing Research, vol. 26, pp. 222-9.
sinergieitalian journal of management Vol. 39, Issue 2, 2021
32

33
HARTMAN K.B., SPIRO R.L. (2005), “Recapturing store image in customer-based store equity: a construct conceptualization”, Journal of Business Research, vol. 58, n. 8, pp. 1112-20.
HESLOP L.A., PAPADOPOULOS N. (1993), “But Who Knows Where or When? reflections on the images of countries and their products”, In Papadopoulos N., Heslop L.A. (Eds.), Product-country images: impact and role in international marketing, International Business Press, New York, pp. 39-75.
HSIEH M.H., PAN S.L., SETIONO R. (2004), “Product-, corporate-, and country-image dimensions and purchase behavior: a multicountry analysis”, Journal of the Academy of Marketing Science, vol. 32, n. 3, pp. 251-70.
HU L.T., BENTLER P.M. (1999), “Cutoff criteria for fit indexes in covariance structure analysis: Conventional criteria versus new alternatives”, Structural Equation Modeling: A Multidisciplinary Journal, vol. 6, n. 1, pp. 1-55.
JARA M., CLIQUET G. (2012), “Retail brand equity: Conceptualization and measurement”, Journal of Retailing and Consumer Services, vol. 19, n. 1, pp. 140-9.
JAVALGI R.G., CUTLER B.D., WINANS W.A. (2001), “At your service! Does country of origin research apply to services?”, Journal of Services Marketing, vol. 15, n. 7, pp. 565-582.
JINFENG W., ZHILONG T. (2009), “The impact of selected store image dimensions on retailer equity: evidence from 10 Chinese hypermarkets”, Journal of Retailing and Consumer Services, vol. 16, n. 6, pp. 486-94.
JOHANSSON J.K. (1989), “Determinants and effects of the use of ‘made in’ labels”, International Marketing Review, vol. 6, n. 1, pp. 47-58.
JOHANSSON J.K., DOUGLAS S.P., NONAKA, I. (1985), “Assessing the impact of country-of-origin on product evaluations: a new methodological perspective”, Journal of Marketing Research, vol. 22, pp. 388-96.
JOSIASSEN A., HARZING A.W. (2008), “Comment: descending from the ivory tower: reflections on the relevance and future of country-of- origin research”, European Management Review, vol. 5, n. 4, pp. 264-70.
KAN G., CLIQUET G., PUELLES GALLO M. (2014), “The effect of country image on hypermarket patronage intention: A cross-cultural study in China and Spain”, International Journal of Retail and Distribution Management, vol. 42, n. 2, pp. 106-130.
KELLER K.L. (1993), “Conceptualizing, Measuring, and Managing Customer-Based Brand Equity”, Journal of Marketing, vol. 57, n. 1, pp. 1-22.
KLEIN J.G., ETTENSON R., MORRIS M.D. (1998), “The animosity model of foreign product purchase: an empirical test in the People’s Republic of China”, Journal of Marketing, vol. 62, n. 1, pp. 89-101.
KNIGHT G.A., CALANTONE R.J. (2000), “A flexible model of consumer country-of-origin perceptions: a cross-cultural investigation”, International Marketing Review, vol. 17, n. 2, pp. 127-45.
KOTLER P., GERTNER D. (2002), “Country as brand, product, and beyond: A place marketing and brand management perspective”, Journal of Brand Management, vol. 9, n. 4, pp. 249-61.
KREMER F., VIOT C. (2012), “How Store Brands Build Retailer Brand Image”, International Journal of Retail and Distribution Management, vol. 40, n. 7, pp. 528-43.
Elisa Martinelli Francesca De CanioCountry image dimensions and retail brand equity. A multi-cue analysis

34
sinergieitalian journal of management Vol. 39, Issue 2, 2021
LAROCHE M., PAPADOPOULOS N., HESLOP L.A., MOURALI M. (2005), “The influence of country image structure on consumer evaluations of foreign products”, International Marketing Review, vol. 22, n. 1, pp. 96-115.
LASSAR W., MITAL B., SHARMA A. (1995), “Measuring customer-based brand equity”, Journal of Consumer Marketing, vol. 12, n. 4, pp. 11-19.
LONDOÑO J.C., ELMS J., DAVIES K. (2016), “Conceptualising and measuring consumer-based brand-retailer-channel equity”, Journal of Retailing and Consumer Services, vol. 29, pp. 70-81.
LONDOÑO J.C., ELMS J., DAVIES K. (2017), “A commentary on “conceptualising and measuring consumer-based brand-retailer-channel equity”: A review and response”, Journal of Retailing and Consumer Services, vol. 37, pp. 31-32.
MAGNUSSON P., WESTJOHN S., ZDRAVKOVIC S. (2011), “What? I thought Samsung was Japanese”: accurate or not, perceived country of origin matters”, International Marketing Review, Vol. 28, n. 5, pp. 454-72.
MARINO V., MAINOLFI G. (2013), Country brand management, EGEA, Milano. MARINO V., MAINOLFI G. (2010), “Valutazione e analisi del processo di country
branding. La percezione del capitale reputazionale dell'Italia nel mercato cinese”, Mercati e Competitività, n. 4. pp. 65-83.
MARTIN I.M., EROGLU S. (1993), “Measuring a multi-dimensional construct: Country image”, Journal of Business Research, vol. 28, n. 3, pp. 191-210.
MARTINELLI E., DE CANIO F. (2018), “Retail Brand Equity: un’analisi customer-based”, Micro and Macro Marketing, n. 3, pp. 397-416.
MARTINELLI E., DE CANIO F. (2019), “Eating in an Italian restaurant. The role of Country Image in driving Spanish customers attitude and intention to patronize an ethnic restaurant”, Mercati e Competitività, n. 2, pp. 83-104.
MORSCHETT D., SWOBODA B., FOSCHT T. (2005), “Perception of store attributes and overall attitude towards grocery retailers: The role of shopping motives”, The International Review of Retail, Distribution and Consumer Research, vol. 15, n. 4, pp. 423-47.
NAGASHIMA A. (1970), “A comparison of Japanese and US attitudes toward foreign products”, Journal of Marketing, vol. 34, n. 1, pp. 68-74.
NEBENZAHL I.D., JAFFE E.D., USUNIER J.C. (2003), “Personifying country of origin research”, Management International Review, vol. 43, n. 4, pp. 383-406.
PAPADOPOULOS, N. (1993), “What product and country images are and are not”, in Papadopoulos N., Heslop L. (Eds), Product Country Images: Impact and Role in International Marketing, International Business Press, New York, NY, pp. 3-38.
PAPADOPOULOS N., HESLOP L.A. (2002), “Country equity and country branding: problems and prospects”, Journal of Brand Management, vol. 9, n. 4-5, pp. 294-314.
PAPADOPOULOS N., HESLOP L.A., BAMOSSY, G. (1990), “A comparative image analysis of domestic versus imported products”, International Journal of Research in Marketing, vol. 16, n. 7, pp. 283-94.
PAPPU R., QUESTER P. (2006), “A consumer-based method for retailer equity measurement: Results of an empirical study”, Journal of Retailing and Consumer Services, vol. 13, n. 5, pp. 317-29.
PAPPU R., QUESTER P. (2010), “Country equity: Conceptualization and empirical evidence”, International Business Review, vol. 19, n. 3, pp. 276-291.

35
PAPPU R., QUESTER P.G., COOKSEY R.W. (2007), “Country image and consumer-based brand equity: relationships and implications for international marketing”, Journal of International Business Studies, vol. 38, n. 5, pp- 726-45.
PARAMESWARAN R., YAPRAK A. (1987) “A cross-national comparison of consumer research measures”, Journal of International Business Studies, vol. 18, n. 1, pp. 35-49.
PECOTICH A., PRESSLEY M., ROTH D. (1996), “The impact of country of origin in the retail service context”, Journal of Retailing and Consumer Services, vol. 3, n. 4, pp. 213-224.
PHARR J.M. (2005), “Synthesizing country-of-origin research from the last decade: is the concept still salient in an era of global brands?”, Journal of Marketing Theory and Practice, vol. 13, n. 4, pp. 34-45.
RASHMI, DANGI H. (2016), “Act like a retailer, Think like a Brand: An overview of retailer brand equity and agenda for future research in Indian context”, Asia-Pacific Journal of Management Research and Innovation, vol. 12, n.1, pp. 67-84.
ROTH K.P., DIAMANTOPOULOS A. (2009), “Advancing the country image construct”, Journal of Business Research, vol. 62, n. 7, pp. 726-40.
ROTH M.S., ROMEO J.B. (1992), “Matching product category and country image perceptions: A framework for managing country-of-origin effects”, Journal of International Business Studies, vol. 23, n. 3, pp. 477-97.
SAMIEE S. (2010), “Advancing the country image construct-a commentary essay”, Journal of Business Research, vol. 63, n. 4, pp. 442-5.
SAMIEE S., SHIMP T.A., SHARMA S. (2005), “Brand origin recognition accuracy: its antecedents and consumers’ cognitive limitations”, Journal of International Business Studies, vol. 36, n. 4, pp. 379-97.
SHOCKER A.D., SRIVASTAVA R.K. AND RUEKERT R.W. (1994), “Challenges and opportunities facing brand management: an introduction to the special issue”, Journal of Marketing Research, vol. 31, n. 2, pp. 149-58.
SWEENEY J.C., SOUTAR G.N., JOHNSON, L.W. (1997), “Retail service quality and perceived value: A comparison of two models”, Journal of Retailing and Consumer Services, vol. 4, n. 1, pp. 39-48.
SWOBODA B., BERG B., SCHRAMM-KLEIN H., FOSCHT T. (2013), “The importance of retail brand equity and store accessibility for store loyalty in local competition”, Journal of Retailing and Consumer Services, vol. 20, n. 3, pp. 251-62.
SWOBODA B., HAELSIG F., SCHRAMM-KLEIN H., MORSCHETT D. (2009), “Moderating role of involvement in building a retail brand”, International Journal of Retail & Distribution Management, vol. 37, n. 11, pp. 952-74.
SWOBODA B., WEINDEL J., HÄLSIG F. (2016), “Predictors and effects of retail brand equity-A cross-sectoral analysis”, Journal of Retailing and Consumer Services, vol. 31, pp. 265-76.
THAKOR M.V.. KATSANIS L.P. (1997), “A model of brand and country effects on quality dimensions: issues and implications”, Journal of International Consumer Marketing, vol. 9, n. 3, pp. 79-100.
THAKOR M.V., KOHLI C.S. (1996), “Brand origin: conceptualization and review”, Journal of Consumer Marketing, vol. 13, n. 3, pp. 27-42.
Elisa Martinelli Francesca De CanioCountry image dimensions and retail brand equity. A multi-cue analysis

36
sinergieitalian journal of management Vol. 39, Issue 2, 2021
36
THAKOR V.M., LAVACK A.M. (2003), “Effect of perceived brand origin associations on consumer perceptions of quality”, Journal of Product and Brand Management, vol. 12, n. 6, pp. 394-407.
USUNIER J.C. (2006), “Relevance in business research: the case of country-of-origin research in marketing”, European Management Review, vol. 3, n. 1, pp. 60-73.
USUNIER J.C. (2011), “The shift from manufacturing to brand origin: suggestions for improving COO relevance”, International Marketing Review, vol. 28, n. 5, pp. 486-96.
YASIN M.N., NOOR N.M., MOHAMAD O. (2007), “Does image of country‐of‐origin matter to brand equity?”, Journal of Product and Brand Management, vol. 16, n. 1, pp. 38-48.
YOO B., DONTHU N. (2001), “Developing and Validating a Multidimensional Consumer-Based Brand Equity Scale”, Journal of Business Research, vol. 52, n. 1, pp. 1-14.
YOO B., DONTHU N., LEE S. (2000), “An examination of selected marketing mix elements and brand equity”, Journal of the Academy of Marketing Science, vol. 28, n. 2, pp. 195-211.
VERLEGH P.W.J., STEENKAMP J.B.E.M. (1999), “A review and meta-analysis of country of origin research”, Journal of Economic Psychology, vol. 20, n. 5, pp. 521-46.
VILLANUEVA L., PAPADOPOULOS N. (2003), “Toward a model of consumer receptivity of foreign and domestic products”, Journal of International Consumer Marketing, vol. 15, n. 3, pp. 101-26.
WEINDEL J.K. (2016), Retail Brand Equity and Loyalty: Analysis in the Context of Sector-Specific Antecedents, Perceived Value, and Multichannel Retailing, Springer.
ZEITHAML V.A. (1988), “Consumer perceptions of price, quality, and value: a means-end model and synthesis of evidence”, Journal of Marketing, vol. 52, n. 3, pp. 2-22.
Academic or professional position and contacts
Elisa Martinelli Associate Professor of Management University of Modena and Reggio Emilia - Italye-mail: [email protected]
Francesca De Canio Research fellow of Management University of Modena and Reggio Emiliae-mail: [email protected]
sinergieitalian journal of management
ISSN 0393-5108 DOI 10.7433/s115.2021.02
pp. 17-36

37
Received21st February 2020
Revised 25th May 2020
Accepted 11th May 2021
The impact of sustainability orientation on firm propensity to ally1
Stefano Romito - Angeloantonio Russo - Clodia Vurro
Abstract
Purpose of the paper: The aim of this paper is to analyse the effect of firm sustainability orientation, defined as the overall proactive strategic stance of firms toward the integration of environmental and social concerns and practices into their strategic and operational activities, on its propensity of making alliances.
Methodology: We validate our arguments using panel data on 10.509 unique firm-year observations over the period 2003-2017.
Findings: We find support for our baseline hypothesis: sustainability orientation has a positive impact on alliance formation. Additionally, we find that the hypothesized relationship is stronger for firms with lower expected value creation and for those that operate in opaque contexts.
Research limits: Our work represents an initial attempt to investigate the role of firm sustainability orientation in explaining firm alliance propensity. In so doing, we adopted a firm level perspective assuming alliance counterparts to be homogeneous, which represents the main limitation of this study. Other limitations, as well as topics for future research are discussed in the last section.
Practical implications: Our arguments and findings emphasize the critical role played by the way in which the firm manages the network of relationships in which it is embedded, in addition to the considerations about the type of relationship a firm owns that have been widely analysed. In particular, our study contributes to obtain a deeper understanding of the benefits of a stakeholder-oriented approach, which remains fundamental to encourage managers to adopt stakeholder theory practices in their behaviour.
Originality of the paper: To the best of our knowledge, this study represents the first attempt to study the relationship between firm sustainability orientation and its alliance propensity.
Key words: sustainability orientation; alliance formation; stakeholder management
1. Introduction
While many firms rush to jump on the bandwagon of strategic alliances to leverage complementarities or defray costs, only few succeed to achieve expected outcomes. Limited attractiveness because of perceived exchange related risks (Hitt et al., 2000; Russo et al., 2019) and inadequate alliance management capabilities (Wang and Rajagopalan, 2015) are among the
1 The authors equally contributed to the design and implementation of the research, to the analysis of the results and to the writing of the manuscript, and are listed in alphabetical order.

sinergieitalian journal of management Vol. 39, Issue 2, 2021
38
key reasons that derail firms from alliance formation. Indeed, research and practice have long investigated how the development of valuable resources (Lavie and Rosenkopf, 2006), the availability of information on prospective partners (Luo, 2007), and the active engagement in activities that stimulate partnering skills (Zollo et al., 2002) can support firms in the decision to ally.
In the mainframe of what drives firm’s attractiveness as an alliance partner, the role of sustainability orientation, defined as the overall proactive strategic stance of firms towards the integration of environmental and social concerns and practices into their strategic and operational activities (Roxas and Coetzer, 2012), has been mostly neglected. Previous research has largely documented that sustainability orientation is an important driver for the development of innovative capabilities that could easily attract a prospective partner (Carayannopoulos and Auster, 2010). Moreover, the long term attitude of sustainability oriented firms act as a signal that increase their perceived trustworthiness (Parmar et al., 2010). Similarly, the increased availability of information, both directly disclosed and sourced from third parties, about sustainability oriented firms reduces opacity, which, in turn, mitigates the perceived risk of adverse selection (Cho et al., 2013; Cui et al., 2018). Finally, sustainability-oriented firms develop collaborative capabilities with stakeholders that predispose them to cope with situations of higher risk of moral hazard (Russo et al., 2018). Taken together these arguments support the need for further research on the existence of a positive effect of firm sustainability orientation on alliance formation.
Heeding the call for a deeper understanding of what drives the choice of an alliance partner and building on recent advancements on the relevance and role of sustainability orientation (Cheng, 2020; Eccles et al., 2014), we aim at advancing this stream of research by submitting that sustainability-oriented firms are also different in terms of attractiveness as an alliance partner and ability to form and mange strategic alliances, resulting in a greater propensity to ally. We test our hypotheses using a comprehensive panel dataset of 10.509 unique firm-year observations drawn from US-listed firms over the period from 2003 to 2017. We find support for the notion that sustainability orientation significantly increases the propensity of a firm to form strategic alliances. Moreover, we find evidence that the positive effect of a firm sustainability orientation on its alliance propensity is stronger only for those firms that show characteristics that are commonly associated to a lower attractiveness (i.e., when the financial market does not acknowledge a high potential for value creation and when the risk related to adverse selection is higher because of increased opacity).
The reminder of the paper is structured as it follows. First, earlier research focused on the reasons that derail firms from forming alliances and on the different factors that can support firms in overcoming obstacles is recapitulated. Second, the theoretical framework and hypotheses are developed. These sections are followed by the empirical analysis. Finally, the findings and contributions are discussed, as well as the limitations of the paper.

39
Stefano Romito Angeloantonio Russo Clodia VurroThe impact of sustainability orientation on firm propensity to ally
2. Literature review and hypotheses
Firms participate in strategic alliances for various reasons (Gulati and Singh, 1998). They might engage in collaborative relationships for developing knowledge, experimenting with assets on an arm’s length basis, preserving limited resources and gaining access to markets (Dacin et al., 2007; Hitt et al., 2000). Despite motivations, firms are heterogeneous in their propensity to form alliances. In an attempt to explain such variety, theory has converged on two firm-specific perspectives.
The first perspective is related to the observation that some firms might be less attractive than others as an alliance partner. For instance, resource-based view (RBV) scholars focus on the role of the resources a firm owns as a predictor of its alliance propensity (Mowery et al., 1998). Accordingly, alliances are considered as means to get access to valuable resources which will generate a competitive advantage (Hitt et al., 2000). Thus, a firm that does not possess resources that can be leveraged to develop managerial skills and capabilities, generate new knowledge or build valuable relationships that might facilitate the counterpart’s access to a new markets (Russo and Vurro, 2010), will be considered less attractive as an alliance partner. Other scholars point to the risks associated to the alliance as a deterrent for its formation. In particular, strategic alliances are considered as risky means of corporate development because of exchange related hazards, which are connected to the asymmetry of information in assessing ex-ante firm resources and capabilities, and the risk of moral hazard, which is connected to the cost (or the impossibility) of monitoring a firm’s contribution to the alliance (Gulati and Higgins, 2003). Previous work has emphasized that, ceteris paribus, limited or incomplete information when assessing the value of inter-firm collaborations reduce a firm’s likelihood to attract potential partners for an alliance (Hoenig and Henkel, 2015). Similarly, it has been found that the lack of trust in the counterpart increases the cost associated with the monitoring of opportunistic behaviors of the parties involved in the alliance (Das and Teng, 1998), reducing firm attractiveness.
The second perspective is related to the observation that some firms might be less able than others in forming and managing alliances. In particular, extant research points to the lack of alliance capability as a key factor that negatively affect a firm’s propensity to ally (Wang and Rajagopalan, 2015). In fact, limited abilities to search, negotiate, manage, and terminate an alliance (Kale and Singh, 2007) are associated to a lower propensity of participating into an alliance. For instance, it has been observed that firms not endowed with this capability prefer alternative growth strategies, such as acquisitions or internal development (Villalonga and McGahan, 2005).
Several studies have investigated which factors could mitigate these negative effects. Some scholars have focused on the strategic decisions or on the investments that increase the resource endowment of a firm, which, in turn, might positively affect firm attractiveness as an alliance partner. For instance, it has been found that superior technological knowledge makes a firm more attractive as potential alliance partner, compared to firms with inferior technological knowledge (Ahuja, 2000). Similarly,

sinergieitalian journal of management Vol. 39, Issue 2, 2021
40
having resources that might enable a partner’s understanding of non-market environments or provide access to decision and opinion makers increases a firm’s attractiveness (Lin and Darnall, 2015). Other scholars focus on the aspects that might mitigate the relational risk. For instance, it has been found that the existence of specific inter-organizational ties, such as those with highly reputed business partners or suppliers increase the perceived trust in the firm (Luo, 2007). Similarly, firm status (Stuart, 2000), market identity (Russo et al., 2019), reputation (Stern et al., 2014), and investment to reduce its environmental impact (Norheim-Hansen, 2015) are considered as trust-enhancing mechanisms in the context of alliance formation.
By adopting a capability lens, research has also analyzed what contributes to the emergence of alliance-related skills (Wang and Rajagopalan, 2015). While a firm’s previous experience in collaborating via alliances has been identified as one of the most important antecedents of the emergence of this capability, scholars have recently examined the role played by the dedicated alliance function (Russo and Vurro, 2019). This function is an organizational unit that contributes to the codification of the knowledge relative to the alliances and manages the activities that have to be performed (Kale and Singh, 2007). Similarly, it has been observed the existence of a spillover effect on alliance capability from performing activities that show similar features to those of the alliance in terms of knowledge domains, managerial tasks or a/the counterpart’s characteristics (Zollo and Reuer, 2010).
2.1 Sustainability orientation and alliance propensity
Despite the vast amount of research aimed at identifying which factors may foster or impede a firm’s participation in alliances, we argue that a key neglected element that can also influence a firm attractiveness as an alliance partner, as well its ability to form and manage alliances, is a firm’s orientation towards sustainability. This orientation is rooted in the development of sustainability strategies consisting of the planning and implementation of corporate activities in response to social and environmental responsibilities. Accordingly, sustainability orientation implies a stronger involvement of stakeholders in the firm’s decision making processes and a greater attitude toward long-term value creation (Eccles et al., 2014). As a consequence, sustainability-oriented firms display a greater ability in understanding the stakeholders’ needs and expectations (Freeman et al., 2007), which in turn elicits the emergence of relations based on mutual trust (Bridoux and Stoelhorst, 2014) and an increased propensity in measuring and disclosing non-financial information (Cui et al., 2018). Indeed, firms with strong sustainability orientation have been observed to behave differently from others, in terms of the governance structure they adopt to take into account environmental and social issues (Eccles et al., 2014), especially in the context of corporate development activities such as acquisitions (Russo et al., 2018), or innovation (Cheng, 2020).

41
We wish to advance this stream of research by submitting that sustainability-oriented firms are also different in terms of attractiveness as an alliance partner, thus resulting in a higher propensity to ally. In particular, four main arguments point to a positive effect of firm orientation toward sustainability on in propensity of forming alliances. The first argument pertains the type and value of the resources and capabilities owned by a sustainability-oriented firms. In fact, sustainability orientation has been indicated as an important driver for the development of innovative capabilities within the firm. On the one hand, by engaging in sustainability firms, they are more aware of a wider set of need of their stakeholders, including social and economic ones (Adams et al., 2016). This results in an increased ability to interpret external stimuli and in the continuous search for solutions that will enable the firm to integrate the stakeholders’ needs in the development of product and services (Cheng, 2020). On the other hand, the long term attitude of sustainable firms elicits the creation of relationships based on principles of fairness and mutual trust, which, in turn promote the utilization and dissemination of knowledge within the stakeholder network (Jiang et al., 2019). In particular, the characteristics of the relationships and the continuous interactions between the parties promote the development of a shared perspective and a shared vocabularies between them, which are necessary elements for the transmission of tacit knowledge (Jones et al., 2018). Further, these resources and capabilities are difficult to be imitated by an outside actor because of the complexity and the causal ambiguity related to their formation. The intrinsic characteristics of these resources, such as the complexity in assessing them or the fragility associated to the fact that they have been generated and are embedded within the firm stakeholder network, might increase the likelihood that a potential counterpart will seek them through an alliance (Carayannopoulos and Auster, 2010).
The second argument is rooted in the observation that sustainability orientation might be perceived as a signal of trustworthiness by potential counterparts because of the long-term attitude and expected fairness which emerge from developing an attitude towards stakeholders (Eccles et al., 2014; Zander and Zander, 2005). In this sense, an higher level of sustainability orientation could represent a signal of trustworthiness for the firm possessing it, increasing its attractiveness to external audiences (Parmar et al., 2010). In addition, the firm’s sustainability orientation reflects its tendency to build and manage relationships according to the principles of fairness and reciprocal trust (Bridoux and Stoelhorst, 2014). This suggests that if a potential partner makes an “outside-in” analysis to assess the focal firm (i.e. interviewing suppliers, customers, former employees and other stakeholders to collect information) the stakeholders involved in this process will be more likely to provide them with positive feedbacks about the firm under assessment and about its management (Chen et al., 2018). These positive feedbacks, in turn, might positively influence the counterpart’s perception about the focal firm trustworthiness, smoothing the negotiation process and increasing the likelihood of alliance formation.
The third argument pertains to the effect of sustainability orientation on information asymmetry. Recent developments in CSR literature indicate
Stefano Romito Angeloantonio Russo Clodia VurroThe impact of sustainability orientation on firm propensity to ally

sinergieitalian journal of management Vol. 39, Issue 2, 2021
42
that firms with higher levels of sustainability orientation display lower level of information asymmetry, because of the higher propensity to disclose information about internal processes and outcomes, not only economic but also social and environmental (Cui et al., 2018). Furthermore, devoting attention toward sustainability has been associated to a better social evaluation (King, 2008), which can, in turn, influence a firm’s external visibility (Pollock et al., 2010) and the likelihood of it being covered by analysts (Bowers and Prato, 2018). Taken together, these studies indicate that firms with strong sustainability orientation would convey a larger amount of information to external audiences because of their tendency to be transparent and a higher likelihood to be covered by analysist and specialized press. Overall, the increased availability of information can reduce the efforts potential counterparts have made to identify and assess the quality of the firm (Ozmel et al., 2013), increasing its attractiveness as an alliance partner.
The fourth argument relates to the observation that sustainability orientation might increase firm ability to form and manage alliances by contributing to the emergence of alliance capability. It has been argued, in fact, that capabilities related to the development of a sustainability oriented approach, influence corporate development activities (Russo et al., 2018). In particular, it has been argued that the capabilities developed in assessing and managing social and environmental issues might be redeployed in the context of target selection or during the negotiation phase, supporting the focal firm in successfully managing these complex tasks. Similar considerations might apply in the case of alliances. Sustainability-oriented firms might have a higher propensity to form alliances as the capabilities they have developed in the interactions with stakeholders might facilitate the assessment of the counterpart’s resources. In addition, sustainability orientation might predispose these firms to cope with situations in which there are higher risks of moral hazard (Lorenzoni and Lipparini, 1999) as firms make extensive use of relational contracts to access internal and external resources (Gibbons and Henderson, 2012). These contracts are more generic and open-ended compared to formalized contracts, which imply a higher risk of moral hazard in the relationships of sustainability-oriented firms. This may be related to two aspects that influence the firm’s alliance propensity: first, it might indicate that sustainability-oriented firms are more prone to cope with situations surrounded by uncertainty and, second, it might signal that firms have developed a capability to manage cooperative relationships under uncertainty (Garcia‐Castro and Aguilera, 2015).
Taken together, these arguments point to a higher attractiveness of high sustainability-oriented firms, which depend on the resources owned, the lower perceived exchange hazards such as moral hazard and adverse selection, and stronger relational capabilities. These considerations will result in a higher likelihood of observing alliances that involve sustainability-oriented firms. Thus, we hypothesize:
Hypothesis 1: The more sustainability-oriented a firm is, the greater its tendency to form strategic alliances.

43
2.2 Boundary conditions and alternative mechanisms
In our baseline prediction we postulated that the sustainability orientation of firms will be positively associated to the likelihood of being involved in alliances, because they are more attractive, they will be perceived at lower risk of adverse selection, they will be considered as more trustworthy, and they will be more comfortable in collaborating. This effect could be mitigated under certain conditions, which posit the need for contextualization. We propose three conditions that have the potential to offset the positive impact of sustainability orientation on alliance formation.
The first mitigating factor we consider is the firm potential for value creation, which represents the external assessment of the value of the resources owned by a firm. The second factor relates to an important governance device external to the firm, i.e., the number of analysts covering a given company. The third, which is an important antecedent of the development of a firm ability to form and manage alliances, is the firm’s level of diversification. In the next sections, we discuss how these mechanisms provide useful boundary conditions to our baseline hypothesis about sustainability orientation and its effect on propensity to ally.
2.2.1 Firm potential value creation
Tobin’s Q is the measure of the market perception about a firm value creation. In particular, this measure represents the market assessment about the value of firm resources (Villalonga, 2004), such as its human capital (Vomberg et al., 2015), its technological knowledge (Bracker and Ramaya, 2011), or its ability to gain consensus from the market and the communities in which it operates (Dorobantu et al., 2017). This variable has often been considered as a proxy for firm value creation (see, for example, Garcia‐Castro and Francoeur, 2016; Huselid et al., 1997; Kim and Bettis, 2014). In this sense, the degree to which a firm has resources that contribute to value creation might increase its attractiveness as an alliance partner because partnering with that firm can provide higher pay-offs, being them in terms of knowledge creation or in terms of access to resources or to valuable partners (Dyer, 2000; Hitt et al., 2004; Jap, 1999).
This argument suggests that the higher the market assessment of firm value the higher the value attributed to firm resources. Thus, we expect the value creation potential to mitigate the value creation effect of firm sustainability orientation on alliance formation.
Hypothesis 2: Firm value creation potential weakens the positive influence of sustainability orientation on alliance propensity
2.2.2 Financial analyst coverage
Financial analysts are key for the correct functioning of financial markets. Given their extensive training in finance and industry-specific knowledge, financial analysts provide valuable information in the form of earnings forecasts and recommendations which are useful to investors,
Stefano Romito Angeloantonio Russo Clodia VurroThe impact of sustainability orientation on firm propensity to ally

sinergieitalian journal of management Vol. 39, Issue 2, 2021
44
and stakeholders more broadly, in order to assess the financial conditions and prospects of firms (Lang and Lundholm, 1996). Analyst coverage has been shown to alleviate informational frictions in financing policies, making firms better able to obtain external financing from equity markets (Chang et al., 2006). In addition, previous work has documented a positive correlation between the number of analysts following a firm and the likelihood to voluntarily disclosure financial information (Hutton, 2005). As such, the analysts covering a firm act both as information intermediaries and as stimuli for the firms’ transparency to the external markets as well as to potential partners.
In this context, we can expect the informational advantage that is associated to firms characterized by a high sustainability orientation to be upper bounded as the benefit deriving from increased information availability decreases marginally when the amount information that are available to an external audience reaches a certain threshold level. For instance, Pollock and Rindova (2003) found that the level of media coverage affect investors’ decisions at a diminishing rate because the information conveyed through, and thanks to, the relational bonds with stakeholders becomes increasingly redundant. Thus, we posit:
Hypothesis 3: Financial analysts’ coverage weakens the positive influence of sustainability orientation on alliance propensity.
2.2.3 Firm Diversification
The first strand of theoretical consideration pertains the firm diversification as a resource enhancing mechanism, which, in turn, might influence a firm’s propensity of making alliances (Krammer, 2016). Firms that span several knowledge domains develop superior coordinating routines and combinative capabilities that enable them to harness divergent knowledge streams within their boundaries (Kogut and Zander, 1992). The ability to manage internal diversity also enables the firm to handle and derive advantage from external diversity, i.e. the ability to engage with different types of external actors. Additionally, due to their ability to manage external diversity by engaging with different kinds of alliance partners (representing a potentially wide array of technologies and knowledge streams), firms that span different knowledge domains will be able to better predict and identify combinatorial opportunities that are novel and path-breaking, thereby enhancing the potential benefits that they can realize from knowledge-based alliances (Rosenkopf and Almeida, 2003). In this sense, diversified firms might have a higher ability to form and manage alliances as compared to firms that operate in a single sector.
Thus, we expect the firm diversification to mitigate the positive effect of firm sustainability orientation on alliance formation and hypothesize:
Hypothesis 4: Firm diversification weakens the positive influence of sustainability orientation on alliance propensity

45
3. Methodology
3.1 Sample selection and estimation procedure
We tested our hypothesis over a sample of US firms in the period 2003-2017. To build the dataset we initially collected data from the Thomson Reuters Asset4 database, one of the most comprehensive databases providing data on ESG (Environmental, Social and Governance) factors for over 7,000 public companies from 2002. Asset4 analysts collect data from several public sources such as annual reports, NGO websites, and stock exchange filings. The data collection process is designed to maximize data quality and comprises automated checks, independent audits, and managerial reviews (Eccles et al., 2014). Asset4 was preferred to other databases used in papers on stakeholder orientation such as the Kinder, Lydenberg, Domini & Co. (KLD) due to the detail and accuracy of the data which is ensured by rigorous processes of quality check and auditing. This choice follows recent trends in studies on CSR and inter-organizational relationships (Ioannou et al., 2016). The first step in the sampling process was identifying the 2,888 US firms whose ESG performance had been assessed by ASSET4. Second, the Thomson Reuters Securities Data Company (SDC) Platinum database was used to collect data on alliances realized by these companies in the period 1997-20017. This choice follows an established practice in the existing alliance literature (Lavie and Rosenkopf, 2006). Out of the 2,888 ASSET4 US firms, 1,270 have realized at least one alliance in the period 2003-2017, with a total number of 6,516 alliances. This data was used to compute the number of alliances carried out by each firm in each year between 2003 and 2017 and to identify in which years of the analysis period each firm carried out new alliances (if any). The third step in the sampling process was collecting data about control variables for each firm. This was done by using the Thomson Reuters Datastream database. Collected data was then merged with the stakeholder orientation data from ASSET4 and variables related to alliance activity computed based on SDC data. The 6-digit version of the CUSIP identifier was used throughout the entire sampling process as the linking field to merge the three different datasets and identify each firm. The risk of possible discrepancies in CUSIPs was minimized by using databases that all belong to Thomson Reuters (ASSET4, SDC, and Datastream) and should report the same CUSIP for each firm. In addition, manual checks were also performed to ensure accuracy. Finally, we retrieved information about industry concentration from the Hoberg-Philips data library. The final sample was reduced to 10,509 observations due to missing data in Datastream and in the Hoberg-Philips datasets.
To estimate the effect of firm sustainability orientation on the alliance propensity we ran population-averaged regression models and used a generalized estimating equation (GEE) to control for firm heterogeneity. Given the nature of our dependent variable, we used a negative binomial model. In each model, the independent and control variables were lagged by 1 year. This approach follows an established practice in alliance literature to mitigate reverse causality concerns (Russo et al., 2019).
Stefano Romito Angeloantonio Russo Clodia VurroThe impact of sustainability orientation on firm propensity to ally

sinergieitalian journal of management Vol. 39, Issue 2, 2021
46
3.2 Dependent Variable
The dependent variable is the propensity of a firm to form alliances, measured as the number of alliances formed by a firm in a given year (Rothaermel, 2001).
3.3 Explanatory Variables
Firm sustainability orientation. To operationalize firm sustainability orientation, we took the Environmental, Social and Governance (ESG) scores assigned by Asset4 to each firm included in the sample. These scores reflect firm decisions and investments aimed at reaching certain outcomes in terms of social impact, environmental footprint, transparency, and inclusiveness. Following previous research (see, for example, Cheng et al., 2014), we constructed the variable sustainability orientation as an equally weighted average of the environmental, social and governance (ESG) scores for the focal firm for every year in our dataset.
The second explanatory variable is firm value creation potential. To operationalize it, we adopted the firm Tobin’s Q which is the ratio of firm market value divided by the book value of its assets. This variable captures a firm’s market-based performance, as well as the growth opportunities a firm can access through an alliance or an acquisition of the firm (Deng et al., 2013).
The third explanatory variable is coverage by financial analysts. At firm level, we operationalized this variable as the number of analysts covering a firm in a given year. Since the I/B/E/S database reports quarterly data, we used the average of the four quarters’ figures to obtain a yearly score.
The fourth explanatory variable is firm diversification. To operationalize it, we counted the number of segments (SIC codes) in which the firm operates (Rothaermel, 2001).
3.4 Control Variables
Several firm-specific control variables were introduced in the analysis to mitigate concerns for potential heterogeneity at firm level in the tendency to form alliances. We controlled for firm size as previous research has shown its influence on the propensity to form alliances (Beckman et al., 2004). Following an established practice in the alliance literature, this was measured as the log of the number of the employees. We accounted for the effect of previous experiences with alliances using the number of alliances the firm conducted in the previous three years (Alliance experience) (Kale and Singh, 2007). We included firm financial solvency which indicates the financial resources available to support alliance activities, and can reveal organizational slack which in turn can influence its alliance propensity (Lavie and Rosenkopf, 2006; Vurro and Russo, 2009). We operationalized the variable as the debt-to-asset ratio, following previous papers on alliances.
We included the intangible asset ratio which might positively influence the attractiveness of a firm as a partner for alliances (Bizzi,

47
2017). We included a control for firm financial performance as it can also have an influence on alliance-related decisions, for instance by facilitating reinforcement of existing routines and discouraging alliance formation (Lavie and Rosenkopf, 2006). This was included as control through earnings per share (EPS). To account for potential heterogeneity based on experience, we included firm age as a control for the analysis, measured as the logarithm of the difference between the focal year and the year in which the firm was founded. Seventh, we included the intensity of competition within the focal firm industry to control for industry dynamics (Caves, 1998). In order to estimate the extent of competition faced by a given firm, we adopted the formulation of the Herfindahl-Hirschman concentration index (HHI) proposed by Hoberg and Phillips according to whom the strength of competition between a pair of firms can be inferred from the degree of similarity with which each describes its products in their annual statements (2010). More specifically, since US public firms are legally required to provide accurate and updated product description in their annual statements, the two scholars rely on a text-based analysis of such descriptions to compute a pairwise similarity matrix - i.e. a matrix of the pairwise similarity score for any two given firms in the sample. Based on the similarity scores, the two scholars construct a Text-Based Industry Classification (TNIC-3) with the same degree of coarseness2 as the SIC-3 and calculate the HHI index accordingly. Lastly, we controlled for industry effect using two-digit US Standard Industrial Classification codes (industry dummy variables), for temporal effects (year dummy variables). Table 1 reports the summary statistics and the pairwise correlations.
Tab. 1: Summary statistics and pairwise correlations
Variable Mean Std Dev 1 2 3 4 5 6
1 Alliance propensity 0.376 1.295
2 Alliance experience 0.218 1.805 0.642
3 Intangible Asset Ratio 0.225 0.212 0.041 0.013
4 Industry Competition 0.242 0.235 -0.006 -0.014 0.183
5 Age 0.365 1.040 0.050 0.054 0.035 0.202
6 Debt/Asset 0.266 0.212 -0.015 -0.021 0.149 0.003 0.010
7 Size 0.265 1.581 0.148 0.139 0.023 0.032 0.128 0.016
8 EPS 2.539 5.948 0.003 -0.002 0.006 -0.006 -0.002 0.003
9 Sustainability Orientation 0.066 0.997 0.170 0.178 -0.011 0.114 0.309 -0.055
10 Tobin’s Q 1.252 1.270 0.036 0.032 0.052 0.059 -0.072 -0.021
11 Analyst 0.572 1.152 0.240 0.216 0.105 -0.045 0.156 -0.051
12 Diversification 2.773 1.503 0.048 0.041 -0.053 0.066 0.253 -0.016
Variable 7 8 9 10 11
8 EPS 0.004
9 Sustainability Orientation 0.264 0.060
10 Tobin’s Q -0.015 -0.003 -0.037
11 Analyst 0.236 -0.006 0.219 0.063
12 Diversification 0.143 -0.003 0.206 -0.087 0.163 Source: Our elaboration
2 Coarseness refers to the likelihood that, choosing randomly two firms in the sample, these firms result related according to the proposed classification
Stefano Romito Angeloantonio Russo Clodia VurroThe impact of sustainability orientation on firm propensity to ally

sinergieitalian journal of management Vol. 39, Issue 2, 2021
48
4. Results
Table 2 reports the regression models used to test our hypothesis. Model 1 is the baseline model, including only control variables. Coefficient estimates for the control variables confirm results shown in previous research: alliance experience (p=0.000), firm size (p=0.000), and intangible asset ratio (p=0.000) are all positively correlated with the likelihood of entering into an alliance.
The coefficient estimate for the effect of firm sustainability orientation on the propensity to ally (Model 2) is positive and statistically significant, which provides support for hypothesis 1. In particular, an increase in the firm’s stakeholder orientation by one standard deviation is associated to a 1.7% increase in the alliance propensity (p=0.000).
Our second hypothesis submitted that the firm potential for value creation mitigates the positive effect of stakeholder orientation on the intensity of alliance activity. In Model 3 we report the coefficient associated to the interaction term between stakeholder orientation and Tobin’s Q which is negative and significant (p=0.000). This result supports hypothesis 2.
In the third hypothesis, we predicted that the number of financial analysts covering the firm might mitigate the positive effect of firm stakeholder orientation on alliance intensity. Results reported in Model 4 provide support for the hypothesis. In fact, the coefficient estimate for the interaction term is negative and significant (p=0.000).
Model 5 presents the results of the analyses aimed at testing hypothesis 5.
The interaction between sustainability orientation and firm diversification is positive and not statistically significant (p=0.378), which does not provide support for the mitigating effect of diversification.
Table 3 presents a set of additional analysis aimed at ensuring the robustness of our main result. In Model 6 we replicated the analyses using a random effect Poisson estimation.
In Model 7, we dichotomized the dependent variable and we estimated the effect of sustainability orientation on alliance likelihood using a random effect Logit estimation, including a control for the sector in which the firm operates (first 2 digits of the firm’s primary SIC codes). Results do not differ from those reported in Table 2, confirming our findings.

49
Tab. 2: Results of main analyses
GEE Negative Binomial EstimationModel 1 Model 2 Model 3 Model 4 Model 5
Alliance Experience 0.687*** 0.663*** 0.657*** 0.659*** 0.655***(0.014) (0.014) (0.014) (0.014) (0.014)
Intangible asset ratio 0.711*** 0.708*** 0.735*** 0.651*** 0.711***(0.118) (0.118) (0.119) (0.119) (0.117)
HHI -0.031 -0.033 -0.090 -0.047 -0.044(0.111) (0.110) (0.112) (0.111) (0.110)
Age 0.011 -0.039 -0.035 -0.040 -0.029(0.029) (0.030) (0.031) (0.031) (0.030)
Debt Asset -0.057 -0.044 0.025 -0.028 -0.026(0.118) (0.123) (0.122) (0.121) (0.121)
Size 0.037*** 0.018* 0.017 0.021* 0.014(0.012) (0.011) (0.011) (0.011) (0.011)
EPS -0.006 -0.012* -0.010 -0.014* -0.012*(0.005) (0.007) (0.007) (0.008) (0.007)
Sustainability Orientation 0.166*** 0.274*** 0.220*** 0.012(0.026) (0.033) (0.027) (0.051)
Tobin’s Q 0.031*(0.019)
Sustainability Orientation*Tobin’s Q -0.069***(0.017)
Analyst 0.059**
(0.024)
Sustainability Orientation*Analyst -0.088***
(0.017)
Diversification -0.060
(0.022)
Sustainability Orientation*Diversification -0.107
(0.22838)
Constant -1.926*** -1.794*** -1.825*** -1.918*** -1.634***
(0.125) (0.122) (0.124) (0.147) (0.134)
Year YES YES YES YES YES
Observations 10,509 10,509 10,339 10,509 10,509Number of firms 2,056 2,056 2,016 2,056 2,056Chi-Squared 3,131.06 3,217.11 3,192.59 3,244.24 3,241.46Prob > Chi Squared 0 0 0 0 0Robust standard errors in parentheses*** p<0.01, ** p<0.05, * p<0.1
Source: our elaboration
Stefano Romito Angeloantonio Russo Clodia VurroThe impact of sustainability orientation on firm propensity to ally

sinergieitalian journal of management Vol. 39, Issue 2, 2021
50
Tab. 3: Robustness tests
Model 6Random effect
Poisson
Model 7Random effect
LogitAlliance Experience 0.100** 2.475***
(0.051) (0.120)Intangible asset ratio 1.061*** 0.258
(0.174) (0.170)HHI -0.060 -0.340**
(0.169) (0.149)Age -0.119*** 0.058*
(0.042) (0.032)Debt Asset -0.086 0.027
(0.149) (0.156)Size 0.230*** 0.017
(0.082) (0.017)EPS -0.007 -0.005
(0.011) (0.009)Sustainability Orientation 0.249*** 0.073*
(0.064) (0.038)Constant -1.926*** -1.794***
(0.125) (0.122)Year YES YESSector NO YESObservations 10,509 10,509Number of firms 2,056 2,056Chi-Squared 3,131.06 3,217.11Prob > Chi Squared 0 0
Source: our elaboration
5. Discussion and conclusion
In this paper, we analyzed the influence of sustainability orientation on firm alliance propensity. Our results show that firm sustainability orientation positively influences its propensity to ally. We theorized that this relationship is attributable to the fact that sustainability-oriented firms are perceived as more attractive as an alliance partner, because of the resources they own and the lower relational risk they convey. Moreover, we predicted that these firms display a higher ability to form and manage alliances, because of the development of relational capabilities.
We showed that sustainability orientation particularly matters for firms that present characteristics that are commonly associated to lower attractiveness as an alliance partner. In particular, when the financial market does not acknowledge to the focal firm a potential for future value creation, the relational resources the firm has developed by collaborating with its stakeholders in the mainframe of corporate sustainability, still represent a source of valuable knowledge for potential partners. Further, in case of

51
limited external information to assess potential partners, the sustainability orientation is associated with a lower perceived risk of adverse selection.
By bridging literature on the drivers of partner selection in strategic alliances and sustainability orientation, this paper makes contributions to two distinct streams of research. First, we advance our understanding of the antecedents of alliance formation by introducing the role of sustainability orientation. We extend alliance research that has examined, through different theoretical lenses, the factors that affect firm attractiveness in the alliance context, by theorizing on how a firm sustainability orientation shapes firm propensity to ally. Our arguments and findings, therefore, emphasize the critical role played by the way in which the firm integrates sustainability into its strategic decision-making processes, in addition to the considerations about the role of entrepreneurial or market orientation emphasized in previous research. Second, we contribute to the corporate sustainability literature. In particular we advance existing knowledge on the relationship between sustainability orientation and corporate development activities (Cheng, 2020; Russo et al., 2018). Obtaining a deeper understanding of the benefits of a sustainability-oriented approach, in fact, remains fundamental to encourage managers to increase the integration of sustainability in their decision making. In the alliance context, as discussed in this paper, managers have several incentives to adopt a sustainability-oriented approach, as this approach can provide them with capabilities, routines and social capital which facilitate alliance formation, knowledge exchange and alliance management. More efforts are needed in this research area, since resulting insights could equip managers with a more profound knowledge of the mechanisms underlying alliance formation, partner selection and alliance management, improving their alliance capabilities and incentivizing them to adopt sustainability-oriented behavior.
Our work represents an initial attempt to investigate the role of firm sustainability orientation in explaining alliance propensity. In so doing, we adopted a firm level perspective assuming that the counterparts are homogeneous. Relaxing this assumption and analyzing the effect similarity\dissimilarity in partners sustainability orientation on alliance formation might contribute significantly to advance our understanding of the relation between stakeholder orientation and alliance behavior.
Additionally, future research should examine the potential effects of sustainability orientation on alliance performance, which have only been supposed. In fact, sustainability orientation is likely to have a relevant influence also on the management of alliances and, in turn, on their performance, as hypothesized in the previous section. This can happen, for instance, by influencing the development of firm capabilities and social capital, which can have an important impact on alliance management. Third, studies about the relationship between sustainability orientation and types of alliances might be integrated more deeply with concepts and theories from the exploration-exploitation alliance literature, like the balancing of exploration and exploitation across dimensions, time and organizational modes.
Stefano Romito Angeloantonio Russo Clodia VurroThe impact of sustainability orientation on firm propensity to ally

sinergieitalian journal of management Vol. 39, Issue 2, 2021
52
References
ADAMS R., JEANRENAUD S., BESSANT J., DENYER D., OVERY P. (2016), “Sustainability‐Oriented Innovation: A Systematic Review”, International Journal of Management Reviews, vol. 18, n. 2, pp. 180-205.
AHUJA G. (2000), “Collaboration Networks, Structural Holes and Innovation: A Longitudinal Study”, Administrative Science Quarterly, vol. 45, n. 3, pp. 425-455.
BECKMAN C.M., HAUNSCHILD P.R., PHILLIPS D.J. (2004), “Friends or Strangers? Firm-Specific Uncertainty, Market Uncertainty, and Network Partner Selection”, Organization Science, vol. 15, n. 3, pp. 259-275.
BIZZI L. (2017), “The Strategic Role of Financial Slack on Alliance Formation”, Management Decision, vol. 55, n. 2, pp. 383-399.
BOWERS A., PRATO M. (2018), “The Structural Origins of Unearned Status: How Arbitrary Changes in Categories Affect Status Position and Market Impact”, Administrative Science Quarterly, vol. 63, n. 3, pp. 668-699.
BRACKER K., RAMAYA K. (2011), “Examining the Impact of Research and Development Expenditures on Tobin’s Q”, Academy of Strategic Management Journal, vol. 10, pp. 63.
BRIDOUX F., STOELHORST J.W. (2014), “Microfoundations for Stakeholder Theory: Managing Stakeholders with Heterogeneous Motives”, Strategic Management Journal, vol. 35, n. 1, pp. 107-125.
CARAYANNOPOULOS S., AUSTER E.R. (2010), “External Knowledge Sourcing in Biotechnology through Acquisition Versus Alliance: A Kbv Approach”, Research Policy, vol. 39, n. 2, pp. 254-267.
CAVES R.E. (1998), “Industrial Organization and New Findings on the Turnover and Mobility of Firms”, Journal of Economic Literature, vol. 36, n. 4, pp. 1947-1982.
CHANG X., DASGUPTA S., HILARY G. (2006), “Analyst Coverage and Financing Decisions”, The Journal of Finance, vol. 61, n. 6, pp. 3009-3048.
CHEN Z., KALE P., HOSKISSON R.E. (2018), “Geographic Overlap and Acquisition Pairing”, Strategic Management Journal, vol. 39, n. 2, pp. 329-355.
CHENG B., IOANNOU I., SERAFEIM G. (2014), “Corporate Social Responsibility and Access to Finance”, Strategic Management Journal, vol. 35, n. 1, pp. 1-23.
CHENG C.C. (2020), “Sustainability Orientation, Green Supplier Involvement, and Green Innovation Performance: Evidence from Diversifying Green Entrants”, Journal of Business Ethics, vol. 161, n. 2, pp. 393-414.
CHO S.Y., LEE C., PFEIFFER JR R.J. (2013), “Corporate Social Responsibility Performance and Information Asymmetry”, Journal of Accounting and Public Policy, vol. 32, n. 1, pp. 71-83.
CUI J., JO H., NA H. (2018), “Does Corporate Social Responsibility Affect Information Asymmetry?”, Journal of Business Ethics, vol. 148, n. 3, pp. 549-572.
DACIN M.T., OLIVER C., ROY J.P. (2007), “The Legitimacy of Strategic Alliances: An Institutional Perspective”, Strategic Management Journal, vol. 28, n. 2, pp. 169-187.
DAS T.K., TENG B.-S. (1998), “Between Trust and Control: Developing Confidence in Partner Cooperation in Alliances”, Academy of Management Review, vol. 23, n. 3, pp. 491-512.
53
DENG X., KANG J.-K., LOW B.S. (2013), “Corporate Social Responsibility and Stakeholder Value Maximization: Evidence from Mergers”, Journal of financial Economics, vol. 110, n. 1, pp. 87-109.
DOROBANTU S., HENISZ W.J., NARTEY L. (2017), “Not All Sparks Light a Fire: Stakeholder and Shareholder Reactions to Critical Events in Contested Markets”, Administrative Science Quarterly, vol. 62, n. 3, pp. 561-597.
DYER J.H. (2000), Collaborative Advantage: Winning through Extended Enterprise Supplier Networks, Oxford University Press.
ECCLES R.G., IOANNOU I., SERAFEIM G. (2014), “The Impact of Corporate Sustainability on Organizational Processes and Performance”, Management Science, vol. 60, n. 11, pp. 2835-2857.
FREEMAN E.R., MARTIN K., PARMAR B. (2007), “Stakeholder Capitalism”, Journal of Business Ethics, vol. 74, n. 4, pp. 303-314.
GARCIA‐CASTRO R., AGUILERA R.V. (2015), “Incremental Value Creation and Appropriation in a World with Multiple Stakeholders”, Strategic Management Journal, vol. 36, n. 1, pp. 137-147.
GARCIA‐CASTRO R., FRANCOEUR C. (2016), “When More Is Not Better: Complementarities, Costs and Contingencies in Stakeholder Management”, Strategic Management Journal, vol. 37, n. 2, pp. 406-424.
GIBBONS R., HENDERSON R. (2012), “Relational Contracts and Organizational Capabilities”, Organization Science, vol. 23, n. 5, pp. 1350-1364.
GULATI R., HIGGINS M.C. (2003), “Which Ties Matter When? The Contingent Effects of Interorganizational Partnerships on Ipo Success”, Strategic Management Journal, vol. 24, n. 2, pp. 127-144.
GULATI R., SINGH H. (1998), “The Architecture of Cooperation: Managing Coordination Costs and Appropriation Concerns in Strategic Alliances”, Administrative Science Quarterly, pp. 781-814.
HITT M.A., AHLSTROM D., DACIN M.T., LEVITAS E., SVOBODINA L. (2004), “The Institutional Effects on Strategic Alliance Partner Selection in Transition Economies: China Vs. Russia”, Organization Science, vol. 15, n. 2, pp. 173-185.
HITT M.A., DACIN M.T., LEVITAS E., ARREGLE J.-L., BORZA A. (2000), “Partner Selection in Emerging and Developed Market Contexts: Resource-Based and Organizational Learning Perspectives”, Academy of Management Journal, vol. 43, n. 3, pp. 449-467.
HOBERG G., PHILLIPS G. (2010), “Product Market Synergies and Competition in Mergers and Acquisitions: A Text-Based Analysis”, The Review of Financial Studies, vol. 23, n. 10, pp. 3773-3811.
HOENIG D., HENKEL J. (2015), “Quality Signals? The Role of Patents, Alliances, and Team Experience in Venture Capital Financing”, Research Policy, vol. 44, n. 5, pp. 1049-1064.
HUSELID M.A., JACKSON S.E., SCHULER R.S. (1997), “Technical and Strategic Human Resources Management Effectiveness as Determinants of Firm Performance”, Academy of Management Journal, vol. 40, n. 1, pp. 171-188.
HUTTON A.P. (2005), “Determinants of Managerial Earnings Guidance Prior to Regulation Fair Disclosure and Bias in Analysts’ Earnings Forecasts”, Contemporary Accounting Research, vol. 22, n. 4, pp. 867-914.
IOANNOU I., LI S.X., SERAFEIM G. (2016), “The Effect of Target Difficulty on Target Completion: The Case of Reducing Carbon Emissions”, The Accounting Review, vol. 91, n. 5, pp. 1467-1492.
Stefano Romito Angeloantonio Russo Clodia VurroThe impact of sustainability orientation on firm propensity to ally

sinergieitalian journal of management Vol. 39, Issue 2, 2021
54
JAP S.D. (1999), “Pie-Expansion Efforts: Collaboration Processes in Buyer-Supplier Relationships”, Journal of Marketing Research, vol. 36, n. 4, pp. 461-475.
JIANG W., WANG A.X., ZHOU K.Z., ZHANG C. (2019), “Stakeholder Relationship Capability and Firm Innovation: A Contingent Analysis”, Journal of Business Ethics, pp. 1-15.
JONES T.M., HARRISON J.S., FELPS W. (2018), “How Applying Instrumental Stakeholder Theory Can Provide Sustainable Competitive Advantage”, Academy of Management Review, vol. 43, n. 3, pp. 371-391.
KALE P., SINGH H. (2007), “Building Firm Capabilities through Learning: The Role of the Alliance Learning Process in Alliance Capability and Firm-Level Success”, Strategic Management Journal, vol. 28, n. 1, pp. 981-1000.
KIM C., BETTIS R.A. (2014), “Cash Is Surprisingly Valuable as a Strategic Asset”, Strategic Management Journal, vol. 35, n. 13, pp. 2053-2063.
KING B.G. (2008), “A Political Mediation Model of Corporate Response to Social Movement Activism”, Administrative Science Quarterly, vol. 53, n. 3, pp. 395-421.
KOGUT B., ZANDER U. (1992), “Knowledge of the Firm, Combinative Capabilities, and the Replication of Technology”, Organization Science, vol. 3, n. 3, pp. 383-397.
KRAMMER S.M. (2016), “The Role of Diversification Profiles and Dyadic Characteristics in the Formation of Technological Alliances: Differences between Exploitation and Exploration in a Low-Tech Industry”, Research Policy, vol. 45, n. 2, pp. 517-532.
LANG M.H., LUNDHOLM R.J. (1996), “Corporate Disclosure Policy and Analyst Behavior”, Accounting Review, vol. 71, n. 4, pp. 467-492.
LAVIE D., ROSENKOPF L. (2006), “Balancing Exploration and Exploitation in Alliance Formation”, Academy of Management Journal, vol. 49, n. 4, pp. 797-818.
LIN H., DARNALL N. (2015), “Strategic Alliance Formation and Structural Configuration”, Journal of Business Ethics, vol. 127, n. 3, pp. 549-564.
LORENZONI G., LIPPARINI A. (1999), “The Leveraging of Interfirm Relationships as a Distinctive Organizational Capability: A Longitudinal Study”, Strategic Management Journal, vol. 20, n. 4, pp. 317-338.
LUO Y. (2007), “The Independent and Interactive Roles of Procedural, Distributive, and Interactional Justice in Strategic Alliances”, Academy of Management Journal, vol. 50, n. 3, pp. 644-664.
MOWERY D.C., OXLEY J.E., SILVERMAN B.S. (1998), “Technological Overlap and Interfirm Cooperation: Implications for the Resource-Based View of the Firm”, Research Policy, vol. 27, n. 5, pp. 507-523.
NORHEIM-HANSEN A. (2015), “Are ‘Green Brides’ More Attractive? An Empirical Examination of How Prospective Partners’ Environmental Reputation Affects the Trust-Based Mechanism in Alliance Formation”, Journal of Business Ethics, vol. 132, n. 4, pp. 813-830.
OZMEL U., REUER J.J., GULATI R. (2013), “Signals across Multiple Networks: How Venture Capital and Alliance Networks Affect Interorganizational Collaboration”, Academy of Management Journal, vol. 56, n. 3, pp. 852-866.
PARMAR B.L., FREEMAN R.E., HARRISON J.S., WICKS A.C., PURNELL L., DE COLLE S. (2010), “Stakeholder Theory: The State of the Art”, The Academy of Management Annals, vol. 4, n. 1, pp. 403-445.

55
POLLOCK T.G., CHEN G., JACKSON E.M., HAMBRICK D.C. (2010), “How Much Prestige Is Enough? Assessing the Value of Multiple Types of High-Status Affiliates for Young Firms”, Journal of Business Venturing, vol. 25, n. 1, pp. 6-23.
POLLOCK T.G., RINDOVA V.P. (2003), “Media Legitimation Effects in the Market for Initial Public Offerings”, Academy of Management Journal, vol. 46, n. 5, pp. 631-642.
ROSENKOPF L., ALMEIDA P. (2003), “Overcoming Local Search through Alliances and Mobility”, Management Science, vol. 49, n. 6, pp. 751-766.
ROTHAERMEL F.T. (2001), “Incumbent’s Advantage through Exploiting Complementary Assets Via Interfirm Cooperation”, Strategic Management Journal, vol. 22, n. 6-7, pp. 687-699.
ROXAS B., COETZER A. (2012), “Institutional Environment, Managerial Attitudes and Environmental Sustainability Orientation of Small Firms”, Journal of Business Ethics, vol. 111, n. 4, pp. 461-476.
RUSSO A., VASTOLA V., VURRO C. (2018), “To Be or Not to Be Sustainable? Solving the Dilemma During the Acquisition Process”, Sinergie Italian Journal of Management, vol. 36, n. 106, pp.127-140.
RUSSO A., VURRO C. (2010), “Cross-Boundary Ambidexterity: Balancing Exploration and Exploitation in the Fuel Cell Industry”, European Management Review, vol. 7, n. 1, pp. 30-45.
RUSSO A., VURRO C. (2019), “Alliance Management Knowledge and Alliance Performance: Unveiling the Moderating Role of the Dedicated Alliance Function”, Industrial and Corporate Change, vol. 28, n. 4, pp. 725-752.
RUSSO A., VURRO C., NAG R. (2019), “To Have or to Be? The Interplay between Knowledge Structure and Market Identity in Knowledge-Based Alliance Formation”, Research Policy, vol. 48, n. 3, pp. 571-583.
STERN I., DUKERICH J.M., ZAJAC E. (2014), “Unmixed Signals: How Reputation and Status Affect Alliance Formation”, Strategic Management Journal, vol. 35, n. 4, pp. 512-531.
STUART T.E. (2000), “Interorganizational Alliances and the Performance of Firms: A Study of Growth and Innovation Rates in a High-Technology Industry”, Strategic Management Journal, vol. 21, n. 8, pp. 791-811.
VILLALONGA B. (2004), “Intangible Resources, Tobin’sq, and Sustainability of Performance Differences”, Journal of Economic Behavior and Organization, vol. 54, n. 2, pp. 205-230.
VILLALONGA B., MCGAHAN A.M. (2005), “The Choice among Acquisitions, Alliances, and Divestitures”, Strategic Management Journal, vol. 26, n. 13, pp. 1183-1208.
VOMBERG A., HOMBURG C., BORNEMANN T. (2015), “Talented People and Strong Brands: The Contribution of Human Capital and Brand Equity to Firm Value”, Strategic Management Journal, vol. 36, n. 13, pp. 2122-2131.
VURRO C., RUSSO A. (2009), “Balancing Exploration and Exploitation across Firm Boundaries: Intra- and Interorganizational Learning in the Fuel Cell Industry”, in Pogutz S., Russo A., Migliavacca P.O., Innovation, Markets and Sustainable Energy: The Challenge of Hydrogen and Fuel Cells, Edward Elgar Publishing, Cheltenham, UK.
WANG Y., RAJAGOPALAN N. (2015), “Alliance Capabilities: Review and Research Agenda”, Journal of Management, vol. 41, n. 1, pp. 236-260.
Stefano Romito Angeloantonio Russo Clodia VurroThe impact of sustainability orientation on firm propensity to ally

sinergieitalian journal of management Vol. 39, Issue 2, 2021
56
ZANDER I., ZANDER U. (2005), “The inside Track: On the Important (but Neglected) Role of Customers in the Resource‐Based View of Strategy and Firm Growth”, Journal of Management Studies, vol. 42, n. 8, pp. 1519-1548.
ZOLLO M., REUER J.J. (2010), “Experience Spillovers across Corporate Development Activities”, Organization Science, vol. 21, n. 6, pp. 1195-1212.
ZOLLO M., REUER J.J., SINGH H. (2002), “Interorganizational Routines and Performance in Strategic Alliances”, Organization Science, vol. 13, n. 6, pp. 701-713.
Academic or professional position and contacts
Stefano Romito Post-doc researcher of Management University of Milan - Italye-mail: [email protected]
Angeloantonio Russo Full Professor of Management LUM University - Italye-mail: [email protected]
Clodia Vurro Associate Professor of Management University of Milan - Italye-mail: [email protected]
sinergieitalian journal of management
ISSN 0393-5108 DOI 10.7433/s115.2021.03
pp. 37-56

Selected papers


59
Family firms, women, and innovation
Mariasole Bannò - Graziano Coller - Giorgia M. D’Allura
Abstract
Frame of the research: We aim to inform family business literature and family business managers on the effect to include women as managers by providing empirical evidence on their impact on innovation.
Purpose of the paper: The paper investigates the impact of female directors on innovation in Family Businesses (FBs). We assume that the presence of women, due to recent generations with the presence of daughters or due to marriages involving third parties, could be more common than in non-FBs.
Methodology: We tested our hypotheses on a sample of 755 Italian FBs through a count data model.
Findings: Our findings show how and when the invisible women became visible and their effect on innovation performance. Prejudice against women in FBs is detrimental to innovation; however, both the presence of female family members in control positions and the presence of a critical mass helps to mitigate the effect of prejudice on innovation.
Research limits: The sample is limited to Italian firms only. The social dynamics and the role of women in the entrepreneurial arena are strongly influenced by the institutional system in which the firm operates.
Practical implications: Our findings will be relevant to family business owners and managers with regard to their innovation strategy. A greater understanding of the relationship between female directors and innovation may contribute to increasing the number of women in these important roles.
Originality of the paper: We extend our understanding of the effects on innovation of the involvement of female family members on the board of directors. We discuss the invisibility of female family members. We enhance our growing knowledge on female directors in family businesses by studying women’s roles as president or vice president, in relation to innovation.
Key words: gender; invisible women; family business; innovation
1. Introduction
The study of women as managers and/or owners is not new to management literature (Terjesen et al., 2009). Some studies investigated the relationship between the presence of women in management roles and firms’ strategic choices (Post and Byron, 2015; Sila et al., 2016; Smith et al., 2006; Fagenson, 1993; Vinnicombe and Colwill, 1995). Others focused on the differences in the firms’ performance as the female presence in top roles increases. These studies originate from the Upper Echelons Theory (Hambrick and Mason, 1984), according to which the observable
Received18th February 2020
Revised 3th November 2020
Accepted 1st July 2021

sinergieitalian journal of management Vol. 39, Issue 2, 2021
60
demographic variables constitute important factors influencing the decisions taken by the upper echelons and, consequently, on the behaviors and results of the firms.
This issue has always attracted researchers’ interest in both FB and non-FB domains, but there remains a need to improve our understanding due to the main change that is occurring at the institutional level related to the inclusion of women in the boardroom. For example, in Italy in 2011, the Golfo-Mosca law obliged listed companies to reserve one third of the seats on boards to women. From this date forward, the presence of women in listed companies was no longer spontaneous, but legally required. However, as the presence of women increases, so does the need for new research surfaces. As a result, management scholars have called for major research on the topic. We aim to contribute to the FB literature by considering how the FB potential supports the presence of women in management and on the board (Bannò and D’Allura, 2018). Our interest is to improve our understanding both in quantitative terms (if women are formally present in key roles or are still invisible) and qualitative terms (what is their influence on firm innovation). In this paper, we aim to extend this literature by providing an empirical investigation into women’s presence on the boards of family firms and their role in firm innovation.
The presence of women in managerial roles is a topic relevant to the case of FBs started in the 80s (Campopiano et al., 2017), and FB scholars call for further investigation (Cesaroni and Sentuti, 2014; Gallucci, 2010; Gallucci et al., 2015). We contribute to this mainstream research in many ways. First, we extend our understanding of the effects on innovation of female family involvement in the board of directors. In particular, we discuss the invisibility of female family members. Second, we add to the growing literature on FB (e.g., Dibrell and Memili, 2019) by addressing how innovation output of FBs varies depending on the composition of the board of directors, specifically with regard to the presence of female directors. Third, we enhance our knowledge of women’s roles in FBs relative to innovation (e.g., Campopiano et al., 2017; Chadwick and Dawson, 2018), by studying cases in which women act as president or vice president. Fourth, from an empirical point of view, our paper investigates the impact on innovation of the presence of women in a sample of 755 Italian FBs. Finally, our research is also relevant to practitioners (e.g., FB owners and managers) with regard to their innovation strategy, specifically in connection to the composition of the board of directors. Finally, a greater understanding of the relationship between women’s presence on the board and innovation may contribute to the increase of the number of women in the upper echelon.
2. Theoretical framework
2.1 Women’s presence in family firms
In their recent review, Campopiano et al. (2017) emphasize that contributions analyzing the role of women within FBs are still limited.
61
Mariasole Bannò Graziano CollerGiorgia M. D’AlluraFamily firms, women, and innovation
Available research suggests that FBs offer a relatively favorable environment for women to cover upper echelon positions (Bianco et al., 2015; Chadwick and Dawson, 2018). For example, small- and medium-sized FBs offer a more advantageous context for women to join the board of directors (Songini and Gnan, 2009). Family connections with the controlling shareholder are conducive to joining the board, especially in small firms with concentrated ownership (Bianco et al., 2015). Indeed, in developed countries, FBs generally have more women on their boards than non-FBs; this is often because female directors are part of the owning family (Bettinelli et al., 2019).
Even if women are more present in FBs, they usually play informal roles (Dumas, 1992). It is not clear from the literature whether the family environment supports or opposes the female presence in leadership positions. Some studies suggest that FBs represent the most suitable place to offer opportunities to women. Other studies suggest that traditional family roles are perceived as inconsistent with corporate hierarchies and, consequently, the spaces available for women are marginal or invisible (Montemerlo and Profeta, 2009). The female presence could be inhibited by the work-family conflict (Vera and Dean, 2005): women can have problems looking after the family if they work too many hours a day (Cadieux et al., 2002). Therefore, the family tends to protect the primary role of caring for the woman’s family at the expense of her presence in the firm.
This also affects how daughters and sons are prepared for succession (Haberman and Danes, 2007); usually daughters spend less time in FBs than sons. Consequently, the daughters inevitably develop less firm-specific knowledge, and this will be a hindrance to the later identification processes of the successor. According to what emerges from the FB literature, as well as historical and current anecdotal evidence, it is clear that the preferred route in family succession is to identify the heir in the male child. In fact, even if there is an increase in women-led enterprises, there has always been a greater propensity to ignore daughters as possible successors (Dumas, 1998). Keating and Little (1997) identified the gender factor of the successor, explaining the rule according to which daughters could not become chosen heirs to lead the companies following generational change, except in the absence of other possible heirs.
The manifold reasons why women are rarely chosen as successors are linked to a set of stereotypes attributable to their supposed lower working capacity and to their reluctance to sacrifice the family in which the female role is central. In this regard, investigating the challenges and opportunities that women must face and seize respectively, and considering that the contribution of women in FBs is recognized but not evident, Dumas (1998) identifies the barriers to participation and hiring leadership in (a) the social structure, in (b) the family expectations about the woman’s role, in (c) the relationship with parents, siblings, and unfamiliar members, and in (d) problems related to the assumption of power and authority. Furthermore, female leaders tend to favor the family over the company’s performance (Gherardi and Perotta, 2016), which could lead to a negative assessment of women’s presence in key roles by relatives and other stakeholders. It is often the case that women are considered by their families to be less
legitimate than males to manage the FB, and thus they do not plan a real career within the firm, participating only when needed or during a crisis (Dumas, 1998). The need to ensure the dynastic continuity of the firm is one of these cases and can contribute to the encouragement of female entrepreneurship (Cassia et al., 2011).
2.2 Women and firm innovation output
While, in the domain of FB, few papers investigate the effects on innovation of women’s presence in upper echelons (Campopiano et al., 2017), this issue has long been investigated in management literature. This literature is often quantitative, comparing the tendencies of women and men to contribute to innovation. Whittington (2011) suggests that “academic mothers” are less likely to patent because “family responsibilities” impede women’s ability to innovate. As a consequence, the intersection of gender and innovation appears to favor men. Other studies show that male researchers are more likely than female researchers to be involved in industry cooperation (Bozeman and Gaughan, 2007). Further, public support for innovation or R&D is mainly given to science and engineering, and there is a strong association between masculinity, science and engineering, and innovation since these processes are intertwined (Dautzenberg, 2012; Marlow and McAdam, 2012). As a consequence, it is not surprising to find in the literature that the concept of innovation is highly gendered, with a strong male connotation (Marlow and McAdam, 2012).
2.3 Hypotheses development
FBs are unique institutions. They represent a context in which two superficially different social units (i.e., families and businesses) are substantially integrated (D’Allura, 2019). There is an “intimate connection between family and business” that is “natural and compatible” (Davis, 1968). This connection covers succession across generations. As a result of this connection, FBs generally have more women on their boards than non-FBs, because female directors are part of the owning family. The main consequence is that they are often selected because of their family ties rather than for their competencies (Bettinelli et al., 2019). However, even if directly involved in the daily operations of the FB, women do not receive recognition for their contribution, neither with a formal position in the company nor for a salary and, in short, they do not receive the same consideration as their male relatives within the enterprise due to the motivation for their selection (Hollander and Bukowitz, 1990). This phenomenon has been recognized in the literature as the “invisibility of women” (Cole, 1997). We argue that there is a further kind of invisibility such that, even if female family members are recognized by the Board, they cannot exercise their role because they are tokens for the family and because their presence is seen as a product of an inferior succession process. Indeed, family firms formally include female family members, but continue to treat them more as family members than professionals (Campopiano et
sinergieitalian journal of management Vol. 39, Issue 2, 2021
62

63
al., 2017). This reveals how the presence of these women is not related to their effective role in the decision-making process, particularly in terms of innovation.
For these reasons, we expect that:
HP1: The relationship between female family presence and level of innovation is negative
Further, women in the boardroom face family and social barriers that create the condition of often being the minority on the board. Often, women prefer to leave their business roles to maintain their family roles, preferring the caring of the family to their professional lives (Cesaroni and Sentuti, 2014; Bianco et al., 2015). Moreover, innovation literature states that women’s orientations also influence their propensity to innovate (Dautzenberg, 2012); as a result, compared to males, they patent less. However, previous contributions have suggested that women need to have other qualities to be influential directors, such as having specific prior board experience and network ties, interlinks with other boards, and individual power as president or vice president (Westphal and Milton, 2000; Cook and Glass, 2015). Another way for women to be influential is to reach a critical mass (Kanter, 1977; Konrad et al., 2008), which the literature identifies as three seats on the board (e.g., Torchia et al., 2011). Consequently, what is expected here is a change in the relationship between women’s presence and innovation; in this case, the conditions should change in terms of power or critical mass, and, consequently, women should exercise their roles by making their impact on innovation.
Following previous contributions on women in power positions and critical mass, we expect that:
HP2: The relationship between female family presence and level of innovation become positive when female family members are on the board with other females and/or they are president or vice president.
3. Methodology
3.1 Data and sample
FBs play a primary role within the global context both in terms of social impact and with respect to the importance assumed within the economic dynamics (Tapies and Ward, 2008). According to estimates by the Family Firm Institute1, two out of three companies are FBs. They produce an annual gross domestic product share of approximately 70% to 90% and, in most countries, create more than half of the jobs available (between 50% and 80%). The predominant role of FBs is also confirmed in the European context and, in particular, in Italy (Cesaroni and Sentuti, 2010; Corbetta, 2010; Gallucci and Gentile; 2009), where 82% of firms are FBs. In the Italian context, a further peculiarity is that even the largest companies are 1 https://www.ffi.org/
Mariasole Bannò Graziano CollerGiorgia M. D’AlluraFamily firms, women, and innovation

sinergieitalian journal of management Vol. 39, Issue 2, 2021
64
FBs (Corbetta, 2010). These characteristics of the industrial ecosystem justify and support the use of a sample of Italian firms to conduct empirical analyses.
The sample for this study comprised 755 Italian family firms. The dataset, updated to 2018, was randomly gathered by merging data from the following datasets: Espacenet, Aida (Bureau Van Dijk), Borsa Italiana, and Reprint. We operationalized FB through the key dimensions of ownership. Firms were selected randomly; therefore, each firm had the same probability of being selected. We controlled for the representativeness of the sample according to relevant dimensions. Further tests were conducted by comparing the representativeness of family dimension and firm dimension.
We selected Family Business as a binary variable equal to 1, if either a non-listed firm was majority-owned by the family or no less than 20% of a listed firm was owned by the family, and 0, if otherwise (Anderson and Reeb, 2003). The variable describing the family nature of the firm was constructed by crossing data from the Aida database and the Borsa Italiana databases.
3.2 The variables and the models
Given the count nature of the dependent variable, for the main effect we adopted Poisson models to estimate the influence of the independent variables on the dependent variables (Greene, 2018; Wooldridge, 2013; Kennedy, 2003).
Table 1 reports the definitions and sources of both the dependent and independent variables.
Dependent variable. The dependent variable is the number of patents (Innovation).
Independent variable. We measure the female presence as the number of women on the BoD (variable Female Board). We measure the variable Female Family as a dummy variable indicating whether they are part of the family or not. We measure the variable Female Power, as a dummy variable with value 1 if the female is a president or vice president, and 0, if otherwise.
Control variable. According to previous research on the factors affecting a firm’s degree of innovation, we controlled for several firm-specific characteristics: firm size and age, profitability, firms’ internationalization, geographical localization, financial constraints, productivity, listed, and industry (e.g., Chabchoub and Niosi, 2005; Arundel and Kabla, 1998; Mansfield, 1986; Horstmann et al., 1985).
Firm size and firm age are proxies for accumulated knowledge and managerial experience (Brouwer and Kleinknecht, 1999). Thus, we measured Size as the logarithm of total sales and Age as the logarithm of the number of years since the firm’s foundation.
We controlled for Profitability, measured as the return on equity (Hanel and St-Pierre, 2002).
We further controlled for Internationalization, which is measured by the logarithm of the number of total Foreign Direct Investments (FDIs)

65
made by the parent company in foreign markets. Past literature suggests that by acting in international markets, firms can better capitalize the exclusive rents of innovation. Multinational firms offer products to a larger number of potential buyers, thereby enhancing profits from innovation efforts and distributing innovation costs. Internationalization lowers the risk of R&D by avoiding fluctuations and business cycles specific to a single market (Kafouros et al., 2008). Furthermore, international investments enhance a firm’s knowledge about the environment and the competition in different countries. This knowledge drives the firm’s efforts into the most promising innovative objectives. We proxy international presence through the variable Internationalisation, here measured as the logarithm of the number of the firm’s foreign subsidiaries.
The binary variable Localisation takes the value 1 when the firm is located in the North of Italy, and 0, if otherwise; regional location of the headquarters in Southern Italy vs. other regions entails differing services and resource availability.
To take into account whether the firm is exposed to financial restrictions (a firm needs adequate capital to develop its innovative ideas), we control for Financial Constraints (ratio of current assets net of inventory to current liabilities).
We also controlled for Productivity, which is measured as the value added per employee (Hanel and St-Pierre, 2002).
Tab. 1: Definition and source of the variables used in the empirical analyses
Definition SourceDependent variableInnovation Number of patent EspacenetIndependent variablesGender variableFemale Board Number of women on the board of directors. AidaFemale Family Dummy variable taking value 1 when a family
woman is on the board of directors, 0 otherwise.Aida
Female Power Dummy variable taking value 1 when a family woman that is on the board of directors or is the president or vice president, 0 otherwise.
Aida
Control variableSize Logarithm of total sales (euro). AidaAge Logarithm of firm age (years). AidaProfitability Return on equity (%). AidaInternationalization Logarithm of the number of the past FDIs. ReprintLocalization Dummy variable taking the value 1 if the firm is
located in the north of Italy, 0 otherwise. Aida
Financial Constraints Ratio between bank debt and total assets. AidaProductivity Logarithm of the value added per employee (euros). AidaListed Dummy variable if the firm is listed, 0 otherwise. Borsa Italiana
Source: author elaboration
The variables Listed is a dummy; in this case, it is equal to 1 if the firm is listed, and 0 if otherwise.
Mariasole Bannò Graziano CollerGiorgia M. D’AlluraFamily firms, women, and innovation

sinergieitalian journal of management Vol. 39, Issue 2, 2021
66
Finally, we include industry dummies as further controls, not only because of the significant impact of the industry on innovation capacity (Scherer, 1983), but also because patenting is more extensively used as an intellectual-property protection tool in science-based industries. The analysis monitored the industry by using the Pavitt taxonomy (1984). Four binary variables identify whether the firm belongs to a traditional sector, a scale-intensive sector, a specialized supplier sector, a science-based sector, or any other sector; the variables are Pavitt traditional, Pavitt scale intensive, Pavitt specialised supplier, Pavitt science based, and Pavitt other, respectively.
To test our hypothesis, we developed five econometric models that relate the innovation output of the firm with the different roles of women in the boardroom. In Model 1, we consider the presence of women in the board of directors.
Model 1: Innovation = ƒ (Female Board; Control Variables)
We then estimated four other conceptual models to further elaborate on the idea of female presence in family firms. With Model 2 we consider the simple presence of a female family member on the board.
Model 2: Innovation = ƒ (Female Board; Female Family; Control Variables)
Then, we consider the presence of a female family member on the board using three different scenarios. The first scenario (Model 3) concerns the case where female family directors are on the board with other non-family females. The second scenario (Model 4) concerns the case where female family directors are on the board with a powerful role (i.e., president or vice president women). The last scenario (Model 5) concerns the synthesis of the previous two.
Model 3: Innovation = ƒ (as.factor Female Board X Female Family; Control Variables) Model 4: Innovation = ƒ (Female Board; Female Family; Female Power; Control Variables)
Model 5: Innovation = ƒ (as.factor Female Board X Female Family; Female Power; Control Variables)
3.3 Descriptive analysis
The overall descriptive statistics reported in Table 2 show that the average Innovation is equal to 36 patents.
As for the female variables, if we consider the whole sample, there is an average female presence in important decision-making roles of just 11% (on average one female director for every board), a percentage that rises to 31% if we refer to the subgroup where at least one family woman takes part in the board. The percentage of family members holding the

67
president or vice president position is very high, while the percentage of female president or vice president is very low, for an average of just 11%. Companies with a female presence in decision-making roles are larger and more structured. The average size is equal to 3.26 logarithm of total sales. Almost nine out of ten firms are located in the North of Italy. The average age is 3.6 years and profitability is more than 8%, revealing a good sample of profitable family firms. Correlation is acceptable among all variables (Table 3) (Greene, 2018; Wooldridge, 2013).
Tab. 2: Descriptive statistics
Statistic Mean/Percentage
St. Dev. Min Max
Innovation 36.764 312.622 0 7,710Female Board 0.544 1.005 0 5Female Family 31.1% 0.463 0 1Female Power 11.2% 0.316 0 1Size 3.265 1.917 -5.116 8.079Age 3.615 0.538 2.079 5.231Profitability 8.2% 0.174 -1.430 0.790Internationalization 1.477 1.143 0 4.898Localization 90.0% 0.300 0 1Financial Constraints 0.412 0.227 -0.396 1.000Productivity 7.822 8.042 0.080 98.740Listed 5.5% 0.228 0 1
Source: author elaboration
Tab. 3: Correlation matrix1 2 3 4 5 6 7 8 9 10 11 12
1. Innovation 12. Female Board 0.031 13. Female Family -0.003 0.803 14. Female Power -0.001 0.391 0.524 15. Size 0.143 0.169 0.113 0.067 16. Age 0.070 0.128 0.039 0.071 0.234 17. Profitability 0.020 -0.002 -0.010 -0.001 0.111 0.012 18. Internationalization 0.131 0.185 0.097 0.046 0.545 0.236 -0.043 19. Localization 0.023 -0.125 -0.096 0.008 -0.001 0.004 0.035 -0.082 1
10. Fin. Constraints 0.033 0.062 0.066 0.030 0.012 0.099 0.096 0.007 0.026 111. Productivity -0.044 -0.019 -0.006 -0.044 0.063 -0.080 0.092 -0.052 -0.027 -0.018 112. Listed 0.048 0.572 0.266 0.089 0.167 0.150 0.012 0.203 -0.125 0.024 -0.016 1
Source: author elaboration
4. Results
4.1 Empirical findings
Table 4 reports the regression results from Model 1 to Model 5. The econometric results highlight that not all female-related variables considered exert the same impact, and that only some of the traditional variables included as determinants of innovation had the expected impact.
Mariasole Bannò Graziano CollerGiorgia M. D’AlluraFamily firms, women, and innovation

sinergieitalian journal of management Vol. 39, Issue 2, 2021
68
Results show that a female presence on the board has a negative impact on innovation (Female Board is negative and significant at p<.01 in Model 1), but when controlling for the presence of female family members (introducing the variable Female Family), the variable of Female Board became positive and significant at p<.01 in Model 2. This reveals that the presence of female family members has a negative impact on innovation (Female Family is negative and significant at p<.01 in Model 2). Female Family shows the same negative coefficient in Models 2 and 4.
When looking at the interaction of Female Family and Female Board as factors in Model 3, results demonstrate that the influence of female family members became positive only when at least three women were on the board, suggesting that the critical mass must be reached in order to make their contribution effective (as.factor Female Board = 1 Female Family and as.factor Female Board = 2 Female Family are both negative and significant at p<.01; as.factor Female Board = 3 Female Family, as.factor Female Board = 4 Female Family, as.factor Female Board = 5 Female Family are all positive and significant at p<.01 in Model 3; similar results hold also for Model 5). When considering the role of president or vice president, the impact of female family members became positive and significant (Female Power is positive and significant at p<.01 in Models 4 and 5).
The control variables also yielded interesting results. Both Size and Age, reflecting managerial capability, had a positive impact and their coefficients are significantly different from zero at p<.01 in all models. International presence is positive and significant in all Models, except Model 3. Concerning the remaining variables, firms localised in North of Italy and less financially constrained, show a greater innovation (Localization and Financial Constraints are positive and significant at p<0.01 in all Models). Also, Productivity, surprisingly negative and significant at p<.01 in all Models, directly affects innovation; on the contrary, the profitability does not seem to crucially influence innovation, at least in the full Model (Profitability is not a significant factor in Models 3 and 5). Variable Listed shows mixed results in different models. Not surprisingly, there are always significant differences among sectors.
4.2 Robustness check
We produced various robustness checks and we tried additional models. First, we included alternative measures of the presence of women on the board of directors, attaining outcomes consistent with previous ones. Second, other specifications for the dependent variable Innovation have been considered in the analysis and, again, have yielded the same results (i.e., a dummy variable and a log variable). Third, to check for possible selection bias due to the presence of only innovative firms, we made a Heckman selection model, which included the sample of non-innovative firms as a control, again finding the same results. All the alternative models produced the same results proposed in this paper. Finally, we believe that endogeneity might not represent a major issue in our analysis, because our hypotheses included interaction terms. Bun and Harrison (2019) report that endogeneity is minimized when the findings of interest include
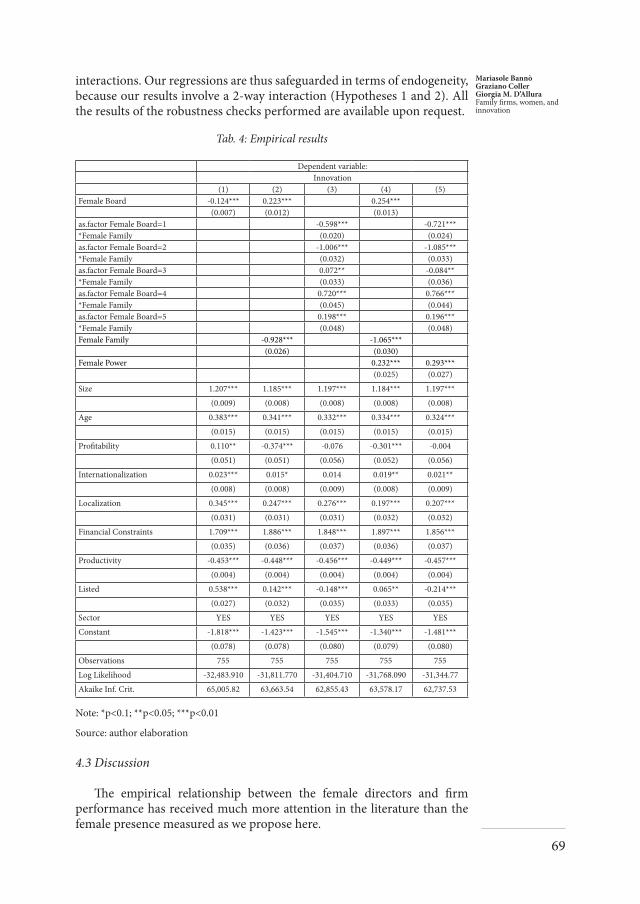
69
interactions. Our regressions are thus safeguarded in terms of endogeneity, because our results involve a 2-way interaction (Hypotheses 1 and 2). All the results of the robustness checks performed are available upon request.
Tab. 4: Empirical results
Dependent variable:Innovation
(1) (2) (3) (4) (5)Female Board -0.124*** 0.223*** 0.254***
(0.007) (0.012) (0.013)as.factor Female Board=1 -0.598*** -0.721****Female Family (0.020) (0.024)as.factor Female Board=2 -1.006*** -1.085****Female Family (0.032) (0.033)as.factor Female Board=3 0.072** -0.084***Female Family (0.033) (0.036)as.factor Female Board=4 0.720*** 0.766****Female Family (0.045) (0.044)as.factor Female Board=5 0.198*** 0.196****Female Family (0.048) (0.048)Female Family -0.928*** -1.065***
(0.026) (0.030)Female Power 0.232*** 0.293***
(0.025) (0.027)
Size 1.207*** 1.185*** 1.197*** 1.184*** 1.197***
(0.009) (0.008) (0.008) (0.008) (0.008)
Age 0.383*** 0.341*** 0.332*** 0.334*** 0.324***
(0.015) (0.015) (0.015) (0.015) (0.015)
Profitability 0.110** -0.374*** -0.076 -0.301*** -0.004
(0.051) (0.051) (0.056) (0.052) (0.056)
Internationalization 0.023*** 0.015* 0.014 0.019** 0.021**
(0.008) (0.008) (0.009) (0.008) (0.009)
Localization 0.345*** 0.247*** 0.276*** 0.197*** 0.207***
(0.031) (0.031) (0.031) (0.032) (0.032)
Financial Constraints 1.709*** 1.886*** 1.848*** 1.897*** 1.856***
(0.035) (0.036) (0.037) (0.036) (0.037)
Productivity -0.453*** -0.448*** -0.456*** -0.449*** -0.457***
(0.004) (0.004) (0.004) (0.004) (0.004)
Listed 0.538*** 0.142*** -0.148*** 0.065** -0.214***
(0.027) (0.032) (0.035) (0.033) (0.035)
Sector YES YES YES YES YES
Constant -1.818*** -1.423*** -1.545*** -1.340*** -1.481***
(0.078) (0.078) (0.080) (0.079) (0.080)
Observations 755 755 755 755 755
Log Likelihood -32,483.910 -31,811.770 -31,404.710 -31,768.090 -31,344.77
Akaike Inf. Crit. 65,005.82 63,663.54 62,855.43 63,578.17 62,737.53
Note: *p<0.1; **p<0.05; ***p<0.01
Source: author elaboration
4.3 Discussion
The empirical relationship between the female directors and firm performance has received much more attention in the literature than the female presence measured as we propose here.
Mariasole Bannò Graziano CollerGiorgia M. D’AlluraFamily firms, women, and innovation

sinergieitalian journal of management Vol. 39, Issue 2, 2021
70
Our results suggest the existence of the phenomenon of family tokenism for female members. Tokenism, polarization, and assimilation phenomena derive from the low proportionate representation of minority group members. Tokenism is defined as “a tendency for minority members to be viewed as representatives of their culture group rather than as individuals, as well as a tendency for their performance, good or bad, to be magnified because of the extra attention that their distinctiveness creates” (Cox, 1994). We demonstrated that even if female family members are recognized by the board, they cannot exercise their roles because they are tokens for the family. This explains the negative role of female family members on innovation.
However, if at least three women are on the board, the effect of female family members on innovation becomes positive. This result confirms those explained in previous literature that argue that females should reach a critical mass in order to be effective (Kanter, 1977; Konrad et al., 2008, Torchia et al., 2011).
Furthermore, the aforementioned effect is emphasized when considering female family members of the board holding power positions.
Overall these results confirm the idea that, given the social barriers female family members face in the boardroom, female minorities need to have either critical mass or powerful positions to be influential.
5. Conclusion, limits, and future developments
In this paper we investigated the effect of female directors on innovation with a focus on FBs. From a theoretical point of view, we build on the invisibility of female family members to outline our hypotheses. From an empirical point of view, we tested our hypotheses on a sample of 755 Italian FBs. Our results support the idea that the relationship between female family members on the board and the level of innovation is negative due to their invisible condition. Specifically, given the social barriers family females face in the boardrooms, they need to reach a critical mass and/or to hold powerful positions in order to be influential. In that case, the relationship between family women on the board and the level of innovation becomes positive, because they lose their invisible condition.
The women-invisibility is a well-known phenomenon in the literature: women are rarely considered as candidates for the management team or for succession to the helm of the business. Still, in family firms, female presence on boards and in control positions (president or vice president of the BoD) is higher than in non-family firms; however, this choice is forced by the lack of male successors or by a crisis looming over the company (Curimbaba, 2002; Dumas, 1992, 1998; Haberman and Danes, 2007). Our findings confirm the idea that to consider women as members of the family (formal inclusion to the board) instead of professionals (consider their skill and listen to their voice) is detrimental to innovation. However, both the presence of family women in control positions (i.e., as president or vice president) and the presence of a critical mass (i.e., three or more women on the BoD) helps in mitigating the effect of prejudice on innovation.

71
Our findings are relevant also to practitioners. Owners and managers can observe how female directors positively impact firms’ innovation strategies. The concept of innovation is often regarded as a highly gendered phenomena with a strong male connotation. However, our results suggest that women’s presence on the board may be either beneficial or detrimental to innovation. Beneficial effects are obtained with critical mass and may be enhanced by women in power positions. However, power position alone is not sufficient to induce such positive effects. This is particularly relevant for family firms where family women are more likely to be involved in the board of directors, but where women-invisibility and tokenism phenomena are still present (potentially triggering the aforementioned detrimental effects). In order to leverage the positive effects of female presence on the board, family firms should place particular attention on overcoming tokenism (with family or non-family female members).
We hope that these results can inspire a new path for women inside FBs, increasing the number of women in important roles. Further research is still needed in order to improve our understanding of the relationship between female directors on the board and innovation, with the goal to support owners’ and managers’ practices.
Our paper presents some limitations. First the sample is limited to Italian firms only. The same study could be replicated in countries characterized by different institutional and socio-cultural contexts, which could provide different results. The social dynamics and the role of women in the entrepreneurial arena are strongly influenced by the institutional system in which the firm operates. Specifically, a culture more inclined towards the female figure in leadership roles can influence the contribution made by women to those processes.
References
ANDERSON R.C., REEB D.M. (2003), “Founding-Family Ownership and Firm Performance: Evidence from the S&P 500”, The Journal of Finance, vol. 58, pp. 1301-1328.
ARUNDEL A., KABLA I. (1998), “What percentage of innovations are patented? empirical estimates for European firms”, Research Policy, vol. 27, pp. 127-141.
BANNÒ M., D’ALLURA G.M. (2018), “La presenza delle donne nei CDA italiani: un confronto tra imprese familiari e non familiari”, Esperienze d’Impresa, vol. 1, pp. 19-40.
BETTINELLI C., DEL BOSCO B., GIACHINO C. (2019), “Women on Boards in Family Firms: What We Know and What We Need to Know”, in Memili E., Dibrell C. (Eds), The Palgrave Handbook of Heterogeneity among Family Firms, Springer International Publishing, Cham, pp. 201-228.
BIANCO M., CIAVARELLA A., SIGNORETTI R. (2015), “Women on corporate boards in Italy: The role of family connections”, Corporate Governance (Oxford), vol. 23, n. 2, pp. 129-144.
BUN M.J.G., HARRISON T.D. (2019), “OLS and IV estimation of regression models including endogenous interaction terms”, Econometric Reviews, vol. 38, pp. 814-827.
Mariasole Bannò Graziano CollerGiorgia M. D’AlluraFamily firms, women, and innovation

sinergieitalian journal of management Vol. 39, Issue 2, 2021
72
BOZEMAN B., GAUGHAN M. (2007), “Impacts of grants and contracts on academic researchers’ interactions with industry”, Research Policy, vol. 36, pp. 694-707.
BROUWER E., KLEINKNECHT A. (1999), “Innovative output, and a firm’s propensity to patent: An exploration of CIS micro data”, Research Policy, vol. 28, pp. 615-624.
CADIEUX L., LORRAIN J., HUGRON P. (2002), “Succession in women-owned family businesses: a case study”, Family Business Review, vol. 15, n. 1, pp. 17-30.
CAMPOPIANO G., DE MASSIS A., RINALDI F.R., SCIASCIA S. (2017), “Women’s involvement in family firms: Progress and challenges for future research”, Journal of Family Business Strategy, vol. 8, n. 4, pp. 200-212.
CASSIA L., DE MASSIS A., GIUDICI F. (2011), “I family business e la successione padre-figlia nella cultura italiana: un caso di studio”, Piccola Impresa/Small Business, vol. 1, n. 1, pp. 65-87.
CESARONI F.M., SENTUTI A. (2010), “Nuove generazioni ed evoluzione dell’impresa familiare: la sfida della successione imprenditoriale. Analisi di alcuni casi di successo”, Piccola Impresa/Small Business, vol. 2, pp. 63-94.
CESARONI F.M., SENTUTI A. (2014), “Women and family businesses. When women are left only minor roles”, The History of the Family, vol. 19, n. 3, pp. 358-379.
CHABCHOUB N., NIOSI J. (2005), “Explaining the propensity to patent computer software”, Technovation, vol. 25, pp. 971-978.
CHADWICK I.C., DAWSON A. (2018), “Women leaders and firm performance in family businesses: An examination of financial and nonfinancial outcomes”, Journal of Family Business Strategy, vol. 9, pp. 238-249.
COLE P.M. (1997), “Women in family business”, Family Business Review, vol. 10, n. 4, pp. 353-371.
COOK A., GLASS C. (2015), “Diversity begets diversity? The effects of board composition on the appointment and success of women CEOs”, Social Science Research, vol. 53, pp. 137-147.
CORBETTA G. (2010), Le aziende familiari, EGEA, Milano.COX T. (1994), Cultural diversity in organizations: Theory, research and practice,
Berrett-Koehler Publishers.CURIMBABA F. (2002), “The Dynamics of Women’s roles as family business
managers”, Family Business Review, vol. 15, n. 3, pp. 239-252.D’ALLURA G.M. (2019), “The leading role of the top management team in
understanding family firms: Past research and future directions”, Journal of Family Business Strategy, vol. 10, n. 2, pp. 87-104.
DAUTZENBERG K. (2012), “Gender differences of business owners in technology‐based firms”, International Journal of Gender and Entrepreneurship, vol. 4, pp. 79-98.
DAVIS S.M. (1968), “Entrepreneurial succession”, Administration Science Quarterly, vol. 13, pp. 403-416.
DIBRELL C., MEMILI E. (2019), “A Brief History and a Look to the Future of Family Business Heterogeneity: An Introduction”, In: Memili E., Dibrell C. (Eds), The Palgrave Handbook of Heterogeneity among Family Firms, Springer International Publishing, Cham, pp. 1-15.
DUMAS C. (1992), “Integrating the Daughter into Family Business Management”, Entrepreneurship Theory and Practice, vol. 16, pp. 41-56.

73
DUMAS C. (1998), “Women’s pathways to participation and leadership in the family-owned firm”, Family Business Review, XI , n. 3, pp. 219-228.
FAGENSON E.A. (1993), Women in management: Trends, issues, and challenges in managerial diversity, Sage Publications, Inc.
GALLUCCI C. (2010), La diversità di genere nel wine family business. Un’indagine sul ruolo e sulle performance di una leadership al femminile, Torino Giappichelli Editore.
GALLUCCI C., GENTILE G. (2009), “Imprese familiari e fabbisogno di governance nel processo di successione generazionale”, Esperienze d’Impresa, vol. 1 , pp. 5-57.
GALLUCCI C., SANTULLI R., CALABRÒ A. (2015), “Does family involvement foster or hinder firm performance? The missing role of family-based branding strategies”, Journal of Family Business Strategy, vol. 6, pp. 155-165.
GHERARDI S., PERROTTA M. (2016), “Daughters taking over the family business: Their justification work within a dual regime of engagement”, International Journal of Gender and Entrepreneurship, vol. 8, n. 1, pp. 28-47.
GREENE W.H. (2018), Econometric analysis. Pearson Education Limited, Harlow.HABERMAN H., DANES S.M. (2007), “Father-daughter and father-son family
business management transfer comparison: Family FIRO model application”, Family Business Review, vol. 20, n. 2, pp. 163-184.
HAMBRICK D.C., MASON P.A. (1984), “Upper echelons: The organization as a reflection of its top managers”, Academy of Management Review, vol. 9, n. 2, pp. 193-206.
HANEL P., ST-PIERRE A. (2002), “Effects of R & D Spillovers on the Profitability of Firms”, Review of Industrial Organization, vol. 20, pp. 305-322.
HOLLANDER B.S., BUKOWITZ W.R. (1990), “Women, family culture, and family business”, Family Business Review, vol. 3, n. 2, pp. 139-151.
HORSTMANN I., MACDONALD G.M., SLIVINSKI A. (1985), “Patents as Information Transfer Mechanisms: To Patent or (Maybe) Not to Patent”, Journal of Political Economy, vol. 93, pp. 837-858.
KAFOUROS M.I., BUCKLEY P.J., SHARP J.A., WANG C. (2008), “The role of internationalization in explaining innovation performance”, Technovation, vol. 28, pp. 63-74.
KANTER R.M. (1977), “Some Effects of Proportions on Group Life: Skewed Sex Ratios and Responses to Token Women”, American Journal of Sociology, vol. 82, pp. 965-990.
KEATING N.C., LITTLE H.M. (1997), “Choosing the successor in New Zealand family farms”, Family Business Review, vol. 10, n. 2, pp. 157-171.
KONRAD A.M., KRAMER V., ERKUT S. (2008), “Critical Mass: The Impact of Three or More Women on Corporate Boards”, Organizational Dynamics, vol. 37, p. 145-164.
KENNEDY P. (2003), A guide to econometrics (6. ed.), MIT Press, Cambridge, Massachusetts.
MANSFIELD E. (1986), “Patents and Innovation: An Empirical Study”, Management Science, vol. 32, pp. 173-181.
MARLOW S., MCADAM M. (2012), “Analyzing the Influence of Gender Upon High-Technology Venturing Within the Context of Business Incubation”, Entrepreneurship Theory and Practice, vol. 36, pp. 655-676.
MONTEMERLO D., PROFETA P. (2009), “La gender diversity nelle aziende familiari italiane. Una risorsa da valorizzare”, Economia e Management, vol. 6 , n. 2009, pp. 314-328.
Mariasole Bannò Graziano CollerGiorgia M. D’AlluraFamily firms, women, and innovation

sinergieitalian journal of management Vol. 39, Issue 2, 2021
74
PAVITT K. (1984), “Sectoral patterns of technical change: towards a taxonomy and a theory”, Research Policy, vol. 13, n. 6, pp. 343-373.
POST C., BYRON K. (2015), “Women on Boards and Firm Financial Performance: A Meta-Analysis”, Academy of Management Journal, vol. 58, pp. 1546-1571.
SCHERER F.M. (1983), “The propensity to patent”, International Journal of Industrial Organization, vol. 1, pp. 107-128.
SILA V., GONZALEZ A., HAGENDORFF J. (2016), “Women on board: Does boardroom gender diversity affect firm risk?”, Journal of Corporate Finance, vol. 36, n. 1, pp. 26-53.
SMITH N., SMITH V., VERNER M. (2006), “Do women in top management affect firm performance? A panel study of 2,500 Danish firms”, International Journal of Productivity and Performance Management, vol. 55, n. 7, pp. 569-593.
SONGINI L., GNAN L. (2009), “Women, glass ceiling, and professionalization in family SMEs: A missed link”, Journal of Enterprising Culture, vol. 17, n. 4, pp. 497-525.
TÀPIES J., WARD J. (Eds.), (2008), Family values and value creation: The fostering of enduring values within family-owned businesses, Springer.
TERJESEN S., SEALY R., SINGH V. (2009), “Women directors on corporate boards: A review and research agenda”, Corporate governance: An international review, vol. 17, n. 3, pp. 320-337.
TORCHIA M., CALABRÒ A. HUSE M. (2011), “Women Directors on Corporate Boards: From Tokenism to Critical Mass”, Journal of Business Ethics, vol. 102, pp. 299-317.
VERA C.F., DEAN M.A. (2005), “An examination of the challenges daughters face in family business succession”, Family Business Review, vol. 18, n. 4, pp. 321-345.
VINNICOMBE S., COLWILL N.L. (1995), The essence of women in management (pp. 79-106), Prentice Hall, London.
WESTPHAL J.D., MILTON L.P. (2000), “How Experience and Network Ties Affect the Influence of Demographic Minorities on Corporate Boards”, Administrative Science Quarterly, vol. 45, pp. 366.
WHITTINGTON K.B. (2011), “Mothers of Invention?: Gender, Motherhood, and New Dimensions of Productivity in the Science Profession”, Work and Occupations, vol. 38, p. 417-456.
WOOLDRIDGE J.M. (2013), Introductory econometrics: a modern approach, South-Western Cengage Learning, Melbourne.
Academic or professional position and contacts
Mariasole BannòAssociate Professor of Applied Economics University of Brescia - ItalyE-mail: [email protected]
Graziano CollerAssociate Professor of Business Economics University of Trento - ItalyE-mail: [email protected]
Giorgia M. D’AlluraAssistant Professor of Management University of Catania - ItalyE-mail: [email protected]
sinergieitalian journal of management
ISSN 0393-5108 DOI 10.7433/s115.2021.04
pp. 59-74

75
Decision trees to identify companies’ distress: the AI at work
Sergio Barile - Irene Buzzi - Ernesto D’Avanzo Francesca Iandolo
Abstract
Frame of the research: The main subject of investigation is represented by the valuation of a company’s distress, adopting decision trees, a well-established artificial intelligence methodology to automatically identify a combination of attributes to explain two target variables of interest, that is the zone of discrimination and cut off. The proposed methodology allows for the representation of decision processes according to paths on the tree’s branches, or through a set of easily browsable if-then rules.
Objectives: The study aims to examine whether and how artificial intelligence (AI) may facilitate the joint comprehension of corporate distress and corporate legality. The main subjects of investigation are both represented by the valuation of the company’s distress, as well as by the legality rating (LR), which is a measure of the company’s degree of legality. The combination of a new set of variables, allows to understand - within a given range of accuracy - the company’s financial health, and conversely, the company’s distress, regardless of the Altman Z-score.
Methodology: The dataset is composed of companies in possession of legality ratings. Two experimental settings, which make use of decision trees, allow us in this study to automatically identify the unique combination of variables from the dataset that explains two target variables - ‘zone of discrimination’ and ‘cut off ’ - from the standpoint of a unique perspective; one that is not considered by the Altman Z-score.
Findings: AI allows for the identification of a new ‘basket’ of variables, one different from those employed by the Altman Z–score. These variables may be used to determine a company’s level of distress. The experiments test the ‘ability’ of the algorithm to identify a combination of variables to predict the target value. It is thereby possible to analyse in which way these variables operate alongside one another to produce with accuracy the correct identification of the target variable. In light of this scenario, the contribution of the study is the identification of two algorithms able to determine two settings of if-then rules that produce the same outcomes obtainable through the application of the Altman Z-score model, without directly using the model itself.
Research limits: The methodology described above was required to determine a plausible interval for the variables identified by the decision trees. The current development of the research, however, reveals that the methodology still needs to be adapted in order to determine the plausible intervals for the variables identified by the decision trees. In fact, the dimensionality of the dataset could benefit from resampling the variables for the proposed methodology, which suffers from certain degrees of skew.
Practical implications: The AI methodology can process large amounts of records within a given dataset, thereby allowing for the testing of the effectiveness of LR in the assessment of creditworthiness.
Received18th February 2020
Revised 20th April 2020
Accepted 2nd July 2021

sinergieitalian journal of management Vol. 39, Issue 2, 2021
76
Originality of the study: The recognition and composition of the new variables can be interpreted as a tool to strengthen the comprehension of the company’s distress.
Key words: company’s distress; legality rating; artificial intelligence; decision tree; Z-score
1. Introduction
The study aims to examine whether and how artificial intelligence (AI) may suggest and facilitate a different joint comprehension of distress (Vulpiani, 2014) and legality within the business context.
The legality rating (LR) system is employed to measure the company’s degree of legality. It was introduced by the Italian legal system through the Legislative Decree n.1/2012, and it measures a company’s compliance along a scale of values - from ‘*’ to ‘***’ (see Section 2)- in relation to the different levels of achieved legality. The current Italian regulatory framework suggests that companies, in possession of a LR, can benefit from certain advantages when accessing credit both from public administrations and banks.
This study evaluates the financial performance of the Italian companies in possession of a LR, by examining their distress, using as a benchmark the Altman Z-score, which is a bankruptcy prediction model.
The novelty of the paper is represented by the employment of decision trees (DTs), a well-established artificial intelligence methodology (Quinlan, 1993; Mitchell, 1997; Witten, 2011; Barile et al., 2019; D’Avanzo et al., 2018), to automatically identify a combination of attributes (from 2 to 7, out of 101 variables) to explain two target variables of interest; that is, the zone of discrimination and cut off. The proposed method uses a new ‘basket of variables’, different from those employed by the Altman Z-score, in order to identify a company’s distress zones’. The proposed methodology allows for the representation of decision processes according to paths on the tree’s branches, or through a set of easily browsable if-then rules (Anderson et al., 2015; Masias et al., 2015).
The recognition and composition of these new variables, which were previously not considered by Altman's formulation, can be interpreted as a tool to reinforce understanding of a company's distress. In fact, the new variables and attributes consider other aspects of the company's financial profile, which collectively can be translated into a model for understanding said company’s financial health.
The paper is organised as in the follows. Section 2 reports on the LR, companies’ distress, and Altman’s Z-score; these factors represent the benchmark for the subsequent analysis. Section 3 contains a description of the artificial intelligence methodology employed. Section 4 reports on the experimental settings - describing, respectively, how DTs identify zones of discrimination and cut off targets. The final section discusses the results and depicts the conclusion.

77
Sergio Barile Irene Buzzi Ernesto D’Avanzo Francesca IandoloDecision trees to identify companies’ distress: the AI at work
2. Background
Company’s distress and its evaluation
Analysts usually differentiate between financial and operational distress (Vulpiani, 2014). The former occurs when the values of equity and debt show probabilities of default. The latter is related to sporadic events or factors, such as economic downturns, employee turnover, and so on.
Bankruptcy is recognized as the last threshold of distress (Pratt, 2010; Damodaran, 2002), whereas financial distress is usually considered the last step before bankruptcy, as it is present when it is impossible to generate revenues or incomes to meet or to pay financial obligations.
To assess the severity of business distress, most of the time one employs bankruptcy prediction models, which, usually, are divided into ‘accounting-ratio-based’, ‘market-based’, and ‘hybrid-based’.
Altman’s Z-score, and its subsequent variants, belong to the category of an accounting-ratio-based model, which works with information and data collected from the financial statements1.
According to Altman's formulation, the ‘zone of discrimination’ allows for the classification of the companies into three zones: safe zone, grey zone, and distress zone, whereas the ‘cut off ’ divides the companies according to the zone of possible distress and the zone of potential solvency. In other words, a zone of discrimination identifies companies with a well-defined financial profile (namely, solvent, insolvent, and to be determined), while a cut off deals with uncertainty, since it allows for a better understanding of the conduct of companies falling into the grey zone, defined by the zone of discrimination. In other words, the cut off establishes a demarcation line of the financial behaviour, suggesting when the zone of discrimination is grey.
Legality rating: general features
The LR is a measure of the degree of legality, valid only within the Italian legal system. It is a voluntary rating, granted by the Italian Competition Authority (AGCM) at the request of the interested party.
To obtain a LR, companies must comply with the following requirements:- operational headquarters in Italy;- a minimum turnover of two million euros in the last financial year
closed by the time of the request for the rating - this stands for a single company or group which has requested the rating, and evidence provided must come from a financial statement approved and published under the law;
- at the date of the LR request, the business must have been registered for at least two years;
- compliance with the other substantive requirements of the AGCM.The base score of LR is ‘*’, one star, granted to companies that comply
with all the substantive legislative requirements. In fact, these basic
1 See ‘Supplementary materials' published online on www.sijm.it’ for a detailed explanation about the three models.

sinergieitalian journal of management Vol. 39, Issue 2, 2021
78
requirements refer both to the legal persons requesting the rating, and and to the individuals they represent.
This type of requirements include, for instance, the absence of precautionary measures or penal sentences for convictions related to crimes against national and European Institutions, social security, as well as a history of compliance with law provisions.
The base score may be increased by a ‘+’ for each additional requirement which the company meets. For instance, one additional requirement2 is the adoption of protocols or legal agreements aimed at preventing and counteracting the infiltration of organised crime into the legal economy. Another requirement is represented by the use of payment tracking systems which include the tracking of payments of sums of amounts lower than those required to be tracked by law, or another involves the adoption of organisational models for the prevention of and defence against corruption.
The achievement of three ‘+’ rewards the attribution of an additional ‘*’, up to a maximum score of ‘***’ (i.e. three stars).
Tab. 1: Legality rating - Requirements
Purpose RequirementsRequest of LR Cumulatively:
• operational headquarters in Italy• turnover ≥ € 2 million• registered in the business register for at least two years
‘*’ Achievement Compliance with the other substantive requirements‘+’ increase Compliance with an additional requirement‘*’ increase Compliance with three additional requirements
Source: authors’ elaboration on LR requirements, AGCM.
The possible combinations of LR in relation to their requirements are summarised in the following table.
Tab. 2: Legality rating scores
Rating Requirements* Basic requirements*+ Basic requirements and 1 additional requirement*++ Basic requirements and 2 additional requirements** Basic requirements and 3 additional requirements**+ Basic requirements and 4 additional requirements**++ Basic requirements and 5 additional requirements*** Basic requirements and 6 additional requirements
Source: authors’ elaboration on LR requirements, AGCM.
A LR lasts two years from the date of issuance, is renewable on request, and is free of charge.
2 See ‘Supplementary materials’ for the full list of the additional requirements.

79
Company’s distress and legality rating
As mentioned above, the adoption of a LR allows firms to benefit from certain advantages when accessing credit. For instance, both public administrations and banks, when granting loans, consider the company’s LR. Companies, when seeking loans from public administrators, enjoy at least one of the following rewards if they have a respectable LR:- preference in ranking;- attribution of a higher credit rating;- share reserve of the financial resources allocated.
Regarding access to bank credit, the potential benefits of LR while dealing with banks should include the reduction of the investigation time, better economic conditions when requesting or renegotiating the loan, and the reduction of investigation costs.
In relation to the access to bank credit, the Italian legal system actively encourages Italian financial institutions to consider LR among the parameters in assessing a company’s creditworthiness.
In fact, Italian banks are encouraged to define and formalise internal procedures to regulate the use of LR. Financial institutions take LR into account to determine loans’ conditions of disbursement whenever relevant.
In light of these considerations, LR is related to the company’s creditworthiness, and by consequence, to the company’s distress. In fact, the higher the creditworthiness, the lower the likelihood of bankruptcy.
3. Methodology and data
Since LR is a measure of the degree of legality, valid only within the Italian legal system, the dataset employed in the following experiments is exclusively composed of Italian companies. In particular, it involves qualitative and quantitative information of 6,005 Italian companies, extracted from the Bureau van Dijk database, AIDA. All of the companies under investigation have their own LR.
The sample includes companies whose LR was conferred for the first time, or renewed by the Italian Competition Authority (AGCM) and updated on 12/10/2018. The list of companies is publicly available on the AGCM website. Companies have been classified into four geographical areas (North East, North West, Centre, South, and Insular) according to the NUTS 1 (Nomenclature of Territorial Units for Statistics at the first level - subdivision for Groups of Regions), based on the region of the operational headquarters. In cases lacking this information, the companies were classified based on the legal headquarters with which they had registered.
The size-class of a company considers three parameters, and defines four categories of companies: micro, small, medium, and big3.
3 This classification is borrowed from the Italian Legislative Decree n. 139/2015, which distinguishes the limited companies (società di capitali) based on quantitative parameters
Sergio Barile Irene Buzzi Ernesto D’Avanzo Francesca IandoloDecision trees to identify companies’ distress: the AI at work

sinergieitalian journal of management Vol. 39, Issue 2, 2021
80
Tab. 3: Size-classes
Size-class Parameters (at least two out of three)Total Assets Sales Revenues Employees
Micro ≤ € 175,000 ≤ € 350,000 ≤ 5Small ≤ € 4,400,000 ≤ € 8,800,000 ≤ 50Medium ≤ € 20,000,000 ≤ € 40,000,000 ≤ 250Large > € 20,000,000 > € 40,000,000 > 250
Source: Legislative Decree n. 139/2015
As said above, in order to better grasp the peculiarities of the Italian business context, this research uses Altman's Z-Score as a corporate bankruptcy prediction model4. This choice originates from the main intrinsic features of the Z-score, which are suitable for non-listed companies. This characteristic allows the Z-score to fit with the companies within our sample. The data used to calculate the Z-score refers back to the 2016 financial year.
The cut off corresponds to a Z-score equal to 2.675 (Altman, 2013). Compared to this value, companies with a higher Z-score fall into the potential solvency category, while companies with a lower Z-score fall into the possible distress category. However, it is undisputed that when Z-score is lower than 1.23, companies are surely in the distress zone, and when Z-score is higher than 2.90 companies are surely in the safe zone. Consequently, the cut-off analysis allows us to better understand the performance of companies with a Z-score from 1.23 to 2.90, which fall into the grey zone. In other words, the cut-off could be interpreted as a measure of uncertainty.
After having illustrated the main features of the sample, and the criteria referring to the profiling of the zone of discrimination and the cut-off, it would be suitable to highlight the key concepts related to the AI methodology used in the research.
Decision trees are a classification scheme, widely employed both to represent and to run decision processes (Anderson et al., 2015), which themselves generate a tree and a set of rules from a given dataset (Witten and Frank, 2011). They represent a useful graphical tool, as they allow for an intuitive understanding of a problem, and can aid decision-making, since they are interpretable through if-then rules by any professional - including trainees, even if he or she is not trained in computer applications. Users can refer to rules generated by the DT in order to make decisions, since such rules are based on a short-ordered list of features (also referred to as attributes).
Experiments introduced below employ an implementation of the C4.5 DT algorithm, developed by Quinlan (1993). The C4.5 DT algorithm classifies instances (i.e. companies’ records) by sorting them down from the root to some leaf nodes. It provides the classification of the instances according to the values of a given target attribute (e.g. a cut-off that can assume two values: possible distress and potential solvency). Nodes of the DT specify a testing of some features describing the instances, such as 4 See ‘Supplementary materials’ for a more complete discussion.

81
Return on Assets (ROA) at the root node of the DT, shown in Figure 5. Branches descending from nodes correspond to one of the possible values the attribute may assume; for instance, in the case of the tree depicted in Figure 6, the root attribute may assume two sets of possible values: 21.54%, and > 21.54%. The same process is repeated for the sub-tree rooted at the new node. Looking at Figures 5 and 6, after testing ROA at the root node, the C4.5 DT algorithm jumps on the right and left branches, based on the two sets of value the root feature may assume, and, if this is the case, then the algorithm tests other variables (e.g., Total Debt% on the left branch); otherwise, it stops. The process is repeated until a leaf node is reached, where the class label is present, such as in the tree represented in Figure 6, where it corresponds to possible distress and potential solvency.
As a feature selection methodology - i.e. which feature/attribute is to be tested at each node of the tree - used in the experiments introduced below, Information Gain has been employed (Mitchell, 1997). Information Gain is strictly related to Entropy (Mitchell, 1997), or an index of the purity of a dataset, since it only represents the expected reduction in entropy that results from the partition of the examples according to this attribute.
Experiments performed have been tested using different evaluation metrics (Fawcett, 2006). As a first evaluation metric, accuracy has been employed. This measures how often the DT makes the correct prediction by calculating the ratio between the number of correct predictions and the total number of predictions. Accuracy, however, does not distinguish between false-positives and false-negatives. For such a kind of evaluation, the confusion matrix was employed, showing a detailed breakdown of correct and incorrect classifications for each class; such sorts of information would otherwise be lost just looking at the overall accuracy.
A precision score estimates how many cases are needed so that the DT assigns an extraction target, while recall allows for the determining of how many cases are found to be true by the DT, out of all the true cases.
4. AI at work
Preliminary considerations on the sample
This section reports on some preliminary considerations on the features of the sample dataset employed.
An analysis from descriptive statistics has allowed for the exploring of certain macro aspects, such as legality rating, zone of discrimination, and cut-off, concerning four geographic areas.
Companies are classified by their geographic areas, and in comparison to this variable, other variables are assessed. First and foremost, the sample’s geography shows an uneven composition: the number of firms belonging to the Centre and the North East regions are, respectively, 24% lower than the average, and 16% higher than the average.
Concerning the LR, cross-region trends arise: the most recurring LR is ‘*+’, present in almost one-third of the sample. The higher the LR (‘**++’ or ‘***’), the lower the diffusion within the sample (about 5%).
Sergio Barile Irene Buzzi Ernesto D’Avanzo Francesca IandoloDecision trees to identify companies’ distress: the AI at work

sinergieitalian journal of management Vol. 39, Issue 2, 2021
82
Moreover, in all geographic areas, the LR featured by ‘*’ (and its variants - ‘*+’ and ‘*++’) amounts to two-thirds of the whole sample.
The relative frequency of each LR-class, assessed by geographic area, does not differ significantly from the average value. It can be therefore derived that the four geographic areas show the same average LR regardless of distribution.
Fig. 1: Legality rating vs. geographic area
79 82 79 10482 81 75 75
154 117 82124
275215
182254
387365
252
422
597
418
370
540
178
214
116
170
0
200
400
600
800
1000
1200
1400
1600
1800
2000
North East North West Centre Sounth and Insular
# of
com
pani
es
Rating
Area
*
*+
*++
**
**+
**++
***
Source: authors’ elaboration
370 266 184 282
1.235
988
820
1.161
155
154
131
259
0
200
400
600
800
1000
1200
1400
1600
1800
2000
North East North West Centre Sounth andInsular
# of
com
pani
es Zone of discrmination
Area
distress zone
grey zone
safe zone
Source: authors’ elaboration
Secondly, a common cross-geographical trend emerges also around the zones of discrimination (as derived from Z-score). This means that in all four areas, roughly the same percentages for each zone of discrimination applied: safe zone - around 20%; grey zone - around 70%; and distress zone - around 10%. It is relevant to note that a consistent portion of the sample is composed of companies featuring an uncertain financial profile.
Moreover, companies in the distress zone were situated mainly in the South (37%), whereas those marked as within the safe zone were significantly present in the North East.
In the following chart, these considerations are expressed in relation to absolute frequencies.
Fig. 2: Zone of discrimination vs. geographic area
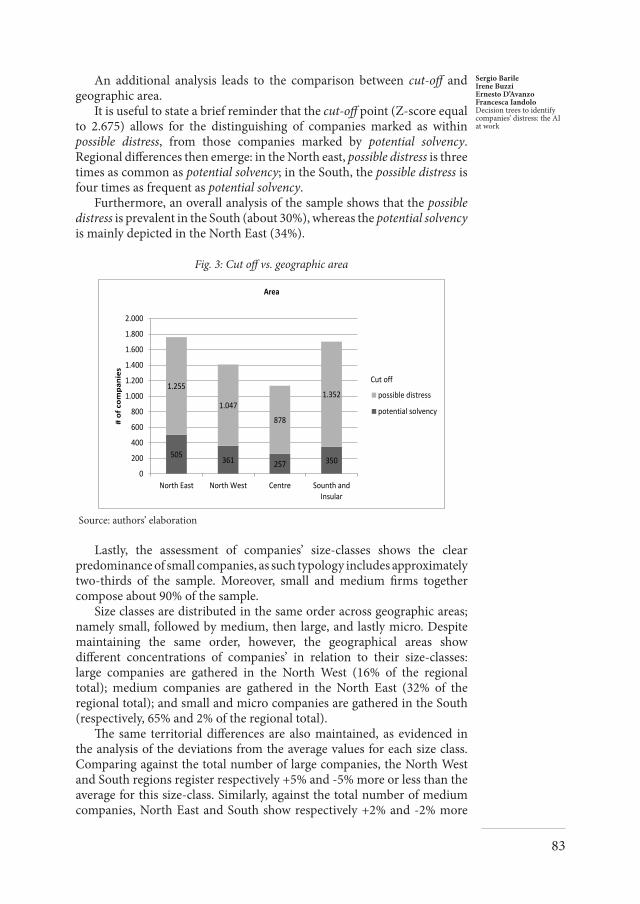
83
An additional analysis leads to the comparison between cut-off and geographic area.
It is useful to state a brief reminder that the cut-off point (Z-score equal to 2.675) allows for the distinguishing of companies marked as within possible distress, from those companies marked by potential solvency. Regional differences then emerge: in the North east, possible distress is three times as common as potential solvency; in the South, the possible distress is four times as frequent as potential solvency.
Furthermore, an overall analysis of the sample shows that the possible distress is prevalent in the South (about 30%), whereas the potential solvency is mainly depicted in the North East (34%).
Fig. 3: Cut off vs. geographic area
Source: authors’ elaboration
Lastly, the assessment of companies’ size-classes shows the clear predominance of small companies, as such typology includes approximately two-thirds of the sample. Moreover, small and medium firms together compose about 90% of the sample.
Size classes are distributed in the same order across geographic areas; namely small, followed by medium, then large, and lastly micro. Despite maintaining the same order, however, the geographical areas show different concentrations of companies’ in relation to their size-classes: large companies are gathered in the North West (16% of the regional total); medium companies are gathered in the North East (32% of the regional total); and small and micro companies are gathered in the South (respectively, 65% and 2% of the regional total).
The same territorial differences are also maintained, as evidenced in the analysis of the deviations from the average values for each size class. Comparing against the total number of large companies, the North West and South regions register respectively +5% and -5% more or less than the average for this size-class. Similarly, against the total number of medium companies, North East and South show respectively +2% and -2% more
505 361 257 350
1.255
1.047
878
1.352
0
200
400
600
800
1.000
1.200
1.400
1.600
1.800
2.000
North East North West Centre Sounth andInsular
# of
com
pani
es
Cut off
Area
possible distress
potential solvency
Sergio Barile Irene Buzzi Ernesto D’Avanzo Francesca IandoloDecision trees to identify companies’ distress: the AI at work

sinergieitalian journal of management Vol. 39, Issue 2, 2021
84
or less than the average of the size-class. Conversely, regarding the total of small companies, the North West and South regions mark respectively -6% and +7% more or less than the average for this size-class. Lastly, against the total number of micro-companies, the Centre and South regions display divergent dynamics (respectively -1% and +1% more or less than the average of this size class).
Fig. 4: Size-class vs. geographic area
Source: authors’ elaboration
The inquiry is composed of two experiments aimed at analysing two different target variables; respectively, the zone of discrimination (experiment 1) and cut off (experiment 2).
In this section, we illustrate the experimental setting, the if-then rules, the metrics, and the DTs of each experiment.
The rules shown in both the experiments are those generated in the training phase, and, therefore, each of the counts refer to this step. It may be appropriate to generate everything in the test phase, so as to align with the measurement metrics.
Experiment 1: DT to identify ‘zone of discrimination’ target
The first experiment assesses the ‘zone of discrimination’ as the target variable - the values of which, in relation to the Z-score, can be: safe zone, grey zone, and distress zone.
The goal of the experiment is to test the ability of the algorithm to identify a combination of variables, used then to predict the target without considering the pre-written variables of ‘cut off ’ and ‘Z-score’ in the dataset.
The experimental setting for the first experiment is described in the following table.
17 19 8 30
937
697644
1038
531
417
314
441
189
210
112
88
0
100
200
300
400
500
600
700
800
900
1000
1100
1200
1300
1400
1500
1600
1700
North East North West Centre South and Insular
Num
ero d
i rec
ord Size-class
Area
big
medium
small
micro

85
Tab. 4: Experimental setting (experiment 1)
Number of initial records 6,005Number of records after the
elimination of ‘N/A’ values5,726
Target variable Zone of discriminationValues of the target variable DISTRESS ZONE
GREY ZONESAFE ZONE
Features of the experimental setting
The variables ‘cut off ’ and ‘Z-score’ are eliminated in order to test the ability of the algorithm to identify a combination of variables
to predict the target.Data partition for training and
testingTraining set: 4,580
Test set: 1,146Total: 5,726
Feature selection method Gain ratioPruning method Minimal Description Length
Source: authors’ elaboration
This experiment identifies eight if-then rules (R1 - R8), and consequently, the best practices that generate the respective DT. Before illustrating each rule and its outcome, in the following table an explanation of the financial meaning of the variables involved in the first experiment is provided.
Tab. 5: Financial meaning of the rules (experiment 1)
Variable Financial meaningTotal Debt% Total debt/Total liabilities and equityROA ROA (Return on Assets)EBIT EBIT (Earnings Before Interest and Taxes)Non-current assets % Non-current assets/Total AssetsSales Sales
Source: authors’ elaboration
R1 is made up of two variables; Total Debt% and ROA. The outcome of the first rule is the prediction of the safe zone.
R2 is made up of four variables that predict the distress zone. The variables are EBIT, Non-current assets %, Total Debt%, and ROA.
R3 predicts the safe zone thanks to five variables: Total Assets, ROA, EBIT, Non-current assets %, Total Debt%, and ROA.
Five variables Sales, Total Assets, ROA, EBIT, Non-current assets %, Total Debt%, and ROA are featured in R4, which predicts the distress zone.
R5 has six variables - Sales, Total Assets, ROA, EBIT, Non-current assets %, Total Debt%, and ROA - that predict the grey zone.
R6 comprises of four variables, ROA, EBIT, Non-current assets %, and Total Debt%, and predicts the safe zone.
R7 has three variables, namely Non-current assets %, Total Debt%, and ROA, that predict the distress zone.
Lastly, R8 is made up of one variable, ROA, which predicts the safe zone.
In order to better explain the results expressed above, a brief summary of the if-then rules, their outcomes, the record count, and the number of correct cases is presented in the following table.
Sergio Barile Irene Buzzi Ernesto D’Avanzo Francesca IandoloDecision trees to identify companies’ distress: the AI at work

sinergieitalian journal of management Vol. 39, Issue 2, 2021
86
Tab. 6: If-then rules (experiment 1)
if-then rules (best practices) Outcome Record count
Number of correct cases
R1 IF Total Debt% ≤ 18.204271574863533 AND ROA ≤ 22.86
Safe zone 112 95
R2 IF EBIT ≤ -374.7615 AND Non-current Assets% ≤ 76.30784360563888 AND Total Debt% > 18.204271574863533 AND ROA ≤ 22.86
Distress zone 106 71
R3 IF Total Assets ≤ 1138.336 AND ROA ≤ 15.934999999999999 AND EBIT > -374.7615 AND Non-current Assets% ≤ 76.30784360563888 AND Total Debt% > 18.204271574863533 AND ROA ≤ 22.86
Safe zone 101 65
R4 IF Sales ≤ 1633.301 AND Total Assets > 1138.336 AND ROA ≤ 15.934999999999999 AND EBIT > -374.7615 AND Non-current Assets% ≤ 76.30784360563888 AND Total Debt% > 18.204271574863533 AND ROA≤ 22.86
Distress zone 101 55
R5 IF Sales > 1633.301 AND Total Assets > 1138.336 AND ROA ≤ 15.934999999999999 AND EBIT > -374.7615 AND Non-current Assets% ≤ 76.30784360563888 AND Total Debt% > 18.204271574863533 AND ROA ≤ 22.86
GREY ZONE 3,731 2,997
R6 IF ROA > 15.934999999999999 AND EBIT > -374.7615 AND Non-current Assets% ≤ 76.30784360563888 AND Total Debt% > 18.204271574863533 AND ROA ≤ 22.86
Safe zone 202 139
R7 IF Non-current Assets% > 76.30784360563888 AND Total Debt% > 18.204271574863533 AND ROA ≤ 22.86
Distress zone 109 82
R8 IF ROA > 22.86 AND TRUE
Safe zone 118 113
Total 4,580 3,617 Source: authors’ elaboration
In order to give a complete illustration of the first experiment, its metrics are outlined in two tables.
Tab. 7: Metrics - Part 1 (experiment 1)
Zone of discrimination GREY ZONE Safe zone Distress zoneGREY ZONE 736 35 33
Safe zone 115 95 1Distress zone 85 2 44
Source: authors’ elaboration
Tab. 8: Metrics - Part 2 (experiment 1)
Correct classified 875Wrong classified 271
Accuracy 76,353%Error 23,65%
Cohen’s Kappa 0,406 Source: authors’ elaboration
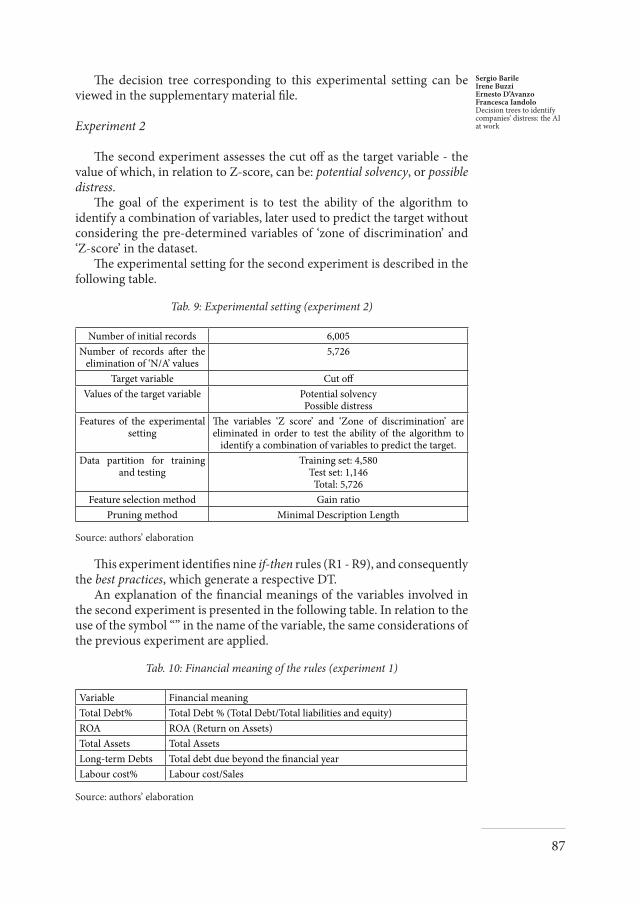
87
The decision tree corresponding to this experimental setting can be viewed in the supplementary material file.
Experiment 2
The second experiment assesses the cut off as the target variable - the value of which, in relation to Z-score, can be: potential solvency, or possible distress.
The goal of the experiment is to test the ability of the algorithm to identify a combination of variables, later used to predict the target without considering the pre-determined variables of ‘zone of discrimination’ and ‘Z-score’ in the dataset.
The experimental setting for the second experiment is described in the following table.
Tab. 9: Experimental setting (experiment 2)
Number of initial records 6,005Number of records after the
elimination of ‘N/A’ values5,726
Target variable Cut offValues of the target variable Potential solvency
Possible distressFeatures of the experimental
settingThe variables ‘Z score’ and ‘Zone of discrimination’ are eliminated in order to test the ability of the algorithm to
identify a combination of variables to predict the target.Data partition for training
and testingTraining set: 4,580
Test set: 1,146Total: 5,726
Feature selection method Gain ratioPruning method Minimal Description Length
Source: authors’ elaboration
This experiment identifies nine if-then rules (R1 - R9), and consequently the best practices, which generate a respective DT.
An explanation of the financial meanings of the variables involved in the second experiment is presented in the following table. In relation to the use of the symbol “” in the name of the variable, the same considerations of the previous experiment are applied.
Tab. 10: Financial meaning of the rules (experiment 1)
Variable Financial meaningTotal Debt% Total Debt % (Total Debt/Total liabilities and equity)ROA ROA (Return on Assets)Total Assets Total AssetsLong-term Debts Total debt due beyond the financial yearLabour cost% Labour cost/Sales
Source: authors’ elaboration
Sergio Barile Irene Buzzi Ernesto D’Avanzo Francesca IandoloDecision trees to identify companies’ distress: the AI at work

sinergieitalian journal of management Vol. 39, Issue 2, 2021
88
R1 is made up of two variables; Total Debt% and ROA. The outcome of the first rule is the prediction of the potential solvency.
R2 has three variables, namely Total Assets, ROA, Total Debt%, and predicts the potential solvency.
R3 predicts the potential solvency thanks to three variables: Total Debt%, Total Assets, ROA.
Five variables are featured in R4: Long-term Debts, Labor cost%, ROA, Total Debt%, and Total Assets. The outcome of the fourth rule is the prediction of the potential solvency.
R5 has five variables that predict the possible distress. The variables involved are: Long-term Debts, Labor cost%, ROA, Total Debt%, and Total Assets.
R6 predicts the possible distress. In order to produce this outcome, four variables are involved: Labor cost%, ROA, Total Debt%, Total Assets.
R7 comprised of three variables: ROA, Total Debt%, and Total Assets. The outcome is the prediction of the potential solvency.
R8 has two variables, ROA and Total Debt%, that predict the potential solvency.
Lastly, R9 is defined by one variable, ROA, which predicts the potential solvency.
In the following table, in relation to the second experiment, a brief summary of the if-then rules, their outcomes, their record count, and their number of correct cases, is presented.
Tab. 11: If-then rules (experiment 2)
if-then rules (best practices) Outcome Record count
Number of correct cases
R1 IF Total Debt% ≤ 18.196832168335906 AND ROA ≤ 21.54 Potential solvency
125 116
R2 IF Total Assets ≤ 1241.238 AND ROA ≤ 16.055 AND Total Debt% > 18.196832168335906 AND ROA ≤ 21.54
Potential solvency
149 99
R3 IF Total Debt% ≤ 25.066864783615408 AND Total Assets > 1241.238 AND ROA ≤ 16.055 AND Total Debt% > 18.196832168335906 AND ROA ≤ 21.54
Potential solvency
101 63
R4 IF Long-term Debts ≤ 318.2925 AND Labor cost% ≤ 4.276964813170087 AND ROA ≤ 13.614999999999998 AND Total Debt% > 25.066864783615408 AND Total Assets > 1241.238 AND ROA ≤ 16.055 AND Total Debt% > 18.196832168335906 AND ROA ≤ 21.54
Potential solvency
137 79
R5 IF Long-term Debts > 318.2925 AND Labor cost% ≤ 4.276964813170087 AND ROA ≤ 13.614999999999998 AND Total Debt% > 25.066864783615408 AND Total Assets > 1241.238 AND ROA ≤ 16.055 AND Total Debt% > 18.196832168335906 AND ROA ≤ 21.54
Poss ible distress
157 119
R6 IF Labor cost% > 4.276964813170087 AND ROA ≤ 13.614999999999998 AND Total Debt% > 25.066864783615408 AND Total Assets > 1241.238 AND ROA ≤ 16.055 AND Total Debt% > 18.196832168335906 AND ROA ≤ 21.54
Poss ible distress
3,497 3,085
R7 IF ROA > 13.614999999999998 AND Total Debt% > 25.066864783615408 AND Total Assets > 1241.238 AND ROA ≤ 16.055 AND Total Debt% > 18.196832168335906 AND ROA ≤ 21.54
Potential solvency
112 66
R8 IF ROA> 16.055 AND Total Debt% > 18.196832168335906 AND ROA ≤ 21.54
Potential solvency
177 134
R9 IF ROA > 21.54 Potential solvency
125 120
Total 4,580 3,881 Source: authors’ elaboration

89
In order to give a complete illustration of the first experiment, its metrics are outlined in two tables.
Tab. 12: Metrics - Part 1 (experiment 2)
Cut off Possible distress Potential solvencyPossible distress 807 57
Potential solvency 113 169
Source: authors’ elaboration
Tab. 13: Metrics - Part 2 (experiment 2)
Correctly classified 976Wrongly classified 170
Accuracy 85.166%Error 14.83%
Cohen’s Kappa 0.572 Source: authors’ elaboration
The decision tree corresponding to this experimental setting can be viewed in the supplementary material file.
5. Conclusion
The experiments performed show reveal an algorithm capable of identifying a combination of variables used later to predict the target, without considering the two variables of, respectively ‘cut off ’ and ‘Z-score’ (experiment 1), and ‘zones of discrimination’ and ‘Z-score’ (experiment 2), in the dataset.
Two different settings of if-then rules are featured in the experiments: the first identifies eight rules able to predict the values of the ‘zones of discrimination’, while the second determines nine rules, the outcomes of which are related to the values of the cut off.
Despite the unique targets typical of each experiment, and the different combinations of variables involved, the key role of the variable ROA - that is, Return on Assets - emerges in both cases. In fact, in both experiments, ROA is at the root node of the decision tree.
It should be noted that ROA corresponds with the variable X3 ((EBIT)/ Total Assets) of the Altman Z-score, connected to which is the highest weighting coefficient within the linear combination. This means that both the AI algorithms and the Altman Z-score model confer a pivotal role towards the same variable.
ROA (or EBIT/ Total Assets) represents a profitability ratio that suggests how a company can conduct business activity, regardless of the form of financing. In other words, this ratio depicts the ability of a company to create value through internal assets: the higher the ROA, the greater the ability to enhance the resources. It can be derived that ROA gives stakeholders an idea of management’s efficiency at using assets to generate earnings.
Sergio Barile Irene Buzzi Ernesto D’Avanzo Francesca IandoloDecision trees to identify companies’ distress: the AI at work

sinergieitalian journal of management Vol. 39, Issue 2, 2021
90
Both experiments share the use of one other variable - which, unlike the previous one, is not mentioned in the Altman Z-score model. This variable is Total Debt%, which is equal to total debt divided by total liabilities and equity.
This ratio is related to the company’s financial structure, and it expresses the weight of the total debt over the invested capital. According to another perspective, this ratio is complementary to the financial-independence index, equal to equity over invested capital. This comparison allows for the examination of the relationship between risk capital (equity) and debt capital, as well as allows the considering of the relationships between the remuneration of the former and the cost of the latter. Therefore, with the same invested capital, the higher the total debt, the lower the equity. It follows, then, that companies will prefer to use third-party capital, rather than their own capital.
From this brief explanation of the financial meaning of this variable emerges the conclusion that, despite its absence within the Altman Z-score model, Total Debt% works as a good predictor of the features associated with the company’s financial structure. For this reason, it is plausible that it may be used as a measure to represent both of the target variables (‘zone of discrimination’ and ‘cut off ’).
However, both experiments are marked by the presence of other variables missing in Altman’s Z-score model.
In particular, the first experiment also includes the following variables: Sales, EBIT, and Non-current assets %, which represents the non-current assets ratio.
Sales and EBIT are both items of the income statement, and so they pertain to the analysis of the company’s economic situation. Each express different sides of profitability: while sales refers to the value of a company’s sales of goods and services, where the revenue or income process begins, EBIT is a company’s net income before income tax expense and interest expenses have been deducted. Although EBIT is also present in the ROA formula, it is in this case considered to represent ROA’s absolute value. It represents a good indicator with which one can analyse the performance of a company’s core operations without considering the impact on profit of the costs of the capital structure and tax expenses.
The non-current assets ratio is given by the weight of non-current assets (fixed, intangible, and financial) over total assets, and it indicates the long-term methods involved in business operations to generate income.
This ratio pertains to the assessment of the financial position, and is complementary to the current asset ratio. This means that, when total assets are equal, the higher the value of fixed assets the lower the value of current assets - and by extension a higher number of assets are not expected to be consumed or converted into cash in the short period.
The second experiment considers three variables not included in Altman’s Z-score model: Total Assets (total assets), Long-term Debts (total debt due beyond the financial year), and Labor cost% (personnel costs ratio). These variables pertain to two different sides of evaluation: the first two are related to the financial assessment, while the second to economic analysis.

91
Total assets represent the total amount of invested capital, and so the variable gives a measure of the resources with economic value that are able to generate cash flow, reduce expenses, or improve sales. Total assets are given by the sum of all non-current assets (fixed, intangible, and financial) and all current assets, which are the short-term resources expected to be converted into cash within one year.
Total debt due beyond the present financial year represents the non-current liabilities, and so the liabilities to be paid over the medium to long period.
The personnel costs ratio is given by the personnel costs (salary and wage expenses) on sales. Personnel costs are included within the operating costs - a negative component that contributes to determining the operating result. It can be derived that, when sales are equal, the higher the personnel costs are the lower are the operating costs and, consequently, the net income.
In light of this scenario, the contribution of the study is the identification of two algorithms able to determine two settings of if-then rules that produce the same outcomes obtainable through the application of the Altman Z-score model, without directly using the model itself.
It derives that, thanks to the combination of a new set of variables, it is possible to understand - within a given range of accuracy - the company’s financial health, and conversely, the company’s distress, regardless of the Altman Z-score.
The current development of the research reveals that the methodology still needs to be adapted in order to determine the plausible intervals for the variables identified by the decision trees. In fact, the dimensionality of the dataset could benefit from resampling the variables for the proposed methodology, which, even using high-quality software and hardware, suffers from certain degrees of skew.
However, the identified algorithms are a powerful tool that strengthens the comprehension of a companies’ financial profile. Since they work with large amounts of data, they are even more significant.
This algorithm is thus an asset of great value, when used in relation to the peculiarities of the sample under investigation, as all the companies are in possession of a LR.
The practical implications related to this finding may be addressed uniquely to various actors.
For example, banks may wish to employ a methodology, which is different to the Altman Z-score model, to monitor companies’ financial profiles. In detail, financial institutions may perform comparative evaluations when granting loans to companies in possession of legality ratings: the financial health of these kinds of companies may be assessed vis-à-vis the financial profile of the other companies seeking bank credit. In addition to the company’s individual financial assessment, banks may benefit from a set of rules to monitor the comprehensive financial status of the above-mentioned forms of companies.
Furthermore, companies themselves may be the recipients of this research’s achievement. Management can monitor competitor companies requesting for legality ratings (the companies’ list is freely available on the
Sergio Barile Irene Buzzi Ernesto D’Avanzo Francesca IandoloDecision trees to identify companies’ distress: the AI at work

sinergieitalian journal of management Vol. 39, Issue 2, 2021
92
AGCM website), and their financial performance. So, from a perspective of competition, by virtue of an AI methodology, management may make a relative self-evaluation of its own company in relation to a set benchmark. It can be derived that a virtuous circle is triggered by avoiding downward competition.
Moreover, the policy-maker may take advantage of the AI methodology in order to assess the coherence of law provisions on legality rating, and the ratings’ concrete impacts. It may allow the testing of the effectiveness of LR in the assessment of creditworthiness, and may potentially encourage amendments aimed to align the regulation’s intent with the real bank-company relationship.
In consideration of the link between LR and a company’s distress, the AI toolbox is able to process large amounts of records within a given dataset, thus allowing for the testing of the effectiveness of LR in the assessment of creditworthiness.
References
ALTMAN E.I. (1968), “Financial Ratios. Discriminant Analysis and the Prediction of Corporate Bankruptcy”, The Journal of Finance, n. 23, pp. 589-609.
ALTMAN E.I. (1983), Corporate Financial Distress, Wiley Interscience, New YorkALTMAN E.I. (2000), Predicting Financial Distress of Companies: Revisiting The
Z-Score and Zeta, Handbook of Research Methods and Applications in Empirical Finance, 5.
ALTMAN E.I., HARTZELL J., PECK M. (1995), Emerging Markets Corporate Bonds: A Scoring System, Salomon Brothers Inc. New York.
ALTMAN E.I., HOTCHKISS E. (2006), Corporate Financial Distress and Bankruptcy, 3rd edition, Hoboken, NJ, J. Wiley & Sons.
ALTMAN E.I. (2013), “Predicting financial distress of companies: revisiting the Z-Score and ZETA® models”, in Handbook of Research Methods and Applications in Empirical Finance, Cheltenham, UK: Edward Elgar Publishing.
ANDERSON D.R., SWEENEY D.J., WILLIAMS T.A., CAMM J.D., COCHRAN J.J. (2015), An introduction to management science: quantitative appROAches to decision making, Cengage Learn.
BARILE S., PICIOCCHI P., BASSANO C., SPOHRER J.C., PIETRONUDO M.C. (2019), “Re-defining the role of artificial intelligence in wiser service systems”, Kacprzyk J. (Ed.), Advances in Intelligent Systems and Computing (AISC), Vol. 787, Springer International Publishing AG, part of Springer Nature, Switzerland, pp. 159-170.
D’AVANZO E., D’ANTÒ V., MICHELOTTI A., MARTINA R., ADINOLFI P., PANGO MADARIAGA A.C., ZANOLI R (2018), “A Collaborative Web Service Exploiting Collective Rules and Evidence Integration to Support Sustainable Orthodontic Decisions”, Journal of Cleaner Production, n. 176, pp. 813-826.
DAMODARAN A. (2002), Investment valuation: Tools and Techniques for Determining the Value of Any Asset, John Wiley and Sons, Inc.

93
MASÍAS V.H., KRAUSE M., VALDE S.N., PEREZ J.C., LAENGLE S. (2015), “Using decision trees to characterize verbal communication during change and stuck episodes in the therapeutic process”, Front. Psychol., n. 6, p. 379.
MITCHELL T.M. (1997), Machine Learning, 1 ed. McGraw-Hill, Inc., New York, NY, USA.
OHLSON J.A. (1980), “Financial ratios and the probabilistic prediction of bankruptcy”, Journal of Accounting Research, vol. 18, n. 1, pp. 109-131.
PRATT S.P., GRABOWSKI R.J. (2010), Cost of Capital - Fourth edition, John Wiley and Sons, Inc., New York.
QUINLAN R.J. (1993), C4.5: Programs for Machine Learning, Morgan Kaufmann Publishers Inc., San Francisco, CA, USA.
VULPIANI M. (2014), Special Cases of Business Valuation, McGraw-Hill, Milano.WITTEN I.H., FRANK E. (2011), Data Mining: Practical Machine Learning Tools
and Techniques, Morgan Kaufmann.
Academic or professional position and contacts
Sergio Barile Full Professor of Management Sapienza University of Rome - Italye-mail: [email protected]
Irene Buzzi Ph.D. student in Management, Banking, and Commodity Sciences Sapienza University of Rome - Italye-mail: [email protected]
Ernesto D’AvanzoAssociate Professor of ManagementUniversity of Trento - Italye-mail: [email protected]
Francesca IandoloPh.D., Assistant Professor of ManagementSapienza University of Rome - Italye-mail: [email protected]
Sergio Barile Irene Buzzi Ernesto D’Avanzo Francesca IandoloDecision trees to identify companies’ distress: the AI at work
sinergieitalian journal of management
ISSN 0393-5108 DOI 10.7433/s115.2021.05
pp. 75-93


95
Received2nd March 2020
Revised 29th April 2020
Accepted 15th July 2021
Online public engagement is the New Deal! Along the distinctive pathway of the Italian University
Letizia Lo Presti - Giulio Maggiore - Vittoria Marino
Abstract
Frame of the research: A managerial perspective of public engagement can help universities to strengthen the communication of university identity from a social, scientific, or accessibility point of view.
Purpose of the paper: The goal of this paper is to investigate the concept of the online university public engagement from a managerial standpoint by examining those Italian universities that have engaged in Third Mission activities thanks also to recent ministerial decrees issued on the subject.
Methodology: A content analysis of the main official websites of 50 Italian universities was performed. An exploratory factorial analysis made it possible to identify the main approaches to online public engagement.
Findings: There are 4 main dimensions of online public engagement that have been communicated on Italian websites (social, cultural, research and widening engagement), each referring to a specific target. A so-called “Cultural engagement” approach emerges which underlines the role of the university as a pole of cultural and artistic attraction.
Research limits: The research explores public engagement only in the Italian context. Although the article investigates more than 50% of the Italian universities, it does not allow the extension of the results to the reference population.
Practical implications: Research results contribute to the understanding of online public engagement and map the current uses of stakeholder engagement activities in the university context to date.
Originality of the paper: The research enriches the knowledge of the online public engagement construct thanks to the identification of a new dimension “Cultural engagement”, that had not yet emerged in international contexts.
Key words: public engagement; web communication; managerial perspective; stakeholder; third mission; cultural engagement.
1. Introduction
Major changes that have affected the university world for some years now and due largely to strong pressure from society for a more participatory role of university institutions, have certainly been amplified by the new digital tools. It is now possible to communicate and share university strategies and activities with an enlarged community in almost real time thus allowing them to become the protagonists in a process of

sinergieitalian journal of management Vol. 39, Issue 2, 2021
96
close-knit integration with their territory and with their community. Universities are gradually abandoning their “ivory tower” to descend more and more often into the reality that surrounds them so that the knowledge they produce can be used for the benefit of their community. The Third Mission and public engagement, one of its main pillars, does precisely this and concretizes the osmotic idea of a relationship between a university and its territory, between the results of scientific research and their benefits for the community, between the processes of growth and social improvement, all activated through the virtuous circuits and synergies created between universities and society.
In particular, public engagement implies that universities listen to and interact with their internal and external communities; social networks and official websites seem to constitute valuable tools in strengthening engagement with all the stakeholders. Indeed, the simplicity, speed and diffusion of social networks may favour the creation of an effective bridge between research, teaching, and public services as they increase the possibility of stimulating the dialogue between and with the public. Despite the fact that the academic literature is unanimous in considering universities as the “engine” of change and social development (e.g. Kerr, 2001; Furco, 2010), yet little has been studied on development opportunities that the university can offer to the territory through the public engagement lever. In Italy, in particular, the potential of public engagement is still poorly understood and there are still many areas of application in our universities which remain unexplored. A synchronized use of all the levers of engagement can help create relationships of trust with citizens as well as new relationships between universities and citizens, universities and businesses, universities and the academic community (e.g. Baccarani, 1995; Stephenson, 2011; Chilvers, 2013; Bandelli and Konijn, 2013; Watermeyer and Lewis, 2018; Goldner and Golan, 2018; Lo Presti and Marino 2019). Public engagement therefore represents a cultural interpretative perspective of the relationships between universities and communities that cannot be separated from the use of digital communication tools (Marino and Lo Presti, 2017; 2018; Lo Presti and Marino, 2019). But how have Italian universities implemented public engagement? And above all how have they communicated and shared it through their digital media? This study aims to investigate the ways in which Italian universities have dealt with public engagement and what dimensions are used the most. Studying university public engagement through communication on official websites has inevitable managerial implications. In fact, by measuring what is actually communicated on the websites, it is possible to rethink and/or design those dimensions that have not yet received visibility. In addition, studies on university public engagement can help strengthen the communication of university identity from a social, scientific or accessibility point of view, depending on the positioning that the university wants to communicate to its public of reference.

97
Letizia Lo PrestiGiulio MaggioreVittoria Marino Online public engagement is the New Deal! Along the distinctive pathway of the Italian University
2. Background
2.1 The Third Mission of Universities
The significance of the Third Mission of University Institutions has its roots in the last century. Many trace its birth back to 1963 when the rector of the University of California Clark Kerr, in a speech at Harvard, introduced the concept of “Multiversity” thus paving the way for a new idea of University (Multi vs Uni) to be seen as the centre of a community, capable of both including and enhancing its differences and of interpreting those social changes that, stemming from the economic boom of the 1960s, gave way to global transformations around the world. The central point of the disruptive vision of this enlightened rector is the understanding of how the University had shut itself inside its own boundaries, sitting high in the exclusivity of its own circles, disconnected from its territory and people, and that it would soon implode on itself, accelerating society’s perception of its deep detachment from the contemporary world. The University must become a community that creates value for society, thus contributing to the development of human capital and enabling it to face the new challenges of globalization. This innovative idea of University spread quickly and found a wide consensus; and pressure for an increasingly widespread awareness in this regard became stronger and stronger until it finally concretised in the form of recommendations and/or regulatory provisions from the authorities. A “new institutional aim” for universities was thus declared as being part of an open and dynamic system, increasingly interlaced with the external environment (Piccaluga, 2000). In addition to its traditional educational and research purposes (First and Second Mission), university institutions are now increasingly involved in a process of sharing and disseminating knowledge, due to the need to support an economic and social development that goes beyond the academic boundaries (Third Mission). In the very concept of the Third Mission lies the idea that the University is a resource for the territory itself (Cognetti, 2013) and that it must implement strategies and practices that takes its actions outside its actual premises (Gleeson, 2010). The Third Mission aims to enhance the social role of the University - a role, however, that can be interpreted with differing intensity, through different degrees of public involvement, such as awareness, consultation, collaboration or shared leadership. Furco (2010) uses the term “engaged campus” in order to emphasize the single objective of its tripartite mission. The author argues that university campuses can be defined as “engaged” when each mission has the same priority and when not only does the university engages its community of reference, but it is often called upon by the public with whom it interacts to collaborate, thus enabling a virtuous circle in which truly authentic strategies of engagement, aimed at establishing value and lasting relationships with the stakeholders, come into play. The last two decades of the 20th century, particularly in Anglo-Saxon countries, saw numerous attempts to implement management models in order to confer more substance to the Third Mission. This multitude of more or less virtuous cases have given rise to an international case study whose goal is the definition of best practices and, therefore, valid

sinergieitalian journal of management Vol. 39, Issue 2, 2021
98
criteria for measuring performance and impact on the territory. In Italy, the debate on the Third Mission is in full swing.
With regard to Italy, ANVUR, the National Agency for the Evaluation of the University System and Research, in its Public Announcement for The VQR 2004-2010, defined eight indicators of the Third Mission, most of them linked to financially valorising research, research contracts and subcontracted consulting, patents, spin-offs, participation in think-tanks and consortia with technological transfer purposes; other indicators referred to the enhancement of knowledge for the well-being of society, such as the management of archaeological sites, museum poles and other activities. An open category for “other activities of the Third Mission”, broad and indefinite, shows a conceptual confusion that yet has not been fully clarified. In fact, creating a single final indicator for the Third Mission proved to be problematic and opened a phase of discussion and elaboration in the agency that saw the establishment of a group of Experts of the Third Mission for the analysis of evaluation criteria, possible indicators and sources, and the organisation of several workshops on the state of the art of the Third Mission indicators. With the second research assessment, the 2011-2014 Research Quality Assessment (VQR 2011-2014) where better tools tested by ANVUR were in fact used, the results of the assessment showed significant differences between universities, in particular in terms of comparability. As a result, it became clear that further reflection was needed on the definition of the Third Mission and its measurement. More recently, the Third Mission Assessment Manual for Italian Universities was approved and published in 2015 by ANVUR, effectively making the Third Mission one of the assessment parameters of research quality, together with Life-Long Learning and Public Engagement. In fact, according to some Authors, the Third Mission system can therefore be segmented into three main ambits: innovation and technology transfer; permanent education; Public Engagement (Boffo et al., 2015). In the first area - innovation and technological transfer - research is transformed into knowledge useful for production purposes, using an entrepreneurial approach. Whereas in the other two ambits of permanent education and social engagement, a logic of community service tends to prevail through cultural, social, educational or civil content contributions, capable of enhancing and multiplying the collective resources: an invisible revolution that scholars have long highlighted at an international level - the overcoming of the traditional academic self-exaltation thanks to an increased interdependence with the surroundings in a mutually advantageous exchange of diverse strategic resources. This change of perspective in Italy is also evident in the last evaluation of the research (VQR 2015-2019). The Third Mission appears strengthened in the ability to give relevance to the University Institution in its territory, confirming and expanding the parameters of evaluation. The evidence of this activity is given through the case studies which, presented in limited numbers by the department and/or institution, must be able to illustrate the social, economic and cultural dimension of the impact, the relevance with respect to the reference context, the added value for the beneficiaries, the contribution of the proposing structure. Following a standard scheme provided directly by Anvur, with this new method of

99
presenting the results, an attempt was made to limit the risk of a conceptual confusion represented by the summary that was required in previous assessments.
2.2 Public Engagement: its Foundation and Purpose
Unlike the other areas of the Third Mission, Public Engagement remains, above all in Italy, a pillar of the Third Mission still to be explored and consolidated. Much attention is being focused today on this subject in view of the progressive financial squeeze that has been plaguing the university system for years, driving them more and more towards a collaboration with the world of business and local authorities. And if society as a whole does not fully understand the value produced by Universities and does not share its objectives, it will be increasingly difficult to attract the resources necessary for research, knowledge and progress, either from the public sector or from the private sector. Many initiatives, especially at an international level, aimed at coordinating the dissemination of scientific research and at enhancing scientific studies and research were already widely implemented well before what is the current level of diffusion of public engagement. In October 2002, a short article in Science informed the scientific community about the term “Public Understanding of Science” (PUS), better known as the Bodmer.
Report dating back to 1985, was now obsolete and, to indicate the increasingly complex relationship between scientific research and society, it was necessary to introduce a more explicit terminology to render its re-conceptualization and emphasise the dimension of public involvement: the “Public Engagement with Science and Technology” (PEST). The PUS was based on the assumption that the public passively receive the knowledge produced by the scientific community. The translation of the results of their research into a language that everyone understood was entrusted to the mass communication channels who used a language that was mostly improper and sometimes trivial and had the opposite effect to what was intended thus to all effects increasing the gap between science and the general public. No longer a diffusion of scientific knowledge and research results only and exclusively from the top down, today the focus is on a dialogue between the scientific communities and society in order to make the social consequences of science more and more effective, efficient and understandable. The one-way communication process, which has always characterized the transfer of knowledge, has also begun to feed off this dialogue between equals and the participation of those who will subsequently be the users and/or beneficiaries of that knowledge, and therefore sets off the involvement process right from the initial definition of its research paths and shares the dissemination of the results.
There have been some important foreign initiatives in this regard. The National Co-ordination Centre for Public Engagement (NCCPE) was founded in 2008 in the United Kingdom to assist universities in improving the quality and effectiveness of their public engagement activities. It is probably the institution that more than any other has inspired the philosophy of current public engagement and has made it a working
Letizia Lo PrestiGiulio MaggioreVittoria Marino Online public engagement is the New Deal! Along the distinctive pathway of the Italian University

sinergieitalian journal of management Vol. 39, Issue 2, 2021
100
priority for all those who carry out basic and applied research activities. The same body defines public engagement as “[...] the myriad of ways in which the activity and benefits of higher education and research can be shared with the public. Engagement is by definition a two-way process, involving interaction and listening, with the goal of generating mutual benefit” and identifies the following three macro categories of goals that Public Engagement must necessarily pursue. 1. Inspire, inform and educate the public and make the results of the university’s work more accessible. 2. Activate permanent listening to the public’s point of view, their concerns and any further knowledge they may require. 3. Work directly with the participation of the public to solve problems together and activate the mutual exchange of skills. The Carnegie Foundation in the United States has worked for years to increase the efficiency of public and private institutions, certifying universities as “community-engaged institutions” through a five-year survey of the extent of public engagement based on the documentation that the agencies involved spontaneously provide to the Foundation. The Carnegie Foundation uses the following definition of community engagement “the collaboration between institutions of higher education and their larger communities (local, regional/state, national, global) for the mutually beneficial exchange of knowledge and resources in a context of partnership and reciprocity” (The Carnegie Foundation for the Advancement of Teaching, 2013). In Italy, Anvur describes public engagement as a set of non-profit initiatives of educational, cultural, and societal value, as illustrated in its Handbook for the Evaluation of the Third Mission of 2015. It also shows that the activity and benefits of higher education and research can be conveyed and shared with the public in a variety of ways and adds a number of activities that can be considered fully part of Public Engagement (Anvur, 2015). Subsequently, due to the confusion that still remains on the subject and the very heterogeneous measurements that were made in the first VQRs, during the first Assembly of the APEnet (Italian Network of Universities and Research Bodies for Public Engagement) in March 2018, in collaboration with ANVUR, a review of the definition of Public Engagement was proposed that, as a result of the critical issues which emerged, further specified the types of activities and recipients of the same. As a result, public engagement can be described as a collection of activities coordinated institutionally by the University or its non-profit structures that have educational, cultural, or societal value and are directed at a non-specialist audience. It is evident in this first classification, that the institutional nature of the activities that are part of Public Engagement and the need to address a non-specialist public has been highlighted, but it also confirms the fact that the definition of what public engagement is exactly and how it is to be implemented still remains, in Italy and in most cases also abroad, an unfinished work that certainly needs further investigation.
2.3 Public Engagement in the perspective of management studies
Despite its immediate conceptual association, the study of public engagement has been addressed from different perspectives, revealing
101
the complexity of how its actions are to be identified and implemented to enable the participation of the Public. In the strictly managerial sphere, public engagement is linked to the need for greater stakeholder involvement in the activities and in choosing organizations. There are many contributions present in the literature that, through qualitative and quantitative methodological approaches, illustrate theoretical experiences, best practices and frameworks (Bandelli and Konijn, 2013; Borum et al., 2017; Bruning et al., 2006; Curtis, 2014; Domegan, 2008; Hart and Northmore, 2011; Kim, 2007; Watermeyer, 2012, 2016; Watermeyer and Lewis, 2018). Studies on the subject converge towards the search for a unique definition of the phenomenon and the dimensions of the construct (Hart and Northmore, 2011) but little has been said about the nature of Public Engagement, its determinants, or the context in which it is studied (Davies, 2013a, 2013b; Hart and Northmore, 2011; Watermeyer and Lewis, 2018).
Being able to observe Public Engagement in action at a university represents a great opportunity not only because of the great changes that are affecting the academic world but also because it allows us to circumscribe the phenomenon within well-defined boundaries. It is dealt with from three different perspectives: in relation to the context; in terms of the efficiency of its activities; and, finally, in relation to its usefulness for those who implement it and for those who benefit from it.
Preliminary studies on Public Engagement date back to 2004 in the ambit of Public Management and Communication and to 2006 for the Marketing area. But it has been the last five years that have shown a significant quantitative increase in the number of articles published in all thematic areas, demonstrating the growing interest in the subject. In particular, previous research has shown that University Public Engagement can be found mostly in the Communication Area, only partly in the Area of Public Management and residually in the Marketing Area (Marino and Lo Presti, 2018; Lo Presti and Marino, 2019). One of the most important studies (Hart and Northmore, 2011) identified the dimensions of public engagement, each of which can be identified as an objective for a specific target, both at the level of potential users and at the level of individuals directly involved in the organization, laying the groundwork for the definition of a theoretical framework of reference (Tab. 1).
It is evident that public engagement can be understood as an articulated construct that involves interaction and bidirectional exchange between two parties in order to co-create knowledge. In understanding the ultimate goal of public engagement, it is important to focus more and more on resources and intangible relationships (Vargo and Lush, 2004). In this way, value can be created through interaction that allows a co-creation process. Once again it is Vargo and Lush who introduce the interpretative scheme of the Service-Dominant Logic which is based on the assumption that organizations are interested in the exchange of services, that is, “the application of skills by one entity for the benefit of another” (Vargo and Lush, 2008). This, in practice, implies the recognition of the fact that the value of the service is generated collaboratively through a network of one’s own resources that, once made available and integrated with each other, contribute to the co-
Letizia Lo PrestiGiulio MaggioreVittoria Marino Online public engagement is the New Deal! Along the distinctive pathway of the Italian University

sinergieitalian journal of management Vol. 39, Issue 2, 2021
102
creation of value. The service ecosystem construct, adopted in the Service-Dominant Logic (S-D Logic), underlined the awareness of the opportunities arising from adequate resource management through the integration of economic, social and political actors and fostered the foundation of the concept of service ecosystem (Vargo and Lusch, 2016). Even though there is agreement in the literature on the dimensions of public engagement and its objectives, there is still much debate regarding the different perspectives used for its definition and how it is to be implemented. Some authors see public engagement as a series of activities aimed at bringing the general public closer to science, stimulating informal debate and dialogue, for example students and teachers doing voluntary work.
Tab. 1: Subjects involved and beneficiaries for each dimension of university public engagement
N. Dimension Meaning Subjects involved Beneficiary subjects1 Public access to
facilitiesAccess to university structures: libraries, gyms; open-air spaces; multi-media rooms etc.
Citizens; Students (current and prospective students); parents; Non-profit organizations
Students; citizens
2 Public access to knowledge
Access and sharing of the results of the scientific research produced inside the university or in collaboration with the territory
Students, Enterprises; citizens; associations
University
3 Student engagement
Student involvement through voluntary activities or through collaboration with research
Students (current and prospective students)
Civil society
4 Faculty engagement
Involvement of the teaching staff in socially committed activities through voluntary activities or through the research for solutions to social problems
Academic staff; citizens
Civil society; territory
5 Widening participation
Activities for the constitution of partnerships with the territory
University Students, citizens
6 Encouraging economic regeneration
Technology transfer or industry consulting activities
University Firms and Institutions
7 Institutional relationships and partnership building
Activities aimed at the inclusion of subjects of discrimination by sex, race or physical condition
University Public Institutions; Associations
Source: our adaptation from Marino and Lo Presti (2019)
It therefore refers to a series of initiatives that Universities can put into place to achieve the objectives of Public Engagement. As an example, we have open labs, live science, open days, live demonstrations, meetings to explain scientific research. Such activities are usually aimed at a wide and undifferentiated audience of individuals, schools, parents and pupils,

103
businesses and the whole community who could be interested in an active participation in the event organized by the University.
From a more nuanced perspective, public engagement refers to a process of individual and collective problem solving on aspects related to scientific research whose main characteristic lies precisely in the involvement of stakeholders during the decision-making process. And it is precisely this involvement that stimulates innovation and the search for useful solutions (Bandelli and Konijn, 2013; Boland, 2014; Capurro et al., 2015; Kim, 2007; Krabbenborg and Mulder, 2015; Watermeyer, 2016). This type of interpretative perspective focuses on the connector, that is, on the relational node capable of establishing a conjunction between the parties involved, thus making Public Engagement a process that will ensure the realization of a stable stakeholder participation. The stronger and more stable the connection, the more significant the benefits that are produced for the network of actors. Today public engagement is still considered by some authors to be a strategy or method orientated to making science available to the general public but also to bringing about social changes and a stronger and fairer democracy (Bruning, et al., 2006; Curtis, 2014; Domegan, 2008 Fall, 2006; Hinchliffe, 2014; Miller et al., 2009; Tang et al., 2013; Tosse, 2013; Ward et al., 2008). It is a knowledge-production strategy that strengthens the university’s social role from an economic, social, and cultural standpoint (Davies, 2013a; Ostrander, 2004; Stephenson, 2011; Wilkinson et al., 2011).
Other studies see public engagement as a new way for universities to interact with their partners. In this situation, the University’s public engagement encourages a sense of citizenship and social conscience and brings the community closer to the academic world of universities, traditionally perceived as very distant from society. In this new vision, the term “public engagement” is often used to describe the scope of corporate social responsibility (CSR) (Boland, 2014). However, in order to connect with stakeholders, this modern vision necessitates institutional transformation, new curriculum frameworks, new capabilities, and a shift in conventional organizational models (Chilvers, 2013; Denson and Bowman, 2013; Kimmel et al., 2012; Persell and Wenglinsky, 2004; Retzbach and Maier, 2015; Stephenson, 2011). Finally, there are studies that see public engagement as a communication tool (Chilvers, 2013; Poliakoff and Webb, 2007). Encouraging dialogue, discussion, participation and enabling the dissemination of scientific knowledge beyond the academic walls, are strategic objectives of the universities and are more easily achieved through a kind of communication orientated specifically towards these purposes. Today, in order to set up new training proposals, to better focus on research and to increase the number of social actors involved, it is essential to focus on all the activities of the University as any loss of attention on the part of the public concerned would result in an immediate loss of efficiency and effectiveness of the services offered. The focus on technology and innovation of communication styles and tools and the need to be attractive to students, teachers and social partners, with the adoption of marketing strategies, advertising, guidance and fundraising, are issues that in the past hardly ever emerged publicly in the context of
Letizia Lo PrestiGiulio MaggioreVittoria Marino Online public engagement is the New Deal! Along the distinctive pathway of the Italian University

sinergieitalian journal of management Vol. 39, Issue 2, 2021
104
higher education, but today they have become necessary as the demand for university education and, consequently, its structures (Morcellini, 2005) increases. University communication today plays a strategic role as a tool in raising awareness in the general public of the role that the University plays in society today and its performance in every field of competence, especially in these times of identity crisis.
The literature also questions the results of public engagement in universities. One of the most important objectives is related to the dissemination of information related to the university world, increasing public awareness on all the scientific issues while maintaining a high interest, particularly in young people, for all the different scientific fields (Davies, 2013a; Curtis, 2014; Schoerning, 2018; Watermeyer, 2016; Wilkinson et al., 2011; Winter, 2004). This can also lead to an improvement in the image, reputation and identity of university institutions in the community (Ward et al., 2008; Watermeyer, 2016). It also improves the quality of learning as it is based on the actual needs of the community and helps to support businesses in their challenges by finding new opportunities in an ever-changing environment. The benefits of public engagement in terms of perceived quality are also evident in the collaboration between universities and communities to drive social and institutional change towards a more just society (Boland, 2014; Kimmel et al., 2012; Ostranger, 2004; Stephenson, 2011; Kimmel et al., 2012; Krabbenborg and Mulder, 2015). Public engagement also helps to build a deep synergy between academia and society in value co-creation processes, through the construction of learning action networks (LANs) that connect people through information and ideas (Dickerson-Lange et al., 2016; Hinchliffe et al., 2014; Kimmel et al., 2012; Stephenson, 2011; Watermeyer, 2012). But public engagement also stimulates emotional and experiential aspects and raises one’s level of personal satisfaction and enjoyment. In fact, science poles and museums serve as facilitators of public-scientist conversation and provide a valuable place for disseminating scientific content to the general public (Bandelli and Konijn, 2013; Chilvers, 2013; Denson and Bowman, 2013; Goldner and Golan, 2018; Miller et al., 2009; Wilkinson et al., 2011). Finally, public engagement, through the new online communication tools, facilitates the interaction between researchers, scientists and stakeholders, thus increasing accessibility, in particular for businesses, to the knowledge produced by scientists (Bandelli and Konijn, 2013; Chilvers, 2013; Denson and Bowman, 2013; Goldner and Golan, 2018; Miller et al., 2009; Wilkinson et al., 2011). The use of tools like websites and social networks, contributes to giving a greater impetus to public engagement and above all gives visibility to the multiple activities that fuel it.
3. Methodology
3.1 The sample
To assess the potential of the phenomenon of public engagement in countries like Italy that have only recently started to develop knowledge and sensitivity towards this phenomenon, we analysed the websites of

105
50 universities from a list of 98 universities (both public and private) present on the Italian territory and published on the ISTAT website for university institutions (www.ustat.miur.it). A study of the content of universities’ official websites was used to examine the online university public engagement using an evaluation grid already validated in the literature (Marino and Lo Presti, 2018; 2019) for the analysis of online public engagement in British and American universities. Furthermore, our research was based on the theoretical framework proposed by Hart and Northmore (2011) who define university public engagement as a 7-dimensional construct. Each dimension of public engagement was then operationalized for a total of 23 items (Marino and Lo Presti, 2017).
3.2 Website analysis and inter-rater reliability
In order to analyse the 50 university websites, a content analysis was adopted with a methodology consolidated in the literature in the context of university public engagement (Marino and Lo Presti 2018; 2019) and in the context of management (e.g. Schmidt et al., 2008). Content analysis permits us to analyse the phenomena that are still in an exploratory phase. According to Woodside et al. (2011), the richness of content and ease of use are two factors that contribute to the overall quality of a website. Exploring the content on websites and applying statistical methods to measure its effectiveness permits us to understand which are the most critical aspects and which ones need improvement. Furthermore, a content analysis of the websites explores the content while taking into account its presentation and its communicative effectiveness (Wan, 2002; Polillo, 2005; Gordon and Berhow, 2009; Polillo, 2013; Marino and Lo Presti, 2017). To evaluate each website, the evaluation grid was divided into two sections: the first section explores the presence or absence of public engagement and/or the Third Mission on its homepage; whereas the second section explores the quality of the communication, accessibility and the navigability of the information for each dimension of public engagement within the website (Marino and Lo Presti, 2017).
To carry out this task, three evaluators, experts on public engagement issues, assessed each aspect connected to each dimension of public engagement on a 5-point Likert scale (from 1 = definitely not visible to 5 = definitely visible) (Marino and Lo Presti, 2018; 2019). Before the assessment, the evaluators were “instructed” on how to compile the evaluation forms. In the presence of the authors of this paper, a pilot test was conducted in order to reduce the margins of error. Since the biggest limit of content analysis is subjectivity during the evaluation process, the coefficient of concordance was calculated, using Kendall’s W test for each dimension. This coefficient ranges from 0 (absence of concordance) to 1 (maximum concordance).
The concordance test revealed a wide agreement between the evaluators (W = 0.50 p = <0.01 for public access to knowledge; W = 0.60 p = <0.01 for widening participation; W = 0.62 p = <0.01 for public access to facilities; W = 0.52 p = <0.01 for “encouraging economic regeneration” dimension and finally, W = 0.66 p = <0.01 for the “institutional relationship and partnership
Letizia Lo PrestiGiulio MaggioreVittoria Marino Online public engagement is the New Deal! Along the distinctive pathway of the Italian University
sinergieitalian journal of management Vol. 39, Issue 2, 2021
106
building” dimension; W = 0.55 p = <0.01 for student engagement) and a discreet concordance for the faculty engagement dimension (W = 0.40 p = <0.01).
3.3 Reliability analysis and Exploratory Factor Analysis
For each dimension of university public engagement, the Item to Total Correlation (ITC) and Cronbach’s Alpha were used to perform a reliability analysis (Table 3). This analysis led to the elimination of the faculty engagement dimension, made up of three items, which do not seem to adequately represent the dimension (Cronbach’s Alpha <.65). The reliability analysis also made it possible to remove three other items that resulted from the analysis with Item to Total Correlation <.40 (Public engagement office within the Institutional partnership dimension; public databases and research involvement belonging to the Public knowledge dimension). At the end of this step, each dimension has a Cronbach Alpha > .65 and an ITC > .40 and the public engagement scale is composed of 17 items (Table 3). The overall Cronbach’s Alpha of the scale is .887 and an ITC > .415.
An exploratory factorial analysis was conducted on the assessment of the 17 items in order to detect the approaches to public engagement adopted by Italian universities on their official websites. In fact, Italian universities can also be distinguished by a different approach to public engagement that could well be connoted to the mission that the university institution has set itself to achieve. Furthermore, resources and skills in this sense are strategic to identify which “approach” could be more suitable in relation to the “university vocation” and how much of these must be strengthened in order to make this attitude manifest (Marino and Lo Presti, 2019).
4. Results
4.1 Descriptive analysis
The analysis of university public engagement through their official websites was conducted on the top 50 universities from a list that includes all Italian universities accredited by MIUR (51% of 98 universities). As can be seen in table 2, the analyses include the universities of Northern and Central Italy. Almost all the universities in the north-west and all those in the north-east of Italy were analysed. The analysis only partially includes the universities of Central and Southern Italy.
Of the 50 universities analysed, it was found that 28 universities presented a section dedicated to the Third Mission. 23 of these universities entered a reference to the Third Mission directly on the homepage accessible from the navigation bar. While only 24 universities report a section dedicated to Public engagement and, in 7 cases, this section can be reached from the homepage. While if we observe each single dimension of public engagement, the exploratory analysis of the websites gives a fairly homogeneous picture in terms of communication of the dimensions of
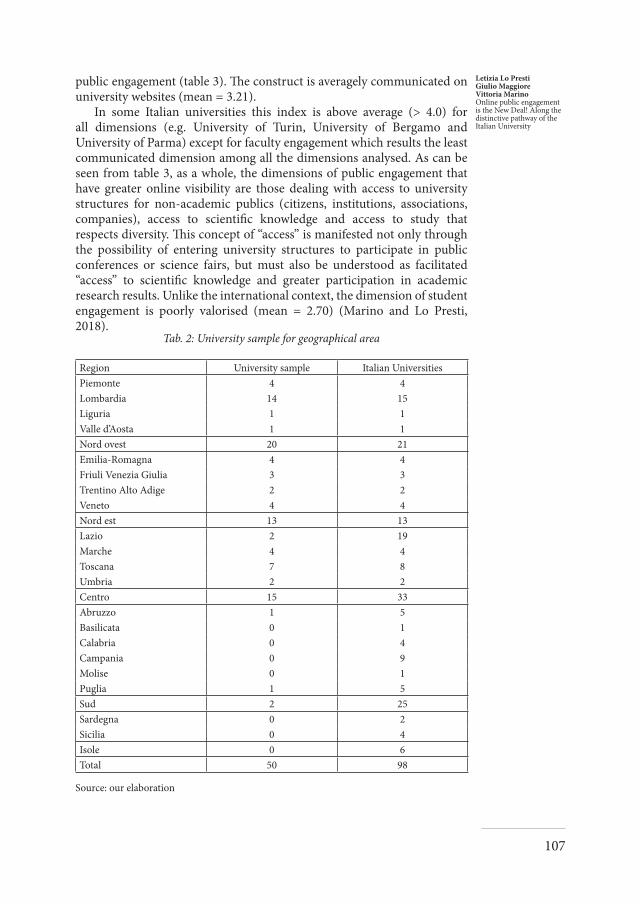
107
public engagement (table 3). The construct is averagely communicated on university websites (mean = 3.21).
In some Italian universities this index is above average (> 4.0) for all dimensions (e.g. University of Turin, University of Bergamo and University of Parma) except for faculty engagement which results the least communicated dimension among all the dimensions analysed. As can be seen from table 3, as a whole, the dimensions of public engagement that have greater online visibility are those dealing with access to university structures for non-academic publics (citizens, institutions, associations, companies), access to scientific knowledge and access to study that respects diversity. This concept of “access” is manifested not only through the possibility of entering university structures to participate in public conferences or science fairs, but must also be understood as facilitated “access” to scientific knowledge and greater participation in academic research results. Unlike the international context, the dimension of student engagement is poorly valorised (mean = 2.70) (Marino and Lo Presti, 2018).
Tab. 2: University sample for geographical area
Region University sample Italian UniversitiesPiemonte 4 4Lombardia 14 15Liguria 1 1Valle d’Aosta 1 1Nord ovest 20 21Emilia-Romagna 4 4Friuli Venezia Giulia 3 3Trentino Alto Adige 2 2Veneto 4 4Nord est 13 13Lazio 2 19Marche 4 4Toscana 7 8Umbria 2 2Centro 15 33Abruzzo 1 5Basilicata 0 1Calabria 0 4Campania 0 9Molise 0 1Puglia 1 5Sud 2 25Sardegna 0 2Sicilia 0 4Isole 0 6Total 50 98
Source: our elaboration
Letizia Lo PrestiGiulio MaggioreVittoria Marino Online public engagement is the New Deal! Along the distinctive pathway of the Italian University

sinergieitalian journal of management Vol. 39, Issue 2, 2021
108
In particular, the activities that promote student volunteer work or those that see the joint participation of students, teachers and communities in view of a common benefit for all, are on the whole not well developed. The “Institutional partnership” dimension also reports lower average values (mean = 2.65) than the public engagement index (mean=3.21) (calculated as Lo Presti and Marino, 2019), despite the fact that universities have shown themselves to be active in exploiting the possibility of enhancing visibility for web pages dedicated to the promotion of the university’s territory and the beauty of its landscape.
Tab. 3: Item Total Statistics
N. Dimension N. of Items
Mean Min. Max Variance Alpha di Cronbach
1 Public access to facilities 4 3.57 3.22 4.28 .23 .672 Public access to knowledge 2 3.83 3.50 4.16 .21 .65*3 Student engagement 4 2.70 2.18 3.76 .52 .704 Faculty engagement 3 2.02 1.06 2.74 .75 .27**5 Widening participation 2 3.55 3.32 3.78 .10 .896 Encouraging economic
regeneration3 3.18 2.70 3.46 .17 .82
7 Institutional partnership 2 2.65 2.10 3.20 .60 .66*Public engagement index 17 3.21 2.10 4.28 .42 .88
Note: * Cronbach’s alpha is calculated missing the items with the ITC <.40; **the dimension of Faculty engagement has a Cronbach’s Alpha <.65 for this reason therefore it was not taken into account for exploratory factorial analysis.
Source: our elaboration
4.2 Digital engagement approaches to online public engagement
Both the KMO index for the measurement of sample suitability equal to 0.728 (> of 0.50) and Bartelett’s sphericity test (<0.001 df = 136) confirm that the implementation of the factorial analysis was sufficient (Lattin et al., 2003). The Cronbach’s α (coefficient of reliability), for the single factors is acceptable (1st factor: 0.86; 2nd factor: 0.73; 3rd factor: 0.82; 4th factor: 0.73). All of the variables have a commonality of at least 0.50, indicating that the study was effective in producing a four-factor structure (Table 4).
The exploratory factorial analysis generated 4 dimensions of online public engagement. Compared to the American or English context (Marino and Lo Presti, 2018), Italian universities give much more space to “social engagement” such that it is possible to identify another approach to university public engagement that could fall into the “cultural engagement” category. Most likely this is related to the Italian culture which boasts a historical past of great value and which can then be found in its web communication.
As for the other dimensions, we can confirm a certain affinity with the other dimensions that emerged from the research of Marino and Lo Presti (2018) on British and American universities. In particular, the “research engagement approach” dimension is confirmed, which corresponds to

109
the “encouraging economic regeneration” dimension identified by Hart and Nortmore (2011) and which seems to be communicated quite well at Italian universities. Furthermore, while in American universities there is an office for public engagement in Italy this is not yet the case.
Tab. 4: Engagement approaches to online public engagement in the Italian sample
Dimensions of online public engagement
Items Widening engagement
Cultural engagement
Research engagement
SocialEngagement
5.b Strategy in favor of the public to encourage the access of students with disabilities
.976
5.a Financial assistance, peer-mentoring, etc. to improve recruitment and the success rate of students from non-conventional backgrounds
.940
1.d Public access to the sports facilities and to summer sports schools
.718
3.a Students doing voluntary work .632
4.a Activities organized by the students, e.g. art, environment, etc.
.591
1.c Sharing structures, e.g. museums, art galleries and entertainment organized by the university
.798
7.b Web site with pages dedicated to location or city
.752
7.c Conferences with public access to discuss social questions, e.g. ceremonies, awards, shows
.680
1.a Access to the university libraries .573
6.a Collaboration with research and technological transfer
.905
6.c Consultancy services for enterprises that produce and exchange goods and services of social utility (e.g. Social enterprises)
.834
6.b Initiatives for technological development (e.g. that brings together staff, students and members of the community to plan, and develop technology for people with disabilities)
.743
2.a Access to pre-established study programs .871
1.b Access to university spaces, e.g. for conferences, meetings, events, accommodation, gardens, walking tours, discovery programs, campus tours, etc.
.476 .626
2.b Public involvement in events, science fairs, science shops, etc
.623
3.b On-site learning, e.g. traineeships, collaboration in research projects, etc.
.415
3.c Curriculum engagement .338
Eignvalue 6.246 1.709 1.579 1.229
Percent of variance 36.743 10.054 9.288 7.228
Cumulative percent of variance 36.743 46.797 56.085 63.314
Note: Extraction Method: Principal Component Analysis. Rotation Method: Promax with Kaiser Normalization. Loading under 0.35 are not shown. The items were taken from the study conducted by Marino and Lo Presti (2018)
Source: our elaboration
Letizia Lo PrestiGiulio MaggioreVittoria Marino Online public engagement is the New Deal! Along the distinctive pathway of the Italian University

Therefore, the factorial analysis allows us to recover the dimensions of online public engagement attributable to different approaches, that is to say methods of implementation of public engagement capable of putting in place actions aimed at involving the main players in the area:- Widening engagement - this dimension is made up of items that involve
students in research activities, volunteer work, also with financial assistance, and activities that encourage access for students with disabilities.
- Cultural engagement - this dimension includes all those activities that connect the university to local resources or that connect university resources to different non-academic publics (institutions, citizens and relatives). In this dimension, reference is made to the importance of culture which, especially in Italy, is connected to art and tourism. The university has a central role in these aspects and cultural engagement is a catalyst and the privileged conduit for cultural and educational activities.
- Research engagement - this dimension, on the other hand, includes all those activities related to technology transfer, consultancy activities, and activities aimed at involving the diversified publics in technological development.
- Social engagement - in this dimension we can find all those activities that directly involve universities with the territory. This involvement concerns opening the university to the outside community, through conferences for scientific dissemination and developing collaboration to finalize research towards applications useful to the real needs of the public. In this case, the university makes its skills and academic programs available to a wider audience in the form of applied knowledge.
5. Discussion and conclusion
This research shows that online university public engagement is a complex construct that can take on different facets depending on the country. In fact, while on the one hand the research confirms that the dimensions of online public engagement are those connected to the social dimension, to research and to its willingness to open university boundaries towards collaboration with other non-academic stakeholders, on the other hand this research identifies a new dimension connected to culture and to the dissemination of scientific knowledge through museum events and structures and access to libraries, which seems to be a distinctive feature of Italy as a country and another important manifestation of university public engagement. This result enriches current research on university public engagement and demonstrates the complexity of the construct which, to date, is struggling to be applied in its entirety despite the recognition of its importance. This paper tries to fill the gap of literature by providing a comprehensive study that investigates the nature of public engagement and its determinants by means of Italian context that it is not been fully investigated through digital communication.
sinergieitalian journal of management Vol. 39, Issue 2, 2021
110

111
At the same time, this research tries to demonstrate that public engagement, precisely by virtue of its complexity, is capable of demonstrating the social and community nature of the university also through its core product: culture. Indeed, the presence of a new dimension that communicates culture-orientated university public engagement seems to be a prerogative of the Italian university. This new perspective fits well both with the mission of public engagement and with the concept of culture itself (William, 1958). Hess et al., (2007) talk about a model for cultural engagement resulting from the interaction and participation between multiple actors (academic and otherwise) in order to create effective cultural growth: “The CMCE (Conceptual Model for Cultural Engagement [ours]) develops long-term interactive relationships between faculty, students, and communities from an asset-based perspective […]. Individuals in this relationship are active participants in the process of growing toward cultural effectiveness” (Hess et al., 2007, p. 34). Doyle (2010) also highlighted the social role of the university, especially with reference to the value of cultural engagement as an engine that activates university efforts. In fact, if we consider the definition of “culture” as provided by the principle scholars of the topic (e.g. William, 1958), the dual role of the university as a social promoter and cultural promoter clearly emerges. The former has to do with the norms and the values that form a society and through which the university expresses itself; the latter, on the other hand, is aimed more at enriching the quality of life. In Italian universities there is a wide variety of activities that involve both the university and other players in the area: civil society, companies, institutions and associations. In this sense, the university plays a decisive role in influencing the culture of a territory in terms of increasing cultural and social capital. This research shows that universities are not to be seen only as an allied service industry in which the knowledge of other territorial actors converge (Doyle, 2010), but also the place where the “sense of culture” is cultivated as an art through participatory and free learning in which processes of discovery and creative effort are activated (William, 1958). The rediscovery of this important role of the university enriches the very concept of public engagement. This means that academic research should commit to studying public engagement in a cross-cultural perspective in order to highlight the facets of the construct.
In this sense, the concept of cultural engagement also refers to the university’s ability to use service-learning courses to assist students in developing cultural competence (Hess et al., 2007). As a result, universities must foster reciprocal relationships among faculty, community partners, and higher education students in order to activate participation in culturally engaged learning (Hess et al., 2007).
The research results show the absence of faculty engagement in the sample of the universities analysed. This important result should lead to some reflections on the importance of faculty engagement as another important dimension of the university’s ability to be for and with its territory. This also leads us to imagine an opportunity to structure and plan activities that can adequately develop and communicate this dimension. Although this paper analyzes online communication strategies that do not
Letizia Lo PrestiGiulio MaggioreVittoria Marino Online public engagement is the New Deal! Along the distinctive pathway of the Italian University

sinergieitalian journal of management Vol. 39, Issue 2, 2021
112
always coincide with the public engagement policies actually adopted by the universities, the indicators used are to be considered valid proxies of the real public engagement activities carried out by universities and therefore these indicators can provide useful information to help universities to fill the information gap on websites. This research investigates only a sample of Italian universities and therefore the results cannot be extended to the entire population. Moreover, this research carries out an analysis of online public engagement strategies at the University level, but future research developments could focus on investigating public engagement at the Departmental level. Despite this, the research investigates a country that has not yet been fully explored in the literature on the subject, particularly with reference to public engagement as a 7-dimensional construct.
References
BACCARANI C. (1995), “La complessità delle relazioni tra i soggetti istituzionali locali preposti allo sviluppo: il possibile ruolo dell’università”, Sinergie italian journal of management, n. 36/37, pp. 95-110
BANDELLI A., KONIJN E.A. (2013), “Science centers and public participation: Methods, strategies, and barriers”, Science Communication, vol. 35, n. 4, pp. 419-448.
BOFFO S., MOSCATI R (2015), “La Terza Missione dell’università. Origini, problemi e indicatori”, Scuola Democratica, n. 2, pp. 251-272.
BOLAND J.A. (2014), “Orientations to civic engagement: insights into the sustainability of a challenging pedagogy”, Studies in Higher Education, vol. 39, n. 1, pp. 180-195.
BORUM CHATTOO C., FELDMAN, L. (2017), “Storytelling for social change: Leveraging documentary and comedy for public engagement in global poverty”, Journal of Communication, vol. 67, n. 5, pp. 668-701.
BRUNING S.D., MCGREW S., COOPER M. (2006), “Town-gown relationships: Exploring university-community engagement from the perspective of community members”, Public Relations Review, vol. 32, n. 2, pp. 125-130.
CAPURRO G., DAG H., LONGSTAFF H., SECKO D.M. (2015), “The Role of Media References During Public Deliberation Sessions”, Science Communication, vol. 37, n. 2, pp. 240-269.
CHILVERS J. (2013), “Reflexive Engagement? Actors, Learning, and Reflexivity in Public Dialogue on Science and Technology”, Science Communication, vol. 35, n. 3, pp. 283-310.
COGNETTI F. (2013), “La third mission delle università. Lo spazio di soglia tra città e accademia”, Territorio, n. 66, pp. 18-22.
CURTIS V. (2014), “Public engagement through the development of science-based computer games: The Wellcome Trust’s “Gamify Your PhD” initiative”, Science Communication, vol. 36, n. 3, pp. 379-387.
DAVIES S.R. (2013a), “Constituting Public Engagement: Meanings and Genealogies of PEST in Two U.K. Studies”, Science Communication, vol. 35, n. 6, pp. 687-707.
DAVIES S.R. (2013b), “Research staff and public engagement: A UK study”, Higher Education, vol. 66, n. 6, pp. 725-739.

113
DEBORAH J., HESS H.L., WINSTON V. (2007), “Educating for Equity and Social Justice: A Conceptual Model for Cultural Engagement”, Multicultural Perspectives, vol. 9, n. 1, pp. 32-39.
DENSON N., BOWMAN N. (2013), “University diversity and preparation for a global society: the role of diversity in shaping intergroup attitudes and civic outcomes”, Studies in Higher Education, vol. 38, n. 4, pp. 555-570.
DICKERSON-LANGE S.E., EITEL K.B., DORSEY L., LINK TE, LUNDQUIST J.D. (2016), “Challenges and successes in engaging citizen scientists to observe snow cover: from public engagement to an educational collaboration”, Journal of Science Communication, vol. 15, n. 1, pp. 1-14.
DOYLE L. (2010), “The Role of Universities in the ‘Cultural Health’ of their Regions: universities’ and regions’ understandings of cultural engagement”, European Journal of Education, vol. 45, n. 3, pp. 466-480.
DOMEGAN C.T. (2008), “Social marketing: implications for contemporary marketing practices classification scheme”, Journal of Business and Industrial Marketing, vol. 23, n. 2, pp. 135-141.
FALL L. (2006), “Value of engagement: Factors influencing how students perceive their community contribution to public relations internships”, Public Relations Review, vol. 32, n. 4, pp. 407-415.
FURCO A. (2010), “The Engaged Campus: Toward a comprehensive approach to Public engagement”, British Journal of Educational Studies, vol. 58, n. 4, pp. 375-390.
GLEESON R.E. (2010), “The Third Mission and the History of Reform in American Higher Education”, in Inman P., Schuetze H.G. (eds), The Community Engagement and Service Mission of Universities, Niace, Leicester, pp. 121-137.
GOLDNER L., GOLAN D. (2018), “What is meaningful civic engagement for students? Recollections of Jewish and Palestinian graduates in Israel”, Studies in Higher Education, vol. 44, n. 3, pp. 1-15.
GORDON J., BERHOW S. (2009), “University websites and dialogic features for building relationships with potential Students”, Public Relations Review, vol. 35, n. 2, pp. 150-152.
HART A., NORTHMORE S. (2011), “Auditing and Evaluating University-Community Engagement: Lessons from a UK Case Study”, Higher Education Quarterly, vol. 65, n. 1, pp. 34-58.
HINCHLIFFE S., LEVIDOW L., ORESZCZYN S. (2014), “Engaging Cooperative Research”, Environment and Planning A, vol. 46, n. 9, pp. 2080-2094.
KERR C. (2001), The uses of the university, Boston, Harvard University Press.KIM H.S. (2007), “PEP/IS: A new model for communicative effectiveness of
science”, Science Communication, vol. 28, n. 3, pp. 287-313.KIMMEL C.E., HULL R.B., STEPHENSON M.O., ROBERTSON D.P., COWGILL
K.H. (2012), “Building community capacity and social infrastructure through landcare: a case study of land grant engagement”, Higher Education, vol. 64, n. 2, pp. 223-235.
KRABBENBORG L., MULDER H.A. (2015), “Upstream public engagement in nanotechnology: Constraints and opportunities”, Science Communication, vol. 37, n. 4, pp. 452-484.
LO PRESTI L., MARINO V. (2020), “Is on line public engagement a new challange in the unversity communication plan? A managerial perspective”, Studies in Higher Eduction, vol. 45, n. 7, pp. 1380-1397.
Letizia Lo PrestiGiulio MaggioreVittoria Marino Online public engagement is the New Deal! Along the distinctive pathway of the Italian University
sinergieitalian journal of management Vol. 39, Issue 2, 2021
114
MARINO V., LO PRESTI L. (2018), “Approaches to university public engagement in the online environment: insights from Anglo-Saxon Higher education”, International Journal of Educational Management, vol. 32, n. 5, pp. 734-748.
MARINO V., LO PRESTI L. (2017), “Towards an online approach to university public engagement: An exploratory analysis of website content”, Mercati e Competitività - The Journal of the Italian Marketing Association, vol. 2, pp. 75-98.
MILLER S., FAHY D., ESCONET TEAM. (2009), “Can science communication workshops train scientists for reflexive public engagement? The ESConet experience”, Science Communication, vol. 31, n. 1, pp. 116-126.
MORCELLINI M. (2005), Contro il declino dell’Università. Appunti e idee per una comunità che cambia, Il Sole 24 Ore, Milano.
OSTRANDER S.A. (2004), “Democracy, civic participation, and the university: A comparative study of civic engagement on five campuses”, Nonprofit and voluntary sector quarterly, vol. 33, n. 1, pp. 74-93.
PERSELL C.H., WENGLINSKY H. (2004), “For-Profit Post-Secondary Education and Civic Engagement”, Higher Education, vol. 47, n. 3, pp. 337-359.
PICCALUGA A. (2000), La valorizzazione della ricerca scientifica, Franco Angeli, Milano.
POLIAKOFF E., WEBB T.L. (2007), “What factors predict scientists’ intentions to participate in public engagement of science activities?”, Science Communication, vol 29, n. 2, pp. 242-263.
POLILLO R. (2013), “Il check up dei siti web delle organizzazioni non profit”, I Quaderni di THINK!, n. 3.
POLILLO R. (2005), “Un modello di qualità per i siti web, Mondo Digitale”, vol. Giugno, n. 2, pp. 32-44, Associazione Italiana per l’Informatica e il Calcolo Automatico (AICA).
RETZBACH A., MAIER M. (2015), “Communicating Scientific Uncertainty: Media Effects on Public Engagement With Science”, Communication Research, vol. 42, n. 3, pp. 429-456.
SCHOERNING E. (2018), “A no-conflict approach to informal science education increases community science literacy and engagement”, Journal of Science Communication, vol. 17, n. 3, pp. 1-16.
SCHMIDT S., CANTALLOPS A.S., DOS SANTOS C.P. (2008), “The characteristics of hotel websites and their implications for website effectiveness”, International Journal of Hospitality Management, vol. 27, n. 4, pp. 504-516.
STEPHENSON M. (2011), “Conceiving land grant university community engagement as adaptive leadership”, Higher Education, vol. 61, n. 1, pp. 95-108.
TANG J.J., MAROOTHYNADEN J., BELLO B., KNEEBONE R. (2013), “Public Engagement Through Shared Immersion: Participating in the Processes of Research”, Science Communication, vol. 35, n. 5, pp. 654-666.
TØSSE S.E. (2013), “Aiming for social or political robustness? Media strategies among climate scientists”, Science Communication, vol. 35, n. 1, pp. 32-55.
VARGO S.L., LUSCH R.F. (2016), “Institutions and Axioms: An Extension and Update of Service-Dominant Logic”, Journal of the Academy of Marketing Science, vol. 44, n. 1, pp. 5-23.
VARGO S.L., LUSCH R.F. (2008), “Service-dominant logic: continuing the evolution”, Journal of the Academy of Marketing Science, vol. 36, n.1, pp. 1-10.

115
VARGO S.L., LUSCH R.F. (2004), “Evolving to a new Dominant Logic”, Journal of Marketing, vol. 68, n. 1, pp. 1-17.
WAN C.S. (2002), “The web sites of international tourist hotels and tour wholesalers in Taiwan”, Tourism Management, vol. 23, n. 2, pp. 155-160.
WARD V., HOWDLE P., HAMER S. (2008), “You and Your Body A Case Study of Bioscience Communication at the University of Leeds”, Science Communication, vol. 30, n. 2, pp. 177-208.
WATERMEYER R., LEWIS J. (2018), “Institutionalizing public engagement through research in UK universities: perceptions, predictions and paradoxes concerning the state of the art”, Studies in Higher Education, vol. 43, n. 9, pp. 1612-1624.
WATERMEYER R. (2012), “Measuring the impact values of public engagement in medical contexts”, Science Communication, vol. 34, n. 6, pp. 752-775.
WILKINSON C., BULTITUDE K., DAWSON E. (2011), “Oh yes, robots! People like robots; the robot people should do something: perspectives and prospects in public engagement with robotics”, Science communication, vol. 33, n. 3, pp. 367-397.
WILLIAMS R. (1958) Culture is ordinary, in: n. Mckenzie (Ed) Convictions (London, MacGibbon and Kee).
WINTER E. (2004), “Public Communication of Science and Technology German and European Perspectives”, Science Communication, vol. 25, n. 3, pp. 288-293.
WOODSIDE A.G., VINCENTE R.M., DUNQUE M. (2011) “Tourisms destination dominance and marketing website usefulness”, International Journal Contemporary Hospitality Management, vol. 23, n. 4, pp. 552-564.
Academic or professional position and contacts
Letizia Lo PrestiAssistant Professor of Management University of Rome Unitelma Sapienza - Italye-mail: [email protected]
Giulio Maggiore Associate Professor of Management University of Rome Unitelma Sapienza - Italye-mail: [email protected]
Vittoria Marino Full Professor of Management University of Sannio - Italye-mail: [email protected]
sinergieitalian journal of management
ISSN 0393-5108 DOI 10.7433/s115.2021.06
pp. 95-115
Letizia Lo PrestiGiulio MaggioreVittoria Marino Online public engagement is the New Deal! Along the distinctive pathway of the Italian University


117
Value co-creation in University-Industry collaboration. An exploratory analysis in digital research projects
Francesco Polese - Maria Vincenza Ciasullo Raffaella Montera
Abstract
Purpose of the paper: The paper aims to investigate how academic and business actors co-create value when collaborating in digital research projects.
Methodology: Qualitative research was conducted according to a social constructionism approach. Thirty participants comprising Italian university researchers and industry practitioners took part in three focus groups.
Findings: The interplay among resources, interactions, and outcomes was analysed across individual, organisational, and institutional layers to provide a comprehensive understanding of the value co-creation process between university and industry. Some barriers to the co-creation of value also emerged.
Research limitations: The study had some limitations related to the generalisability of the research results. These limitations nonetheless represent potential avenues for future research.
Practical implications: The study contributes practically to the debate on value co-creation between university and industry in the context of digitalisation, highlighting some actions aimed at developing successful research collaborations and facilitating the transfer of knowledge between scientific and economic actors.
Originality of the paper: The entire value co-creation process was examined, as well as both sides of university-industry (U-I) collaboration, which were considered simultaneously. A conceptual framework consisting of building blocks and contextual layers is proposed drawing on the service-dominant (S-D) logic perspective.
Key words: university-industry collaboration; value co-creation; S-D logic; R&D projects; digital platforms; focus group
1. Introduction
In a knowledge-based economy, University-Industry (U-I) collaboration has received significant attention from policymakers, practitioners, and scholars (Chryssou, 2020). These actors have emphasised the importance of knowledge transfer and commercialisation of academic research and have actively debated the evolution of the university’s traditional mission (teaching and research) (Etzkowitz, 2016). In this vein, the exchange of knowledge by companies and universities under the circumstances of global competition, economic instability, and rapid technological advancements is recognised to play an increasingly vital role both in the
Received2nd March 2020
Revised 31th March 2020
Accepted 28th April 2021

sinergieitalian journal of management Vol. 39, Issue 2, 2021
118
enhancement of their competitive advantage and in innovation and socio-economic development of national economies (Saad and Zawdie, 2011; Hemmert et al., 2014).
Despite the growing interest in this topic, the state of knowledge remains quite fragmented and uncertain (Galán-Muros and Plewa, 2016). To begin, previous studies have not contributed to an explicit and specific conceptualisation of U-I collaboration in terms of what it is and what it involves, hindering its proper definition and management (Perkmann et al., 2013). Moreover, the literature has mainly investigated university-business relations based on valorisation activities, emphasising patents and licenses. Conversely, potential forms of cooperation involving critical domains of higher education institutions, like research, are poorly explored (Kitagawa and Lightowler, 2013). In addition, prior works were often limited to the outcomes of U-I collaboration without considering the factors that affect them from a holistic perspective (Ha and Kwon, 2016). The adoption of a limited analysis perspective is also confirmed by both the scarce exploration of interaction channels used to collaborate and the unbalanced focus on the academic side of U-I collaboration (Franco et al., 2015).
Drawing on these gaps, the paper aims to shed light on the variety of contextual elements, dynamics, mechanisms, practices, and resultant outcomes that frame knowledge exchanges between university and industry in the context of digital research projects. In this direction, U-I collaboration can be conceptualised as a collaborative innovation process in which the knowledge contributed by partners is able to create new and mutual value. Perspectives on co-creation in the U-I literature are limited, even though such perspectives can contribute to enhancing U-I collaborations. Toward this end, we provide a conceptual understanding and empirical evidence of U-I collaboration by building on the service-dominant (S-D) logic’s notion of value as created through active and multi-actor interactions and via the integration of resources to define and deliver mutually valued outcomes (Prahalad and Ramaswamy, 2004; Perks et al., 2012; Ramaswamy and Ozcan, 2014). According to this interpretative lens, the following research question was posed:
RQ: How do university and industry co-create value when collaborating in digital research projects?
To address the purpose of the paper, the interplay among resources, interactions, and outcomes that shapes the contextual elements affecting the value co-creation process was investigated. Focus group interviews were conducted with Italian industry practitioners and university researchers in the context of digital research projects, upon which a deep empirical analysis was performed. In doing so, we contribute to an in-depth understanding of U-I collaboration in two ways. First, our study complements previous research by broadening the research focus to the entire value co-creation process as well as to both sides of U-I collaboration, thereby accomplishing a comprehensive analysis of the phenomenon. Second, the insights gained from the investigation are relevant from a concrete point of view in terms of practical actions for developing successful research collaborations and facilitating the transfer of knowledge between economic and scientific actors.

119
Francesco Polese Maria Vincenza CiasulloRaffaella MonteraValue co-creation in University-Industry collaboration. An exploratory analysis in digital research projects
The remainder of the paper is structured as follows. The theoretical background on U-I collaboration and the value co-creation process is established in the second section, in which a conceptual framework is proposed drawing on the relevant literature. A description of the research method follows. Findings related to how university and industry co-create value when collaborating in digital research projects are then discussed. Finally, theoretical and managerial implications, as well as directions for future research, are outlined.
2. Theoretical background
2.1 U-I collaboration
U-I interactions are commonly considered as ‘a method of social cooperation, or a voluntary effort made by industrial entities and educational and research institutions to solve problems or issues of common interest cooperatively’ (Ha and Kwon, 2016, p. 2). The paper approaches U-I collaboration in the broad sense of any kind of formal or informal cooperative agreement initiated voluntarily for achieving common goals with a strong emphasis on the joint creation of value for mutual benefit.
U-I interactions include different cooperative activities, all of which are associated with one of the key missions of university (i.e., education, research and valorization). Regarding research activities studied herein, universities provide specific expertise or research results to businesses in return for money or practical experience for academics. Specifically, the temporary movement of teaching staff and researchers from universities to businesses, as well as that of employees, managers, and researchers from businesses to universities, represent relevant U-I research activities. These activities also comprise joint R&D activities, contract research, R&D consulting, cooperation in innovation, joint publications with firm scientists/researchers, joint supervision of theses (bachelor’s, master’s, PhD), or research projects conducted in cooperation with businesses (Cohen et al., 2002; Galán-Muros and Plewa, 2016).
We focus on the specific case of R&D projects in the digital arena as a promising area for U-I collaboration for at least two reasons. First, the interdisciplinary nature of digital research allows for the development of partnerships that transcend established subjects and can refer to multiple fields of inquiry (Bharadwaj et al., 2013). Second, digital research goes beyond the traditional role of the university as a provider of knowledge and that of industry as a provider of funding and materials as both entities are enabled to transfer knowledge that supports innovation (Bozeman et al., 2013).
2.2 Value co-creation dynamics between U-I
To explore value co-creation in digital R&D projects, the S-D logic was embraced. According to this interpretative lens, value co-creation is a complex process of resource integration activities that takes place in many interactions within and among multiple actors rather than in dyadic

sinergieitalian journal of management Vol. 39, Issue 2, 2021
120
relationships (Vargo and Lusch, 2016). In particular, resource integration occurs when actors’ resources are combined for mutual benefit according to their expectations, needs, and capacities, especially skills and knowledge (Gummesson and Mele, 2010).
The following sub-sections describe the building blocks and contextual layers of the value co-creation process between U-I (Fig. 1).
2.2.1 Building blocks of the value co-creation process
University and business are equipped with similar or different resources classified as tangible and static (operand resources) or processional and dynamic (operant resources) (Edvardsson et al., 2011; Vargo and Lusch, 2011). In R&D collaboration, in particular, key resources are operant, such as human capital, which consists of knowledge, competences, capabilities, skills, experience, and relationships shared by actors, although operand resources, such as materials and funding, can also contribute to project execution (Bozeman et al., 2013; Perkmann et al., 2013).
In U-I interactions, actors exchange resources and integrate them in the context of their reality (Prahalad and Ramaswamy, 2004; Vargo and Lusch, 2008) by means of platforms. In this regard, U-I interaction depends on the collaboration formats established. There is a wide range of formats (e.g., simple, ad-hoc exchanges of advice, formal interactions) that are different in size (i.e., number of people involved) and scope, but their aim to produce knowledge is their common trait (Perkmann et al., 2013; Bozeman et al., 2013). U-I interactions can be facilitated by physical and virtual platforms conceptualised as a series of touch points that let actors connect with each other to share information, transfer knowledge, enhance engagement, monitor the incremental progress of the project, and measure collaboration success. In other words, platforms help to develop multi-actor relationships that contribute to overcoming barriers in U-I collaboration related to differences between actors in terms of motivations, internal bureaucracy, languages, time horizons, and daily activities (Siegel et al., 2003; Bruneel et al., 2010; Muscio and Pozzali, 2012). In practice, it happens that university fails to effectively communicate research results to industry, while business representatives fail to recognise the importance of research outputs. Thus, platforms act as a bridge between academic and industrial actors in order to make interactions happen. In any event, actors’ cognitive alignment on project aims is a fundamental prerequisite for valuable U-I collaboration, despite the intermediary role of platforms.
University and business engage in resource exchange and integration to achieve a specific outcome from value co-creation in digital R&D projects. On the one hand, the demonstration of the impact of academic research and the identification of alternative funding sources to undertake research represent the most urgent benefits sought by university (Du et al., 2014). On the other hand, industry is motivated by the prospect of having access to leading-edge research, which is essential for improving its competitive advantage (Lambert and Enz, 2012).

121
Fig. 1: Value co-creation between U-I in digital research projects
Source: our elaboration
2.2.2 Contextual layers of the value co-creation process
Context, as a set of actors and the mutual links between them (Chandel and Vargo, 2011), surrounds and affects the building blocks of the value co-creation process within U-I collaborations.
Focusing on research projects, context comprises individual collaborators at the individual layer, collaborators’ organisational home at the organisational layer, and policy and market at the institutional layer (Bozeman et al., 2013). With regard to the individual layer, collaborators play simultaneous roles ranging from resource integrators and boundary spanners among projects, organisational homes, and wider industry or academic settings (Corsaro et al., 2012). Collaborators’ involvement in R&D projects and their collaborative behavior depend not only on previous interactions with the actors and experiences with projects but also on expectations created by the organisational home’s norms and values (Edvardsson et al., 2011).
Regarding the organisational layer, university acts as a knowledge broker between companies relying on established mechanisms to transmit a wide knowledge base (Agrawal and Henderson, 2002; Henard and McFadyen, 2006). Conversely, the knowledge base of industry is limited to the markets served, and thus companies are reluctant to share it with other players (Un et al., 2010; Du et al., 2014). These different academic and managerial logics can trigger conflicting pressures between actors, so a successful collaboration risks being compromised (Edmondson et al., 2012).
With regard to the institutional layer, scientific and business actors’ efforts invested in a research project are influenced by national policies and attitudes toward innovation in terms of funding allocation, level, and rate of innovation (Janssen et al., 2004; Perkmann et al., 2013). Societal
Institutional layer
Organizational layer
Organizational layer
Individual layer
Institutional layer
Contextual layers
University IndustryResources OutcomeInteractions
Building blocks
Individual layer
Contextual layers
Francesco Polese Maria Vincenza CiasulloRaffaella MonteraValue co-creation in University-Industry collaboration. An exploratory analysis in digital research projects
values also affect the focus of projects and the selection of actors (Ngugi et al., 2010).
3. Method
To understand how university and industry co-create value when collaborating in digital research projects, qualitative research was conducted that adopted a social constructionism approach. This was deemed appropriate for two reasons. First, social constructionism emphasises that knowledge is constructed through interactions between actors within a social situation (Bauersfeld, 1995; Denzin and Lincoln, 2012). Second, the approach provides in-depth insights missing from other studies on this topic (Un et al., 2010; Du et al., 2014).
3.1 Data collection
Data were collected through focus groups aimed at generating critical information on each individual through the interaction of group members (Frisina, 2010). In this sense, focus groups foster interactional dynamics suitable for a social constructionism-based reading (Potter, 1996).
The focus groups involved 30 participants from a heterogeneous set of Italian professionals identified through LinkedIn profiles. In particular, diverse participants belonging to both university and industry contexts were selected. From the university side, we contacted technology transfer professionals and academics at various career levels from established and new, public and private, traditional and telematics universities. From the industry side, entrepreneurs and managers from public/private organisations were identified. All participants were experts with at least five years of R&D experience in digital research. In order to permit active participation from all group members, participants were subdivided into full groups-that is, groups of 8 to 12 individuals (Marbach, 2010). Thus, three groups, including 10 individuals, were formed, comprising an equal number of industry and university participants who did not belong to the same institutions to avoid inhibiting interactions.
The focus groups were developed over a three-month period, after preliminary testing with questions and stimuli and a previous examination of the suitability of one topic as compared to another (pilot focus group) (Kitzinger and Barbour, 1999). Group discussions of 90 to 120 minutes were performed via Skype in the presence of a moderator and an observer. A total of 12 group discussion sessions were conducted, four per group. Of these, the first three sessions were organised by discussion topics, each of which was debated separately. These sessions covered pre-established questions and sequence data but were amenable to modifications in light of the ongoing dynamics of the groups (semi-structured focus group) (Zammuner, 2003). To begin, participants were asked to discuss the operant and operand resources needed for successful R&D projects. Next, interactions that best support R&D collaboration were also explored, specifying types and platforms. Then, the discussions covered the
sinergieitalian journal of management Vol. 39, Issue 2, 2021
122

123
outcomes sought from collaborations. To conclude, contextual influences (e.g., organisational rules or ways of working) on the efforts invested in R&D projects were questioned. The final discussion session consisted of a debriefing in which the participants were encouraged to reflect on the conversations that had occurred.
The answers were audio- and video-recorded, and notes were simultaneously taken by hand. To minimise the development of abnormal stress responses, the debriefing sessions were not recorded.
Regarding the institutional layers, a multitude of elements were considered, such as non-governmental organisations (NGOs), government institutions, investment funds, technology transfer offices (TTOs), collective research centres, regional development agencies, incubators, digital accelerators and science/technology/research parks, innovative start-ups, spin-offs, technological districts, online communities and social media platforms, patents, learning technologies laboratories, and virtual laboratories. The institutional layers were identified by asking to participants to discuss if-and if so, how-these elements influence R&D collaborations. In particular, feedback from the university side allowed us to investigate the orientation toward academic entrepreneurship.
3.2 Data analysis
Data analysis was performed using a thematic analysis (Braun and Clarke, 2006; Bryman, 2012). First, the interviews were transcribed line by line and anonymised, thereby ensuring the privacy of the participants and the protection of the strategic interests of their organisations. The research team was involved in specific tasks: two researchers separately coded the transcripts; a third researcher sampled the combined codes to check consistency and saturation of pattern matching as well as to ensure internal validity (Fereday and Muir-Cochrane, 2008).
At the operational level, Krippendorff ’s (2004) systematic approach was used to carry out the coding process. Thus, data were inductively interrogated to identify emerging themes, which were then classified into the building blocks (‘resources’, ‘interactions’, and ‘outcome’ as labels) and contextual layers of the value co-creation process (‘individual layer’, ‘organisational layer’, and ‘institutional layer’ as labels) according to participant type (‘academic’ or ‘practitioner’ as labels).
4. Results
4.1 The building block of resources across the contextual layers
All participants reported the need for research funding as an operand resource to foster U-I collaborations. Different funding sources were mentioned: The industry side typically sought internal financial support, while the university side tended to use third sources represented by industry partners or institutional layers, such as research councils and commercial partners. For instance:
Francesco Polese Maria Vincenza CiasulloRaffaella MonteraValue co-creation in University-Industry collaboration. An exploratory analysis in digital research projects

sinergieitalian journal of management Vol. 39, Issue 2, 2021
124
‘Identifying the financial sources of each project is a must. In Italy, few public funds sustain research activities. Thus, the role of private sponsors is vital for R&D collaborations’. [Participant 22, Academic]
‘There is an established awareness that we can rely mainly on our financial strength to innovate’. [Participant 13, Practitioner]
‘We do not exclude the interesting possibility for turning to business angels or other companies when we are not able to finance an innovative project with our own financial strength’. [Participant 3, Practitioner]
Hence, the participants increasingly recognised the unique opportunity provided by joint projects to access operant resources, such as different and complementary skills. On the one hand, business can increase expertise in new fields, accessing cutting-edge scientific knowledge to create new, advanced offerings and/or improve existing ones. Moreover, through access to university facilities, industry can improve recruitment efforts, involving scientists, skilled students, and graduates in its staff. On the other hand, the university can get to know the industry in depth and its problems, business expertise, and business sector R&D facilities to more effectively orient scientific research toward transferring knowledge to economic actors. In this regard, the university can adopt digital technologies (i.e., spin-offs, virtual labs, university website, social platforms, apps, etc.) and digital resources that play a critical role in developing entrepreneurial actions that attract new business relationships. For example:
‘Our university carefully considers digital technologies, and many innovation and technology investments have been made and will be made to open new channels and connections to firms and markets. We count on digital platforms that create an increased network effect being open and viral’. [Participant 20, Academic]
Thus, a range of digital resources necessary for creating new modes or improving existing modes to communicate each other’s work were identified. In the absence of digital technological infrastructures, the communication flow between U-I is not sufficiently fluid because scientific research is typically published in journals that are rarely accessible to managers, who mainly use free resources on the Internet. Moreover, academia may ignore valuable industry-based research due to the lack of quality signals equivalent to the academic peer-review system.
Participants also stressed the need for advanced technical and technological capabilities. Specifically, collaborations on digital research projects require expertise associated with digitalisation and consisting of the ability to sense, capture, and interpret data. Unsurprisingly, some universities have enriched their offerings with digital entrepreneurial courses at different levels of education (bachelor’s courses, professional courses, master’s courses, PhD programs, summer and winter schools). For example:
‘Our university has created a doctoral school in Data Science to create experts in the management of big data and to use advanced data analysis and machine learning methods in many industrial fields’ [Participant 2, Academic]
‘Nowadays, the lack of critical skills does not make an unfeasible project. Selecting the most adequate partners on the basis of their capabilities’

125
relevance allows finding knowledge required to embark on any project’. [Participant 21, Practitioner]
‘Communication skills are critical for the development and success of U-I collaborations. Unfortunately, researchers lack training in communicating research findings outside of academic circles’. [Participant 28, Academic]
‘To really capitalise on R&D projects, we need people able to transform the data available on where the industry is going into valuable insights and actionable directives for university and industry’. [Participant 9, Academic]
Resource exchange and integration within U-I collaborations are affected by individual mindsets that support innovation and knowledge transfer, as well as by an organisational context in which experimentation and risk taking are encouraged. For instance:
‘My main characteristic is being willing to learn from others. Being able to listen, I ask for advice, absorbing what helps my business to make money’. [Participant 18, Practitioner]
‘Having space and time to think, people will express their creativity and new ideas will be developed. Organisations should not forget or underestimate this aspect to pursue innovative projects’. [Participant 4, Academic]
4.2 The building block of interactions across the contextual layers
A successful value co-creation process depends on the building stage of U-I collaborations, which is characterised by moving from generic ideas to definite project goals in response to the specific needs of both actors and society. Indeed, the participants reported the importance of achieving a balanced match between innovative thinking and pragmatism. For instance:
‘When university and industry interact, the innovative potential is very high. Anyway, the flow of ideas needs to be controlled. This means that the entrepreneurial ideas and the opportunity for translating them into useful and achievable research projects must achieve a compromise. If this occurs, a well-specified work project can also focus on unconventional ideas that often open the way to more radical innovations’. [Participant 15, Academic]
‘A strong and new idea is the starting point for establishing relationships with the academic world. However, if this idea cannot be developed into a concrete research project with clear roles in the teams, then universities and businesses will not go anywhere’. [Participant 3, Practitioner]
‘A research project is a very specific contribution to solve a big problem without losing creativity’. [Participant 10, Practitioner]
Another element critical to valuable U-I interactions is the development of trust among actors involved in the project. Participants reported their desire to establish trusting relationships that allow effective collaborations. In this regard, digital technology was recognised as an enabler of the continuous exchange of information, real-time communication, and the opportunity for jointly working on projects remotely without geographical limitations. These opportunities provided by digitalisation create the conditions needed to generate new knowledge, which in turn fosters innovations. Contextually, seamless information access and exchange between U-I nurtures transparent communication, in turn creating trust
Francesco Polese Maria Vincenza CiasulloRaffaella MonteraValue co-creation in University-Industry collaboration. An exploratory analysis in digital research projects

sinergieitalian journal of management Vol. 39, Issue 2, 2021
126
between academic and business collaborators. For example:‘Digitalisation has caused positive effects that would have been impossible
in the pre-digitalised state of research projects. Digital platforms have become essential for fostering interactions based on mutual trust, going beyond face-to-face meetings’. [Participant 20, Academic]
‘Technology has become an indispensable ally that supports the actors to work together and create close ties leveraging connectivity’. [Participant 8, Practitioner]
Addressing their efforts in building trusting relationships, the participants emphasised a long-term vision: Trust cannot be imposed externally, nor can it be achieved rapidly, as it is the result of synergistic interactions based on the alignment of goals that are nurtured over time. Shared purposes through the harmonisation of differing expectations facilitate U-I collaborations (Bekkers and Bodas Freitas, 2008; Bruneel et al., 2010) as the potential for misalignment and conflicts between parties diminishes (Lee, 2011). This requires a genuine interest in interacting and an understanding of the interests of all actors involved in the project, thereby easing the development and maintenance of mutually beneficial partnerships. For instance:
‘Previous failed experiences have taught us that simple connections with industrial players do not automatically lead to joint projects. Shared purposes and strong commitment to cultivating relationships with reliable people are required to embark on future collaborations’. [Participant 27, Academic]
However, the means and motives for developing and maintaining relationships are affected by the subjective preferences of the collaborating actors, legal barriers to co-creation in terms of intellectual property (IP) protection and the bureaucracy of institutional bodies, and cultural barriers linked to different time horizons of working. For example:
‘Being a lecturer at a small provincial university, I prefer collaborating with multinationals who have a high reputation in the field of research projects’. [Participant 2, Academic]
‘Bureaucratic red tape and frequent delays created by IP offices discourage us from starting and continuing projects with universities’. [Participant 25, Practitioner]
‘While academics are less accustomed to working in a time-critical environment, businesses must quickly adapt after changing customer needs to remain competitive. In other words, it is very difficult to collaborate across different sectors and disciplines’. [Participant 30, Practitioner]
4.3 The building block of outcomes across the contextual layers
Many beneficial outcomes arise from value co-creation in digital R&D projects. In particular, specific tangible and intangible benefits emerge for each actor involved in research collaborations. From the university side, benefits include the income generated from the collaboration and from any resulting or follow-up projects, including income from the commercial exploitation of any IP, as well as the number of publications arising from the research. By interacting with industry, university can also obtain intangible benefits, such as new teaching materials and the identification

127
of research avenues and priorities suggested by business actors. Thus, university can demonstrate the impact of scientific research on not just an exclusively academic audience, easily attracting major research funding. From the industry side, tangible benefits include an appropriate return on investment (RoI) through the value created from the innovation generated or from other success measures, like additional profit. Intangible benefits are related to the opportunity for accessing specialist academic expertise at little or no cost. For example:
‘U-I projects are an effective way to validate theoretical concepts in real industrial settings. In doing so, we can teach with case studies and address our concerns for demonstrating the managerial and social implications of academic works and financing our research efforts’. [Participant 24, Academic]
‘Partnerships with university allow us to access a wider knowledge base without huge investments. If this knowledge is well leveraged, it leads to market innovations, enhanced competitiveness, and better performance for my business’. [Participant 26, Practitioner]
Mutual benefits for all participants arise from subjective approaches to problems based on the complementary perspectives of actors. Researchers indeed benefit from industry’s practical view, while business players benefit from university’s theoretical view because ‘mixing theory and practice is the more complete way to discover new problems and new solutions or to better solve old business problems with new solutions’. [Participant 17, Academic]
Organisational and institutional layers may exert negative influences on the outcome of value co-creation in digital R&D projects. This occurs when a project’s goals are not aligned with organisational architecture or in cases in which external sponsors limit the project scope to a specific outcome being sought. For instance:
‘We cannot share a project goal that does not lead to an immediate economic return of the project or compromise the existing revenue stream’. [Participant 16, Practitioner]
‘The type of work to perform depends on a sponsor that invests in the project. We have to adapt to the sponsor’s focus even if the problem is broader than what the sponsor wants’. [Participant 11, Academic]
‘An information symmetry is required at all levels of the organisation. Otherwise, people do not assimilate the potential of digital in their specific functions and tasks’. [Participant 21, Practitioner]
5. Discussion
5.1 Theoretical and managerial implications
The paper’s purpose was to examine value co-creation within U-I collaborations on R&D projects in the digital arena. Adopting S-D logic as an interpretative lens, resources, interactions, and outcomes were analysed across three contextual layers-in a process view-to provide a comprehensive understanding of the value co-creation process between U-I.
Francesco Polese Maria Vincenza CiasulloRaffaella MonteraValue co-creation in University-Industry collaboration. An exploratory analysis in digital research projects

sinergieitalian journal of management Vol. 39, Issue 2, 2021
128
Academia and business players co-create value in digital research projects by co-designing value propositions as the result of synergistic interactions and dynamic processes of resource integration. By rereading the conceptual framework in light of the findings, value co-creation was conceptualised as a process that affects the contextual layers in a circular and synergistic way.
In particular, the individual layer refers to the subjective dimension, embracing the abilities of both university and industry and their propensity for technology adoption. Thus, intangible resources, mainly consisting of digital skills, are crucial, and academia must rethink its strategic orientation to trigger value co-creation processes with firms. The organisational layer refers to the transformational mechanisms that allow the co-creation of digital value in R&D projects. In fact, only when U-I act as active integrators, assimilators, and transformers of knowledge can new practices and interactive modes emerge, generating new knowledge and thereby innovation. These new practices and interactive modes involve the social dimension to which the institutional layer refers. They produce new meanings, norms, and rules, and they pave the way to a new entrepreneurial culture that shapes academia as an entrepreneur in a digital ecosystem.
The research findings underline the importance of U-I proximity, which is reflected at various contextual layers given their strong interdependence. At individual layers, academia and business should be connected by cognitive proximity in terms of the alignment of values essential for achieving shared purposes. Cognitive proximity at the individual layer leads to a relational proximity at the organisational layer such that the mutual exchange and integration of resources in the reality of the U-I exploit the potential of digital platforms. Cognitive and relational proximities represent the basis of the institutional proximity at the institutional layer, where the alignment of values and digital relationships between academia and industry create and renovate an ongoing social and economic development in a specific context.
Drawing on the results, some drivers were identified as fostering the circular and synergistic process of value co-creation across the contextual layers. First, social capital represents a crucial operant resource that acts on the value co-creation process in the domain of U-I collaborations. In line with previous studies (Hitt et al., 2003; Thune, 2007), familiarity, trust and norms of reciprocity, mutual understanding, and long-term commitment to co-creation have a significant and positive bearing on the establishment and management of U-I relationships. Thus, as it is difficult to co-create value between previously unconnected actors, the desirable practical action is to invest in developing social capital. Hence, social capital gives rise to the co-creation of value since it fosters the generation and exploitation of knowledge, builds new resources and capabilities, and enhances interactional dynamics between academia and companies. Additionally, our results shed light on the role of social capital in lowering barriers to value co-creation over time. Long-term linkages and mutual trust between actors facilitate the reduction of problems related to the differences in the orientation of universities and businesses, IP conflicts, and contract management (Canter et al., 2017; Garcia et al., 2018). In this

129
vein, institutions act as fundamental coordinating mechanisms that inspire direct and indirect interactions through institutional arrangements created and recreated through the agency of actors. They enable or constrain value co-creation, guiding resource integration and service exchange among actors.
Second, given that value co-creation does not lie in the technological architecture per se but in its use, a platform approach (Thomas et al., 2014), one that combines digital technology tools and socio-technical systems, is required. This approach champions the digital interactional dynamics during all project stages because it offers communication and user feedback, collaboration, and computing capabilities (Nambisan, 2017) that enable organisational integration and reciprocity among academic and industrial collaborators. Within such an approach, digital platforms play the role of the enabler of the value co-creation process between U-I. In line with Soendergaard et al. (2015), we found that digital platforms act as intermediary services that help universities and companies develop and maintain multilateral interactions supporting joint research. In doing so, digital platforms become innomediary (Mele and Russo-Spena, 2015; Ciasullo, 2018), bridging academia and business actors and promoting and diffusing innovation as a result of the value co-creation process between U-I. In addition, digital platforms contribute to reducing the barriers to value co-creation that are linked to the generally small amount of funding for R&D projects because U-I collaborations in a virtual space offer resource savings on both sides. Moreover, connection barriers (Galán-Muros and Plewa, 2016) are also reduced since platforms can support U-I in many directions. First, they can assist in more effectively identifying actors to involve in co-creation-for instance, mapping them with complementary resources and common interests. Then, platforms can help to disseminate awareness of collaboration opportunities across the globe, bypassing the constraints of geographical proximity between the actors (Laursen et al., 2011; D’Este et al., 2013). In sum, digital platforms can be viewed as transformative resources that enhance actor engagement, providing access and engagement opportunities for generating new knowledge capable of fostering innovation (Wieland et al., 2012; Storbacka et al., 2016). Hence, a platform approach-expressed by the adoption of an integrated set of digital platforms and proactive involvement of users-reveals itself to be an ideal approach not only for successfully completing a research project but also for building a long-term collaborative research program and, finally, for contributing to the emergence of a university digital ecosystem. In this vein, a system-based perspective (Barile and Polese, 2010; Meynhardt et al., 2016) can contribute to fostering a service-based logic according to self-contained and self-adjusting collections of social and economic actors sharing institutional arrangements. Moreover, a system-based perspective can provide organisational structures and principles that facilitate the exchange and integration of resources and, in so doing, the co-creation of value-in-use with and among actors.
Francesco Polese Maria Vincenza CiasulloRaffaella MonteraValue co-creation in University-Industry collaboration. An exploratory analysis in digital research projects
sinergieitalian journal of management Vol. 39, Issue 2, 2021
130
5.2 Limitations and future research directions
This research contributes both theoretically and practically to the debate on value co-creation between U-I in the context of digital research projects.
From a theoretical perspective, the paper enriches the scientific debate on digital academic entrepreneurship. This is an emerging research area because contemporary universities are expected not only to provide knowledge-intensive outputs but also to contribute to economic growth and regional development through start-ups and spin-offs by leveraging the rapid acceleration of digital technologies (Rippa and Secundo, 2019).
Additionally, the paper extends the previous relevant literature by broadening the research focus to the entire value co-creation process and both sides of U-I collaboration, accomplishing a holistic analysis of the phenomenon. More specifically, the paper provided enhanced understanding via both a holistic view and an analysis of individual elements as well as their relationships, exploring the main drivers that foster or inhibit value co-creation. In doing so, an S-D logic-related midrange theory was developed (Vargo and Lusch, 2017) through a theoretical framework that broke down the complex process of value co-creation into building blocks and contextual layers, shedding more light on multi-actor interactions.
From a practical point of view, some engagement activities are suggested to develop successful research collaborations and to facilitate the transfer of knowledge among and between economic and scientific actors.
Despite these valuable contributions, our work also had some limitations, and yet these limitations can serve as the basis for future research.
On the empirical side, U-I interactions were observed within digital R&D projects, excluding other types of cooperation activities. Future studies could unpack the various collaborative projects in which U-I engage, exploring whether the interactions, resources, and outcomes across the contextual layers vary by different kinds of projects. The focus group technique also presents some risks that should be considered in the design of future research. First, the crucial role of the moderator in directing the discussion group is a potential source of bias. Second, group interviews push the participants to focus only on the positive aspects of value co-creation, making it socially undesirable to discuss personal benefits gained and to criticise collaboration.
Regarding the findings, a larger number of focus group interviewees and a wider geographic range could improve the generalisability of the research results. Moreover, although this study highlighted the tangible and intangible outcomes of value co-creation, more effective performance metrics must be developed, as well as measures that adequately capture the broader implications of undertaking research collaborations between U-I (e.g., personal development, change in employability of students).
From a policy perspective, possible actions for the development of successful R&D projects between U-I were identified. Despite their
131
importance, as suggested by empirical evidence, one-size-fits-all actions do not exist. Thus, there is a need for tailoring the actions to different projects that depend on characteristics of researchers in different scientific fields and business players in different industries. Standardised actions that neglect such differences may be neither appropriate nor effective within a specific U-I collaboration.
References
AGRAWAL A., HENDERSON R. (2002), “Putting patents in context: Exploring knowledge transfer from MIT”, Management Science, vol. 48, n. 1, pp. 44-60.
BARILE S., POLESE F. (2010), “Smart service systems and viable service systems: Applyng system theory to service science”, Service Science, vol. 2, n. 1-2, pp. 21-40.
BAUERSFELD H. (1995), “Language games’ in the mathematics classroom: Their function and their Effects”, in Cobb P., Bauersfeld H. (Eds.), The emergence of mathematical meaning: Interaction in classroom cultures, Hillsdale, US-NJ: Lawrence Erlbaum: pp. 211-292.
BEKKERS R., BODAS FREITAS I.M. (2008), “Analysing knowledge transfer channels between universities and industry: to what degree do sectors also matter?”, Research Policy, vol. 37, n. 10, pp. 1837-1853.
BHARADWAJ A., EL SAWY O.A., PAVLOU P.A., VENKATRAMAN N. (2013), “Digital business strategy: Toward a next generation of insights”, MIS Quarterly, vol. 37, n. 2, pp. 471-482.
BOZEMAN B., FAY D., SLADE C. (2013), “Research collaboration in universities and academic entrepreneurship: The-state-of-the-art”, The Journal of Technology Transfer, vol. 38, n. 1, pp. 1-67.
BRAUN V., CLARKE V. (2006), “Using thematic analysis in psychology”, Qualitative Research in Psychology, vol. 3, n. 2, pp. 77-101.
BRUNEEL J., D’ESTE P., SALTER A. (2010), “Investigating the factors that diminish the barriers to university–industry collaboration”, Research Policy, vol. 39, n. 7, pp. 858-868.
BRYMAN A. (2012), Social research methods, 4th Ed., Oxford: Oxford University Press.
CANTNER U., HINZMANN S., WOLF T. (2017), “The coevolution of innovative ties, proximity, and competencies: Toward a dynamic approach to innovation cooperation”, in Glückler J., Lazega E., Hammer I. (Eds.), Knowledge and networks. Knowledge and space, pp. 337-372.
CHANDLER J.D., VARGO S.L. (2011), “Contextualization and value-in-context: How context frames exchange”, Marketing Theory, vol. 11, n. 1, pp. 35-49.
CIASULLO M. (2018), Service innovation in (Eco)System View. Towards a circular path of co-innovation, Giappichelli Editore, Torino.
CHRYSSOU C.E. (2020), “University-industry interactions in the Sultanate of Oman: Challenges and opportunities”, Industry and Higher Education, pp. 1-16.
COHEN W.M., NELSON R.R., WALSH J.P. (2002), “Links and impacts: The influence of public research on industrial R&D”, Management Science, vol. 48, n. 1, pp. 1-23.
Francesco Polese Maria Vincenza CiasulloRaffaella MonteraValue co-creation in University-Industry collaboration. An exploratory analysis in digital research projects

sinergieitalian journal of management Vol. 39, Issue 2, 2021
132
CORSARO D., RAMOS C., HENNEBERG S.C., NAUDÉ P. (2012), “The impact of network configurations on value constellations in business markets. The case of an innovation network”, Industrial Marketing Management, vol. 41, n. 1, pp. 54-67.
D’ESTE P., GUY F., IAMMARINO S. (2013), “Shaping the formation of university–industry research collaborations: What type of proximity does really matter?”, Journal of Economic Geography, vol. 13, n. 4, pp. 537-558.
DENZIN N.K., LINCOLN Y.S. (Eds.) (2012), Strategies of qualitative inquiry, 4th ed., London: Sage.
DU J., LETEN B., VANHAVERBEKE W. (2014), “Managing and measuring value co-creation in business-to-business relationships”, Research Policy, vol. 43, n. 5, pp. 828-840.
EDMONDSON G., VALIGRA L., KENWARD M., HUDSON R.L., BELFIELD H. (2012), Making industry-university partnerships work. Lessons from successful collaborations, Science/Business/Innovation Board AISBL.
EDVARDSSON B., TRONVOLL B., GRUBER T. (2011), “Expanding understanding of service exchange and value co-creation: A social construction approach”, Journal of the Academy of Marketing Science, vol. 39, n. 2, pp. 327-339.
ETZKOWITZ H. (2016), “The Entrepreneurial University: Vision and Metrics”, Industry and Higher Education, vol. 30, n. 2, pp. 83-97.
FEREDAY J., MUIR-COCHRANE E. (2008), “Demonstrating rigour using thematic analysis: A hybrid approach of inductive and deductive coding and theme development”, Journal of Qualitative Methods, vol. 5, n. 11, pp. 80-92.
FRANCO M., HAASE H. (2015), “University-industry cooperation: Researchers’ motivations and interaction channels”, Journal of Engineering and Technology Management, vol. 36, pp. 41-51.
FRISINA A. (2010), Focus group: Una guida pratica, Il Mulino, Bologna. GALÁN-MUROS V., PLEWA C. (2016), “What drives and inhibits university-
business cooperation in Europe? A comprehensive assessement”, R&D Management, vol. 46, n. 2, pp. 369-382.
GARCIA R., ARAÚJO V., MASCARINI S., SANTOS E.G., COSTA A.R. (2018), “How the benefits, results and barriers of collaboration affect university engagement with industry”, Science and Public Policy, vol. 46, n. 3, pp. 347-357.
GUMMESSON E., MELE C. (2010), “Marketing as value co-creation through network interaction and resource integration”, Journal of Business Market Management, vol. 4, no. 4, pp. 181-198.
HA Y., KWON S. (2016), “A study on factors influencing the outcomes of university-industry collaborative activities focusing on the faculty’s need for and engagement in university-industry collaborative activities”, Indian Journal of Science and Technology, vol. 9, n. 46, pp. 1-8.
HEMMERT M., BSTIELER L., OKAMURO H. (2014), “Bridging the cultural divide: Trust formation in university-industry research collaborations in the US, Japan, and South Korea”, Technovation, vol. 34, n. 10, pp. 605-616.
HENARD D.H., MCFADYEN M.A. (2006), “R&D knowledge is power”, Research-Technology Management, vol. 49, n. 3, pp. 41-47.
HITT M.A., IRELAND R.D., SANTORO M. (2003), “Developing and managing strategic alliances, building social capital and creating value”, in Ghobadian A., O’Regan N., Gallear D., Viney, H. (Eds.), Strategy and Performance: Achieving Competitive Advantage in the Global Marketplace, Palgrave Macmillan, Houndmills.

133
JANSSEN O., VLIERT E.V.D., WEST M. (2004). “The bright and dark sides of individual and group innovation: A special issue introduction”, Journal of Organizational Behavior, vol. 25, n. 2, pp. 129-145.
KITAGAWA F., LIGHTOWLER C. (2013), “Knowledge exchange: A comparison of policies, strategies, and funding incentives in English and Scottish higher education”, Research Evaluation, vol. 22, n. 1, pp. 1-14.
KITZINGER J., BARBOUR R. (Eds.) (1999), Developing focus group research: politics, theory and practice, Sage, London.
LAMBERT D.M., ENZ M.G. (2012), “Managing and measuring value co-creation in business-to-business relationships”, Journal of Marketing Management, vol. 28, n. 13/14, pp. 1588-1625.
LAURSEN K., REICHSTEIN T., SALTER A. (2011), “Exploring the effect of geographical proximity and university quality on university-industry collaboration in the United Kingdom”, Regional Studies, vol. 45, n. 4, pp. 507-523.
MARBACH G. (2010), Ricerche per il marketing, 2th Ed., Utet, Torino.MEYNHARDT T., CHANDLER J.D., STRATHOFF P. (2016), “Systemic principles
of value co-creation: Synergetics of value and service ecosystems”, Journal of Business Research, vol. 69, n. 8, pp. 2981-2989.
MELE C., RUSSO-SPENA T. (2015), “Innomediary agency and practices in shaping market innovation”, Industrial Marketing Management, vol. 44, pp. 42-53.
MUSCIO A., POZZALI A. (2012), “The effects of cognitive distance in university-industry collaborations: Some evidence from Italian universities”, The Journal of Technology Transfer, vol. 38, n. 4, pp. 486-508.
NAMBISAN, S. (2017), “Digital entrepreneurship: toward a digital technology perspective of entrepreneurship”, Entrepreneurship Theory and Practice, vol. 41, n. 6, pp. 1029–1055.
NGUGI I., JOHNSEN R.E., ERDELYI P. (2010), “Relational capabilities for value co-creation and innovation in SMEs”, Journal of Small Business and Enterprise Development, vol. 17, n. 2, pp. 260-278.
PERKMANN M., TARTARI V., MCKELVEY M., AUTIO E., BROSTRÖM A., D’ESTE P., SOBRERO M. (2013), “Academic engagement and commercialisation: A review of the literature on university–industry relations”, Research Policy, vol. 42, n. 2, pp. 423-442.
PERKS H., GRUBER T., EDVARDSSON B. (2012), “Co-creation in radical service innovation: A systematic analysis of microlevel processes”, Journal of Product Innovation Management, vol. 29, n. 6, pp. 935-951.
POTTER J. (1996), Representing reality: Discourse, rhetoric and social construction, Sage, London.
PRAHALAD C., RAMASWAMY V. (2004), The future of competition: Co-creating unique value with customers, HBS Press.Boston, MA.
RAMASWAMY, V., OZCAN, K. (2014), The co-creation paradigm, Stanford University Press.
RIPPA, P., SECUNDO, G. (2019), “Digital academic entrepreneurship: The potential of digital technologies on academic entrepreneurship”, Technological Forecasting and Social Change, vol. 146, pp. 900-911.
SAAD M., ZAWDIE G. (2011), “Introduction to special issue: The emerging role of universities in socio-economic development through knowledge networking”, Science and Public Policy, vol. 38, n. 1, pp. 3-6.
Francesco Polese Maria Vincenza CiasulloRaffaella MonteraValue co-creation in University-Industry collaboration. An exploratory analysis in digital research projects

sinergieitalian journal of management Vol. 39, Issue 2, 2021
134
SIEGEL D.S., WALDMAN D.A., ATWATER L.E., LINK A.N. (2003), “Commercial knowledge transfers from universities to firms: Improving the effectiveness of university-industry collaboration”, Journal of High Technology Management Research, vol. 14, n. 1, pp. 111-133.
SOENDERGAARD H.A., BERGENHOLTZ C., ROSENDAHL J.C. (2015), “University-Industry collaboration: Drivers and barriers for going online”, In Proceedings of DRUID Summer Conference, Rome, June 15-17, 2015.
STORBACKA, K., BRODIE, R.J., BÖHMANN, T., MAGLIO, P.P., NENONEN, S. (2016), “Actor engagement as a microfoundation for value co-creation”, Journal of Business Research, Vol. 69, n. 8, pp. 3008-3017.
THOMAS, L. D., AUTIO, E., GANN, D.M. (2014), “Architectural leverage: Putting platforms in context”, Academy of Management Perspectives, vol. 28, n. 2, pp. 198-219.
THUNE T. (2007), “University-industry collaboration: The network embeddedness approach”, Social and Public Policy, vol. 34, n. 3, pp. 158-68.
UN C.A., CUERVO-CAZURRA A., ASAKAWA K. (2010), “R&D collaborations and product innovation”, Journal of Product Innovation Management, vol. 27, n. 5, pp. 673-689.
VARGO S.L., LUSCH R.F. (2011), “It’s all B2B…and beyond: Toward a systems perspective of the market”, Industrial Marketing Management, vol. 40, n. 2, pp. 181-187.
VARGO S.L., LUSCH R.F. (2008), “Service-dominant logic: Continuing the evolution”, Journal of the Academy of Marketing Science, vol. 36, n. 1, pp. 1-10.
VARGO S.L., LUSCH R.F. (2016), “Institutions and axioms: An extension and update of service-dominant logic”, Journal of the Academy of Marketing Science, vol. 44, n. 1, pp. 5-23.
VARGO S.L., LUSCH R.F. (2017), “Service-dominant logic 2025”, International Journal of Research in Marketing, vol. 34, n. 1, pp. 46-67.
ZAMMUNER V.L. (2003), I focus group, Il Mulino, Bologna.WIELAND H., POLESE F., VARGO S.L., LUSCH R.F. (2012), “Toward a service
(eco) systems perspective on value creation”, International Journal of Service Science, Management, Engineering, and Technology (IJSSMET), vol. 3, n. 3, pp. 12-25.
Academic or professional position and contacts
Francesco Polese Full Professor of Management University of Salerno - Italye-mail: [email protected]
Maria Vincenza Ciasullo Associate Professor of Management University of Salerno - Italye-mail: [email protected]
Raffaella Montera Adjunct Professor University of Salerno - Italye-mail: [email protected]
sinergieitalian journal of management
ISSN 0393-5108 DOI 10.7433/s115.2021.07
pp. 117-134

135
Received18th February 2020
Revised 8th May 2020
Accepted 21st June 2021
Exploring connections between vintage marketing and sustainability in the italian agri-food sector. An empirical analysis1
Annunziata Tarulli - Domenico Morrone - Pierluigi Toma
Abstract
Purpose of the paper: This research aims to find out a possible relationship between the “nostalgia effect” (related to Vintage Marketing) and sustainability applications in the Italian Agri-food sector. In particular, focusing on organic food products, the analysis seeks to find a connection between these topics by considering the consumers’ food purchasing behaviours.
Methodology: The data collected through the dissemination of an online questionnaire was used to answer the research questions. After a first descriptive analysis of the sample, two exploratory factor analyses were performed to identify those latent factors underlying the variables.
Findings: The results show a positive relationship between the Vintage and Sustainability topics, implying that memories of past consumption are capable to influence the consumers’ future food purchase choices.
Research limits: The analysis is limited from two fronts: first, it relates only to Italian consumers and, second, the sample under study is restricted. Therefore, future researches should include a larger dataset, collected from different countries, and consider other factors that could influence the consumers’ food purchasing choices.
Practical implications: Despite the research limits - strictly connected to its embryonic stage - the results highlight interesting managerial and academic implications. It enriches the debate on consumer behaviour, in a sector where all the potential has not yet been expressed.
Originality of the paper: It explores the theme of sustainability from a new angle - that of Vintage - seeking for connections and implications. As literature in this field is not rich, future research should deepen this relationship in order to fill its knowledge gap.
Key words: vintage; sustainability; agri-food; marketing; nostalgia; green
1 Authors’ contributions: Annunziata Tarulli wrote the Literature review, and Data and Sample section. Domenico Morrone contributed to the Introduction, the Research objectives, and Questionnaire Development and Instrument sections. Pierluigi Toma is responsible for Results. All the authors wrote the Discussion and conclusion section and the body of the paper, read and approved the final manuscript.

1. Introduction
In recent decades, the socio-economic scenario has shown a growing attention to corporate social responsibility (CSR) issues as a consequence of the awareness of global warming and climate changes’ evidence. This wind of change has pushed companies to change the way they do business, especially for those belonging to sectors that particularly affect the environment, such as agriculture. Hence, the need to promote new sustainable business models, which seek practices capable of facing the numerous challenges that this revolution poses. In fact, if, on one hand, this shift towards sustainability can be defined as a “mandatory” choice, on the other hand, it represents an opportunity to be seized as it opens to valuable benefits in terms of consumer awareness, brand reputation and corporate image, besides the economics.
The research literature related to sustainability application is very broad and constantly evolving, thanks to its adaptability to different sectors as well as to the ability to create synergies between different topics. In this sense, this work seeks to find a possible connection between Sustainability and Vintage Marketing topics by exploring the Italian consumers’ behaviour during the food purchasing process. In particular, by focusing on agri-food products, this research tries to understand the value consumers assign to value propositions characterized by a nostalgic sentiment related to past experience as well as sustainable features.
Therefore, the rediscovery of such experience from a modern perspective, connected with the paradigm of sustainability, could open a new way in the marketing field, both academic and for managerial implications. It exploits “old” memories as an opportunity to think about sustainability differently.
Although these topics seem to be unrelated, it is possible to create a first theoretical link between the nostalgic sentiment typical of Vintage Marketing strategies and Sustainability in the Italian Agri-food sector. Using the consumers’ point of view, a focus on their behaviour at purchasing time as well as their food consumption is studied, detecting those internal and external factors that influence their behaviour.
Therefore, this paper aimed to explore, through an empirical analysis, whether a relationship between the nostalgic sentiment of Vintage Marketing and Sustainability (expressed in its environmental, social, economic aspects) exists, as well as the influence this relationship may have on the Italian’s food purchasing decisions. To answer these questions, the data collected through the dissemination of an online questionnaire was analysed to understand whether these two unrelated concepts were actually appreciated and perceived as influential by consumers. Therefore, through the use of Exploratory Factor Analyses (EFA), the latent factors among variables were identified and led us to highlight some managerial implications.
The remainder of the paper is organised as follows: Section 2 focuses on the analysis of the extant literature and proposes the research questions; Section 3 introduces the methodology while Section 4 brings in the results of the empirical analysis. Finally, the last section includes discussion

137
and conclusion, suggesting managerial implications as well as future developments.
2. Literature review
2.1 Towards a new sustainable consumption
The latest profound environmental changes and the uncertainty connected to the quality-of-life issues have raised several questions that involve, in different ways, both businesses and consumers. Since the early 21st century, the entire capitalist and consumeristic system have been questioned, leading to a focus shift from profit (Porter et al., 2007) to principles relating to ethics, environmental protection, and social progress. For this reason, companies have started to consider their stakeholders in a new light, integrating sustainable development issues with their strategies (Grant, 2008). Consumer behaviour has also changed over time, especially in the last decades which registered deep changes in the consumers’ consumption preferences and buying behaviour (Cicia et al., 2021). As for consumption, consumers embraced new sustainable attitudes, moving from mainly compulsive and environmentally impactive careless behaviours (e.g., single-use and disposable products, food wastes, etc.), to more reflective and attentive ones, driven by a complex set of interlinked personal, environmental factors as well as social factors (Verbeke, 2008). This demonstrates the centrality of the role of consumption (Grant et. al, 2009), the understanding of which is essential to forecast the direction the way in which individuals’ consumption moves.
From these considerations arise the need for fostering more sustainable consumption patterns, as it assumes considerable importance as consumers’ attention on concepts such as saving, recycling, and reusing products grows. This way of doing is supported also in literature, which highlights that individuals can have a better life only if they undertake to build a better society (Sardar, 2007).
In their transition towards a more sustainable consumption, consumers can count on Marketing applications (i.e., green marketing, vintage marketing, etc.), which promote the adoption of more conscious and sustainable practices (Morrone, 2012) through new managerial strategies.
2.2 Nostalgia and Marketing
Nostalgia is a sentiment for the past, typically for a period or place characterized by happy personal associations (Boyms, 2008). It has its origins from a Greek compound and it is defined as an emotional state characterized by a sense of sadness related to the distance from loved ones, or places, or for events that occurred in the past. It was the physician Joannes Hofer, in 1688, to first define the term “nostalgia” by studying the adverse psychological and physiological symptoms displayed by Swiss mercenaries (Wildschut et al., 2006). Since then, many scholars have tried to define and study this topic in its various forms, and apply it to different research areas,
Annunziata Tarulli Domenico Morrone Pierluigi TomaExploring connections between vintage marketing and sustainability in the italian agri-food sector. An empirical analysis

sinergieitalian journal of management Vol. 39, Issue 2, 2021
138
from sociology to philosophy and, in recent years, also to marketing. As for philosophical research literature, several contributions were made. For example, Kant (1798) defined nostalgia as a mere representation of reality, created by the individual on the basis of his own sensory perception. In sociology, on the other hand, it is noteworthy the contribution of Davis (1979) who expressed nostalgia both in personal and communal ways. The first one associates nostalgia with the individual’s life cycle, whereas the second refers to a sentiment that involves a large number of subjects within society, observed through the lens of significant events (such as revolutions, wars, etc.).
Marketing introduced the so-called “nostalgic link” between consumers and products (Schindler et al., 2003) which identifies a personal relationship between consumer and product during a specific stage of life, called “preference age peak”. Holbrook and Schindler (2003) defined nostalgia as “the preference for objects (e.g., people, places, or things) that were more common (e.g., popular, fashionable, or widely distributed) when we were younger (e.g., in adulthood, in adolescence, as children or even before we were born)”. While Holbrook and Shindler can be considered the precursors of scientific studies concerning the nostalgia role in purchasing behaviours and decision-making process, also other scholars contributed to this topic discovering a close relationship between consumer, product, and nostalgia (Holak and Havlena, 1992, 1998; Goudling, 2001; Fairey, 2003; Muehling and Sprott, 2004; Reisenwitz, Iyer and Cutler, 2004; and other). Davis (1979) divided nostalgia into three orders: the first one, the “simple” nostalgia, is based on the belief that individuals consider past objects or events as better; the second, i.e., the “reflexive” nostalgia, is based on the belief that past eras are better than the present ones; lastly, the “interpreted” nostalgia, relates to the comparison that people make between the current situation and the emotions that nostalgia provokes, intending to improve the present. In any case, regardless of the definition adopted, a necessary condition for nostalgia is that individuals must use memories of past emotions/events, which have to be both experienced first-hand and acquired externally (Braun, 2002). In fact, only through the availability and reliability of their recollections, they act and make purchasing decisions recalling past experiences.
In marketing, nostalgia is exploited by bringing to the mind of consumers the history of a brand, its evolution, and all the individuals’ personal events connected to that specific brand. In other words, through marketing actions, it is possible to convert a negative sentiment (i.e., nostalgia, defined as the suffering caused by memories of the past) (Wildschut et al., 2006) into new opportunities by developing a greater consumer-brand engagement. From these considerations arise the concept of Retro and Vintage Marketing which seeks to explain the consumers’ continuous search for authenticity towards certain brands with the nostalgic dimension. In addition, the revival of old brands allows us to create a connection between today’s consumers, the community in which they live, as well as different generations of consumers, which results to be functional from a strategic side. Therefore, the growing attention to products related to the past.

139
2.3 The role of nostalgia and sustainability in the consumers’ purchasing process
When it comes to the consumers’ purchasing process, the study of consumer behaviour results to be of great importance as it tries to forecast the possible actions and reactions of individuals or groups to the internal and external stimuli they meet at purchasing time. The analysis and understanding of these stimuli is fundamental as it is able to trigger a series of brain mechanisms that lead consumers to buy a product rather than another (Gallucci, 2019). In fact, the consumers’ purchasing choices are influenced by various and complex emotions. Consequently, the ability of businesses to unleash emotions (positive or negative) in consumers’ minds is closely related to the stimulation of some specific areas of the brain.
In marketing, particularly in Vintage Marketing, emotions are capable of making the purchasing time more or less attractive in relation to variables that have nothing to do with the characteristics of the product (for example, influenced by past experiences, or related to a particular emotional phenomenon called somatic marker). Focusing on the Agri-food sector, the study and understanding of neurological phenomena and the conscious and unconscious motivations that push consumers towards a particular purchase play such a decisive role as to substantially modify the current perception of food. Indeed, studies have shown how modern consumers pay more attention to the value of a product’s consumption experience than to the product itself (Meo, 2019). As a result, communication and marketing strategies are no longer directed towards enhancing products but towards individuals, considering their habits, lifestyles, emotions, and perceptions they have during the consumption of food products. Therefore, as individuals are irrational, in the elaboration of purchasing decision-making processes, emotions and memory result to have a leading role.
Emotionality in purchasing choices is widely affirmed in literature (Gallucci, 2019; Lindstorm, 2013), especially in the food products one. Several factors influence the consumers’ perception of food products, such as design, packaging, brand image, positioning on shelves, sensory involvement, and memories. As regards memories, they are strictly connected to the vintage concept. In particular, “vintage foods” means all those products that intentionally evoke a habit of a bygone era, more or less distant from the current one, in which they were consumed. In recent years, the vintage concept applied to the Agri-food sector has received considerable interest both from the scientific community and from consumers. As regards consumers, they look to the past to recover the awareness of a more authentic and genuine food style, characterized by greater attention to quality and healthiness attributes of food products, which is totally in contrast to contemporary consumption styles characterised by ready-to-use and highly-processed foods. Therefore, nostalgia in the food sector seeks for authenticity, traditional, and genuine flavours that recall the memory of a rural world and its values.
As for sustainability, the Agri-food sector is no stranger to the change brought by this topic. In fact, empirical evidence shows that the way in
Annunziata Tarulli Domenico Morrone Pierluigi TomaExploring connections between vintage marketing and sustainability in the italian agri-food sector. An empirical analysis

sinergieitalian journal of management Vol. 39, Issue 2, 2021
140
which food products are consumed has a decisive impact both on the individuals’ environment, economic and social sphere (Seuneke et al., 2013; Morgan et al., 2009; Goodman and Watts, 2007; Sage, 2014). Therefore, the way in which food products are produced and consumed plays a decisive role in the fight against wastes and towards a more conscious use of natural resources (Carolan, 2018). These considerations push companies to seek new strategies for food production, distribution, and consumption aimed at creating an innovative model of integrated economic development, whose origin lies in the individual local territories.
Regarding consumers’ behaviour in the Agri-food sector, several researches (Cristini et al., 2015; Davies et al., 1995; Zanoli et al., 2002) have highlighted the growing interest in consuming organic food and local products. As for organic and local food, consumers associate those aspects related to food safety, naturalness, freshness, healthiness, environmental protection, animal well-being, as well as the maintenance and well-being of rural communities (Lombardi et al., 2015; Bagdonis et al., 2009; DeLind, 2002). Moreover, the interest shown by consumers in local food is linked to a different way of perceiving the quality of food (Migliore et al., 2015), as well as with attributes such as taste and safety.
In this context, information represents a fundamental tool for consumers when they have to purchase, especially in the food sector. Therefore, the need for a complete information as regards the attributes of quality experience (i.e., taste, freshness, etc.), convenience (i.e., simplicity and convenience of consumption) and credence (i.e., organic products, environmental and social sustainability, the origin of the product and ethics), which play a leading role since they represent the basic characteristics of food products (Ophuis et al., 1995; Andersen and Philipsen, 1998; Deshmukh and Mohan, 2015).
Organic products belong to credence attributes. They differ from traditional food for the way in which they are produced (i.e., no chemical pesticides, cultivation that follows the course of the season, etc.). As for the way in which consumers approach to organic products, many scholars studied this phenomenon and concluded that consumers associate the term “organic” with elements such as naturalness, health and well-being, human respect, the environment and nature, quality, and the concept of “unprocessed” (Cristini and Bellini, 2015; Davies et al., 1995). An interesting result was that of Haghner et al. (2007), which highlighted the existence of a relationship between consumers of organic food products and “nostalgia”, as the attributes of these products are able to recall memories of the past and old traditions.
However, despite the high interest of consumers towards organic products, high prices and low disposable incomes represent the primary factors limiting their purchases. Demographic variables (i.e., age, education, income, etc...) were also found to be influential (in a positive or negative way) in the purchase of organic products. Therefore, from these considerations, arises the need to understand whether a relationship between vintage and sustainable aspects exists, its influence as well as the impact the latent factors have on Italian Agri-food purchases. In detail, the following two research questions were empirically tested:
141
RQ1: Is there a relationship between the nostalgic feeling deriving from Vintage Marketing and the awareness of purchasing a sustainable food product?
RQ2: If such a relationship exists, what is its effect and intensity in influencing the purchase of Agri-food products?
3. Methodology and data
3.1 Research objectives
Therefore, the current research has two aims. First, it seeks to find a possible relationship between Sustainability (declined in its environmental, social and economic aspects) and Vintage Marketing (i.e., the “nostalgia effect”) topics in the Italian Agri-food sector. The second, closely connected to the first, aims to find out whether this connection can influence the Italians’ Agri-food product purchases.
Based on the previous background, a questionnaire was built in order to identify those attributes that influence consumers at purchasing time. In particular, it investigated on the following attributes: the food characteristics consumers value the most, their level of knowledge and behaviour towards sustainability aspects, the influence that products recalling past experience have on their purchasing behaviour, as well as their propensity towards organic products. From the analysis of these attributes, it will be possible to understand the nature of consumers’ behaviour at food-purchasing time but also whether certain characteristics may influence their final choices.
3.2 Questionnaire development and variables description
To perform the analysis, the data was collected through the dissemination of an online questionnaire. In particular, the investigation was addressed to a well-stratified sample of Italian consumers and lasted approximately a month (from September to October 2019). The Google Form platform was used to disseminate and collect data.
The survey included 28 questions divided into the following five sections: variables related to Sustainability topic, variables that influence food purchase process, variables related to the Vintage Marketing topic, variables related to organic Agri-food products, and demographic variables. Some questions provided a five-point Likert scale evaluation (where ‘1’ and ‘5’ identified a poor or high match) while others included open or multiple-choice answers. The Likert scale is a psychometric response scale used to measure the level of agreement, attitude, or opinion of the respondents to a statement or question. It measures the extent to which the respondents agree or disagree on a particular topic (Preedy, 2010). The most common scales use five- or seven-points. In this work, a five-point one was used as it is easier to understand and provides a better distribution of data (Matell and Jacoby, 1972). The multiple-choice answers, on the other hand, are useful in understanding the factors that most influence consumer behaviour in the proposed scenarios.
Annunziata Tarulli Domenico Morrone Pierluigi TomaExploring connections between vintage marketing and sustainability in the italian agri-food sector. An empirical analysis

sinergieitalian journal of management Vol. 39, Issue 2, 2021
142
The first section investigated the attention and level of knowledge consumers have on sustainability, their sustainable daily practices, and the importance they give to sustainability aspects at purchasing time. The second section was related to understanding the features consumers value the most when it comes to purchasing food products. In particular, it was asked to evaluate characteristics such as quality, organoleptic properties, availability, price, to name a few. The Vintage Marketing section analysed consumer buying behaviour to understand whether Schindler’s “nostalgic link” influence the Agri-food purchasing process. In particular, the nostalgia effect, its importance at purchasing time, and its link with organic and authenticity were explored. Lastly, the demographic section explored essential demographic items such as gender, age, income, education, qualification, and job.
Table 1 summarizes the description of the variables and their measure.
Tab. 1: Variables description table
Name Description MeasureVariables related to Sustainability InfoSust Expresses the degree of information perceived by the respondent about
environmental, social and economic sustainability.closed, Likert scale
SustPract Indicates the respondent’s implementation of sustainable consumption practices.
closed, Likert scale
PurcSUSTinfl Aims to understand whether, at purchasing time, the consumer pays attention to sustainability aspects.
closed, Likert scale
PurcENVprot Indicates how much a consumer pays attention to environmental protection in purchases decisions making.
closed, Likert scale
Variables that influence food purchase process
Pdt_COST Refers to the price of food products. closed, Likert scalePdt_AVAI Refers to the availability of the product. closed, Likert scalePdt_QUAL Concerns the quality of food. closed, Likert scalePdt_PACK Refers to the packaging. closed, Likert scalePdt_INGR Refers to the ingredients. closed, Likert scalePdt_TAST Refers to the taste. closed, Likert scalePdt_SAV Refers to saving. closed, Likert scalePdt_ADV Refers to advertising. closed, Likert scalePdt_PROMO Refers to the presence of promotions in stores. closed, Likert scalePdt_STORE Refers to the store. closed, Likert scalePdt_ENVprot Refers to the attention, at purchasing time, on products designed and produced
with respect for the environment.closed, Likert scale
Pdt_WORKprot Refers to the attention, at purchasing time, on products designed and produced with respect for workers protection.
closed, Likert scale
Pdt_OTH Refers to the presence of additional attributes (different from the previous ones) that influence consumers at purchasing time.
closed, Likert scale
Variables related to Vintage MarketingPurcVINT Indicates whether the consumer is attracted to food products that remind of
the past.closed, Likert scale
VintEFCT Aims to quantify the incidence of past memories in food purchasing choices. closed, Likert scaleVintAUT Refers to consumers’ association between the concept of “food of the past” and
the authenticity of the product itself.closed, Likert scale
VintSUST Indicates and quantifies the existence of a relationship between the concept of sustainability and vintage food products.
closed, Likert scale
Variables related to organic Agri-food productsPdtBIO Refers to organic food products and, in particular, to the idea that consumers
have of these.closed, single choice
No_BIO Refers to the reasons why consumers do not buy and consume organic food products.
closed, single choice
Demographic variablesGENDER Refers to sexual gender. closed, binary choiceEDUC Refers to educational qualification. open, numericalOCCUP Refers to the occupation. closed, single choiceAGE Refers to age. closed, single choiceINCOME Refers to income closed, single choice
Source: our elaboration

143
3.3 Data and Sample
The online survey reached 450 respondents. Only responses with no missing data were included in the final sample. Participants were 65% female and 35% male, with an average age of 44 years old. As for education, most of the sample had a high school education (59%), followed by college or university (34%) and postgraduate (7%). As regards the profession, the 45% of the sample was a worker, while the remaining part was students (18%), self-employers (13%), and so on. The average monthly income was below Euro 1999,00. Considering this data, it is possible to state that the sample is well-stratified and balanced. Table 2 summarizes the sample composition.
Tab. 2: Sample composition (in percentage, %)
Gender Age (years)
Education Profession Monthly income (€)
Female, 65 18-25, 21 High school or below, 59 Student, 18 < 999, 41Male, 35 26-40, 25 College or university, 34 Employed, 45 1.000-1.999, 38
41-55, 34 Postgraduate, 7 Entrepreneur, 6 2.000-2.999, 1456-65, 16 Self-employed, 13 > 3.000, 7> 65, 4 Unemployed, 8
Retired, 10 Source: our elaboration
4. Results
To answer the research questions, the data collected was studied as follows. At first, a descriptive analysis was carried out focusing on the purchasing attributes related to sustainability, food characteristics, nostalgia effect, and organic products. Subsequently, two Exploratory Factor Analyses (EFA) were performed to identify those latent factors underlying the phenomena under study. In particular, the attributes that influence the purchase intentions, as well as the connection between sustainability aspects and nostalgia effect, were examined.
4.1 Focus on the sample’s purchasing attributes
The first step was, therefore, to analyse the attributes that the respondents value during their food purchasing process. As for the sustainability aspects, Table 3 shows that most of the sample has a medium level of knowledge of sustainability (45%) and adopt sustainable practices in daily life (e.g., attention to wastes, recycling, use of the bike instead of the car, etc...) (35%). Furthermore, the possible relationship between food purchases and sustainability was studied both in general terms as well as focusing on environmental protection. As for the generic relationship, 42% of the sample declares to be quite influenced by sustainability aspects during purchasing, whereas the remainder is fairly (24%) or highly (13%)
Annunziata Tarulli Domenico Morrone Pierluigi TomaExploring connections between vintage marketing and sustainability in the italian agri-food sector. An empirical analysis

sinergieitalian journal of management Vol. 39, Issue 2, 2021
144
influenced. This demonstrates the sample’s growing interest in purchasing food products geared toward sustainable consumption (only 6,4% of the sample are not affected at all). This trend is also confirmed by the attention to environmental sustainability (i.e., the purchase of organic products or from particular areas), which obtains higher percentage scores as attention increases (Tab. 3).
Tab. 3: Purchasing attributes of food and sustainability (in percentage, %)
Knowledge-level of sustainability
Sustainable practices
Sustainable influence in purchasing food
products
Attention to environmental sustainability
Likert’s scale
1 4 2 6 82 19 11 15 143 45 32 42 284 25 35 24 315 7 20 13 19
Source: our elaboration
As for food product characteristics, the respondents value features like quality, ingredients, and taste of medium-high importance. On the other hand, attributes such as advertising, packaging, point of sale, worker protection, availability, environmental protection, and price had a medium-low relevance. Regarding savings and promotions, these attributes deserve different considerations. The results show that there is a share of consumers who consider these attributes of little relevance - therefore they pay more attention to other characteristics (e.g., quality) - and there is a share of consumers for whom it assumes clearly higher importance.
Next, the study focused on Vintage and its possible implications in the Agri-food sector. Table 4 confirms the existence of an attraction to food products that evoke the past in the minds of consumers (e.g., foods consumed during childhood/adolescence). More specifically, more than half of the sample is considered to be substantially influenced by vintage elements at purchasing time, while the rest of the sample records no influence, or little and medium influence. As for Agri-food products, 33% of the sample shows a high incidence of nostalgia in their Agri-food purchases, while the rest of the sample reports a medium (30%), low (26%) or absent (11%) incidence (Tab. 4). In addition, the association between nostalgia and authenticity (i.e., a greater naturalness of food products that evoke past experiences) was also investigated. The results show that 54% of the respondents associate a greater genuineness to nostalgic food products, while the rest of the sample identifies an intermediate (23%), low (13%), or absent (10%) association. Lastly, the link between nostalgic food products and sustainability was found as 70% of the respondents expressed a medium-high connection between these two topics (Tab. 4).

145
Tab. 4: Vintage (in percentage, %)
Food products and nostalgia
effect
Incidence of nostalgia effect at purchasing time
Vintage food and
genuineness
Vintage food and
sustainabilityLikert’s scale
1 8 11 10 92 16 26 13 213 25 30 23 414 31 21 24 215 20 12 30 8
Source: our elaboration
As for organic products, the analysis revealed that the respondents consider organic food products healthier (20%) and less chemically treated and less processed (72%), than non-organic food products. Furthermore, 6% of the sample considers these products a return to “the good food of the past”, while only 1% believes that they are tastier. Lastly, the respondents identified the following reasons why organic food products are not purchased: excessive cost (66%), lack of confidence in these products (24%), or lack of interest in this food category (9%).
This descriptive analysis allows us to make some initial reflections. There seems to be a growing attention from consumers towards responsible food consumption, which is positively associated with the “nostalgia effect” as they connect the attribute of authenticity to “vintage food product”. Consequently, it generates a first meeting point between sustainability and vintage topics. In addition, also other attributes - such as quality, ingredients, and taste - seem to influence these purchases. Finally, as regards organic food products, the majority of consumers understand and appreciate these products but still consider them too expensive.
4.2 Exploratory Factor Analysis: Consumers’ purchase intention
Once the variables were defined, the analysis focuses on detecting the latent factors influencing the purchasing intention of consumers. Therefore, the first Exploratory Factor Analysis (EFA) was performed using the twelve variables influencing food purchasing process. However, before proceeding with the analysis, the correlation matrix was first carried out. Table 5 shows good and medium-high positive correlations among all the variables, thus confirming the importance of these attributes when it comes to purchase food products.
Annunziata Tarulli Domenico Morrone Pierluigi TomaExploring connections between vintage marketing and sustainability in the italian agri-food sector. An empirical analysis

sinergieitalian journal of management Vol. 39, Issue 2, 2021
146
Tab. 5: Correlation Matrix
Source: our elaboration with IBM SPSS Statistics
In order to perform a robust analysis, two tests were performed to understand whether the sample was adequate for the development of the model: the Kaiser-Meyer-Olkin Measurement (KMO Test) and the Test of Sphericity by Bartlett. Both measures were found to be significant (Tab. 6) as KMO values higher than 0,7 are to be considered satisfactory. Therefore, we proceeded with the analysis.
Tab. 6: KMO and Bartlett’s Test
Kaiser-Meyer-Olkin Measure of Sampling Adequacy. ,881Bartlett's Test of Sphericity Approx. Chi-Square 3.060,707
df 66Sig. ,000
Source: our elaboration with IBM SPSS Statistics
The next step was to study Communalities, which indicates how much the variance of each considered variable is explained by common factors. The analysis showed significant values so the Total Variance Explained was then carried out. Its results identified the three factors to be extracted, as they were the ones capable of explaining more than half of the total variance of the phenomenon under study (69,9%). Finally, the Rotated Component Matrix detected the three latent factors among the variables, summarised in Table 7.
The first factor includes the variables Pdt_ENVprot, Pdt_WORKprot, Pdt_INGR, Pdt_QUAL, and Pdt_TAST, which identifies the component that combines sustainability with product quality (Sustainability and Quality). The second includes the variables Pdt_COST, Pdt_SAV, Pdt_PROMO, and Pdt_AVAI and is defined as the economic component that considers the relevance of the price, savings, and promotions, which is associated with the importance of availability (Price and Availability). The last factor refers to the variables Pdt_STORE, Pdt_ADV, and Pdt_PACK, which relates to marketing aspects as they consider the influence of the store type, advertising, and packaging (Marketing).
COST AVAI QUAL PACK INGR TAST SAV ADV PROMO STORE ENVprot WORKprot
Pdt_COST 1
Pdt_AVAI 0,55 1
Pdt_QUAL 0,49 0,49 1
Pdt_PACK 0,27 0,36 0,44 1
Pdt_INGR 0,31 0,43 0,71 0,48 1
Pdt_TAST 0,5 0,52 0,74 0,42 0,61 1
Pdt_SAV 0,78 0,53 0,5 0,31 0,34 0,5 1
Pdt_ADV 0,34 0,41 0,37 0,39 0,32 0,34 0,4 1
Pdt_PROMO 0,57 0,41 0,41 0,29 0,28 0,46 0,6 0,48 1
Pdt_STORE 0,25 0,48 0,32 0,41 0,32 0,37 0,33 0,43 0,4 1
Pdt_ENVprot 0,3 0,44 0,6 0,49 0,64 0,5 0,35 0,3 0,24 0,36 1
Pdt_WORKprot 0,25 0,4 0,55 0,4 0,58 0,49 0,29 0,28 0,18 0,35 0,8 1

147
Tab. 7: Rotated Component Matrix
Component1 2 3
Pdt_ENVprot ,843Pdt_WORKprot ,829Pdt_INGR ,808Pdt_QUAL ,727Pdt_TAST ,623Pdt_COST ,884Pdt_SAV ,846Pdt_PROMO ,704Pdt_AVAI ,516Pdt_STORE ,798Pdt_ADV ,721Pdt_PACK ,544
Extraction Method: Principal Component Analysis. Rotation Method: Varimax
Source: our elaboration with IBM SPSS Statistics
4.3 Exploratory Factor Analysis: Sustainability and “nostalgia effect” in Agri-food sector
Subsequently, it was performed the second Exploratory Factor Analysis (EFA), which examined the possible relationships between the concept of sustainability and the “nostalgia effect” in the Agri-food purchases. The Correlation Matrix (Tab. 8) shows, this time, different results as negative correlations are found in the VintAUT and PurcVINT variables. However, even if negative, these correlations have values really close to zero. The remaining variables, on the other hand, detect positive correlations ranging from low to medium-high values.
Tab. 8: Correlation Matrix
Source: our elaboration with IBM SPSS Statistics
Therefore, we proceeded with the KMO and the Bartlett’s Test, which verified the adequacy of the sample (Tab. 9).
InfoSust SustPract PurcSUSTinfl PurcENVprot PurcVINT VintEFCT VintAUT VintSUST AGE
InfoSust 1
SustPract 0,351 1
PurcSUSTinfl 0,359 0,46 1
PurcENVprot 0,293 0,346 0,608 1
PurcVINT 0,06 0,018 0,11 0,105 1
VintEFCT 0,061 0,057 0,177 0,158 0,748 1
VintAUT -0,015 -0,005 0,049 0,099 0,272 0,319 1
VintSUST 0,051 0,108 0,239 0,203 0,396 0,468 0,408 1
AGE 0,073 0,165 0,196 0,158 -0,086 0,006 0,204 0,075 1
Annunziata Tarulli Domenico Morrone Pierluigi TomaExploring connections between vintage marketing and sustainability in the italian agri-food sector. An empirical analysis

sinergieitalian journal of management Vol. 39, Issue 2, 2021
148
Tab. 9: KMO and Bartlett’s Test
Kaiser-Meyer-Olkin Measure of Sampling Adequacy. ,698Bartlett's Test of Sphericity Approx. Chi-Square 1.067,617
df 36Sig. ,000
Source: our elaboration with IBM SPSS Statistics
Following, the analysis of Communalities was carried out and confirmed the ability of the common factors in explaining a relevant part of the total variance of the extracted variables. Then, the analysis of the Total Variance Explained defined in three the factors capable of explaining more than half of the total variance (i.e., 64,30%), which were finally detected with the Rotated Component Matrix (Tab. 10).
Tab. 10: Rotated Component Matrix
Component1 2 3
VintEFCT ,884PurcVINT ,875VintSUST ,672PurcSUSTinfl ,816PurcENVprot ,734SustPract ,725InfoSust ,665AGE ,816VintAUT ,634
Extraction Method: Principal Component Analysis. Rotation Method: Varimax
Source: our elaboration with IBM SPSS Statistics
Specifically, the first component includes the variables related to the attraction to food products that remind of the past, the incidence of past memories in food purchasing choices, and the relationship between the concept of sustainability and vintage food products (i.e., VintEFCT, PurcVINT, and VintSUST). Therefore, this first component demonstrates the latent existence of a relationship between the vintage features and sustainability in the food purchases (Vintage and Sustainability). The second factor combines the PurcSUSTinfl, PurcENVprot, SustPract, and InfoSust variables, which relate to the growing influence that sustainability has in Agri-food products purchasing and, in particular, to the increasingly role of sustainable knowledge and practices (Knowledge and Influence of Sustainability). Lastly, the third component refers to the AGE and VintAUT variables. It confirms the first latent factor but it highlights a totally different aspect. In this sense, the positive relationship between past purchasing experiences, the perception of authenticity of vintage Agri-food products, and sustainability are demonstrated. It is interesting to emphasize that

149
past purchases, with a strong nostalgic component, not only influence future purchases but manage to significantly evoke the feeling of a healthy, genuine and sustainable product (Past experience).
5. Discussion and conclusion
The results confirmed the consumers’ growing attention towards a more responsible consumption of food products, as well as a positive relationship between sustainability aspects and the nostalgic sentiment. In particular, an initial connection between these topics is discovered in the first latent factor, which proves the existence of a relationship between the greater value that consumers give to vintage food products - as well as its importance in influencing food purchases - and sustainable applications. In this context, indeed, knowledge of sustainability and its potential is fundamental in the application and implementation of best practices for businesses. In fact, by exploiting the greater value customers place on vintage food products, companies can maximize their revenues by changing their offer toward a more authentic and sustainable one. Furthermore, the great power assigned to nostalgic sentiment should also be noted. In fact, past purchases characterised by strong nostalgic components are able not only to influence future purchases but also manage to significantly evoke the feeling of a healthy, genuine, and sustainable product. Therefore, companies should consider these aspects in their business practices, the implementation of which could strategically lead to greater benefits in terms of consumer awareness, brand reputation and corporate image, besides economics.
Moreover, also the other attributes that influence the Agri-food purchasing process need to be exploited, as their analysis could open to further managerial considerations. As for economic attributes (i.e., price, savings, and promotions), for example, the need to set up new advertising strategies emerged, focused on the enhancement of the product (e.g., packaging) and the enhancement of better purchasing experience for consumers (e.g., more attractive stores).
A final consideration must be made regarding organic food products. The analysis highlighted that even if most of the sample positively links attributes like quality, authenticity, and healthiness to these products, however, the connection between organic and vintage topics appeared to be almost non-existent. Nonetheless, companies should still promote this connection as nostalgia is gaining interest among consumers. Therefore, besides the healthiness and authenticity attributes, future marketing campaigns should emphasise the return to the good products of the past as this is the ultimate goal of the organic products.
In conclusion, the obtained results allow us to positively answer the research questions underlying this study. In fact, exploratory factor analyses have shown that the relationship between nostalgic sentiment and sustainable food products exists, is positive, and consumers are aware of it. Therefore, even in this first exploratory stage of the study, a meeting point between sustainability and vintage was discovered.
Annunziata Tarulli Domenico Morrone Pierluigi TomaExploring connections between vintage marketing and sustainability in the italian agri-food sector. An empirical analysis
sinergieitalian journal of management Vol. 39, Issue 2, 2021
150
Undoubtedly, this study is not without limitations. First, the sample under study is quite small (e.g., it reached only 450 respondents) and, moreover, it relates only to Italian consumers. However, as this represents a first step in the exploration of these themes, we expect to overcome this limitation by deeply analysing these topics in future researches. Therefore, future analyses should include a bigger dataset, collected from a wider and diversified sample, from different countries. The second limitation, on the other hand, is strictly related to the novelty of the topic under study. In fact, this work provides a preliminary understanding of the connections between the Vintage Marketing and Sustainability topics. With our results, we seek to lay the foundations for a new research perspective in the management arena, the understanding of which will be key to directing companies towards more consumer-oriented strategies. This way of doing will benefit both companies and consumers: companies because they will reach the desired sales level and increase their reputation, consumers because they will find and purchase products in line with their desires.
References
ANDERSEN E.S., PHILIPSEN K. (1998), “The evolution of credence goods in customer markets: exchanging “pigs in pokes””, DRUID Winter Seminar, Middelfart, vol. 10.
BAGDONIS J.M., HINRICHS C.C., SCHAFFT K.A. (2009), “The emergence and framing of farm-to-school initiatives: civic engagement, health and local agriculture”, Agriculture and Human Values, vol. 26, n. 1-2, pp. 107-119.
BOYM S. (2008), The future of nostalgia, Basic books.BRAUN K.A., ELLIS R., LOFTUS E.F. (2002), “Make my memory: How advertising
can change our memories of the past”, Psychology and Marketing, vol. 19, n. 1, pp. 1-23.
CAROLAN M. (2018), The Real Cost of Cheap Food, Routledge.CICIA G., FURNO M., DEL GIUDICE T. (2021), “Do consumers’ values and
attitudes affect food retailer choice? Evidence from a national survey on farmers’ market in Germany”, Agricultural and Food Economics, vol. 9, n. 1, pp. 1-21.
CRISTINI G., BELLINI S. (2015), “Le dimensioni fiduciarie nell’acquisto dei prodotti biologici: un’analisi esplorativa”, Micro and Macro Marketing, vol. 24, n. 1, pp. 21-40.
DAVIES A., TITTERINGTON A.J., COCHRANE C. (1995), “Who buys organic food? A profile of the purchasers of organic food in Northern Ireland”, British Food Journal, vol. 97, n. 10, pp. 17-23.
DAVIS F. (1979), Yearning for yesterday: A sociology of nostalgia, Free Press.DELIND L.B. (2002), “Place, work, and civic agriculture: Common fields for
cultivation”, Agriculture and Human values, vol. 19, n. 3, pp. 217-224.DESHMUKH A.K., MOHAN A. (2015), “Exploring consumer preferred food
attributes in India”, Business Review (gbr), vol. 54.GALLUCCI F. (2019), Neuromarketing, Egea, Seconda edizione, pp. 10-20, 86-98.GOULDING C. (2001), “Romancing the past: heritage visiting and the nostalgic
consumer”, Psychology and Marketing, vol. 18, n. 6, pp. 565-592.

151
GRANT J. (2008), “Green marketing”, Strategic Direction, vol. 24, n. 6, pp. 25-27.GRANT J., CARÙ A., PEROGGI M., DE MARINIS A. (2009), Green Marketing: Il
Manifesto, Francesco Brioschi Editore, pp. 7-14, 98-111, 266-272.HOLAK S.L., HAVLENA W.J. (1992), Nostalgia: An exploratory study of themes and
emotions in the nostalgic experience, ACR North American Advances.HOLAK S.L., HAVLENA W.J. (1998), “Feelings, fantasies, and memories: An
examination of the emotional components of nostalgia”, Journal of Business Research, vol. 42 n. 3, pp. 217-226.
HOLBROOK M.B. (2003), “Nostalgic bonding: exploring the role of nostalgia in the consumption experience”, Journal of Consumer Behaviour, vol. 3, n. 2, Henry Stewart Publications 1479-1838, pp. 107-127.
HOLBROOK M.B., SCHINDLER R.M. (1989), “Some Exploratory Findings on the Development of Musical Tastes”, Journal of Consumer Research, vol. 16, n. 1, pp. 119-24.
HOLBROOK M.B., SCHINDLER R.M. (1991), “Echoes of the Dear Departed Past: Some Work in Progress On Nostalgia”, Advances in Consumer Research, vol. 18, n. 1, pp. 330-333.
LINDSTROM M. (2013), Neuromarketing, Attività cerebrale e comportamenti d’acquisto, Apogeo Education, pp. 133-147.
MATELL M.S., JACOBY J. (1972), “Is there an optimal number of alternatives for Likert-scale items? Effects of testing time and scale properties”, Journal of Applied Psychology, vol. 56, n. 6, p. 506.
MEO C. (2019), Food Marketing2: Il food conquista la città, Hoepli Editore.MIGLIORE G., SCHIFANI G., GUCCIONE G.D., CEMBALO L. (2014), “Food
community networks as leverage for social embeddedness”, Journal of Agricultural and Environmental Ethics, vol. 27, n. 4, pp. 549-567.
MORGAN K., MARSDEN T., MURDOCH J. (2009), Worlds of Food: Place, Power, and Provenance in the Food Chain, Oxford University Press.
MORRONE, D. (2012), “The influence of Sustainable Sevelopment on Marketing Theory”, Megatrend Review, vol. 9, n. 4.
MUEHLING D.D., SPROTT D.E., SPROTT D.E. (2004), “The power of reflection: An empirical examination of nostalgia advertising effects”, Journal of Advertising, vol. 33, n. 3, pp. 25-35.
OPHUIS P.A.O., VAN TRIJP H.C. (1995), “Perceived quality: A market driven and consumer-oriented approach”, Food Quality and Preference, vol. 6, n. 3, pp. 177-183.
PORTER M.E., KRAMER M.R. (2007), “Strategia e società. Il punto d’incontro tra il vantaggio competitivo e la Corporate Social Responsibility”, Harvard Business Review Italia, vol. 14, n. 1/2, pp. 1-18.
PREEDY V.R. (2010), Handbook of disease burdens and quality of life measures, R. R. Watson (Ed.). New York, Springer, pp. 4271-4272.
REISENWITZ T.H., IYER R., CUTLER B. (2004), “Nostalgia Advertising and the Influence of Nostalgia Proneness”, Marketing Management Journal, vol. 14 n. 2.
SAGE C. (2015), “Food and Sustainable Development: How should we feed the world?”, Routledge International Handbook of Sustainable Development, Abingdon, UK, Routledge.
SARDAR Z. (2007), “Beyond the troubled relationship”, Nature, vol. 448, n. 7150, pp. 131-133.
Annunziata Tarulli Domenico Morrone Pierluigi TomaExploring connections between vintage marketing and sustainability in the italian agri-food sector. An empirical analysis

sinergieitalian journal of management Vol. 39, Issue 2, 2021
152
SCHINDLER R.M., HOLBROOK M.B. (2003), “Nostalgia for early experience as a determinant of consumer preferences”, Psychology and Marketing, vol. 20, n. 4, pp. 275-302.
SEUNEKE P., LANS T., WISKERKE J.S. (2013), “Moving beyond entrepreneurial skills: Key factors driving entrepreneurial learning in multifunctional agriculture”, Journal of Rural Studies, vol. 32, pp. 208-219.
VERBEKE W. (2008), “Impact of communication on consumers' food choices: Plenary lecture”, Proceedings of the Nutrition Society, vol. 67, n. 3, pp. 281-288.
WILDSCHUT T., SEDIKIDES C., ARNDT J., ROUTLEDGE C. (2006), “Nostalgia: content, triggers, functions”, Journal of personality and social psychology, vol. 91, n. 5, p. 975.
ZANOLI R., NASPETTI S. (2002), “Consumer motivations in the purchase of organic food”, British Food Journal, vol. 104, n. 8, pp. 643-653.
Academic or professional position and contacts
Annunziata Tarulli Ph.D. Student LUM “Jean Monnet” University, Casamassima (BA) - Italye-mail: [email protected]
Domenico MorroneAssociate Professor of Management LUM “Jean Monnet” University, Casamassima (BA) - Italye-mail: [email protected]
Pierluigi TomaAssistant Professor in Econometrics University of Salento - Italye-mail: [email protected]
sinergieitalian journal of management
ISSN 0393-5108 DOI 10.7433/s115.2021.08
pp. 135-152

Sinergie Italian Journal of Management
Useful information for readers and authors


Aims and scope
What is the positioning of Sinergie Italian Journal of Management?
Sinergie Italian Journal of Management, the official journal of the Società Italiana di Management (SIMA-the Italian Society of Management), is a peer-reviewed scholarly publication that presents leading research across all business and management areas and focuses on the main trends and boundary-pushing ideas in management studies.
What is this journal’s topic coverage?
The journal has a broad thematic profile and covers various areas in the business and management field, such as strategic management, corporate governance, entrepreneurship, international business, sustainability, small and family business, operations and supply chains, strategic communication, marketing, retailing and service management, innovation and technology management, tourism and culture management and, of course, business ethics and general management.
What is “Italian” in Sinergie Italian Journal of Management?
This journal aims both to bring the Italian management perspective to the international debate and to encourage scholars worldwide to contribute through an innovative approach on topics relevant to the sound conduct of businesses and other organisations. The journal’s keywords include, but are not limited to, management applications specially relevant to the Italian economy and other mature economies, such as manufacturing, creativity, sustainability, open innovation, digital transformation, entrepreneurship in small and medium-sized enterprises, family business, networks, alliances and territorial ecosystems, innovative value proposals and circular business models, as well as to the management of specific businesses, such as food, fashion, furniture, industrial equipment, art, culture, tourism, design and luxury.
How broad is the scope of this journal?
Sinergie Italian Journal of Management aims to balance relevance with methodological rigour and encourages interpretation, reasoning and critical, context-aware discussion about phenomena and their managerial implications. Narrow discussions focussed only on highly specific sub-fields will be regarded as non-priority.
Which research approach does this journal welcome?
The journal is open to different research approaches and welcomes both conceptual and empirical contributions that employ a qualitative, quantitative or mixed methods research approach. It also accepts case
sinergieitalian journal of management
155

studies, provided the analysis is adequate. Review articles that move beyond description to propose critical reflection and sound theoretical contributions are also welcome.
Issues frequency and coverage
When is the journal published during the year and are special issues part of the editorial planning?
The journal is published every quarter. It welcomes both the submission of manuscripts to be published in its regular issues and of manuscripts to be published in special issues edited by guest editors. Special thematic issues have always been a prominent feature of Sinergie Italian Journal of Management. Currently, the Editors are encouraging the development of special issues on relevant management themes that fit the journal’s scope.
Principles and vision
What principles drive the conduct of this journal?
A few fundamental principles drive the conduct of Sinergie Italian Journal of Management:• Relevance: The journal values the usefulness of research to improving
management practice and to addressing business challenges and socially relevant issues.
• Originality: The journal encourages creativity, curiosity and interdisciplinary contamination in an effort to develop fresh, sometimes out-of-the-box, ways of conceptualising management-related phenomena.
• Collaboration: The journal fosters collaboration and networking with the different components of the national and international scientific community by considering their ‘voices’ and by being open to proposals of partnership with other journals.
• Respect: The journal promotes constructive, respectful dialogue among authors, staff and readers and recognises the dignity of individuals and the validity of their opinions.
What vision has inspired the development of this journal?
Connections between research, ethics, creative thinking and managerial action are the foundational premises on which to build a future based on the common good.
sinergieitalian journal of management
156

Peer review procedures
How is journal content quality assured?
Sinergie is a double-blind reviewed journal.
Only original content is published, following evaluation procedures. The journal’s editor-in-chief and co-editor are in charge of evaluating the papers and supervising the peer-review process.
Each paper is submitted for evaluation to two anonymous independent reviewers, who are academics chosen among experts in the field.
Editorials and explicitly invited contributions are not subjected to peer review.
The editors reserve the right to require changes to a manuscript, including to its length, as a condition of acceptance. The editors reserve the right, notwithstanding acceptance, not to publish the paper if for any reason such publication would, in the reasonable judgement of the editors, result in legal liability or violation of the journal’s ethical practices. If the editors decide not to publish a paper, the author or authors are free to submit it to any other journal of any publisher.
The peer-review process can lead to:- acceptance of the paper as it is- acceptance with minor proposals for improvements- acceptance subject to substantial modifications- revise and resubmit- rejection.
The review forms will be sent back to the corresponding author, who must return the paper within a specified time frame after revising it according to the reviewers’ comments. In case of substantial modifications and of “revise and resubmit”, the manuscript is sent again to reviewers for further evaluation.Guidance by the editor-in-chief, guest editors and blind referees results in a ‘training ground for young researchers’, which at the time of foundation was declared as the mission of Sinergie by its founder, Giovanni Panati.
Reviewers apply the following criteria when assessing submissions:1. correctness of the methodological approach2. relevance of the primary and secondary data sources and of the
references3. clarity of expression4. originality/innovation5. relevance from theoretical and empirical viewpoints, and potential
impact of managerial implications.
sinergieitalian journal of management
157

Access to journal content
How can journal content be accessed and retrived?
Fondazione CUEIM, the publisher of Sinergie Italian Journal of Management, is committed to public availability and preservation of scholarly research and ensures open accessibility to the papers on its servers.
The authors agree to open access publication of their paper under the terms of the Creative Commons Licence Attribution 4.0 International (CC BY 4.0)1, and for it to be published as part of an issue of the periodic publication Sinergie Italian Journal of Management ISSN 0393-5108.
The authors grant the publisher and its archiving partners the non-exclusive and irrevocable right to archive the paper and to make it accessible (online and free of charge) for public distribution. This granted right extends to any associated metadata of the paper. Specifically, the authors license the associated metadata under a Creative Commons CC0 1.0 Universal licence (public domain). The authors agree that author names and affiliations are part of the associated metadata and may be stored on the servers of Fondazione CUEIM and made available under the CC0 license.
1 Available at https://creativecommons.org/licenses/by/4.0/legalcode
sinergieitalian journal of management
158
sinergieitalian journal of management
159
Publishing ethics and publication malpractice statement
How does the journal enforce publishing ethics and prevent malpractices?
The editors of Sinergie Italian Journal of Management apply the principles of independence, confidentiality and fairness when reviewing submissions.
Reviewers examine the submissions objectively and confidentially, in a way that helps authors to improve their manuscript.Editors and reviewers will not use unpublished information disclosed in a submitted manuscript for their personal advantage.
Possible conflicts of interest resulting from competitive, collaborative or other relationships with any of the authors, companies or institutions connected to the papers will be disclosed by editors and reviewers.
Authors who submit articles to Sinergie Italian Journal of Management agree to the following terms of conduct regarding avoidance of plagiarism, authorship, redundant publications, copyright protection, legality and disclosure of conflicts of interest.
The paper is the authors’ original work, the contents are based on the authors’ own research and are expressed in their own words. If authors have used the work or words of others, they must be appropriately cited and referenced.
All individuals identified as authors actually contributed to the paper, and all individuals who contributed are included. Those who have provided support but have not contributed to the research should be acknowledged on the first page of the article.
If the paper was prepared jointly, the corresponding author has informed the co-authors of the terms of conduct and has obtained their signed written permission to adhere to and to sign the Licence for Publishing on their behalf as their agent.
The paper is submitted only to Sinergie Italian Journal of Management and publication is not redundant: the paper has not been published in its current or a substantially similar form before, has not been included in another manuscript, and is not currently under consideration or accepted for publication elsewhere; as a controlled exception, papers developed from published conference proceedings are accepted but only as a result of a previous explicit agreement between the editors of Sinergie Italian Journal of Management and the conference organisers.
If excerpts from copyrighted works owned by third parties are included, the authors shall obtain written permission from the copyright owners for all uses, and show credit to the sources in the paper.
The paper and any submitted supporting information must contain no libellous or unlawful statements, must not infringe upon the rights (including without limitation the copyright, patent or trademark rights) or the privacy of others, must not breach any confidentiality obligation, must not violate a contract or any law, must not contain material or instructions that might cause harm or injury, and must only use data that has been obtained in accordance with applicable legal requirements and the journal’s policies.
The author must confirm that there are no conflicts of interest relating to the paper, except as disclosed. Accordingly, the author represents that the following information shall be clearly identified on the title page of the paper: (1) all financial and material support for the research and work; (2) any financial interests the author or any co-authors may have in companies or other entities that have an interest in the information in the paper or any submitted supporting information (e.g. grants, advisory boards, employment, consultancies, contracts, honoraria, royalties, expert testimony, partnerships or stock ownership); and (3) indication of no such financial interests if appropriate.
All authors will receive a final version of the article, take responsibility for the content, agree to its publication, the order of the authors listed on the paper and the allocation of paragraphs. All authors must read and adhere to the journal’s author guidelines.
sinergieitalian journal of management
160

sinergieitalian journal of management
161
Author guidelines
How do I submit a paper to this journal?
Authors who wish to submit a paper to the journal should comply with the submission procedures and the author guidelines, which are presented on the journal’s website.
Sinergie only publishes original work; therefore, submitted papers must not have previously been published in a refereed journal in their current or a substantially similar form, and they must not be currently under consideration for publication in another refereed journal (any explanation on the matter must be provided to the editor in the accompanying email).
Editors cannot provide any excerpts of the paper. Authors may download the PDF file of their paper’s final layout from the journal’s website.Authors are required to express their consent to the publication of their disclosed email addresses, as stated by Italian Law D.Lgs. 196 of 30 June 2003. They must also commit themselves to respect the journal’s publishing ethics.
Authors may submit papers in English or Italian by sending the paper directly to the Publisher’s Secretary ([email protected]).
The submission procedure requires authors to provide:
Two separate files (.doc):
- The first file should be called ‘IA’, and it should include only the title of the paper, information about the authors (qualifications, scientific sector, email addresses and corresponding author’s mobile phone number, which will be reserved for internal use), possible allocation of paragraphs, acknowledgements and references to research projects that led to the drafting of the paper.
- The second file should be called ‘FP’. It must not contain any details regarding the author(s), or any information that could be traced back to the author(s) (e.g. acknowledgements and similar expressions).
To ensure the quality of the editing, especially of tables, graphs and figures, the preferred format is Microsoft Word, but compatible formats are accepted as well. Files in .bmp, .jpeg, .jpg, .png and .gif formats can create problems in editing. If possible, please avoid these formats and provide files containing additional tables and graphs in their original format (e.g. xls). Footnotes should be used only for comments, to provide more detail or alternative considerations; they should not contain bibliographic information.

sinergieitalian journal of management
162
What is the acceptable word limit and what are the other editorial guidelines to follow when submitting a paper to this journal?
LengthThe paper should not exceed 7,000 words, including charts, figures, tables, footnotes and references.
TitleNo longer than 125 characters (spaces included).
AbstractNo longer than 250 words. The abstract must be structured according to the following layout: frame of the research, purpose of the paper, methodology, results, research limitations, practical implications and originality of the study.
KeywordsA minimum of three and a maximum of six keywords must be included to identify the framework of the study’s main topic.
Text style
The body of the text and of the notes must be justified.
Italics may be used to emphasise certain parts of the text and for English words that are not commonly used. Neither boldface (except in paragraph titles) nor underlining should be used.
Text graphic rules
Quotations must be indicated by double quotation marks (“…”) followed by the cited author’s surname, year of publication and page number(s) (e.g., Panati, 1981, pp. 48–53). The author is responsible for referencing sources in the reference list, which means that all citations in the text must have a corresponding entry in the reference list before the file is uploaded. Citations that are not indicated in the reference list will be removed from the text. Footnotes are only to be used for comments, in-depth investigations and further remarks, and not as bibliographical references.
Tables and figures
Any tables and figures included in the paper must be numbered in progressive order, have a title (above the table/figure) and source (under the table/figure), be black and white (or grey if necessary), and be inserted in the Word document in the most appropriate position.Tables, figures and graph files must be uploaded in their original format. Word (.doc or .docx), Excel (.xls) and PowerPoint (.ppt) files are accepted. Image formats that are not accepted include .png, .gif, .jpeg, .bmp and .pdf.References and Internet websites
sinergieitalian journal of management
163
References must be placed at the end of the text. They should be listed in alphabetical order and, for authors with multiple references, ordered chronologically. References must be formatted as follows:
Books
PORTER. M. (1985), The competitive advantage: creating and sustaining superior performance, Free Press, New York.
Articles
BACCARANI C., GOLINELLI G.M. (2015), “The non-existent firm: relations between corporate image and strategy”, Sinergie Italian Journal of Management, vol. 33, n. 97, May-Aug., pp. 313-323.
Book chapters
PHILLIPS R., BARNEY J., FREEMAN R., HARRISON J. (2019), “Stakeholder Theory”, in Harrison J., Barney J., Freeman R., Phillips R. (edited by), The Cambridge Handbook of Stakeholder Theory, Cambridge University Press, Cambridge.
Internet websites
Websites should be mentioned separately below the references.http://www.sijm.it

sinergieitalian journal of management
164
Papers in Italian language
Although it is highly recommended to submit manuscripts in English for broader diffusion, under specific circumstances, it is allowed to publish in Italian. Please contact the Editor in Chief to verify this option.
For papers being submitted in Italian, authors are required to provide:
• A title in Italian and in English of no more than 125 characters each (spaces included)
• An abstract in Italian and in English of no more than 250 words each.
The two abstracts must be structured according to the following layout:
(Italian abstract)- inquadramento della ricerca- obiettivo del paper- metodologia- risultati- limiti della ricerca- implicazioni manageriali - originalità del paper
(English abstract)- framing of the research- purpose of the paper- methodology- results- research limitations- managerial implications- originality of the paper.
• A minimum of three and a maximum of six keywords-in both Italian and English-that identify the framework of the study’s main topic.
SINERGIEAddress: Via Interrato dell’Acqua Morta, 2637129 Verona, ItalyTel. +39 045 597655; Fax +39 045 597550E-mail: [email protected]: www.sijm.it

Subscription
2021 subscription fees
As official journal of Italian Society of management, subscription to Sinergie Italian Journal of Management is offered on favourable terms to SIMA members.
Subscription to the quarterly Sinergie is on an annual basis, starting from January of each year. It includes three issues of the journal.
A supporter subscription entitles the subscriber to receive five copies of each issue and special visibility in the journal. Each subscription is due for renewal by the end of April to guarantee subscribers a regular mailing of the publications.
Late subscribers are entitled to receive back numbers, to be sent at the end of the year. All fees include VAT.
Italy SIMA MEMBER
SIMA NON-MEMBER
Professors and researchers € 120,00 € 180,00
PhD students, fellows and undergraduates students € 60,00 € 90,00
Supporters € 1.000, 00
Libraries € 80, 00
Book shops € 100, 00
The subscription, if completed by april 30 2021, includes free access to Sinergie Sima Management Conference 2021, online from Palermo on 9-10-11 june 2021 To subscribe, complete the subscription form at:www.sijm.it → Journal → Subscribe to Sinergie
To become a SIMA member visit the web site:www.societamanagement.it
sinergieitalian journal of management
165

Subscribers may pay for their subscription via:• Paypal/prepaid credit card• Bank transfer to the following account: FondazioneCueim at BNL,
Banking IBAN IT 67 W 01005 11700 000000004041—BIC/SWIFT CODE BNLIITRR. In addition to personal identification data, please specify the reason for payment (Name Surname + Sub. Sinergie 2021).
For more information, and to request back issues of the Journal, contact:
Administration, subscription and advertisingAnnalisa AndrioloVia Interrato dell’Acqua Morta, 2637129 VeronaTel. (+39) 045 597655; Fax 045 597550Email: [email protected]
Upon receiving the subscription request and payment, the administration office will issue the related note to the subscriber.
For subscriptions by public institutions, submission payments must be made only after the note has been issued. In this case, the number of the note and the name and surname of the subscriber must be indicated in the reason of payment.
sinergieitalian journal of management
166

Responsible EditorMarta Ugolini
“The Direction is not liable for any opinions expressed by the authors of published texts and advertisements. The partial or total use of the articles is permitted so long as the source is cited. The maximum percentage of allowed advertisements is 50%”.
Registered with Law Court of Verona, Italy, reg. no. 570, 1 April 1983
© 2021 FONDAZIONE-CUEIM
Forthcoming issues:
A strategic approach to procurement
Leveraging intersections in management theory and practice
Silver Economy: challenges and opportunities for an aging world
Knowledge and trust in data-rich business environments
Service-mix: new channels and consumption patterns in services
450 copies printed by
GRAFICHE BAIETTA -Via Carcirago, 14, 37022 Fumane (VR) Italy - Tel. 045 770 2088September 2021
€ 66, 00
Quadrimestrale - Poste Italiane s.p.a. - Spedizione in Abbonamento Postale D.L. 353/2003 (conv. in L. 27/02/2004 n. 46) art. 1, comma 1, DCB VERONA
Official Journal of Italian Society of ManagementVol. 39, Issue 2 - May/August 2021 - ISSN 0393-5108
Faust, the burst forth the career and publication ethics Alberto PastoreAlberto Pastore
Country image dimensions and retail brand equity. A multi-cue analysisElisa Martinelli - Francesca De Canio Elisa Martinelli - Francesca De Canio
The impact of sustainability orientation on firm propensity to ally Stefano Romito - Angeloantonio Russo - Clodia VurroStefano Romito - Angeloantonio Russo - Clodia Vurro
Family firms, women, and innovationMariasole Bannò - Graziano Coller - Giorgia M. D'AlluraMariasole Bannò - Graziano Coller - Giorgia M. D'Allura
Decision trees to identify companies’ distress: the AI at workSergio Barile - Irene Buzzi - Ernesto D'Avanzo - Francesca IandoloSergio Barile - Irene Buzzi - Ernesto D'Avanzo - Francesca Iandolo
Online public engagement is the New Deal! Along the distinctive pathway of Italian UniversityLetizia Lo Presti - Giulio Maggiore - Vittoria MarinoLetizia Lo Presti - Giulio Maggiore - Vittoria Marino
Value co-creation in University-Industry collaboration. An exploratory analysis in digital research projectsFrancesco Polese - Maria Vincenza Ciasullo - Raffaella MonteraFrancesco Polese - Maria Vincenza Ciasullo - Raffaella Montera
Exploring connections between vintage marketing and sustainability in the italian agri-food sector. An empirical analysisAnnunziata Tarulli - Domenico Morrone - Pierluigi TomaAnnunziata Tarulli - Domenico Morrone - Pierluigi Toma
Sinergie italian journal of management