Embed Size (px)
Citation preview
ORIGINALRESEARCH
Simultaneous Measurement of Arterial TransitTime, Arterial Blood Volume, and Cerebral BloodFlow Using Arterial Spin-Labeling in Patientswith Alzheimer Disease
T. YoshiuraA. Hiwatashi
K. YamashitaY. Ohyagi
A. MonjiY. Takayama
E. NagaoH. KamanoT. Noguchi
H. Honda
BACKGROUND AND PURPOSE: Cerebral hemodynamics abnormality in Alzheimer disease (AD) is notfully understood. Our aim was to determine whether regional hypoperfusion due to AD is associatedwith abnormalities in regional arterial blood volume (rABV) and regional arterial transit time (rATT) asmeasured by quantitative arterial spin-labeling (ASL) with multiple-delay time sampling.
MATERIALS AND METHODS: Nineteen patients with AD (9 men and 10 women; mean age, 74.5 � 8.6years) and 22 cognitively healthy control subjects (11 men and 11 women; mean age, 72.8 � 6.8 years)were studied by using a quantitative ASL method with multiple-delay time sampling. From the ASLdata, maps of regional cerebral blood flow (rCBF), rABV, and rATT were generated. A region ofhypoperfusion due to AD was determined by statistical parametric mapping (SPM) analysis. MeanrCBF, rABV, and rATT values within the hypoperfused region were compared between the AD andcontrol groups.
RESULTS: Despite the significantly lower rCBF (P � .0004) in patients with AD (27.8 � 7.1 mL/100g/min) in comparison with control subjects (36.7 � 6.3 mL/100 g/min), no significant difference in rATTwas observed between the control (0.48 � 0.09 seconds) and AD (0.47 � 0.10 seconds) groups. MeanrABV was lower in the AD group (0.22 � 0.10%) than in the control group (0.27 � 0.12%), though thedifference did not reach the level of statistical significance.
CONCLUSIONS: Our results revealed that regional hypoperfusion in AD is not associated with rATTprolongation, suggesting that the mechanism of hypoperfusion is distinct from that in cerebrovasculardiseases.
Alzheimer disease (AD) is associated with regional de-creases of cerebral blood flow (CBF). Typical sites of hy-
poperfusion include cortical regions over the posterior cingu-late gyrus and precunei and the temporoparietal associationcortices.1,2 Such hypoperfusion is most commonly evaluatedby using single-photon emission CT (SPECT) and has beenused to discriminate individuals affected by AD from healthyindividuals.3 The pathophysiologic mechanism of the hypo-perfusion is assumed to be either degeneration of local neuraltissue or a “remote effect” from the neurodegeneration in adistant brain region that has a strong functional connectionwith the hypoperfused region4 and is considered to be distinctfrom hemodynamic impairment due to lowered perfusionpressure, which is seen in ischemic cerebrovascular diseases.To date, there has been only a limited number of imagingstudies on cerebral hemodynamics in AD. One of these studiesused positron-emission tomography (PET) and showed thathypoperfusion in AD is not associated with prolongation ofvascular transit time (or mean transit time [MTT]) or depres-sion of vascular reserve (VR).5 These findings not only provideinsight into the pathophysiology of AD but may also be useful
in distinguishing AD from vascular dementia (VD), which isanother major cause of dementia.
Arterial spin-labeling (ASL) is an MR imaging method thatallows noninvasive measurement of regional cerebral perfu-sion.6 It uses arterial blood as an intrinsic tracer and thereforeneeds no radioactive tracer or contrast agent. ASL has beenpreviously used to measure regional CBF (rCBF) in AD.7,8
However, ASL has never been used to measure other hemody-namic parameters in patients with AD because most conven-tional pulsed ASL techniques acquire labeled images only at asingle postlabeling time point. Recently, ASL pulse sequenceswith multiple-delay time sampling became available on clini-cal 3T MR imagers, allowing measurement of other hemody-namic parameters such as arterial blood volume (ABV) andarterial transit time (ATT). ABV represents the volume frac-tion of the arterial lumen in a given voxel, whereas ATT rep-resents the duration of the labeled blood flowing from thelabeling region to the vascular compartment of imaging sec-tions. ATT is different from MTT, which is calculated by di-viding the cerebral blood volume by CBF measured by PET.MTT is a physiologic parameter that represents the averagetime it takes for blood to traverse from the arterial to the ve-nous side of the cerebral vasculature. Unlike MTT, ATT is nota physiologic parameter, but it is known to be correlated withMTT.9 We hypothesized that regional hypoperfusion in AD isnot associated with ATT prolongation, whereas it can be asso-ciated with decreased ABV. To determine whether regionalhypoperfusion due to AD is associated with abnormalities inthese hemodynamic parameters, we used a quantitative ASLtechnique with multiple-delay time sampling.
Received December 10, 2008; accepted after revision January 25, 2009.
From the Departments of Clinical Radiology (T.Y., A.H., K.Y., A.M., Y.T., E.N., H.K., T.N.,H.H.), Neurology (Y.O.), and Neuropsychiatry (A.M.), Graduate School of Medical Sciences,Kyushu University, Fukuoka, Japan.
Please address correspondence to Takashi Yoshiura, MD, PhD, Department of ClinicalRadiology, Graduate School of Medical Sciences, Kyushu University, 3-1-1 Maidashi,Higashi-ku, Fukuoka 812-8582, Japan; e-mail: [email protected]
DOI 10.3174/ajnr.A1562
1388 Yoshiura � AJNR 30 � Aug 2009 � www.ajnr.org
Materials and Methods
SubjectsThis study was approved by the local institutional review board, and
informed consent was obtained from each healthy subject. Acquisi-
tion of consent was waived for the retrospective use of MR images and
clinical data of patients with AD.
MR imaging data of 19 patients with clinically diagnosed AD (9
men and 10 women; age range, 55– 89 years; mean age, 74.5 � 8.6
years) were retrospectively analyzed. All patients received the Japa-
nese version of the Mini-Mental State Examination (MMSE),10 and
their scores ranged from 11 to 24 points (mean, 20.1 � 4.3 points).
Twenty-two healthy individuals (11 men and 11 women; age range,
50 – 81 years; mean age, 72.8 � 6.8 years) were recruited from the
general population as control subjects. Individuals with any history of
hypertension, diabetes mellitus, cardiovascular diseases, stroke, brain
tumor, epilepsy, Parkinson disease, dementia, depression, drug
abuse, or head trauma were excluded. Their MMSE scores ranged
from 27 to 30 (mean, 29.4 � 0.9).
MR ImagingMR images were obtained by using a 3T MR imaging unit (Achieva
Quasar Dual; Philips Medical Systems, Best, the Netherlands) and an
8-channel head array receiving coil for sensitivity encoding (SENSE)
parallel imaging.
ASL was performed by using quantitative signal-intensity target-
ing by alternating radio-frequency pulse labeling of arterial regions
(QUASAR), which is a pulsed ASL method developed by Petersen et
al.11 Details of the sequence and the calculation method for the per-
fusion parameters have been described elsewhere,11 but we will pro-
vide a brief summary here: QUASAR is characterized by multiple-
delay time sampling based on the Look-Locker technique,12 which
enables observation of the postlabeling time course of perfusion-re-
lated signals in each imaging voxel. Our protocol consisted of 42 pairs
of labeled and nonlabeled image acquisitions, of which 24 pairs were
acquired with crusher gradients (velocity encoding � 4 cm/s) and 12
pairs were acquired without crushers. These 36 pairs were acquired at
a flip angle of 35°. The other 6 pairs were acquired at a lower flip angle
(11.7°) without crushers to estimate the actual flip angle, which might
vary across the brain due to the inhomogeneity of B1. The actual
imaging parameters were as follows: labeling slab thickness, 150 mm;
gap between the labeling and imaging slabs, 15 mm; SENSE factor,
2.5; TR, 4000 ms; TE, 22 ms; sampling interval, 300 ms; sampling time
points, 13; FOV, 230 mm; matrix size, 64 � 64; imaging time, 5 min-
utes 52 seconds. Seven 6-mm-thick transverse sections (gap, 2 mm)
covered a 54-mm-thick imaging volume above a plane including an-
terior and posterior commissures.
In addition to ASL, high-resolution 3D T1-weighted images of the
whole brain were obtained by using the magnetization-prepared
rapid acquisition of gradient echo sequence: TR, 8.3 ms; TE, 3.8 ms;
TI, 240 ms; FA, 8°; SENSE factor, 2; number of signal average, 1; FOV,
240 mm; matrix size, 240 � 240; section thickness, 1 mm; imaging
time, 5 minutes 20 seconds. The images were obtained in sagittal
planes and were reconstructed into 1-mm-thick consecutive trans-
verse images.
Image AnalysisMR imaging data were analyzed on a Windows computer (Microsoft,
Redmond, Wash). Maps of rCBF, regional ABV (rABV), and regional
ATT (rATT) were obtained by using dedicated software running on
IDL (Research Systems, Boulder, Colo), which was developed and
provided by Petersen et al (National Neuroscience Institute, Singa-
pore).11 Perfusion-related signals were obtained by subtracting la-
beled data from nonlabeled data. Absolute rCBF was calculated
through deconvolution of the perfusion-related signal intensity in
each voxel by the local arterial input function (AIF). AIF was obtained
by subtracting the crushed data from noncrushed data. The following
constants were used in the CBF calculation: T1 of arterial blood, 1.65
seconds; inversion efficiency, 95%; blood-brain partition coefficients
for gray and white matter, 0.98 and 0.82, respectively. rABV was cal-
culated as the ratio of the area of the local AIF to the area of blood-
filled voxel.11 rATT was measured by detecting the onset of the per-
fusion-related tissue-signal-intensity rise in each voxel by using the
edge-detection algorithm proposed by Canny.13
Areas of hypoperfusion due to AD were determined by statistical
parametric mapping (SPM) analysis on SPM2 software (Wellcome
Trust Center for Neuroimaging, London, UK). The rCBF map of each
subject was coregistered to the corresponding high-resolution T1-
weighted image. First, raw ASL images before subtraction, which were
in exactly the same position as the corresponding rCBF maps and had
more anatomic details than the rCBF maps themselves, were coregis-
tered to the T1-weighted images, and the transformation matrix was
obtained. The same transformation matrix was applied for coregistra-
tion of the rCBF map. The coregistered rCBF maps were then spatially
normalized by using the T1 template provided with the SPM2 soft-
ware (ICBM-152). The spatially normalized rCBF maps were
smoothed by using an isotropic gaussian kernel with 12-mm full
width at half maximum to reduce the noise and residual anatomic
difference among the brains. For the statistical comparison of the
rCBF maps, mask images were created. This was done to limit the
spatial extent of the voxelwise comparison with the voxels within the
brain parenchyma, excluding the voxels within ventricles and cerebral
fissures.
The mask images were generated in the following steps: First, a
map of the longitudinal relaxivity (R1) of each subject was generated
from the ASL data. The R1 maps of all subjects were coregistered to
the corresponding high-resolution T1-weighted image and then spa-
tially normalized following the same steps as those used for the rCBF
maps. In the normalized R1 map of each subject, brain region was
segmented by thresholding the map at an arbitrary R1 value (0.35/s).
Finally, binary mask images were generated by selecting voxels that
were included in the brain region in all subjects.
A 2-sample t test was used to compare the rCBF between the AD
and control groups at a voxel-level significance threshold of P � .001
uncorrected for multiple comparisons. Only clusters of 50 voxels or
larger were taken into account. The area of hypoperfusion due to AD
defined by the SPM analysis was used as a 3D region of interest for the
subsequent analyses. The maps of rABV and rATT were coregistered
to the corresponding high-resolution T1-weighted image and then
spatially normalized. The 3D region of interest for the hypoperfused
area defined by the SPM analysis was applied to the normalized rABV
and rATT maps, and mean values of rCBF, rABV, and rATT within
the hypoperfused area were thus measured for each subject. Measured
perfusion indices (rCBF, rABV, and rATT) were statistically com-
pared between the AD and control groups by using a t test. P values �
.05 after Bonferroni correction for multiple comparisons (3 compar-
isons) were considered to be significant.
BRA
INORIGIN
ALRESEARCH
AJNR Am J Neuroradiol 30:1388 –93 � Aug 2009 � www.ajnr.org 1389

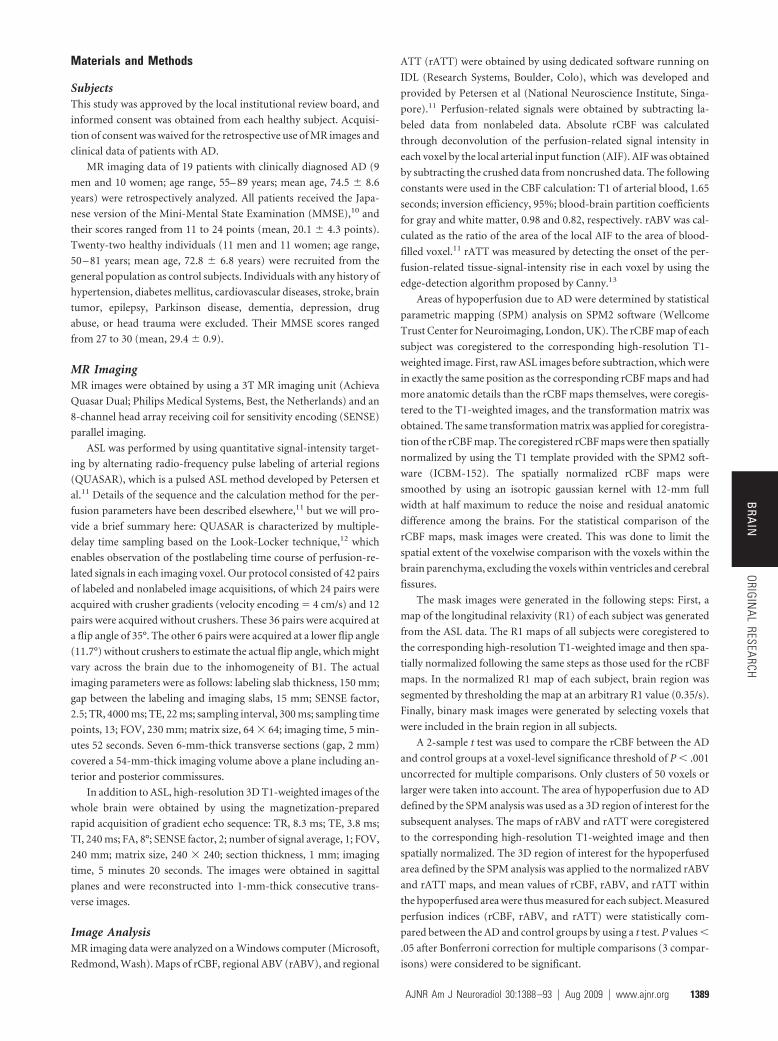
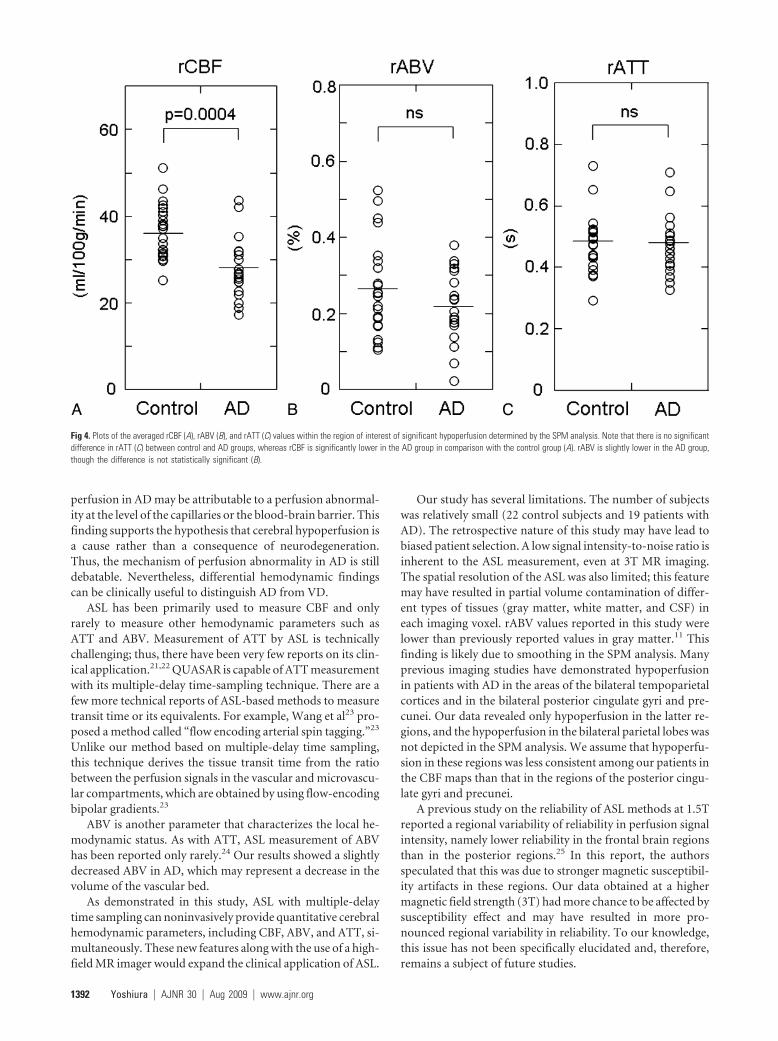
ResultsFigures 1 and 2 show maps of rCBF, rABV, and rATT of ahealthy subject and a patient with AD, respectively. SPM anal-ysis revealed a significant CBF decrease in areas of the bilateralprecunei and the left posterior cingulate gyrus (Fig 3). Fig-ure 4 summarizes the results of the intergroup comparison ofthe mean values of the 3 hemodynamic parameters (rCBF,rABV, and rATT) within the region of interest. The compari-son of rCBF values revealed that the mean rCBF was signifi-cantly lower in the AD group (mean, 27.8 � 7.1 mL/100g/min) than the control group (36.7 � 6.3 mL/100 g/min)(P � .0004) (Fig 4A). The comparison of rABV showed thatthe mean rABV was also lower in the AD group (0.22 �0.10%) than the control group (0.27 � 0.12%), though thedifference did not reach the level of statistical significance (P �.05) (Fig 4B). The comparison of rATT showed no differencebetween the 2 groups (0.47 � 0.10 seconds for the AD groupand 0.48 � 0.09 seconds for the control group) (P � .05) (Fig4C).
DiscussionOur results revealed no significant rATT prolongation in thehypoperfused area in patients with AD, despite a relatively
profound CBF deficit (lower than that of the control groupby 24.2% on average). rABV was lower in patients with AD,though the difference was not statistically significant. Thesefindings are distinct from those seen in cerebrovascular dis-ease, where lowered perfusion pressure results in the dilationof small resistance vessels and the prolongation of MTT inlocal tissue.14 The findings seem consistent with the hypothe-sized mechanism of the degeneration of local neural tissueand/or the secondary transneuronal effect from such degener-ation in remote brain regions. Hemodynamic abnormalitiesof AD have been explored by several researchers. For example,Nagata et al5 measured MTT and VR to carbon dioxide inha-lation in patients with AD and VD and found that MTT wasprolonged and VR was depressed in patients with VD, whereasthe 2 indices were preserved in patients with AD.5
Impairment in the responsiveness to vascular activationin VD was reported by De Reuck et al,15 whereas other groupsfound no such impairment in AD based on SPECT16-18
and xenon-enhanced CT19 analysis. Moreover, Puls et al20 re-vealed, by using transcranial sonography, that tissue transittime is prolonged in VD but not in degenerative dementia.Most interesting, Nagata et al5 also found a mildly increasedoxygen extraction fraction in AD and speculated that hypo-
Fig 1. Maps of the rCBF, rABV, and rATT of a 70-year-old healthy woman. Note the relative prolongation of ATT in the anterior and posterior border zones (arrows), which is a normalfinding.
1390 Yoshiura � AJNR 30 � Aug 2009 � www.ajnr.org
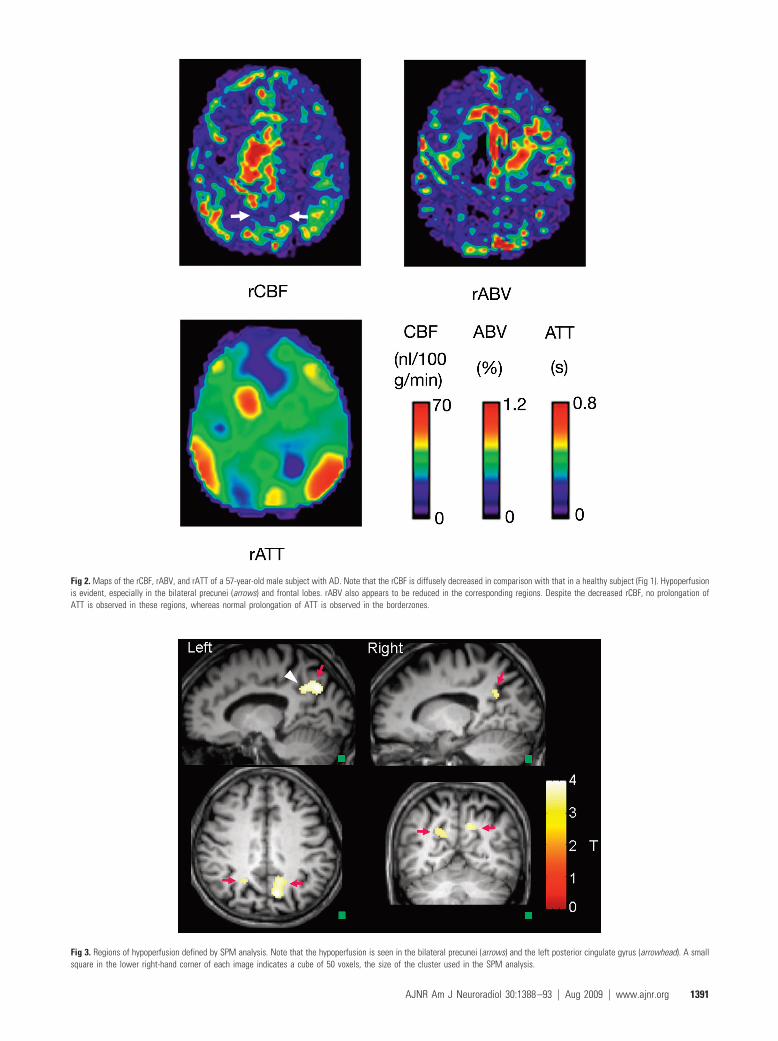
Fig 3. Regions of hypoperfusion defined by SPM analysis. Note that the hypoperfusion is seen in the bilateral precunei (arrows) and the left posterior cingulate gyrus (arrowhead). A smallsquare in the lower right-hand corner of each image indicates a cube of 50 voxels, the size of the cluster used in the SPM analysis.
Fig 2. Maps of the rCBF, rABV, and rATT of a 57-year-old male subject with AD. Note that the rCBF is diffusely decreased in comparison with that in a healthy subject (Fig 1). Hypoperfusionis evident, especially in the bilateral precunei (arrows) and frontal lobes. rABV also appears to be reduced in the corresponding regions. Despite the decreased rCBF, no prolongation ofATT is observed in these regions, whereas normal prolongation of ATT is observed in the borderzones.
AJNR Am J Neuroradiol 30:1388 –93 � Aug 2009 � www.ajnr.org 1391
perfusion in AD may be attributable to a perfusion abnormal-ity at the level of the capillaries or the blood-brain barrier. Thisfinding supports the hypothesis that cerebral hypoperfusion isa cause rather than a consequence of neurodegeneration.Thus, the mechanism of perfusion abnormality in AD is stilldebatable. Nevertheless, differential hemodynamic findingscan be clinically useful to distinguish AD from VD.
ASL has been primarily used to measure CBF and onlyrarely to measure other hemodynamic parameters such asATT and ABV. Measurement of ATT by ASL is technicallychallenging; thus, there have been very few reports on its clin-ical application.21,22 QUASAR is capable of ATT measurementwith its multiple-delay time-sampling technique. There are afew more technical reports of ASL-based methods to measuretransit time or its equivalents. For example, Wang et al23 pro-posed a method called “flow encoding arterial spin tagging.”23
Unlike our method based on multiple-delay time sampling,this technique derives the tissue transit time from the ratiobetween the perfusion signals in the vascular and microvascu-lar compartments, which are obtained by using flow-encodingbipolar gradients.23
ABV is another parameter that characterizes the local he-modynamic status. As with ATT, ASL measurement of ABVhas been reported only rarely.24 Our results showed a slightlydecreased ABV in AD, which may represent a decrease in thevolume of the vascular bed.
As demonstrated in this study, ASL with multiple-delaytime sampling can noninvasively provide quantitative cerebralhemodynamic parameters, including CBF, ABV, and ATT, si-multaneously. These new features along with the use of a high-field MR imager would expand the clinical application of ASL.
Our study has several limitations. The number of subjectswas relatively small (22 control subjects and 19 patients withAD). The retrospective nature of this study may have lead tobiased patient selection. A low signal intensity-to-noise ratio isinherent to the ASL measurement, even at 3T MR imaging.The spatial resolution of the ASL was also limited; this featuremay have resulted in partial volume contamination of differ-ent types of tissues (gray matter, white matter, and CSF) ineach imaging voxel. rABV values reported in this study werelower than previously reported values in gray matter.11 Thisfinding is likely due to smoothing in the SPM analysis. Manyprevious imaging studies have demonstrated hypoperfusionin patients with AD in the areas of the bilateral tempoparietalcortices and in the bilateral posterior cingulate gyri and pre-cunei. Our data revealed only hypoperfusion in the latter re-gions, and the hypoperfusion in the bilateral parietal lobes wasnot depicted in the SPM analysis. We assume that hypoperfu-sion in these regions was less consistent among our patients inthe CBF maps than that in the regions of the posterior cingu-late gyri and precunei.
A previous study on the reliability of ASL methods at 1.5Treported a regional variability of reliability in perfusion signalintensity, namely lower reliability in the frontal brain regionsthan in the posterior regions.25 In this report, the authorsspeculated that this was due to stronger magnetic susceptibil-ity artifacts in these regions. Our data obtained at a highermagnetic field strength (3T) had more chance to be affected bysusceptibility effect and may have resulted in more pro-nounced regional variability in reliability. To our knowledge,this issue has not been specifically elucidated and, therefore,remains a subject of future studies.
Fig 4. Plots of the averaged rCBF (A), rABV (B), and rATT (C) values within the region of interest of significant hypoperfusion determined by the SPM analysis. Note that there is no significantdifference in rATT (C) between control and AD groups, whereas rCBF is significantly lower in the AD group in comparison with the control group (A). rABV is slightly lower in the AD group,though the difference is not statistically significant (B).
1392 Yoshiura � AJNR 30 � Aug 2009 � www.ajnr.org

ConclusionsWe measured rABV and rATT in the hypoperfused area inpatients with AD by using a quantitative ASL method. Noprolongation of rATT was observed, whereas rABV wasslightly decreased. The lack of rATT prolongation suggeststhat the mechanism of hypoperfusion is distinct from that incerebrovascular diseases.
References1. Johnson KA, Mueller ST, Walshe TM, et al. Cerebral perfusion imaging in
Alzheimer’s disease: use of single photon emission computed tomographyand iofetamine hydrochloride I 123. Arch Neurol 1987;44:165– 68
2. Ishii K, Sasaki M, Yamaji S, et al. Demonstration of decreased posterior cingu-late perfusion in mild Alzheimer’s disease by means of H215O positron emis-sion tomography. Eur J Nucl Med 1997;24:670 –73
3. Matsuda H. Role of neuroimaging in Alzheimer’s disease, with emphasis onbrain perfusion SPECT. J Nucl Med 2007;48:1289 –300
4. Hirao K, Ohnishi T, Matsuda H, et al. Functional interactions between ento-rhinal cortex and posterior cingulate cortex at the very early stage of Alzhei-mer’s disease using brain perfusion single-photon emission computed to-mography. Nucl Med Commun 2006;27:151– 66
5. Nagata K, Sato M, Satoh Y, et al. Hemodynamic aspects of Alzheimer’s disease.Ann NY Acad Sci 2002;977:391– 402
6. Detre JA, Leigh JS, Williams DS, et al. Perfusion imaging. Magn Reson Med1992;23:37– 45
7. Alsop DC, Detre JA, Grossman M. Assessment of cerebral blood flow in Alz-heimer’s disease by spin-labeled magnetic resonance imaging. Ann Neurol2000;47:93–100
8. Johnson NA, Jahng G-H, Welner MW, et al. Pattern of cerebral hypoperfusionin Alzheimer disease and mild cognitive impairment measured with arterialspin-labeling MR imaging: initial experience. Radiology 2005;234:851–59
9. Kane I, Carpenter T, Chappell F, et al. Comparison of 10 different magneticresonance perfusion imaging processing methods in acute ischemic stroke:effect of lesion size, proportion of patients with diffusion/perfusion mis-match, clinical scores, and radiologic outcomes. Stroke 2007;38:3158 – 64
10. Folstein MF, Folstein SE, McHugh PR. “Mini-Mental State”: a practicalmethod for grading the cognitive state of patients for the clinician. J PsychiatrRes 1975;12:189 –98
11. Petersen ET, Lim T, Golay X. Model-free arterial spin labeling quantificationapproach for perfusion MRI. Magn Reson Med 2006;55:219 –32
12. Look DC, Locker DR. Time saving in measurement of NMR and EPR relax-ation times. Rev Sci Instrum 1970;41:250 –51
13. Canny J. A computational approach to edge-detection. IEEE Trans PatternAnal Machine Intell 1986;8:679 –98
14. Powers WJ, Grubb RL, Raichle ME. Physiological responses to focal cerebralischemia in humans. Ann Neurol 1984;16:546 –52
15. De Reuck J, Decoo D, Hasenbroekx MC, et al. Acetazolamide vasoreactivity invascular dementia: a positron emission tomographic study. Eur Neurol1999;41:31–36
16. Bonte FJ, Devous MD Sr, Reisch JS, et al. The effect of acetazolamide on re-gional cerebral blood flow in patients with Alzheimer’s disease or stroke asmeasured by single-photon emission computed tomography. Invest Radiol1989;24:99 –103
17. Knap WH, Dannenberg C, Marschall B, et al. Changes in local cerebral bloodflow by neuroactivation and vasoactivation in patients with impaired cogni-tive function. Eur J Nucl Med 1996;23:878 – 88
18. Pavics L, Grunwald F, Reichmann K, et al. Regional cerebral blood flow single-photon emission tomography with 99mTc-HMPAO and the acetazolamidetest in the evaluation of vascular and Alzheimer’s dementia. Eur J Nucl Med1999;26:239 – 45
19. Meyer JS, Shirai T, Akiyama H. Neuroimaging for differentiating vascularfrom Alzheimer’s dementias. Cerebrovasc Brain Metab Rev 1996;8:1–10
20. Puls I, Hauck K, Demuth K, et al. Diagnostic impact of cerebral transit time inthe identification of microangiopathy in dementia: a transcranial ultrasoundstudy. Stroke 1999;30:2291–95
21. Hendrikse J, Petersen ET, van Laar PJ, et al. Cerebral border zones betweendistal end branches of intracranial arteries: MR imaging. Radiology 2008;246:572– 80. Epub 2007 Nov 30
22. Bokkers RP, van Laar PJ, van de Ven KC, et al. Arterial spin labeling MR imag-ing measurements of timing parameters in patients with a carotid artery oc-clusion. AJNR Am J Neuroradiol 2008;29:1698 –703
23. Wang J, Alsop DC, Song HK, et al. Arterial transit time imaging with flowencoding arterial spin tagging (FEAST). Magn Reson Med 2003;50:599 – 607
24. Brookes MJ, Morris PG, Gowland PA, et al. Noninvasive measurement of ar-terial cerebral blood volume using Look-Locker EPI and arterial spin labeling.Magn Reson Med 2007;58:41–54
25. Jahng G-H, Song E, Zhu X-P, et al. Human brain: reliability and reproducibil-ity of pulsed arterial spin-labeling perfusion MR imaging. Radiology 2005;234:909 –16
AJNR Am J Neuroradiol 30:1388 –93 � Aug 2009 � www.ajnr.org 1393