Embed Size (px)
Citation preview
Role of Renal Sympathetic Nerves in Mediating Hypoperfusion of Renal CorticalMicrocirculation in ExperimentalCongestive Heart Failure and Acute Extracellular Fluid Volume Depletion
Valentina Kon, Aida Yared, and lekuni IchikawaWith the technical assistance of M. Laurette HughesLaboratory of Renal Physiology, Department of Medicine, The Children's Hospital, and Department of Pediatrics,Harvard Medical School, Boston, Massachusetts 02115
Abstract
To evaluate the pathophysiologic importance of renal nerves inregulating the renal vasomotor tone, we measured several pa-rameters of renal cortical microcirculation before and after acuterenal denervation (DNx) in the following three groups of anes-thetized Munich-Wistar rats: (group 1) congestive heart failureafter surgically induced myocardial infarction (n = 10), (group2) acute extracellular fluid volume depletion after deprivation ofdrinking water for 48 h (n = 8), and (group 3) sham or nontreatedcontrols (n = 6). In the myocardial-infarcted rats, DNx led to auniform increase in glomerular plasma flow rate of, on average,36%. Single nephron glomerular filtration rate of myocardial-infarcted rats also increased despite a reduction in glomerularcapillary hydraulic pressure. These changes were associated witha fall in arteriolar resistances, particularly in the efferent arte-riole. The glomerular capillary ultrafiltration coefficient rose inall but one myocardial-infarcted animal. A similar hemodynamicpattern was seen after DNx in water-deprived animals. In everywater-deprived animal, glomerular plasma flow rate and singlenephron GFRincreased on average by 28 and 14%, respectively.Again, afferent and efferent arteriolar resistances decreased sig-nificantly. Furthermore, the ultrafiltration coefficient increaseduniformly and substantially with DNx.
To ascertain the potential importance of the interaction be-tween the renal nerves and angiotensin II in these circumstances,we compared the renal cortical hemodynamics in additionalgroups of water-deprived rats (group 4) after DNx (n = 15),(group 5) during inhibition of angiotensin II with saralasin(n = 15), and (group 6) during treatment with both saralasin andDNx (n = 15). No appreciable difference was detected betweengroup 4 vs. 6. In contrast, substantial differences were notedbetween group 5 vs. 6: on average, the glomerular plasma flowrate was 26% higher and the afferent and efferent arteriolar re-sistances 25% and 27% lower, respectively, in group 6.
Portions of these studies were presented at the annual meeting of theAmerican Society of Nephrology, Washington, DC, 1984, and at theAnnual Meeting of the Federations of American Societies for Experi-mental Biology, Washington, DC, 1985, and were published in abstractform (1984. Am. Soc. Nephrol. 17:134; and 1985. Clin. Res. 33:489A).
Address correspondence to Dr. Kon, Laboratory of Renal Physiology.Receivedfor publication 8 January 1985 and in revisedform 12 July
1985.
These observations provide direct evidence to indicatepathophysiologic importance of renal nerves in the profound in-trarenal circulatory adjustments in prerenal circulatory impair-ment. The vasoconstrictive effects of renal nerves appear to bemediated in part by their stimulatory influence on angiotensinII release and their direct constrictor actions on pre- and post-glomerular vessels as well.
Introduction
It is well known that at normal base-line conditions, activationof renal nerves causes antidiuresis and antinatriuresis (1-4).Conversely, removal of the renal nerve influence by acute de-nervation of the kidney is associated with increased urine flowand sodium excretion (5, 6). These phenomena have been at-tributed by many investigators to reflect a direct influence ofrenal nerves on the tubule reabsorption processes. Micropuncturemeasurements in normal animals have shown that acute renaldenervation led to a decrease in the fractional reabsorption ofsodium and water by the proximal tubule (5-8). That renalnerves directly influence tubule transport is further supportedby several whole kidney clearance studies in which acute de-nervation-induced diuresis and natriuresis in normal animalswere not accompanied by changes in renal hemodynamics orthe rate of glomerular filtration (5, 6). These observations havebeen taken to indicate that, in contrast to their significant influ-ence on tubule transport, renal nerves contribute little to thevasomotor tone of normal animals under baseline physiologicconditions.
These conclusions, however, do not preclude the possibilitythat when the efferent neural tone is heightened above baselinelevel, it may profoundly influence renal circulatory dynamics.In fact, direct activation of renal nerves above baseline levelinduces an increase in renal vascular resistances proportionalto the degree of nerve stimulation (4, 9-12). Recent studies lo-calized the effects of renal nerve stimulation to the pre- andpostglomerular arterioles, where they cause constriction, as wellas reduction in glomerular capillary ultrafiltration coefficient(4, 13, 14). These neural influences on renal hemodynamics arereminiscent of actions of many other vasoactive substances. Forexample, suppression of endogenous angiotensin II actions innormal animals by administration of specific angiotensin II in-hibitors has repeatedly been shown to elicit minimal changes inrenal hemodynamics and glomerular filtration rate (15, 16). Atthe same time, it is now well recognized that exogenous admin-istration of angiotensin II is capable of causing profound vaso-constriction (17, 18). Moreover, in circumstances in which renin-
Role of Renal Nerves in Renal Circulation 1913
J. Clin. Invest.© The American Society for Clinical Investigation, Inc.0021-9738/85/11/1913/08 $1.00Volume 76, November 1985, 1913-1920
angiotensin levels are elevated, such as chronic extracellular fluid(ECF)' volume depletion induced by restriction of salt intake,administration of an angiotensin II inhibitor markedly altersrenal hemodynamics and glomerular filtration (19). Therefore,it appeared warranted to examine whether the profound effectsof renal nerves on renal vasculature demonstrated by experi-mental electrical stimulation do, in fact, participate in patho-physiologic settings. Two conditions, congestive heart failureand acute ECFvolume depletion, are characterized by markedrenal vasoconstriction, including high afferent and efferent ar-teriolar resistances and depressed glomerular capillary ultrafil-tration coefficient (15, 20). The sympathetic tone is believed tobe markedly enhanced in both of these conditions (21-24). Todetermine the causal role of renal nerves under these circum-stances, we removed the direct adrenergic influence of nervesby renal denervation and evaluated the renal microcirculatoryindices before and after denervation. The possible intermediaryrole of angiotensin II was also explored by using an angiotensinII antagonist.
Methods
Treatment before micropuncture experiments. Studies were performedin adult male Munich-Wistar rats weighing 183-369 g. Group 1 (n= 10) consisted of animals with congestive heart failure secondary tomyocardial infarction (MI). Infarcts were surgically produced using thetechnique previously described (25). Briefly, under ether anesthesia, aleft thoracotomy was performed and the heart exteriorized. The left cor-onary artery was ligated between the pulmonary outflow tract and theleft auricle. In some animals, distal blanches of the left and/or rightcoronary arteries were also cauterized. The heart was then returned intothe chest and the thorax closed. The rats were allowed free access to tapwater and standard rat chow. Micropuncture experiments were performed-4 wk after surgery. Only rats having left ventricular end-diastolic pres-
sure (LVEDP) > 15 mmHgduring the micropuncture experiments wereincluded in group 1. Group 2 (n = 8) were normal rats deprived of waterfor 48 h before the experiment (acute water deprivation [AWDD). Group3 (n = 6) included four sham-operated animals that underwent a tho-racotomy and exteriorization of the heart and two nonoperated animals.Group 3 animals were maintained on standard rat chow and water adlibitum until the day of experiment. In addition to these three groups ofanimals, which underwent two-period studies described below, three moregroups of water-deprived rats (groups 4-6) were prepared for a one-period micropuncture study in a fashion identical to that in group 2.
Treatment during micropuncture experiments. On the day of exper-iment, all animals were anesthetized with Inactin (Byk, Federal Republicof Germany; 100 mg/kg, i.p.) and placed on a temperature-regulatedmicropuncture table. Each animal underwent a tracheostomy. In-dwellingpolyethylene catheters were inserted into the right and left jugular veinsfor infusion of inulin and isoncotic rat plasma. A 0.2-ml bolus of 10%inulin in NaCl was given, followed by a continuous infusion at the rate
1. Abbreviations used in this paper: AP, femoral arterial pressure; AWD,acute water deprivation; CA, protein concentration in systemic plasma;CE, protein concentration in efferent arteriolar plasma; ECF, extracellularfluid; Hct, blood hematocrit in femoral artery; Kf, glomerular capillaryultrafiltration coefficient; LVEDP, left ventricular end-diastolic pressure;PE, hydraulic pressure in surface efferent arteriole; Pac, hydraulic pressurein single glomerular capillary; MI, myocardial infarction; PT, hydraulicpressure in proximal tubule; AP, glomerular transcapillary hydraulicpressure difference (= Poc - PT); QA, glomerular plasma flow rate; RAand RE, resistance to blood flow in afferent and efferent arteriole, re-spectively; SNFF, single nephron filtration fraction; SNGFR, singlenephron glomerular filtration rate; (TF/P)N, proximal tubule fluid-to-plasma inulin concentration ratio; UN&V, urinary sodium excretion rate;V, urine flow rate; V~TF, tubule fluid flow rate; -, (over-bar) mean value.
of 1.2 ml/h. Plasma equal to 1% body weight in groups I and 3, and0.5-0.7% body weight in groups 2, 4, 5, and 6 were infused, followed byinfusion of 1.2 ml/h throughout the remainder of the experiment toreplace the plasma volume lost during surgical preparation (20, 26). Theleft femoral artery was catheterized for periodic sampling of blood andrecording of mean systemic arterial blood pressure (AP). AP was mon-itored with an electronic transducer (model P-23Db [Statham InstrumentsDiv., Gould Inc., Oxnard, CA]) connected to a direct writing recorder(model 2200 [Gould Inc.]). An in-dwelling left ventricular catheter wasinserted through the right carotid artery and connected to a Millar mi-cromanometer (PC-350, Millar Industries, Houston, TX), which waslinked to the writing recorder.
The left kidney was exposed by ventral midline and subcostal incisionsand suspended on a Lucite holder. Its surface was illuminated with afiberoptic light source and bathed with 0.9% NaCl. All micropuncturemeasurements and collections were obtained from the left kidney. Ineach one of the animals from groups 1-3, base-line micropuncture mea-surements and specimen collections specified below were begun 90-120min after induction of anesthesia. The base-line period was completedwithin 30 min. Renal denervation was then carried out as previouslydescribed (5, 7). The nerve bundles running parallel with the renal arterywere severed. In addition, the renal artery was carefully stripped of itsadventitia and swabbed with a 10% phenol solution, care being taken toprotect the kidney and surrounding tissues. To ascertain the completenessof this denervation technique, we electrically stimulated the splanchnicnerve by placing it on a bipolar electrode connected to a Grass stimulator(model S44 [Grass Instrument Co., Quincy, MA]), set to deliver a square-wave signal for 0.5 msat 5 V and 5-10 Hz. It has previously been shownby us and others that nerve stimulation at this frequency range causedprofound renal vasoconstriction, which is evidenced by blanching of thekidney surface if the renal nerve is intact (4, 13, 14). In the rats undergoingdenervation, micropuncture measurements were begun after a 45-60-min equilibration period and completed within -30 min.
In the AWDanimals of groups 4-6, micropuncture measurementsand collections were performed only once (one-period study). In designingthe study for groups 4-6, it was felt necessary to perform experimentsin a relatively large number of animals (- 15 in each group), since awide animal-to-animal variability within each group might otherwisehinder meaningful statistical group-to-group comparison. Group 4 definesAWDanimals that underwent denervation, and includes the secondperiod of group 2. Micropuncture measurements were performed 90-120 min after denervation. In group 5 (n = 15) AWDanimals, micro-puncture was performed during infusion of saralasin (0.3 mg/kg/h, i.v.),an angiotensin II antagonist.2 Saralasin was begun 40-120 min beforemeasurements of cortical hemodynamics and continued throughout theexperiment. Group 6 (n = 15) AWDanimals underwent both saralasintreatment and renal denervation. Group 6 experiments include animalsthat were first denervated, then infused with saralasin (the same rats asgroup 4, n = 6), or treated vice versa (the same rats as group 5, n = 6),or which underwent both treatments simultaneously (separate rats,n = 3).
Micropuncture measurements. Micropuncture measurements andcollections were carried out as follows. Timed (I1-2 min) samples of fluidwere collected from surface proximal tubules from each of two or threenephrons for determination of flow rate, inulin concentration, and cal-culation of tubule fluid-to-plasma inulin concentration ratio ([TF/P]h),hence single nephron glomerular filtration rate (SNGFR). The rate offluid collection was adjusted to maintain a column of polymer oil, threeto four tubule diameters in length, in a constant position just distal tothe site of puncture. Coincident with tubule fluid collection, femoralarterial blood samples were obtained for determination of hematocritand plasma inulin concentration. Urine was collected from the right and
2. This dose of saralasin has previously been used by several investigators(I18, 20, 27) and has been shown to inhibit the microcirculatory changesinduced by endogenous and exogenous angiotensin II. There exists thetheoretical possibility, however, that in these experiments, angiotensinII may only be partially inhibited by saralasin.
1914 V. Kon, A. Yared, and I. Ichikawa
left kidneys for determination of flow rate (V), renal sodium excretionrate (UN8V), and inulin for the glomerular filtration rate (GFR). For theurine collections, in-dwelling ureteral polyethylene catheters (PE-IO) wereused.
Hydraulic pressures were monitored in accessible surface structureswith a continuous-recording servo-null micropipette transducer system(model 3 [Instrumentation for Physiology and Medicine, San Diego,CA]). Micropipettes with outer tip diameters of 1-2 Aim containing2.0 MNaCI were used. Hydraulic output from the servo-null systemwas coupled electronically to the recorder by means of a pressure trans-ducer. Direct measurements of time-averaged hydraulic pressures wererecorded in single capillaries of surface glomeruli (PGc), proximal tubules(PT), and efferent arterioles (PE). Protein concentrations of plasma entering(CA) and leaving (CE) glomerular capillaries were determined by analyzingfemoral arterial and surface efferent arteriolar plasma, respectively (28).Protein content was analyzed by the fluorometric technique of Viets etal. (29). The oncotic pressure was calculated from the protein concen-trations determined by the relationship previously described (30).
The volume of fluid collected from individual tubules was estimatedfrom the length of the fluid column in a constant-bore capillary tube ofknown internal diameter. The concentration of inulin in tubule fluidwas measured in duplicate by the microfluorescence method of Vurekand Pegram (31). Inulin concentrations in plasma were determined bythe macroanthrone method of Fifhr et al. (32). The sodium concentrationin the urine was determined by flame photometry.
Calculations. SNGFRwas calculated by SNGFR= (TF/Ph& X VTF,where (TF/PhN and VTF refer to tubule fluid-to-plasma inulin concen-tration ratio and tubule fluid flow rate, respectively. Glomerular capillary
ultrafiltration coefficient (Kf) and resistances of single afferent (RA) andefferent (RE) arterioles were calculated using equations described in detailelsewhere (30).
Paired t test was used for period to period comparison within thesame group. Analysis of variance was used to compare groups 4, 5, and6. Statistical significance is defined as P < 0.05. Significance for analysisof variance are given at levels of P < 0.05 and P < 0.01.
Results
Group I (MI rats). LVEDPof MI animals ranged from 15 to30 mmHg, with a mean value of 21 mmHg. Other pertinentparameters of systemic and renal functions during the controlperiod and after renal denervation are shown in Table I. Whencompared to the identically prepared MI rats in our previousexperiments (15), the degree of impairment of cardiac perfor-mance in the current rats appears to be somewhat less, i.e., highermean systemic arterial pressure (101 vs. 96 mmHg)and lowervalues for LVEDP (21 vs. 24 mmHg). Nevertheless, the renalmicrocirculatory pattern found in the present series of MI ratswas qualitatively similar to that reported earlier (15). Thus,compared to normal control rats, MI rats were again character-ized by high afferent and efferent arteriolar resistances and re-duced ultrafiltration coefficient.
Comparing various measurements before and after dener-
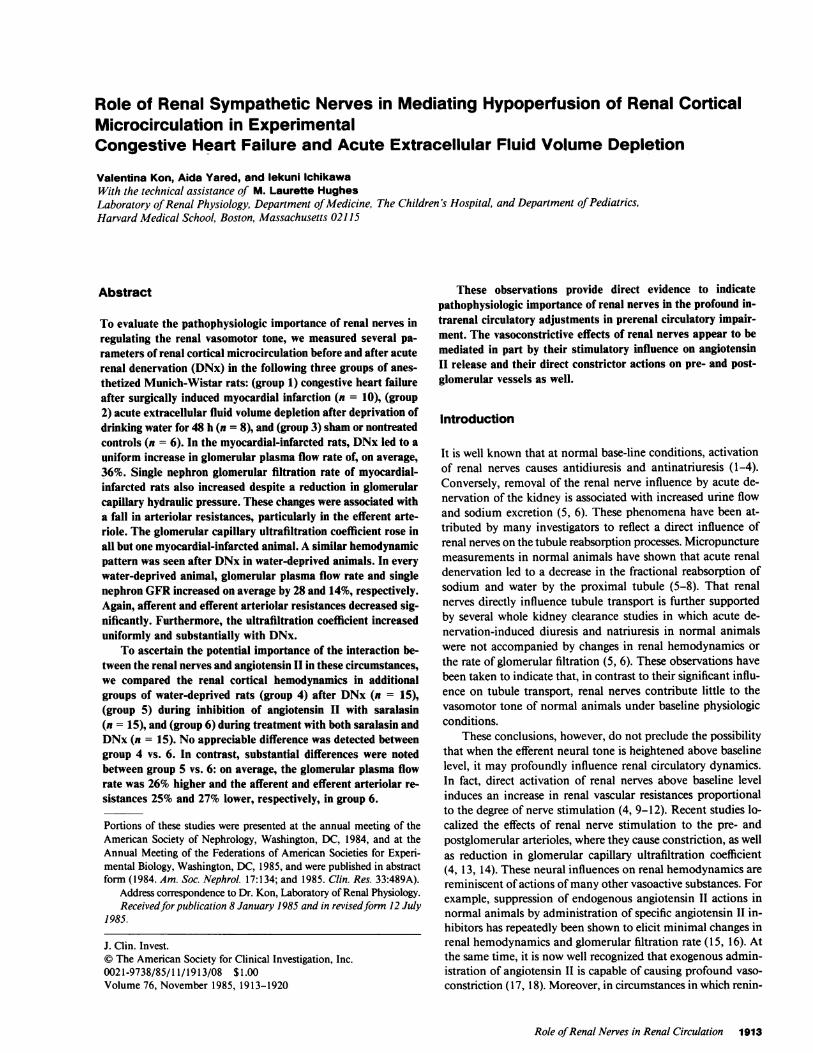
Table I. Summary of Whole Body and Bilateral Kidney Function
V USv GFR
Body wt AP Hct R L R L R L
g mmHg vol % mIl/min mIl/min eq/min ueq/min ml/min ml/min
MI(n= 10rats)Baseline 280 101 47 0.0064 0.0074 0.32 0.35 0.77 0.68
±14 4 1 0.0010 0.0011 0.05 0.07 0.09 0.07
Denervation 103 47 0.0098 0.0194 0.65 1.32 0.76 0.88(left kidney) 4 1 0.0021 0.0034 0.13 0.34 0.07 0.09
P value* NS NS NS <0.05 NS <0.01 NS <0.05P value4 NS NS NS NS NS NS NS NS
AWD(n = 8 rats)Baseline 247 106 56 0.0036 0.0040 0.14 0.14 0.65 0.62
± 11 3 1 0.0005 0.0005 0.04 0.05 0.07 0.11
Denervation 103 55 0.0042 0.0052 0.23 0.27 0.62 0.68(left kidney) 3 1 0.0006 0.0004 0.09 0.06 0.12 0.11
P value* NS <0.025 NS <0.05 NS <0.05 NS <0.05P value§ NS NS NS <0.05 NS NS NS NS
CONT(n = 6 rats)Baseline 290 115 48 0.0086 0.0086 0.44 0.50 0.86 0.91
±18 4 1 0.0009 0.0007 0.05 0.12 0.30 0.16
Denervation 115 48 0.0108 0.0125 0.53 0.80 0.97 0.87(left kidney) 4 1 0.0024 0.0015 0.13 0.05 0.07 0.12
P value* NS NS NS <0.05 NS <0.025 NS NS
Values are expressed as mean±SE. CONT, control. R, right kidney. L, left kidney. NSdenotes P > 0.05. * tests were performed between thebaseline and denervation in the same group. Statistical comparison was also performed for denervation-induced changes between MI vs. CONT(f) and AWDvs. CONT(§).
Role of Renal Nerves in Renal Circulation 1915
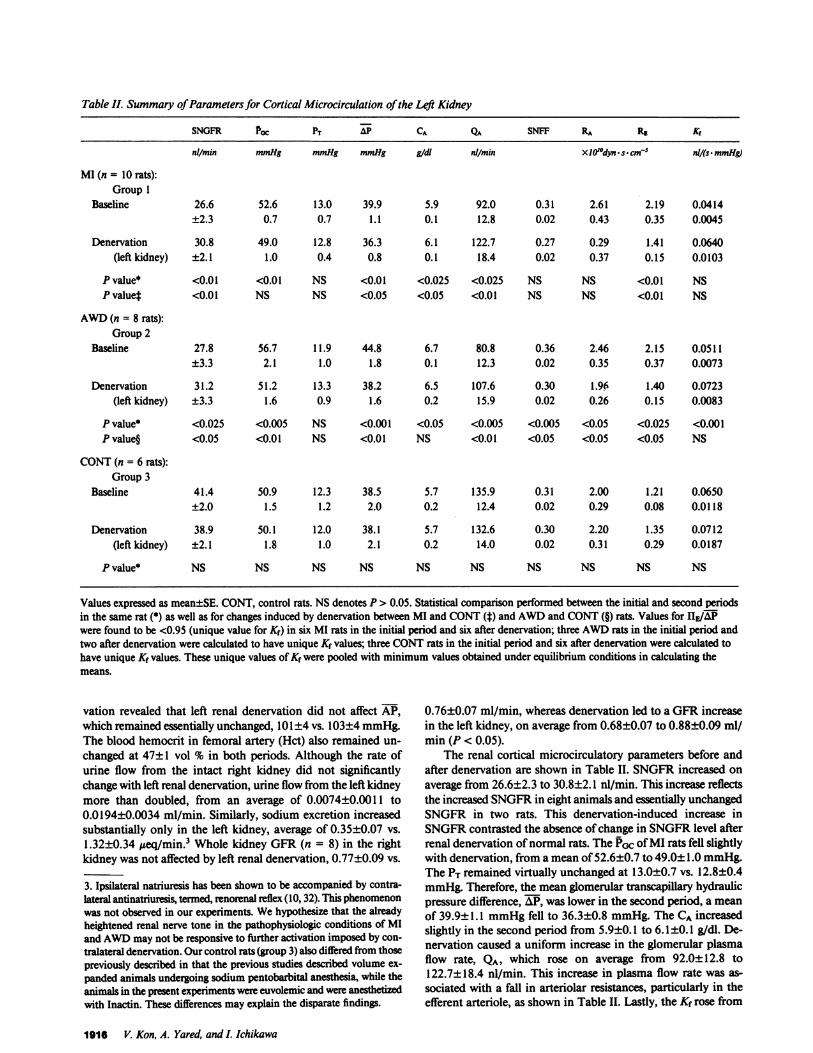
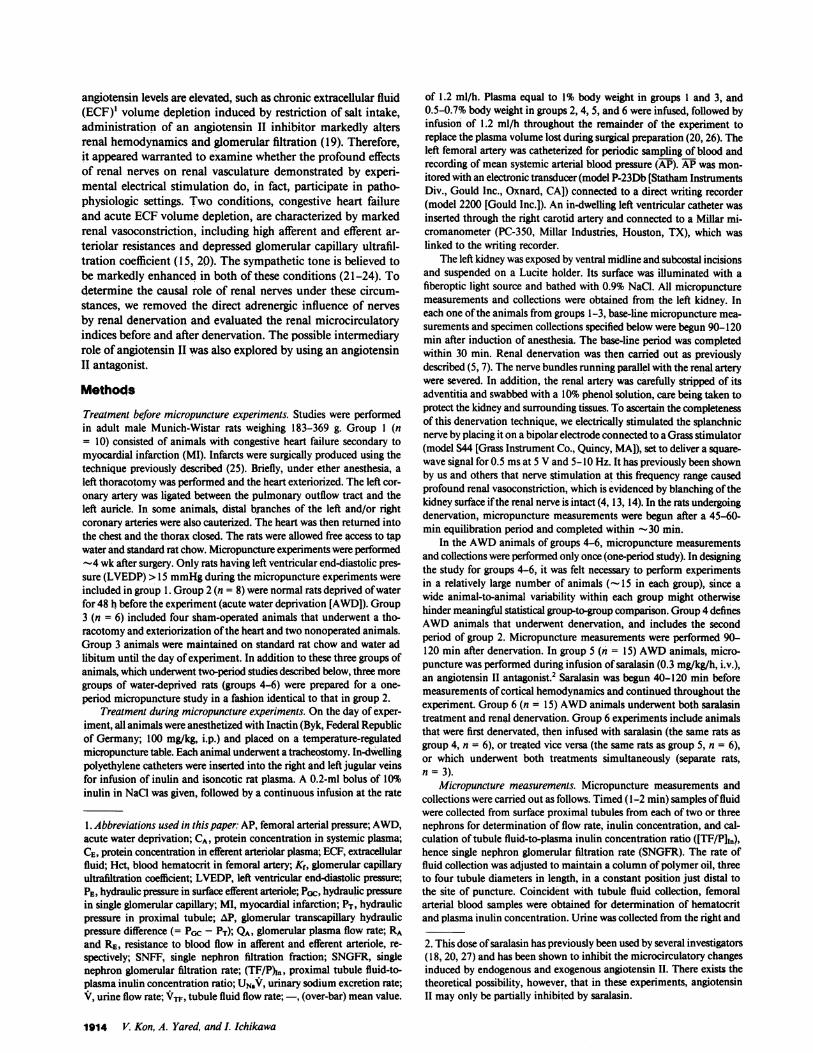
Table II. Summary of Parameters for Cortical Microcirculation of the Lei Kidney
SNGFR POC PT AP CA Qua SNFF RA Re Kr
nil/min mmHg mmHg mmHg gidl nl/min XIO'dyn s. cm-5 nl/(s. mmHg)
MI (n = 10 rats):Group 1
Baseline 26.6 52.6 13.0 39.9 5.9 92.0 0.31 2.61 2.19 0.0414±2.3 0.7 0.7 1.1 0.1 12.8 0.02 0.43 0.35 0.0045
Denervation 30.8 49.0 12.8 36.3 6.1 122.7 0.27 0.29 1.41 0.0640(left kidney) ±2.1 1.0 0.4 0.8 0.1 18.4 0.02 0.37 0.15 0.0103
P value* <0.01 <0.01 NS <0.01 <0.025 <0.025 NS NS <0.01 NSP value* <0.01 NS NS <0.05 <0.05 <0.01 NS NS <0.01 NS
AWD(n = 8 rats):Group 2
Baseline 27.8 56.7 11.9 44.8 6.7 80.8 0.36 2.46 2.15 0.0511±3.3 2.1 1.0 1.8 0.1 12.3 0.02 0.35 0.37 0.0073
Denervation 31.2 51.2 13.3 38.2 6.5 107.6 0.30 1.96 1.40 0.0723(left kidney) ±3.3 1.6 0.9 1.6 0.2 15.9 0.02 0.26 0.15 0.0083
P value* <0.025 <0.005 NS <0.001 <0.05 <0.005 <0.005 <0.05 <0.025 <0.001P value§ <0.05 <0.01 NS <0.01 NS <0.01 <0.05 <0.05 <0.05 NS
CONT(n = 6 rats):Group 3
Baseline 41.4 50.9 12.3 38.5 5.7 135.9 0.31 2.00 1.21 0.0650±2.0 1.5 1.2 2.0 0.2 12.4 0.02 0.29 0.08 0.0118
Denervation 38.9 50.1 12.0 38.1 5.7 132.6 0.30 2.20 1.35 0.0712(left kidney) ±2.1 1.8 1.0 2.1 0.2 14.0 0.02 0.31 0.29 0.0187
P value* NS NS NS NS NS NS NS NS NS NS
Values expressed as mean±SE. CONT, control rats. NSdenotes P > 0.05. Statistical comparison performed between the initial and second periodsin the same rat (*) as well as for changes induced by denervation between MI and CONT(t) and AWDand CONT(§) rats. Values for HE/APwere found to be <0.95 (unique value for Kf) in six MI rats in the initial period and six after denervation; three AWDrats in the initial period andtwo after denervation were calculated to have unique Kf values; three CONTrats in the initial period and six after denervation were calculated tohave unique Kf values. These unique values of Kf were pooled with minimum values obtained under equilibrium conditions in calculating themeans.
vation revealed that left renal denervation did not affect AP,which remained essentially unchanged, 101±4 vs. 103±4 mmHg.The blood hemocrit in femoral artery (Hct) also remained un-changed at 47±1 vol % in both periods. Although the rate ofurine flow from the intact right kidney did not significantlychange with left renal denervation, urine flow from the left kidneymore than doubled, from an average of 0.0074±0.0011 to0.0194±0.0034 ml/min. Similarly, sodium excretion increasedsubstantially only in the left kidney, average of 0.35±0.07 vs.1.32±0.34 Ateq/min.3 Whole kidney GFR(n = 8) in the rightkidney was not affected by left renal denervation, 0.77±0.09 vs.
3. Ipsilateral natriuresis has been shown to be accompanied by contra-lateral antinatriuresis, termed, renorenal reflex (10, 32). This phenomenonwas not observed in our experiments. Wehypothesize that the alreadyheightened renal nerve tone in the pathophysiologic conditions of MIand AWDmay not be responsive to further activation imposed by con-
tralateral denervation. Our control rats (group 3) also differed from thosepreviously described in that the previous studies described volume ex-
panded animals undergoing sodium pentobarbital anesthesia, while theanimals in the present experiments were euvolemic and were anesthetizedwith Inactin. These differences may explain the disparate findings.
0.76±0.07 ml/min, whereas denervation led to a GFRincreasein the left kidney, on average from 0.68±0.07 to 0.88±0.09 ml/min (P < 0.05).
The renal cortical microcirculatory parameters before andafter denervation are shown in Table II. SNGFRincreased on
average from 26.6±2.3 to 30.8±2.1 nl/min. This increase reflectsthe increased SNGFRin eight animals and essentially unchangedSNGFRin two rats. This denervation-induced increase inSNGFRcontrasted the absence of change in SNGFRlevel afterrenal denervation of normal rats. The Prc of MI rats fell slightlywith denervation, from a mean of 52.6±0.7 to 49.0± 1.0 mmHg.The PT remained virtually unchanged at 13.0±0.7 vs. 12.8±0.4mmHg.Therefore, the mean glomerular transcapillary hydraulicpressure difference, AP, was lower in the second period, a mean
of 39.9±1.1 mmHgfell to 36.3±0.8 mmHg. The CA increasedslightly in the second period from 5.9±0.1 to 6.1±0.1 g/dl. De-nervation caused a uniform increase in the glomerular plasmaflow rate, QA, which rose on average from 92.0±12.8 to122.7±18.4 nl/min. This increase in plasma flow rate was as-
sociated with a fall in arteriolar resistances, particularly in theefferent arteriole, as shown in Table II. Lastly, the Kf rose from
1916 V. Kon, A. Yared, and I. Ichikawa
a mean of 0.0414±0.0045 to 0.0640±0.0103 nl/(s - mmHg). Thisnumeric rise in Kf represents the direction of change in all butone animal; the change in the mean value, however, was justshort of reaching statistical significance by t test (0.05 < P<0.10).
Group 2 (water-deprived animals). The parameters for sys-temic and renal microcirculatory dynamics of water-deprivedrats are also shown in Tables I and II. APaveraged 106±3 mmHgbefore and 103±3 mmHgafter renal denervation. The Hct fellby 1 vol %, from 56±1 to 55±1. Urine volume and sodiumexcretion rose significantly only in the denervated left kidney,as shown in Table I. Whole kidney GFR(n = 6) in the intactright kidney was 0.65±0.07 ml/min before and 0.62±0.12ml/min after left denervation (NS), while the left kidney in-creased slightly, but significantly, from 0.62±0.11 to 0.68±0.11ml/min after denervation (P < 0.05). As in the rats with MI,SNGFRrose slightly, from an average of 27.8±3.3 to 31.2±3.3nl/min (Table II). PGc fell in every animal, averaging 56.7±2.1mmHgduring the base-line period and 51.2±1.6 mmHgafterdenervation. Together with the trend toward higher value of PTfollowing denervation, AlP was markedly lower in the secondstudy period, mean 44.8±1.8 vs. 38.2±1.6 mmHg. Systemicplasma protein concentration decreased slightly from an averageof 6.7±0.1 to 6.5±0.2 g/dl. QA increased in every animal, av-eraging 80.8±12.3 nl/min with renal nerves intact and107.6±15.9 nl/min after denervation. Both RA and RE fell sig-nificantly, as shown in Table II. The relatively greater increasein QA than SNGFRin this group of animals is reflected by thefall in single nephron filtration fraction, a mean of 0.36±0.02fell to 0.30±0.02. Finally, the value for Kf also increased signif-icantly with renal denervation, i.e., from 0.0511±0.0073 to0.0723±0.0083 nl/(s -mmHg).
Group 3 (normal control). To test whether the effects of renaldenervation seen in Groups 1 and 2 animals were specific to theexperimental conditions of these animals, we subjected a thirdgroup of normal Munich-Wistar rats to micropuncture study.Blood pressure and Hct were again not affected by denervation.As can be seen in Table I, renal denervation increased urine
flow in the left kidney, from an average of 0.0086±0.0007 to0.0125±0.0015 ml/min. The magnitude of this increase waslarger in these euvolemic animals than the postdenervation in-crease in urine volume observed in AWDrats. Sodium excretionalso rose only in the left kidney, mean 0.50±0.12 vs. 0.80±0.05,ueq/min. Whole kidney GFRwas not affected by left renal de-nervation in either kidney 0.86±0.30 vs. 0.97±0.07 ml/min onthe right and 0.91±0.16 vs. 0.87±0.12 ml/min on the left. Asimilar pattern has been observed by many previous investigators(5-8). By contrast, due to the subtle and directionally dissimilareffects of renal denervation on hemodynamics among the ani-mals studied, statistical significance was not reached in any ofthe microcirculatory parameters described in Table II. Thesefindings echo previous micropuncture observations followingrenal denervation (7).
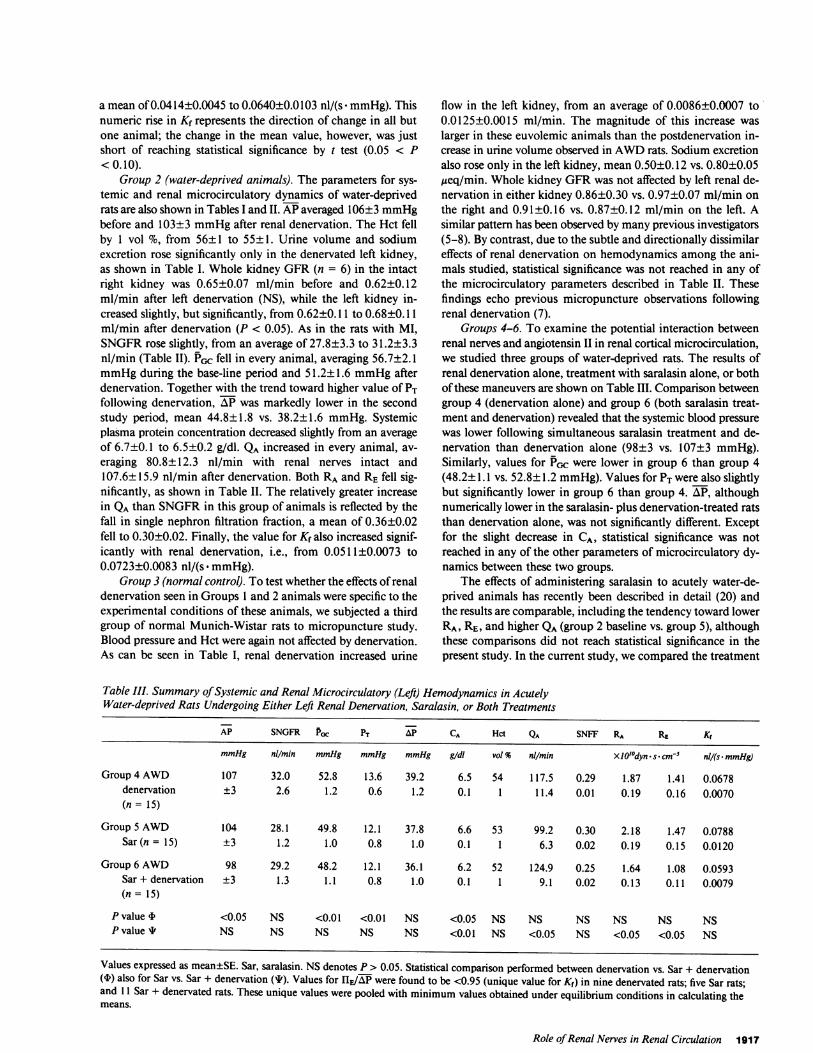
Groups 4-6. To examine the potential interaction betweenrenal nerves and angiotensin II in renal cortical microcirculation,we studied three groups of water-deprived rats. The results ofrenal denervation alone, treatment with saralasin alone, or bothof these maneuvers are shown on Table III. Comparison betweengroup 4 (denervation alone) and group 6 (both saralasin treat-ment and denervation) revealed that the systemic blood pressurewas lower following simultaneous saralasin treatment and de-nervation than denervation alone (98±3 vs. 107±3 mmHg).Similarly, values for PGC were lower in group 6 than group 4(48.2± 1.1 vs. 52.8±1.2 mmHg). Values for PT were also slightlybut significantly lower in group 6 than group 4. AP, althoughnumerically lower in the saralasin- plus denervation-treated ratsthan denervation alone, was not significantly different. Exceptfor the slight decrease in CA, statistical significance was notreached in any of the other parameters of microcirculatory dy-namics between these two groups.
The effects of administering saralasin to acutely water-de-prived animals has recently been described in detail (20) andthe results are comparable, including the tendency toward lowerRA, RE, and higher QA(group 2 baseline vs. group 5), althoughthese comparisons did not reach statistical significance in thepresent study. In the current study, we compared the treatment
Table III. Summary of Systemic and Renal Microcirculatory (Left) Hemodynamics in AcutelyWater-deprived Rats Undergoing Either Left Renal Denervation, Saralasin, or Both Treatments
AP SNGFR Pac PT AP CA Hct QA SNFF RA RE Kf
mmHg nil/min mmHg mmHg mmHg gidi vol % nil/min XIO'0dyn - s * cm-5 ni/(s * mmHg)
Group 4 AWD 107 32.0 52.8 13.6 39.2 6.5 54 117.5 0.29 1.87 1.41 0.0678denervation ±3 2.6 1.2 0.6 1.2 0.1 1 11.4 0.01 0.19 0.16 0.0070(n= 15)
Group 5 AWD 104 28.1 49.8 12.1 37.8 6.6 53 99.2 0.30 2.18 1.47 0.0788Sar(n = 15) ±3 1.2 1.0 0.8 1.0 0.1 1 6.3 0.02 0.19 0.15 0.0120
Group 6 AWD 98 29.2 48.2 12.1 36.1 6.2 52 124.9 0.25 1.64 1.08 0.0593Sar + denervation ±3 1.3 1.1 0.8 1.0 0.1 1 9.1 0.02 0.13 0.11 0.0079(n= 15)
P value t <0.05 NS <0.01 <0.01 NS <0.05 NS NS NS NS NS NSP value I NS NS NS NS NS <0.01 NS <0.05 NS <0.05 <0.05 NS
Values expressed as mean±SE. Sar, saralasin. NSdenotes P > 0.05. Statistical comparison performed between denervation vs. Sar + denervation(4) also for Sar vs. Sar + denervation (I). Values for IIE/AP were found to be <0.95 (unique value for K,) in nine denervated rats; five Sar rats;and 11 Sar + denervated rats. These unique values were pooled with minimum values obtained under equilibrium conditions in calculating themeans.
Role of Renal Nerves in Renal Circulation 1917
with saralasin alone (group 5) with the effects produced by sar-alasin and denervation together (group 6). Systemic blood pres-sure tended to be lower in group 6 than group 5, as shown inTable III. PCC and AP were not different between these twogroups. CAwas somewhat higher in group 5 than group 6. Glo-merular plasma flow was significantly higher in animals treatedwith both saralasin and denervation than those with saralasintreatment alone (124.9±9.1 vs. 99.2±6.3 nl/min, P < 0.05). Thishigher value for QAin group 6 was associated with a significantlylower level of RA in this group, as shown in Table III. Similarly,RE was lower in the saralasin- and DNx-treated animals thanthose with only saralasin treatment (P < 0.05) (Table III).
Discussion
Although urine flow and sodium excretion increased in the de-nervated left kidney in normal rats, denervation failed to changeany of the parameters of renal cortical microcirculation in thesecontrol animals. These findings are in good agreement withpreviously reported micropuncture studies from other labora-tories (5-8). In contrast, in the two experimental conditionsstudied, MI and AWD,denervation caused an amelioration ofrenal vasoconstriction, as evidenced by the significant increasein whole kidney and SNGFR,and QA. The cardiac performanceof the currently studied animals appears to be less compromisedthan those previously reported (15), i.e., higher AP and lowerLVEDP. It is conceivable that with a more severe degree of heartfailure, with more profound hypoperfusion of the renal cortex,the degree of vasodilation after denervation would be evengreater.
In MI rats, changes in circulatory dynamics included a de-crease in arteriolar resistances, particularly in RE, on average by30%of its base-line value. This was accompanied by a slight butuniform fall in the glomerular capillary hydraulic pressure anda marked increase in QA, which rose on average by 36% withdenervation. Although the numerical increase in Kf was shortof reaching statistical significance, the individual Kf values in-creased in all but one MI animal.
Hypoperfusion of renal cortical microcirculation in acuteECF volume depletion also appears to be attributable to theprofound tonic influence of renal nerves on renal vasculature.As described in the Results section, denervation in water-de-prived animals caused a uniform increase in QA. In these ex-periments, diminution of vasoconstriction was evidenced by themarked decreases in both afferent and efferent arterioles, and auniform rise in the ultrafiltration coefficient. In association withthese changes, a mild increase in SNGFRwas seen after dener-vation.
The denervation-induced pattern of renal cortical microcir-culation is qualitatively opposite to the changes seen in our pre-vious study of stimulation of renal nerves in normal animals(4). That is, contrasting the amelioration of vasoconstriction thatoccurred after removal of renal nerves, we previously observedthat electrical stimulation of renal nerves causes profound va-soconstriction. In response to moderately high frequency stim-ulation, QA fell by -40%. This reduction in plasma flow wasaccompanied by a marked increase in both RA and RE. Theglomerular capillary ultrafiltration coefficient also fell, on averageby some 70% with nerve stimulation. These changes were suf-ficient to cause a reduction in SNGFRby >50%. As discussedabove, in the current study of MI and water-deprived rats, di-
rectionally opposite changes occurred in virtually all of thesemicrocirculatory parameters after renal denervation. The find-ings of these and our previous studies are strengthened by nu-merous observations of adrenergic innervation of various vas-cular structures, including afferent and efferent arterioles andglomerular mesangium (34-38).4
It is believed that the sympathetic tone is enhanced in bothacute ECF volume depletion and congestive heart failure, pre-sumably through mechanisms involving activation and/or at-tenuation of baroreceptor systems (21-24). The enhanced sym-pathetic tone under these circumstances is believed to contributeto improved cardiac performance by increasing the heart rateand myocardial contractility, thereby sustaining perfusion to vitalorgans (39). It has been experimentally demonstrated that theantidiuresis and antinatriuresis induced by constriction of thethoracic vena cava or tricuspid insufficiency in dogs was abol-ished by pretreatment with systemic or intrarenally administeredadrenergic blockers (40-43) or, as in the present study, surgicaldenervation (43-45). In some of these studies, whole kidneyplasma flow rate, estimated by renal clearance of para-amino-hippuric acid, was found to change to a relatively small andvariable degree after the adrenergic inhibition (40, 41). By mea-suring pressures and flows in renal cortical microcirculation inMI and water-deprived animals, our study has provided directevidence to indicate that renal nerves contribute substantiallyto the enhanced vasomotor tone and hypoperfusion of renalcortical circulation in some circumstances.
There is accumulating evidence of interaction between renalnerves and other vasoactive substances (43-51). The relationshipbetween renal nerves and the renin angiotensin system, in par-ticular, has generated intense interest. It has been shown thatactivation of renal nerves increased renal release of renin andgeneration of angiotensin II (46, 47). Pelayo et al. (13) recentlyshowed that treatment of rats with angiotensin II inhibitors par-tially prevented reduction of SNGFRand QAduring mild elec-trical stimulation of renal nerves. It was speculated that the tonicinfluences of renal nerves on cortical microcirculation are, inpart, mediated by enhanced renal renin release and angiotensinII action. In our study, therefore, an additional effort was madeto examine the potential intermediary role of angiotensin II inthe profound hemodynamic effects of renal nerves demonstratedin groups 1-3.
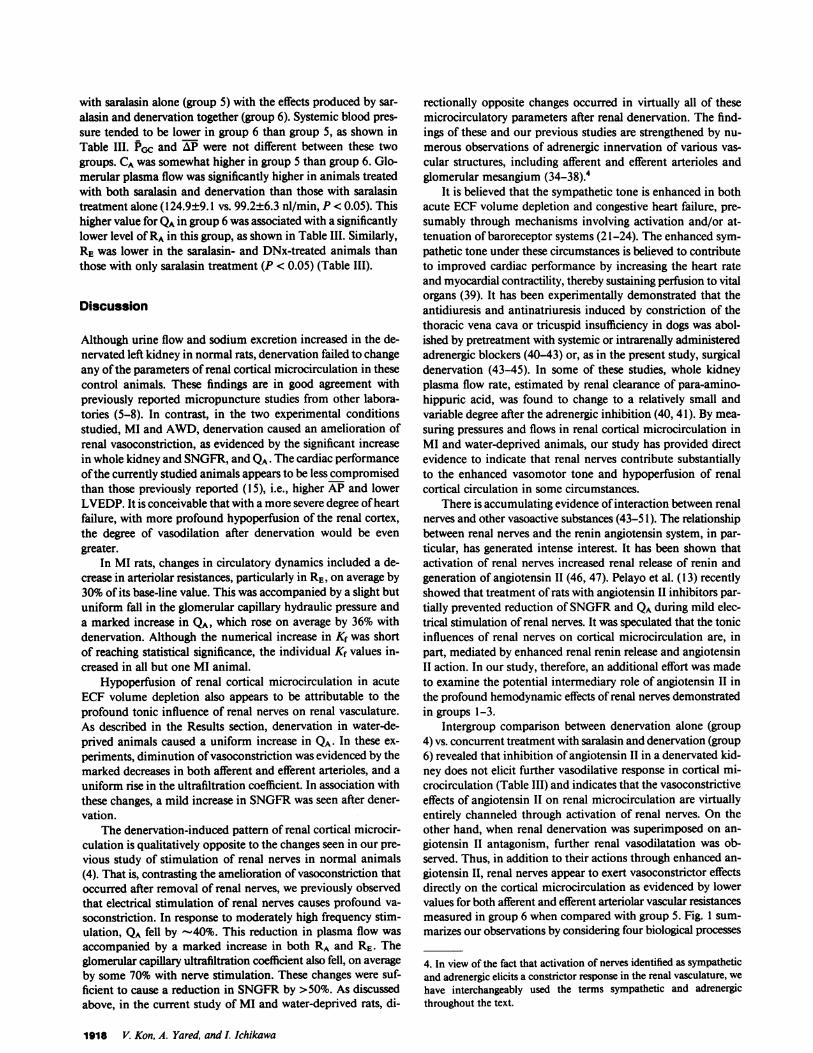
Intergroup comparison between denervation alone (group4) vs. concurrent treatment with saralasin and denervation (group6) revealed that inhibition of angiotensin II in a denervated kid-ney does not elicit further vasodilative response in cortical mi-crocirculation (Table III) and indicates that the vasoconstrictiveeffects of angiotensin II on renal microcirculation are virtuallyentirely channeled through activation of renal nerves. On theother hand, when renal denervation was superimposed on an-giotensin II antagonism, further renal vasodilatation was ob-served. Thus, in addition to their actions through enhanced an-giotensin II, renal nerves appear to exert vasoconstrictor effectsdirectly on the cortical microcirculation as evidenced by lowervalues for both afferent and efferent arteriolar vascular resistancesmeasured in group 6 when compared with group 5. Fig. 1 sum-marizes our observations by considering four biological processes
4. In view of the fact that activation of nerves identified as sympatheticand adrenergic elicits a constrictor response in the renal vasculature, we
have interchangeably used the terms sympathetic and adrenergicthroughout the text.
1918 V. Kon, A. Yared, and I. Ichikawa
0D
1RA
LIRE
Figure 1. Summary of the four biological processes through which an-giotensin II (AII) and renal nerves (Renal N) may contribute to highafferent (RA) and efferent (RE) arteriolar resistances in acute ECFvol-ume depletion.
that may contribute to the vasoconstriction characteristic ofAWD, namely increased arteriolar resistances and decreasedglomerular capillary ultrafiltration coefficient. All and renalnerves may act independently as renal constrictors, as indicatedby arrows 1 and 2 in Fig. 1. In addition, enhanced renal nerveactivity may exert its constrictor actions through augmentationof intrarenal All release, as discussed above (Fig. 1, arrow 3).Finally, high intrarenal levels of All may facilitate local releaseor delay in uptake of norepinephrine by nerve endings, therebycausing the renal constriction response, as indicated by arrow 4in Fig. 1 (52, 53). The absence of saralasin effects in previouslydenervated kidneys speaks against a significant contribution ofthe first process, that is direct actions of All. Additional vaso-dilation following denervation in previously saralasin-treatedanimals supports process 2, that is, direct vasoconstrictor actionof renal nerves. Although this vasodilatory effect is not expectedto occur through processes 3 and 4 (which have already beensuppressed with saralasin), our previous observations that sar-alasin treatment in AWDrats with intact renal nerves causesrenal vasodilation support these two possibilities (20).
Although the interactions between adrenergic and renin-an-giotensin systems were examined only in AWD, it seems rea-sonable to speculate that this relationship also prevails incongestive heart failure. Supporting this notion are our recentfindings that administration of teprotide, an angiotensin I con-verting enzyme inhibitor, led to hemodynamic alterations inrenal cortical microcirculation that were similar to those follow-ing denervation in the present study (15). Demonstration of theimportant hemodynamic influences of renal nerve activation inthe two experimental models of prerenal circulatory impairmentsuggests future studies to delineate the mechanisms of renal nerveactivation.
Acknowledgments
The authors are grateful to Ms. Janet Stanley for her expert secretarialassistance.
This work was supported by U. S. Public Health Service grants AM-34080 and AM-34792 and grant-in-aid from American Heart Association.Dr. Kon is a recipient of the American Heart Association Clinician Sci-entist Award.
References
1. Bello-Reuss, E., D. L. Trevino, and C. W. Gottschalk. 1976. Effectof renal sympathetic nerve stimulation on proximal water and sodiumreabsorption. J. Clin. Invest. 57:1104-1107.
2. Zambraski, E. J., and G. F. DiBona. 1976. Angiotensin II in an-tidiuresis of low-level renal nerve stimulation. Am. J. Physiol. 231:1105-1110.
3. Slick, G. L., A. J. Aguilera, E. J. Zambraski, G. F. DiBona, andG. L. Kaloyanides. 1975. Renal neuroadrenergic transmission. Am. J.Physiol. 229:60-65.
4. Kon, V., and I. Ichikawa. 1983. Effector loci for renal nerve controlof cortical microcirculation. Am. J. Physiol. 245:F545-F553.
5. Bello-Reuss, E., R. E. Colindres, E. Pastoriza-Muioz, R. A. Mueller,and C. W. Gottschalk. 1975. Effects of acute unilateral denervation inthe rat. J. Clin. Invest. 56:208-217.
6. Bello-Reuss, E., E. Pastoriza-Muiioz, and R. E. Colindres. 1977.Acute unilateral renal denervation in rats with extracellular volume ex-pansion. Am. J. Physiol. 232:F26-F32.
7. Pelayo, J. C., M. G. Ziegler, P. A. Jose, and R. C. Blantz. 1983.Renal denervation in the rat: analysis of glomerular and proximal tubularfunction. Am. J. Physiol. 244(Renal Fluid Electrolyte Physiology 13):F70-F77.
8. Takacs, L., P. Bencsath, and L. Szalay. 1978. Decreased proximaltubular transport capacity after renal sympathectomy. Proc. Int. Congr.Nephrol. 8:553-558.
9. Block, M. A., K. G. Wakim, and F. C. Mann. 1952. Renal functionduring stimulation of renal nerves. Am. J. Physiol. 169:670-677.
10. DiBona, G. G., and L. L. Rios. 1980. Renal nerves in compen-satory renal response to contralateral renal denervation. Am. J. Physiol.238:F26-F30.
11. Johns, E. J., B. A. Lewis, and B. Singer. 1976. The sodium re-taining effect of renal nerve activity in the cat: the role of angiotensinformation. Clin. Sci. 51:93-102.
12. DiSalvo, J., and C. Fell. 1971. Changes in blood flow during renalnerve stimulation. Proc. Soc. Exp. Biol. Med. 136:150-153.
13. Pelayo, J. C., M. G. Ziegler, and R. C. Blantz. 1984. AngiotensinII in adrenergic-induced alterations in glomerular hemodynamics. Am.J. Physiol. 247:F799-F807.
14. Hermansson, K., M. Larson, 0. Kallskog, and M. Wolgast. 1981.Influence of renal nerve activity on arteriolar resistance, ultrafiltrationdynamics and fluid reabsorption. Pfluegers Arch. 389:85-90.
15. Ichikawa, I., J. M. Pfeffer, M. A. Pfeffer, T. H. Hostetter, andB. M. Brenner. 1984. Role of angiotensin II in the altered renal functionof congestive heart failure. Circ. Res. 55:669-675.
16. Ichikawa, I., R. A. Ferrone, K. L. Duchin, M. Manning, V. J.Dzau, and B. M. Brenner. 1983. Relative contribution of vasopressinand angiotensin II to the altered renal microcirculatory dynamics in two-kidney Goldblatt hypertension. Circ. Res. 53:592-602.
17. Myers, B. D., W. E. Deen, and B. M. Brenner. 1975. Effects ofnorepinephrine and angiotensin II on the determinants of glomerularultrafiltration and proximal tubule fluid reabsorption in the rat. Circ.Res. 37:101-1 10.
18. Blantz, R. C., K. S. Konnen, and B. J. Tucker. 1976. AngiotensinII effects upon the glomerular microcirculation and ultrafiltration coef-ficient of the rat. J. Clin. Invest. 57:419-434.
19. Steiner, R. W., B. J. Tucker, and R. C. Blantz. 1979. Glomerularhemodynamics in rats with chronic sodium depletion. J. Clin. Invest.64:503-512.
20. Yared, A., V. Kon, and I. Ichikawa. 1985. Mechanism of pres-ervation of glomerular perfusion and filtration during acute extracellularfluid volume depletion. Importance of intrarenal vasopressin-prosta-glandin interaction for protecting kidneys from constrictor action of va-sopressin. J. Clin. Invest. 75(5):1477-1487.
21. Braunwald, E. 1970. The sympathetic nervous system in heartfailure. Hosp. Pract. 5(12):31-39.
Role of Renal Nerves in Renal Circulation 1919
22. Gaffney, T. E., and E. Braunwald. 1963. Importance of the an-drenergic nervous system in the support of circulatory function in patientswith congestive heart failure. Am. J. Med. 34:320-324.
23. DiBona, G. F., and L. L. Sawin. 1983. Renal nerves in renaladaptation to dietary sodium restriction. Am. J. Physiol. 245(Renal FluidElectrolyte Physiology 14):F322-F328.
24. DiBona, G. F., and L. L. Sawin. 1985. Renal nerve activity inconscious rats during volume expansion and depletion. Am. J. Physiol.248(Renal Fluid Electrolyte Physiology 17):F15-F23.
25. Pfeffer, M. A., J. M. Pfeffer, M. C. Fishbein, P. J. Fletcher, J.Spadara, R. A. Kloner, and E. Braunwald. 1979. Myocardial infarct sizeand ventricular function in rats. Circ. Res. 44:503-512.
26. Ichikawa, I., D. A. Maddox, M. G. Cogan, and B. M. Brenner.1978. Dynamics of glomerular ultrafiltration in euvolemic Munich-Wistarrats. Renal Physiol. 1: 121-131.
27. Arendshorst, W. J., and W. F. Finn. 1977. Renal hemodynamicsin the rat before and during inhibition of angiotensin II. Am. J. Physiol.233(4):F290-F297.
28. Hughes, M. L., and I. Ichikawa. Interglomerular heterogeneityof filtration fraction among superficial nephrons: fact or artifact. KidneyInt. In press.
29. Viets, J. W., W. M. Deen, J. L. Troy, and B. M. Brenner. 1978.Determination of serum protein concentration in nanoliter blood samplesusing fluorescamine or o-phthalaldehyde. Anal. Biochem. 88:513-421.
30. Deen, W. M., J. L. Troy, C. R. Robertson, and B. M. Brenner.1973. Dynamics of glomerular ultrafiltration in the rat. IV. Determinationof the ultrafiltration coefficient. J. Clin. Invest. 52:1500-1508.
31. Vurek, G. G., and S. E. Pegram. 1966. Fluorometric method forthe determination of nanogram quantities of inulin. Anal. Biochem. 16:409-419.
32. Fuihr, J., J. Kaczmarczyk, and C. D. Kruttgen. 1955. Eine einfachecolorimetrische Methods zur Inulinbestimmung fMr Nierenclearanceun-tersuchungen bei Stoffwechselgesunden und Diabetikern. Klin. Woch-enschr. 33:729-730.
33. Colindres, R. E., W. S. Spielman, N. G. Moss, W. W. Harrington,and C. W. Gottschalk. 1980. Functional evidence for renorenal reflexesin the rat. Am. J. Physiol. 239:F265-F270.
34. Barajas, L. 1978. Innervation of the renal cortex. Fed. Proc. 37:1192-1201.
35. Barajas, L., P. Wang, K. Powers, and S. Nishio. 1981. Identifi-cation of renal neuroeffector junctions by electron microscopy ofreembedded light microscopic autoradiograms of semithin sections. J.Ultrastruct. Res. 77:379-385.
36. Dieterich, J. H. 1974. Electron microscopic studies of the inner-vation of the rat kidney. Z. Anat, Entwicklungsgesch. 145:169-186.
37. Gorgas, K. 1978. Innervation of the juxtaglomerular apparatus.In Peripheral Neuroendocrine Interaction. R. E. Coupland and W. G.Forssmann, editors. Springer-Verlag, NewYork. 144-152.
38. Barajas, L., K. Powers, and P. Wang. 1984. Innervation of therenal cortical tubules: a quantitative study. Am. J. Physiol. 247:F50-F60.
39. Berns, A. S., and R. W. Schrier. 1984. The kidney in heart faillure.In The Kidney in Systemic Disease. W. N. Suki and G. E. Knoyan,editors. John Wiley & Sons Medical, NewYork. 569-596.
40. Barger, A. C., M. R. Liebowitz, and F. P. Muldowney. 1959. Therole of the kidney in the homeostatic adjustments of congestive heartfailure. J. Chronic Dis. 9:571-582.
41. Barger, A. C., F. P. Muldowney, and M. R. Liebowitz. 1959.Role of the kidney in the pathogenesis of congestive heart failure. Cir-culation. 20:273-285.
42. Schrier, R. W., M. H. Humphreys, and R. C. Ufferman. 1971.Role of cardiac output and the autonomic nervous system in the antina-triuretic response to acute constriction of the thoracic superior venacava. Circ. Res. 29:490-498.
43. Gill, J. R., Jr., A. A. Carr, L. E. Fleischmann, A. G. T. Casper,and F. C. Bartter. 1967. Effects of pnetolinium on sodium excretion indogs with constriction of the vena cava. Am. J. Physiol. 212:191-196.
44. Slick, G. L., G. F. DiBona, and G. J. Kaloyanides. 1974. Renalsympathetic nerve activity in sodium retention of acute caval constriction.Am. J. Physiol. 226:925-932.
45. Azer, M., R. Gannon, and G. J. Kaloyanides. 1972. Effect ofrenal denervation on the antinatriuresis of caval constriction. Am. J.Physiol. 222:611-616.
46. Davis, J. O., and R. H. Freeman. 1976. Mechanisms regulatingrenin release. Physiol. Rev. 56:1-5.
47. Thames, M. D. 1984. Renin release; reflex control and adrenergicmechanisms. J. Hypertension. 2(Suppl. 1):57-66.
48. Gregory, L. C., and I. A. Reid. 1984. Effect of renal denervationon the suppression of renin secretion by vasopressin in conscious dogs.Am. J. Physiol. 247(Renal Fluid Electrolyte Physiology 16):F88 1-F887.
49. Stella, A., and A. Zanchetti. 1984. Neural control of renin se-cretion, J. Hypertension. 2(Suppl. 1):83-88.
50. Davis, H. A., and E. W. Horton. 1972. Output of prostaglandinsfrom the rabbit kidney: its increase on renal nerve stimulation and itsinhibition by indomethacin. Br. J. Pharamacol. 46:658-675.
51. Stella, A., F. Calaresu, and A. Zanchetti. 1976. Neural factorscontributing to renin release during reduction in renal perfusion pressureand blood flow in cats. Clin. Sci. Med. 51:453-461.
52. Zimmerman, B. G., and G. Gissleu. 1968. Patterns of renal va-soconstriction and transmitter release during sympathetic stimulationin the presence of angiotensin and cocaine. J. Pharmacol. Exp. Ther.163:320-329.
53. Needleman, P., G. R. Marshall, and E. M. Johnson, Jr. 1974.Determinants and modification of adrenergic and vascular resistance inthe kidney. Am. J. Physiol. 227:665-669.
1920 V. Kon, A. Yared, and I. Ichikawa