Embed Size (px)
Citation preview

1
Simulation of Solar Powered Absorption Cooling
System for Buildings in Pakistan
A thesis submitted to The University of Manchester for the Degree of
Doctor of Philosophy
in the Faculty of Engineering and Physical Sciences
2016
Muhammad Asim
School of Mechanical, Aerospace and Civil Engineering
University of Manchester

2
Table of Contents
Abstract ............................................................................................................................. 7
Declaration ........................................................................................................................ 8
Copyright Statement .......................................................................................................... 9
Acknowledgement........................................................................................................... 10
List of Publications ......................................................................................................... 11
List of Tables .................................................................................................................. 12
List of Figures ................................................................................................................. 13
Abbreviations and Symbols ............................................................................................. 17
Chapter 1: Introduction ................................................................................................... 22
1.1 Background ........................................................................................................... 22
1.2 Energy .................................................................................................................. 22
1.3 World Energy ....................................................................................................... 23
1.4 Pakistan and Energy .............................................................................................. 25
1.4.1 Electricity Generation History ....................................................................... 27
1.4.2 Current Status and Future Plans .................................................................... 28
1.5 Impact of the Energy Crisis ................................................................................... 30
1.6 Conclusion ............................................................................................................ 32
1.7 Aims and Objective ............................................................................................... 33
1.8 Structure of the Thesis .......................................................................................... 34
Chapter 2: Renewable Energy Resources in Pakistan ...................................................... 36
2.1 Introduction .......................................................................................................... 36
2.2 Renewable Energy Potential .................................................................................. 36
2.2.1 Wind Energy .................................................................................................. 36
2.2.2 Hydroelectric Energy ..................................................................................... 38
2.2.3 Solar Energy .................................................................................................. 39
2.3 Solar Energy Systems and Pakistan ....................................................................... 42
2.4 Current Status of Solar Energy Application ........................................................... 45
2.4.1 Photovoltaics ................................................................................................. 45
2.4.2 Solar Thermal ................................................................................................ 46
2.5 Institutional Infrastructure ..................................................................................... 47
2.5.1 Pakistan Council for Renewable Energy Technologies ................................... 48
2.5.2 Alternative Energy Development Board (AEDB) ............................................ 48
2.5.3 Educational Institutes .................................................................................... 48
2.5.4 Pakistan Engineering Council (PEC) ............................................................. 49

3
2.6 Doctoral Research on Solar Energy Potential in Pakistan ...................................... 49
2.7 Conclusion ............................................................................................................ 50
Chapter 3: Pakistan’s Climate and Buildings’ Energy ...................................................... 52
3.1 Introduction .......................................................................................................... 52
3.2 Geography of Pakistan .......................................................................................... 52
3.2.1 Population ..................................................................................................... 55
3.3 Climate of Pakistan ............................................................................................... 55
3.3.1 Temperature and Humidity ............................................................................ 56
3.4 Heat Index and Pakistan ........................................................................................ 57
3.5 Thermal Extremes in Pakistan ............................................................................... 59
3.6 Comfort Temperature ............................................................................................ 60
3.6.1 Standard Comfort Temperature ...................................................................... 60
3.6.2 Adaptive Thermal Comfort ............................................................................. 62
3.7 Building Energy in Pakistan .................................................................................. 65
3.7.1 Energy Efficient Buildings: ............................................................................ 66
3.7.2 Building Energy Code of Pakistan.................................................................. 67
3.7.3 Benefits of Introducing Building Energy Code in Pakistan ............................. 68
3.8 Case Study of Energy Efficiency Improvement in Existing Houses in Pakistan ..... 69
3.8.1 Results of the Case Study ............................................................................... 70
3.8.2 Findings on the Basis of Energy Efficient Housing Reports ............................ 74
3.9 Conclusion ............................................................................................................ 74
Chapter 4: Solar Cooling Systems ................................................................................... 76
4.1 Introduction .......................................................................................................... 76
4.2 Solar Electric Cooling ........................................................................................... 77
4.3 Solar Thermal Cooling .......................................................................................... 80
4.3.1 History of Solar Thermal Cooling Systems Development ................................ 81
4.3.2 World Solar Thermal Cooling Status 2014 and IEA Road Map 2050 .............. 82
4.3.3 Solar Thermal Cooling Systems ..................................................................... 82
4.4 Solar Thermal Collectors....................................................................................... 83
4.4.1 Stationary Collectors: .................................................................................... 84
4.4.2 Concentrating Solar Power (CSP) ................................................................. 88
4.4.3 Comparison of Thermal Collectors ................................................................ 93
4.5 Thermal Cooling Systems ..................................................................................... 94
4.5.1 Absorption System.......................................................................................... 95
4.5.2 Adsorption System.......................................................................................... 97

4
4.5.3 Solid and Liquid Desiccant Cooling System ................................................... 98
4.5.4 Ejector System ............................................................................................. 103
4.6 Solar Cooling for Hot Climates ........................................................................... 104
4.6.1 Solar Cooling System Research for Pakistan and India ................................ 108
4.7 Conclusion .......................................................................................................... 110
Chapter 5: Methodology ................................................................................................ 112
5.1 Introduction ........................................................................................................ 112
5.2 Experimental Study ............................................................................................. 113
5.2.1 Limitations of Experimental Study ................................................................ 115
5.3 Simulation Study................................................................................................. 116
5.3.1 Limitations of Simulation Study .................................................................... 117
5.4 Solar Energy System Simulation Programs ......................................................... 118
5.4.1 WATSUN ..................................................................................................... 118
5.4.2 Polysun ........................................................................................................ 119
5.4.3 f-Chart Method and Program ...................................................................... 119
5.5 Building Energy Simulation Programs ................................................................ 120
5.5.1 Energy Plus ................................................................................................. 120
5.5.2 Integrated Environment Solutions (IES) Virtual Environment (VE) .............. 121
5.5.3 TRNSYS ....................................................................................................... 122
5.5.4 TRNSYS Validity .......................................................................................... 127
5.6 Meteorological Data for Simulation Program ..................................................... 129
5.6.1 Weather Data Types ..................................................................................... 129
5.6.2 Pakistan Weather Data ................................................................................ 131
5.7 Conclusion .......................................................................................................... 136
5.7.1 Methodology ..................................................................................................... 136
5.7.2 Weather Data ............................................................................................... 137
Chapter 6: Building Model and Simulation ................................................................... 139
6.1 Introduction ........................................................................................................ 139
6.2 Building Model ................................................................................................... 140
6.3 TRNSYS Simulation Studio ................................................................................ 143
6.3.1 The Building’s Initial Parameters ................................................................ 144
6.3.2 Zones’ Thermal and Material Properties...................................................... 147
6.4 Building Model Initial Simulation Results .......................................................... 152
6.4.1 Internal Gains and Infiltration Addition ....................................................... 154
6.5 Building Model Modification ............................................................................. 156

5
6.5.2 Modified Building Model Results ................................................................. 158
6.5.3 Building Envelope Conduction ..................................................................... 159
6.6 Solar Cooling System Initial Parameters Calculations ......................................... 160
6.6.1 Chiller Cooling Capacity ............................................................................ 160
6.6.2 Solar Collector Calculation ......................................................................... 161
6.6.3 Cooling Systems Reference Model ................................................................ 162
6.7 Solar Cooling System Simulation ........................................................................ 163
6.7.1 Solar Cooling Process................................................................................. 163
6.7.2 Evacuated Tube Collector ............................................................................ 165
6.7.3 Hot Water Storage Tank ............................................................................... 167
6.7.4 Absorption Chiller ....................................................................................... 169
6.7.5 Cooling Coil ................................................................................................ 171
6.7.6 Cooling Tower ............................................................................................. 173
6.7.7 Pumps .......................................................................................................... 173
6.7.8 Fan .............................................................................................................. 174
6.7.9 Pipes ............................................................................................................ 176
6.7.10 Weather Data Reading and Processing ........................................................ 177
6.7.11 Controllers .................................................................................................. 178
6.8 Solar Cooling Simulation System ........................................................................ 181
6.9 Conclusion .......................................................................................................... 182
Chapter 7: Results and Discussion ................................................................................. 184
7.1 Introduction ........................................................................................................ 184
7.2 Evacuated Collector Energy Yield....................................................................... 184
7.3 Evacuated Tube Collector Efficiency .................................................................. 185
7.4 Room Cooling Load ............................................................................................ 186
7.5 Room Air Temperature ....................................................................................... 187
7.6 Storage Tank Heat Loss ...................................................................................... 188
7.7 Storage Tank Internal Energy Change ................................................................. 190
7.8 Pipe Heat Loss .................................................................................................... 191
7.9 The Solar Cooling System’s Electrical Energy Consumption .............................. 192
7.10 Cooling Tower ................................................................................................ 193
7.11 Absorption Chiller ........................................................................................... 194
7.12 Validation of Simulated Results ....................................................................... 195
7.12.1 Simulation Tool Validation .......................................................................... 196
7.12.2 Simulation Inputs Validation ....................................................................... 196

6
7.12.3 Simulation Results Validation ...................................................................... 196
7.13 Parametric Analysis ......................................................................................... 201
7.13.1 Collector Area and Flow .............................................................................. 203
7.13.2 Storage Tank Volume: .................................................................................. 205
7.13.3 Chilled Water Outlet Temperature ............................................................... 205
7.14 Conclusion ...................................................................................................... 208
Chapter 8: Conclusions and Recommendations ............................................................. 210
8.1 Summary ............................................................................................................ 210
8.2 General Discussion ............................................................................................. 210
8.2.1 Main Finding: Feasibility of Solar Thermal Cooling of a Building in Pakistan
210
8.2.2 Building Model and Energy ......................................................................... 211
8.2.3 Methodology ................................................................................................ 211
8.2.4 Solar Cooling System and Operational Parameters ...................................... 211
8.2.5 System Optimisation ..................................................................................... 213
8.2.6 Results Validation and Sensitivity Analysis................................................... 213
8.2.7 Conclusions and Recommendations ............................................................. 214
8.2.8 Addition to Knowledge ................................................................................. 215
8.3 Conclusions ........................................................................................................ 215
8.4 Recommendations ............................................................................................... 218
8.4.1 Energy and Solar Energy Data .................................................................... 218
8.4.2 Building Energy and Efficiency .................................................................... 218
8.4.3 Solar Thermal Cooling ................................................................................. 219
8.5 Further Studies .................................................................................................... 219
8.5.1 Building Energy and Efficiency .................................................................... 219
8.5.2 Solar Cooling System ................................................................................... 220
References 222
Appendices 243
Appendix A: Annual and Monthly Maximum Average Temperature and Relative
Humidity for District Cities of Pakistan ......................................................................... 243
Appendix B: World and Pakistan Solar Energy Maps with Solar Insolation for District
Cities of Pakistan .......................................................................................................... 246
Appendix C: Equipment Operation Parameters .......................................................... 253
Appendix D: System Heat Balance ............................................................................ 259

7
Abstract
This research investigates the potential of a solar powered cooling system for single family
houses in Pakistan. The system comprises water heating evacuated tube solar collectors, a hot
water storage tank, and an absorption chiller.
A literature review was carried out covering:
• Energy situation, climate, and renewable energy potential in Pakistan;
• Energy and thermal comfort in buildings, particularly for hot climates;
• Solar collectors and solar cooling systems, particularly for hot climates;
• Dynamic thermal simulation and weather data for solar energy systems and buildings.
It was found that Pakistan is short of energy and that there is a great need to cool buildings.
Renewable energy cooling systems are, therefore, of interest. The system described above
was selected, as it was found that solar energy is abundant in Pakistan when cooling is
required; thermal systems can be more economical than photovoltaics for hot climates and
suitable components (collectors, absorption chillers, etc.) are commercially available. The
TRNSYS dynamic thermal simulation program was selected as the main research tool, as it
has been tested for solar energy and building applications by many researchers and suitable
experimental facilities were not available.
A simple typical building in Pakistan with a solar cooling system was simulated. Optimum
values for key parameters were found by repeated simulations. It was concluded that the
system would be able to provide cooling when required without an auxiliary heat source, and
that an evacuated tube collector with a gross area of 12 m2, a collector flow rate of 165 kg/h,
and a storage tank volume of 2 m3 would provide satisfactory performance for a 3.52 kW
absorption chiller integrated with 42m3 single room. The results were in good agreement with
published results from other researchers.
Sensitivity analysis was carried out for the collector area, collector flow rate and storage tank
size. It was found that varying the collector area had the largest effect on system
performance, followed by varying the storage tank volume. Varying the collector flow rate
had the smallest effect.
It is recommended that solar cooling systems should be considered for Pakistan, and that
further research should be carried out into reducing building cooling loads, using surplus heat
for other loads, improving the performance of the proposed solar cooling system, and
comparing it with other systems such as photovoltaics.

8
Declaration
No portion of the work referred to in the thesis has been submitted in support of an
application for another degree or qualification of this or any other university or other institute
of learning.

9
Copyright Statement
i. The author of this thesis (including any appendices and/or schedules to this thesis) owns
certain copyright or related rights in it (the “Copyright”) and s/he has given The University of
Manchester certain rights to use such Copyright, including for administrative purposes.
ii. Copies of this thesis, either in full or in extracts and whether in hard or electronic copy,
may be made only in accordance with the Copyright, Designs and Patents Act 1988 (as
amended) and regulations issued under it or, where appropriate, in accordance with licensing
agreements which the University has from time to time. This page must form part of any such
copies made.
iii. The ownership of certain Copyright, patents, designs, trademarks and other intellectual
property (the “Intellectual Property”) and any reproductions of copyright works in the thesis,
for example graphs and tables (“Reproductions”), which may be described in this thesis, may
not be owned by the author and may be owned by third parties. Such Intellectual Property
and Reproductions cannot and must not be made available for use without the prior written
permission of the owner(s) of the relevant Intellectual Property and/or Reproductions.
iv. Further information on the conditions under which disclosure, publication and
commercialisation of this thesis, the Copyright and any Intellectual Property and/or
Reproductions described in it may take place is available in the University IP Policy (see
http://documents.manchester.ac.uk/DocuInfo.aspx?DocID=487), in any relevant Thesis
restriction declarations deposited in the University Library, The University Library’s
regulations (see http://www.manchester.ac.uk/library/aboutus/regulations) and in The
University’s policy on Presentation of Theses.

10
Acknowledgement
All praises to Almighty Allah who bestowed upon me the capabilities to complete this work.
I extend my sincerest thanks to my praise worthy supervisor Dr. Jonathan Dewsbury for his
precious time, valuable guidance, continuous support, constructive criticism, motivations and
incredible encouragements.
Finally, I am grateful to all of my family members who always support and pray for my
success. It is all because of their encouragements, prayers and support that enabled a
successful completion of this endeavor. I would also like to thank all of my colleagues and
friends for their continuous support.
Last but not least I am thankful to the University of Engineering and Technology, Lahore,
Pakistan for supporting me financially to carry on this research work

11
List of Publications
1. Muhammad Asim, Jonathan Dewsbury, Safwan Kanan, . TRNSYS Simulation of a
Solar Cooling System for the Hot Climate of Pakistan in SHC 2015, International
Conference on Solar Heating and Cooling for Buildings and Industry. 2015. 2-4
December, 2015, Turkey: Elsevier. (No publication details)
2. Safwan Kanan, Jonathan Dewsbury, Gregory F.Lane-Serff, Muhammad Asim,. The
Effect of Ground Conditions under a Solar Pond on the Performance of a Solar Air-
Conditioning System. in SHC 2015, International Conference on Solar Heating and
Cooling for Buildings and Industry. 2015. 2-4 December Turkey: Elsevier. (No
Publication details)
3. Safwan Kanan, Muhammad Asim, Rohan Kumar. A Simple Salt Gradient Solar Pond
Model for Lahore.Technical Journal, UET Taxila Pakistan, (Accepted, No Publication
details)

12
List of Tables
Table 1-1: Latest details of future electricity generation projects by fuel type ..................... 29
Table 2-1: Hydroelectric energy potential in Pakistan ......................................................... 39
Table 2-2: Solar energy application and types of collector used .......................................... 44
Table 3-1: Heat Index and its effects .................................................................................. 58
Table 3-2: Climate zones of Pakistan for comfortable temperature ..................................... 64
Table 3-3: Designed indoor (Td) globe temperature for selected cities ................................ 65
Table 3-4: Potential energy conservation areas ................................................................... 69
Table 4-1: History of solar thermal cooling development ................................................... 81
Table 5-1: Comparison of differences between experimental & TRNSYS simulation data 128
Table 6-1: Properties of materials assigned to walls and roof surfaces .............................. 156
Table 6-2: Room envelope heat conduction calculations ................................................... 159
Table 6-3: COP of absorption chillers ............................................................................... 160
Table 6-4: Pumps power and flow rates ............................................................................. 174
Table 6-5: Pipes size and flow rates................................................................................... 177
Table 6-6: Collector pump controller inputs ...................................................................... 178
Table 7-1: Comparison of simulated vs published results………………………………….197
Table 7-2: Summary of parameters used by researcher for parametric analysis……………202
Table 7-3: Sensitivity of storage tank volume on tank heat loss and internal energy and
collector efficiency………………………………………………………………………….205

13
List of Figures
Figure 1-1: Global energy source consumption growth % from 2012 to 2013 ..................... 23
Figure 1-2: Global energy source consumption growth from 2012-2035 .............................. 24
Figure 1-3: World primary energy demand projection ........................................................ 25
Figure 1-4: Pakistan’s primary energy consumption by fuel 2013 ........................................ 26
Figure 1-5: Electricity generation by fuel type 2015 ............................................................ 28
Figure 1-6: Electricity demand and supply 2012-19 ............................................................ 29
Figure 1-7: Electricity consumption by economic groups ................................................... 30
Figure 1-8: Activities most affected by power outage ......................................................... 31
Figure 2-1: Wind energy potential of Pakistan .................................................................... 37
Figure 2-2: Solar energy spectrum distribution ................................................................... 39
Figure 2-3: Solar energy balance on earth ........................................................................... 40
Figure 2-4: Solar insolation over Pakistan .......................................................................... 42
Figure 2-5: PV and solar thermal power systems power range and global irradiation .......... 43
Figure 2-6: Regions of world appropriate for solar thermal power plants ............................ 43
Figure 3-1: Geography of Pakistan ..................................................................................... 53
Figure 3-2: Administrative areas of Pakistan ...................................................................... 53
Figure 3-3: Area distribution of Pakistan ............................................................................ 54
Figure 3-4: Population distribution of Pakistan ................................................................... 54
Figure 3-5: Population density in 2010 ............................................................................... 55
Figure 3-6: Pakistan annual mean daily temperature ........................................................... 56
Figure 3-7: Pakistan normal mean heat index distribution ................................................... 58
Figure 3-8: Areas of moderate and severe heat wave frequency in South Asia .................... 60
Figure 3-9: ASHRAE standard comfort temperature zone .................................................. 61
Figure 3-10: Acceptable temperature ranges for naturally conditioned spaces ASHRAE 55
rev. 2003 ............................................................................................................................ 63
Figure 3-11: 30 years average monthly mean daily temperatures ........................................ 64
Figure 3-12: Climate zone map of Pakistan………………………………………………….68
Figure 3-13: Outside air and inside temperature with solution comparison during day time..71
Figure 3-14: Comparison of outside air and inside temperature with solutions at midnight...72
Figure 3-15: Initial cost of different solutions ..................................................................... 73
Figure 3-16: 10 years cost of different solutions ................................................................. 73
Figure 4-1: Schematic overview of solar electric cooling system ........................................ 77

14
Figure 4-2: Schematic diagram of vapour compression refrigeration system ....................... 78
Figure 4-3: Solar light spectrum used in a PV system ......................................................... 80
Figure 4-4: Overview of thermal cooling system ................................................................ 83
Figure 4-5: Solar energy collector’s application .................................................................. 84
Figure 4-6: Types of solar thermal collectors ...................................................................... 84
Figure 4-7: Construction of flat plate collector ................................................................... 85
Figure 4-8: Schematic diagram of compound parabolic collector ........................................ 86
Figure 4-9: Schematic diagram of evacuated tube collector ................................................ 87
Figure 4-10: Linear Fresnel reflector (Left) & compact linear Fresnel reflector (Right) ...... 89
Figure 4-11: Schematic overview of power tower (central receiver system) ........................ 90
Figure 4-12: Schematic of a parabolic trough collector ....................................................... 91
Figure 4-13: Parabolic trough collector tracking mechanism .............................................. 92
Figure 4-14: Schematic of a parabolic dish ......................................................................... 93
Figure 4-15: Yearly thermal performance of stationary and tracking collectors ................... 94
Figure 4-16: Schematic overview of solar absorption cooling system ................................. 96
Figure 4-17: Schematic diagram of solar adsorption system ............................................... 98
Figure 4-18: Desiccant cooling process .............................................................................. 99
Figure 4-19: Principle of desiccant cooling ......................................................................... 99
Figure 4-20: An illustration of solar assisted solid desiccant cooling system ..................... 100
Figure 4-21: A Solar assisted liquid desiccant cooling system .......................................... 102
Figure 4-22: Schematic view of solar ejector cooling system ............................................ 103
Figure 5-1: Building model and low zero carbon technologies analysis ............................ 122
Figure 5-2: Model diagram in TRNSYS simulation studio view ....................................... 124
Figure 5-3: TRNSYS simulation result plot overview ....................................................... 125
Figure 5-4: TRNBuild wall and windows types and area selection .................................... 126
Figure 5-5: TRNBuild wall type manager with construction materials .............................. 126
Figure 5-6: Climatic comparison between Lahore and Amritsar ....................................... 132
Figure 5-7: Amritsar daily mean temperature (EPW vs WMO) ......................................... 133
Figure 5-8: Lahore temperature comparison (WMO vs TMY2) ........................................ 134
Figure 5-9: Pakistan’s cities maximum average temperature from TMY2 .......................... 134
Figure 5-10: Pakistan’s cities average relative humidity from TMY2 ............................... 135
Figure 5-11: Pakistan’s cities average global horizontal radiation from TMY2 .................. 135
Figure 6-1: Typical single storey house in urban Punjab ................................................... 140
Figure 6-2: Typical single storey house in rural Punjab .................................................... 140

15
Figure 6-3: Model building location ……………………………………………………….141
Figure 6-4: Trnsys-3d two zone (room) model back and top views. ................................... 142
Figure 6-5: Trnsys-3d two zone (room) model front view .................................................. 142
Figure 6-6: Import of Tnsys3d model into simulation studio step-1 ................................... 143
Figure 6-7: Import of Trnsys3d model step- 2.................................................................... 143
Figure 6-8: After import of Tnsys3d model final window in simulation studio .................. 144
Figure 6-9: Parameters for heat transfer co-efficients......................................................... 146
Figure 6-10: Standard and user defined inputs ................................................................... 146
Figure 6-11: Building outputs ............................................................................................ 147
Figure 6-12: Room1volume, surface and areas calculated by TRNSYS ............................. 148
Figure 6-13: Properties of material assigned to external roofs ........................................... 149
Figure 6-14: Properties of windows assigned..................................................................... 150
Figure 6-15: Radiation and geometry modes ..................................................................... 152
Figure 6-16: Initial result, room 1 and room2 air temperatures .......................................... 153
Figure 6-17: Ambient and room 1 temperature comparison ............................................... 153
Figure 6-18: Ambient and room 2 temperature comparison ............................................... 154
Figure 6-19: Room1 air temperature with initial gain, infiltration, and ventilation ............. 155
Figure 6-20: ASHRAE standard materials assigned to walls, roof and floor ..................... 157
Figure 6-21: ASHRAE standard properties of windows 1001 ............................................ 157
Figure 6-22: Room 1 temperature after assigning walls and windows materials ................. 158
Figure 6-23: Solar cooling system ..................................................................................... 164
Figure 6-24: Evacuated tube collector TYPE 71 efficiency curve for I =1000 W/m2 .......... 165
Figure 6-25: Collector solar data input .............................................................................. 167
Figure 6-26: Operation of hot water storage tank ............................................................... 168
Figure 6-27: Tank inlet and outlet connections .................................................................. 169
Figure 6-28: Absorption chiller input and out connections ................................................. 170
Figure 6-29: Cooling coil connections ............................................................................... 172
Figure 6-30: Auxiliary cooler connections ......................................................................... 173
Figure 6-31: Pumps connection ......................................................................................... 174
Figure 6-32: Fan connections ............................................................................................ 175
Figure 6-33: Pipes connections .......................................................................................... 176
Figure 6-34: Weather data processor connections .............................................................. 177
Figure 6-35: Collector pump controller connection ............................................................ 180
Figure 6-36: Room air fan controller connections .............................................................. 181
16
Figure 6-37: Complete process diagram of solar cooling system ........................................ 182
Figure 7-1: Solar collector monthly yield (kWh) ............................................................... 185
Figure 7-2: Collector monthly and annual efficiency (%) .................................................. 186
Figure 7-3: Room monthly cooling load and solar energy availability (kWh) .................... 187
Figure 7-4: Ambient (Blue) and room (Red) temperature comparison (°C) ........................ 188
Figure 7-5: Tank heat loss (kWh) ...................................................................................... 189
Figure 7-6: Tank heat loss as percentage of energy collected (%).........................................189
Figure 7-7: Ambient and tank temperature with solar radiation available in July-August…190
Figure 7-8: Tank internal energy change (kWh) ................................................................ 191
Figure 7-9: Pipes heat loss to and from ambient air (kWh) ................................................ 192
Figure 7-10: Monthly Electrical Energy Load (kWh) ........................................................ 193
Figure 7-11: Auxiliary cooler heat rejected (kWh) ............................................................. 194
Figure 7-12: Chiller actual and rated COP ......................................................................... 194
Figure 7-13: Chilled water outlet temperature with the TRNSYS provided data file ......... 198
Figure 7-14: Chilled water outlet temperature with referenced data file ............................. 199
Figure 7-15: Energy balance of solar cooling system ......................................................... 200
Figure 7-16: Annual input and output energy distribution………………………………….200
Figure 7-17: Sensitivity of collector area and annual energy collected and efficiency…….204
Figure 7-18: Sensitivity of collector flow rate and annual energy collected and efficiency..204
Figure 7-19: Variation of maximum chilled water temperature and number of hours above set
point with collector area…………………………………………………………………….206
Figure 7-20: Variation of maximum chilled water temperature and number of hours above set
point with tank storage volume……………………………………………………………..207
Figure 7-21: Sensitivity of storage tank volume and maximum chilled water temperature and
number of hours above set point……………………………………………………………208

17
Abbreviations and Symbols
$ Dollar
£ Pound Sterling
Coefficient of Transmittance
€ Euro
µm Micro metre
3D Three Dimensional
A Area
ACH Air changes per hour
AEDB Alternative Energy Development Board
ASHRAE American Society of Heating Refrigerating and Air-Conditioning
Engineers
a-Si Amorphous Silicon
a-SiC Amorphous Silicon Carbide
a-SiGe Amorphous Silicon Germanium
a-SiN Amorphous Silicon-Nitride
BECP Building Energy Code of Pakistan
BEE Bureau of Energy Efficiency (India)
BLAST Building Load Analysis And System Thermodynamics
BP British Petroleum
CDA Capital development Authority (Islamabad)
CdS Cadmium Sulphide
CdTe Cadmium Telluride
CH4 Methane gas
CIBSE Chartered Institution for Building Services Engineers
CIGS Copper Indium Gallium Selenide
CIS Copper Indium Selenide
CLFR Compact Linear Fresnel Reflectors
CNG Compressed Natural Gas
CO2 Carbon dioxide
Coll. Collector
COP Coefficient of Performance
CP Specific Heat at Constant Pressure
CPC Compound Parabolic Collectors
CPV Concentrating Photo Voltaic
CRS Central Receiver System
c-Si Crystalline Silicon
CSP Concentrating Solar Power
CSU Colorado State University

18
CTZ California Climate Zones
Cu2S Cuprous sulphide
CuInSe2 Copper Indium Diselenide
CWEC Canadian Weather for Energy Calculation
DC Direct current
DDY Design Day Data
DHW Domestic hot water
DNI Direct Normal Irradiation
DOE Department of Energy (US)
DSG Direct Steam Generation
DSSC Dye-sensitised solar cell
E East
ECBC Energy conservation building code(India)
EME College of Electrical and Mechanical Engineering (Pakistan)
ENERCON National Energy Conservation Centre (Pakistan)
EPW Energy Plus Weather
ESTIF European Solar Thermal Industry Federation
ETC Evacuated Tube Collectors
ETP Energy Technology Prospective
FATA Federally Administrated Tribal Area
FPC Flat Plate Collector
GaAs Gallium Arsenide
GBP British Pound Sterling
Gt Giga ton
GUI Graphic User Interface
g-value Solar energy transmittance of transparent material (glass) (%)
GW Giga Watt
GWh Giga watt hour
GWp Giga Watt Peak
GWth Giga Watt Thermal
H2O Water
HI Heat Index
hr Hour
HVAC Heating Ventilation and Air Conditioning
HW Heat Wave
HX Heat exchanger
I Incident solar Insolation
IAM Incidence Angle Modifiers
ID Identification
IEA International Energy Agency
IES Integrated Environment Solution

19
In Inlet
ISO International organisation for standardisation
IT Total incident solar Insolation
IWEC International Weather for Energy Calculation
J Joule
k Kilo
K Kelvin
kg Kilo gram
kJ Kilo joule
km Kilo metre
KPK Khyber Pakhtun Khwa (Pakistan)
KSK Kala Shah Kaku (Lahore)
kW Kilo Watt
kWC Kilo Watt cooling
kWh Kilo Watt Hour
LED Light Emitting Diode
LEED Leadership in Energy and Environmental Design
LFR Linear Fresnel Reflectors
LiBr Lithium Bromide
LPG Liquefied Petroleum Gas
m Mass flow rate / metre
m2 Square metre
m3 Cubic metre
MENR Ministry of energy and natural resources (Turkey)
mh Fluid flow rate to and from heat source
MJ Mega Joule
mL Fluid flow rate to and from load source
Mt Mega ton (metric)
MW Mega Watt
MWh Mega Watt Hour
MWP Mega Watt Peak
N North
N2O Nitrous Oxide
NASA National Aeronautics and Space Administration
NCDC National Climatic Data Centre
NED Nadirshaw Edulji Dinshaw (Pakistan)
NEPRA National Electric Power Regulatory Authority (Pakistan)
NESPAK National Engineering Services Pakistan
NGO Non-Governmental Organisation
NH3 Ammonia

20
NIST National Institute of silicon Technology (Pakistan)
nm Nano metre
NOAA National Oceanic and Atmospheric Administration
NOx Nitrogen Oxides
NREL National Renewable Energy Laboratory
NSRDB National solar radiation date base (US)
NUST National University of Science and Technology (Islamabad)
OCA Optical Coupling Agent
Out Outlet
Pa Pascal
PCAT Pakistan council for appropriate technologies
PCRET Pakistan Council for Renewable Energy Technologies
PCSIR Pakistan Council for Scientific and Industrial Research
PEC Pakistan Engineering Council
PMD Pakistan Meteorological Department
PMISP Prime Minister’s Initiative for Solar Power (Pakistan)
PMV Predicted mean vote
PPD Predicted percentage of dissatisfaction
PSVEP Parliamentarian Village Electrification Program (Pakistan)
PV Photo Voltaic
Qc Condenser heat rate
Qe Evaporator heat rate
Qg Generator heat rate
QS Solar energy incident on panel
Qu Useful heat energy rate
RC Reinforced Concrete
R-value Thermal resistance of insulator
SHGC Solar Heat Gain Coefficient
SHS Solar Home System
SOx Sulphur Oxides
SRCC Solar Rating and Certification Commission
SSE Surface meteorology and solar energy (NASA)
SWH Solar Water Heating
Ta Air temperature
Tamb Ambient temperature
Tc Comfortable Temperature
Tc Collector temperature
Td Design Indoor Temperature
TEG Tri-Ethylene Glycol
Tenv Environment temperature
TESS Thermal Energy Systems Specialists

21
Tg Indoor Globe Temperature
TH Upper Input temperature
Ti Indoor Temperature
TIN Temperature for high limit monitoring
TiO2 Titanium Dioxide
TL Lower Input temperature
TMAX Maximum Input temperature
TMY Typical Meteorological Year
TO Operative temperature
TOLT Outdoor Long Term Temperature
TR Ton of Refrigeration
Tr Mean radiant temperature
TRNSYS TRaNsient SYstem Simulation
TRY Test reference year
TWh Tera Watt Hour
TWhth Terra Watt Hour Thermal
UAE United Arab Emirates
UET University of Engineering and Technology (Pakistan)
UK United Kingdom
UN United Nation
UNEP United Nation Environment Program
USA United states of America
USAID United States Agency for International Development
USD United States Dollar
U-value Overall heat transfer co-efficient (W/m2.K)
VE Virtual Environment
W Watt
w Work rate
WMO World Meteorological Organization
wPV Photo voltaic work rate
wT Total work rate
γI Input control function
γo Output control function
ΔT Change in Temperature
ΔTH Upper dead band temperature difference
ΔTL Lower dead band temperature difference
η cool Cooling efficiency
ηsol.cool Solar cooling efficiency
θc Acceptance Angle
μc-Si Microcrystalline Silicon
22
Chapter 1: Introduction
1.1 Background
Titled “Solar Cooling”, although this study has been done for the climatic conditions of
Lahore, Pakistan, it is expected that the results will also be useful for other countries in the
south Asia region which have similar climate and building construction styles.
The main aim of this work (as explained in more detail in later sections of this chapter) is to
investigate the potential and operational feasibility of a solar cooling system for buildings in
the context of Pakistan’s climate and location. The thermal performance of a solar collector,
solar energy availability, building cooling load profile with existing construction materials
and performance of an absorption chiller were investigated.
This chapter gives brief information about world energy consumption and a background to
the energy crisis in Pakistan, current status and future electricity generation plans to
overcome the energy crisis through the contribution of renewable energy in primary energy
consumption. The future electricity demand and impact of the energy crisis on domestic users
is also presented. At the end of the chapter, detailed aims and objectives, as well as the
structure of the thesis, are given.
1.2 Energy
Energy is an important commodity for continued human development and economic growth.
The availability of sufficient, affordable energy is a vital key to eradicating poverty,
improving human welfare and raising living standards worldwide. Historically, fossil fuels
have been the main source of energy supply and have contributed a major part in fulfilling
human energy demands. Renewable energy sources have also been important for humans
from early times. For example, biomass has been used for heating and cooking, and wind
energy for transport and, later, for electricity production [1, 2].
The current sources of energy, with a major contribution from fossil fuels, have three main
concerns: depletion of resources, environmental impacts and the security of energy supply.
The increasing demand and limited reserves have led to the exploration of alternative sources
of energy. The continuous consumption of fossil fuels has had various impacts on the natural
environment. The global implications include global warming and local impacts, such as an
effect on human health and the ecology. Onshore oil and gas drilling, exploration and

23
production waste (fluids and solids) have contaminated the surroundings. Coal mining and
exploration has resulted in land degradation through mine fires and the impact of mining on
forest areas is of particular concern. Nuclear energy is linked to real threats of radioactive
emissions and is also of concern due to its possible association with military use, the impact
of mining nuclear fuel and nuclear waste hazards. Renewable energy sources (biomass, solar,
wind, geothermal and hydropower) are cleaner energy sources. Renewable energy sources
have the potential to provide energy with zero or almost zero emissions of air pollutants and
greenhouse gases [1, 2].
1.3 World Energy
The BP Statistical Review of World Energy 2014 reveals that the world’s primary energy
consumption grew by 2.3% in 2013 compared to the previous year. As such, the global oil,
gas, and coal reserves at the end of 2013 are predicted to last 53.3, 55.1 and 113 years,
respectively, at current production rates. The affirmed reserves are quantities that geological
and engineering information indicate, with reasonable certainty, can be recovered in the
future. The global consumption growth rate (%) from year 2012 to 2013, of oil, gas and other
sources is shown in Figure 1-1[3].
Figure 1-1: Global energy source consumption growth % from 2012 to 2013 [3]
Figure 1-1 shows that renewables are growing annually at a higher rate than other fuels.
Renewables now account for 2.7% of global energy consumption, up from 0.8% a decade
ago[3].
0
2
4
6
8
10
12
14
16
18
oil Gas Coal Nuclear Hydel Renewables
% C
han
ge
Global energy source consumption growth rate from 2012 to 2013

24
According to BP’s Energy Outlook 2035, published in January 2014, world primary energy
demand is expected to increase by 41% from 2012 to 2035, with an annual average growth
rate of 1.5%. The major consumer is expected to be the residential sector, in the form of
electricity consumption. Global CO2 emissions from energy use are growing at 1.1% annually
and are expected to double from 1990 to 2035[4]. The projected global annual average
consumption growth rate (%) of different fuels from 2012-2035 is shown in Figure 1-2.
Figure 1-2 shows that, by 2035, the annual growth rate of renewables will be higher than all
other fuels.
Figure 1-2: Global energy source consumption growth from 2012-2035[4]
According to the International Energy Agency’s (IEA) World Energy Outlook 2013, world
energy demand will increase by 33% by 2035 with reference to year 2011. There will be an
increase in energy source consumption of oil by 13%, coal by 17%, natural gas by 48%,
nuclear by 66% and renewables by 77%. In the buildings sector, energy use will grow at an
average rate of 1% per year till 2035 and households will account for almost 60% of the
increase in energy demand. The increase will be in the form of electricity used for lighting,
space heating and cooling[5].
Energy-related CO2 emission rise will be 20% by 2035, and most increase in energy will be
in electricity demand. About half of the net increase in electricity will be generated by
renewables and the total share of renewables in electricity generation will be about 30% by
2035. The share of renewables in primary energy will be increased to 18% by 2035 under the
new policies scenario, as shown in Figure 1-3[5].
0
1
2
3
4
5
6
7
oil Gas Coal Nuclear Hydel Renewables
An
nu
al
av
erag
e g
ro
wth
(%
)
Global energy source consumption average growth rate projection 2012-2035

25
Figure 1-3: World primary energy demand projection [5]
Although this is a significant proportion, it will take many years for renewables to surpass the
proportion of fossil-based energy under current policy. The new policies scenario takes
account of policy commitments to reduce greenhouse gas emissions.
Solar energy is an emerging source of energy with worldwide potential. It is seen to have the
potential to contribute a major proportion of renewable energy sources in the future. Solar
energy is not a new idea and has been implemented effectively for many years. Solar energy
applications, like domestic hot water and space heating, have proven economic and useful
compared to conventional energy systems for these purposes [6]. Solar energy has many
benefits: it cannot be monopolised by a few countries, as with fossil fuels, for example. It has
no conversion processes producing emissions and can be easily integrated into buildings.
Solar energy could be the largest source of energy by 2050 [6].
1.4 Pakistan and Energy
The availability of energy in any country is linked with its economic and social strength.
Pakistan is an energy-deficient country, wherein the majority of the population has no
provision of basic energy facilities such as electricity and gas [2]. Pakistan is also facing
0
200
400
600
800
1000
1200
1400
1600
1800
2011 New Policies 2035 Current Policies 2035
Other Renewables Bioenegy Hydro Nuclear Gas Oil Coal
En
erg
y D
em
an
d (
TW
h)
World primary energy demand

26
serious threats due to global warming. Under the United Nations Environment Program
(UNEP) [2], Pakistan’s thousand kilometre-long coasts are classified as particularly
vulnerable to the effects of sea level rise.
According to BP’s Statistical Energy Review 2014, the primary energy consumption of
Pakistan during 2013 was 809.33 TWh, whereas for the UK it was 2360 TWh for the same
duration. Pakistan’s CO2 emission was 166.41Mt in 2013. The CO2 emission was 0.9321
tonnes per capita in 2010 [3]. The primary energy consumption per capita was 5.60 MWh in
2011, whereas, in developed countries like the UK, it was 34.60 MWh for the same period
[7]. Pakistan’s CO2 emission of electricity generation and transmission is 0.4733kg/kWh and
0.1419kg/kWh, respectively. Electricity consumed emissions are 0.01798g/kWh and
0.00316g/kWh for CH4 and N2O, respectively[8].
The primary energy consumption by source for year 2012-13 is shown in Figure 1-2. It is
clear that most of the energy consumed is from fossil fuels and the contribution of renewables
other than hydroelectric is negligible (less than 0.05% of total)[3]. Biomass consumption is
excluded, because reliable statistics of its use are not available.
Figure 1-4: Pakistan’s primary energy consumption by fuel 2013[3].
Figure 1-4 shows that most of the primary energy is shared by oil, coal, and natural gas, but
Pakistan has few reserves of fossil fuel. Pakistan had oil and natural gas reserves of 342
million barrels and 803 billion m3, respectively, as of the end of December 2013. These
reserves will last for 15 and 27 years respectively under the current production rate[9]. Oil,
coal, and gas are imported to meet requirements and, during the year 2013-14, 66% oil and
50%
32%
10%
6% 2%
Pakistan's primary energy consumption by fuel (2013)
GAS OIL HYDRO ELECTRIC COAL NUCLEAR

27
45% coal of total consumption were imported. The natural gas domestic production is 66% of
total consumption and different plans are proposed for the import of natural gas to meet
demand [10].
1.4.1 Electricity Generation History
At independence in 1947, Pakistan had 60MW of electricity generation capacity. Electricity
supply has fallen short of demand due to rapid industrialisation, population growth, and
urbanisation. The supply is often unable to meet demand due to poor governance, weak
institutions, incompatible power tariffs and poor load management and future planning. The
national grid system still supplies electricity to only 65% of the total population. The
electricity supply system is not reliable to maintain a consistent supply to the consumers[11].
The first major electricity shortage crisis was triggered in 1994, when the country was facing
a shortage of 2000 MW between peak demand and supply. Under the new power policy in
1994, an attractive incentive was given to electricity generation companies to overcome the
demand and supply gap. This policy was successful and the country’s generation was more
than demand till the end of 2006[12].
In 2005, the planning commission of Pakistan announced a plan vision for 2030 with key
targets for future energy of the country. Considering energy as a key factor for the
development and sustainability of the country, a detailed plan was made to make Pakistan
self-sufficient in power and reduce its dependence on a single source, especially imported
fossil fuels. This was the first policy to utilise renewable energy technologies (other than
hydroelectric power) in Pakistan to provide an energy mix in the national energy supply
system. It was estimated to add a minimum of 9,700 MW (5%) of total electricity generation
capacity from renewables (hydroelectric , wind and solar) by 2030 [13, 14].
The current power policy was announced in 2013, aiming to develop highly efficient power
generation, transmission, and distribution in a sustainable and economical manner. Special
consideration was given to renewable energy utilisation and wind and solar energy-based
electricity generation projects were initiated: 3432 MW of wind power projects are planned
to be completed by the end of 2016; 341MWP of solar energy projects are planned to be
completed by the end of 2015 and hydroelectric power projects of total capacity 3514 MW
are planned to be completed by the end of 2017 [15].
28
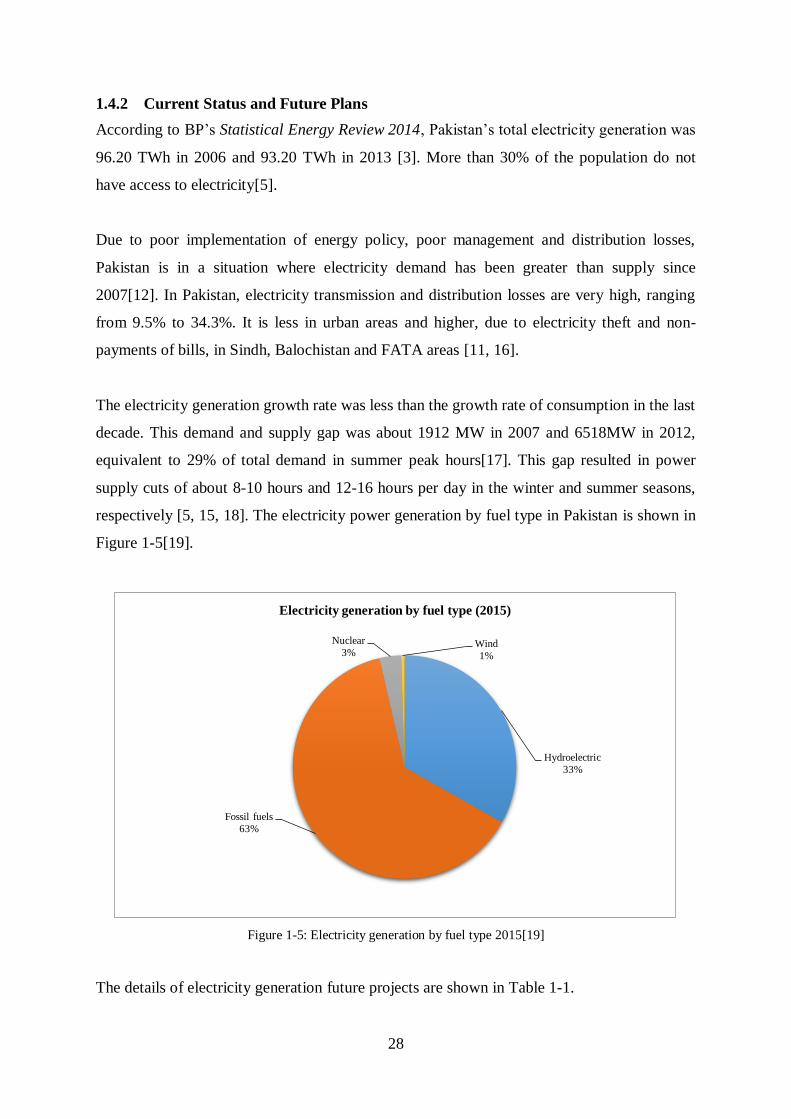
1.4.2 Current Status and Future Plans
According to BP’s Statistical Energy Review 2014, Pakistan’s total electricity generation was
96.20 TWh in 2006 and 93.20 TWh in 2013 [3]. More than 30% of the population do not
have access to electricity[5].
Due to poor implementation of energy policy, poor management and distribution losses,
Pakistan is in a situation where electricity demand has been greater than supply since
2007[12]. In Pakistan, electricity transmission and distribution losses are very high, ranging
from 9.5% to 34.3%. It is less in urban areas and higher, due to electricity theft and non-
payments of bills, in Sindh, Balochistan and FATA areas [11, 16].
The electricity generation growth rate was less than the growth rate of consumption in the last
decade. This demand and supply gap was about 1912 MW in 2007 and 6518MW in 2012,
equivalent to 29% of total demand in summer peak hours[17]. This gap resulted in power
supply cuts of about 8-10 hours and 12-16 hours per day in the winter and summer seasons,
respectively [5, 15, 18]. The electricity power generation by fuel type in Pakistan is shown in
Figure 1-5[19].
Figure 1-5: Electricity generation by fuel type 2015[19]
The details of electricity generation future projects are shown in Table 1-1.
Hydroelectric
33%
Fossil fuels
63%
Nuclear
3% Wind
1%
Electricity generation by fuel type (2015)

29
Table 1-1: Latest details of future electricity generation projects by fuel type [19]
Completion Year Fuel Capacity (MW)
2014-2018
Gas 3147
Oil 425
Solar 1000
Hydroelectric 4222
Coal 7560
Nuclear 600
Wind 650
Total/ Fossil fuels 17604/11132
Figure 1-5 shows that, currently, most of the electricity is generated by fossil fuels and the
contribution of renewables is considerably less, other than hydroelectric. Table 1-1 shows the
future electricity generation projects, including wind, solar and hydroelectric. By the year
2018, the contribution of renewables will be sizeable, but the major contribution will still be
by fossil fuels. According to the National Electric Power Regulatory Authority (NEPRA)
2014 report, under current policy and planning, the projected electricity peak demand and
supply in Pakistan to year 2019 is shown in Figure 1-6[20].
Figure 1-6: Electricity demand and supply 2012-19 [20]
0
5000
10000
15000
20000
25000
30000
2012 2013 2014 2015 2016 2017 2018 2019
Actual (2012-14) and projected (2015-19) electricity peak demand and supply
Supply (MW) Demand (MW)

30
Figure 1-6 shows that demand is continuing to exceed supply, despite supply being
approximately double from 2012 to 2019. The annual average growth rate of electricity
consumption is 14.5%, which has been more than supply since 2007 [20].267
1.5 Impact of the Energy Crisis
In Pakistan, the domestic sector is the major consumer of electricity and the current crisis has
a direct impact on domestic consumers. Electricity consumption share by different sectors in
the country for year 2013-14 is shown in Figure 1-7.
Figure 1-7: Electricity consumption by economic groups [16]
The supply of natural gas also falls in the winter season, causing an energy shortage for
domestic heating and cooking facilities. Natural gas supplies also fall short due to use in
Compressed Natural Gas (CNG) based motor vehicles, urea production, power generation,
and textile industry consumption. In the summer season, energy demand increases, mainly
due to air conditioning, household appliances (refrigeration and deep freezers) and tube wells
(irrigation water for rice crop) [11].
The deficiency of energy supply has affected not only people’s psychology and health, but it
has also severely damaged economic activities across the country[21]. High level stress and
Domestic, 46.9%
Commercial, 6.7%
Industrial, 28.9%
Agriculture, 11.4%
Public Lighting, 0.5%
Others, 5.5%
Electricity consumption by economic group 2013-14

31
sleep deprivation among people are also observed in the population, as their daily schedule is
heavily influenced by planned power outage. An increase in the crime rate is also associated
with planned and unplanned power outage. The other impacts include closure of healthcare
facilities and other services, which disrupts the everyday life of millions [21].
A study carried out in 2013 showed that the overall power outage cost to urban areas’
domestic consumers alone was estimated at GBP 1.30 billion per annum. The most affected
households belong to the income group from GBP 0-235 per month; those have no other
alternative supply system. This group constitutes 57% of the country total urban population.
The activities most disturbed by power outage, according to Pasha’s classification, are shown
in Figure 1-8[17].
Figure1-8: Activities most affected by power outage [17]
The most important activity affected is the heating /cooling used to maintain comfort inside
buildings. This is basic facility which is required most of the time inside buildings to live in.
The study has shown that a high percentage (42%) of households do not have alternate or
self-generation facilities. The annual average power outage cost per residential consumer is
£207 in terms of direct spoilage and adjustment costs. The average outage cost per kWh for a
residential consumer is £0.18. Residential customers’ average expenditure on electricity
jumped from 5% to 16% of total annual expenses after 2007, compromising basic necessities.
25%
18%
17%
15%
13%
8%
2% 2%
Activities most affected by power outage
Cooling/Heating
Studies (home work )of childern
Preparation for work/school
Regular household
work(cooking,cleaning)
water shortage
income generating activities (home
based)
Social activities
Entertainment, Leisure

32
The worst time of the year for power outage is summer and on Sundays, Mondays and
Fridays. About 29% of consumers showed willingness to pay above the current tariff, to
obtain a more reliable electricity supply[17].
Recent study shows that solar cooling systems in hot climates (Riyadh and Jakarta) can make
a significant contribution to reducing primary energy consumption. A solar energy-based
cooling system can reduce primary non-renewable energy consumption and CO2 emissions
by 30-79%, with a solar fraction of 22-80%. [22]. In European climates (Germany and
Spain), the use of solar thermal and solar electric systems can save 40-60% of primary energy
consumption [23].
Mateus and Oliviera [24] established that for single family house, solar integrated system
with 20-80% solar fraction is more economical and profit able than conventional ones for
south European locations.
According to European Solar Thermal Industry Federation (ESTIF) report on solar thermal
markets in Europe, trends, and market statistics 2014, single family houses are currently
largest market sector using thermal equipment. In European region the share of single family
houses is 40-46% and for multi-family houses its 27-29% [25].
1.6 Conclusion
Energy demand is increasing globally, including in Pakistan. Most of the energy resources
are based on fossil fuels. These fuels are damaging the environment and causing global
warming. To meet the energy demand without any or with minimum environmental damage
and, to address the issue of limited fossil fuel resources, policies have been recommended to
increase the share of renewable energy resources for clean and sustainable development.
Pakistan has also faced an energy crisis over the last few years and it is highly likely this
crisis will continue for years to come unless it is addressed properly. One of the major
reasons of the energy crisis is dependency on fossil fuels and its imports, as domestic
production is considerably less than requirements. In the past, no major project and plan has
been executed to reduce the dependency on fossil fuels by using alternative resources to deal
with the energy crisis.
In Pakistan the use of renewables for the primary energy and electricity generation is
negligible, except for hydroelectric power generation. To address the current energy crisis

33
and meet future energy demands, renewables will be a suitable option. The use of renewables
is clean and could provide a long-term solution to Pakistan’s energy issues, along meet the
global goal of decreasing CO2 emissions.
The energy statistics data showed that the use of solar energy is negligible in Pakistan’s
primary energy mix. There is a need for long-term and consistent plans and policies to meet
the country’s energy requirements, along with promotion of clean renewables, especially
solar energy. The potential of solar energy and its usage in Pakistan is described in detail in
Chapter 2.
The domestic sector is the major consumer of electricity and the electricity crisis has a direct
impact on domestic consumers. Electricity shortage has a major effect on comfort
(heating/cooling) in buildings. It is the worst in summer, when cooling is required due to the
high ambient temperature. There is need for a system which works to provide cooling and
heating during summer and winter. Solar energy-based systems are a reliable way of meeting
energy demand for lighting, cooling, and heating and help to reduce CO2 emission and
dependency on imported fuels[26] as the potential of solar energy is highest than any other
source of energy (Section 2.2).
1.7 Aims and Objective
The aim of this research is to investigate the potential of a solar powered cooling system and
the feasibility of achieving comfort in buildings in Pakistan.
The objectives of this work are to:
Investigate the energy scenario of Pakistan with respect to the electricity crisis, future
energy plans, and the potential and current status of renewable energy resources
application.
Carry out a detailed study of Pakistan’s solar energy potential, the annual and monthly
average solar insolation values for main cities and its current status of application.
Study climatic conditions, comfort temperatures, building energy consumption and
codes and possible techniques for improved efficiency in current building designs.
Carry out a literature review of photovoltaic systems, solar thermal systems and heat-
driven, low-energy cooling systems.

34
Design and analyse the building 3D model with current construction materials in
Pakistan and the simulation of a solar powered cooling system using suitable
simulation program.
Examine the simulation results, validation of input data, calculations, and results of
the solar cooling system with overall recommendations of solar cooling system
effectiveness to achieve building comfort in Pakistan.
1.8 Structure of the Thesis
The thesis has eight chapters and begins with an introduction, chapter 1, providing an
overview of world energy and a detailed analysis of current and future electricity demand and
generation in Pakistan. In addition, the generation based on different fuel types and effect of
current energy shortage crisis is also presented. Finally, aims and objectives of this research
are given.
Chapter 2 is about renewable energy resources in Pakistan. Renewables’ potential and the
application of solar energy in specific are presented. Institutional infrastructure for promotion
of renewables is also reviewed. Status and the application suitability of solar energy systems
in Pakistan are presented.
In chapter 3, climate and building energy use in Pakistan is investigated in detail. The mean
maximum temperature, thermal extremes, seasonal distribution, and comfort conditions are
examined. The current building energy code of Pakistan is analysed in terms of energy
efficiency. A United Nations project for energy efficiency improvement for existing houses
in Pakistan is also discussed and a conclusion is drawn from that project’s findings.
In chapter 4, solar energy cooling systems are reviewed. Efficiency, types, and the current
status of PV systems and IEA future targets are analysed. Solar thermal collector systems are
described in detail and different cooling systems suitable for solar thermal energy application
are described. A summary of application of solar cooling system in hot climates is also
presented. Status of solar cooling system in Pakistan is also reviewed.
In chapter 5, a detailed literature about experimental and simulation studies of solar cooling
system are presented. Solar energy systems and building energy simulation programs are

35
reviewed. Program suitable for a solar cooling system integrated with a building model is
studied in detail. A conclusion is drawn for the selection of a suitable simulation program.
Weather data types are reviewed and suitability of each data type with the different energy
simulation program is discussed. Weather data files available for Pakistan cities are also
analysed and data are selected to model typical weather in summer. A conclusion is drawn for
the selection of data to be used in the simulation.
Chapter 6 is about the building model, a description of solar cooling components and
operating parameters. Initial simulation results and modifications in building materials are
also presented. Mathematical calculations for operating parameters of the solar cooling
system are carried out and used to estimate simulation initial parameters.
In chapter 7, the final results of simulations, carried out for a typical building model with a
solar cooling system, are given. All the results are discussed in detail with results validation
and parametric sensitivity analysis. A conclusion is drawn regarding the feasibility aspect of
solar cooling in Pakistan.
Chapter 8 is the final chapter, results are summarised and conclusions, general discussions
with recommendations, are presented. The possible scope of further work, which will be
valuable to carry out, is expressed.

36
Chapter 2: Renewable Energy Resources in
Pakistan
2.1 Introduction
In chapter 1 it was shown that fossil fuels (oil, coal, and natural gas) are a major source for
primary energy consumption in Pakistan. This is causing environmental damage due to
emissions of carbon dioxide and other gases promoting global warming and disturbing
climatic conditions. Energy demand and prices are consistently rising and volatility has
caused a severe energy crisis in Pakistan. Many techniques and technologies are used to
convert renewable energy into a useable energy form for environmental and climate
protection. At present, the use of renewable technologies in Pakistan is small as compared to
other sources of energy. Only hydroelectric energy is being used, whose relative share is
decreasing in primary energy. There is a need to increase the use of renewable and
sustainable energy resources like solar, wind and hydroelectric energy resources in Pakistan.
Pakistan is enriched with renewable energy resources; an overview of the potential of
renewables for current and future use in Pakistan is described in the following sections.
Related to this research, solar energy will be discussed in detail.
2.2 Renewable Energy Potential
Pakistan has sufficient potential for wind, hydroelectric and solar energy to meet the
country’s present and future energy demands [2, 27]. At present the share of renewables is
very low (except in the case of hydroelectric energy) compared to the use of fossil fuel based
energy systems. The Pakistan government is making an effort to promote renewable energy
to increase the share of renewable energy in the country’s energy mix [2, 28].
For residential applications at a micro level in remote or undeveloped areas, the viable and
sustainable options are off-grid hydroelectric, solar and wind power systems. These options
are sufficient for electricity and cooking needs and would help to reduce de-forestation [29].
2.2.1 Wind Energy
In Pakistan the potential areas for wind energy are very limited as shown in Figure 2-1.
Pakistan is rich in wind energy only in the coastal areas of Sindh, Balochistan and some
Northern areas. One part of the coastal area in Sindh is only 60 km wide and 170 km long and

37
has the potential for about 60,000 MW of capacity. The annual average wind speed of this
corridor is from 5.9 to 7.1 m/s. Most of the remote villages in coastal area can have electricity
through micro wind turbines. The first wind energy project with 6 MW of capacity was
installed in 2009 and the installed capacity is now 106 MW [28, 30].
According to the Alternative Energy Development Board (AEDB), 5 wind farms with a total
power capacity of 255.4 MW are operational and 9 farms with 479 MW of capacity are under
construction. Fourteen projects 814 MW of capacity are in the process of being planned and
there are no details of the completion time for these projects [30].
Figure 2-1: Wind energy potential of Pakistan [27]
Wind energy associated environmental issues such as noise, effects on animals, deforestation
and soil erosion and visual impact cause concerns about utilising it. Variation in wind speed
and inconsistent power output are considered drawbacks for the promotion of wind energy
[31].

38
In Pakistan, the availability of wind energy is less during the 8 months from September to
April. Capacity from the available wind is significantly low, with an annual average of 0.20-
0.25 being quoted by AEDB for Pakistan [2].
The data presented above for wind energy shows that wind energy is limited to a small area
of the country. The annual available capacity is much less and its contribution to meet the
peak demand would not be dependable. Wind energy cannot be the main source of electricity
generation.
2.2.2 Hydroelectric Energy
Pakistan has identified a potential of about 60,000 MW of hydroelectric power, which can be
harvested. About 86% of this hydropower potential is still untapped. The total installed
capacity by the end of June 2014 was only 7097 MW. In 1960 the share of hydroelectric was
70% of the total electricity generation capacity whereas it was only 30% in 2014. The cost of
hydroelectric electricity generation is lower and it is the cheapest source of energy than any
other source in Pakistan[28]. The availability of hydroelectric energy depends on seasonal
variation. It also depends upon reservoir levels and in flow and out flow from reservoirs [28].
According to an economic survey of Pakistan 2013-14, ninety-seven micro hydroelectric
projects with a total capacity of 758 MW are being planned for different locations around the
country; feasibility studies and construction are being carried out. The micro hydropower
projects with a capacity of about 110 MW, have been operating in different parts of the
country [32].
Hydroelectric energy projects could be a source for future clean energy. High initial costs, the
length of time to build dams and environment damage linked with hydroelectric energy have
raised concerns about the implementation of such projects. The main hydroelectric energy
sites in Pakistan lie in earthquake danger zones and since 2005 earthquake investment risks
have discouraged national and international investors from initiating large capacity projects
for hydroelectric energy. The Indus water treaty with India has involved a lot of risks and
delays in project initiation. The hydro politics (rift among provinces) in Pakistan regarding
construction of larger hydroelectric power based dams is also a major hurdle in addition to
new capacities [33].
The hydroelectric energy potential of Pakistan is shown in Table 2-1.

39
Table 2-1: Hydroelectric energy potential in Pakistan [34]
Description
Project Under Implementation Projects with
Feasibility Study
Completed
(MW)
Projects
with Raw
Sites (MW)
Total
Resources
(MW) Public
Sector (MW)
Private Sector (MW)
Province
Level
Federal
Level
Total 23309 468 12742 4286 18751 59796
The data for hydroelectric energy shows that sufficient potential for clean and cheap energy
exists. The potential could provide sustainable energy to meet future demands. High initial
costs, political rifts, the Indus water treaty with India, security risks and environmental issues
are major concerns when considering harnessing hydroelectric energy potential.
2.2.3 Solar Energy
Solar energy is the most abundant renewable energy resource on earth and it is available for
use in its direct (solar radiation) and indirect (wind, biomass, hydro, ocean) forms. The
energy radiated by the sun is around 5% ultraviolet light, 43% visible light and 52% infra-red
light as shown in Figure 2-2 [35]. The solar radiation spectrum spans a wide range of
wavelengths, and resembles black body radiation at 5500K.
Figure 2-2: Solar energy spectrum distribution [35]

40
The black body radiation spectrum is shown by a black solid line in Figure 2-2.Most shorter
wavelength 0-400 (nm) ultraviolet radiation is absorbed in the atmosphere. Water vapour and
carbon dioxide absorbs longer wavelength energy while dust particles scatter more radiation,
dispersing some of it back into space. Clouds also reflect radiation into space [36]. The
energy balance of the earth, based on the incoming solar radiation, is explained in Figure 2-3.
Figure 2-3: Solar energy balance on earth [36]
Considering all these factors, around 52% of the incoming radiation energy, 700 Million
TWh annually, reaches the earth’s surface as solar radiation [37]. The global annual energy
consumption in 2014 is approximately 0.156 Million TWh which is only a small fraction
(0.02%) of the solar energy availability [38].
Sunlight reaches Earth’s surface directly and indirectly by numerous reflections and
deviations in atmosphere. On clear days, direct irradiance represents 80-90 % of the solar
energy reaching the earth’s surface whereas, on a cloudy or foggy day, the direct component
is zero. The indirect or diffused radiations are received on earth after its direction has been
changed by scattering the atmosphere. The direct component of solar irradiance is of the

41
greatest interest for high temperature solar thermal systems because it can be concentrated on
small areas using mirrors or lenses, whereas diffuse components cannot be. For concentrating
solar rays, clear sky is required, which is usually in semi-arid areas or regions with hot
climates [39, 40].
Solar energy systems can be used anywhere on the earth but some regions are better than
others. Pakistan is richer with solar energy than other renewable energy sources. The
available estimated solar energy potential of Pakistan is about 2900GW [the source is not
clear whether it is average or peak available capacity[41].
Solar energy can provide a power supply all over the country even in remote areas. Solar
energy available in Pakistan is sufficient for use all year in summer and winter seasons for
both cooling and heating with small and large scale applications. A comparison of solar and
wind energy prospects indicates that solar energy has an advantage over wind energy for a
number of reasons including potential, availability and acceptability by locals. Solar energy is
much more economical than wind energy for Pakistan [2].
Pakistan can take advantage of using solar energy technologies. This energy source has wide
and uniform distribution, throughout the country. Detailed solar energy maps of Pakistan and
the world are shown in Appendix A. A solar energy map of Pakistan is shown in Figure 2-4.
The mean global insolation on a horizontal surface in Pakistan is about 4-6 kWh/m2day with
enough sunshine hours (10-12) required for harnessing solar energy. The south western part,
from Baluchistan, is richer in solar energy with annual average global insolation of 5.1 - 6.0
kWh/m2/day with annual average daily sunshine hours of 8 - 10 hours. These are favourable
conditions for photovoltaic and solar thermal applications. The global insolation for district
cities in Pakistan is listed in Appendix A [42].
Sukhera et al.[43, 44] Raja and Twidell [45-47] and Muneer et al. [48] analysed measured
solar radiation data of five main cities of Pakistan. The annual average solar insolation is
19MJ/m2/day (5.26kWh/m
2/day). The annual average solar energy map of Pakistan is shown
in Figure 2-4.
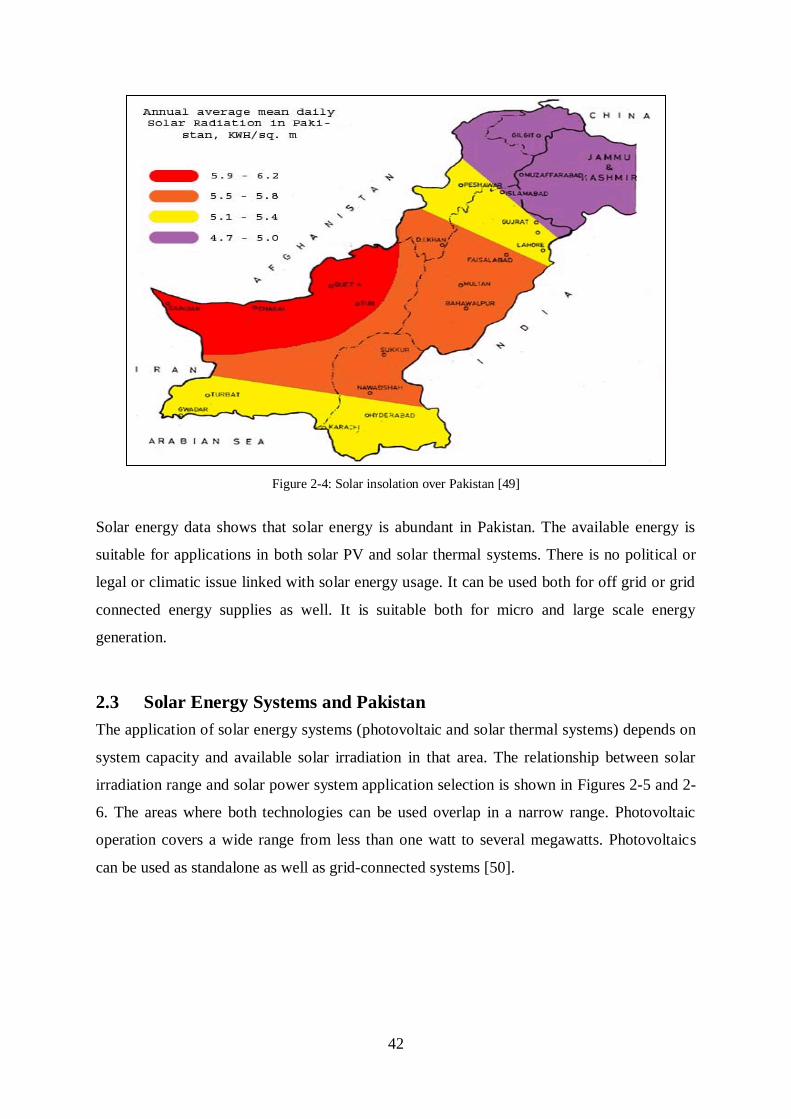
42
Figure 2-4: Solar insolation over Pakistan [49]
Solar energy data shows that solar energy is abundant in Pakistan. The available energy is
suitable for applications in both solar PV and solar thermal systems. There is no political or
legal or climatic issue linked with solar energy usage. It can be used both for off grid or grid
connected energy supplies as well. It is suitable both for micro and large scale energy
generation.
2.3 Solar Energy Systems and Pakistan
The application of solar energy systems (photovoltaic and solar thermal systems) depends on
system capacity and available solar irradiation in that area. The relationship between solar
irradiation range and solar power system application selection is shown in Figures 2-5 and 2-
6. The areas where both technologies can be used overlap in a narrow range. Photovoltaic
operation covers a wide range from less than one watt to several megawatts. Photovoltaics
can be used as standalone as well as grid-connected systems [50].
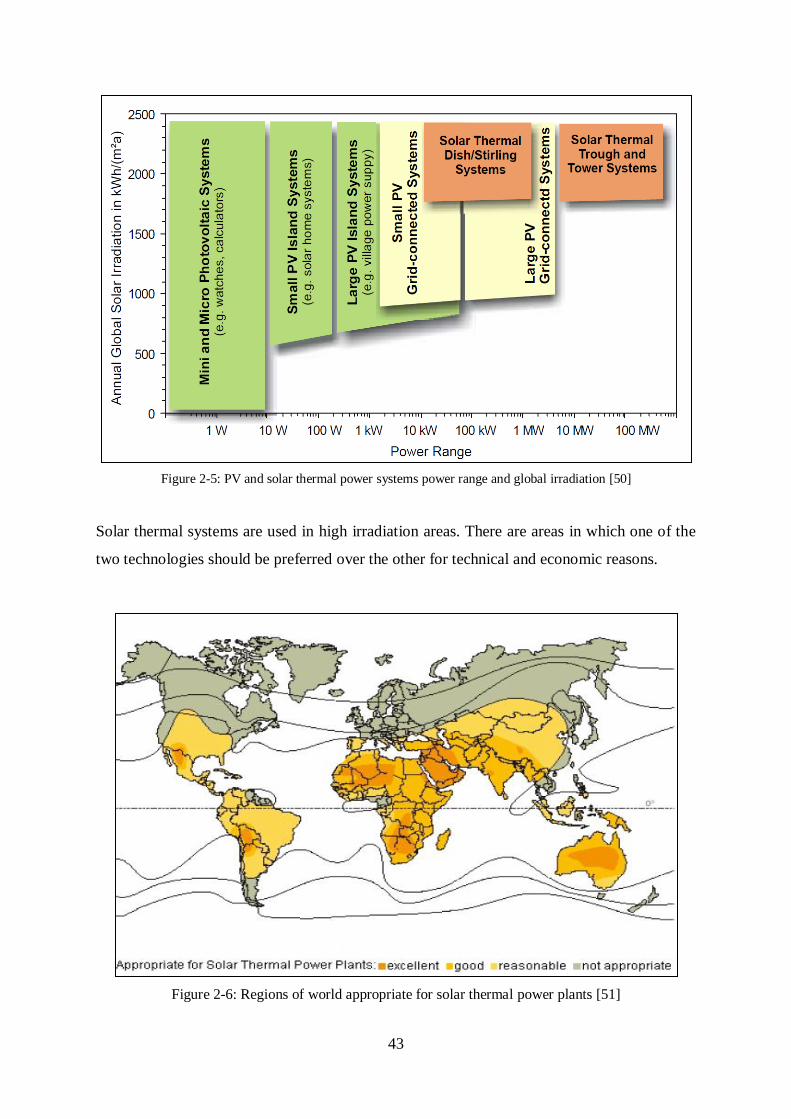
43
Figure 2-5: PV and solar thermal power systems power range and global irradiation [50]
Solar thermal systems are used in high irradiation areas. There are areas in which one of the
two technologies should be preferred over the other for technical and economic reasons.
Figure 2-6: Regions of world appropriate for solar thermal power plants [51]

44
Considering Figures 2-5 and 2-6, it is clear that Pakistan lies in an area of high potential for
both photovoltaic and solar thermal technologies. The annual average global irradiation
varies from 1800 - 2200 kWh/m2
in most of the country. Research work in the field of PV and
solar thermal applications can help the country to overcome the current power crisis and use
clean energy sources. A list of application for solar energy technologies and the solar energy
systems used is shown in Table 2-2.
Table 2-2: Solar energy application and types of collector used [37]
Application System Collector
Solar Water Heating
Thermosyphon system Passive Flat Plate
Integrated collector storage Passive Compound Parabolic
Direct circulation Active Flat Plate, Compound Parabolic , Evacuated Tube
Indirect water heating systems Active Flat Plate, Compound Parabolic , Evacuated Tube
Air systems Active Flat Plate
Space Heating And Cooling
Space heating & service hot water Active Flat Plate, Compound Parabolic , Evacuated Tube
Air systems Active Flat Plate
Water systems Active Flat Plate, Compound Parabolic , Evacuated Tube
Heat pump systems Active Flat Plate, Compound Parabolic , Evacuated Tube
Absorption systems Active Flat Plate, Compound Parabolic , Evacuated Tube
Desiccant cooling Active Flat Plate, Compound Parabolic , Evacuated Tube
Adsorption units Active Flat Plate, Compound Parabolic , Evacuated Tube
Industrial Process Heat
Industrial air & water systems Active Flat Plate, Compound Parabolic , Evacuated Tube
Steam generation systems Active Parabolic Troughs, Linear Fresnel Reflector
Solar Desalination
Multi stage flash Active Flat Plate, Compound Parabolic , Evacuated Tube
Multiple effect boiling Active Flat Plate, Compound Parabolic , Evacuated Tube
Solar Thermal Power Systems
Parabolic trough collector systems Active Parabolic Troughs
Parabolic tower systems Active Solar Towers
Parabolic dish systems Active Parabolic Dish
Solar furnaces Active Solar Towers, Parabolic Dish
As Pakistan receives high levels of solar radiation, all these technologies can potentially be
applied to use solar energy.

45
2.4 Current Status of Solar Energy Application
Pakistan has a huge potential for photovoltaic and solar thermal applications, but there is no
solar thermal power plant or any specific industrial or commercial application of these
technologies. In recent years under the new power policy 2013, there has been a trend
towards the use of PV systems for domestic and commercial electricity generation. The first
PV system electricity generation project of 1000MWP was initiated in 2013 and the 1st phase
of 100MWP has been completed and is in operation. The details of solar energy applications
in Pakistan are summarised here.
2.4.1 Photovoltaics
Photovoltaic systems generate electricity directly. They are suitable for small and large
electricity generation projects. The areas of Baluchistan and Sindh (especially Thar Desert)
are most suitable for photovoltaic energy generation due to their high levels of solar
radiation[52]. Balochistan is the largest area province with the least population density of
about 22 people per square kilometre and most inhabitants live in rural areas as scattered
tribes. Most of these villages and areas are still to be electrified. The houses here require 100-
200 watts of power for lighting purposes. Transmission and distribution lines are difficult and
not economical for these low power scattered populations in hilly areas. Off-grid or local
power generation through solar PV systems is a possible solution as conventional fuels are
also costly to transport into these areas [52].
In the early 1980s, the government installed eighteen photovoltaic systems for the
electrification of remote village areas in different parts of the country[52]. Due to improper
operation and maintenance, these systems failed to produce the desired output. Similarly, the
public health department installed twenty solar water pumps in Northern areas and
Balochistan but these pumps did not perform well due to a lack of operation and maintenance
knowledge and trained, skilled operators. Currently solar photovoltaic energy technologies
are used in the country only for rural telephone exchanges, highways, and motorways’
emergency telephones. In late 2005, Solar Energy International and the National University
of Sciences and Technology (NUST) were jointly awarded a USAID project to provide solar
pumping systems for drinking water supplies in six villages in the Federally Administrated
Tribal Areas (FATA) in the Northwest of Pakistan [52].

46
In April 2012, the government allowed duty free import of all types of PV based system.
Both private and public sectors are financially contributing towards implementation and
promotion of clean energy photovoltaic systems in the country. Many companies are
involved in both trading and manufacturing photovoltaic based home appliances including
lamps, battery chargers, lights and torches [52].
According to the Pakistan economic survey 2013-14, about 65 MWP of electricity is
generated by PV systems. Approximately 793 MWP from Grid solar PV power plants are
under development and in different phases of planning. Under the Prime Minister’s directive
on solar electricity, a supply programme for 3,000 homes in 400 villages across the country
has been started [32].
Solar PV technology use in Pakistan is being promoted on a small and large scale. The first
stage for a 1000MWP solar PV electricity generation plant is operational and some other
projects are under construction. The use of solar PV is increasing but it is very small
compared to the potential that can be harnessed.
2.4.2 Solar Thermal
Solar thermal technology converts solar energy into heat energy and is used for many
applications in heat exchange processes. These technologies are simple, economical and
hazard free. The applications are cooking, heating, cooling and steam for electricity
generation for domestic, commercial, and industrial purposes. The use or application of solar
thermal energy technologies in the Pakistan is reviewed here.
2.4.2.1 Solar Cooker
A number of public and Non-Government Organisations (NGOs) are actively participating in
the promotion of solar cookers. Both box and concentrator type cookers are in use in the
Northern and North West Mountain areas of the country. The use of solar cookers can be
increased to save precious forest wood used for cooking. 67% of the total population is living
in rural areas and the estimated consumption of biomass energy is 27% of their total energy
consumption. The biomass is mainly firewood and crop residues [52].

47
2.4.2.2 Solar Water Heater
Solar water heating is very popular and a commonly used solar thermal application but in
Pakistan, its use is very limited. It is used only in the Northern areas during the winter season
due to a shortage of supply of natural gas and Liquefied Petroleum Gas (LPG). In the past
few years, due to the crisis in electricity throughout year and shortage in the natural gas
supply during the winter season, the use of solar water heaters is increasing throughout the
country for domestic hot water in the winter season [52].
According to the Pakistan economic survey 2013-14, approximately 16,715 units of solar
water heaters are in use in Northern areas, Balochistan, North Punjab and Khyber Pakhtun
Khwa (KPK) [32].
2.4.2.3 Solar Dryers
Solar energy can be effective in drying agricultural products especially fruits and grains. It
can produce a clean, high quality taste and quick drying and cost economic products. Solar
dryers are in use to dry fruits and preserve fruits for off-season use. Both public and NGOs
are actively participating in promoting solar dryers in all parts of the country [52] .
2.4.2.4 Solar Desalination
A large part of the population in the country, especially in Balochistan, Sindh, and south
Punjab has no clean drinkable water facilities. The available water is polluted or, saline due
to a high concentration of sodium chloride. This saline water is not suitable for drinking,
cooking, and washing. Solar energy can be effective and economical for desalination of this
polluted and saline water. Solar desalination technologies are very simple, low cost, and easy
to use for people with little technical training. The government has installed two plants with a
production capacity of 23 m3 / day, which converts sea water into sweet water in Gawadar
city. Some other projects are still under consideration for implementation in Sindh [52].
2.5 Institutional Infrastructure
In Pakistan most of the research and development work is carried out by public sector
organisations. Public sector organisations, which were and are involved in research regarding
solar energy applications, are described here.

48
2.5.1 Pakistan Council for Renewable Energy Technologies
The Pakistan Council for Renewable Energy Technologies (PCRET) was established in 2001
as a result of the merger of National Institute of Silicon Technology (NIST) and the Pakistan
Council for Appropriate Technologies (PCAT). The aim was to have more effective and
beneficial results for renewable technology research. The selected renewable sources were
micro hydropower generation, wind energy, biogas, photovoltaic and solar thermal
technologies. This organisation contributed to the application of different renewable
technologies. With regard to solar energy, the achievements were as follow [52]:
100 kW electricity for 500 houses, mosques, schools and 265 street/garden lights
through use of a 300 Solar PV system
Installation of 21 solar dryers with a total capacity of 5230 kg/day
Completed pilot scale production of solar cells
Testing laboratory for PV and solar thermal appliances
2.5.2 Alternative Energy Development Board (AEDB)
The Alternative Energy Development Board (AEDB) deals with alternative energy resources,
which include wind, micro wind, micro hydro, solar photovoltaic, solar thermal, bio-diesel,
biomass and energy from waste and fuel cells. AEDB, with the assistance of the World Bank,
will convert 100,000 agricultural water pumps for irrigation to run off solar energy within the
next five years. There are 1,100,000 water pumps across the country of which 250,000
electric pumps share, on average, 3000 MW peak electric loads during the day. The World
Bank has approved a pilot project under which initially 25 water pumps will run off solar
energy [52, 53]. According to the Economic survey of Pakistan 2013-14, about 1,429 units of
a solar water pumping system are working in the country both for agriculture and community
drinking water systems [32].
2.5.3 Educational Institutes
The educational institutes of Pakistan have made only a limited contribution to research,
development, and application of renewable energy technologies. So far there are no special
courses that have been started by universities, technical and vocational training institutes
regarding renewable energy technologies. For solar thermal and photovoltaic energy, the
activity in different institutes is minor. At present, the College of Electrical and Mechanical
Engineering (EME), the National University of Science and Technology (NUST) Rawalpindi

49
is carrying out research on solar thermal power generation and solar thermal devices for
heating purposes. The Nadirshaw Edulji Dinshaw (NED) University of Engineering and
Technology, Karachi, has research facilities for solar thermal and photovoltaic energy with
funding for research in this area. The University of Engineering and Technology (UET)
Lahore has established a centre for energy research and development both at Lahore and Kala
Shah Kaku (KSK) campus [54-58].
2.5.4 Pakistan Engineering Council (PEC)
Under the clean energy initiative an on grid solar power generation system with a capacity of
100 kWP will be installed under grant aid from the Government of Japan at the PEC head
office building at Islamabad. This will be the first of its kind in the country and will be an
example to prove an effective measure to overcome energy shortages. The government of
Pakistan under the Prime Minister’s Initiative for Solar Power (PMISP) has approved a grant
of GBP 0.50 Million for PEC. Under this project, PEC is installing 0.50 to 5.0 kWP stand-
alone solar power systems at various engineering universities, commercial areas, and
religious places [53].
2.6 Doctoral Research on Solar Energy Potential in Pakistan
In 1992, Raja [45] completed doctoral research on “Assessment of solar radiation in
Pakistan”. Mean monthly maps of distribution of daily global, diffuse, and direct solar
insolation for Pakistan were presented, using measured data for five cities and sunshine hours
data of thirty seven other stations. The solar insolation measured data was from 1957-
81(except Quetta 1957-87) and the sunshine hour’s duration was from 13-37 years until 1987.
The global solar insolation was calculated from sunshine duration using Angstrom type
insolation-sunshine relation. It was found that the annual mean daily global solar insolation in
the major parts of the country from 16.0 to 21.5 MJ/m2/day (4.4 to 6.0 kWh/m
2/day) with
mean of 19.0 MJ/m2/day (5.26 kWh/m
2/day). It was also reported that all five station have
mean daily insolation more than 10.0 MJ/m2/day (2.77 kWh/m
2/day) with at 85% probability.
Raja also presented data for distribution of monthly mean daily diffuse and direct (beam)
solar insolation for Pakistan. It was reported that measured data for diffused insolation was
available for one city (Quetta) of three year duration (1960-62) and for other cities it was
predicted using empirical relationships. The direct insolation for 40 stations was computed by
the difference of global and diffuse insolation.

50
The main limitation of Raja’s work is that the country’s solar energy potential is estimated on
the basis of five stations measured data. For solar energy applications, long term solar data
from high resolution satellite data or measured data for more cities would provide confidence
for design and operation.
In 2012, Shah [59] completed doctoral research on the “Analysis of solar energy production,
utilisation, and management for facilitating sustainable development in and around the
deserts of Pakistan.” It was established that available solar energy potential utilisation could
provide socioeconomic development and benefits (fresh water, electricity) to the population
in desert areas of Pakistan. The daily solar energy potential of 90,000 km2 of desert would be,
on average, about 30-65GW/m2 [59-61] of electricity. It was concluded that an area of 60
km2 would be sufficient to meet energy demand for the daily needs for water and electricity
for 500 persons village [62].
It was concluded that 0.70 kg per person per day of CO2 emissions could be avoided if a solar
power generation process were used instead of fossil fuels [59]. It has also been found that
solar assisted water desalination for coastal areas of Pakistan is feasible and potential
utilisation could contribute to the development of a 1,046 km long coastal area with a
population of more than 10 million [63].
Pakistan’s solar energy potential is sufficient for solar PV and thermal application as shown
in Figure 2-6 and Appendix B. There is a need to improve the data on solar energy
availability, principally by collecting data for more locations. Doctoral and academic research
into solar cooling systems in Pakistan and India will be described in Section 4.6.1
2.7 Conclusion
Renewables are the source of clean and sustainable energy resources. Use of renewables can
help to meet the global goals for control of carbon emissions and global warming. Pakistan
has sufficient potential in renewables which could provide clean and sustainable energy to
meet the current and future energy demands. In the past and at the moment only hydroelectric
energy and biomass are extensively used; wind and solar energy need to be promoted. As
presented in Section 1.4, in Pakistan the amount of renewables for primary energy
consumption is very low compared to the potential.

51
Solar energy is the largest available renewable source of energy. The use of solar energy is
much less than its availability. It could provide clean energy amounting to many times more
than world energy consumption (0.154 Million TWh for year 2013) for years if it could
capture only 1% of the total available 700 Million TWh.
Solar energy has several advantages over wind, biomass, and hydroelectric energy.
Environmental and political problems are linked with the promotion of these other renewable
technologies in Pakistan. The solar energy potential covers almost all of the country and the
technology can be used on a large scale, which would be economically viable and with the
same standards of service and maintenance.
Pakistan lies in a location with annual solar insolation of 1800-2200kWh/m2. This insolation
is suitable for micro to mega solar energy generation by all types of solar PV and solar
thermal systems. Pakistan is suitable for application of all types of PV and solar thermal
technologies for heating, cooling, power generation and industrial applications. Public and
private sector partnership along with special incentives can promote the application of solar
energy technologies. The application of solar energy systems can help in the improvement of
social and economic values in remote areas of Sindh, Punjab, and Balochistan.
Solar energy is widely available in all areas of Pakistan. It is the only undisputed and short
and long term solution to the current crisis which is a source of green and clean energy. The
use of solar at a micro scale at the domestic level could help to meet demand for daily energy
consumption both for lighting and hot water.
Institutional level infrastructure (technical training) is available in the country which could
contribute a lot to the promotion of solar energy based domestic appliances. The institutional
contribution is much less compared to its potential. The benefit of solar energy use would be
apparent throughout the country’s population both in urban and rural areas. It would help to
develop remote areas in all provinces and facilitate the extremely dense populated cities.
Solar energy can be the best alternative to both electricity and natural gas shortages for
domestic use both for heating and cooling applications (Section 1.5).

52
Chapter 3: Pakistan’s Climate and Buildings’
Energy
3.1 Introduction
In chapter 1, world energy data shows that the predicted annual average growth in energy
consumption in the buildings sector will be 1% till 2035 and major consumption will be for
lighting and space cooling due to increases in population and urbanisation. Pakistan energy
data shows that 54% of total electricity is being consumed by the domestic and commercial
sectors. The climatic conditions in Pakistan are hot and sunny for most of the year. The major
energy consumption in buildings is for cooling systems in summer. In this chapter geography,
population, climatic conditions, comfort temperature, thermal extremes, and building energy
in Pakistan will be described in detail. All these parameters are important in comfort, cooling
system design and cooling demand in the future.
3.2 Geography of Pakistan
Pakistan lies in South Asia between latitude 24◦ N to 38
◦ N and longitude 61
◦ E to 78
◦ E and
the total area is 796,096 km2. The neighbouring countries are China in the north, India in the
east, Afghanistan and Iran in the west and the Arabian Sea to the south. It has a varied
landscape with flat Indus and Punjab rich plains, deserts and the Plateau of Balochistan in the
west and mountains in the north and North West as shown in Figure 3-1.The economy is
agriculture based, and the total arable land in the country is about 28% of the total area.
About 80% of the cultivated land is irrigated through the world’s largest irrigation system
linked with five main rivers [64].

53
Figure 3-1: Geography of Pakistan [65]
Pakistan is divided into seven main administrative areas, which are Punjab, Sindh,
Balochistan, Khyber Pakhtun Khwa (KPK, formally North West Frontier Province) Federally
Administrated Tribal Areas (FATA), Gilgit Baltistan, and Jammu & Kashmir. These
administrative areas are shown in Figure 3-2.
Figure 3-2: Administrative areas of Pakistan [66]

54
The area and population distribution for each administrative unit is shown in Figures 3-3 and
3-4 respectively.
Figure 3-3: Area distribution of Pakistan [67]
Figure 3-4: Population distribution of Pakistan [67]
The above Figures 3-3 and 3-4 show that about 76% of the total population lives in the
Punjab and Sindh provinces, although these provinces constitute only 39% of the total land
area. Balochistan and KPK cover 49% of the area of the country but the population share is
19%. The other administrative areas have less than 12% of the land area and 5% of the total
population.
23%
16%
9%
40%
1%
3%
8%
Pakistan's area distribution
Punjab
Sindh
Khyber Pakhtunkhwa
Balochistan
Azad Kashmir
FATA
Gilgit Baltistan
53% 23%
14%
5% 2% 2% 1% Pakistan's population distribution (2010)
Punjab
Sindh
Khyber Pakhtunkhwa
Balochistan
Azad Kashmir
FATA
Gilgit Baltistan

55
3.2.1 Population
Pakistan is one of the most populated countries in the world. Since 2003 it has been ranked as
number 6 most populated country in the world [5]. The population density is increasing
continuously. The population density of the provinces and country in 2010 is shown in Figure
3-5.
Figure 3-5: Population density in 2010 [68]
According to the Pakistan Bureau of Statistics, the country population has reached more than
184 million. It is estimated that Pakistan’s population will be about 260.06 and 375.25
million by 2030 and 2050 respectively [69].
In 2013, about 33% of the total population was living in urban areas and this number was
expected to rise to 50% by 2025. Presently cities suffer from a housing deficit of about 3
million units and 50% of the current urban population lives in slums. There will be an
increase in demand for houses and electricity for lighting and cooling systems [70].
3.3 Climate of Pakistan
Climate plays an important role in building design, energy demand, heating and cooling
system requirements, and operational hours for these systems. There are different climatic
conditions in the different parts of the country. Ambient temperature and relative humidity
are important for cooling load calculation and they are described here as climatic conditions
396.1
252.5
283.5
22
341.9
131
15.62
221
0
50
100
150
200
250
300
350
400
450
Punjab Sindh Khyber
Pakhtunkhwa
Balochistan Azad Kashmir FATA Gilgit Baltistan Pakistan
Pakistan population density per km2

56
[71]. The climate of Pakistan is generally arid with hot summers and cool or cold winters
with wide variations between extremes of temperature at given locations [72].
3.3.1 Temperature and Humidity
On the basis of temperature experienced, the country is divided into three main seasons:
summer, monsoon, and winter. The summer season lasts from April to June and monsoon
from mid-June to mid-September. In southern and eastern areas the temperature is highest
and decreases towards the north and west, and reaches a minimum in the northern and
western parts. In the summer season the average temperature in the north is below 15°C
whereas in the south it is more than 35°C. About 80% of the population of the country lives
in climatic condition with hot summer seasons and requires cooling systems for comfort [73].
The mean minimum and maximum temperatures for all major district cities of Pakistan are
shown in Appendix B [42]. The annual mean daily temperature of the country from years
1971 to 2000 is shown in Figure 3-6.
Figure 3-6: Pakistan annual mean daily temperature [74]

57
The annual average relative humidity for most of the areas of the Pakistan is from 40% to
70%. It is higher than 70% at the Makran coast and lower than 40% in south-eastern
Balochistan, and in the extreme north [73].The annual average relative humidity for district
cities in Pakistan is shown in Appendix B [42].
3.4 Heat Index and Pakistan
Most of the areas in Pakistan have hot weather conditions in the summer. Continuous high
temperatures and high relative humidity for long periods become a significant hazard and
pose a health risk. Different climate models’ projections show that global air temperature will
increase in the future due to long wave’s radiative effects of increasing greenhouse gases,
especially CO2 emissions (These gases absorbs and re-emit the long wave infrared radiation
emitted by earth thus increasing the atmospheric temperature). The heat-related damage and
casualties are likely to increase due to global warming effects and increasing heat waves
during summer seasons. Cooling systems are required to create comfort inside buildings [75,
76].
The heat index [75] is a measure of stress caused to humans by increases in humidity and
temperature. As the moisture increases, the ability of the human body to release heat through
evaporation decreases which creates stress and discomfort, heat stroke or even death to
humans. The heat index is a simplified relationship between ambient temperature and relative
humidity versus apparent temperature.
The Heat Index (HI) Equation (1) is: [77]
HI = - 42.379 + 2.04901523T + 10.14333127R - 0.22475541TR - 6.83783x10⁻³
T2 - 5.481717×10
-2R
2
+ 1.22874 × 10⁻³
T2R + 8.5282 × 10
-4TR
2 - 1.99x10
-6T
2R
2 (1)
Where
T= Ambient dry bulb temperature (°F)
R= Relative Humidity (%)
The above Equation (1) is applicable when air temperature and humidity are above 26°C and
39% respectively. A relation of different heat index temperature ranges and their effects on
humans is shown in Table 3-1.

58
Table 3-1: Heat Index and its effects [75, 78]
Heat Index Health effects
27 - 32 °C Fatigue possible with prolonged exposure and/or physical activity.
32 - 41 °C Heat cramp and heat exhaustion possible with prolonged exposure and/or physical activity.
41 - 54 °C Heat cramp or heat exhaustion likely & heat stroke possible with prolonged exposure and/or
physical activity.
> 54 °C Heatstroke highly likely with continuous exposure.
In Pakistan the heat index and its possible effects start in summer from May to September.
The heat index range from 27-32°C is tolerable for the people of Pakistan. The normal heat
index for summer seasons based on recorded real time data of mean monthly maximum
temperatures and relative humidity from 1971-2000 in Pakistan is shown in Figure 3-7.
Figure 3-7: Pakistan normal mean heat index distribution [75]
Figure 3-7 shows that most of the areas of the eastern side (Punjab and Sindh) and south
eastern Balochistan are in danger and the extreme danger zones of the heat index, which
poses serious threats to health. Buildings in these areas require cooling system for health as
well as comfort.
The analysis of 1961-2007 recorded weather data shows that there is an increase in
temperature and humidity causing a rise in the heat index and for the summer season the heat
index is increased by 3°C. For this period in the country, on average the increase in humidity

59
is 6.2% and the increase in maximum temperature is 0.25°C. The summer season has been
prolonged while winters have become shorter in Pakistan [75].
3.5 Thermal Extremes in Pakistan
Heat waves (HW) are the by-product of climate extremes. These are now more frequent and
intense during summer in most parts of the world. Recent studies[79-83] on heat waves
reported a risk of more intense and frequent heat waves in the near future. A heat wave is
defined as very high temperatures over a sustained number of days [84]. Heat wave-related
causalities are increasing and in 2003 more than 70,000 were recorded in Europe [85, 86].
Heat waves are the most prominent cause of weather-related human mortality in the U.S. and
Europe [87]. Asia is not far behind in terms of the impact of prolonged spells of heat waves.
The hottest summer in China for the last fifty years was recorded in Shanghai in 2003 when
the mortality rate was at its maximum due to cardiovascular and respiratory disorders [88].
Heat waves generally develop during pre-summer (March/April) and pre-monsoon
(May/June) in Pakistan. Heat wave conditions have been frequent during pre-summer after
the 1990’s due to climate change [84]. The country weather data from 1960-2007 shows there
has been an increase of 0.47°C in the annual mean daily temperature with an average of
0.099°C per decade [64]. The frequency of continuous hot days and hot nights has increased
annually since 1960, and on average there has been an increase of 20 days of continuous hot
days from 1960 to 2003 (hot day or hot night is defined by temperatures exceeding 10% of
average day or night temperatures in the given climate for that region or season). Similarly,
the frequency of hot nights per year has increased by 23 nights for the same period. The
frequency of cold days and nights has decreased significantly since 1960 (cold days or cold
nights are defined as those with temperatures 10% below the average day or night
temperatures for the given climate for that region or season). On average the number of cold
days has decreased by 9.7 days and the number of cold nights by 13 from 1960 to 2003 [71].
Heat waves with temperatures between 40°C and 45°C and durations of 5 and 7 consecutive
days have been increasing in all regions of Pakistan from 1961 to 2009. There is an increase
in the spell of 10 consecutive days at temperatures of more than 40°C in the Punjab, Sindh,
and Balochistan regions. The heat wave periods with temperatures of more than 45°C for 10
consecutive days has increased in the Punjab, Sindh, Balochistan, and Khyber Pakhtun Khwa.
The moderate and severe thermal extremes for temperatures between 40°C and 45°C have

60
increased more for 5 and 7 days than for 10 consecutive days. The area of moderate and
severe heat wave frequency in South Asia is shown in Figure 3-8 [84].
Figure 3-8: Areas of moderate and severe heat wave frequency in South Asia [84]
It is expected that continuous increases in temperatures may make heat waves more frequent
and intense than they are at present. Severe damage to people’s lives is expected, unless
adaptation measures are taken to mitigate heat-related discomfort [84].
3.6 Comfort Temperature
3.6.1 Standard Comfort Temperature
Comfort temperature, is a temperature at which people feel on average neither cool nor warm.
It can vary with varying ambient or climatic conditions. The main factors which influence
thermal comfort and determine heat gain and loss are metabolic rate, clothing insulation, air
temperature, mean radiant temperature, air speed, and relative humidity. The American
Society of Heating, Refrigeration and Air-conditioning Engineers (ASHRAE) standard -55
defines the acceptable standard comfort temperatures and is shown in Figure 3-9 [89]. Figure
3-9 shows the ASRAE standard comfort temperature is 21.2 – 26.7°C and relative humidity
is 30-60 %.

61
Figure 3-9: ASHRAE standard comfort temperature zone [89]
Operative temperature (To), is uniform temperature of an imaginary black enclosure in which
occupants would exchange the same amount of heat by radiation plus convection as in the
actual non-uniform environment. The empirical relation is expressed as Equation 2 [90, 91].
To= (Ta + Tr ) / 2 (2)
Where,
Ta= Air temperature of surroundings (°C)
Tr = Mean Radiant Temperature (°C)
The mean radiant temperature (Tr) is the uniform surface temperature of an imaginary black
enclose in which an occupant would exchange the same amount of radiant heat as in the
actual non-uniform space. The empirical relationship is expressed as Equation 3 [90].
Tr = Tg + 2.42 × va (Tg-Ta) (3)
Where,
Tg = Globe temperature (°C)
va = Air velocity (m/s)

62
Globe temperature (Tg) is a value, which is measured directly by globe thermometer at
thermal equilibrium with the environment, when heat gain by radiation is equal to heat loss
by convection [91].
3.6.1.1 ISO 7730
International standard ISO 7730 is used to predict the thermal sensation and degree of
discomfort of peoples exposed to a moderate thermal environment. It is also used to specify
acceptable thermal comfort conditions. It is based on two techniques: Predicted Mean Vote
(PMV) and Predicted Percentage of Dissatisfied (PPD) [92, 93].
PMV is an environmental index commonly used to specify thermal comfort conditions in
moderate thermal environments. It predicts the mean value of votes of large groups of people
on the ISO thermal sensation seven point scale from +3 to -3 from hot to cold respectively.
The comfort zone is specified by PMV between -0.50 to +0.50 [92, 94].
The PPD index establishes a quantitative prediction of the number of thermally dissatisfied
persons. It predicts the percentage of a large group of peoples likely to feel too hot or too cold
in a given environment as in the PMV scale. The PMV value is used to calculate PPD in
terms of percentage of dissatisfaction [92, 94].
3.6.1.2 Limitations of ISO 7730
Laboratory studies have often supported the validity of ISO 7730 whereas field studies have
not. The standard is also criticised for a lack of theoretical validity [93]. The ISO 7730
standard does not adequately describe comfort conditions for tropical and hot climates. Air
temperatures above 30°C and air velocities of more than 1m/s are common in buildings in
tropical countries. Many field studies have found that occupants can be comfortable at
temperatures over 30°C if fans are in use, even though the PMV is over 2. PMV over
estimates discomfort in hot conditions and under estimates it in cold conditions [95, 96].
Francis and Edward investigated and found errors incurred through the use of ISO 7730. It is
found that for annexe E, linear interpolation can generate small errors. A correction factor
was proposed as, without correction, relative humidity can lead to errors of up to 20% of
comfort span at 30% relative humidity for low activity levels [94].
3.6.2 Adaptive Thermal Comfort
People have a natural tendency to adapt to changing conditions in their environment. This
tendency is expressed in the adaptive thermal comfort approach. The adaptive thermal

63
comfort approach is based on findings of surveys on thermal comfort conducted in the field.
Analysis of international field studies shows that peoples adapt to temperatures they
experience and are comfortable over a greater range of temperatures other than predictions of
ISO 7730 and ASHRAE standard temperatures. For the air-conditioned building the comfort
temperature is different from that in naturally ventilated buildings [97, 98]. The adaptive
approach is used to estimate the indoor temperature at which building occupants are more
likely feel comfortable. Most occupants are comfortable with +/-2°C of the comfort
temperature [32].
Acceptable operative temperature ranges for naturally conditioned spaces according to
ASHRAE 55rev-2003, for different climatic areas is shown in Figure 3-10 [99].
Figure 3-10 Acceptable temperature ranges for naturally conditioned spaces ASHRAE 55 rev. 2003 [99]
Figure 3-10 shows that for naturally conditioned spaces (no mechanical cooling) people are
adapted to higher temperatures than the ASHRAE standard comfort zone. For New Delhi the
range is between 26°C to 30°C, when the mean monthly outdoor temperature is between
33°C and 35°C. These conditions are also applicable to Lahore as the climatic conditions of
New Delhi and Lahore are similar. For a period of 30 years, recorded data for mean monthly
temperature for both Lahore and New Delhi is shown in Figure 3-11. The mean monthly

64
temperature in Lahore is slightly lower than in Delhi from February to June. The acceptable
comfortable temperature for Lahore will be in the same range as for New Delhi.
Figure 3-11: 30 years average monthly mean daily temperatures [100]
In Pakistan two thermal comfort surveys were conducted to find out adaptive comfortable
temperatures in Pakistan by Nicol et al. [97, 101, 102]. One was longitudinal, conducted in
summer and winter, and the other was transverse conducted each month over the year. The
results were close and it was established that there is a relationship between outdoor
conditions and indoor comfort in line with adaptive thermal comfort. For comfortable
temperature observations in Pakistan, the country is divided into five climatic zones, which
are shown in Table 3-2 [97].
Table 3-2: Climate zones of Pakistan for comfortable temperatures [97]
Climate zone Representative
city
Monthly mean outdoor temperature range (°C)
Zone I: Tropical Coastland Karachi 18.1-31.4
Zone II: Subtropical Continental, Lowland arid Multan, Lahore 12.8-35.5
Zone III: Subtropical Continental, Highland Semiarid / Sub-humid Quetta 4.9-27.8
Zone IV: Subtropical Continental, Lowlands / Sub-humid Islamabad, Peshawar 10.1-31.2
Zone V:Subtropical Continental, Highland humid Gilgit, Saidu Sharif 8.2-28.7
Most of the population (more than 60%) in Pakistan lives in climatic zone II, which needs
cooling systems in the summer for comfort inside buildings.
0
5
10
15
20
25
30
35
40
January February March April May June July August September October November December
Tem
peratu
re (
ᵒC)
Lahore vs New Delhi nean daily temperature
Lahore
New Delhi

65
Nicol used Equation (4) to calculate design indoor temperature (Td) or set point for air-
conditioned buildings in Pakistan, from records of monthly mean outdoor long term
temperatures TOLT [97, 103].
Td = 18.5 + 0.36 ToLT (4)
The calculated indoor or set point temperature (Td) for selected cities in Pakistan is shown in
Table 3-3.
Table 3-3: Designed indoor (Td) temperature for selected cities [97, 101]
Month City
Gilgit Islamabad Karachi Lahore Multan Peshawar Quetta Saidu Sharif
January 19.7 22.1 25.0 23.1 23.1 22.5 20.3 21.5
February 20.7 22.9 25.8 24.0 24.0 23.1 20.6 21.9
March 22.7 24.6 27.3 25.9 26.1 24.8 22.4 23.4
April 24.5 26.6 28.7 28.1 28.4 26.9 24.6 25.5
May 25.7 28.4 29.5 29.7 30.2 28.8 26.2 27.4
June 27.4 29.7 29.8 30.7 31.3 30.4 27.7 28.8
July 28.4 29.2 29.4 29.8 30.7 30.1 28.5 28.8
August 28.1 28.8 28.9 29.6 30.4 29.6 28.2 28.3
September 26.5 28.2 28.9 29.2 29.7 28.9 26.3 27.4
October 24.2 26.6 28.5 27.7 28.0 27.0 23.9 25.8
November 21.8 24.4 27.1 25.5 25.6 24.8 22.1 23.7
December 20.0 22.7 25.5 23.6 23.6 23.0 20.5 22.1
Annual average 24.1 26.20 27.9 27.2 27.6 26.9 24.3 25.4
The annual average adopted indoor set point temperature is higher than the ASHRAE
standard of 26ºC in summer and 21ºC in winter. This data will help to use passive or low
energy solutions and also reduce cooling load when designing cooling systems.
3.7 Building Energy in Pakistan
According to the IEA, during 2011, global final energy consumption in all buildings is
33,610 TWh and expected increase to up to 42,915 TWh by 2035. Currently buildings share
29% of total electricity consumption and this figure will increase to 38% in 2035. Currently
space heating and cooling contribute about 60% of total energy consumption in buildings.
The IEA suggests the possibility of saving 3% of total energy consumption by improving
energy efficiency in buildings and making a major contribution by reduction in electricity
consumption [5].

66
In Section 1.5, it is shown that in Pakistan about 54% of total electricity is consumed in
domestic and commercial buildings. Pakistan has increasing demand for air conditioning
systems due to the rising heat index and thermal extremes as discussed in Sections 3.4 and
3.5. Energy demand in buildings is increasing by 15% per annum; high energy use also leads
to more carbon emissions due to combustion of fossil fuels to meet the energy demands
[104]. The ongoing energy crisis has added difficulties in maintaining comfort inside the
buildings as discussed in Section 1.5.
3.7.1 Energy Efficient Buildings:
The present buildings in Pakistan have the following problems [105]:
Poor comfort in peak summer and winter seasons
High cooling and heating loads
Poor energy efficiency
The current buildings in Pakistan have the potential for increasing energy efficiency and
about 50% of energy demand can be saved through comprehensive measures [105]. Energy
can be saved in existing buildings by insulation of the building envelope (walls, roof and
ground floor), glazing of windows, installation of energy efficient heating and cooling
systems, annual service of appliances, installation of temperature controllers and thermostats.
Effective use of day light in building has multiple benefits including occupants feeling
comfortable, more productivity at work, improved aesthetics and energy saving compared to
inefficient buildings [106].
Turkey has successfully implemented energy efficiency policy for buildings and achieved
electricity reduction by about 25-30% in buildings. The policy was prepared and
implemented in 2004, by the Ministry of Energy and Natural Resources (MENR) with the
help of internal donors [107].
In India, the Bureau of Energy Efficiency (BEE) was established in 2001 and has
implemented an Energy Conservation Building Code (ECBC) in 2007 and aims to achieve
energy savings of 25-30% in different buildings [5, 108].
The estimated potential of energy savings in Pakistan’s buildings is described in Section
3.7.3. This estimated potential is higher than actually achieved by Turkish building energy
policy implementation as there is no building energy code in practice in general.

67
3.7.2 Building Energy Code of Pakistan
In Pakistan for energy efficiency in buildings, the Ministry of Environment has updated the
1986 Building Energy Code of Pakistan (BECP) in 2008 with the support of the National
Engineering Services Pakistan (NESPAK) under contract with the National Energy
Conservation Centre (ENERCON). This code was implemented by the Pakistan Engineering
Council (PEC) in February 2014 for buildings with a total connected energy load of 100kW
or greater, 900m2 of conditioned space or greater or unconditioned space of 1200m
2 or
greater. The purpose of this code is to provide minimum requirements for energy efficient
design and construction of buildings in Pakistan [109]. It is mainly focussed on:
a) New buildings and their systems
b) New systems and equipment in existing buildings
This code is not applicable to
a) Buildings using no electricity or fossil fuels
b) Equipment and portions of building systems that use energy primarily for
manufacturing industry and processes
A critical analysis of this energy code, bearing in mind energy efficiency and cooling
systems, in the context of solar cooling is carried out and presented here.
Section IV of the code, describes mandatory requirements for building energy usage but does
not provide guidance on improving energy efficiency in existing buildings and systems.
There is no description for building materials application for energy efficiency or passive
heating, cooling and natural ventilation systems, although the majority of the population lives
in rural areas having no mechanical systems for building comfort [110].
Section V of the code describes heating, ventilating and air conditioning requirements.
Mandatory requirements for natural and mechanical ventilation, equipment minimum
efficiencies, temperature and humidity controls are described. An air leakage limit is
mentioned but no procedure is mentioned for how it varies in winter and summer with
comfortable conditions. For natural ventilation, it is not mentioned which section of the
national building code of Pakistan and ASHRAE should be followed. Mechanical cooling
systems of more than 28 kW must have automatic control systems, whereas most of the
domestic and commercial systems are less than this in capacity. The set point for summer and
winter should not be less than 25ºC or more than 21ºC respectively. Temperature and
humidity ranges for restaurants, office building, museums and communication centres and

68
airport terminals are prescribed, but for schools, domestic buildings, hospitals, mosques and
other public services buildings they are not described [110].
Section XIV of the code describes the climate zones of Pakistan and temperature ranges
measured in these climate regions. The climate zone of Pakistan in the building energy code
map is not in accordance with tabulated zones in the code. The correct climate zone map in
accordance with Table 3-2 climatic zones of Pakistan is shown in Figure 3-12.
Figure 3-12: Climate zone map of Pakistan [110]
The building energy code does not cover all types of buildings and equipment efficiency
standards but still has the potential to reduce building energy consumption, which is
discussed in the next section.
3.7.3 Benefits of Introducing Building Energy Code in Pakistan
ENERCON presented a study on the benefits of implementing the energy code in buildings.
It is estimated that implementation of the code can save about 29% on overall energy use in
buildings. Using an energy code standard for building envelopes of U-value for walls and
windows can save 56% and 38% of energy usage respectively. It is also estimated that with

69
changes in window to wall ratios from 0.38 to 0.33, about 200-300kWh of energy can be
saved on average [111].
Currently air conditioning systems represent 25% of total electricity consumption in
buildings. By implementing the energy code about 18% of the total air conditioning systems’
electricity consumption could be saved. The energy code recommends that using a summer
temperature set point of not less than 25ºC can save 35%, using solar cooling can save 25%
and using occupancy sensors can save 15% of total energy consumption in buildings [111].
Some other areas for potential savings are shown in Table 3-4.
Table 3-4: Potential energy conservation areas [105]
Conservation Areas Saving Potential (%)
Overall lighting 29
High efficiency lighting (LEDs) 72
Fluorescent tube ballasts 83
Lamp fixtures 50
Printers 19
Heaters 17
Copiers 10
Fans 5
Computers 2
The overall potential for 29% of savings is in line with the Turkish energy efficiency policy,
which saved 25-30% on energy use in buildings. This saving potential is just an estimate as
no experimental evidence has been described by ENERCON.
3.8 Case Study of Energy Efficiency Improvement in Existing Houses in
Pakistan
In 2010, UN-HABITAT (United Nation Settlement Programme) in partnership with the
Ministry of Environment, National Energy Conservation Centre (ENERCON) and Capital
Development Authority (CDA), demonstrated and tested measures to improve the thermal
performance of housing with Reinforced Concrete (RC) flat roofs [112]. This project’s phase
one had three steps as explained below:

70
Roof Preparation
The roofs were prepared and repaired for leakage removal, water proofing with bituminous
coating and plain cement concrete (1:2:4) toppings.
Thermal Improvements
Three techniques were used to improve the thermal performance of RC slab roofs which
were: insulative techniques, reflective surface techniques and radiant barrier techniques.
Insulative material reduces heat transfer between objects of different temperatures. The
reflective surface bounces back the incident light and a radiant barrier inhibits heat transfer
by thermal radiation.
Performance Criterion
The thermal performance was monitored for 20 days in the month of July 2010 during the
summer season. The thermal comfort level was set below 34°C. This temperature was set as a
target to reduce the room temperature below it.
3.8.1 Results of the Case Study
During daytime with peak ambient temperatures, the highly effective materials are
paperboard false ceilings (radiative) and jumbolon extruded polystyrene (insulative)
respectively. They reduced room temperature on average by 4°C as compared to rooms with
no solution. Three reflective and four insulative materials also showed good effectiveness in
temperature reduction in the range of 2.5-3°C. The other solutions, three radiative, two
reflective and five insulative, gave average efficiency as shown in Figure 3-13 [112].

71
Figure 3-13: Outside air and inside temperature with solution comparison during day time [112]
The performance of the material at midnight is shown in Figure 3-14. All the materials
reduced the room temperature as compared to rooms with no solutions; the most effective
materials were paperboard false ceilings (radiative) and jumbolon extruded polystyrene
(insulative) and smart concrete tiles (insulative) respectively. The reduction in room
temperature was about 4.7 °C. The other materials gave a temperature reduction of 1.5 - 4°C
[112].
36.2
35.3
33.6
33.1 32.2
34.7
34 33.7
33
34.1
35.1
33.1
33.7
33.1
34.2
34.7
34.6
34.9
32.2
34.4
30
32
34
36
38
40
42Temperature comparison at day
Out Side AirTemperature at 3 PM
With Solution Inside Room Temperature

72
Figure 3-14: Comparison of outside air and inside temperature with solutions at midnight [112]
The initial cost analysis shows that reflective materials are cheaper, insulative materials
are expensive and radiative barrier materials are in between. For initial cost per square
metre the lime wash, weather sheet paint, and enamel paints are the cheapest (£0.24 -
£0.64). For initial cost per square metre, Alnoor tiles, Munawar AC tiles, and smart
concrete tiles are the most expensive (£6.38 - £10.76). The initial cost of all materials is
shown in Figure 3-15 [112].
36.7
35.4
34.1 33.9
32.0
35.6
34.0
32.0
33.4
33.8 33.7
32.6 32.6
32.9
33.4
33.6
34.9
34.5
31.7
33.6
30.0
31.0
32.0
33.0
34.0
35.0
36.0
37.0
38.0 Temperature comparison at night
outside air temperature at mid night
with solution inside room temperature
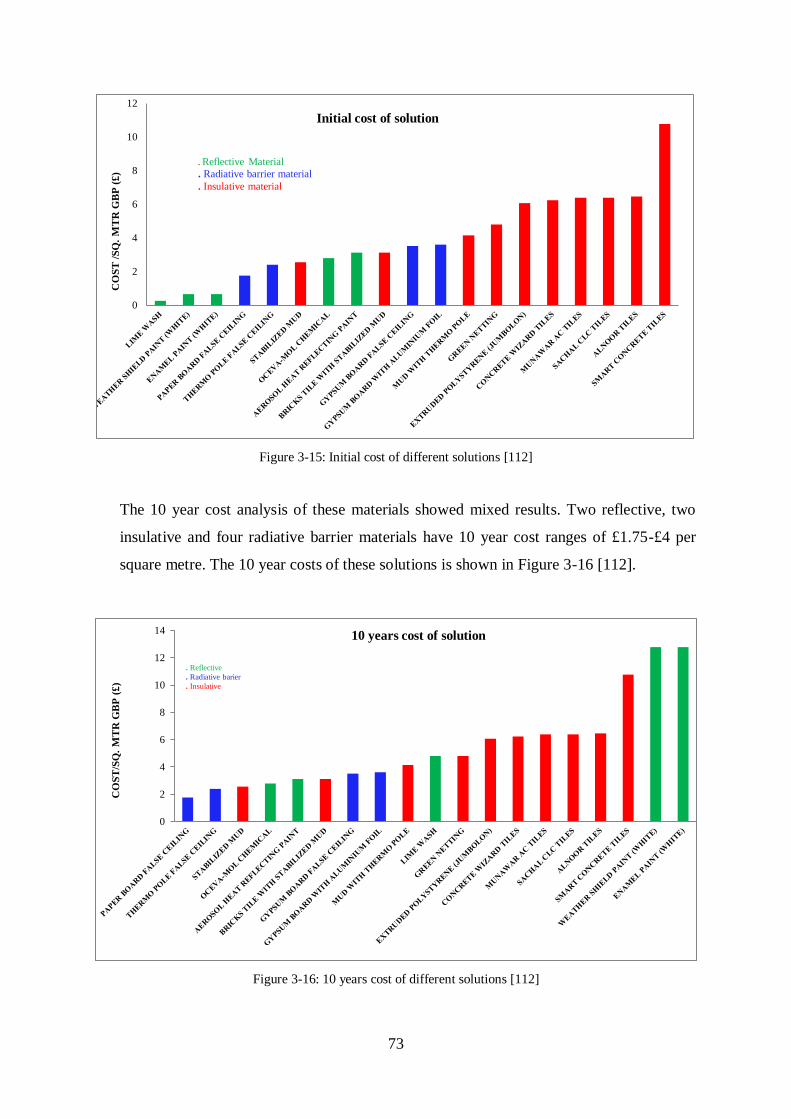
73
Figure 3-15: Initial cost of different solutions [112]
The 10 year cost analysis of these materials showed mixed results. Two reflective, two
insulative and four radiative barrier materials have 10 year cost ranges of £1.75-£4 per
square metre. The 10 year costs of these solutions is shown in Figure 3-16 [112].
Figure 3-16: 10 years cost of different solutions [112]
0
2
4
6
8
10
12C
OS
T /
SQ
. M
TR
GB
P (
£)
Initial cost of solution
. Reflective Material
. Radiative barrier material
. Insulative material
0
2
4
6
8
10
12
14
CO
ST
/SQ
. M
TR
GB
P (
£)
10 years cost of solution
. Reflective
. Radiative barier
. Insulative

74
3.8.2 Findings on the Basis of Energy Efficient Housing Reports
All the solutions improved comfort and indoor temperature decreased by 2-4°C on
average. This improvement in passive building cooling measures helps to reduce
electricity consumption and saves on CO2 emissions. This decrease in cooling load is
favorable for any cooling system especially for application in solar cooling systems.
Paperboard false ceilings are cheapest for both initial and 10-year costs and highly
efficient in reducing indoor temperature both at day and midnight. They are highly
recommended to improve thermal comfort and reduce cooling loads in summer. In
current and new buildings, this material and solar cooling systems can both help to
provide sustainable cooling systems for comfort in summer.
Some solutions/techniques are equally effective both in summer and winter seasons
for improved infiltration and leakages. These techniques are more effective in areas
with hot summers and cold winters. Such solutions include Jumbolon (polystyrene),
brick tiles with stabilised mud, insulating paper board, stabilised mud, mud with
thermopole and thermopole false ceilings.
Some new materials, specifically insulative (polystyrene, insulating paper board,
smart concrete tiles and Munawar tiles), are more efficient in reducing cooling load
and add aesthetics to the inside of rooms.
None of the solutions provide comfortable indoor conditions during hot weather as
occur in the summer in Pakistan.
3.9 Conclusion
Punjab and Sindh are the most populated provinces of Pakistan. The population of the two
provinces is more than 75% of the country’s population.
The climate of Pakistan is mostly hot and dry. Most of the areas have hot summers with a
mean daily maximum temperature of more than 34°C and they require cooling systems for
comfort. The annual average relative humidity for most of the areas is from 40% to 70%.
In the past four decades there is an average increase of 3°C in the heat index. There is an
increase in the frequency of thermal extremes of temperature values of more than 40°C and
45°C. This high temperature climatic zone is mostly in the Punjab and Sindh regions which
are home to majority of the country’s population.

75
The ASHRAE standard comfort temperature is about 26°C. The comfort zone specified by
PMV is between -0.50 to +0.50. The ISO 7730 standard does not adequately describe comfort
conditions for tropical and hot climates when air temperature is above 30°C and air velocities
of more than 1m/s.
For New Delhi (Lahore) ASHRAE adaptive comfort temperature range is between 26°C to
30°C, when the mean monthly outdoor temperature is between 33°C and 35°C. Similar
temperature range was obtained by Nicol et al. [97, 101, 102] adaptive thermal comfort in
Pakistan. Use of an adaptive comfort temperature as a set point compared to an ASHRAE
standard temperature can help to reduce the building cooling load and improve the efficiency
of cooling systems.
In Pakistan there is overall potential for 29% of savings in building energy. The Turkish
building energy efficiency code’s success shows that after the application of building energy
codes and standards in Pakistan’s buildings the following benefits may be achieved:
Decreased cooling and heating loads
Improved energy efficiency
Comfortable livings
Improved and healthier life styles
Improved productivity
The case study of the building thermal performance improvement project showed a potential
for improving existing buildings for comfort in summer with the application of a few
techniques. With nominal expense using insulative and other techniques a lower cooling load
and electricity consumption reduction could be achieved in existing buildings.
As discussed in Chapter 1, the energy crisis and very hot climate in the summer are adding
hardships to the lives of the majority of the population and the most significant factor is the
absence of cooling systems during power cut periods. Long term and sustainable clean energy
systems should be introduced to solve the energy crisis and create comfort conditions during
the summer.

76
Chapter 4: Solar Cooling Systems
4.1 Introduction
In the previous chapters, the literature has discussed in detail of energy demand, electricity
crisis, and the effects of energy crises, solar energy potential, climate, and building energy in
Pakistan. The literature showed there is demand for sustainable energy system which can
provide comfort in buildings, especially during the hot summer season. Solar energy is
widely available in most areas of the country, and its application can provide sustainable,
clean energy. As cooling demand increases in line with increases in solar radiation intensity
increases, solar cooling could provide a logical solution. This research’s aim is to investigate
the potential of a solar energy powered cooling system for the climate of Pakistan.
Solar energy is already widely used as an energy source for cooling [113-117]. Solar cooling
technologies are mainly categorised into passive solar and active solar systems based on the
process of capturing, converting, and distributing solar energy. Active solar technologies are
photovoltaic and solar thermal systems [118]. A variety of solar cooling technologies have
been developed and many are already available in the market [119, 120]. Passive solar
techniques include orienting a building towards the Sun, selecting materials with favourable
thermal properties for heat gain or designing light dispersing properties and spaces for natural
ventilation to provide cooling effects [121].
This research is carried out using an active solar technique for cooling in buildings. Active
solar cooling can be achieved by integrating photovoltaic (solar electric) or solar thermal with
the cooling generation system [117, 122]. The efficiency of the thermal collector improves as
the ambient temperature increases whereas the solar PV modules’ efficiency reduces [120,
123]. The economic study shows that solar thermal cooling is more viable than solar electric
cooling in hot climates and annual costs are location dependent. So, for Pakistan, hot climate
solar thermal will be preferable. The solar thermal cooling system specific cost per kWh of
cooling in Spanish locations is between 0.13 and 0.30 €/kWh. In hot climates like Jakarta and
Riyadh, the specific costs are as low as 0.09 to 0.15 €/kWh[22].
Solar thermal cooling has better compatibility with supply and demand, with cheap storage
compared to solar electric cooling. The investment cost of both solar electric and solar

77
thermal cooling systems is similar[124]. The average CO2 emission saving for solar cooling
in European region is 226kg/kWC per year by saving on the consumption of primary energy
[24].
4.2 Solar Electric Cooling
In solar electric cooling systems, photovoltaic (PV) panels are mostly used to power
conventional vapour compression based cooling machines [125-127]. A Stirling refrigerator
can also be connected to PV panels for cooling. The COP of Stirling refrigerators is less than
that of a vapour compression cooling system [128-130]. The main components of solar
electric cooling are PV panels, a direct current (DC) motor and vapour compression chiller,
cooling tower, chilled water pump, condenser water pump, and air handling unit, as shown in
Figure 4-1. The PV panels are sized to provide necessary electric power to motor, driving the
compression chiller. When the PV panels cannot supply the required power due to weather
conditions or at night, a power regulator is used to draw auxiliary power from the grid
connected supply system. The power regulator is capable of tracking the maximum power
from solar panels and minimises the use of power from a grid connection [117, 118, 120,
131].
Figure 4-1: Schematic overview of solar electric cooling system [132]
The vapour compression cycle consists of four components which are used to remove heat
from a lower temperature (cold reservoir) to higher temperature (hot reservoir) space. These
components include the evaporator, compressor, condenser, and expansion valve as shown in
Figure 4-1[132].

78
These components are connected in a close loop as the refrigerant is continuously circulated
to all of the components. The operation of the vapour compression system is shown in Figure
4-2.The refrigerant starts from stage 1, with a low temperature and pressure at inlet to the
compressor. The refrigerant exits the compressor with a high temperature and pressure in a
gas phase. The super-heated refrigerant enters the condenser at stage 2 and exchanges heat to
a lower temperature secondary fluid. The refrigerant exits the condenser as liquid at stage 3
and enters the expansion valve. In the expansion valve, the pressure of liquid is decreased
through a throttling effect and the sudden decrease in pressure reduces the temperature of
refrigerant[133].
Figure 4-2: Schematic diagram of vapour compression refrigeration system[133]
The refrigerant exits the expansion valve as a mixture of liquid and gas, with a low
temperature and pressure at stage 4. After stage 4, the refrigerant enters the evaporator and
absorbs the heat from the primary fluid. The refrigerant exits the evaporator at a slightly
higher temperature in the gas phase [131-133].
The co-efficient of the performance (COP) of the refrigeration system is defined as the
cooling power (Qe), divided by work in ‘w’, as expressed in Equation 1.

79
COP = η cool = Qe / w (1)
The primary fluid is usually indoor air, or water which then cools the air through a cooling
coil. Similarly, the secondary fluid is usually outdoor air or water which then rejects heat to
the ambient air through a cooling tower [118, 132].
PV modules are devices which convert sunlight directly into electricity without any
intermediate systems [134]. PV cells are normally semiconductors and produce direct current,
details of the types and efficiency of solar cells will be discussed in the next section. The
main disadvantage of PV systems is their low efficiency.
The power produced (wPV) by a PV panel is calculated by using the efficiency of the PV
panel (ηPV ) and solar energy incident on the panel (QS) as shown in Equation 2 [119, 132].
wPV = ηPV × QS (2)
And
QS = I ×A (3)
Where
I = Incident solar Insolation (W/m2)
A= Area of PV collector (m2)
The overall efficiency of solar electric cooling system is expressed in Equation 4.
ηsol.cool = ηPV × η cool = Qe / QS (4)
In solar electric system compressors, power consumption (w) should be provided by the PV
panels. The total area (A) of the solar PV panels can be calculated to cover the total daily
power consumption (wT) of the compressor by using total daily solar radiation (IT) and daily
total PV power production (WPV)T [135, 136].
A = wT / ηPV . IT (5)
The PV system is suitable for small sized refrigeration systems used for medical or food
applications in remote areas, with no conventional energy resources and a high level of solar
radiation [120, 137]. Solar tracking systems can be used to obtain maximum power from
sunrise to sunset time [135].Solar electric vapour compression cooling systems are limited
and few systems are available in literature [138].

80
4.3 Solar Thermal Cooling
Solar thermal systems produce heat energy gained from solar radiation through the heating of
a fluid circulated through a collector. Solar thermal systems are able to exploit both direct and
diffused radiation, and therefore can be installed anywhere [120, 139].
The use of solar thermal energy for cooling in hot and sunny climates is a promising
application of solar thermal collectors in buildings. The main advantage is that in solar air
conditioning applications, cooling loads and solar gains occur at about the same time in
summer. Solar cooling has the potential to significantly reduce electricity consumption,
contribute to fossil fuel energy saving and electrical peak load reduction. Solar thermal
cooling can help in achieving carbon emission reduction and promoting clean and
environmentally friendly refrigerants used in thermal cooling systems compared to
conventional vapour compression cooling systems [140]. The solar cooling technology has
not been widely applied and needs more research and development to achieve competitive
levels of reliability and cost with conventional cooling technologies [120, 141].
Solar thermal systems can use more incoming solar radiation than PV systems. When a solar
light strikes with a PV system, about 35% of the total incident spectrum (Ultraviolet to
Yellow) can be utilised to generate electricity and rest spectrum of about 65% (Orange to
Infrared) is converted to heat, as shown in Figure 4-3 [40].
Figure 4-3 Solar light spectrum used in a PV system[40]
As the solar thermal system converts solar energy to heat energy, collectors have no such
limitation. A solar thermal collector can absorb over 95% of the incoming radiation spectrum
ULTRAVOILET
10%
VOILET
5%
BLUE
5%
GREEN
10%
YELLOW
5%
ORANGE
5% RED
15%
INFRARED
45%
Solar light spectrum used in PV system
useful in a
Si based PV
~35%
Converted to
heat ~65%

81
depending on the absorbing materials [40]. Due to losses and inefficiencies, not all absorbed
energy is converted to useful energy. The collection efficiency of commercially available
solar thermal collectors is more than double compared to PV systems [142, 143].
4.3.1 History of Solar Thermal Cooling Systems Development
The application of solar thermal system for cooling is about five decades old. A summary of
important developments in solar thermal cooling systems is described in Table 4-1.
Table 4-1: History of solar thermal cooling development
Year Development Of Solar Thermal Cooling System.
1962 First Study of the use of solar thermal energy for cooling purpose [144].
1970 First commercial single effect absorption chiller for solar cooling [145].
1974 First simulation of a solar heating and cooling system [146].
1975 First TRNSYS simulation of solar processes and its application [147].
1976 Experimental study of a hybrid solar air condition system [148, 149].
1977 Experimental study of home heating and cooling with flat plate collector [150].
1978 Experimental study of a Yazaki solar cooling system for solar house one [151].
1979 Design of a residential solar heating & cooling system using the evacuated tube collector [152].
1981 Development of a double effect absorption chiller for solar assisted cooling [153].
1982 Development and test of solar Rankine cycle heating and cooling systems [154].
1985 Fortran-based modelling and simulation of a solar absorption cooling system [155].
1990 Development of a solar cooling absorption chiller with 5-10kW capacity [156].
1994 Experimental study of a solar liquid adsorption cooling system [157].
1998 Study of the performance improvement of a solar cooling unit [158].
2001 Experimental studies of a solar air conditioning system with a partitioned hot water storage tank [159].
2002 Grossman established triple & double effects are better than single effect solar powered chillers [160].
2004 R114 replaced by R142b in solar ejector system for better efficiency and environmental effect [161].
2005 Simulation & optimization of LiBr solar absorption cooling system with evacuated tube collector [162].
2007 Investigation of liquid desiccant system for solar air conditioning [163].
2008 Simulation study of solar LiBr-H2O absorption cooling system with parabolic trough collector [164].
2009 Study of an air-cooled LiBr-H2O absorption chiller cooling system in extremely hot weather [165].
2010 Experimental investigation of solar absorption cooling system without backup in tropical climate [166].
2012 Study of alternative designs for 24-h operating solar powered absorption refrigeration technology [167].
2012 Study of solar cooling systems utilising concentrating solar collectors [168].
2013 Experimental comparison of two solar driven air cooled LiBr-H2O absorption chillers [169].
2013 A theoretical & experimental study of the solar ejector cooling system with R236fa carried out [170].
2014 Design of solar ejector cooling system for a COP of 0.32 [171].
2014 Techno-economic review of solar cooling technologies based on location-specific data [172].

82
4.3.2 World Solar Thermal Cooling Status 2014 and IEA Road Map 2050
The global solar cooling market grew at an average annual rate of about 40% from 2004 to
2014. About 1,200 systems of different types and sizes were installed worldwide by 2014 and
most of these systems are in Europe (75%). The use of solar cooling is rising in many regions
with sunny, dry climates, including Australia, India, the Mediterranean islands, and the
Middle East. The availability of small (less than 20 kW) cooling kits for residential use has
increased for the residential sector in Central Europe [173].
One of the market drivers for solar cooling is the potential to reduce peak electricity demand,
particularly in countries with significant cooling needs. The cost of solar cooling kits
continues to fall, declining by 45–55% (depending on system size) over the period 2007–
2012 [173]. Solar cooling could avoid the need for additional electricity transmission
capacity caused by higher peak loads from the rapidly increasing cooling demand in many
parts of the world [174].
According to the IEA 2050 roadmap, up to 2050, solar thermal energy use for cooling could
contribute to 417 TWhth per year. The installed capacity of more than 1000 GWth for cooling
will account for nearly 17% of energy use for cooling in 2050 [174].
4.3.3 Solar Thermal Cooling Systems
A solar thermal cooling system consists of four basic components: a thermal collector,
thermal storage, thermal chiller, and heat exchanging system to exchange heat with a
conditioned space [117, 120]. An overview of solar thermal cooling system is shown in
Figure 4-4.The other components normally required are a hot water pump, auxiliary heater,
chilled water pump, cooling tower, condenser water pump, and air handling unit [5, 6].

83
Figure 4-4: Overview of thermal cooling system[123]
The types of solar thermal collectors and thermal cooling systems are discussed in detail here
as these are important components of a solar thermal cooling system.
4.4 Solar Thermal Collectors
Solar thermal collectors are heat-exchanging devices that transform solar radiation into
internal energy in a fluid (air or water). The collected solar energy is carried away by
circulating fluid either directly to hot water or space conditioning equipment or to a thermal
energy storage system for use at night and or in cloudy days [175].
On the basis of temperature spectrum application, solar collectors are divided into three
categories, as shown in Figure 4-5 [176].
Low temperature (Domestic Hot Water)
Medium temperature (Solar Heating and Cooling of Buildings)
High temperature (Industrial Process Heating and Electricity generation)

84
Figure 4-5: Solar energy collector’s application [176]
There are two basic types of solar collectors; stationary and concentrating, as shown in Figure
4-6. Stationary collectors have same area and do not track solar radiation whereas
concentrating collectors have concave reflective surfaces to intercept and focus the solar
radiation to a small area for an increased solar energy flux [37, 177].
Figure 4-6: Types of solar thermal collectors [178]
Normally, concentrating collectors are used for power generation rather than solar heating or
cooling. These collectors will be covered in the review of collectors for the purpose of
comparison.
4.4.1 Stationary Collectors:
These collectors are normally permanently fixed in a position and do not track the sun. Three
collectors fall into this category;

85
a) Flat Plate Collector (FPC)
b) Compound Parabolic Collectors (CPC)
c) Evacuated Tube Collectors (ETC)
4.4.1.1 Flat Plate Collectors (FPC)
A typical flat-plate solar collector is shown in Figure 4-7. When solar radiation passes
through a transparent cover and impinges on the black absorber surface, a large portion of the
incoming energy is absorbed by the plate and is transferred to a transport medium in fluid
tubes for storage or direct use [141, 177].
Figure 4-7: Construction of flat plate collector [37]
The underside of the absorber plate and the side of casing are well insulated to reduce
conduction losses. The liquid tubes are connected at both ends by large diameter header
tubes. A transparent cover used to reduce convection losses from the absorber plate through
the restraint of a stagnant air layer between the absorber plate and glass. It also reduces
radiation losses from the collector [141, 177].
FPC’s are available in a wide range of designs and materials. These are the most used type of
collector. The major purpose is to collect more solar energy with a lower cost. These are
normally used for low temperature applications of up to 80°C. FPC is usually fixed in
position, oriented directly towards the equator, facing south in the Northern hemisphere and
north in the Southern Hemisphere. The optimum tilt angle of the collector is equal to the
latitude of the location with angle variations of (10–15) ° more or less [37, 177].

86
4.4.1.2 Compound Parabolic Collectors (CPC)
CPC’s have the capability of reflecting nearly all of incident radiation to the absorber. The
necessity of moving the collector to accommodate the changing solar orientation is reduced
by using a trough with two sections of parabolic sides facing each other, as shown in Figure
4-8. CPC’s accept incoming radiation over a relatively wide range of angles. Due to multiple
internal reflections, the incident radiation within the collector acceptance angle (θc) is
directed to the absorber surface at the bottom of collector. The shown reflector has a lower
portion which is circular (AB and AC) and the upper portions (BD and CE) are parabolic.
The upper part of the collector truncated to increase the radiation passage to the absorber.
CPC’s are usually covered with glass to avoid dust and other materials from entering the
collector [37, 177].
Figure 4-8: Schematic diagram of compound parabolic collector [37]
The orientation of a CPC collector is relative to its acceptance angle. The collector can be
oriented along its long axis in either a north-south or east -west direction and its aperture
tilted directly towards the equator at an angle equal to the local latitude. When oriented along
the north-south direction, the collector must track the sun by turning its axis continuously. As
the acceptance angle is wide along its long axis, the seasonal tilt adjustment is not required.
When oriented with its long axis along the east-west direction, a little seasonal tilt adjustment
is required. For stationary CPC collectors, the minimum acceptance angle is 47° in order to
cover the declination of the sun from summer to winter. In practice, bigger angles are used to
enable the collector to collect diffuse radiation with a lower concentration ratio [37, 177].

87
CPC collectors are useful for sunny and warm climates. For higher temperature applications,
a tracking CPC can be used. These are not favourable for cold, cloudy, and windy days [37,
177].
4.4.1.3 Evacuated Tube Collectors (ETC)
Evacuated tube collectors are highly efficient in circumstances where there is a lower
radiation and a higher difference between the absorber and ambient temperature. Evacuated
tubes collectors are more expensive than glazed flat plate collectors. Evacuated tube
collectors use glass tubes with a vacuum. This vacuum works as insulation, reducing heat loss
from the collector and thus increasing the efficiency of the collector. Some ETCs use liquid-
vapour phase change materials for efficient heat transfer [37, 177].
Figure 4-9: Schematic diagram of evacuated tube collector [37]
The sealed copper pipe is attached to black copper fins that fill the tube (absorber plate). The
heat pipe contains a small amount of fluid (e.g. methanol) that undergoes an evaporating
condensing cycle. In this cycle, solar heat evaporates the liquid and the vapour travels to the
heat sink region where it condenses and releases its latent heat. The condensed fluid returns
back to the solar collector and the process are repeated. These tubes are connected to a heat
exchanger (manifold), as shown in Figure 4-9. Water or glycol flows through the manifold
and picks up the heat from the tubes. The heated liquid is stored or heats the load, directly or
through a heat exchanger [37, 177].

88
4.4.2 Concentrating Solar Power (CSP)
In concentrating collectors, solar energy is optically concentrated before it is transformed into
heat. Concentration is obtained by the reflection or refraction of solar radiation by use of
mirrors or lens. This reflected or refracted radiation is concentrated in a focal area, thus
increasing the energy flux per unit area in receiver. CSP systems are designed to produce
medium (400-550°C) to high high-temperature (600-1000°C) heat for electricity generation
or for the co-generation of electricity and heat[179]. These systems are capable of exploiting
only Direct Normal Irradiation (DNI), which is the energy received directly from the Sun (not
scattered by the atmosphere) on a surface tracked perpendicular to the Sun’s rays. Arid or
semi-arid areas with strong sunshine and clear skies are suitable for CSP application [39].
CSP are of following four types;
a) Linear Fresnel Reflectors
b) Power Towers (Central Receiver Systems)
c) Parabolic Troughs
d) Parabolic Dish
4.4.2.1 Linear Fresnel Reflectors: (Line Focus, Fixed Receiver)
Linear Fresnel Reflectors (LFR) are curved trough systems made by using long rows of flat
or curved mirrors to reflect the solar rays onto a downward facing linear, fixed receiver as
shown in Figure 4-10. The receiver can attain temperature of up to 250°C.The main
advantage of the LFR system is its simple design of flexibly bent mirrors and fix receivers
with low-cost direct steam generation. LFR plants have low efficiency in the conversion of
solar energy to electricity [37, 177, 179, 180].
Giorgio Francia was the pioneer in developing both a linear and two-axis tracking Fresnel
reflector system in 60s. For higher temperatures, he used two-axis tracking as modern optics
and coatings were not available [177].

89
Figure 4-10: Linear fresnel reflector (Left) & compact linear fresnel reflector (Right) [37]
The difficulty with LFR is that in order to avoid shading and blocking between adjacent
reflectors, the space needs to be increased between reflectors. The most recent design is for
Compact Linear Fresnel Reflectors (CLFR), two parallel receivers for each row of mirrors as
shown in Figure 4-10. The classical LFR system has only one receiver and there is no choice
of the direction and orientation of reflector. The interleaved arrangement minimises beam
blocking by adjacent reflectors and allows high reflector density and low tower height [37,
177, 180].
4.4.2.2 Solar Towers (Point Focus, Fixed Receiver)
Solar towers are also known as Central Receiver Systems (CRS). Large numbers of small
reflectors called heliostats are used to concentrate the solar rays on a central receiver placed
on top of a fixed tower, as shown in Figure 4-11. Each heliostat has a 50-150 m2 area of
reflective surface. Some new commercial tower plants use Direct Steam Generation (DSG)
system in receivers, in which slightly concave mirror segments on the heliostats directed rays
into the cavity of a steam generator to produce high pressure and temperature steam. The heat
energy absorbed by the receiver is transferred to be circulated for use. The main advantages
of central receivers are: [177, 179]
It minimises the thermal energy transportation as it collects solar energy optically and
transfers it to a single receiver.
The concentration ratio of 300-1500 is achieved and has high efficiency, both in
energy collection and in electricity conversion.

90
Figure 4-11: Schematic overview of power tower (central receiver system) [37]
In addition, the concept is highly flexible with a wide variety of heliostats, receivers, transfer
fluids, and power blocks. The average solar flux impinging on the receiver values from 200
to 1000 kW/m2. This high flux helps to achieve high temperatures of more than 1500
◦C. The
heat transfer and storage fluid may be water /steam, molten sodium or molten nitrate salt
(sodium nitrate / potassium nitrate) [37, 177, 180].
4.4.2.3 Parabolic Troughs (Line Focus, Mobile Receiver)
This system has light structures and low cost technology for process heat applications of up
to 400°C. A parabolic trough system consists of parallel rows of mirrors (reflectors) curved in
one dimension to focus the solar radiation on a linear receiver, as shown in Figure 4-12. The
mirror array can be more than 100m long with the curved surface at 5-6m across. A linear
tube is placed along the focal line to form an external surface receiver. Stainless steel pipes
(absorber tubes) with a selective coating serve as heat collectors. The coating allows pipes to
absorb high levels of solar radiation while emitting much less radiation. A glass cover tube is
placed around the receiver tube to reduce the convective heat loss. The tube may be
evacuated to further reduce convective heat loss. The disadvantage of a glass cover tube is
that the reflected light from the concentrator must pass through glass to reach absorber,
adding a transmittance loss. The glass envelope has an antireflective coating to improve
transmissivity [37, 177, 179, 180].
The reflectors move in tandem with the Sun as it crosses the sky. It is sufficient to use single
axis tracking of the Sun and thus a long collectors’ module is produced. The collector can be
oriented in an east–west direction, tracking the sun from north to south or oriented in a north-
south direction and tracking the sun from east to west. Over a period of year, a horizontal

91
north –south, trough field usually collects slightly more energy than a horizontal east-west
one. However, the north-south field collects a lot of energy in the summer and much less in
the winter. The east-west field collects more energy in winter than a north-south field and less
in the summer, providing a more constant annual output. Therefore, the choice of orientation
usually depends on the application and energy needed during summer or winter [37, 177,
179, 180].
Figure 4-12: Schematic of a parabolic trough collector [37]
The tracking mechanism of a parabolic trough collector is shown in Figure 4-13. The tracking
system must be reliable and able to follow the Sun with certain degree of accuracy and it
returns to its original position at the end of the day or at night. The tracking mechanism is
also used to protect collectors from hazardous environmental working conditions such as
wind gusts, overheating, and the failure of the thermal fluid flow system, by turning the
collector out of focus.
The tracking mechanism has two categories: mechanical and electrical/electronic. The
electronic system is more reliable and accurate in tracking [37, 177].

92
Figure 4-13: Parabolic trough collector tracking mechanism [37]
All parabolic trough plants currently in commercial operation rely on synthetic oil as the fluid
for heat transfer from the collector pipes to the heat exchangers, where water is preheated,
evaporated, and then superheated. The superheated steam runs a turbine, which drives the
generator to produce electricity. After condensation, water returns to the heat exchangers.
Parabolic troughs are the most mature system among CSP technologies and mostly used in all
commercial plants. A recent development in parabolic troughs collectors is the design and
manufacture of the Euro trough with a lightweight structure to achieve cost effective solar
power [37, 177, 180].
4.4.2.4 Parabolic Dish Collectors (Point Focus, Mobile Receiver)
Parabolic dishes concentrate on the solar radiation at a focal point above the centre of the
dish. The entire apparatus tracks the Sun in two axes, with the dish and receiver moving in
tandem, as shown in Figure 4-14. Most dishes have an independent engine/generator (Stirling
machine or micro turbine) at the focal point. Dishes have the highest solar to electric
conversion efficiency over any other CSP system. The salient features of dishes make it
competitive with PV modules, and other CSP technologies. A parabolic system can achieve
temperatures in excess of 1000°C [37, 177, 179, 180].
The salient features of parabolic dishes are; [177]
They always pointing towards the Sun, these are the most efficient of all collectors.

93
The concentration ratios are in the range of 600-2000, making it more efficient in
solar energy absorption and power conversion systems.
These have modular collector and receiver units that can function independently or as
part of a large system.
Figure 4-14: Schematic of a parabolic dish [37]
Parabolic dishes are limited in size (tens of kW or smaller) and each produces electricity
independently, which means that hundreds or thousands would need to be co-located for
large-scale production [37, 180].
4.4.3 Comparison of Thermal Collectors
For solar thermal cooling, most concentrating collectors are expected to be too expensive as
an input thermal energy system for building integrated solar cooling system. The high cost is
mainly due to the complexity of the tracking system [123].
However, tracking can provide a significant increase in energy output. A 10-year comparison
of stationary and tracking solar collectors is shown in Figure 4-15. The stationary collector
was tilted at 40° at Askov, Denmark. The annual energy output of the single axis vertical and
horizontal tracking is about 7% and 55% more than the stationary collector. The two axis
tracking collector has about 75% more energy output compared to the stationary collector
[181].

94
Figure 4-15: 10 year thermal performance of stationary and tracking collectors [181]
A thermal cooling system operates with an input heat at a temperature of between 60°C and
100°C, so a high temperature output of concentrating collectors is not required. For solar
thermal cooling, both flat plate and evacuated tube collectors are used [123].
Evacuated tube collectors are preferred over flat plate collectors due to the higher thermal
efficiency and to produce higher temperature output [182, 183]. Higher efficiency at low
incidence angles making them more suitable for daylong performance [177, 183].
Flat plate collectors are the most used collectors in solar cooling installations. Although
Evacuated tube collectors are expensive, they need less collector area compared to flat plate
collectors. The average collector area for a flat plate collector is 4.6m2/kWC, whereas for an
evacuated tube collector it is 2.5m2/kWC [132, 184].
4.5 Thermal Cooling Systems
Thermal cooling systems are driven by heat, instead of electric power to run the compressor
in a conventional vapour compression cooling system [132]. Thermal cooling systems are
always preferred when a large amount of waste heat energy is available. To couple with a
renewable energy system, such as solar thermal energy, these cooling systems are used for
solar assisted cooling and air-conditioning [185].
0
100
200
300
400
500
600
700
800
2001 2002 2003 2004 2005 2006 2007 2008 2009 2010
An
nu
al
en
erg
y o
utp
ut
(kW
h/m
2.y
ear)
Thermal performance of collectors
Stationary
Vertical
Tracking
Horizontal
Tracking
vertical+Horiz
ontal Tracking

95
In thermal cooling systems, sorption technology is used. In this technology, the cooling
effect is obtained by physical or chemical changes between a pair of substances (the sorbate
and the sorbent). The sorption system is classified into open and closed sorption systems. The
open sorption system includes a solid and liquid desiccant system whereas absorption and
adsorption systems are closed sorption systems [117, 120, 132].
There are of four main types of thermal cooling systems, which are:
Absorption system
Adsorption system
Solid and Liquid desiccant dehumidifiers
Ejector system
4.5.1 Absorption System
Absorption is a process in which two substances in different states are mixed into each other.
These two different states form a solution called a mixture. This process is reversible and can
occur by the addition or removal of heat. The first absorption system was introduced in 1895
[117, 120, 132].
Absorption system-based machines are the most commonly used thermal driven cooling
systems in solar cooling installations. In absorption systems, an absorbent, on the low-
pressure side, absorbs an evaporating refrigerant. The two most used combinations of fluids
include lithium bromide-water (LiBr–H2O), where water is the refrigerant and ammonia-
water (NH3 –H2O) systems, where ammonia is the refrigerant. The first pair is used for
building cooling and the second for low temperature applications [37, 117, 120, 132].

96
Figure 4-16: Schematic overview of solar absorption cooling system[120]
In the absorption refrigeration system, low pressure refrigerant vapour from the evaporator is
dissolved in the absorbent in the absorber, as shown in Figure 4-16. Then, the solution is
pumped to a high pressure with an ordinary liquid pump. The addition of heat in the
generator is used to separate the refrigerant from the solution. In this way, the refrigerant
vapour is compressed with less mechanical energy than the vapour compression systems
demand. The weak solution is then returned to the absorber through a heat exchanger to
recover heat. The remainder of the system consists of similar components to a vapour
compression system (a condenser, expansion valve, and evaporator [37, 120, 185].
The LiBr–H2O system operates at a generator temperature in the range of 70–95°C with water
used as a coolant in the absorber and condenser. The limitation of the LiBr–H2O systems is
that their evaporator cannot operate at temperatures much below 5°C since the refrigerant is
water vapour. Commercially available absorption chillers for air conditioning applications
usually operate with a solution of LiBr–H2O and use steam or hot water as the heat source
[37, 117, 132].
The single effect absorption chillers are mainly used for building cooling loads, where chilled
water is required at 6–7°C. The COP of single effect absorption system varies from 0.60 to
0.80. This variation is due to the heat source and the cooling water temperature. Single effect
chillers can operate with hot water temperatures ranging from about 65 to 150°C [37, 117,
120, 132].

97
The double effect absorption chiller has two stages of generation to separate the refrigerant
from the absorbent. The temperature of the heat source needed to drive the high-stage
generator is essentially higher, and is in the range of 155–205°C. Double effect chillers have a
higher COP of about 0.90–1.35. The triple effect machines can have a COP of about 1.70 [37,
117, 120, 132]. Absorption systems can use flat plate or evacuated tube collectors for single
and double effect machines, and evacuated tube or concentrated parabolic collectors for triple
effects cases [132].
From the literature, it is established that LiBr–H2O absorption systems are a mature
technology and have a good perspective for energy efficient cooling in buildings [124].
4.5.2 Adsorption System
Adsorption technology was first used for cooling systems in the early 1990s. The adsorption
process is surface phenomenon whereas absorption is a volumetric phenomenon [117, 120].
In adsorption systems, a solid (the adsorbent) and gas (the refrigerant) interact with each
other. The adsorbents are porous solids, and can reversibly adsorb large volumes of a vapour.
This interaction can be chemical or physical and depends upon adsorption forces. In chemical
adsorption, there is an exchange of electrons which occurs between solids and gas. In
physical adsorption, molecules of a refrigerant come to fix to the surface of the absorbent [37,
117, 120, 132, 185].
Solar adsorption’s practical application in the field of refrigeration is relatively recent. The
concentration of adsorbate vapours in a solid adsorbent is a function of the temperature of the
mixture (adsorbent and adsorbate), and the vapour pressure of the latter. Under constant
pressure conditions, it is possible to adsorb or desorb the adsorbate by varying the
temperature of the mixture. This forms the basis of the application of this phenomenon in the
solar-powered adsorption refrigeration, as shown in Figure 4-17 [37, 117, 120].
A number of different solid adsorption pairs, such as activated carbon–ammonia, zeolite–
water, zeolite–methanol, activated carbon–methanol, and silica gel-water are used. The
efficiency of adsorption systems is low. Many systems integrate the adsorbent bed and the
solar collector together by packing the adsorbent in the collector. For continuous operation,
two adsorption cycles are combined and such systems can have a COP of 0.60 [37, 117, 120,
132, 185].

98
Figure 4-17: Schematic diagram of solar adsorption system[95]
The activated carbon–methanol working pair was found to perform the best. Complete
physical property data is available for a few potential working pairs, but the optimum
performance remains still unknown. The advantages of adsorption system include: no danger
of damage due to high temperatures, environmentally friendly materials use, less usage of
electricity and low maintenance costs. The disadvantages are: a lower COP than absorption
systems, higher initial costs, and requiring a high vacuum tightness of the container [37, 117,
120, 132].
4.5.3 Solid and Liquid Desiccant Cooling System
A desiccant cooling system is the combination of evaporative cooling and dehumidification.
These are best suitable for application where humidity is low. These are open sorption
cooling systems as water is used as a refrigerant in direct contact with the ambient air. The
desiccants are natural or synthetic substances capable of absorbing or desorbing water vapour
due to difference of water vapour pressure between the surrounding air and desiccant surface
[117, 132, 185].
The driving force for the desiccant process is the difference in vapour pressure between the
air and the desiccant surface. When the water vapour pressure on the desiccant surface is

99
lower than air, water is absorbed by the desiccant. When the water is absorbed, the vapour
pressure in the desiccant is equal to that in the air, as shown in Figure 4-18.
Figure 4-18: Desiccant cooling process [186]
To allow for the repeated use of the desiccant, regeneration is required. This is accomplished
by heating the desiccant to increase its water vapour pressure. The heat required for
regeneration is supplied at a low temperature (60–110°C). Both solid and liquid desiccant
materials are used. These include lithium chloride, tri-ethylene glycol, silica gels, aluminium
silicates (zeolite), aluminium oxides, lithium bromide solution, and lithium chloride solution
with water [117, 186].
A desiccant cooling system comprises of three components; regeneration heat source, the
dehumidifier (desiccant material), and the cooling unit as shown in Figure 4-19 [186, 187].
Figure 4-19: Principle of desiccant cooling [186]

100
4.5.3.1 Solid Desiccant System
A solid desiccant cooling system uses rotating wheels made of silica gel, zeolite, or lithium
chloride as sorption materials. Figure 4-20 illustrates a solar-driven solid desiccant cooling
system. The system has two, slowly revolving wheels and several other components between
the two air streams and a conditioned space. The return air from the conditioned space first
goes through a direct evaporative cooler and enters the heat exchange wheel with a reduced
temperature (A-B). It cools down a segment of the heat exchange wheel when it passes
through (B-C) and is heated as it does so. This warm air stream is further heated to an
elevated temperature by the solar heat in the heating-coil (C-D). The heating-coil has a
temperature of between 50°C to 75°C. The resulting hot air regenerates the desiccant wheel
and is rejected to ambient (D-E). On the other side, fresh ambient air enters the regenerated
part of the desiccant wheel (1-2). Dry and hot air comes out of the wheel as the result of
dehumidification. This air is cooled down by the heat exchange wheel (2-3). Depending on
the temperature level, it is directly supplied to the conditioned space or further cooled in an
after cooler (3-4). If no after cooler is used, the cooling effect is created only by the heat
exchange wheel that was previously cooled by the humid return air at point B on the other
side. The temperature at point 3, T3, cannot be lower than TB, which in turn is a function of
the return air condition at point A, as shown in Figure 4-20 [117, 119, 132, 185].
Figure 4-20: An illustration of solar assisted solid desiccant cooling system [119]
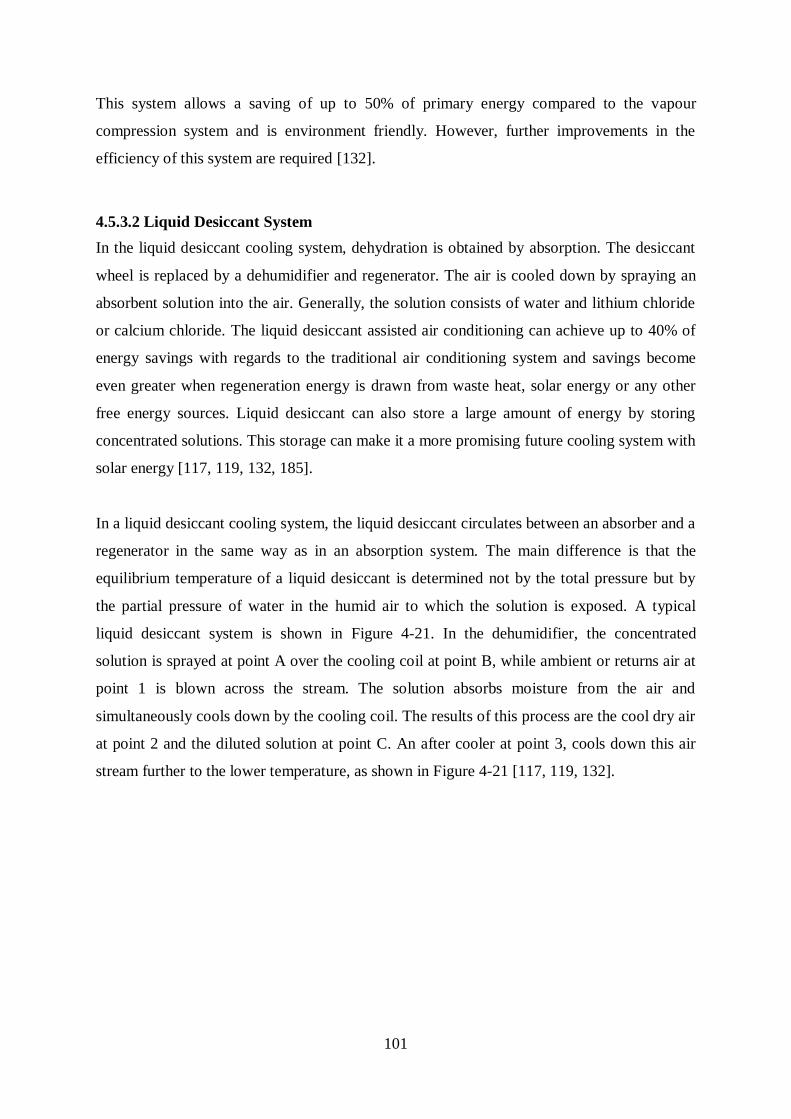
101
This system allows a saving of up to 50% of primary energy compared to the vapour
compression system and is environment friendly. However, further improvements in the
efficiency of this system are required [132].
4.5.3.2 Liquid Desiccant System
In the liquid desiccant cooling system, dehydration is obtained by absorption. The desiccant
wheel is replaced by a dehumidifier and regenerator. The air is cooled down by spraying an
absorbent solution into the air. Generally, the solution consists of water and lithium chloride
or calcium chloride. The liquid desiccant assisted air conditioning can achieve up to 40% of
energy savings with regards to the traditional air conditioning system and savings become
even greater when regeneration energy is drawn from waste heat, solar energy or any other
free energy sources. Liquid desiccant can also store a large amount of energy by storing
concentrated solutions. This storage can make it a more promising future cooling system with
solar energy [117, 119, 132, 185].
In a liquid desiccant cooling system, the liquid desiccant circulates between an absorber and a
regenerator in the same way as in an absorption system. The main difference is that the
equilibrium temperature of a liquid desiccant is determined not by the total pressure but by
the partial pressure of water in the humid air to which the solution is exposed. A typical
liquid desiccant system is shown in Figure 4-21. In the dehumidifier, the concentrated
solution is sprayed at point A over the cooling coil at point B, while ambient or returns air at
point 1 is blown across the stream. The solution absorbs moisture from the air and
simultaneously cools down by the cooling coil. The results of this process are the cool dry air
at point 2 and the diluted solution at point C. An after cooler at point 3, cools down this air
stream further to the lower temperature, as shown in Figure 4-21 [117, 119, 132].

102
Figure 4-21: A Solar assisted liquid desiccant cooling system [119]
In the regenerator, the diluted solution from the dehumidifier sprayed over the heating coil at
point E, connected to solar collectors and the ambient air at point 4, is blown across the
solution stream. Some water is taken away from the diluted solution by the air while the
diluted solution is heated up by the heating coil E. The result is a concentrated solution
collected at point F and the hot humid air is rejected to the ambient at point 5. A recuperative
heat exchanger preheats the cool diluted solution from the dehumidifier using the waste heat
of the hot concentrated solution from the regenerator, resulting in a higher COP [119].
The liquid desiccants have an advantage because of their operational flexibility and capability
of absorbing pollutants, and bacteria, and being regenerated at relatively low temperatures.
Other advantages are high energy storage and the ability to continuously pass a large volume
of air through a close system. The disadvantages of liquid desiccant cooling systems include
less dehumidification in humid climates, a relatively larger size, and heavier and reduced
efficiency due to air leaks [117, 119, 132, 140].
A study of a hybrid cooling system, conventional electrical and desiccant cooling systems in
four different locations worldwide (Hamburg, Chicago, Sao Paulo, and Singapore), showed
that the solar cooling system is not yet economically viable [124, 188].

103
4.5.4 Ejector System
A solar ejector cooling system is a low grade thermal energy driven technology. The ejector
is a thermally driven compressor that operates on a vapour compression refrigeration cycle.
The generator and ejector take the place of the electric compressor; it uses heat rather than
electricity to produce the compression effect in a vapour compression system. A solar ejector
system is shown in figure 4-22 [132].
Figure 4-22: Schematic view of solar ejector cooling system [132]
The ejector cycle start from the generator exit, where the refrigerant is in a superheated state.
Under these conditions, the internal geometry of the ejector sucks the evaporator vapour for
its compression at an intermediate pressure. The working fluid enters the condenser and it is
cooled down to a saturated liquid state. After the condenser fluid is divided into two streams;
the first stream is pumped to the evaporator generator. The other stream is passed through an
expansion valve, to create a cooling effect and then enters the evaporator. In the evaporator it
exchanges heat for space cooling [117, 185].
Ejectors have been used in evacuating air from low-pressure steam condensers. An ejector in
this application acts as a vacuum pump, driven by low pressure steam. Efficiency was not as
important as reliability. It was a small step to form a vapour compression heat pump using an
ejector as a heat driven compressor. Steam-driven ejector heat pumps became common in air
conditioning, particularly in hotels and ships during the early 20th century. Ejector systems
were found to be low cost, very reliable and maintenance free. The main advantages are the
absence of moving parts, being smaller in size, having lower initial costs, and the simplicity
in design. They also consume less electricity compared to other refrigeration systems. The
104
main disadvantage of the ejector is its low COP compared to other cooling systems. The COP
of ejector systems is in range of 0.20-0.33, which is much lower than vapour compression or
absorption systems. Due to low COP, ejector systems’ use is not preferred [132, 140].
From the literature presented on solar thermal cooling systems, it is observed that absorption
cooling systems are most commonly used in all of the installations. Single effect absorption
systems can be used with both flat plate and evacuated tube collectors. As presented in
Section 4.4.3, evacuated tube collectors are more efficient and require less space than the flat
plate collectors, therefore in this research, the absorption cooling system with an evacuated
tube collector will be investigated for the feasibility of a solar cooling system for the climate
of Pakistan.
4.6 Solar Cooling for Hot Climates
Locations across the world with minimum annual solar insolation of 2000 kWh/m2 and a
location between 40° north and south latitude are considered suitable and favourable for the
installation of solar thermal system applications. The suitable locations include Australia,
Africa, Europe (Mediterranean countries), China, Russian federation, Middle East, India,
Pakistan, Iran, South and Central America and USA (South-Western) [140].
In hot climates, air conditioning in buildings is increasing and conventionally provided by
electric driven cooling systems. To reduce the load on an electrical network during peak
loading time, thermal driven cooling systems powered by solar energy can be used [22].
Many researchers have investigated solar cooling systems for hot climates. As early as the
1960s Chinnapa [144] and Tablor [189], concluded from experimental studies that flat plate
collectors could be used to drive heat-operated cooling systems. In the 1970s, Ward et al.
[149, 152, 190-193], studied the operations of a solar cooling system installed at a CSU solar
house in the USA. Muneer [194], Uppal [195], presented a feasibility and design study of a
solar cooling system for Libya. The collector tilt angle for maximum energy output and
capacity of the absorption chiller was proposed. Ayyash [196], and Homoud et al. [197]
presented feasibility and experimental studies of solar vapour absorption cooling systems
with a flat plate collector for Kuwait. It was found that the COP of the cooling system and the
saving in electricity consumption was 0.60 and 25-40% respectively.

105
Yueng at al. [198] and Fong et al. [118] presented experimental and comparative studies for
solar-powered cooling systems for Hong Kong. The experimental absorption system, with a
flat plate collector showed an annual efficiency of 7.8%, with an average solar fraction of
55%. The later compared the performance of five different cooling systems for buildings. On
the basis of a year-long operation, for the best total primary energy consumption, the order of
solar systems is; solar electric compression refrigeration, solar absorption refrigeration, solar,
adsorption refrigeration, solar solid desiccant cooling and solar mechanical compression
refrigeration. For solar collectors, the primary energy consumption of the evacuated tube
collector is 29.2% less than the flat plate collector for absorption refrigeration. For the same
area, the evacuated tube collector collected 81% more energy than the flat plate collector
during a one-year operation. It is concluded that a solar absorption cooling system (either
with a flat plate or with evacuated tube collectors) can save 15.6% to 48.3% in annual energy
compared to conventional electric compression systems.
Sorour [199], Elsafty [200], and Schwerdt [201], investigated the feasibility, economic and
experimental studies of a solar cooling system for Egypt. It is found that solar cooling
systems with both flat plate and evacuated tube collectors can provide sufficient energy for
operation. The economic study showed that the total cost of a double effect vapour absorption
system is 45% and 37% lower than a single effect and vapour compression cooling system,
respectively. The experimental study for the adsorption system showed that the COP of the
system in the summer was 0.25 to 0.30. The thermal efficiency of the CPC collectors was
observed from 50-65%. Izquirdo et al. [202], Syed et al. [203] and Martinez et al. [204],
presented experimental and test results of designed, solar absorption cooling systems for
Spain. Solar cooling systems with flat plate collectors and hot water storage systems showed
a COP from 0.34 to 0.691. The specific collector area was from 1.5-2.2 m2/kWC.
Balghouthi et al. [205, 206], presented a feasibility and optimisation study of the solar
cooling system for Tunisia. A system consists of 11kW LiBr-H2O absorption chiller with
30m2 flat plate collector tilted at 35° with a 0.80m
3 hot water storage tank, was proposed.
Pongtornkulpanich et al. [207], presented an experimental study of a 35.2kW LiBr-H2O
single-effect absorption cooling system in Thailand. The evacuated tube collector of area
72m2 provided an 81% solar fraction. Kim [165] studied the performance of an air cooled
Libr-H2O absorption chiller in extremely hot weather at 35°C and 50°C ambient temperature.
It is observed that at 50°C, the COP of the direct and indirect air cooled chiller was decreased
to 81.6% and 75% and the cooling power also decreased by 37.5% and 35.6% respectively

106
compared to 35°C. It is established that the direct air cooled chiller design is better in terms
of energy efficiency.
Alili et al. [208, 209], optimised and proposed a solar cooling system for Abu Dhabi. The
optimisation carried out for a 10kW absorption system with evacuated tube collectors of area
3.4m2/kWC and it was established that it could save up to 35% in energy compared to
conventional electric compression systems. Another model was proposed of the same
capacity, with an evacuated tube collector specific area 6m2/kWC and a hot water storage tank
with a specific volume of 0.1m3/kWC. The proposed system can save 47% in primary energy
and 12 metric ton/year of CO2 emission. Ssebataya et al. [210], investigated the performance
of a solar cooling system in UAE conditions. A 35.2kW solar absorption system with a
128m2 evacuated tube collector and 1m
3 hot water storage was used to cool 96.75m
2 floor
areas with 22°C indoor set point. The COP of the cooling system was observed from 0.60 to
0.80.
Tsoutsos et al. [211], proposed the design of a solar absorption cooling system for a Greek
hospital. The performance of the system in four different cities in Greece was analysed.
500m2 solar collectors provided 74.23% solar fraction with 15m
3 hot water storage. The
efficiency of the solar cooling system was highest in the most southern locations. Praene et
al. [212], carried out simulation and experimental investigations of a solar absorption cooling
system in Reunion Island. A solar-driven 30kW LiBr-H2O single effect absorption chiller
with 90m2 double glazed flat collectors and 1.5m
3 hot water storage was investigated. The
room temperature set point was 25°C and a 100% cooling load was provided by the solar
cooling system. It was concluded that the solar assisted cooling system could save CO2
emission of 0.23kg /kWC compared to a conventional electric compression system.
Ayadi et al. [213], presented a performance assessment for a solar cooling system for office
buildings in Italy. A 17.6kW absorption chiller with flat plate collectors of a 61.6m2 absorber
area, and 5m3 hot and 1m
3 cold water storage was installed. The thermal efficiency of the
collector was 30% to 40% and the absorption chiller COP was 0.55. Fasfous et al. [214],
studied the potential of utilising solar cooling in the University of Jordan. The analysis was
performed using an 8kW solar cooling system. A flat plate collector with an area of 40m2,
and 2.3m3 hot water storage tanks was used and provided a 15-25% solar fraction. The
economic analysis showed the system pay back is assumed 24 years and concluded that the
solar cooling system is not feasible with the proposed system.

107
Eicker et al. [22, 124], studied the energy and economic performance of solar cooling
systems worldwide. Six different locations were selected and it was found that the evacuated
tube collectors can reduce the collector area by 50% compared to flat plate collectors. It is
found that both solar electric and thermal cooling can reduce primary energy consumption by
21-70% depending on location, building standard and internal load conditions. Solar thermal
systems showed a better match to the demand and supply compared to the solar PV electric
system. It is established that in hot regions, solar cooling costs are quite comparable with
conventional cooling costs. It is found that in the hot climates of Jakarta and Riyadh, the
specific costs are as low as 0.09 to 0.15 €/kWh. The solar cooling systems can save CO2
emissions from 30-79%.
Assilzadeh et al. [162] simulated and optimised a 3.5kW solar absorption cooling system for
Malaysia, Sim [215] modelled and simulated 4.5kW solar thermal cooling system for Qatar,
Sharkawy et al. [216] investigated the potential application of a solar cooling system for
Egypt and Saudi Arabia, Ozgoren et al. [217] investigated the performance of a 3.5kW solar
absorption cooling system for Turkey and Mazloumi [164], simulated 17.5kW solar
absorption cooling system for Iran. The results of these studies are similar to the literature
presented earlier.
The literature of studies presented above are both simulation and experimental. The literature
showed that in most of the studies flat plate collector is used, however, it was also established
evacuated tube collector uses less than half area for same energy output compared to flat
plate collector [22, 124, 198]. It was also established that vapour absorption cooling system is
most widely used and has higher COP than other cooling systems[118]. The building
integrated systems have successfully maintained the selected set point for room
temperature[210, 212]. It was also found that energy consumption and CO2 emission saving
by all solar cooling systems is significant [22, 118, 124, 208, 209]. It was also proved that for
hot climates solar thermal cooling system performance is better than solar electric cooling
system[22, 124].
These studies presented differ in many aspects as performance indicators vary by location.
The literature presented is for different climatic conditions worldwide with different solar
energy potential. The systems and results are different for; collector area (30-500 m2),
collector type (Flat plate or evacuated tube), collector efficiency (7.8-65%), collector tilt (at

108
location latitude), collector specific area (1.5-6m2/kWC), hot water storage tank volume (0.8-
15m3), water storage type (hot-cold),chiller type (absorption or others), Chiller capacity
(3.52-35.2kW), chiller COP (0.25-0.80), building integration and room set point (22-25ᵒC),
solar fraction (15-81%), electrical energy saving (15.6-70%) and cooling tower types (wet or
air cooled) and comparison of different mode of operations and different systems.
All these studies were beneficial for the selection of different components for current
research. This include selection of type of collector, type of storage tank, type of chiller,
mode of operation of chiller (single or double), cooling tower type (dry or wet) and other
operational parameters for these components. The detailed justification for each of these
components is given in Chapter 6. The data of these studies is also used for results validation
and parametric analysis as no experimental data for Pakistan and neighbouring country is
available for solar powered absorption cooling system.
4.6.1 Solar Cooling System Research for Pakistan and India
Little literature is available on the doctoral, and academic published research on solar cooling
systems in Pakistan and India. Most of the research work carried out is on solar desiccant
cooling systems.
Khalid at al. [54, 55], presented a study of a solar assisted hybrid desiccant cooling system
for the climate of Pakistan. Khalid et al. [218], presented an experimental and simulation
study of a solar assisted pre-cooled hybrid desiccant cooling system for Pakistan. The
experiments were performed on a gas fired pre-cooled hybrid solid desiccant cooling system
test rig for highly humid Karachi weather. The TRNSYS model of the same system was
validated by experimental results. Both experimental and simulation results were in good
agreement with each other and other research studies. The experimental data were used as
input for the TRNSYS model. The economic assessment of the system showed a payback
period of 14 years.
Gupta et al. [219] carried out research on an open cycle 10.5kW desiccant solar air
conditioner-concept, design and cycle analysis. Bansal et al. [220] carried out experimental
study of performance testing and evaluation of solid desiccant solar cooling unit in Delhi.
The system had very low cooling capacity of 1.5kWh/day. The theoretical and experimental
COP of the system was 0.143 and 0.081. It was concluded that for Delhi climatic condition
the unit needs to be re-designed. Jani et al.[221] simulated solar assisted solid desiccant

109
cooling systems using TRNSYS. The system was designed for 60kW cooling load with inside
set point condition at 50% RH and 25ᵒC. It was observed that system in recirculation mode
showed higher COP than in ventilation mode. Mittal et al.[222] investigated modelling and
simulation of a solar absorption cooling system for India. The performance of 10.5kW solar
driven LiBr-H2O absorption cooling system with flat plate collector was investigated. It is
found that system performance was highest at 80ᵒC temperature from the storage tank.
Kumar[223] in 1990, completed doctoral research on “Thermal design and performance
evaluation of vapour absorption/adsorption solar space conditioning systems”. It was
concluded that open cycle absorption cooling system with solution storage option is feasible
for continuous air-conditioning in India [224]. A comparative study with methanol-
LiBr.ZnBr2, methanol- LiI.ZnBr2 and H2O-LiBr mixtures has also been undertaken. It was
found that the COP of the methanol-LiI.ZnBr2 and methanol-LiBr.ZnBr2 mixtures are almost
the same, while for the H2O-LiBr mixture, the COP is slightly higher than other mixtures
[225]. It is also concluded that double absorption solar cooling systems are better in
performance than conventional systems [226]. It was found that a desiccant cycle is more
efficient under high latent heat load and higher ambient humidity conditions and uses less
energy compared to conventional vapour compression cooling systems[227]. Habib et
al.[228] simulated a solar heat driven adsorption chiller for Indian city of Durgapur. The
result showed that this chiller is capable of providing cooling throughout the year under the
climatic condition of studies location. The literature also showed that combination of
different collectors and cooling system from 30kW to 350kW capacity, solar powered
cooling systems are in operation in India [229]. The detail of operational parameters and
other specification is not available.
The literature presented showed that most of the research was carried out on desiccant and
adsorption cooling system for hot and humid climatic conditions [218-221]. This limitation
(hot humid climate) creates a need and potential of solar powered cooling system for hot and
dry climatic conditions for the current research, as the climatic condition of Lahore is hot and
dry.
Mittal et al.[222], Kumar [223], and Habib et al.[228] studied systems suitable for hot dry
climates (absorption and adsorption); their work shows that these systems are capable of
providing cooling using solar energy. The current research is detailed analysis of solar
powered cooling system with building integration as their work does not provide details and
validation.

110
4.7 Conclusion
Cooling systems share a major part of total energy consumption in buildings through
electricity. Solar energy-based cooling systems can significantly reduce the grid consumption
of fossil fuel-based generated electricity and help to reduce CO2 emissions. Solar cooling
systems can help to promote environmentally friendly refrigerants. The main advantage of
solar cooling is that maximum solar energy is available when the cooling load is required in
the summer. The use of solar cooling systems is increasing in line with clean energy goals
and under IEA policy and solar cooling will contribute to 17% of total energy use in cooling
by 2050.
Solar electric systems are suitable for small size refrigeration or in remote areas with no grid
supply. The application of solar electric cooling systems is limited and only a few systems are
available in the literature. Solar PV systems can only use about 35% of the spectrum of
incident solar light. Solar electric systems have showed lower performance in hot climates as
the efficiency of solar to electric conversion is reduced by an increase in ambient
temperature.
Solar thermal cooling systems’ use and development started in the 60s. Different techniques
have been developed as being suitable to solar energy availability and output capacity. Solar
thermal systems work efficiently in high ambient temperatures and use about 95% of the
spectrum of incident solar radiation.
Concentrating solar collectors are normally used for electricity generation only. CSP systems
are designed to produce medium (400-550°C) to high (600-1000°C) temperature heat for
electricity generation or for the co-generation of electricity and heat.
Flat plate collectors are the most used collectors in solar cooling installations. Evacuated tube
collectors have high efficiency with low radiation and have a wide range of applications
compared to other stationary collectors. Although evacuated tube collectors are expensive,
but they need less specific collector area compared to flat plate collectors. The average
collector area for flat plate collectors is 4.6m2/kWC whereas for evacuated tube collectors its
2.5m2/kWC. For this research, the solar cooling evacuated tube collector will be used for hot
water to be used in the cooling system.

111
Four types of cooling systems are being used for solar thermal cooling. From the literature it
is established that the absorption system is the most efficient, mature and widely used due to
its commercial availability. Single, double, and triple effect absorption systems have been
developed for applications and efficiency range. For this research, a single effect vapour
absorption cooling system will be used.
The use of desiccants and adsorption systems is new for solar cooling and research is ongoing
to improve process efficiency. An ejector system-based cooling technique is not new but it is
not favourable as compared with compression and absorption systems due to lower
efficiency. Research is being carried out on ejector systems for efficiency improvement with
different refrigerants and effective use for solar cooling.
Despite its attractiveness, solar thermal cooling technology is still in the development stage.
Most installations currently in operation showed differences in the collector area per kilowatt
of cooling capacity. The general range of collector area for thermal cooling system is
between 2m2 to 10m
2 per kWC.
For hot climates, solar cooling is economical compared to conventional compression cooling
using electricity. For Pakistan’s climatic conditions, the experimental and simulated solar
assisted desiccant cooling system showed feasibility of the system operation to meet the
cooling loads in summer.

112
Chapter 5: Methodology
5.1 Introduction
A detailed literature review for solar cooling systems has been presented in chapter 4. Types
of solar cooling systems, solar collectors, and thermal cooling systems were described. This
chapter is about the methodology available and adopted for research into building integrated
solar thermal cooling systems for Pakistan’s climatic conditions.
The proper sizing of a solar cooling system is a complex task which includes both predictable
(collector and other component performance characteristics) and unpredictable (temperature
and humidity) components. The system can be used either as a standalone system or with
conventional air conditioning [211, 230]. To evaluate the feasibility and performance of a
solar cooling system two widely-used techniques are the manufacturing of a prototype and
experimental evaluation, and dynamic simulation. In this chapter a detail of literature is
presented about experimental and simulation studies for solar cooling systems and
meteorological data types are explained. The selected technique with details is presented in
the next sections.
The problem in designing a new solar cooling facility is that there are no standard
specifications and configurations to follow due to variation in climatic conditions and
building characteristics. Every case is a specific, and detailed study (optimisation) is required
to achieve maximum efficiency of the system. Different tools and systems are used by
researchers for solar cooling system studies worldwide [231].
The solar cooling system can be designed and evaluated by two possible criteria. One
criterion is where solar cooling system contributes according to its capacity and providing a
share of total cooling demand. The second criterion is where solar cooling system provides
total cooling demand with solar energy. a system based on the first criterion can produce the
most cooling energy from a given system. The second criteria based system is more complex
to obtain an optimum configuration as there is the need to meet the total cooling demand.
Such systems are best for thermal comfort in small scale facilities for domestic applications
[231].
This research is aimed to evaluate performance of a building integrated solar powered
absorption cooling system. The goal is to use the solar energy to meet the whole cooling
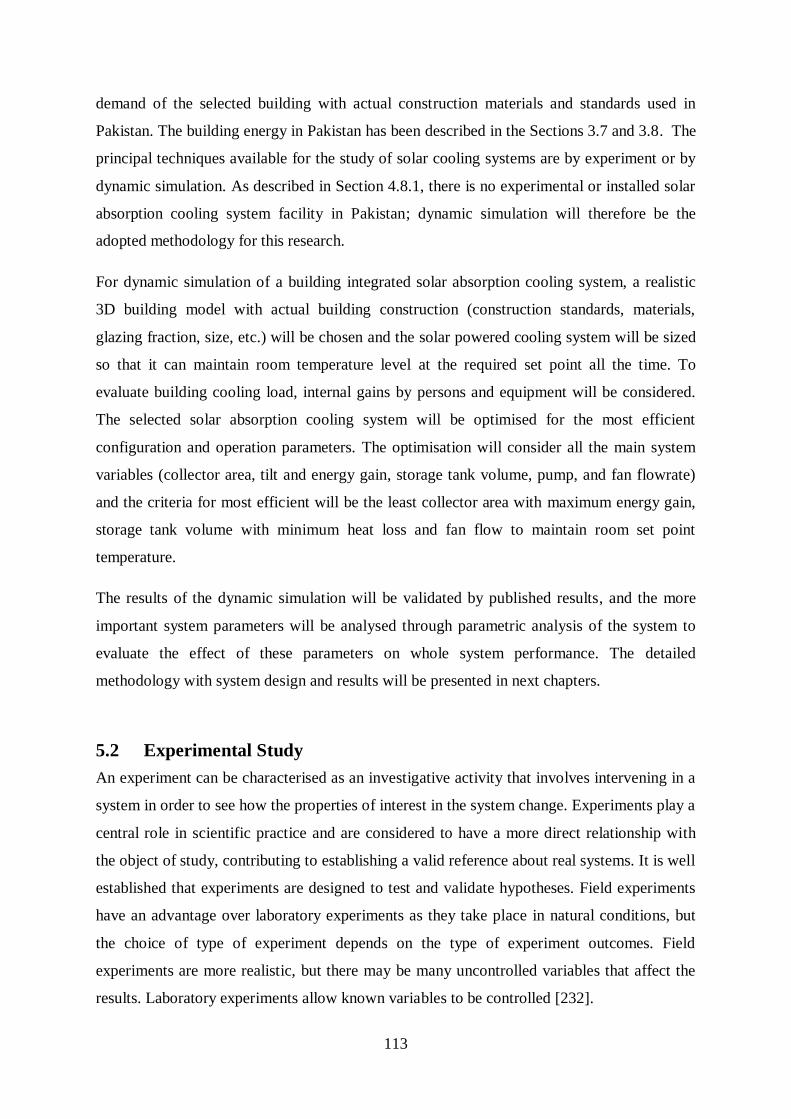
113
demand of the selected building with actual construction materials and standards used in
Pakistan. The building energy in Pakistan has been described in the Sections 3.7 and 3.8. The
principal techniques available for the study of solar cooling systems are by experiment or by
dynamic simulation. As described in Section 4.8.1, there is no experimental or installed solar
absorption cooling system facility in Pakistan; dynamic simulation will therefore be the
adopted methodology for this research.
For dynamic simulation of a building integrated solar absorption cooling system, a realistic
3D building model with actual building construction (construction standards, materials,
glazing fraction, size, etc.) will be chosen and the solar powered cooling system will be sized
so that it can maintain room temperature level at the required set point all the time. To
evaluate building cooling load, internal gains by persons and equipment will be considered.
The selected solar absorption cooling system will be optimised for the most efficient
configuration and operation parameters. The optimisation will consider all the main system
variables (collector area, tilt and energy gain, storage tank volume, pump, and fan flowrate)
and the criteria for most efficient will be the least collector area with maximum energy gain,
storage tank volume with minimum heat loss and fan flow to maintain room set point
temperature.
The results of the dynamic simulation will be validated by published results, and the more
important system parameters will be analysed through parametric analysis of the system to
evaluate the effect of these parameters on whole system performance. The detailed
methodology with system design and results will be presented in next chapters.
5.2 Experimental Study
An experiment can be characterised as an investigative activity that involves intervening in a
system in order to see how the properties of interest in the system change. Experiments play a
central role in scientific practice and are considered to have a more direct relationship with
the object of study, contributing to establishing a valid reference about real systems. It is well
established that experiments are designed to test and validate hypotheses. Field experiments
have an advantage over laboratory experiments as they take place in natural conditions, but
the choice of type of experiment depends on the type of experiment outcomes. Field
experiments are more realistic, but there may be many uncontrolled variables that affect the
results. Laboratory experiments allow known variables to be controlled [232].

114
More than 1,000 solar thermal cooling systems have been installed worldwide. The available
literature shows that often hybrid systems with free cooling support are installed and
evaluated [124]. Most installations in operation are part of demonstration projects and most
of the systems are in European countries [204].
The first experimental study of solar cooling systems was carried out by Chinnappa in 1962
using a flat plate collector [144]. The first design and construction of a residential solar
cooling and heating system was presented in 1975 by Ward et al. [190]. Some other
researchers also presented experimental results for different solar cooling systems in the late
1970s and early 1980s [150-152, 191, 192]. The first experimental study using an evacuated
tube collector for solar heating and cooling was presented by Ward et al. in 1979 and some
other researchers in later years [152, 193, 233]. In the 1980s many experimental studies were
presented with different designs and arrangements for solar cooling systems [154, 234-239].
In the 1990s studies were presented to show the performance of some existing systems and
some newly installed absorption and adsorption cooling systems in different locations
worldwide [158, 197, 198, 202, 220, 240-243]. In the 2000s experimental work was carried
out with all four types of solar cooling systems, hot and cold water storage, all stationary
collectors and both stand alone and fossil fuel heat energy back up [159, 163, 203, 207, 244-
249]. Some studies were carried out to analyse the performance of stratified storage tank use
in solar cooling systems [250, 251]. In the late 2000s and after 2010 experimental studies
were fewer in number as most of the studies were carried out as dynamic simulations [169,
201, 214, 252-262]. Some experimental studies were performed to verify and validate
different simulation results. [169, 204, 212, 213, 255, 263-266].
All the experimental studies were carried to evaluate the potential of solar cooling systems,
the economics, the parametric analysis, the efficiency of solar thermal collectors and cooling
systems for a specific location. Most of the systems were building integrated and to be used
for both heating and cooling purposes.
In Pakistan research on the application of solar energy cooling systems is limited. As
presented in Section 4.8.1, one solar assisted desiccant cooling experimental set up and the
TRNSYS simulation program is available at NED University Karachi (Pakistan). The
experimental results are limited to a humid area as the climate of Karachi is different from the
typical climate of the rest of the country [55, 218]. In first year of research, contacts were
made consistently with Dr. Khalid (the author of the above references) for equipment
specification and possible experimental work on solar cooling, but no answer was received.

115
The application of solar thermal systems for cooling is not setup or available for experimental
work at the present author’s university in Lahore.
In the early months of the second year of study, contact was made to try to establish the use
of experimental facilities at UAE University Al-Ain, but due to time limitations, the
experimental set up could not be arranged so a simulation option was selected as suitable
simulation program was available at the University of Manchester.
5.2.1 Limitations of Experimental Study
Experimental studies provide opportunity to identify cause and effect relations. One major
limitation of experimental study is that experiments are conducted in a particular environment
and results may be hard to generalise except field and natural experiments [267]. Another
limitation is that the environment is likely to affect the results, but perfect controlled
conditions are generally not possible. The experimental research may be able to tell that one
method, design, etc. is better than other, but may not able to explain the reason [268].
The experimental studies carried out on solar cooling have described, collector area, collector
type, collector tilt, collector yield and efficiency, storage type and volume, chiller type and
capacity, chiller COP, solar fraction , Solar COP and Electrical COP. The most common used
equipment is flat plate and evacuated tube collector, hot water storage and vapour absorption
chiller. Use of other collector types, cold water storage, stratified tank, other types of cooling
systems and parametric study of the systems is limited.
The studies of solar cooling systems mentioned in previous section have several limitations.
The duration of the studies was limited to few hours or days only in most of the
research and only few have been carried out for a season or year [159, 166, 198, 233,
234].
All the studies are based on components temperatures and the heat balance of the
whole solar thermal cooling system is not presented in details from heat input to the
heat rejection at each component or system level [212, 213, 245, 253, 264].
The room temperature set point and relative humidity of the building integrated
systems have not been described, in all of the studies. Only building conditioned area
is described no information is provided about the building construction materials,
windows, door, and orientation [201, 214, 220, 234, 240, 247, 269].

116
The experimental studies described the size and type of hot and cold water storage but
no detail is provided about heat loss /gain from these tank and average temperature
[193, 220, 234, 240, 241, 244, 247].
The solar energy collectors type, area and tilt is described but no detail is provided
about collector efficiency curve, flow control, pump capacity and effect of tilt on
collector energy yield [253, 260].
Most of the studies are without building integration and studies with integration have
no description about cooling coil and fan specification [201, 214, 220, 234, 240, 247,
269].
Most of the studies have solar fraction less than 50% and no study was carried out
about 100% solar fraction [159, 163, 203, 207, 214, 244-249, 260].
The experimental studies results do not enable us to predict performance of the proposed
system of the current research.
5.3 Simulation Study
Simulation is the production of a computer model for a system and it complements a physical
experiment. Simulations are numerical experiments and give system performance information
similar to physical experiments. These are relatively quick, inexpensive, and produce
information on the effect of design variables and system performance. Simulation can be used
for exploring new conditions not present in particular real world settings. Using cost data and
economic analysis, simulation results can be used to find economical systems. Simulation is a
powerful tool for research, development and design of systems [40, 270].
Computer modelling of thermal systems has many advantages. It is effective for parametric
studies and helps to investigate the effects of system variables on performance. A wide range
of climatic data can be used to determine the effects of weather on design. It eliminates the
expense of building prototypes, and provides complete understanding of system operations. It
makes it easy to optimise systems and output estimation [40, 141, 230].
The use of simulation for study of solar processes has been used since the late 1960s [40].
The first simulation study was carried out by Sheridan et al. in 1967 for solar water heaters
[271]. Many other researchers carried out simulation for different solar heating and solar
cooling systems in the late 1960s and early 1970s [146, 272-277]. The first simulation study
on design and optimised systems for residential heating and cooling by solar energy was
carried out in 1974 [278]. The first simulation study for hybrid solar air conditioning was

117
presented in 1976 [148]. In the 1980s many studies were carried out for simulation of solar
cooling systems and thermal performance and economics were analysed [155, 279]. In the
1990s feasibility studies, design optimisation, modelling and technical assessment of solar
cooling systems was simulated [199, 280, 281]. In the 2000s most of the simulation research
was carried out on solar cooling systems based on absorption, for which integrated systems
were built with different collectors, energy and carbon emission saving with solar cooling
systems [24, 162, 164, 205, 206, 282-286]. Some studies were carried out to compare
simulation results with actual installation data [287, 288]. After 2010 most of the simulation
studies were on design, performance, optimisation, and sensitivity analysis of solar cooling
systems and comparisons of different solar cooling systems [22, 23, 118, 178, 188, 204, 208-
211, 215, 265, 289-310].
Simulation studies are nearly as old as the experimental studies for solar thermal heating and
cooling systems[40]. After 2000, most of the literature available about solar thermal cooling
systems relates to simulation of solar cooling systems more than experimental studies. The
literature referred shows that TRNSYS is the most widely used simulation program.
The literature presented above described collector area and yield, collector tilt, collector flow,
storage tank type, heat loss, and capacity, pumps power and flow, type of cooling tower,
chiller type, capacity and COP, results validation and sensitivity analysis of the system,
building geometry, materials, heat gains and infiltration. Some other advantages of the
simulation studies include the comparison of different building materials, change of locations
worldwide, different cooling systems, collector’s type change, storage types, and other
parametric variation in the system operation.
The literature showed that solar cooling system simulation studies are flexible, detailed, and
can help to study different and maximum efficient system design for any location worldwide.
However, none of the studies in the literature cover the proposed system for Pakistan.
5.3.1 Limitations of Simulation Study
Simulations are powerful tools for system design and analysis but there are some limits in
simulation use. It is easy to make mistake by assuming incorrect values for system
parameters, and neglecting important factors. A high level of skill and scientific judgement is
required for useful results. Physical problems such as leaks, plugged or restricted pipes, scale

118
on heat exchangers, failure of controllers, poor installation of collectors and poor insulation
cannot easy modelled or accounted [40, 141].
Simulations programs deal only with thermal process but mechanical and other factors can
also affect the thermal performance of solar systems. There is no substitute to carefully
conducted experiments. A combination of simulation and practical experiment can lead to
better understanding of the system [141].
5.4 Solar Energy System Simulation Programs
Simulation programs should ideally offer computational speed, low cost and ease of use.
Over the years many programs have been developed for modelling and simulation of solar
energy systems. The most popular programs are WATSUN, Polysun, f-Chart, and TRNSYS.
TRNSYS is used for both solar energy and building energy systems so its details are
presented in Section 5.5.
5.4.1 WATSUN
Watsun simulates active solar systems and was developed by the Watsun simulation
laboratory at the University of Waterloo, Canada in the early 1970s. It models two kinds of
systems: solar water heating systems without storage and solar water heating with storage. It
combines collection, storage, and load information with the hourly weather data for a
location. Both hourly and monthly reports include data about solar radiation, energy
collected, load, and auxiliary energy. It can calculate long-term performance and economic
analysis to assess the costs and profits of the solar heating system [141, 230].
WATSUN uses TMY weather data with hourly values for global radiation on a horizontal
surface, dry bulb temperature, wind speed, and relative humidity. It uses a synthetic weather
generator WATGEN, which uses monthly average values and generates hourly data for a
given location. The user defines one input file called simulation data files and Watsun
generates three output files: a listing file, an hourly data file, and a monthly data file. The
systems that can be modelled include domestic hot water, pool systems, and industrial
process heating. The program models each component in the system, such as the collector,
pipes and tanks [141, 230].
The program was validated by developers against the TRNSYS program using several test
cases. The comparisons were very favourable; differences in predictions for yearly energy
delivered were less than 1.2% in all configurations tested [311].

119
WATSUN was not used for this research because it cannot simulate solar cooling systems
and building energy together at once.
5.4.2 Polysun
This program provides dynamic annual simulations of solar thermal systems and helps
optimisation of the system. The basic systems that can be simulated include: domestic hot
water, space heating, swimming pools, process heating, and cooling. It provides simulation
with a dynamic time step from 1 second to 1 hour. Worldwide meteorological data for 6,300
locations are available. Polysun has a claimed accuracy within 5-10% variation. It is a
program with economic viability and ecological balance, which includes emissions of the
eight most significant greenhouse gases. The emissions for a solar integrated system and the
conventional fuels can be compared [141, 230].
Polysun was not used for this research because it cannot simulate building integrated solar
thermal cooling systems and building energy.
5.4.3 f-Chart Method and Program
The f-chart method provides a mean for estimating the annual thermal performance of active
heating systems common in residential applications, using air, or liquid as a working fluid.
The f-chart is used to estimate the fraction of a total heating load that can be provided by a
solar system. The f-chart was developed by Klein et al. [147, 312] and Beckman et al. [313].
The primary design variable is the collector area and the secondary variables are the collector
type, storage capacity, fluid flow rates, and load and collector heat exchanger sizes. This
method correlates the results of many hundreds of thermal performances of solar heating
system simulations performed on TRNSYS, in which the simulation conditions were varied
with practical system designs. The resulting correlations give f, the fraction of the monthly
load supplied by solar energy as a function of two dimensionless parameters. One is related to
the ratio of collector losses to heating load, and the other to the ratio of absorbed solar
radiation to heat loads. The f-chart system was developed for three standard system
configurations: liquid and air systems for space and hot water heating, and systems for
service hot water only [141, 230].

120
The f-chart program was developed by the developers of TRNSYS and the model is intended
only for solar heating systems. This program can be used to estimate performance for all
stationary solar collectors, and one or two axis tracking concentrated collectors. This
program, however, does not provide the flexibility of detailed simulation and performance
investigation in the same way that TRNSYS does[230].
f-chart was not used for this research because it cannot simulate solar cooling systems and
building energy. Also it cannot be used for detailed simulation of solar thermal systems as it
is used to simulate fractions only.
5.5 Building Energy Simulation Programs
Building energy system simulation programs can calculate the behaviour of building thermal
control systems and the resultant impact on energy use, peak energy demand, equipment
sizing and occupant comfort as well as providing performance details. An energy efficient
and effective design, detailed analysis of building energy demand, energy savings, and supply
technologies can be tested and optimised by such programs. Many building energy simulation
programs for evaluation of energy efficiency, renewable energy, and sustainability are
developed. Here the popular programs that are commonly used for simulation of energy
systems in buildings are the only ones discussed.
5.5.1 Energy Plus
Energy plus is an energy analysis and thermal load simulation program. Energy Plus is
derived from both the Building Loads Analysis and System Thermodynamics (BLAST) and
DOE–2 programs and was released in 1996. BLAST and DOE–2 both were developed for
building energy and load simulation after the energy crisis of the early 1970s, when it was
realised that building energy consumption is a major component of American energy
consumption. The programs were used by design-engineers and architects to design and size
heating, ventilation and air-conditioning (HVAC) equipment and for equipment life cycling
cost analyses and energy performance optimisation. Energy Plus comprises completely new,
modular, structured code written in Fortran 90 [314, 315].
Using this program, the user can define building envelopes, a building’s physical make-up,
and related mechanical systems. It can calculate heating and cooling loads necessary to
maintain thermal control set points, conditions throughout a secondary HVAC system, coil

121
loads, and energy consumption of equipment as well as verifying that simulation is in
accordance with actual building operation. Some of the main features of the Energy Plus
program are [314, 315].
Sub-hourly, user-definable time steps.
Text based weather input and output files.
Heat balance based solutions.
Atmospheric pollution calculations.
Energy Plus is used to simulate many buildings and HVAC design options directly or
indirectly through links to other programs to calculate thermal loads and energy consumption
on a specific design day or for a certain period [314, 315].
Many researchers have used Energy Plus for modelling and simulation of building energy
performance and improving building energy models [316-324].
The most important limitation of Energy Plus for the present research is that it lacks solar
collector models although it does have models for absorption chillers and storage tanks. Users
can create their own collector model through codes but it might be a lot of work to validate it
and link it correctly to the main program.
5.5.2 Integrated Environment Solutions (IES) Virtual Environment (VE)
IES-VE is used for building and system design. It creates a 3D building model with data such
as materials, constructions, internal heat gains, systems, and controls. IES-VE is used to build
a model and collects information on building geometry, occupancy, climate and installed
equipment [325].
IES-VE is used to design low energy and high performance systems. Energy and carbon
analyses are carried out under the tool Apache Simulation. This is a central simulation
processer that assesses thermal performance, simulates solar gain on surfaces, surface
temperatures, and radiant exchanges. Building and room-level annual, monthly, hourly, sub-
hourly and up to one minute time step analysis is possible. It contains an extensive database
of global weather. It calculates sensible and latent gains from lights, natural ventilation,
mechanical ventilation and infiltration [325].

122
In IES-VE three tools are used for HVAC calculations; Apache HVAC, Apache Loads, and
Apache Calc. Apache HVAC simulate system prototypes and models and the system library
contains a variety of model systems. Apache Loads simulates heat loss and gains, heating and
cooling loads using the ASHRAE heat balance method. It can simulate the cooling load for
buildings and zones and peak cooling loads. Apache calc. simulates heat gains to calculate
the cooling load for a selected day and month with chartered institution of building services
engineer (CIBSE) guidance. It can simulate climate, daylight, natural resource availability,
energy and carbon with low/zero carbon technologies as shown in Figure 5-1 [325].
Figure 5-1: Building model and low zero carbon technologies analysis [325]
Many researchers have used the IES-VE tool to simulate building design, construction
materials, daylight characteristics, solar shading, low energy buildings, and occupant’s
behaviour [326-335]. Like Energy Plus, the main problem with IES for this research is its
lack of solar energy system models. Also, the user cannot create any model and add it to the
IES. 5.5.3 TRNSYS
TRaNsient SYstem Simulation (TRNSYS) is a widely used, thermal process dynamic
simulation program. It was originally developed for solar energy applications, and can now
be used for a wider variety of thermal processes. TRNSYS was developed at the University
of Wisconsin by the members of the solar energy laboratory and the first version was released
in 1977 [40]. TRNSYS can be used for simulation of solar PV, solar heating and cooling and
building energy. It has the capability to interconnect system components in any desired
manner, solving differential equations and information output. Given OUTPUT from one
component is used as an INPUT to other components [336]. Each component has a unique
TYPE number, and components from the standard library of TRNSYS were validated. In the

123
volume4- Mathematical reference of TRNSYS, reference to validation of each TYPE is
included [337]. The components in TRNSYS include solar collectors, heating and cooling
loads, thermostats, absorption chillers, fans, hot water storage, heat pumps and many more.
TRNSYS provides an error of less than 10% between simulation results and actual operating
systems; details of TRNSYS accuracy are described in Section 5.5.4. The simulation time
step can be as short as 1/1000 of an hour (3.6s) and can be helpful for detailed instantaneous
micro analysis. The short time step (less than one hour) can be useful as it may be necessary
for computational stability in the simulation and it can be used to simulate the dynamic
response of the systems that respond faster in seconds or minutes [147, 312, 313, 338] .
In addition to the main TRNSYS components, an engineering consulting company
specialising in the modelling and analysis of innovative energy systems and buildings,
Thermal Energy System Specialists (TESS), developed libraries of components for use with
TRNSYS. The TESS library includes more than 500 TRNSYS components [230].
Numerous applications for the program are mentioned in the literature and described in
Section 5.3. Some typical examples are for the modelling of a thermosiphon system [339,
340], modelling and performance evaluation of solar DHW systems [341], investigation of
the effect of load profile [342], modelling of industrial process heat applications [343] and
modelling and simulation of a lithium bromide absorption system [284].
5.5.3.1 Interface
TRNSYS operates in a graphic interface environment called Simulation Studio. In this
environment, icons of ready-made components are dragged and dropped from a list and
connected together according to the real system configuration [230]. The standard library
includes approximately 150 models ranging from photovoltaic panels, multizone buildings,
solar collectors, storage tanks, weather data processors and HVAC equipment [344]. The
interface is shown in Figure 5-2.
Each component of the system requires a set of inputs (from other components or data files)
and a set of constants parameters, specified by the user. Each component has its own set of
output parameters, which can be saved in a file, plotted, or used as input for other
components.

124
Figure 5-2: Model diagram in TRNSYS simulation studio view [344]
Output values can be seen on an online plotter as the simulation progresses. A typical output
plot is shown in Figure 5-3. The project area also contains a weather processing component,
printers, and plotters through which output data are viewed or saved to data files [230, 344].
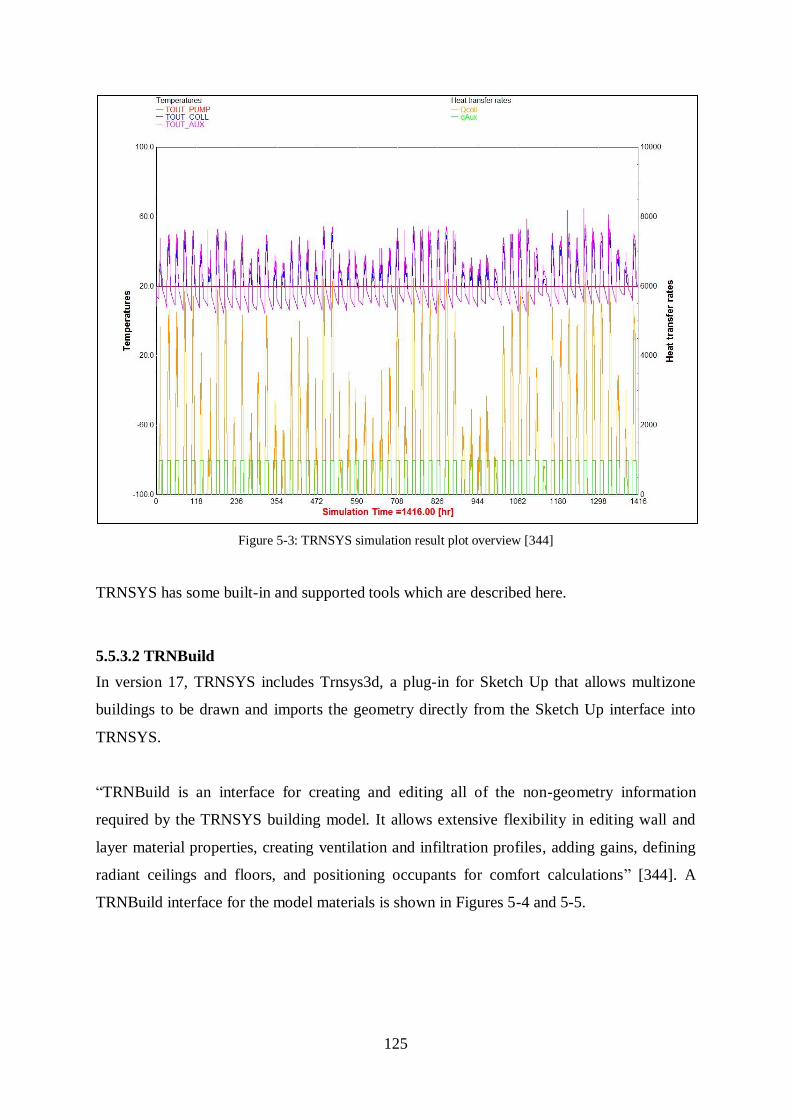
125
Figure 5-3: TRNSYS simulation result plot overview [344]
TRNSYS has some built-in and supported tools which are described here.
5.5.3.2 TRNBuild
In version 17, TRNSYS includes Trnsys3d, a plug-in for Sketch Up that allows multizone
buildings to be drawn and imports the geometry directly from the Sketch Up interface into
TRNSYS.
“TRNBuild is an interface for creating and editing all of the non-geometry information
required by the TRNSYS building model. It allows extensive flexibility in editing wall and
layer material properties, creating ventilation and infiltration profiles, adding gains, defining
radiant ceilings and floors, and positioning occupants for comfort calculations” [344]. A
TRNBuild interface for the model materials is shown in Figures 5-4 and 5-5.

126
Figure 5-4: TRNBuild wall and windows types and area selection [344]
Figure 5-5: TRNBuild wall type manager with construction materials [344]
5.5.3.3 Weather Data
TRNSYS contains a variety of weather data with different weather data types. The main
types available are TMY, TMY2 and TMY3 (for US), EPW, CWEC, IWEC and Meteonorm
for all the major cities of the world. A detail of these weather types is presented in section
5.6.
In TRNYS for Pakistan TMY2 weather data is available for the five major cities Karachi,
Lahore, Peshawar, Multan, and Quetta. The climatic conditions are different for all the cities.

127
A detailed monthly average minimum, maximum dry bulb temperature and monthly average
humidity ratio is shown in Appendix B and discussed in the weather data Section 5.6.
5.5.4 TRNSYS Validity
Mitchell et al. [345] compared the measured and TRNSYS simulated performance of solar
energy systems for CSU house–I, for three different time periods. It found that simulated
energy data was in agreement with measured data. The agreement was generally within 2ºC.
It has also been recommended that simulation models can be used to predict long term system
performance. For different components the difference between measured and TRNSYS
simulated data was between 0.7% and 7% [40]. Beckman et al. [346] described TRNSYS as
the most complete solar energy system modelling and simulation program. Kalogirou et al.
[339] performed TRNSYS modelling and validation of a thermosiphon solar water system. It
was found that the mean deviation between TRNSYS predicted and actual experimental
values was 4.7%.
Monfet et al. [347] performed TRNSYS simulation for large heating and cooling plants and
calibration with monitored data. It was found that there was a good agreement between the
simulated and monitored data with less than 8% variation. Hang et al. [348] conducted a
TRNSYS study of the optimisation method for a solar assisted double effect absorption
system installed in USA and the results showed that the actual system result was in excellent
agreement with the physical model in TRNSYS. Ayompe et al. [265] validated the TRSNSY
model for a forced solar water heating system with a flat plate and evacuated tube collectors
for three representative days of weather conditions in Ireland. The results showed that the
model overestimated the heat collected by 7.4% and 12.4% for a flat plate and the evacuated
tube collectors respectively. Martinez et al. [204] investigated the TRNSYS design and test
results for a low capacity solar cooling system in Spain. It was observed that the level of
agreement between experimental and simulated values was high. The difference between
experimental and simulation parameters was between 2% and 5.50%.
Ssembatya et al. [210] carried out TRNSYS simulation studies on the performance of solar
cooling systems in UAE conditions. It was observed that, overall, the trends for experimental
values were close to TRNSYS simulation. Almeida et al. [337, 349] performed dynamic
testing of systems using TRNSYS. It was observed that comparison of simulation and
measured system energy yield showed very good agreement with a +/-3 % variation. Banister
et al. [350] validated a multi-mode single tank TRNSYS model with experimental data. The

128
agreement between simulation and experiment was found to be very strong, with typical
differences in tank temperatures of less than 1ºC. He et al. [351] studied low temperature
solar thermal cooling system application in China. The comparison between four days of
TRNSYS simulated and measured data for heat gain using a collector and system COP,
showed that the measured data was 7% and 5% higher than simulated data respectively. Bava
et al. [352] carried out a TRNSYS simulation of a solar collector array with two types of solar
collectors. It was found that simulated energy transferred in one year from collectors was
only 1.2% higher than the measured energy amount. The simulated collector’s outlet
temperatures were in good agreement with measured ones. Eicker et al. [353] simulated heat
rejection and primary energy efficiency for solar driven absorption cooling systems. Palacin
et al. [354] also observed the variation to be in the range of 1-7%. The comparison between
the simulated and experimental systems showed a variation of between 1% and 4%.
A summary of the above described work is shown is Table 5-1.
Table 5-1: Comparison of differences between experimental and TRNSYS simulation data
Author Parameters
Difference between
Experimental and TRNSYS simulation (%)
Mitchel et al Collected and Delivered energy, Auxiliary energy, Air heated heat flow 0-7.0
Kalogirou et al Hot water tank initial and final temperatures 4.7
Monfet et al Chilled water temperature, Condenser water temperature, Pumps, Chiller
and cooling tower electricity consumption, COP of chiller, 2.4-4.8
Ayompe et al Heat energy collected 7.4-12.4
Martinez et al Collector and storage tank outlet temperature 2.0-5.5
Almedia et al Energy yield, (+/-3.0)
He et al Collector yield, Total cooling energy, Auxiliary energy demand, Collector efficiency, System COP, Average room temperature and Solar fraction
5.0-7.0
Bava et al Collector energy collected 1.2
Eicker et al Collector energy, Evaporator and generator power, 1-4
Palacin et al Collector energy, Evaporator and generator energy, Electrical energy 1-7
The above Table 5-1 shows that the variation in TRNSYS results from measured data for
solar thermal systems is less than 10%. The TRNSYS simulation proved reasonably accurate
for solar thermal systems modelling. T. He at el.’s work was on solar thermal cooling systems
similar to those in this research. The comparison was for four days of data and it can be
expected that the annual average comparison will show the variation to be lower. As Bava et
al.[352] observed that the annual average variation between simulated and measured data was
1.2%, whereas the seasonal variation was higher at +7% (Jun-Dec) and -8% (Jan-May).

129
Antoni et al. [355] validated the TRNSYS simulation solar combi+ system model with
measured data. The simulated results for storage fluid temperatures and heat transfer rates
were in good agreement with a difference of less than 2%. Keizer et al. [356] used TRNSYS
as a tool for long term fault detection in solar thermal systems. The average variation between
simulated and measured solar yield was up to 5 %.
5.6 Meteorological Data for Simulation Program
Weather conditions and loads are factors that affect cooling system performance. Loads are
dependent on weather for heating and cooling in buildings, and also other factors which are
not related to weather. Meteorological data, including ambient temperature, solar radiation
and wind speed, wind direction and relative humidity are measured at the weather recording
station around the world [357, 358].
5.6.1 Weather Data Types
For simulation of solar cooling systems, weather data with the important parameters and
derived data is used. All simulations in this research are performed with real meteorological
data and it is important to select a suitable data set [357]. The data set type depends upon the
simulation program to be used. To compare the full range of system performance, it is best to
use a full year of data or a full season of data if the process is seasonal [358]. Klein [312]
developed the concept of a design year for first time, which helped to create different types of
weather data for building energy calculations.
The available data sets differ according to the process by which they are compiled, the
amount and type of data presented. A brief description of some important weather data sets
are presented here.
5.6.1.1 Test Reference Year (TRY)
The earliest hourly weather data set specifically designed for use in building energy
simulation is the Test Reference Year (TRY) derived from measured data at the National
Climatic Data Centre (NCDC). The data was available for 60 locations in the US for the
period from 1948-1975. The limitations of the TRY were the exclusion of solar radiation and
extreme high or low temperatures [358].

130
5.6.1.2 Typical Metrological Year (TMY)
Hall et al.’s [359] detailed study of 23 years of data for solar radiation at 26 stations in the US
and resulted in the generation of typical meteorological year data for those and others
locations. This TMY data was used to simulate heating systems and added data which was
not available with TRY [357].
A TMY is a data set for hourly values of meteorological elements and solar radiation for a
period of one year. It consists of typical months of real weather data selected from different
years and combined to form a data set of a year of typical weather. It provides hourly data for
meteorological elements that contribute to performance comparisons for different types for
single or multiple locations. It is not a good indicator for predicting the system parameters for
the next one or five years as selected data is data for a typical month. It is useful to represent
typical conditions judged for a longer period such as 30 years. It is not useful to design
systems and their components to fulfil extreme weather conditions for a location as it
represents typical conditions instead of extreme conditions. A typical meteorological year is
classified into three categories [360, 361].
TMY: This consists of data sets derived from the NCDC of National Oceanic and
Atmospheric Administration (NOAA) with measured data for 26 US locations
from years 1952-1975.
TMY 2: This consists of data sets derived from years 1961-1990, from the
National Solar Radiation Data Base (NSRDB) of US National Renewable Energy
Laboratory for 239 stations.
TMY3: This consists of data sets derived from years 1991-2005, from the NSRDB
of the US National Renewable Energy Laboratory for 1,020 stations worldwide.
The TMY, TMY2 and TMY3 data sets cannot be used interchangeably due to differences in
time (local versus solar), formats, data types and units [357, 360, 361]. Schmitt et al. [362]
have developed algorithms to generate weather data for extreme conditions.
5.6.1.3 International Weather for Energy Calculations (IWEC):
IWEC was generated as a result of the ASHRAE research project RP-1015 for the ASHRAE
technical committee. The purpose was to represent more typical weather than a single
representative year could give. These files contain typical weather data suitable for use in

131
building energy simulation software for 227 locations outside Canada and the US. Data for
all locations is available in an energy plus weather format [358, 363, 364].
All files of IWEC data are derived from 18 years (1982-1999) of DATASAV3 hourly
weather data originally archived in the US, at the National Climatic Data Centre (NCDC).
The solar radiation data is estimated on an hourly basis from earth-sun geometry and hourly
weather elements particularly cloud amount data [311, 363].
Like TMY files the IWEC files are typical years that normally avoid extreme conditions.
Sizing of heating, ventilation, and air conditioning systems that require the consideration of
extreme conditions cannot use the IWEC files.
5.6.1.4 Energy Plus Weather (EPW):
Energy plus weather (EPW) data is generated by the United States Department of Energy.
EPW is compiled from TMY, TMY2, TMY3, and other international data sets. This format
data is now available on the Energy Plus website for more than 2,100 locations; 1,042
locations in the US, 71 in Canada and more than 1,000 locations in another 100 countries
throughout the world [363].
The EPW format has generalised weather data for use in energy simulation programs. The
data includes dry bulb, dew point temperature, relative humidity, station pressure, solar
radiation (global, extra-terrestrial, horizontal, direct and diffuse) illuminance, wind direction
and speed and cloud cover [363].
Each EPW file is named using an ISO standard three-letter country code, followed by the
location name, World Meteorological Organization (WMO) and the source format such as
California Climate Zones 2 (CTZ2), Canadian Weather for Energy Calculations (CWEC)
[363].
There are three files associated with each location: energy plus weather files (EPW), a
summary report on data (STAT) and a compressed file (zip) which contains the EPW, STAT
and Design Day Data (DDY) files for the location [363].
5.6.2 Pakistan Weather Data
Official weather data for Pakistan is recorded and maintained by the Pakistan Meteorological
Department (PMD). It is a scientific and public service department managed by the Ministry

132
of Defence to provide meteorological data services. Data available is not in any of the
standards described in the previous section, which can be used for building energy simulation
programs. The available data is for a few weather stations and contains ambient temperature,
wind speed, and humidity only. NASA SSE provides complete satellite data for any location
across the world with parameters for solar energy calculations. In Appendices A and B, the
annual and monthly daily mean maximum temperature, humidity ratio and solar insolation on
a horizontal surface for Pakistan district cities is derived from NASA surface meteorology
and solar energy (SSE).
In a solar cooling simulation program, two important weather data sets used are energy plus
weather (EPW) and typical meteorological year (TMY). For Pakistan the details of
availability of these two types of data set are described here.
5.6.2.1 EPW Weather Data for Pakistan
The available EPW data is only for one city - Karachi. Karachi is a coastal city with a hot and
humid climate. The population density in coastal areas is much lower than in other climatic
regions apart from Karachi city, which is the most populous city in Pakistan. For this research
Lahore city has been selected as its climate represents typical conditions in the country.
Lahore is the second most populous city in Pakistan and more than 50% of the population of
Pakistan lives in climatic conditions similar to those in Lahore [68]. For Lahore EPW data is
not available but it is available for the nearest Indian city, Amritsar, which is about 40
kilometres away from Lahore with similar climatic conditions. Comparison from the WMO
provided 30 years of typical weather data for both cities and is shown in Figure 5-6.
Figure 5-6: Climatic comparison between Lahore and Amritsar [100]
0
10
20
30
40
50
JAN FEB MAR APR MAY JUN JUL AUG SEP OCT NOV DEC
TE
MP
ER
AT
UR
E (
ᵒC)
LAHORE MEAN MAXIMUM LAHORE MEAN MINIMUM
AMRITSAR MEAN MAXIMUM AMRITSAR MEAN MINIMUM

133
Figure 5-6 shows that the maximum average temperature is similar for both cities (blue and
green). This is important as this research is based on cooling systems, required in hot climatic
conditions during the summer season from April to September.
The EPW data for Amritsar, India is available at the energy plus weather data official
website. The data is obtained from the site and read through the program Climate Consultant
5.5 [365]. A comparison between EPW and WMO data is carried out for Amritsar. This
comparison clearly shows a difference of 4-6ºC on average maximum and minimum
temperatures as shown in Figure 5-7. The discrepancy implies that EPW data for Amritsar
may be unsuitable for Lahore. A detailed study would be required to explain the discrepancy
and thereby, perhaps, show whether the Amritsar EPW data is suitable for the present
research.
Figure 5-7: Amritsar daily mean temperature (EPW vs WMO) [100, 363]
5.6.2.2 TMY2 Data for Pakistan
As there is variation in EPW and WMO typical weather data for Amritsar, some other data
types for Pakistan cities was sought. It was discovered that TRNSYS contains TMY2 weather
data files for five main cities in Pakistan along with 1,036 cities worldwide. This weather
data is provided by METEONORM [344]. The data is for the years 1961-90 and was
obtained from about 7,400 stations worldwide. This data contains mean air temperature,
humidity, sun shine duration and solar radiation [358].
0
5
10
15
20
25
30
35
40
45
JAN FEB MAR APR MAY JUN JUL AUG SEP OCT NOV DEC
TE
MP
ER
AT
UR
E (
ᵒC)
MEAN MAXIMUM(WMO) MEAN MINIMUM(WMO)
MEAN MAXIMUM(EPW) MEAN MINIMUM(EPW)

134
For Lahore, a comparison between WMO data and TMY2 data is carried out and it shows a
minor (less than 1ºC on average) variation in the data values for both sets. This comparison is
shown in Figure 5-8. The good agreement between the two data sets gives confidence that the
TMY2 data can be used to perform valid simulation.
Figure 5-8: Lahore temperature comparison (WMO vs TMY2) [100, 344]
A comparison of TRNSYS available TMY2 data of global horizontal radiation, mean
maximum dry bulb temperature and relative humidity for the five major cities was carried out
to analyse the climatic conditions in these cities and is shown in Figures 5-9, 5-10, and 5-11.
Figure 5-9: Pakistan’s cities maximum average temperature from TMY2[366]
0
5
10
15
20
25
30
35
40
45
JAN FEB MAR APR MAY JUN JUL AUG SEP OCT NOV DEC
TE
ME
PR
AT
UR
E (
ᵒC)
MEAN MINIMUM(TMY) MEAN MAXIMUM(TMY)
MEAN MINIMUM(WMO) MEAN MAXIMUM(WMO)
0
5
10
15
20
25
30
35
40
45
JAN FEB MAR APR MAY JUNE JUL AUG SEP OCT NOV DEC
TE
MP
ER
AT
UR
E(°
C)
LAHORE MULTAN KARACHI QUETTA PESHAWAR

135
Figure 5-10: Pakistan’s cities average relative humidity from TMY2 [366]
Figure 5-11: Pakistan’s cities average global horizontal radiation from TMY2[366]
The analysis of the data shows that Lahore, Multan, and Peshawar have very similar climatic
conditions. So data for Lahore is suitable for use as typical weather data for Pakistan.
Quetta’s climate is different, characterised by low temperatures and humidity both in summer
and winter. Karachi’s climate is not typical for Pakistan due to high humidity in April, May,
and June. Karachi also has low solar radiation, is the lowest of all the cities in summer and
the highest in winter which is not suitable to represent typical conditions for solar cooling
applications. Also, the annual average solar insolation for Quetta and Karachi is higher than
other cities as shown in Appendix A.
0
10
20
30
40
50
60
70
80
90
JAN FEB MAR APR MAY JUN JUL AUG SEP OCT NOV DEC
RE
LA
TIV
E H
UM
IDIT
Y (
%)
LAHORE MULTAN KARACHI QUETTA PESHAWAR
0
50
100
150
200
250
300
350
JAN FEB MAR APR MAY JUN JUL AUG SEP OCT NOV DEC
GL
OB
AL
HO
RIZ
ON
TA
L R
AD
IAT
ION
(w
/m2
)
LAHORE MULTAN KARACHI QUETTA PESHAWAR

136
5.7 Conclusion
5.7.1 Methodology
To evaluate the feasibility and performance of a solar cooling system widely used techniques
are experimental evaluation or the dynamic simulation. Experiments play central role in
scientific studies and are considered a direct relationship with real systems. Field experiments
have advantage over laboratory experiments as they take place in natural conditions. More
than 1000 solar cooling systems are installed worldwide and most are in European countries.
First experimental study of solar cooling system was carried out in 1962 and after mid 2000s
the number of experimental studies is limited compared to dynamic simulation studies. The
history of simulation studies is as old as experimental studies. For this research an
experimental system is not available in Lahore, so the adopted methodology will be dynamic
simulation.
From among the available dynamic simulation programs, TRNSYS was selected as the most
suitable for this research. It is a comprehensive program used for simulation of both solar
energy and building energy systems. A 3D building model can easily be created using
Sketchup and building materials and geometry (walls and windows) can be assigned in
Trnsys3d. It simulates both solar PV and thermal systems in details. It can integrate buildings
with solar and cooling components and contains more than 500 models of different
components. The TRNSYS library contains a variety of components for detailed and real
system simulations. These component’s parameters are from tested data components from
Thermal Energy Systems Specialists (TESS). The outputs from each component can be
plotted both in graphical and excel data formats. This can be easy to use for heat balance and
other calculations. TRNSYS supports all types of weather data formats and it contains
weather data for all main cities in the world. For Pakistan, TMY2 data is available for five
cities.
The literature presented for use of different simulation programs shows that TRNSYS is the
most widely used for solar energy cooling (also heating) system worldwide. The literature
available for use of other programs is limited. Many researchers have validated TRNSYS
simulation results with the experimental results and established that TRNSYS results are in
good agreement with experiments. The accuracy of TRNSYS is high, within 10% variation
from experimental results. For solar energy collected, chilled water temperature, chiller COP
and storage tank temperature simulations TRNSYS results are 4%, 3%, 3%, and 3.5%
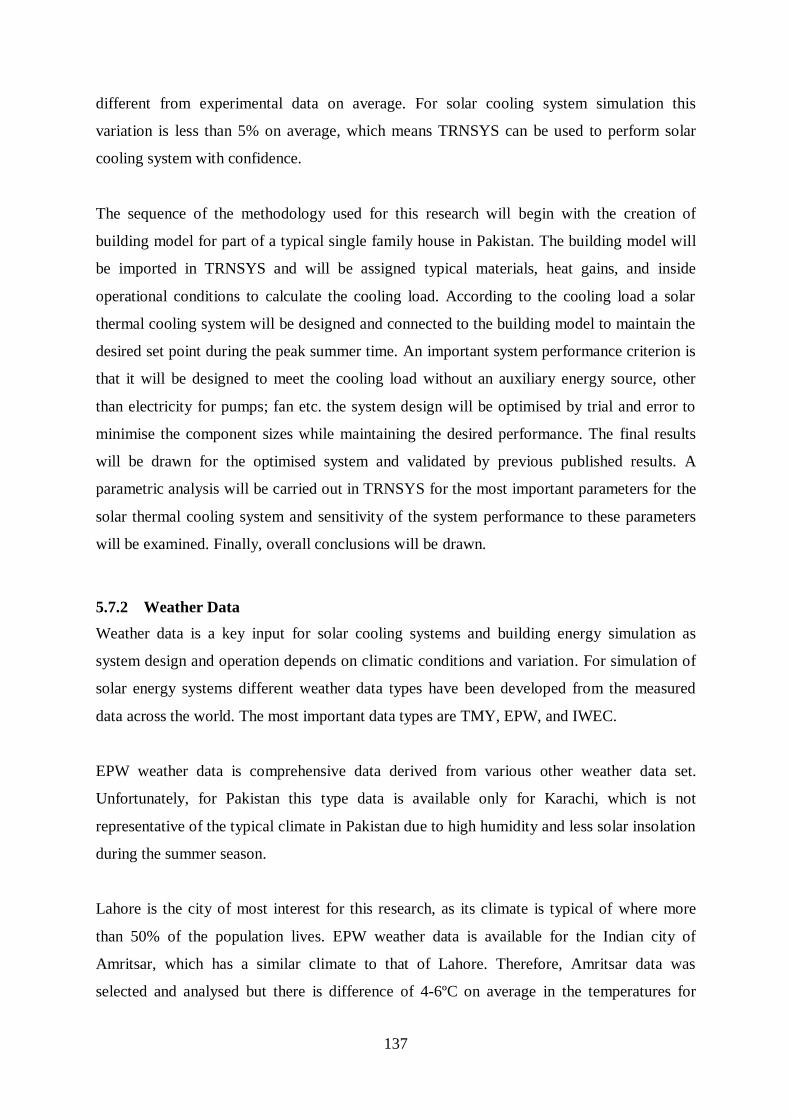
137
different from experimental data on average. For solar cooling system simulation this
variation is less than 5% on average, which means TRNSYS can be used to perform solar
cooling system with confidence.
The sequence of the methodology used for this research will begin with the creation of
building model for part of a typical single family house in Pakistan. The building model will
be imported in TRNSYS and will be assigned typical materials, heat gains, and inside
operational conditions to calculate the cooling load. According to the cooling load a solar
thermal cooling system will be designed and connected to the building model to maintain the
desired set point during the peak summer time. An important system performance criterion is
that it will be designed to meet the cooling load without an auxiliary energy source, other
than electricity for pumps; fan etc. the system design will be optimised by trial and error to
minimise the component sizes while maintaining the desired performance. The final results
will be drawn for the optimised system and validated by previous published results. A
parametric analysis will be carried out in TRNSYS for the most important parameters for the
solar thermal cooling system and sensitivity of the system performance to these parameters
will be examined. Finally, overall conclusions will be drawn.
5.7.2 Weather Data
Weather data is a key input for solar cooling systems and building energy simulation as
system design and operation depends on climatic conditions and variation. For simulation of
solar energy systems different weather data types have been developed from the measured
data across the world. The most important data types are TMY, EPW, and IWEC.
EPW weather data is comprehensive data derived from various other weather data set.
Unfortunately, for Pakistan this type data is available only for Karachi, which is not
representative of the typical climate in Pakistan due to high humidity and less solar insolation
during the summer season.
Lahore is the city of most interest for this research, as its climate is typical of where more
than 50% of the population lives. EPW weather data is available for the Indian city of
Amritsar, which has a similar climate to that of Lahore. Therefore, Amritsar data was
selected and analysed but there is difference of 4-6ºC on average in the temperatures for

138
Amritsar between EPW and WMO data. This difference makes it unsuitable to use this
(Amritsar) EPW weather data as an input for simulation without a detailed study to explain
the discrepancy.
TMY2 data is useful for long term predictions of solar and building energy systems.TMY2
data for five main cities in Pakistan are available in TRNSYS. The available TMY2 data
represent climate zones for all areas of the country. The climatic conditions of Karachi and
Quetta are different and limited to these areas only although the solar energy availability of
these cities is higher than other cities.
Lahore, Multan and Peshawar data show that these cities have about similar climatic
conditions. The mean daily temperatures show that during the summer season from April to
September, these areas require cooling systems to maintain comfort during times of peak
temperature. The calculations and simulation of results will, therefore, be performed using
the TMY2 weather data for Lahore, as typical for Pakistan.

139
Chapter 6: Building Model and Simulation
6.1 Introduction
In Pakistan most areas experience hot summer seasons with high ambient temperatures as
described in Section 3.3. In cities during the summer, people spend more time indoors so
buildings should be made comfortable for hot weather conditions. Most residential buildings
are 1-2 storeys, with fired bricks walls and flat reinforced concrete (RC) slab roofs [97, 367]
and most of the houses have 2-4 rooms [368]. These RC roofs retain heat absorbed in the
daytime and emit it during the night affecting comfort in buildings, when all family members
are in. This is worst for congested areas and houses with cooling systems (fans, coolers, and
air conditioners) combined with poor ventilation, making sleeping difficult, affecting
people’s comfort and health [112]. Rooms are uncomfortable during the peak summer season
(also in winter) due to many hours of electricity cuts (gas in winter) although cooling (also
heating) systems are in place [112].
For simulation of building cooling load in the climatic conditions of Lahore, a simple two-
zone building was selected as TRNSYS ‘TYPE 56’ required a minimum of two thermal
zones. This model was based on a common, typical construction design and materials of
single storey houses in Lahore, Punjab (the largest area with more than 50% of the total
population) [67] and other areas[97].
The model used in the research is an actual existing building with current building materials
and dimensions. The details of typical construction materials used in different cities of
Pakistan are described in Appendix C [97]. The selected single storey model house was
similar to that selected by the UN energy efficient housing project in Pakistan, both in terms
of construction material and size as described in Section 3.8. Typical single storey houses in
urban and rural Punjab are shown in Figures 6-1 and 6-2.

140
Figure 6-1: Typical single storey house in urban Punjab[369]
Figure 6-2: Typical single storey house in rural Punjab [370]
6.2 Building Model
TRNSYS supported Sketchup (Google Sketchup) was used to model an existing building
near Lahore airport and the location is shown in Figure 6-3. It’s a newly built (2010) house
with a concrete roof and double bricks walls. The model used 3D building geometry for a
space to be used for solar thermal cooling simulation. The model created was imported to
TRNSYS for integration with solar thermal cooling system simulation and analysis. The
Trnsys3d plug-in was used to add the geometric information into the building model, which
was necessary for detailed energy calculations. Sketchup zones are different fromTrnsys3d
zones. In Sketchup, interior walls separate one zone from another. In Trnsys3d zones are
divided by the dynamic flow of energy which is indicated by infiltration, shades, solar gain,
and other energy-based parameters. The designed model is a two-zone building with zones
separated by a wall in Sketchup and by different energy flow in Trnsys3d.

141
Figure 6-3: Model building location
The selected building consisted of two room/zones (rooms are representing zones) having the
same volume, door and windows areas with doors and windows at different locations in both.
Room1 has one window and one door, whereas Room 2 had two doors and one window. This
is a typical construction with a drawing room with a door on the street side and courtyard side
and a bedroom with one door on the courtyard side. The average room size in urban and rural
areas is from 20-70m3 with 1-2 windows [371] and the model used these measurements for
analysis. A two zone simple model drawn in Sketchup with Trnsys-3d plug-in was created
and its description and view are shown in Figures 6-4 and 6-5.
Some others parameters are as follows:
Floor area = 14m2
Zone volume (V) = 42 m3
Location: 31.54° N, 74.40° E,
Proportion of window area in external wall = 10%
Window area: 1.5m2

142
Figure 6-4: Trnsys-3d two zone (room) model back and top views
Figure 6-5: Trnsys-3d two zone (room) model front view
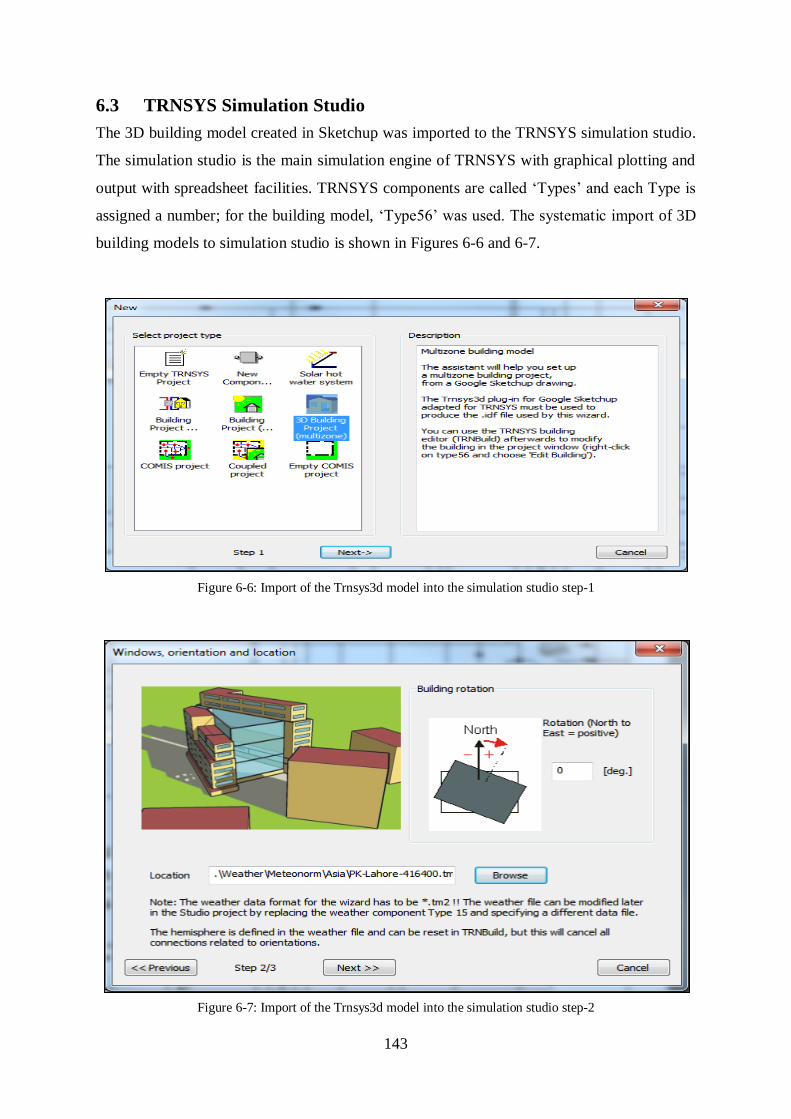
143
6.3 TRNSYS Simulation Studio
The 3D building model created in Sketchup was imported to the TRNSYS simulation studio.
The simulation studio is the main simulation engine of TRNSYS with graphical plotting and
output with spreadsheet facilities. TRNSYS components are called ‘Types’ and each Type is
assigned a number; for the building model, ‘Type56’ was used. The systematic import of 3D
building models to simulation studio is shown in Figures 6-6 and 6-7.
Figure 6-6: Import of the Trnsys3d model into the simulation studio step-1
Figure 6-7: Import of the Trnsys3d model into the simulation studio step-2

144
In the above Figures 6-6 and 6-7, the building rotation was set to a default value of zero and
the location was set to Lahore, Pakistan by selecting TMY2 weather data for Lahore available
in TRNSYS weather data.
Figure 6-8: After import of Trnsys3d model, the final window in the simulation studio
The screen after the import of the building model and components are shown in Figure 6-8.
During the import, TRNSYS calculates the volume of zones, number of surfaces, view factor
to sky calculation, sorting of zones/air nodes and surfaces. It generates a *.BUI file and opens
it in TRNBuild and *_b17_IDF (this file can be used to go back from TRNBuild to Trnsys3d
GUI) with the same order of zones and surface numbers. All Building-related materials,
geometry and thermal properties are viewed and modified in the TRNSYS plug-in called
TRNBuild. TRNBuild opens independently or by right clicking on building Type 56 using
‘edit building’.
6.3.1 The Building’s Initial Parameters
In TRNBuild, building materials, thermal calculation parameters and the model construction,
with details of walls and windows for zones, are assigned according to selected standards. In
TRNBuild American/ASHRAE, French, German, Japanese, Spanish and TESS standard

145
libraries are available and American/ASHRAE is selected as a default standard. The initial
values for building materials, thermal comfort and other parameters were used from
TRNBuild pre-defined ‘default’ values selected within the American/ASHRAE standard. The
details of some default and initial parameters used in the simulation are described here.
In TRNBuild the settings menu is used to set up some general settings for the simulation.
These basics settings include data files location, selected standard libraries, import and export
model applications, TRNSYS input data files, and some other parameters required for the
TRNSYS program applications for simulation.
The other important building settings in TRNBuild are the project settings which include
building orientations and miscellaneous settings. The orientations menu shows the
orientation of building surfaces. Each orientation is described by direction (N, S, E, W or H),
Azimuth angle of orientation (0-South, 90-West, 180-North and 270-South) and slope of
orientation (0-Horizontal, 90-Vertical and 180- Facing down). When the initial building
rotation is set (shown in Figure 6-7) the orientations are assigned to the model surfaces by the
TRSNYS program.
The miscellaneous settings include properties, inputs and outputs. The properties are material
thermal properties; some are general properties and others are parameters for internal
calculation of heat transfer co-efficients as shown in Figure 6-9. Heat transfer co-efficients
depend heavily on the temperature difference between surface and fluid and direction of heat
flow. TRNBuild automatically selects ‘default’ values for properties during the model
import.
For thermal calculations, the general values used are: air density (1.204kg/m3), air specific
heat (1.012kJ/kg.K) and air pressure (101325Pa), water vaporisation heat (2454kJ/kg), Stefan
Boltzmann constant (5.67e-8
W/m2K
4) and approximate average surface temperature
(293.15K).

146
Figure 6-9: Parameters for heat transfer co-efficients
The miscellaneous settings include inputs and outputs other than properties. TRNBuild
calculates and creates standard inputs during the Trnsys3d model import. The inputs can be
added and removed unless related to building description. Most of the inputs used are from
weather data and building location as shown in Figure 6-10.
Figure 6-10: Standard and user defined inputs
Outputs are the last step in the building description and the desired parameters are defined to
be plotted from the simulation results. Outputs can be added and deleted as required
simulation result parameters for analysis. The Outputs window for Type56 in TRNBuild is
shown in Figure 6-11. The default outputs are zone air temperature and sensible heat
(positive for cooling and negative for heating).
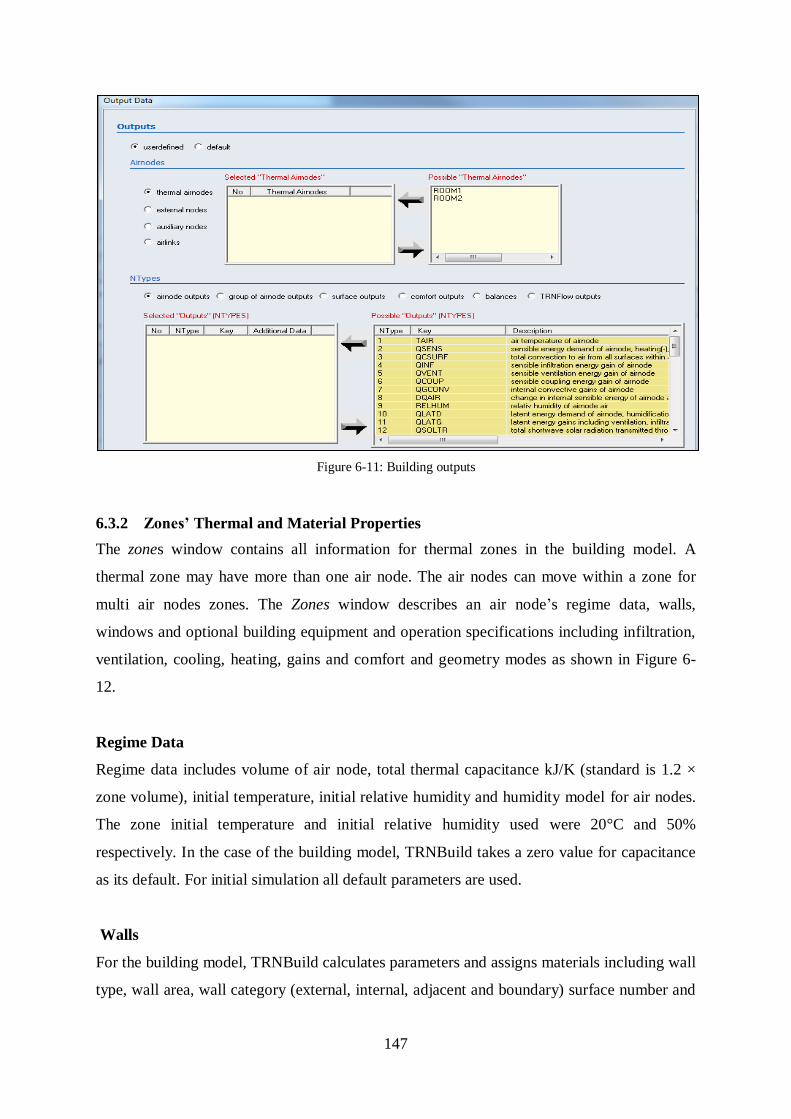
147
Figure 6-11: Building outputs
6.3.2 Zones’ Thermal and Material Properties
The zones window contains all information for thermal zones in the building model. A
thermal zone may have more than one air node. The air nodes can move within a zone for
multi air nodes zones. The Zones window describes an air node’s regime data, walls,
windows and optional building equipment and operation specifications including infiltration,
ventilation, cooling, heating, gains and comfort and geometry modes as shown in Figure 6-
12.
Regime Data
Regime data includes volume of air node, total thermal capacitance kJ/K (standard is 1.2 ×
zone volume), initial temperature, initial relative humidity and humidity model for air nodes.
The zone initial temperature and initial relative humidity used were 20°C and 50%
respectively. In the case of the building model, TRNBuild takes a zero value for capacitance
as its default. For initial simulation all default parameters are used.
Walls
For the building model, TRNBuild calculates parameters and assigns materials including wall
type, wall area, wall category (external, internal, adjacent and boundary) surface number and

148
wall gain. TRNBuild contains a library according to the selected standard for walls and a new
wall type can be defined. It also calculates total wall thickness and standard u-value
according to wall material. The summary of walls is shown in Figure 6-12.
Figure 6-12: Room1 volume, surface and areas calculated by TRNSYS
Similarly, for wall layer, a standard library is available and the user can define a new layer.
New layer definition has four category options that are: massive (normal construction), mass
less (to neglect thermal mass), active (concrete core cooling and heating) and chilled ceiling
(chilled ceiling panel).
In addition to wall constructions the co-efficient of solar absorptance is also required as
shown in Figure 6-13. It depends upon properties of wall finish and the standard value for
each surface is available in the library. TRNBuild uses default values automatically and
changes are possible if required. Finally, the convective heat transfer co-efficient of the wall
required and standard vales are: inside - 11kJ/h m2
K and outside - 64kJ/h m2
K.

149
Figure 6-13: Properties of material assigned to external roofs
The properties of materials used for an external roof are shown in Figure 6-13. The detailed
description of other wall types and materials is as follows. By default TRNBuild assigned
standard materials to the adjacent wall (partition between zones) front/inside with three
materials layers (plasterboard, fiberglass and plasterboard) with a total thickness of 0.090m
and u-value of 0.508W/m2K. The external wall was assigned with three material layers
(plasterboard, ASHRAE fiberglass and ASHRAE wooden sidings) with a total thickness of
0.087m and a u-value of 0.510W/m2K.The solar absorptance of all walls is 0.6 for both sides.
The long wave emission coefficient of all walls is 0.90 for both sides.
Windows
In TRNBuild, windows can be defined for external and adjacent walls. Windows can be
added, edited or deleted depending upon the geometry mode settings. The specifications for
windows geometry and materials include windows type, area, category, surface number, gain,
orientation and shading device. The TRNBuild standard and default setting for windows is
shown in Figure 6-14.

150
Figure 6-14: Properties of windows assigned
When the *.BUI file is written during model transfer, the windows area is automatically
subtracted from the wall area by considering it an extra surface with area. This window can
be assigned different materials, glazing, frame and optional properties of shading devices
including convective heat transfer co-efficients for a window (glazing + frame) as shown in
Figure 6-14.
TRNBuild contains a standard library for windows according to the available standards. In
the library, each type is assigned with an ID number, u-value, g-value, convective heat
transfer coefficient, frame properties and optional properties of shading devices. The selected
default settings for windows are shown in Figure 6-14.
Infiltration
Airflow into the zone from outside is specified by infiltration. In TRNBuild, infiltration is
optional and it can be a constant value, an input or scheduled value. The infiltration is defined
in terms of number of air changes per hour (ACH). By default, infiltration is off for the initial
simulation parameter.
Ventilation
Airflow from external heating or cooling equipment into the zone is specified by ventilation.
In TRNBuild, ventilation is optional and it can be defined by airflow (air change rate or mass
flow rate), temperature of airflow (outside or other) and humidity of airflow (relative or

151
absolute humidity and outside or other). By default, ventilation is off and the user can create
different types of ventilation. For initial simulation default parameters are used.
Heating
Heating requirements and heating control in any zone are defined by heating type. Using
heating in a zone is optional and by default it is off. Heating control is defined by set
temperature, heating power (unlimited or limited) and humidification (off or on with relative
or absolute humidity). For initial simulation default parameters are used.
Cooling
Cooling requirements and cooling control in any zone is defined by cooling type. Use of
cooling in the zone is optional and, by default, it is off. Cooling control is defined by set
temperature, cooling power (unlimited or limited) and humidification (off or on with relative
or absolute humidity). For initial simulation default parameters are used.
Gains
Internal gains including persons, electrical devices and lighting are defined by gains. Gains
are optional and by default, they are off. A person’s activity gains are defined according to
the ISO 7730 standard. Use of computer and artificial lighting is optional. Gains are from a
standard library and the user defines other gains which are available according to selected
standards. For initial simulation default parameters are used (no gain at all).
Comfort
Thermal comfort calculations are based on the ISO 7730 standard. Specification of comfort is
optional and by default the comfort setting is off. The user can define the comfort type based
on clothing factor, metabolic rate, external work and relative air velocity. The internal
calculation based on comfort is calculated by a simple model (based on area weighted mean
surface temperature) or a detailed model (based on view factor of reference point). For initial
simulation default parameters are used, which is that no comfort standard is used.
Schedule
TRNBuild offers a scheduling system for infiltration, cooling, heating, ventilation, gains and
comfort. The schedule types are, day-night, and light, set off, use, weekend, workday and

152
work light. Frequency is daily or weekly with any start stop times during the 24 hour
duration. For initial simulation no schedule is used.
Geometry and Radiation Modes
Radiation modes of thermal zones are for direct and diffuse shortwave and long wave
radiation distribution within zones. The available options are beam radiation and diffuse
radiation distribution with standard and detailed models, and long wave radiation exchange
with a zone offering standard, simple and detailed models as shown in Figure 6-15.
Figure 6-15: Radiation and geometry modes
TRNBuild supports different levels of geometric surface information for each zone.
Geometry modes use manual, mixed and 3D data. If the geometry mode is set to manual data
for all three dimensions will be deleted. Detailed models for radiation mode selections work
only if geometry is set to 3D data. For the initial simulation 3D data is used when 3D model
is imported into TRNSYS.
6.4 Building Model Initial Simulation Results
After the model import in TRNSYS with all the default settings and parameters selected as
initial parameters for the building model with Lahore TMY2 data, a simulation was executed
and initial results were obtained. The TRNBuild default building model outputs were zone air
temperatures and sensible heat required for the zone (positive for cooling and negative for

153
heating). For initial results only zone temperatures were plotted to study the room’s
temperatures with (American/ASHRAE) TRNBuild pre-selected default parameters. For
better plot results, temperature ranges were set from 0°C to 55°C and sensible heat ranges
were set from zero to 5000 kJ/hr. The default simulation time-step was one hour and the total
duration was 8760 hours for a year (365 days). For the purpose of simplicity only the room’s
temperatures were plotted to observe the inside air temperature with default materials and
others parameters. The initial results are shown in Figures 6-16, 6-17 and 6-18.
Figure 6-16: Initial results, room1 and room2 air temperatures
Figure 6-17: Ambient and room 1 temperature comparison

154
Figure 6-18: Ambient and room 2 temperature comparison
Figure 6-16 shows that both rooms have very high temperatures in the summer season with a
peak temperature of more than 45°C which is higher than the ASHRAE standard comfort
temperature. It also shows there is a need for a cooling system for comfort, which is realistic
for Pakistan weather conditions. The pattern and range of temperature for both rooms is
similar. Figures 6-17 and 6-18 show the comparison between room 1 and room 2
temperatures with the ambient temperatures respectively. It is clear that both rooms have
temperatures higher than ambient temperature both in summer and winter seasons. For the
current research concern is with temperatures in the summer season as research relates to
cooling load for comfort temperatures in the summer season.
Default (initial) building properties were assigned by TRNSYS to both rooms. For simplicity
and reference, all the modifications and changes were made in room 1 only. The reference
was there, so that it was possible to check (as an aid to trace errors) if the results detected
something was wrong while modifying room 1. The cooling system was designed for room 1
and could be multiplied for a multi-rooms building.
6.4.1 Internal Gains and Infiltration Addition
The first change made in the building parameters was the addition of internal gains,
infiltration and ventilation to room 1 as the TRNSYS default settings do not use any gain or
infiltration. This addition made the simulation results more realistic and estimated the
maximum room temperature and cooling load with gains and losses. Internal gain used the

155
default ISO 7730 standard with the presence of one person with light activity from 4 pm to
9am and a 100 W/m2 incandescent lamp and one TV/computer of power 140W as the internal
gains. Infiltration was set according to the LEED standard as 0.2 (ACH) and ventilation as
2.0 (ACH) with ambient temperature and humidity [372]. The simulation results after
addition of gains and losses showed an increase in room 1 air temperature, which is shown in
Figure 6-19.
Figure 6-19: Room1 air temperature with internal gain, infiltration, and ventilation
Figure 6-19 shows an increase in room air temperature due to an increase in internal heat gain
and infiltration of ambient air. The peak temperature during the summer is more than 50°C.
Ventilation is heat input to the room in the middle of the day when ambient temperature is
high and heat removal is at night when the ambient temperature is lower, which lowers the
room temperature.
The initial results showed that there is a need to modify building construction materials and
operating parameters to improve building comfort levels and minimise the cooling load
before designing a cooling system to maintain the standard comfort conditions inside the
room.

156
6.5 Building Model Modification
6.5.1 Construction Materials
Walls
Room 1 was assigned actual construction materials from the TRNBuild library according to
the ASHRAE Standard to make the model more realistic according to constructions
commonly used in Pakistan as described in Sections 6.1 and 6.2. The construction included
reinforced cement and concrete for roof and floor, and solid brick walls.
In TRNBuild, normally the roof is considered as a roof surface with external conditions and
the floor as a roof surface with boundary conditions. Boundary condition is the temperature
of a node to which surface back is connected through pure resistance. For a simple model, the
roof and floor are both simulated as a roof with external conditions. The library for walls and
roof materials is the same. The detailed properties of three materials assigned to walls, roof
and floor are shown in Table 6-1. The composition of the wtype115 and wtype11 are
different, although both are heavy concrete.
Table 6-1: Properties of materials assigned to walls and roof surfaces
Surface Library No. Type Description
External Roof 25 wtype 115 200 mm heavy weight concrete
External Floor 11 wtype 11 300 mm heavy weight concrete
External/Adjacent Wall 64 wtype 20 Solid brick wall (200mm)
Solar absorptance of wall Front:0.60 and back:0.60
Convective heat transfer coefficient of wall Front:11 kJ/h.m2K back: 60kJ/h.m2K
Others wall parameters include solar absorptance and convective heat transfer co-efficients of
the wall for the front and back sides. Solar absorptance and connective heat transfer co-
efficients are the same for all the walls and roof surfaces. The thermal capacitance of the
room was set to a standard value which is 1.2 times room volume and is 54.60kJ/K. The
summary of material assigned to walls, roof and floor surfaces is shown in Figure 6-20.

157
Figure 6-20: ASHRAE standard materials assigned to walls, roof and floor
Windows
Windows ID-1001 was selected from the ASHRAE library as an external window 1. It is a
single glaze window, which is the most commonly used window type in Pakistan (author’s
own observation). All the properties were according to the ASHRAE standard and selected
window properties and other parameters are shown with details in Figure 6-21. The u-value
and g-value of TRNBuild default windows (ID: 6001, u-value 2.89W/m2.K, g-value 0.789)
are less than the selected single glazed window.
Figure 6-21: ASHRAE standard properties of window ID-1001

158
Gains
Room cooling or heating load was based on room envelope conduction and internal heat
gains. The gains were set for occupancy according to the ISO7730 standard with light
activities of 170W (75W sensible heat 95W latent heat) total heat and , a computer with 50W
of power and artificial lighting with a total heat gain of 19 W/m2. These were updated
according to the best energy efficient available equipment and were different to the default
described in Section 6.4.1.
6.5.2 Modified Building Model Results
After assigning materials to walls, roof, floor and windows, simulation results for zone 1
(room 1) air temperature were derived to observe the effect of assigning commonly used
materials in Pakistan. The results showed a decrease in the room 1 air temperature in
comparison to previously assigned TRNBuild default materials. This decrease in temperature
occurs both in summer and winter. This indicates a decrease in energy transfers from the
outside to the inside of the room. The room peak temperature during summer decreased to
less than 43°C as shown in Figure 6-22.
Figure 6-22: Room 1 temperature after assigning walls and windows materials
Further modification required is integration of the cooling system with the building. The
building materials and internal gains used were the same and the final results were plotted for
standard room comfort conditions.

159
6.5.3 Building Envelope Conduction
TRNBuild is lacking only in defining the doors created in the Trnsys3d model. It considers
doors to be parts of walls. The area of doors is included in the wall area. If the difference
between doors and walls is important, doors may be modeled as windows. For actual
assigned materials, the heat conduction through walls, roof, floor and door was carried out in
detail to compare the heat conduction effect from doors. The heat conduction of actual
materials is shown in Table 6-2.
The U-value for floor was higher than for roof in spite of being thicker, because of the
difference in composition of both materials. Similar construction materials with a U-value
(2.15-5.78 W/m2K) were used by Montero et al. [302] for solar assisted cooling systems for
the climate of Guayaquil, Ecuador.
The thermal conductivity of wood across the grain, yellow pine, timber =0.147 W/m.K [373].
The normal thickness of a door according to (Indian standard) IS4021-95 = 0.060 m [374].
The heat loss co-efficient for the door = 2.45 W/m2K.
Table 6-2: Room envelope heat conduction calculations
Surface Area (m2) U-Value (W/m
2K) Heat loss UA (W/K)
Front wall 12.5 2.09 26.12
Back wall 14 2.09 29.26
Adjacent wall 10.5 2.09 21.94
Side wall 10.5 2.09 21.94
Roof 12 1.97 23.64
Floor 12 2.45 29.48
Window 1.5 5.68 8.52
Door 2 2.45 4.90
Total 165.80
If the door is considered part of the wall (the U value is 2.09 W/m2K instead of wood
2.45W/m2K) the total UA value decreases by 0.72W/K (4.90- 4.18) or about 14% only.
Therefore, neglecting the door and considering it as part of the wall did not have a large
effect on the results.

160
6.6 Solar Cooling System Initial Parameters Calculations
6.6.1 Chiller Cooling Capacity
In the previous sections, the conditioned zone was not comfortable. Therefore, to make it
suitable for the comfort of residents in the summer a cooling system needed to be designed.
To start the TRNSYS simulation for a solar cooling system an estimation of initial parameters
was required for all components of the solar cooling system. In this section some calculations
are performed to get initial parameters to start the simulation.
The selected building model was an existing building with typical construction with two
rooms each with a space volume of 42m3. An air-conditioning unit about 3.52kW (1 Ton of
refrigeration) capacity was expected to be sufficient for comfort during the peak summer
season for the room with a volume of 42m3.
Estimated installed capacity = 3.52 kW ~12660 kJ/hr.
The TRNSYS default value for the Type107 chiller gives a difference between the hot water
inlet and the outlet temperature from the chiller at 46°C but for low temperature heat sources,
such as solar collectors, it is assumed to be 33°C. The standard COP for absorption chillers is
shown in Table 6-3.
Table 6-3: COP of absorption chillers [375]
Chiller Type Heating Source C.O.P Range
Single effect Hot water or steam 0.60 to 0.75
Double effect Hot water or steam 1.19 to 1.35
Double effect Direct fired 1.07 to 1.18
COP of chiller = 0.60 (lower as a conservative estimate)
The COP of a chiller is expressed as Equation 1.
COP = Qe ÷ Qg (1)
Qe = 3520 W
So, Qg = 3520 ÷ 0.60
= 5867W~21100 kJ/hr
The hot water flow rate (m) from the tank to the chiller was estimated from Equation 2.
Qg = m × CP × (ΔT) (2)

161
5867 = m × 4190 × 33
m = 0.0424 kg/sec ~ 153kg/hr
Where, CP is the specific heat capacity of water and it is 4190 J/kg.K
6.6.2 Solar Collector Calculation
Solar energy availability varies each month due to seasonal changes. For the solar collector
initial parameters, from the summer season a month was selected with the highest solar
energy availability to meet the cooling load of the building. All the calculations were made
for a single day, and then the simulation was run to optimise the system for one day (24 hr)
then for the whole year (8760 hrs).
According to NASA, SSE data as shown in Appendix A, the month of May has the maximum
daily average insolation incident in Lahore on a horizontal collector and is measured at
approximately, 7.34 kWh/m2 [42].
Assuming May 15th (day number 135, hours 3216-3240) to be a clear day with no clouds and
with 14 hours of bright sunshine day length, the average incident radiation received per
square metre during each hour would be:
7.34 ÷14 = 0.524kW/m2 = 524 W/m
2
This means that the total incident energy rate available on the surface of a collector with an
area of 1m2, would be 524W.
The efficiency of an evacuated tube collector ranges from 50% to 85% [376]. Supposing the
mean efficiency of the evacuated tube collector is 67% (a conservative value). The energy
absorbed at the collector and water flow rate would be as follows.
The energy rate absorbed/available from collector = 524 × 0.67
= 351 W/ m2 ~ 1264 kJ/hr. m
2
So, 1m2 area of evacuated tube collector could produce a maximum energy rate = 351 W/ m
2
Assuming there is no heat loss from the collector outlet to the tank storage and the tank to the
absorption chiller, the energy output required from the collector would be equal to Qg
calculated from Equation 1:

162
Qcoll.out = Qg = 5867 W
The area of the collector would be = required energy output ÷ energy available per unit area
=5867÷ 351 ~17 m2
Zambolin et al. [377] did experimental work on the performance of a flat plate and an
evacuated tube collector for a single day, showing the difference between the collector inlet
and the outlet temperature to be 30°C. The water flow rate for a collector can be calculated
from Equation 3.
Qcoll.out = m × CP × (ΔT) (3)
5867 = m × 4190 × 30
m = 0.0466 kg/sec ~ 168 kg/hr
This is approximately the same as the flow rate from the tank to the chiller, because ΔT is
about the same.
Theoretically, 5.867kW (21100 kJ/hr) of heat energy is required by a chiller generator for
3.52kW (3520W) refrigeration cooling output. The energy supplied by a solar collector to a
storage tank is 5.967kW (21481kJ/hr). This is sufficient heat energy to run the cooling system
by assuming zero tank heat losses at the start of the simulation. Later on in the optimisation
process the tank and pipes losses were introduced.
6.6.3 Cooling Systems Reference Model
In the above basic calculation, parameters were referenced from the literature mentioned.
Some other parameters were referenced from the literature are described here.
Eicker et al. [353] analysed heat rejection and primary energy efficiency of solar driven
absorption systems. They analysed an 18kW solar cooling absorption system installed at the
Solar Next Company in Rimsting, Germany. The solar cooling system had hot and chilled
water storage, flat plate and evacuated tube collectors, a wet cooling system (dry cooling is
also possible) with fan coils for the distribution of cooling air.

163
All the electrical loads of the chiller, fan, pumps and cooling system were referenced from
[353] , adjusted in proportion to the rated cooling capacity. All other parameters were either
TRNSYS standards or optimised values according to the system energy balance.
For a TYPE 71 collector, the collector test reports representative data is available on the web
from testing institutes. The evacuated tube collector model CALDORIS-58-30 was selected
from different available models due to a nominal flow rate of 180 kg/hr as most suitable. It is
manufactured by Caldoris Polska Sp.Zo.o and tested for performance and quality in
accordance with the EN12975-2:2006 standard. The efficiency a0 (0.769) and loss co-
efficients a1 (2.52 W/m2K), a2 (0.0106W/m
2K
2) were selected from this tested model [378].
6.7 Solar Cooling System Simulation
Different types of component are available in TRNSYS to simulate solar cooling systems. As
described in Section 4.4.3, the evacuated tube collectors are more efficient than flat plate
collectors. Also absorption chillers are the most commonly used chillers. For the simulation
both of these two components were selected. For small capacity and low temperature heat
input applications a dry cooler is a better choice than a wet cooler [353] . To store heat for
load after sunset and the smooth operation of the chiller, a hot water storage tank was
selected [379].
6.7.1 Solar Cooling Process
A simplified summary and process flow diagram involved in the simulated solar cooling
system is shown in Figure 6-23 and explained here. It should be noted that the lines in the
diagram represent logical connections in the simulation rather than physical pipes etc.
The process of solar cooling starts from the solar heat collection through an evacuated tube
collector Type71. The cold water from a stratified water storage tank Type4a bottom is
pumped to the collector and hot water returns to the top of the storage tank. The collector
pump Type3d is controlled by a timer controller (not shown) and turns on during the day
when energy is available. The controller working parameters are described in Section
6.7.11.The hot water from the top of the tank is pumped to the chiller Type107 and returns to
the bottom of the storage tank through a pump Type3d-2.

164
The chiller absorbs heat from the cooling coil Type697 by circulating chilled water through a
pump Type3d-4. The returned chilled water from the cooling coil exchanges heat with the
absorption solution inside the chiller. The absorption solution is cooled by cooling water from
the auxiliary dry cooler Type1246.
Figure 6-23: Solar cooling system
The hot cooling water from the chiller is circulated by a pump Type3d-3 to the auxiliary
cooler Type1246. It is a dry cooler and cools hot water by exchanging heat with ambient air.
The cooled water is returned to the chiller to absorb heat from the absorption solution.
The chilled water in the cooling coil Type697 exchanges heat with the air coming from the
fan Type112b. The fan takes air from the building Type56 which is cooled down through a
cooling coil and returned to the building. The fan is controlled by the controller Type108 (not
shown) which monitors the inside temperature of the building. As the temperature goes above
the set point the fan turns on. The detailed description of the controller is in Section 6.7.11
The components used for the simulation of solar energy collection, storage and cooling
systems integrated with the building are described here with some important operating
parameters. The details of all components, parameters, and inputs are shown in Appendix C.

165
6.7.2 Evacuated Tube Collector
An evacuated tube solar collector of TYPE 71 is used for TRNSYS simulation. It is a
TRNSYS TESS standard collector with experimental data validation [344]. The loss
coefficients a1 and a2 used are from the collector (SPF No.C1586: CALDORIS-58-30) as a
reference [378]. This reference collector model is selected as the nominal flow rate is in the
same range as this research design (Section 6.6.2).
The collector’s efficiency depends on the collector inlet or average or outlet temperature (Tc).
In Type 71 input parameters, one (1) is for the collector efficiency parameters given as a
function of the inlet temperature. Two (2) is for a function of the collector mean temperature
and three (3) is for a function of the collector outlet temperature. In this research, two (2) is
used as a collector average temperature (Tm) for collector efficiency calculations.
The efficiency of a collector is written as Equation 4.
Collector efficiency = a0 – [a1 × (Tc-Tamb)/I] – [a2 × (Tc-Tamb)2 /I] (4).
The efficiency of the collector type with the selected a0 (0.769), a1 (2.52W/m2K) and a2
(0.0106 W/m2K
2) and I=1000 W/m
2, using Equation 4, is shown in Figure 6-24.
Figure 6-24: Evacuated tube collector TYPE 71 efficiency curve for I=1000 W/m2
The Solar Ratings and Certification Commission (SRCC) define the efficiency of an
evacuated tube collector using the same equations as for a flat plate; the main difference
(from a modelling point of view) is in the treatment of Incidence Angle Modifiers (IAM).
Type71 reads a text file containing a list of transversal and longitudinal IAM’s. IAM is the
0%
10%
20%
30%
40%
50%
60%
70%
80%
90%
0 5 10 15 20 25 30 35 40 45 50 55 60 65 70 75 80 85 90 95 100 105 110 115 120 125
Co
llecto
r e
ffic
ien
cy
Tm-Ta

166
variance in output performance of a solar collector as the angle of the sun changes in relation
to the surface of the collector.
Transversal IAM measures change the performance of the collector as the angle of the sun
changes at right angles to the collector tube axis. Longitudinal IAM measures change in
performance as the angle of the sun changes along the collector tube axis. The default number
of IAM’s in TRNSYS is 5 and the optimised number for maximum energy yield and
efficiency results is also 5. The reference values used for TYPE 71 are shown in Appendix C.
Figure 6-24 shows that collector efficiency decreases as the difference between a collector’s
mean temperature and ambient air temperature increases. The higher the difference the higher
the heat loss to ambient will be. For a temperature difference of 30ºC the efficiency of a solar
collector is about 67%, which is higher than the initially selected collector efficiency of 60%
in Section 6.6.2.
Simulation Parameters
The inputs to the collector Type71 simulation model are fluid properties, flow rate and
weather data. Collector inlet fluid temperature and flow is the outlet of a storage tank cold
side. The flow is controlled by a controller, which cuts off flow if fluid temperature
difference between inlet and outlet is less than 2°C. The operation of the controller is
explained in Section 6.7.11. The collector slope is zero (lying flat on the roof) and other input
data is shown in Figure 6-25.

167
Figure 6-25: Collector solar data input
Collector Outputs
The collector gave three outputs which were outlet temperature, outlet flow rate, and useful
energy gain. The outlet temperature is at the exit of the array and the outlet flow is the same
as the inlet flow rate. The rate of useful energy gain by the solar collector fluid was calculated
by Equation 5.
Qu = m × CP × (Tcoll.out – Tcoll.in) (5)
6.7.3 Hot Water Storage Tank
The hot water storage tank Type 4a was used to simulate the thermal storage tank in
TRNSYS. It is a stratified storage tank with fixed inlets and uniform losses with an auxiliary
heating system. The stratified tank delivers water at a slightly higher temperature than an un-
stratified tank [357]. This is a simple stratified tank suitable only as a storage tank without
auxiliary heating. The tank volume is 2m3 with a total height of 1m and an area of 2m
2 and a
diameter of 1.6m. This volume is sufficient to provide energy for 24 hour operation of an
absorption chiller with about 12 hour back up. Tank Type4a includes two auxiliary heating
elements and auxiliary heating elements are not used in this simulation so their maximum
heating capacity is set to zero.

168
Figure 6-26: Operation of hot water storage tank
Fluid is hot on the top side and cools down as it moves downwards and is cold at the bottom
of the tank. The tank is divided into ten equal heights (each 0.10m). It was assumed that
losses from each tank node are equal. The hot water from the collector enters the tank top and
leaves from the top to the chiller. The cold side water enters at the bottom of the tank
returning from the chiller and leaves the tank bottom for the inlet to the collector as shown in
Figure 6-26, where, mh and mL are the fluid flow rates to and from the heating side and load
side respectively and the temperature difference from top to bottom is about 10°C.
Inputs and Outputs
The inputs to the tank are the hot side inlet (collector outlet) fluid flow rate and temperature
and cold side (Chiller outlet) fluid flow rate and temperature. The ambient/environment
temperature is an input for heat loss calculations. The input and output connections for hot a
water storage tank are shown in Figure 6-27.
For storage tank heat loss calculation it is assumed that the tank is well insulated with
minimum heat loss. For storage tank with fiber glass insulation of thickness 0.050m [380]
and R-value 6m2K/W, the tank average heat loss co-efficient is about 0.167W/m
2.K [381].
The boiling point temperature of the fluid in the storage tank is set to 100°C. When the tank
temperature reaches the boiling temperature, venting of steam occurs to keep the fluid at
boiling temperature. The venting is assumed to occur with negligible loss of mass.

169
Figure 6-27: Tank inlet and outlet connections
The tank outputs include the fluid flow rate, temperature to the heating source (collector
inlet), energy rate, fluid flow rate, and temperature to load (chiller inlet). Internal energy
change (kJ), auxiliary heating rate, energy rate from the heating source (collector), tank
thermal losses rate, average tank temperature, and temperature of any specified node are also
outputs from the storage tank.
6.7.4 Absorption Chiller
A hot water fired single effect absorption chiller Type 107 is used in TRNSYS simulation.
Type107 uses a normalised catalogue data, lookup approach to model a single-effect hot
water fired absorption chiller. Hot water-fired indicates that the energy supplied to the
machine generator comes from a hot water stream. Because the data files are normalised, it
can operate for a variable set of inlet fluid temperatures, cooling capacities and outlet chilled
water temperatures.
The chiller capacity is set at 3.52kW with COP of 0.60 as described in Section 6.6.2. The
chiller cooling water inlet temperature is from a cooling tower and the chilled water set point
is at 7°C. Many parameters are linked with the TRNSYS library supplied data file. These
include a number of hot water temperatures, a number of cooling water steps, a number of
chilled water set points and a number of design load fractions. The TRNSYS default values
were used for all these four parameters as they are parameters tested by the Thermal Energy
System Specialists (TESS).

170
The specific heat capacity for hot water, cooling water and chilled water is 4.190kJ/kg.K. The
auxiliary electrical power required by an absorption chiller to operate a solution pump and
refrigerant pumps is set to 0.061kW. This parameter is taken from a reference absorption
chiller model [353].
Figure 6-28: Absorption chiller input and out connections
Inputs and Outputs
The TRNSYS default and selected set-point temperature for the chilled water stream is set to
7°C, which is the design temperature for commercially available chillers [297, 382]. If the
chiller has the capacity to meet the current load, it will modulate to meet the load and a
chilled water stream will leave at this temperature.
Inputs to a chiller are hot water flow rate and temperature from a storage tank, cooling water
flow rate and temperature from a cooling tower and chilled water flow rate and temperature
returned from a cooling coil.
The chilled water flow rate was set to 250 kg/hr and the inlet hot water from the tank hot
temperature with a flow set to 150 kg/hr in accordance with chiller performance. For the
cooling water from the cooling tower, the flow was set to 800 kg/hr. All these flowrates are
used to maintain to a chiller set of 7°C.

171
Outputs from the chiller are hot water flow, temperature return to the storage tank, cooling
water flow, temperature to the cooling tower and chilled water flow, as well as temperature to
the cooling coil. Hot, cooling, and chilled water energies and electrical energy required are
also outputs from the chiller simulation. The chiller input and output connections for a chiller
Type107 are shown in Figure 6-28.
6.7.5 Cooling Coil
A conventional cooling coil model Type697 is used in TRNSYS to model building air
cooling through chilled water from a chiller. This component models a cooling coil where air
cools down as it passes across a coil containing a cooler fluid (typically water). This model
relies on user-provided external data files that contain the performance of the coil as a
function of the entering air and fluid conditions.
Type697 models a simple air-cooling device that removes energy from an air stream
according to performance data found in a combination of three external data files and based
upon the flow rates and inlet conditions of the air stream and a liquid stream. In Type697,
three data files are required. The first provides water temperature correction factor
performance data. The second provides correction factor data for the performance based on
varying air temperatures while the third provides correction factor data for the performance
based on varying airflow rates. The default values are used for all these three parameters as
they are parameters tested by the TESS and shown in Appendix C.
At each time step, Type697 performs a call to the TRNSYS psychrometric routine in order to
obtain air properties for the inlet air stream not specified by the user among the component’s
inputs.

172
Figure 6-29: Cooling coil connections
Inputs and Outputs
The Type 697 model works on two types of humidity modes used for inlet air. These modes
are both for an absolute humidity ratio and the percentage of relative humidity. Some
parameters are linked with the TRNSYS library and supplied in three data files. These are the
number for water flow rates, the number for water temperatures, the number for air flows, the
number for dry bulb temperatures, and the number for wet bulb temperatures. The rated
volumetric flow rate for air is input from a fan. The total cooling capacity is 2.5kW and the
sensible cooling capacity is 2.0kW. These settings are in accordance with chiller performance
to maintain room temperature below the set point. For the Type 697, the TRNSYS default
ratio of total cooling capacity to sensible cooling capacity is 1.26.
The inputs to the coil are chilled fluid flow and temperature from the chiller, as well as
airflow, temperature, pressure and percentage of relative humidity from a building through a
fan Type112b. Inlet air pressure is 1 atm and the air-side pressure drop is set to zero.
The outputs include outlet fluid flow and temperature back to the chiller, outlet airflow,
temperature and pressure and percentage of relative humidity to the building. The total heat
transfer rate, sensible heat transfer, fluid heat transfer, condensate temperature, and flow are
outputs from a coil. Input and output connections for the cooling coil Type 697 are shown in
Figure 6-29.

173
6.7.6 Cooling Tower
The air-cooled cooling tower Type1246 is used to model an external proportionally
controlled fluid cooler. Type1246 is a low-temperature heat-distributing unit such as
radiators, convectors, and finned-tube units. This unit transfers heat through a combination of
radiation and convection without a fan.
Figure 6-30: Auxiliary cooler connections
The rated capacity of the cooler is set to 5.83kW and the heat capacity of fluid is
4.190kJ/kg.K. The inputs to the auxiliary coolers are fluid flow and temperature from the
chiller, heat loss coefficient and the temperature of the environment. The control function
controls the on/off operation of the cooler. The loss coefficient (UA) for the fluid cooler
during operation is set to zero.
The outputs are outlet fluid flow and temperature to the chiller, cooling rate, thermal losses
and useful cooling rate. The input and output connections of the auxiliary cooler Type1246
are shown in Figure 6-30.
6.7.7 Pumps
For water flow simulation in TRNSYS, pump Type 3d was selected. This is a simple, single
speed and constant flow pump with only inputs of fluid flow and pump electrical power. The
TRNSYS library contains multiple pump types which are complex and meet different criteria.
This pump model computes a constant mass flow rate using a variable control function,
which must have a value of 1 or 0. The pump will be on when it is 1 and off when it is 0. A
user-specified portion of the pump power is converted to fluid thermal energy. This

174
component sets the flow rate for the rest of the components in the flow loop by mult iplying
the maximum flow rate from the control signal. All the four pumps used for water flow from
the solar collector to the storage tank, the storage tank to the absorption chiller, the absorption
chiller to the cooling coil and from the absorption chiller to the auxiliary cooler are Type3d
pumps as shown in Figure 6-31.
Figure 6-31: Pump connections
The inputs to the pumps are fluid maximum flow rate, fluid temperature and control signal.
The outputs are outlet fluid temperature, fluid flow rate and pump power consumption. These
inputs and outputs are common parameters for all pumps used. The flow rate and power
consumption [353] for all the pumps are shown in Table 6-4.
Table 6-4: Pumps, powers and flow rates
Pump Connection Maximum Power (W) Maximum Flow (kg/hr)
Type3d Tank-Collector 27 165
Type 3d-2 Tank-Chiller 14 150
Type 3d-3 Chiller-Cooler 63 800
Type 3d-4 Chiller-Coil 14 250
Chiller Solution pump 61
6.7.8 Fan
TRNSYS Type112b was selected to model a fan to transfer air from building Type56 to
cooling coil Type697. It is a simple, single speed fan with relative humidity inputs. The
humidity mode for the cooling coils Type697 is relative humidity so Type12b was selected.
Type112b models a fan which spins at a single speed and maintains a constant mass flow rate
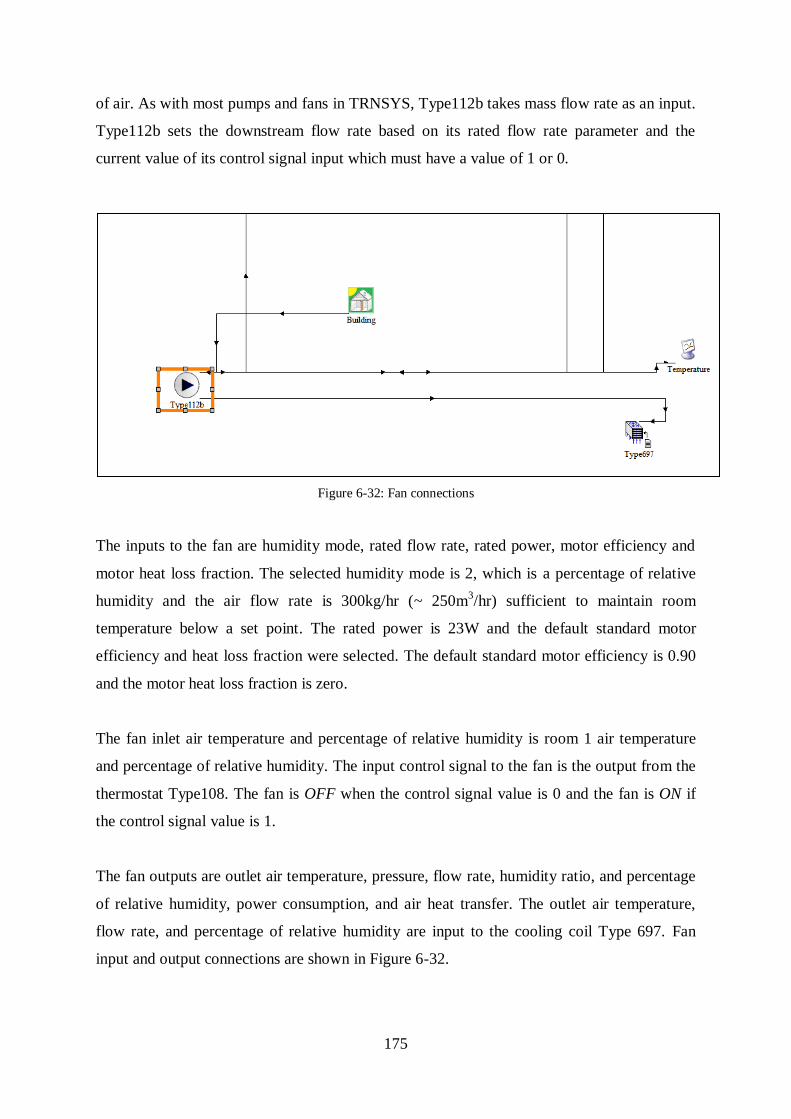
175
of air. As with most pumps and fans in TRNSYS, Type112b takes mass flow rate as an input.
Type112b sets the downstream flow rate based on its rated flow rate parameter and the
current value of its control signal input which must have a value of 1 or 0.
Figure 6-32: Fan connections
The inputs to the fan are humidity mode, rated flow rate, rated power, motor efficiency and
motor heat loss fraction. The selected humidity mode is 2, which is a percentage of relative
humidity and the air flow rate is 300kg/hr (~ 250m3/hr) sufficient to maintain room
temperature below a set point. The rated power is 23W and the default standard motor
efficiency and heat loss fraction were selected. The default standard motor efficiency is 0.90
and the motor heat loss fraction is zero.
The fan inlet air temperature and percentage of relative humidity is room 1 air temperature
and percentage of relative humidity. The input control signal to the fan is the output from the
thermostat Type108. The fan is OFF when the control signal value is 0 and the fan is ON if
the control signal value is 1.
The fan outputs are outlet air temperature, pressure, flow rate, humidity ratio, and percentage
of relative humidity, power consumption, and air heat transfer. The outlet air temperature,
flow rate, and percentage of relative humidity are input to the cooling coil Type 697. Fan
input and output connections are shown in Figure 6-32.

176
6.7.9 Pipes
To simulate pipe connections between components Type31 pipe was selected. This
component models the thermal behaviour of fluid flow in a pipe and thermal losses are also
considered for realistic operation. The pipe connections are used between the storage tank
Type4a and pumpType3d, solar collector Type71 and storage tank Type4a, chiller Type107
and auxiliary cooler Type1246 and between the chiller Type107 and cooling coil Type 697.
The simplified layout of pipe connections is shown in Figure 6-33.
Figure 6-33: Pipe connections
Inputs and Outputs
As the same type of pipe is used, all inputs and outputs are the same except for pipe diameter
and length, fluid temperature and flow rate. The pipe diameters were selected from the
TRNSYS default standard sizes to sizes with optimal losses and fluid flow. The lengths of
pipes were estimated from the room dimensions. The heat loss co-efficient for pipes is used
as for the storage tank, namely 0.167W/m2.K [381]. Fluid density and specific heat capacity
value are 1000kg/m3 and 4.190 kJ/ kg.K. The same ambient temperature is used for the pipes
which is output from weather data for thermal losses of the pipes.
The outputs included fluid outlet temperature and flow, environment losses, change in
internal energy, average temperature, and rate of change of internal energy. The outlet
temperature and flow were input for the components these pipes are connected to. Only
environment losses were considered for heat balance calculations. Input parameters used for
the pipes are shown in Table 6-5.
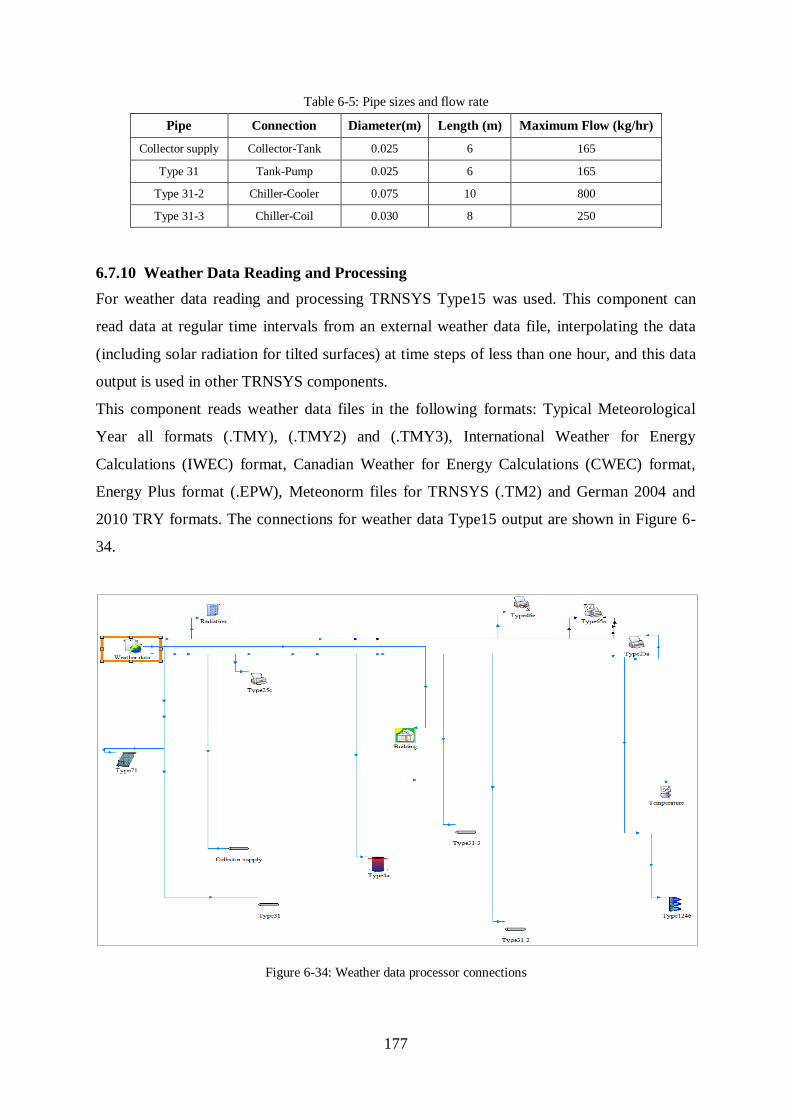
177
Table 6-5: Pipe sizes and flow rate
Pipe Connection Diameter(m) Length (m) Maximum Flow (kg/hr)
Collector supply Collector-Tank 0.025 6 165
Type 31 Tank-Pump 0.025 6 165
Type 31-2 Chiller-Cooler 0.075 10 800
Type 31-3 Chiller-Coil 0.030 8 250
6.7.10 Weather Data Reading and Processing
For weather data reading and processing TRNSYS Type15 was used. This component can
read data at regular time intervals from an external weather data file, interpolating the data
(including solar radiation for tilted surfaces) at time steps of less than one hour, and this data
output is used in other TRNSYS components.
This component reads weather data files in the following formats: Typical Meteorological
Year all formats (.TMY), (.TMY2) and (.TMY3), International Weather for Energy
Calculations (IWEC) format, Canadian Weather for Energy Calculations (CWEC) format,
Energy Plus format (.EPW), Meteonorm files for TRNSYS (.TM2) and German 2004 and
2010 TRY formats. The connections for weather data Type15 output are shown in Figure 6-
34.
Figure 6-34: Weather data processor connections

178
6.7.11 Controllers
Two different types of controller were used for the current TRNSYS simulation. Controller
Type2d was used to control the collector pump flow into the collector from the storage tank.
Controller Type108 (thermostat) was used to control the fan air flow from room 1 to the
cooling coil. Controller Type108 (thermostat) cannot be used with other components, as a
simulation error occurs when it is connected with a chiller. Controller Type2d monitors and
compares three parameters whereas Type 108 monitors only two parameters.
6.7.11.1 Collector Pump Flow Controller
A differential controller with hysteresis for Type2d was selected for the collector pump flow
control.
This ON/OFF differential controller generates a control function γο. The value of this control
function is either 0 or 1. The new value of γ0 is dependent on whether γi = 0 or 1. If γi = 0
then it will compare the difference (TH - TL) with ΔTL. If γi = 1 then it will compare the
difference (TH - TL) with ΔTH. It will use either ΔTH or ΔTL for comparison. The controller
settings are shown in Table 6-6.
The controller is normally used with γ0 connected to γi giving a hysteresis effect. For safety
considerations, a high limit cut-out is included with the Type2d controller. Regardless of the
dead band conditions, the control function is set to zero if the high limit condition is
exceeded. This controller is not restricted to sensing temperatures, even though temperature
notation is used.
Table 6-6: Collector pump controller inputs
Input Symbol Value
Upper input value TH Collector outlet temperature (Tcoll.out)
Lower input value TL Collector inlet temperature (Tcoll.in)
Monitoring value TIN Tank average temperature
Input control function 1
Upper dead band ΔTH 4
Lower dead band ΔTL 2
High cut limit Tmax 100

179
Where,
ΔTH = Upper dead band temperature difference
ΔTL =Lower dead band temperature difference
TH = Upper input temperature = Collector outlet temperature (ᵒC)
TIN = Temperature for high limit monitoring = Collector inlet temperature (ᵒC)
TL =Lower input temperature (ᵒC)
TMAX =Maximum input temperature (ᵒC)
γI =Input control function
γo = Output control function
Mathematically, the control function is expressed as follows:
IF THE CONTROLLER WAS PREVIOUSLY ON
If γi = 1 and ΔTL ≤ (TH - TL), γo = 1
If γi = 1 and ΔTL > (TH - TL), γo = 0
IF THE CONTROLLER WAS PREVIOUSLY OFF
If γi = 0 and ΔTH ≤ (TH - TL), γo = 1
If γi = 0 and ΔTH > (TH - TL), γo = 0
However, the control function is set to zero, regardless of the upper and lower dead band
conditions, if TIN > TMAX. This situation is often found in hot water systems where the pump
is not allowed to run if the tank temperature is above some prescribed limit. In this simulation
100ºC is the high cut limit.
Inputs and Outputs
The inputs for the collector pumps controller are shown in Table 6-6 and connections are
shown in Figure 6-35. For this simulation, the controller’s initial value was selected as 1,
meaning the pump is ON at the start of the simulation. The pump will remain ON as long as
the temperature difference in the collector outlet and inlet water temperature is more than or
equal to 2 and the pump will turn OFF when the difference (TH - TL) is less than 2. The pump
will remain OFF until the difference (TH - TL) is more than 4.

180
Figure 6-35: Collector pump controller connection
6.7.11.2 Fan Controller
Room thermostat Type 108 was selected for the current simulation in TRNSYS. This is the
only thermostat controller in the TRNSYS library. Type108 is a five stage room thermostat
modeled to give five output ON/OFF control functions that can be used to control a system
with a two stage heating system, an auxiliary heater and a two-stage cooling system. The
controller commands first stage cooling at moderately high room temperatures and second
stage cooling at room temperatures higher than the 1st stage. First stage heating starts at a low
room temperature, second stage heating at a lower room temperature, and auxiliary heating at
an even lower room temperature. There is an option to disable first stage heating during the
second stage, disable both first and second stage heating during auxiliary heating, and disable
first stage cooling during second stage cooling.
Inputs and Outputs
In the simulation only first stage cooling is used and no second stage cooling and no heating
(both first and second stage) are required at all. First stage cooling is set to ON when second
stage cooling is ON as only first stage cooling is always used. The first stage cooling input is
a set point in such a way that the system maintains room temperature at less than 26°C. The
second stage cooling set point is 30°C (which will never be reached and second stage cooling
is not available) and the monitoring temperature is the room 1 air temperature inside building
Type56. The fan controller connections are shown in Figure 6-36.

181
Figure 6-36: Room air fan controller connections
The first stage heating was set to be off in the second and third stage and the second stage to
be off in the third stage. The first and second stage heating and auxiliary heating were set to
10°C which was not achieved during the simulation 8760 hours. Therefore, heating is always
off all the time of simulation.
The controller outputs are control signals for first, second and third stage heating and control
signals for first and second stage cooling. The first stage cooling signal is used to give a
signal to a fan for air flow control.
6.8 Solar Cooling Simulation System
The solar cooling components and operation sequence was described in Section 6.7.1. The
complete final solar cooling system with all its components is shown in Figure 6-37. This
includes some printers and plotters to get output graphs and an excel data sheet for energy
calculations and heat balance. It also shows the complete layout of connections of all
components and flow sequences. The red lines shown represent the hot water flow cycle, the
blue lines represent the chilled water cycle, the green line represents cooling water, and sky
blue lines represent the ambient temperature connections. The red dotted lines are for
representation of control signals from the controller to the equipment. The remaining black
lines are the output data from the system to the online plotter and printers.

182
Figure 6-37: Complete process diagram of the solar cooling system
6.9 Conclusion
The model building used is a typical single family house in Pakistan. The 3D model
was created in Sketchup and imported to TRNSYS for simulation. The simulation
studio is the main simulation engine of TRNSYS program with graphical plotting and
output with spreadsheet facilities. TRNBuild is used to assign building model
materials and thermal properties.
The model initial results with Lahore weather conditions and ASHRAE standard
materials showed the room temperature is higher than 40°C without any internal gain
and with internal gains it is higher than 40°C in summer season.
Building materials were changed to make the model more realistic by replacing
ASHRAE standard materials with referenced actual materials. The results with actual
materials showed the room temperature was still higher than 40°C and the building
needs a cooling system to maintain comfort in summer.
Solar cooling system’s initial parameters were calculated for a typical cooling
capacity (3.52kW). Referenced and standard data is used to estimate the initial
parameters.

183
Details of solar thermal cooling system components and operating parameters are
described. All the components input and output parameters details are described, with
the sequence of system operation.

184
Chapter 7: Results and Discussion
7.1 Introduction
In the previous chapter 6, key operational parameters are described to estimate the collector
energy output, collector water flow, collector area, and hot water flow to the chiller. All the
components were connected in the TRNSYS model and operated for realistic parameters
(referenced from literature). The cooling system was operated to maintain a standard
comfortable temperature inside the room during the summer season. The system parameters
were optimised on the basis of the TRNSYS simulation results. This optimisation was
achieved on the basis of several hundred simulations by trial and error using repeated
simulations.. The final results, after the system optimisation, are presented and discussed here
in detail. The results of the numerical analysis are validated by previously published results.
A parametric analysis is performed to study the effect of collector area, flow rate, and storage
tank volume on the system performance.
7.2 Evacuated Collector Energy Yield
The TRNSYS simulation output includes the collector heat gain (i.e. yield) and energy
available (incident solar radiation). The final gross collector’s area is 12m2 to meet the
building cooling load. Figure 7-1 shows the energy collected and available monthly from the
collector.
As expected, the energy available is greater in mid-summer and least in mid-winter. This is
because the collector tilt is zero, in order to maximise the energy available in the summer
when cooling is required and the sun is approximately overhead at noon.
Also, as expected, the yield is greatest in mid-summer and least in mid-winter. In winter there
is less energy available, heat loss from the collector is greater due to the lower ambient
temperature, and less heat is required as the building does not need cooling and the heat from
the collector only keeps the system hot so it will be able to operate when required.

185
Figure7-1: Solar collector monthly yield (kWh)
7.3 Evacuated Tube Collector Efficiency
The monthly and annual average collector efficiency is shown in Figure 7-2. Some key
results are described here.
Collector efficiency is maximum (86%) in the month of July and minimum (18%) in January,
and the annual average efficiency is 61%. This general pattern is as would be expected from
the energy available and collected (Figure7-1).
The calculated maximum efficiency for the collector is slightly greater than the value of the
maximum efficiency parameters a0 in the month of July. This can be accounted for by the fact
that the incident angle modifier values are more than 1 for some angles.
0
500
1000
1500
2000
2500
Solar energy available and collected (kWh)
Energy Collected
Energy available
Collector area (gross) = 12m2
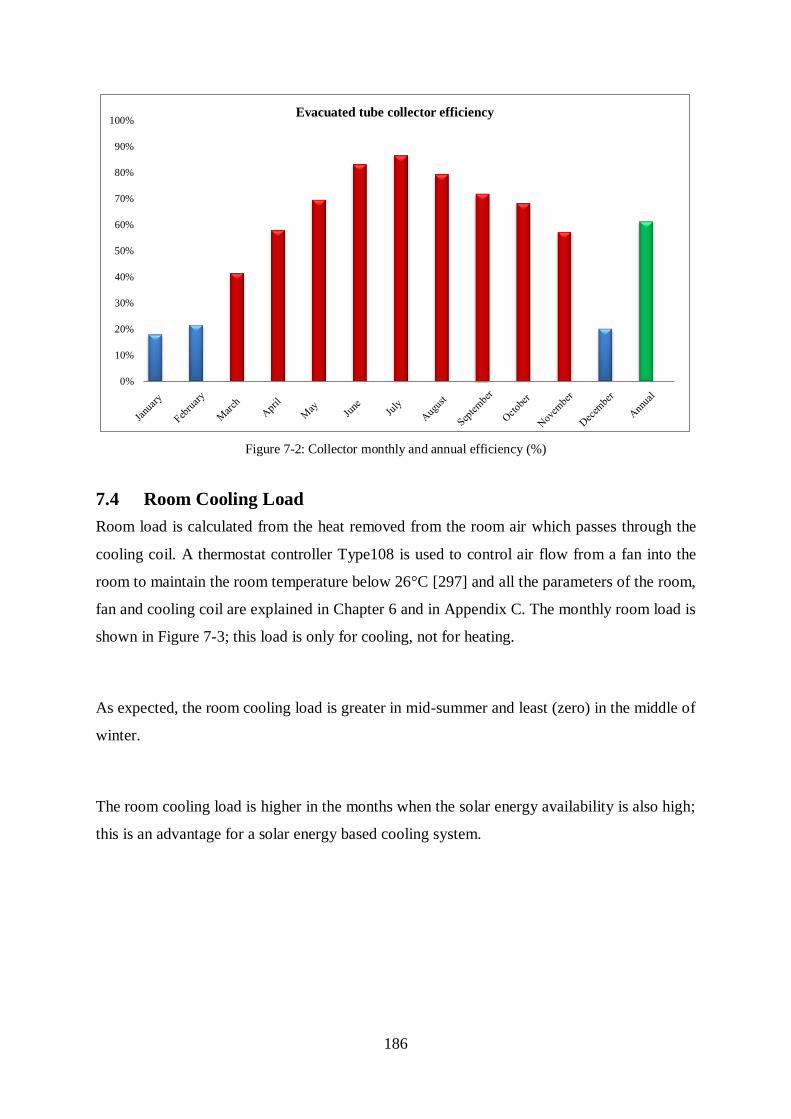
186
Figure 7-2: Collector monthly and annual efficiency (%)
7.4 Room Cooling Load
Room load is calculated from the heat removed from the room air which passes through the
cooling coil. A thermostat controller Type108 is used to control air flow from a fan into the
room to maintain the room temperature below 26°C [297] and all the parameters of the room,
fan and cooling coil are explained in Chapter 6 and in Appendix C. The monthly room load is
shown in Figure 7-3; this load is only for cooling, not for heating.
As expected, the room cooling load is greater in mid-summer and least (zero) in the middle of
winter.
The room cooling load is higher in the months when the solar energy availability is also high;
this is an advantage for a solar energy based cooling system.
0%
10%
20%
30%
40%
50%
60%
70%
80%
90%
100%Evacuated tube collector efficiency

187
Figure 7-3: Room monthly cooling load and solar energy availability (kWh)
7.5 Room Air Temperature
For comfort, the room temperature is maintained by the fan air controlled by an on-off
thermostat. The system is sized so that the room temperature is always under thermostatic
control (less than 26°C) during the summer season. The room temperature and ambient
temperature for the whole year are shown in Figure 7-4. The number of hours shown on the
x-axis is the number of hours at approximately one monthly interval, from January to
December.
The system maintains the room temperature below the ambient temperature throughout the
summer season. The maximum room temperature is between 25-26°C in the months of April,
May, June, July, August, and September (2160-6552 hours).
0
500
1000
1500
2000
2500Total room load (kWh)
room load
solar energy available at collector

188
Figure 7-4: Ambient (Blue) and room (Red) temperature comparison (°C)
In the winter, although there is no heating in the simulation, the minimum room temperature
is always above 11°C, and higher than the ambient temperature that is between 4-7°C.
7.6 Storage Tank Heat Loss
A stratified hot water tank is used for storage of thermal energy obtained from the collector.
The monthly heat losses for the tank are shown in Figure 7-5 and some findings are described
here.
The heat loss depends upon the temperature difference between the tank water and the
ambient air temperature (which TRNSYS takes as the outside air temperature) and it is clear
from Figure 7-5 that heat loss is maximum in winter and lowest in summer, as would be
expected.

189
Figure 7-5: Tank heat loss (kWh)
Tank heat loss is low during the cooling season (May to October) and highest in winter
season when cooling is not required and the temperature difference between the tank and
ambient temperature is higher. The tank heat loss as percentage of energy collected is shown
in Figure 7-6.
Figure7-6:Tank heat loss as percentage of energy collected
-100
0
100
200
300
400
500
600
January February March April May June July August September October November December
Tank heat loss (kWh)
TANK HEAT LOSS
-5%
15%
35%
55%
75%
95%
115%
135%
155%
175%
195%
Tank heat loss to energy collected (%)

190
From June to August (between 3984-5832 hrs), there is some heat absorbed by the tank
instead of heat loss. This is due to monsoon season with some rainy cloudy days. The tank
cools down on these days due to less solar radiation and tank temperature increases again
when solar energy is available as shown in Figure 7-7.
Figure 7-7:Ambient and tank temperature with solar radiation available in July-August
Tank heat loss is also linked with tank volume; less volume leads to less heat loss as shown in
Table 7-2.
7.7 Storage Tank Internal Energy Change
The tank’s internal energy is the energy contained in the tank in relation to some reference
condition. The change in internal energy is the difference between the total energy added and
the total energy removed from the tank. The internal energy change is an output parameter
from the tank. The tank’s internal energy change at the start of the simulation and at the end
of each month is shown in Figure 7-8.
The result shows that the tank’s internal energy change is positive (heat gain) in spring and
early summer and negative (heat loss) in autumn and winter.

191
Figure 7-8: Tank internal energy change (kWh)
The maximum monthly changes in internal energy are +76 kWh in May and -97 kWh in
January. The annual net change in internal energy is -100 kWh, which means the tank lost
more energy than it gained due to winter season operation. These energy changes are
equivalent to changes of 32.6°C, 41.6°C, and 42.9°C respectively in the mean tank
temperature. The internal energy changes will be affected by the tank temperature at the start
of the simulation, which was set to 50°C for all simulations.
7.8 Pipe Heat Loss
Pipes are used in the simulation for water flow between different components. The pipes loss
is heat transferred to and from pipes due to temperature difference with the ambient outside
air in TRNSYS. The monthly heat loss for pipes is shown in Figure 7-9.
Some pipes carry hot water, while some carry chilled water. The overall pipe heat loss is the
net figure when some pipes have lost heat and some have gained heat.
Pipe heat loss patterns are similar to tank heat loss. Heat loss is higher in the winter season
and negative (i.e. heat gain) in the summer season. The annual net heat loss from all pipes is
114 kWh.
-120
-100
-80
-60
-40
-20
0
20
40
60
80
100
Monthly net change in internal energy (kWh)
NET INTERNAL ENERGY
CHANGE

192
Figure 7-9: Pipe heat loss to and from ambient air (kWh)
7.9 The Solar Cooling System’s Electrical Energy Consumption
Electrical energy is required to run the pumps for water flow between components, fan air
flow and chiller solution pump. The monthly total electrical energy consumption is shown in
Figure 7-10.
The electrical energy supply is almost constant as all the pumps are ON continuously except
the collector pump and the air fan. In January, February and December the fan is off when the
room temperature is lower than the thermostat control temperature range (21-26°C). The
solar collector water pump works only when solar energy is available during the day time.
There is a small variation from month to month due to the different number of days in each
month.
The total annual electrical energy consumption for the solar cooling system is 1575 kWh and
the total cooling load is 7291 kWh. Electrical energy represents about 21% of the total
cooling load. In practice, the electrical energy consumption could be reduced by additional
control as only the fan and collector pump are controlled and other equipment is always on
for the sake of simplicity in the simulation
-20
-10
0
10
20
30
40
50 Pipes to air heat loss (kWh)
PIPES TO AIR HEAT LOSS

193
Figure 7-10: Monthly electrical energy load (kWh)
The maximum electrical energy consumption (137 kWh per month) is during the summer
season. The lowest energy supply (114 kWh per month) is in February due to the lowest
number of days compared to other months and the fan is off for the first two weeks and
restarts when room temperature is in range of thermostat control.
7.10 Cooling Tower
An air cooled dry cooler is used for the simulation of cooling water for the chiller. The
operating parameters are described in Chapter 6 and in Appendix C. The heat rejected by the
cooler is simulation output and shown in Figure 7-11.
The heat rejected by the cooler is equal to the heat input from the tank hot water to the chiller,
heat absorbed from the air in the room, and the electrical energy input into the system.
The annual total heat energy rejected from the cooler is 19,836 kWh. The maximum heat
rejected (3,122 kWh) is in the month of June against its total capacity of 4,200 kWh. The
minimum heat rejection (48 kWh) is in January which is the heat input from the electrical
energy of the pumps.
0
20
40
60
80
100
120
140
160
Monthly electrical energy consumption (kWh)
Monthly electrical energy Load

194
Figure 7-11: Cooling tower heat rejected (kWh)
7.11 Absorption Chiller
A hot water operated absorption chiller with a rated cooling capacity of 3.52 kW is used. The
performance of the chiller is shown in Figure 7-12.
Figure 7-12: Chiller actual and rated COP
0
500
1000
1500
2000
2500
3000
3500
Cooling tower heat rejected (kWh)
0.00
0.10
0.20
0.30
0.40
0.50
0.60
0.70Chiller COP
ACTUAL RATED

195
The chiller performed at a rated COP (0.60) only from May to August during the peak
summer season. It is 0.59 in April, September, and October. In March and November the
COP is 0.58 and 0.57. In December, January and February it is very much less as cooling is
not required in these months. The reason for the COP being less than 0.60 is that the chiller is
always on even when cooling is not required.
The COP of the absorption chiller is same during cooling season as expected and calculated
in Chapter 6.
The maximum cooling load is 1165 kWh in June whereas the cooling capacity is 2535 kWh.
This difference is more than 50% due to variation in heat supply and hot water temperature to
the chiller as there is no backup heat source is installed. The over size of the absorption
chiller will increase the economics of the system. The cooling load of the room is already
explained in the room load Section 7.4.
7.12 Validation of Simulated Results
Validation is the act of comparing some data with reference data and drawing conclusions
from this comparison. Although most models are based on physical laws and material
properties, modellers needs some experimental data to test the model’s predictions. The
comparison is used to establish confidence that the model can be used to predict performance
where experimental data does not exist. In the comparison, the model can be evaluated by
system parametric analysis. An advantage of simulation is the ability to perform parameter
optimisation, which is difficult to do through experiments; however, a validated model allows
optimisation with confidence at minimal cost [383].
Anand et al. [384] carried out the first presented study for validation methodology for solar
heating and cooling systems and proposed a four level validation methodology. The first level
includes: use of measured system parameters (component data) and measured weather data
for simulation, to gain confidence in a known system under known conditions. Level two
validation deals with performance prediction accuracy when the input data used represent a
particular system. Level three includes the parametric variability for system performance to
establish the model validity for the field system which is yet to be installed. Level four is the
verification of simulation results from level three using field performance data.

196
The system variables they compared were: energy provided by solar, solar fraction, energy
supplied by auxiliary and collection efficiency. They proposed that variation of +/-10 %
between simulated and measured results for any program is satisfactory for the validation of
solar heating and cooling [384].
Thacker et al. [385] presented a study on concepts of modelling and validation. In this it is
established that it is desirable for a model to be accurate to within 10%. Bales [386] states
that a TRNSYS simulation for a heat exchanger with variation of more than 20% is
unacceptable. Kaplan et al. [387] recommend that for simulation of HVAC systems the
maximum allowable difference between the simulated and measured data should be 15-25%
(on a monthly basis) and 25-35% (on a daily basis), whereas for seasonal and annual periods
the simulated outputs should be within 25% and 10% respectively of the measured amounts.
7.12.1 Simulation Tool Validation
Many researchers have validated TRNSYS model simulation results with
experimental/measured results. For the current research TRNSYS has been used as the
simulation tool. The validation and accuracy of TRNSYS is described in Section 5.5.4 and it
shows maximum variation between simulation and experimental/measured data of less than
10%. The variation is in the acceptable range as described by the above references [384-387],
therefore it can be established that the methodology for the current research is valid and
accurate enough to simulate a solar cooling system.
7.12.2 Simulation Inputs Validation
According to Anand et al. [384] for validation of solar heating and cooling system, use of the
measured data inputs and measured weather data provide a confidence in the known system
under known conditions. For this research all of the input parameters of the solar cooling
system are from measured and validated literature data as described in Section 6.6. The
building model in section 6.1-6.2 and 6.5 is also an actual existing building. There are neither
hypothetical or assumed data used nor any which is not from any previous research work.
7.12.3 Simulation Results Validation
In the literature experimental and simulated data for a solar thermal absorption cooling
system with 3.52-4.5kW capacity is limited. Only four published references [162, 215, 217,
260] are available for this capacity range for climatic conditions in Malaysia, Qatar, UK, and
Turkey. None are available for Pakistan.

197
The results from the current simulation are, therefore, compared with these and other
published data for solar cooling systems of various sizes installed around the world. Priority
was given to comparison with the above mention similar capacity systems and, where
parameter data is mentioned, other literature is used. The current results are in close
agreement with these published results. The detail of this comparison is presented in Table 7-
1.
Table 7-1 Comparison of simulated vs published results
Parameter Current
simulation Published results Reference
Collector efficiency (%) 61 60, 63 Rosiek et al. [248]
Ayompe et al.[265]
Collector specific area (m2/kWc) 3.41 3.6 European commission SACE
[388]
Slope of collector (ᵒ) for maximum energy yield in summer
0 0 NASA, SSE[42]
Collector monthly yield (kWh/m2) 85 80 Blackman et al. [310]
Collector flow (kg/h) 165 150-200 Ssembatya et al. [210]
Collector outlet temperature (°C) 60-105 70-95 Agyenim et al. [260]
Tank volume specific volume (m3/kWc) 0.57 0.22 Agyenim et al. [260]
Tank volume to collector area (l/m2) 166 83 Agyenim et al. [260]
Storage tank heat loss co-efficient 0.20W/m2K 0.83W/m2K Shirazi et al. [389]
Chilled water outlet temperature (°C) 7-12 7-12 European commission
SACE[388]
Chiller COP 0.57-0.60 0.58, 0.60 Agyenim et al. [260]
Rosiek at al. [248]
Chiller electrical power (kWh/kWc) 0.020 0.018-0.027 European commission SACE
[388]
Room temperature set point (°C) 26 24, 25.5 Sim [215]
Fong et al. [390]
Solar fraction (%) 100 55, 83 Assilzadeh et al. [162]
Fong et al. [390]
Solar COP (COPth* ηcoll) 0.36 0.36-0.46 European commission SACE
[388]
Total electrical energy consumption to total cooling produced (%)
21% 24% Rosiek at al. [248]
Chiller operation hours /day (hrs) 24 7.5, 9 Agyenim et al. [260]
Sim [215]
System COP (Thermal +Electrical) 0.51 0.47 Agyenim et al. [260]
Electrical COP 4.62 3.62 Agyenim et al. [260]
Hot water storage capacity (hrs) 12 2 Sim [215]
Annual energy balance difference (%) 1.15 1 Thomas and Andre [391]

198
The comparison between simulated and published parameters shows good agreement with
each other. The exception is only in tank volume and solar fraction which is higher in the
current simulation for two reasons: i) the simulated system works as a standalone system
without any fossil fuel backup and ii) the chiller is operated continuously. The systems
studied previously by researchers were not standalone and operated for fewer hours.
7.12.3.1 Chiller Parameters Validation
TRNSYS, Type107 is used to model a hot water operated absorption chiller which uses an
external performance data file to simulate chiller performance. The results presented so far
are based on chiller operation using the TRNSYS provided chiller data file. The chilled water
outlet temperature data file for TRNSYS is shown in Figure7-13.
Figure 7-13: Chilled water outlet temperature with the TRNSYS provided data file
Reference [392] details the performance of an actual 17.6kW cooling capacity hot water
operated chiller. This data was used to generate a chiller data file which was used in the
TRNSYS simulation. The actual chiller data file is shown in Appendix C. The simulated
chilled water outlet temperature, by using the reference data file, is shown in Figure 7-14.

199
Figure 7-14: Chilled water outlet temperature with referenced data file
From Figures 7-13 and 7-14 it is observed that there is a good agreement between TRNSYS
and referenced data based chiller performance. There are minor differences in the chilled
water outlet temperature during summer and spring time, which is in total for 12 hours higher
than set point. However, this variation has not had any effect on the inside air temperature of
the building, which was below the set point in both cases at all times.
7.12.3.2 Energy Balance for the Solar Cooling System
The model solar cooling system integrated with the building includes many components with
energy loss and gain associated with each component. The energy inputs are cooling
delivered to the room, solar energy absorbed by the solar collector, heat gains by the heat
storage tank and pipes and electricity used by the pumps, chiller, and fan. The main energy
losses are heat rejected at the cooling tower and heat losses from the storage tank and pipes.
The solar cooling system simulation is validated by the energy balance of the system.
The total monthly energy input and output for the system is shown in Figure 7-15. The total
monthly input and output increase and decrease together as would be expected from the

200
variation of solar energy available and the cooling load. However, they are not quite equal.
The details of monthly energy input and output are in Appendix D.
Figure 7-15: Energy balance of solar cooling system
The distribution of the annual input and output for the solar cooling system energy is shown
in Figure 7-16.
Figure 7-16: Annual input and output energy distribution
0
500
1000
1500
2000
2500
3000
3500
System energy balance (kWh)
Total input Total output
0
5000
10000
15000
20000
25000
Input Output
Tank Heat Loss
Pipes Heat Loss
Cooler Heat Rejection
Heat from Room
Electrical Energy
Collector gain
Input output energy distribution (kWh)

201
Major input energy is from the collector (59%) and the room cooling load (34%), which is
93% of the total input. Major output energy is the heat rejected by the cooling tower, which is
about 93% of the total output (it is only coincidence that 93% occurs twice here).
The total annual energy input to the system is 21526 kWh and the total energy output is
21378 kWh. Annual energy input is more than output and the system surplus energy is 148
kWh.
In the simulation, the only energy storage in the solar cooling system is in the tank. The
difference between energy input and output should, therefore, correspond to the change in the
tank’s internal energy. The tank output data showed an annual net change in internal energy,
namely a decrease of 100 kWh. Thus the total discrepancy is 148 + 100 = 248 kWh, which is
1.15% of the total energy input. This discrepancy shows that there are some minor energy
losses in the simulation which were not accounted for.
A similar energy balance discrepancy was described by Thomas and Andre [391] in the range
of 90kWh to 370kWh due to the storage tank. TRNSYS technical support was contacted to
assist and it was confirmed that no system is present to investigate such discrepancies.
However, technical support described heat balance as a way of simulation validity.
As the energy balance discrepancy is well within the range generally regarded as an
acceptable error (Section 7.12), and it could not be explained despite exhaustive
investigation, it was decided to accept it.
7.13 Parametric Analysis
Saltelli et al. [393] defined the objective of parametric sensitivity analysis of a model to
investigate how a given model (numerical or otherwise) depends on its input factors. This
analysis is important in verification and validation of a simulation model.
The characteristics of a solar thermal system are the combination of variables acting together
with a changing pattern due to solar radiation variation. For operational parameter
optimisation, it is necessary to make rational choices between parameters such as collector
area, fluid flow rate and storage volume. The preference for operational parameter is not
sufficient; the effect on system performance must be judged quantitatively so that it can be
compared with the cost effect. Parametric studies refers to the investigation of performance
parameters such as collector area, flow rate and storage tank volume [394].

202
Parametric analysis of a solar thermal system is carried out by few researchers. The summary
of available important studies is shown in Table7-2 and described here.
Table 7-2: Summary of parameters used by researcher for parametric analysis
Researchers Parameters
Collector area Tank volume Collector flow Other parameters
Saltelli et al. √ √ √
Lunde √ √ √
Calise √ √ √
Hang et al. √ √
Villar et al. √ √ √
Sim √ √
Ssembatya et al. √ √
Arsalis √ √ √
He et al. √
Shirazi et al. √ √ √
Lunde [394] describes that the important parameters for parametric analysis are collector
area, storage capacity, collector orientation and collector type. Venegas et al. [264] carried
out parametric analysis for solar absorption of a cooling system and observed that a major
effect on solar COP, cooling energy produced and duration of cooling production, is due to
radiation. Calise [297] carried out a parametric sensitivity analysis for a solar heating and
cooling system for the collector area, collector outlet temperature and tank volume to solar
collector area for different European cities. Hang et al. [395] carried out a parametric
sensitivity analysis for solar fraction with the change in storage tank to collector area ratio
for a solar cooling system. Villar et al. [300] carried out a sensitivity analysis for storage tank
volume, collector area and slope, chiller COP and solar energy collected for a solar
absorption cooling system in different configurations. Sim [215] performed a parametric
sensitivity analysis for collector slope and area, storage tank volume and effectiveness of a
heat exchanger for a solar cooling system. Praene et al. [396] carried out a parametric
sensitivity analysis to optimise a solar absorption cooling system for distance between
collector and hot water storage tank, chiller and collector inlet temperature. Ssembatya et al.
[210] did a parametric analysis for collector area, water flow rate and slope with chiller inlet
temperature to improve solar fraction for a solar cooling system. Arsalis [397] performed a

203
parametric study for collector area and tilt angle and storage tank volume for a solar heating
and cooling system. He et al. [351] carried out a parametric analysis of heat storage tank
volume for solar yield. Shirazi et al. [389] performed a parametric analysis for storage tank to
collector area ratio, collector specific area on primary energy saving, collector area and heat
storage tank volume on a solar assisted heating and cooling absorption system.
From the above referenced literature, it is clear that the parameters most commonly regarded
as important are storage tank volume, collector area and collector water flow rate. For the
current research work these three most common parameters were selected for parametric
sensitivity analysis and results were observed annually. It is reasonable to assume that the
chiller, cooling coil, cooling tower and their associated pipes, pumps and fans would be sized
for the building's design cooling load. The details of the parametric analysis for the collector
area, collector flow and storage tank volume are described here. During the parametric
analysis it was observed that when the room temperature increases above the thermostat
upper limit (26°C), the simulation stops working (controller stuck error from TRNSYS) due
to significantly less heat input compared to cooling load. However, for optimised parameters
simulation works normally and no error was observed.
7.13.1 Collector Area and Flow
Collector area directly affects the solar energy gained. The collector area and flow rate are
varied and the change in collector energy gain and efficiency is observed. The results are
shown in Figure 7-17.Figure 7-17 shows that increasing the collector area increases both,
energy collected and collector efficiency for same flow. With a change of area from 6m2 to
12m2, the annual energy collected varies from 9.7 MWh to 12.66 MWh and the collector
efficiency from 54% to 61%. The reason is collector efficiency increases as the collector
outlet temperature decreases with increase in area keeping constant flow. The evacuated tube
collector efficiency with collector and ambient temperature difference is shown in Figure 6-
24.
For a collector area less than 6m2, the simulation also stops working (mathematical error
from TRNSYS) as the heat input is significantly less than the cooling load during summer
season.

204
Figure 7-17: Sensitivity of collector area and annual energy collected and efficiency
The change in collector flow rate effect on collector energy gain and collector efficiency is
shown in Figure 7-18.
Figure 7-18: Sensitivity of collector flow rate and annual energy collected and efficiency
Figure 7-18 shows that increasing the collector flow slightly increases the energy yield and
efficiency. The change of flow rate from 40 to 165 (kg/h), changes the annual energy
collected from 12.30MWh to 12.66MWh and collector average efficiency from 58.5 to 61%
respectively. The reason is as the flow increases the collector outlet temperature decreases for
constant area, which increases efficiency.
8
9
10
11
12
13
14
52
53
54
55
56
57
58
59
60
61
62
6 8 10 12
Ener
gy (
MW
h)
Eff
icie
ncy
(%
)
Area (m2)
Collector area
Collector efficiency (%)
Energy collected (MWh)
12.25
12.3
12.35
12.4
12.45
12.5
12.55
12.6
12.65
12.7
58
58.5
59
59.5
60
60.5
61
61.5
20 60 100 140 180
Ener
gy (
MW
h)
Eff
icie
ncy
(%
)
Mass flowrate (kg/h)
Collector Flow Collector efficiency (%)
Energy collected (MWh)

205
7.13.2 Storage Tank Volume:
A change in heat energy storage tank volume and its effect on annual tank heat loss, collector
efficiency, and change in internal change is shown in Table 7-3. Table 7-3 shows that
increasing the storage tank volume increases the tank heat loss reduces collector efficiency
and increases the tank internal energy change. As with less volume surface area is less, the
heat loss is lower from the tank. Whereas, lower volume results in less thermal storage and
tank water temperature will be lower so with lower collector input water temperature and
increase collector efficiency.
Table 7-3: Sensitivity of storage tank volume on tank heat loss and internal energy and collector efficiency
Tank volume (m3) Tank heat loss (kWh) Collector efficiency (%)
0.40 723 66
0.80 1003 64
1.20 1174 63
1.60 1293 62
2.00 1428 61
7.13.3 Chilled Water Outlet Temperature
The simulated chilled water outlet temperature is a key system variable , because it only rises
above its set point if the chiller is unable to meet load due to lower heat energy input. The
simulated room temperature does not respond so clearly or quickly because of varying room
heat gains, thermostat settings, and room thermal capacity. The simulation also stops working
when the room temperature is above the thermostat upper limit (error message from
TRNSYS).

206
Figure 7-19: Variation of maximum chilled water temperature and number of hours above set point with collector area
The effect of collector area on maximum chilled water outlet temperature and number of
hours during the year when chilled water outlet temperature is above set point (7°C) is shown
in Figure 7-19. From Figure 7-19 it is clear that both the maximum chilled water temperature
and number of hours when the chilled water temperature is above the set point, increases with
a decrease in collector area.
The effect of collector flow rate on the maximum chilled water outlet temperature and
number of hours during the year when the chilled water outlet temperature is above set point
(7°C) is shown in Figure 7-20.
0
50
100
150
200
250
300
350
6 8 10 12
6
7
8
9
10
11
12
Tem
peratu
re (
C)
Collector area (m2)
Ho
urs
Maximum Chilled water temperature
Maximum Chilled water temperature
Number of hours temperature above setpoint

207
Figure 7-20: Variation of maximum chilled water temperature and number of hours above set point with tank
storage volume
From Figure7-20 it is clear that both the maximum chilled water temperature and number of
hours when the chilled water temperature is above the set point, increases with a decrease in
collector flow rate. Chilled water temperature and number of hours when it is above set point
remains the same when the collector water flow rate is decreased from 65kg/h to 40kg/h.
The effect of hot water storage volume on maximum chilled water outlet temperature and
number of hours during the year when the chilled water outlet temperature is above set point
(7°C) is shown in Figure 7-21.
Figure7-21 shows that both the maximum chilled water temperature and the number of hours
when the chilled water temperature is above the set point, increases with a decrease in storage
tank volume.
6
6.5
7
7.5
8
8.5
9
9.5
10
10.5
11
0
20
40
60
80
100
120
40 65 90 115 140 165
Tem
peratu
re (
C)
Hou
rs
Collector Flow (kg/h)
Maximum chilled water temperature
Number of hours temperature above setpoint
Maximum chilled water temperature

208
Figure 7-21: Sensitivity of storage tank volume and maximum chilled water temperature and number of hours
above set point
It was concluded that an evacuated tube collector area of 12 m2, collector flow rate of 165
kg/h and storage tank volume of 2m3 would provide satisfactory performance of 3.52kW
absorption chiller. These values were used for the final results described in Sections 7.2 to
7.11.
7.14 Conclusion
A solar thermal cooling system integrated with a building model for one room of a single
family house in Pakistan was simulated to maintain a comfortable room temperature. The
house was of standard construction and did not include any measures to reduce the cooling
load.
The values of three key design variables (collector area, collector flow rate and storage tank
volume) were initially found through simplified calculations and then optimised by trial and
error using repeated simulations. The optimum values were the minimum values which
enabled the system to maintain the required room temperature throughout the cooling season,
with no auxiliary heat input in addition to the solar collector. It was found that the optimised
values were close to the initial values.
6
7
8
9
10
11
12
0
50
100
150
200
250
300
0.4 0.8 1.2 1.6 2
Tem
peratu
re(C
)
Ho
urs
Storage tank Volume (m3)
Maximum chilled water temperature
Number of hours temperature above setpoint
Maximum Chilled water temperature
209
For the optimised system:
• The required collector area (gross), flow rate, and storage tank size were respectively
12 m2, 165 kg/h and 2 m
3.
• The annual electricity consumption for the system was 21% of the cooling load, but
this could be reduced by improved controls.
• The annual heat loss from the storage tank was 11.30 % of the total energy collected
and most of this was in winter.
• The simulation results showed good agreement with published results from other
researchers.
• The energy balance of the system showed a small discrepancy (approximately 1%)
between the annual energy input and output, which was in the same range as reported by
other researchers.
A parametric analysis was performed on the collector area, collector flow rate and storage
tank volume. It was found that varying the collector area had the largest effect on system
performance, followed by varying the storage tank volume. Varying the collector flow rate
had the smallest effect.
The overall results showed that Pakistan’s climate has a potential for solar powered thermal
space cooling systems. It is feasible to use a solar thermal powered cooling system to meet
the space cooling load for a single family house in the summer season.

210
Chapter 8: Conclusions and Recommendations
8.1 Summary
The use of solar energy for cooling purposes is an attractive prospect; the key factor for this
application is the availability of solar energy for a specific location and climate and suitable
cooling technology. Currently, flat plate or evacuated tube collectors with absorption cooling
technology could be used for solar cooling systems, as an alternative to fossil fuel based
conventional electrical powered cooling systems. For hot climates like Pakistan, a solar
cooling system could be a sustainable, clean, and viable system to meet cooling energy
demand.
8.2 General Discussion
8.2.1 Main Finding: Feasibility of Solar Thermal Cooling of a Building in Pakistan
The results showed that solar thermal cooling for a typical existing building in Pakistan is
feasible; the main aim of this research was to test whether this was so. The designed solar
cooling system successfully maintained the room temperature below 26°C throughout the
year without any backup heat source. The final system configuration and equipment sizes are
comparable to previous published work and are shown in Chapter 7. The final solar powered
cooling system for a 42m3 room with 100% solar fraction consists of 12m
2 (gross area) of
evacuated tube collectors lying horizontally, a 2m3 hot water storage tank and a 3.52kW
capacity absorption chiller. It was noted that published simulated and experimental studies
generally mention collector aperture area, which is less than gross area.
Strength of this research is that all the building dimensions, materials, heat gains, solar
thermal cooling equipment operation parameters are based on published or actual data. None
of the input parameters are assumed or hypothetical, which helps to ensure the validity of the
research as described in Chapter 7.
The major limitation of this research is that it is a theoretical study carried out with one
building model and one solar thermal cooling system. Different building models, solar
collectors, and thermal cooling systems are possible. A variant mentioned by most
researchers is that the system cost and component sizes can be reduced by adding a backup
heat source. A designer of a real system would need to consider the advantages and
disadvantages (e.g. capital cost, running costs, and availability) of a system with or without
possible backup heat sources before choosing the most suitable configuration.

211
8.2.2 Building Model and Energy
One of the research objectives was to gather information needed to construct a suitable
building model for the simulation work, including information on building constructions,
building energy efficiency and indoor comfort conditions in Pakistan; these are discussed in
Chapters 3 and 5. It was observed that in previous studies of solar cooling, no detail is
provided about the building dimensions, thermal properties, or internal heat gains. Building
energy efficiency is key factor for cooling system design and performance but is not
mentioned by many researchers when reporting research into solar thermal cooling systems.
An advantage of the current research is that all these details are provided.
Existing buildings in Pakistan are generally not energy-efficient. As the building model in
this research was intended to represent a typical existing building, there is scope for reducing
the heat gains and cooling equipment sizes by improving the thermal properties of the
building. The UN-habitat program [112] showed that there is potential for this in existing
buildings. Future research work can be carried out to improve building energy efficiency,
thermal comfort and cooling system sizes.
8.2.3 Methodology
As suitable experimental facilities were not available, it was decided to investigate the
feasibility and performance of the solar thermal cooling system by simulation. TRNSYS
software was selected for this; details are presented in Chapter 5. Many researchers have
validated TRNSYS simulation results with experimental results for solar thermal systems and
established that it is a suitable tool for such simulations. Another advantage is that TRNSYS
contains suitable typical weather data for Pakistan, which is not conveniently available from
any other source. The main limitation of using simulation for this research is that no
experimental data is available for Pakistan for comparison and validation.
To test the validity of the simulation results, they were compared with published results from
other researchers and a chiller performance data file was created to validate the chiller
operation. It was found that all the results agreed well with those from other researchers and
Validation is described in Chapter 7.
8.2.4 Solar Cooling System and Operational Parameters
The details of solar cooling systems and operational parameters are described in Chapter 4
and 6 respectively. The selected components are well tested by other researchers, and data is
available for operation and results validation. The selected components have relatively high

212
thermal efficiency and low heat losses compared to others in similar categories. A limitation
is that comparisons cannot be drawn for different components for Pakistan climatic
conditions; future work could be carried out for this.
The component sizes for the solar energy collection and building cooling systems were
estimated by simple mathematical calculation using reference data as described in Chapter 6.
It was decided to investigate the feasibility of a system with no auxiliary heat source, as
electricity outage hours are high as mentioned in Chapter 1. Having no backup heat source
requires increased sizes of some components, which would increase some costs and energy
losses. On the other hand, the costs and energy losses associated with a backup heat source
are avoided.
Solar electricity generation and storage using photovoltaic panels and batteries is now a well
proven technology, and the electrical energy consumption of a solar thermal cooling system
should be comparatively low. It was therefore decided not to investigate the supply of solar
photovoltaic electricity for operating the solar cooling system's pumps, fan, and controls.
The system's thermal losses and electricity consumption in the simulation results are higher
than they would need to be in reality, as most of the simulated components operated
continuously even when cooling was not required (for convenience in constructing the
simulation model). The COP of the absorption chiller was also set to a lower conservative
value (0.60) rather than the manufacturer's rated value (0.70), which led to a higher energy
input, larger collector area and larger storage tank. Most previous studies have used a higher
COP; however, with these limitations the results of this research are better than those found
by other researchers in terms of specific sizes and efficiencies, as described in Chapter 7.
Most researchers have set the collector tilt angle to the location latitude; in this research the
collector tilt is set to zero, as this maximises the available energy during the hottest summer
months at the location of interest (Lahore). It was observed that none of the researchers have
mentioned Incident Angle Modifiers (IAMs), which are important parameters for evacuated
tube collector operation. IAMs were incorporated into the collector model in this research,
and were found to increase the collector efficiency.
Other important system parameters which are not available in the cited literature but are
provided here include the building cooling fan and coil capacities and operational parameters,
and the hot water storage tank and pipes heat loss coefficients and insulation details.

213
8.2.5 System Optimisation
Chapter 6 presents the calculations for the solar thermal cooling system initial parameters,
which were used to start the simulation work. Initial parameter value calculations are not
available from other authors. When the simulation was configured so that it operated
successfully with all the components connected, it was run for different durations (one
month, six months, and one year) with different time steps (one hour, 30 minutes, 15 minutes
and 5 minutes). It was found that 15 minutes time step and one year continuous operation
yielded satisfactorily detailed and stable results.
Advantages of this research are that the system behaviour during a whole year was analysed,
whereas in all experimental and simulation studies by other researchers the operation duration
is limited to few hours, days, weeks or months only, and that different time steps and
durations have been tested, whereas other researchers have used only single time step (mostly
one hour) and duration for their results.
System parameters were changed by trial and error for repeated simulations to find optimum
parameter values, as presented in Chapter 7. A limitation of this methodology was the time
taken, as there is no specific standard for solar cooling systems to guide the choice of
parameter values. To obtain the final results hundreds of different combinations were
simulated and analysed to find the best configuration.
During simulation it was noted that a higher hot water storage temperature gave better chiller
performance but reduced the collector efficiency. Most researchers have not mentioned this
relationship in their publications.
It was observed that the values of some parameters (e.g. collector flow and chiller capacity)
were almost unchanged from the initial estimates to the final optimised values. This means
that simple calculations can be used to obtain good estimates of some required parameters.
8.2.6 Results Validation and Sensitivity Analysis
All the results are in good agreement with the published results, as described in Chapter 7.
The hot water storage tank size is larger than reported by other researchers, which is because
in this research the system operates continuously and meets the entire cooling load.
The results are more detailed than those provided by previous researchers. A detailed chiller
performance data sheet was constructed to validate chiller operation, which was performed

214
before only by two researchers. The number of parameters validated (more than 10) is more
than considered by previous researchers.
Energy balances were constructed as part of the validation, and showed that energy inputs
and outputs were equal within less than 1%. This is within the acceptable range reported by
other researchers. An energy balance of the whole system was constructed, which has not
been reported by any other researcher.
A sensitivity analysis was carried out for the effect of selected parameters of the solar energy
system (collector flow, collector area and storage tank volume) on the system performance.
These were chosen because they were expected to have the largest effect. This analysis
showed that their order of importance was firstly collector area, then storage tank volume,
and finally collector flow rate. Few researchers have performed sensitivity analysis on solar
thermal cooling systems; their results are similar to those found here.
The system performance measure used in this analysis was the chilled water outlet
temperature, as it was found that this was maintained at its set point in the simulation
provided the chiller was not overloaded and had sufficient heat available. Room temperature
was a less useful measure of performance, as this was affected by room heat gains and losses,
and control action. For experimental studies, on the other hand, researchers have used chiller
inlet hot water temperature as a solar energy system performance criterion, as this can be
changed with a backup heat source.
8.2.7 Conclusions and Recommendations
The conclusions mentioned above and described in more detail in Section 8.3 are validated,
and can provide confidence to designers for the application of solar thermal cooling systems
in Pakistan. However, the simulation results are limited to one combination of system
components, and do not provide system selection or design guidelines. Further research is
required to study different combinations of systems and components to select the most
suitable ones for Pakistan's conditions.
The recommendations of the research are described in Section 8.4. The most important are
related to Pakistan's energy crisis, the importance of building energy and comfort, solar
powered cooling systems, and alternative and sustainable energy sources. The main
advantage of implementation of these recommendations is that these would not only help to
overcome the energy shortage but also provide an alternative, sustainable, and reliable energy

215
source. The limitation will be that the cost of the proposed system may be higher, and
subsidies and supportive plans may be required for implementation as mentioned by some
researchers. There is a need for sincere commitment and persistent policies, which will
probably be difficult to maintain in view of the history of energy management in Pakistan.
8.2.8 Addition to Knowledge
This research is the first study of a building integrated solar absorption cooling system for
Pakistan or India. Continuous operation without a backup heat source is also an advance on
previous knowledge, worldwide and in the region, as most studies have been for a few hours
or days operation and with a backup heat source. More detailed results than other similar
research, and detailed validation of the simulation at each step, are prominent features of this
research. The results can be applied to existing buildings, but this research also shows that
existing buildings are not energy-efficient and there is potential for improvement. Details of
solar collector incident angle modifiers, storage tank and pipes heat losses, and the system
energy balance are also additions to previous available knowledge.
8.3 Conclusions
The research presented here demonstrates that cooling through a single-effect absorption
chiller connected to a solar collector with a hot water storage tank can maintain room comfort
for the climate in Pakistan.
The first objective was to analyse energy scenarios, supply and demand, and the renewable
energy potential in Pakistan. The literature on Pakistan’s energy data showed that the primary
source of energy is fossil fuels and the use of renewables is negligible except in the case of
hydroelectric energy [3]. The domestic sector is badly impacted upon by energy crises and
building indoor comfort is often not achievable in the hot summer season due to power cuts
[17]. The future demand and supply data showed that the country will be energy deficient in
meeting the demand until 2019 [20]. It is concluded that there is a need for an alternative and
sustainable source to meet energy demand in the country. It is important that a newly-
developed system can save electricity and help meet domestic sector comfort demands.
The second objective was to review renewable resources, specifically solar energy. In
Pakistan, the resource potential of about 60GW from each hydroelectric and wind energy

216
source has been identified [27, 28]. The wind energy potential is mainly limited to relatively
small coastal areas, while political rifts and environmental issues are significant hurdles in the
utilisation of hydroelectricity[33]. The solar energy potential of Pakistan is greater than that
of any other renewable source with a daily average insolation of 4-6kWh/m2/day and 8-10
sunshine hours/day all over the country [49]. Pakistan is suitable for the application of all
types of solar energy technologies as there is no political or environmental problem with solar
energy as with wind and hydroelectric power. This potential could provide sustainable energy
for current and future demand.
The third objective was to study climatic conditions, indoor comfort conditions and their
relationship to the building energy code of Pakistan. The climate of Pakistan is generally arid
with hot summers and relatively cold winters. About 80% of population (total 184 million)
[69], in the country lives in climatic condition with hot summer season, required cooling
systems for comfort. Extreme high temperatures have increased in frequency and severity in
the past decades and this is increasing energy demand for cooling [84]. Energy demand in
buildings is increased by 15% per annum in Pakistan [104]. There is a negligible application
of building energy codes and most buildings are energy inefficient. There is the overall
potential to save about 30% of energy in buildings by applying building energy codes and
other measures [111]. Simple radiative, insulative, and reflective materials can decrease the
room temperature in the summer season and reduce a building’s cooling energy demand
[112].
The fourth objective was a literature review of solar cooling systems and especially solar
cooling in hot climates, and this was aimed at identifying the current state of knowledge
about solar cooling system technology relevant to the climate of Pakistan. Solar thermal
cooling application started in the early 1960s and more than 1,200 systems have been
installed worldwide [173]. In hot climates such as Pakistan, solar thermal is preferable to
solar electric cooling both in terms of efficiency and load compatibility [24]. The climate of
Pakistan is favourable for solar cooling applications as the greatest cooling loads and solar
energy availability occur at about the same time in summer. Stationary collectors, flat plate
and evacuated tube, are most commonly used for solar cooling applications as they are much
cheaper than concentrating (tracking) collectors, and can generate sufficiently high

217
temperatures for solar cooling. Evacuated tube collectors are preferred over flat plate
collectors due to their higher thermal efficiency and higher temperature output [183]. The
average area required for a flat plate collector is 4.6m2/kWC, whereas for an evacuated tube
collector it is 2.5m2/kWC [184]. An absorption cooling system is more efficient than other
thermal cooling systems [132].
The fifth objective of the research was the selection of a suitable analysis methodology.
TRNSYS is a comprehensive computer program which is widely used for dynamic
simulation of building integrated solar energy systems. The accuracy of TRSNSY for solar
energy systems has been tested by many researchers and found to be within +/- 10% variation
of experimental data [336]. Weather data is a key input for solar cooling systems and building
energy simulation. Suitable typical weather data (TMY2) for five cities in Pakistan is
provided with TRNSYS [361]. A building model was created to simulate part of a typical
house in Pakistan with actual dimensions and construction materials.
The last objective was to perform a simulation, analyse the results and produce
recommendations. The simulation was performed for a solar powered cooling system with an
evacuated tube collector, hot water storage tank, absorption chiller, and dry cooler. The
simulation was performed in the TRNSYS environment and the system operated
continuously for 1 year (8,760 hours).The simulations results showed that a final optimum
system for a 42m3 room consists of 12m
2 (gross area) of evacuated tube collectors lying
horizontally with 2m3 of hot water storage tank for 3.52kW absorption chiller capacity. It is
concluded from the simulation of the system that, on an annual basis without a backup heat
source, 100% of the heat input demand can be covered with solar energy and the system can
meet the building cooling loads.
The component model of the absorption chiller needs a specific data sheet for its performance
description. An actual chiller performance data sheet was constructed specifically for the
current research [392]. The results showed a very good agreement of chiller performance
between TRNSYS default chiller data and actual data.
The accuracy of the model was investigated by validating the results with published and
standard parameters. All the inputs are referenced to increase the model validity and
218
accuracy. All the results are in good agreement with the published results. A sensitivity
analysis was carried out for the effect of selected parameters on collector flow, collector area
and storage tank volume on the chilled water outlet temperature. This showed that the order
of importance of these parameters for system performance was, firstly, the collector area,
then the storage tank volume and, finally, the collector flow rate.
8.4 Recommendations
8.4.1 Energy and Solar Energy Data
There should be one agency which should publish authentic and accurate energy statistics
data for research and other use. Similarly, CO2 and other greenhouse gases emission and
country population data for Pakistan are not available from any public agency of the country
[69]. The available data is years old and need verified up to date from public agency.
The theft, transmission, and distribution losses and less recovery of bills are main contributor
of current crisis which need to be overcome with better policies and management as done in
many developed countries.
The renewable energy resource (Solar, wind and hydroelectric energy) should be utilised to
help meet current and future energy demand. The future energy projects plans should target
the use of these green energy resources with countable share in energy mix. The use of solar
energy based products can help to meet basic needs for light and other utilities.
The use of off grid PV systems in the remote areas of Balochistan, KPK, Sindh, and south
Punjab can provide electricity in areas which are not connected to national grid system due to
low population density.
There should be comprehensive solar energy potential mapping for the country as Raja’s
work is confined to five cities[46]. The reliable and long term data are mandatory for
successful solar energy system design and operation.
8.4.2 Building Energy and Efficiency
Buildings in Pakistan are not energy efficient due to a lack of the application of any building
energy code and standard. The building sector is a major consumer of electricity in the
country; energy savings in buildings would reduce electricity demand and improve the
comfort of buildings in the summer [111].

219
New building codes (as in Turkey) should be introduced for energy efficient buildings in
Pakistan to improve energy efficiency in existing buildings.
The materials and techniques used by UN-HABITAT for improving energy efficiency of
existing buildings have improved the comfort inside. The best material was paper board in
term of cost and comfort [112]. This material should be used in current building to reduce
cooling load and increase comfort.
The building simulation results showed the use of double glazed windows in place of
currently used single glazed windows or steel shutters can improve comfort, infiltration and
heat gains and losses in buildings.
8.4.3 Solar Thermal Cooling
Solar absorption cooling systems can be a sustainable and green solution as cooling demand
for the building and solar radiation intensity take place more or less at the same time. It is
recommended to promote use of these systems for cooling in Pakistan.
The simulation results showed that in the proposed solar thermal cooling system, heat energy
collected is not used in winter months. This excess energy can be used for domestic hot water
in winter season when there is shortage of natural gas supply.
8.5 Further Studies
8.5.1 Building Energy and Efficiency
The research work on building energy, efficiency, and efficient building materials in Pakistan
is limited. Building heating and cooling load with current materials should be investigated in
details for all five climatic regions of Pakistan.
The results for a typical building are specific and depend upon building geometry,
construction material and the cooling system in use. The cooling load also depends upon
human occupancy and activities. Cooling is required only in the summer and the simulation
was carried out for a year. The results may be further split into summer and winter seasons
for separate analysis of cooling and heating output for future research.
Further work could be carried out to identify the energy efficient building materials with the
minimum heat gains and cooling load for the all the climatic regions of Pakistan.

220
The current research was carried out for ASHRAE standard thermal comfort condit ion.
Further research can be carried out for adopted thermal conditions for each climatic region of
Pakistan for small sizes of cooling systems and economics.
8.5.2 Solar Cooling System
In the current research, only two components were controlled and operated and only when
required. All other components (chiller, fan, cooling tower, and cooling coil) were working
continuously. Further research could be carried out to improve the system control so it
includes realistic controls for pumps and the chiller to reduce the electricity consumption.
Further research work could be carried out to investigate the effect of different types of
collectors and cooling systems on system efficiency and energy consumption for the climate
of Pakistan.
This research is carried out using vapour absorption cooling system for Lahore climate.
Further research can be carried out by using different cooling system in all climatic regions to
establish the most suitable technology for each region.
Further research can be carried out by using backup heat source and optimise the share of
solar energy in the total energy supply with minimum collector and storage sizes.
Further research can be carried out for hybrid solar thermal heating and cooling system for
different climatic regions of Pakistan in combination with wind, micro hydroelectric and geo
thermal energy.
An experimental setup can be to assess the performance of actual solar cooling system and
can be optimised using the TRNSYS results and the performance of both systems can be
compared.
In this research the tilt angle of the solar collector was fixed to zero. Further research can be
carried out for monthly, seasonal, and annual tilt angle for maximum energy yield of
collector.
This work was performed for a solar thermal cooling system with grid supplied electricity.
Further research could be carried out by providing solar PV based electrical energy for a
standalone and self-sufficient solar powered cooling system.

221
The economic analysis of solar cooling system can be carried out for Pakistan climate. The
most economical configuration for solar cooling system can be figured out. Furthermore the
economics of each solar cooling system for specific region can be established.
Further research can be carried out to compare the solar thermal and solar electric cooling for
different climatic regions of Pakistan and suitable system can be recommended.

222
References
1. Muneer, Tariq, Muhammad Asif and Saima Munawwar, Sustainable production of
solar electricity with particular reference to the Indian economy. Renewable and
Sustainable Energy Reviews, 2005. 9(5): p. 444-473.
2. Muneer, T. and M. Asif, Prospects for secure and sustainable electricity supply for
Pakistan. Renewable and Sustainable Energy Reviews, 2007. 11(4): p. 654-671.
3. British Petroleum, Statistical review of world energy June 2014. 2014.
4. British Petroleum, BP energy outlook 2035. BP stats, Jan, 2014.
5. Birol, F, World Energy Outlook 2013. International Energy Agency, Paris, France, ,
2013.
6. Haukkala, Teresa, Does the sun shine in the High North? Vested interests as a barrier
to solar energy deployment in Finland. Energy Research & Social Science, 2015. 6: p.
50-58.
7. World Bank. Energy use per capita. 2014 [cited November 2014.
8. Brander, Matthew, Aman Sood, Charlotte Wylie, Amy Haughton, and Jessica Lovell,
Technical Paper| Electricity-specific emission factors for grid electricity. 2011,
Ecometrica.
9. Eni., World oil and gas review. 2014.
10. Ministry of Finance Pakistan, Economic survey of Pakistan 2014-15. 2015: Islamabad
Pakistan.
11. Qasim Mubashir, Kotani Koji, An empirical analysis of energy shortage in Pakistan.
Asia Pacific Development Journal, 2014. 21(1): p. 29.
12. Aftab, Safia, Pakistan's energy crisis:causes , consequences and possible remedies, in
NOREF Expert Analysis. 2014, Norwegian Peacebuilding Resource Centre (NOREF):
Oslo, Norway.
13. Government of Pakistan, Policy for development of renewable energy for power
generation, employing small hydro, wind anfd solar technologies. 2006, Ministry of
water and power: Islamabad Pakistan.
14. Amer, Muhammad and Tugrul U Daim, Selection of renewable energy technologies
for a developing county: a case of Pakistan. Energy for Sustainable Development,
2011. 15(4): p. 420-435.
15. Government of Pakistan, National power policy 2013. 2013, Ministry of Water and
power: Islamabad Pakistan.
16. National Transmission & Dispatch Company, Power Systems Statistics 2013-14.
2014, Planning Power NTDC: Lahore. p. 70.
17. Pasha, Hafiz A and Wasim Saleem, The Impact and Cost of Power Load Shedding to
Domestic Consumers. The Pakistan Development Review, 2013. 52(4): p. 355-373.
18. Sher, Hadeed Ahmed, Ali F. Murtaza, Khaled E. Addoweesh, and Marcello
Chiaberge, Pakistan’s progress in solar PV based energy generation. Renewable and
Sustainable Energy Reviews, 2015. 47: p. 213-217.
19. Government of Pakistan, Annual plan 2015-16. 2015, Planning comission of Pakistan:
Islamabad Pakistan. p. 121-137.
20. Nepra, State of industry report 2014. 2014: Islamabad Pakistan. p. 9-10.
21. Pokharel, Bipin, Mark A Curtis, Gordon M Hickey, and Michel A Bouchard, Power
shortage, its impacts and the hydropower sustainability assessment protocol: in the
context of South Asia. 2010, Masters Thesis submitted to the Depart of Natural
Resource Sciences, McGill University, MacDonald Campus, Montreal, QC, Canada.

223
22. Eicker, Ursula, Dirk Pietruschka, Maximilian Haag, and Andreas Schmitt, Energy and
Economic Performance of Solar Cooling Systems World Wide. Energy Procedia,
2014. 57: p. 2581-2589.
23. Hartmann, N, C Glueck and Fp Schmidt, Solar cooling for small office buildings:
Comparison of solar thermal and photovoltaic options for two different European
climates. Renewable Energy, 2011. 36(5): p. 1329-1338.
24. Mateus, Tiago and Armando C. Oliveira, Energy and economic analysis of an
integrated solar absorption cooling and heating system in different building types and
climates. Applied Energy, 2009. 86(6): p. 949-957.
25. Welling, Robin M., Solar Thermal Markets in Europe, in Trends and Market
Statistics 2014. 2015, European Solar Thermal Industry Federation (ESTIF): Brussels.
p. 1-20.
26. Kalkan, Naci, Ea Young and Ahmet Celiktas, Solar thermal air conditioning
technology reducing the footprint of solar thermal air conditioning. Renewable and
Sustainable Energy Reviews, 2012. 16(8): p. 6352-6383.
27. Pakistan Meteorological Department. PMD wind energy project. 2015 [cited 2015 15
April]; Available from: http://www.pmd.gov.pk.
28. Nepra, State of industry report 2013. 2013: Islamabad Pakistan.
29. Ali, Jawad, Tor A Benjaminsen, Ahmed A Hammad, and Øystein B Dick, The road to
deforestation: An assessment of forest loss and its causes in Basho Valley, Northern
Pakistan. Global Environmental Change, 2005. 15(4): p. 370-380.
30. Aedb Pakistan. wind resource potential. 2015 [cited 2015 25 June]; Available from:
www.aedb.org.
31. Dai, Kaoshan, Anthony Bergot, Chao Liang, Wei-Ning Xiang, and Zhenhua Huang,
Environmental issues associated with wind energy–A review. Renewable Energy,
2015. 75: p. 911-921.
32. Ministry of Finance Pakistan, Economic survey of Pakistan 2013-14. 2014: Islamabad
Pakistan.
33. Khalid, Iram and Ishrat Begum, Hydro Politics in Pakistan: Perceptions and
Misperceptions. South Asian Studies, 2013. 28(1): p. 7-23.
34. Ppib Pakistan, hydro power resources of pakistan. 2011, Ministry of water and power:
Pakistan. p. 9-10.
35. Biernat, Krzysztof, Artur Malinowski and Malwina Gnat, The Possibility of Future
Biofuels Production Using Waste Carbon Dioxide and Solar Energy. 2013.
36. Trenberth, Kevin E, John T Fasullo and Jeffrey Kiehl, Earth's global energy budget.
Bulletin of the American Meteorological Society, 2009. 90(3): p. 311-323.
37. Bent Sørensen, Solar Power, in Renewable Energy Focus Handbook. 2009, Academic
press: USA. p. 341-382.
38. Ener Data. Global energy statistical year book 2015. 2015 [cited 2015 15 July ];
Available from: www.enerdata.net.
39. Philibert, Cédric, Technology roadmap: concentrating solar power. 2010:
OECD/IEA.
40. Duffie, J.A. and W.A. Beckman, Solar Engineering of Thermal Processes. 2006:
Wiley.
41. Awan, Ahmad Bilal and Zeeshan Ali Khan, Recent progress in renewable energy–
Remedy of energy crisis in Pakistan. Renewable and Sustainable Energy Reviews,
2014. 33: p. 236-253.
42. Nasa. Surface Meteorology and Solar Energy. Renewable Energy Source website
2014 [cited 2014 30-11-2014]; 6.0:[

224
43. Sukhera, Mb and Mar Pasha, Solar radiation maps for Pakistan. Solar & wind
technology, 1987. 4(2): p. 229-238.
44. Sukhera, Mb, Mar Pasha and Ms Naveed, Solar radiation over Pakistan—
Comparison of measured and predicted data. Solar & wind technology, 1986. 3(3): p.
219-221.
45. I.A.Raja, Assessment of Solar Radiation in Pakistan, in Energy Studies Unit,. 1992,
University of Strathclyde, Glasgow: U.K.
46. Raja, I. A. and J. W. Twidell, Distribution of global insolation over Pakistan. Solar
Energy, 1989. 43(6): p. 355-357.
47. Raja, I. A. and J. W. Twidell, Statistical analysis of measured global insolation data
for Pakistan. Renewable Energy, 1994. 4(2): p. 199-216.
48. Muneer, T, S Maubleu and M Asif, Prospects of solar water heating for textile
industry in Pakistan. Renewable and Sustainable Energy Reviews, 2006. 10(1): p. 1-
23.
49. Malik, Sidra Nisar and Osama Rafiq Sukhera, Management of natural gas resources
and search for alternative renewable energy resources: A case study of Pakistan.
Renewable and Sustainable Energy Reviews, 2012. 16(2): p. 1282-1290.
50. Quaschning, Volker and M Blanco Muriel, Solar power-photovoltaics or solar
thermal power plants? VGB POWERTECH-INTERNATIONAL EDITION-, 2002.
82: p. 48-52.
51. World Energy Council, 2010 survey of energy resources. 2010: United Kingdom.
52. Mirza, Umar K, M Mercedes Maroto-Valer and Nasir Ahmad, Status and outlook of
solar energy use in Pakistan. Renewable and Sustainable Energy Reviews, 2003.
7(6): p. 501-514.
53. Pakistan Engineering Council, energy updates, in newsletter. 2010, PEC: Islamabad
pakistan. p. 38.
54. A. Khalid, M Mahmood, Energy conservation using desiccant cooling system, in 12th
HVACR national conference on air conditioning systems pakistan. 2005, Pakistan
HVACR society: Islamabad.
55. A. Khalid, M Mahmood, M Asif, T.Muneer, solar assisted hybrid desiccant cooling
system for the climate of pakistan, in 3rd international conference on solar radiation
and day lighting. 2007: New delhi, India.
56. Mehmood, Aamir, Adeel Waqas and Hafiza Tahira Mahmood, Stand-alone PV
System Assessment for Major Cities of Pakistan Based on Simulated Results: A
Comparative Study. NUST Journal of Engineering Sciences (NJES) Islamabad, 2013.
6(1): p. 33-37.
57. Raja, Nusrat Kamal, M Shahid Khalil, Syed Athar Masood, and Muhammad Shaheen,
Design and manufacturing of parabolic trough solar collector system for a
developing country Pakistan. Journal of American Science, 2011. 7(1).
58. Khan, T, Ia Chaudhry and A Rehman, Design of a Solar Updraft Tower Power Plant
for Pakistan and its Simulation in TRNSYS. 2014.
59. Shah, Sadiq Ali, Analysis of solar energy production, utilisation and management for
facilitating sustainable development in and around the deserts of Pakistan. 2012,
University of Manchester.
60. Shah, Sadiq Ali, Yang Zhang and Rodger Edward Edwards, Hybrid Energy Based
and CO2 Sequestration Capable Desert Potential Development. NUST Journal of
Engineering Sciences (NJES), 2010. 3(1): p. 39-45.
61. Shah, Sadiq Ali and Yang Zhang, The impact of desert solar power utilization on
sustainable development. Applied Solar Energy, 2011. 47(4): p. 336-341.

225
62. Shah, Sadiq Ali and Rodger Edwards, Sustainable energy generation processes in the
deserts of solar-rich countries. International Journal of Sustainable Energy, 2013.
32(3): p. 196-203.
63. Shah, Sa and Y Zhang, Prospects of coastal solarization for freshwater and electricity
production. ISESCO Science and Technology Vision, 2010. 10: p. 82-87.
64. Chaudhry, Q-U-Z, A Mahmood, G Rasul, and M Afzaal, Climate change indicators
of Pakistan. Pakistan Meteorological Department, Islamabad. Technical Report No.
PMD-22/2009, 2009: p. 1-43.
65. Khan, Fazle Karim, A geography of Pakistan: environment, people and economy.
1991: Oxford University Press.
66. Survey of Pakistan. Adminitrative Areas of Pakistan. 2015 [cited 2015 15 March ].
67. Pakistan Statistical Pocket Book, Islamabad: Federal Bureau of Statistics Division.
Government of Pakistan, 2006.
68. Pakistan Population. The world gazetteer. 2010 [cited 2010 15 August]; Available
from: http://www.grida.no/geo/GEO/Geo-2-234.htm.
69. Desa, Un, World population prospects: The 2012 revision. Population Division of the
Department of Economic and Social Affairs of the United Nations Secretariat, New
York, 2013.
70. Kugelman, Michael, urbanisation in pakistan: causes and consequences, in NOREF
Expert Analysis. 2013: Oslo, Norway.
71. Mcsweeney, Carol, Gil Lizcano, Mark New, and X Lu, The UNDP Climate Change
Country Profiles: Improving the accessibility of observed and projected climate
information for studies of climate change in developing countries. Bulletin of the
American Meteorological Society, 2010. 91(2): p. 157-166.
72. Chaudhry, Qz and G Rasul, Agroclimatic classification of Pakistan. Science Vision,
2004. 9(3-4): p. 59-66.
73. Khan, Saif Ullah, Mu Hasan, Fk Khan, and A Bari, Climate classification of Pakistan.
Balwois-Ohrid, Republic of Macedonia, May, 2010. 29.
74. Pakistan Meteorological Department. normal temperature. climate data processing
center 2014 [cited 2014 10 june].
75. Zahid, Maida and Ghulam Rasul, Rise in summer heat index over Pakistan. Pakistan
Journal of Meteorology, 2010. 6(12): p. 85-96.
76. Delworth, Thomas L, Jd Mahlman and Thomas R Knutson, Changes in heat index
associated with CO2-induced global warming. Climatic Change, 1999. 43(2): p. 369-
386.
77. Rothfusz, Lans P and Nws Southern Region Headquarters, The heat index equation
(or, more than you ever wanted to know about heat index). Fort Worth, Texas:
National Oceanic and Atmospheric Administration, National Weather Service, Office
of Meteorology, 1990: p. 90-23.
78. Gadiwala, Muhammad Sohail and Naeem Sadiq, The apparent temperature analysis
of Pakistan using bio-meteorological indices. Pakistan Journal of Meteorology Vol,
2008. 4(8).
79. Meehl, Gerald A and Claudia Tebaldi, More intense, more frequent, and longer
lasting heat waves in the 21st century. Science, 2004. 305(5686): p. 994-997.
80. Schär, Christoph, Pier Luigi Vidale, Daniel Lüthi, Christoph Frei, Christian Häberli,
Mark A Liniger, and Christof Appenzeller, The role of increasing temperature
variability in European summer heatwaves. Nature, 2004. 427(6972): p. 332-336.
81. Clark, Robin T, Simon J Brown and James M Murphy, Modeling northern
hemisphere summer heat extreme changes and their uncertainties using a physics

226
ensemble of climate sensitivity experiments. Journal of Climate, 2006. 19(17): p.
4418-4435.
82. Rasul, Ghulam, Qin Dahe and Qz Chaudhry, Global warming and melting glaciers
along southern slopes of HKH range. Pak. Jr. of Meteorology, 2008. 5(9).
83. Dousset, Bénédicte, Françoise Gourmelon, Karine Laaidi, Abdelkrim Zeghnoun,
Emmanuel Giraudet, Philippe Bretin, Elena Mauri, and Stéphanie Vandentorren,
Satellite monitoring of summer heat waves in the Paris metropolitan area.
International Journal of Climatology, 2011. 31(2): p. 313-323.
84. Zahid, Maida and Ghulam Rasul, Changing trends of thermal extremes in Pakistan.
Climatic Change, 2012. 113(3-4): p. 883-896.
85. Robine, Jean-Marie, Siu Lan K Cheung, Sophie Le Roy, Herman Van Oyen, Clare
Griffiths, Jean-Pierre Michel, and François Richard Herrmann, Death toll exceeded
70,000 in Europe during the summer of 2003. Comptes rendus biologies, 2008.
331(2): p. 171-178.
86. Rebetez, Martine, Olivier Dupont and M Giroud, An analysis of the July 2006
heatwave extent in Europe compared to the record year of 2003. Theoretical and
Applied Climatology, 2009. 95(1-2): p. 1-7.
87. Luber, George and Michael Mcgeehin, Climate change and extreme heat events.
American journal of preventive medicine, 2008. 35(5): p. 429-435.
88. Huang, Wei, Haidong Kan and Sari Kovats, The impact of the 2003 heat wave on
mortality in Shanghai, China. Science of the Total Environment, 2010. 408(11): p.
2418-2420.
89. Handbook, Ashrae Fundamentals, Thermal comfort. Atlanta, GA: American Society
of Heating, Refrigerating and Air-conditioning Engineers, 2005.
90. Standard, Ashrae, Standard 55-2013. Thermal environmental conditions for human
occupancy. ASHRAE. Atlanta, USA, 2013.
91. Kazkaz, Mohammad and Milan Pavelek, Operative temperature and globe
temperature. Engineering MECHANICS, 2013. 20(3/4): p. 319-325.
92. Standard, Iso, 7730. Moderate thermal environments–Determination of the PMV and
PPD indices and specification of the conditions for thermal comfort, 1994.
93. Olesen, Bjarne W and Kc Parsons, Introduction to thermal comfort standards and to
the proposed new version of EN ISO 7730. Energy and buildings, 2002. 34(6): p. 537-
548.
94. Francis, J and Re Edwards, Speedy comfort assessment using ISO 7730. Building
Services Engineering Research and Technology, 1995. 16(3): p. 165-168.
95. Nicol, Fergus, Adaptive thermal comfort standards in the hot–humid tropics. Energy
and Buildings, 2004. 36(7): p. 628-637.
96. Humphreys, Michael A. and J. Fergus Nicol, The validity of ISO-PMV for predicting
comfort votes in every-day thermal environments. Energy and Buildings, 2002. 34(6):
p. 667-684.
97. Nicol, J Fergus, Iftikhar A Raja, Arif Allaudin, and Gul Najam Jamy, Climatic
variations in comfortable temperatures: the Pakistan projects. Energy and Buildings,
1999. 30(3): p. 261-279.
98. Nicol, J Fergus and Michael A Humphreys, Adaptive thermal comfort and sustainable
thermal standards for buildings. Energy and buildings, 2002. 34(6): p. 563-572.
99. Olesen, Bjarne W, Kw Tham, C Sekhar, and D Cheong. International standards for
the indoor environment. Where are we and do they apply to Asian countries? in 7th
International Conference on Healthy Buildings 2003. 2003.
100. World Meteorological Organization. world weather Information Service. 2015 [cited
2015 15 September]; Available from: http://worldweather.wmo.int.

227
101. Nicol, J. Fergus and Iftikhar A. Raja, Indoor thermal comfort: the Pakistan study.
Energy for Sustainable Development, 1997. 3(5): p. 50-60.
102. Nicol, Fergus and Susan Roaf, Pioneering new indoor temperature standards: the
Pakistan project. Energy and Buildings, 1996. 23(3): p. 169-174.
103. Bouden, C and N Ghrab, An adaptive thermal comfort model for the Tunisian context:
a field study results. Energy and Buildings, 2005. 37(9): p. 952-963.
104. Eiswerth, Mark E, Kurt W Abendroth, Robert E Ciliano, Azedine Ouerghi, and
Michael T Ozog, Residential electricity use and the potential impacts of energy
efficiency options in Pakistan. Energy policy, 1998. 26(4): p. 307-315.
105. Ahmed, Ajaz, Energy Smart Buildings: Potential for Conservation and Efficiency of
Energy. 2013.
106. Drewe, David, Energy conservation in traditional buildings. 2007.
107. Keskin, Tülin, Energy management in the building sector: Turkish experience. World
Energy Council, Turkish Committee, , 2008.
108. Jha, Is, Subir Sen and S Victor P Selvakumar. Energy Efficiency—Potential solution
for bridging demand supply gap. in Power Systems Conference (NPSC), 2014
Eighteenth National. 2014. IEEE.
109. Enercon. Launch of BEC. 2014 [cited 2014 15 October]; Available from:
www.enercon.gov.pk.
110. Enercon, Building energy code of Pakistan. 2008: Islamabad Pakistan.
111. Enercon. Implementation of the building energy code potential and needs. [cited
2015 10 September]; Available from: www.enercon.gov.pk.
112. Un-Habitat, Energy efficient housing:improvement of thermal performance of RC slab
roof. 2010, ENERCON: Islamabad Pakistan.
113. Kattakayam, Thomachan A and K Srinivasan, Lead acid batteries in solar
refrigeration systems. Renewable energy, 2004. 29(8): p. 1243-1250.
114. Henning, Hans-Martin, Solar assisted air conditioning of buildings–an overview.
Applied Thermal Engineering, 2007. 27(10): p. 1734-1749.
115. Axaopoulos, Petros J and Michael P Theodoridis, Design and experimental
performance of a PV Ice-maker without battery. Solar Energy, 2009. 83(8): p. 1360-
1369.
116. Fumo, N, V Bortone and Jc Zambrano, Comparative Analysis of Solar Thermal
Cooling and Solar Photovoltaic Cooling Systems. Journal of Solar Energy
Engineering, 2013. 135(2): p. 021002.
117. Sarbu, Ioan and Calin Sebarchievici, Review of solar refrigeration and cooling
systems. Energy and Buildings, 2013. 67: p. 286-297.
118. Fong, Kf, Tin Tai Chow, Chun Kwong Lee, Z Lin, and Ls Chan, Comparative study
of different solar cooling systems for buildings in subtropical city. Solar Energy,
2010. 84(2): p. 227-244.
119. Kim, Ds and Ca Infante Ferreira, Solar refrigeration options–a state-of-the-art
review. International Journal of refrigeration, 2008. 31(1): p. 3-15.
120. Ullah, Kr, R Saidur, Hw Ping, Rk Akikur, and Nh Shuvo, A review of solar thermal
refrigeration and cooling methods. Renewable and Sustainable Energy Reviews,
2013. 24: p. 499-513.
121. Chan, Hoy-Yen, Saffa B Riffat and Jie Zhu, Review of passive solar heating and
cooling technologies. Renewable and Sustainable Energy Reviews, 2010. 14(2): p.
781-789.
122. Reichardt, Till Felix, Technical and Economic Assessment of Medium Sized Solar-
Assisted Air-Conditioning in Brazil. 2010, Departamento de Engenharia Civil, PUC-
Rio.

228
123. Otanicar, Todd, Robert A Taylor and Patrick E Phelan, Prospects for solar cooling–
An economic and environmental assessment. Solar Energy, 2012. 86(5): p. 1287-
1299.
124. Eicker, Ursula, Dirk Pietruschka, Maximilian Haag, and Andreas Schmitt, Systematic
design and analysis of solar thermal cooling systems in different climates. Renewable
Energy, 2015. 80: p. 827-836.
125. Cherif, Adnene and Ahmed Dhouib, Dynamic modelling and simulation of a
photovoltaic refrigeration plant. Renewable Energy, 2002. 26(1): p. 143-153.
126. Modi, Anish, Anirban Chaudhuri, Bhavesh Vijay, and Jyotirmay Mathur,
Performance analysis of a solar photovoltaic operated domestic refrigerator. Applied
Energy, 2009. 86(12): p. 2583-2591.
127. Peyton-Levine, Tobin, Jonathan Sherbeck, Beth Magerman, and Patrick E Phelan.
Solar Cooling With Ice Storage. in ASME 2012 International Mechanical
Engineering Congress and Exposition. 2012. American Society of Mechanical
Engineers.
128. Ewert, Michael K, Marty Agrella, Dan Demonbrun, Jim Frahm, David J Bergeron,
and David Berchowitz. Experimental evaluation of a solar PV refrigerator with
thermoelectric, stirling and vapor compression heat pumps. in Proceedings of Solar.
1998.
129. Berchowitz, David M, Jarlath Mcentee and Steven Welty. Design and testing of a 40
W free-piston Stirling cycle cooling unit. in Proceedings of 20th International
Congress of Refrigeration, Sydney, Australia. 1999.
130. Kribus, Abraham, Thermal integral micro-generation systems for solar and
conventional use. Journal of solar energy engineering, 2002. 124(2): p. 189-197.
131. Li, Y., G. Zhang, G. Z. Lv, A. N. Zhang, and R. Z. Wang, Performance study of a
solar photovoltaic air conditioner in the hot summer and cold winter zone. Solar
Energy, 2015. 117: p. 167-179.
132. Allouhi, Amine, Tarik Kousksou, Abdelmajid Jamil, Pascal Bruel, Youssef Mourad,
and Youssef Zeraouli, Solar driven cooling systems: An updated review. Renewable
and Sustainable Energy Reviews, 2015. 44: p. 159-181.
133. Zhao, Lei, Wenjian Cai, Xudong Ding, and Weichung Chang, Model-based
optimization for vapor compression refrigeration cycle. Energy, 2013. 55: p. 392-402.
134. Gude, Veera Gnaneswar and Nagamany Nirmalakhandan, Sustainable desalination
using solar energy. Energy Conversion and Management, 2010. 51(11): p. 2245-
2251.
135. Bilgili, Mehmet, Hourly simulation and performance of solar electric-vapor
compression refrigeration system. Solar Energy, 2011. 85(11): p. 2720-2731.
136. Yamankaradeniz, R, I Horuz, O Kaynakli, S Coskun, and N Yamankaradeniz,
Refrigeration techniques and heat pump applications. 2009, Dora Publication
Company, Bursa, Turkey,(in Turkish).
137. Mastrullo, R and C Renno, A thermoeconomic model of a photovoltaic heat pump.
Applied Thermal Engineering, 2010. 30(14): p. 1959-1966.
138. Rudischer, R, J Waschull, W Hernschier, and C Friebe. Available solar cooling
applications for different purposes. in International Conference ‘Solar Air
Conditioning’, Bad Staffelstein. 2005.
139. Tian, Yuan and Chang-Ying Zhao, A review of solar collectors and thermal energy
storage in solar thermal applications. Applied Energy, 2013. 104: p. 538-553.
140. Ghafoor, Abdul and Anjum Munir, Worldwide overview of solar thermal cooling
technologies. Renewable and Sustainable Energy Reviews, 2015. 43: p. 763-774.

229
141. Sørensen, Bent, Paul Breeze, Truman Storvick, Shang_Tian Yang, Aldo V Da Rosa,
Harsh K Gupta, Roy Sukanta, Mukesh Doble, P Maegaard, and Gianfranco Pistoia,
Renewable Energy Focus Handbook. 2009, Academic Press, .
142. Choudhury, B, Pk Chatterjee and Jp Sarkar, Review paper on solar-powered air-
conditioning through adsorption route. Renewable and Sustainable Energy Reviews,
2010. 14(8): p. 2189-2195.
143. Joshi, Anand S, Ibrahim Dincer and Bale V Reddy, Performance analysis of
photovoltaic systems: a review. Renewable and Sustainable Energy Reviews, 2009.
13(8): p. 1884-1897.
144. Chinnappa, Jcv, Performance of an intermittent refrigerator operated by a flat-plate
collector. Solar Energy, 1962. 6(4): p. 143-150.
145. Bolocan, S and I Boian, SOLAR COOLING FOR ENERGY SAVING. CAN WE
AFFORD NOT TO USE THE HEAT OF THE SUN? Bulletin of the Transilvania
University of Braşov• Vol, 2010. 3: p. 52.
146. Butz, Lw, Wa Beckman and Ja Duffie, Simulation of a solar heating and cooling
system. Solar Energy, 1974. 16(3): p. 129-136.
147. Klein, Sa, Pi Cooper, Tl Freeman, Dm Beekman, Wa Beckman, and Ja Duffie, A
method of simulation of solar processes and its application. Solar Energy, 1975.
17(1): p. 29-37.
148. Costello, Frederick A, A hybrid solar air conditioning system. Solar Energy, 1976.
18(2): p. 149-152.
149. Ward, Dan S, Thomas A Weiss and George Og Löf, Preliminary performance of CSU
Solar House I heating and cooling system. Solar Energy, 1976. 18(6): p. 541-548.
150. Nakahara, Nobuo, Yasuyuki Miyakawa and Mitsunobu Yamamoto, Experimental
study on house cooling and heating with solar energy using flat plate collector. Solar
Energy, 1977. 19(6): p. 657-662.
151. Ishibashi, Toshihiro, The result of cooling operation of Yazaki experimental solar
house “one”. Solar Energy, 1978. 21(1): p. 11-16.
152. Ward, Dan S and John C Ward, Design considerations for residential solar heating
and cooling systems utilizing evacuated tube solar collectors. Solar Energy, 1979.
22(2): p. 113-118.
153. Grossman, Gershon, Joseph R Bourne, Jonathan Ben-Dror, Yigal Kimchi, and Isaiah
Vardi, Design improvements in LiBr absorption chillers for solar applications.
Journal of Solar Energy Engineering, 1981. 103(1): p. 56-61.
154. Biancardi, Fr, Jw Sitler and G Melikian, Development and test of solar Rankine cycle
heating and cooling systems. International Journal of Refrigeration, 1982. 5(6): p.
351-360.
155. Muneer, T and Ah Uppal, Modelling and simulation of a solar absorption cooling
system. Applied energy, 1985. 19(3): p. 209-229.
156. Gommed, K and G Grossman, Performance analysis of staged absorption heat
pumps: water-lithium bromide systems. 1990: American Society of Heating,
Refrigerating and Air-Conditioning Engineers.
157. Meunier, F, Sorption solar cooling. Renewable Energy, 1994. 5(1): p. 422-429.
158. Hammad, M and Y Zurigat, Performance of a second generation solar cooling unit.
Solar Energy, 1998. 62(2): p. 79-84.
159. Li, Zf and K Sumathy, Experimental studies on a solar powered air conditioning
system with partitioned hot water storage tank. Solar Energy, 2001. 71(5): p. 285-
297.
160. Grossman, Gershon, Solar-powered systems for cooling, dehumidification and air-
conditioning. Solar energy, 2002. 72(1): p. 53-62.

230
161. Arbel, A and M Sokolov, Revisiting solar-powered ejector air conditioner––the
greener the better. Solar Energy, 2004. 77(1): p. 57-66.
162. Assilzadeh, F, Sa Kalogirou, Y Ali, and K Sopian, Simulation and optimization of a
LiBr solar absorption cooling system with evacuated tube collectors. Renewable
Energy, 2005. 30(8): p. 1143-1159.
163. Gommed, K and Gershon Grossman, Experimental investigation of a liquid desiccant
system for solar cooling and dehumidification. Solar Energy, 2007. 81(1): p. 131-138.
164. Mazloumi, M, M Naghashzadegan and K Javaherdeh, Simulation of solar lithium
bromide–water absorption cooling system with parabolic trough collector. Energy
Conversion and Management, 2008. 49(10): p. 2820-2832.
165. Kim, Ds and Ca Infante Ferreira, Air-cooled LiBr–water absorption chillers for solar
air conditioning in extremely hot weathers. Energy Conversion and Management,
2009. 50(4): p. 1018-1025.
166. Marc, Olivier, Franck Lucas, Frantz Sinama, and E Monceyron, Experimental
investigation of a solar cooling absorption system operating without any backup
system under tropical climate. Energy and Buildings, 2010. 42(6): p. 774-782.
167. Said, Syed Am, Maged Ai El-Shaarawi and Muhammad U Siddiqui, Alternative
designs for a 24-h operating solar-powered absorption refrigeration technology.
international journal of refrigeration, 2012. 35(7): p. 1967-1977.
168. Ayadi, Osama, Marcello Aprile and Mario Motta, Solar cooling systems utilizing
concentrating solar collectors-An overview. Energy Procedia, 2012. 30: p. 875-883.
169. Lizarte, R, M Izquierdo, Jd Marcos, and E Palacios, Experimental comparison of two
solar-driven air-cooled LiBr/H 2 O absorption chillers: Indirect versus direct air-
cooled system. Energy and Buildings, 2013. 62: p. 323-334.
170. Zhang, B, Js Lv and Jx Zuo, Theoretical and experimental study on solar ejector
cooling system using R236fa. International Journal of Low-Carbon Technologies,
2014. 9(4): p. 245-249.
171. Zhang, Wei, Saffa B Riffat, Xiaoli Ma, and Siddig A Omer. Optimum Design of a
Solar-Driven Ejector Cooling System. in Proceedings of the 8th International
Symposium on Heating, Ventilation and Air Conditioning. 2014. Springer.
172. Ferreira, Carlos Infante and Dong-Seon Kim, Techno-economic review of solar
cooling technologies based on location-specific data. International Journal of
Refrigeration, 2014. 39: p. 23-37.
173. Ren21, Renewables 2015 Global Status Report. 2015: Paris, REN21 Secretariat.
174. Iea, Technology Roadmap:Solar Heating and Cooling. 2012: Paris. p. 50.
175. Duffie, John A and William A Beckman, Solar Collectors. Solar Engineering of
Thermal Processes, Fourth Edition, 2013: p. 3-42.
176. A.Brown, A.Eisentraut And, Heating Without Global Warming,Market Developments
and Policy Considerations for Renewable Heat, in FEATURED INSIGHT. 2014,
International Energy Agency: Paris, France.
177. Kalogirou, Soteris A., Processess and Systems, in Solar Energy Engineering (Second
Edition), S.A. Kalogirou, Editor. 2014, Academic Press: Boston. p. 125-540.
178. Noro, M and Rm Lazzarin, Solar cooling between thermal and photovoltaic: An
energy and economic comparative study in the Mediterranean conditions. Energy,
2014. 73: p. 453-464.
179. Baharoon, Dhyia Aidroos, Hasimah Abdul Rahman, Wan Zaidi Wan Omar, and
Saeed Obaid Fadhl, Historical development of concentrating solar power
technologies to generate clean electricity efficiently–A review. Renewable and
Sustainable Energy Reviews, 2015. 41: p. 996-1027.
180. Iea, Technology roadmap: concentrating solar power. 2010: OECD/IEA.

231
181. Murphy, Pamela, IEA solar heating and cooling programme. 2015.
182. Wang, Zhangyuan, Wansheng Yang, Feng Qiu, Xiangmei Zhang, and Xudong Zhao,
Solar water heating: From theory, application, marketing and research. Renewable
and Sustainable Energy Reviews, 2015. 41: p. 68-84.
183. Sabiha, Ma, R Saidur, Saad Mekhilef, and Omid Mahian, Progress and latest
developments of evacuated tube solar collectors. Renewable and Sustainable Energy
Reviews, 2015. 51: p. 1038-1054.
184. Navarro Rivero, P and B Ehrismann, Durability issues, maintenance and cost of solar
cooling systems. Task report 5.3. 2. Quality Assurance in Solar Heating and Cooling
Technology, 2012.
185. Best, R and W Rivera, A review of thermal cooling systems. Applied Thermal
Engineering, 2015. 75: p. 1162-1175.
186. Daou, Kadoma, Rz Wang and Zz Xia, Desiccant cooling air conditioning: a review.
Renewable and Sustainable Energy Reviews, 2006. 10(2): p. 55-77.
187. Kumar, Naresh, G Srivastava and Brijesh Gangil, Heat and mass transfer study of
liquid desiccant with heat exchange by solar cooling technology. Int. J. Eng. Studies,
2010. 2: p. 105-118.
188. Wrobel, Jan, Pablo Sanabria Walter and Gerhard Schmitz, Performance of a solar
assisted air conditioning system at different locations. Solar Energy, 2013. 92: p. 69-
83.
189. Tabor, H, Use of solar energy for cooling purposes. Solar Energy, 1962. 6(4): p. 136-
142.
190. Ward, Dan S and George Og Löf, Design and construction of a residential solar
heating and cooling system. Solar Energy, 1975. 17(1): p. 13-20.
191. Ward, Dan S, George Og Löf, Charles C Smith, and Ll Shaw, Design of a solar
heating and cooling system for CSU Solar House II. Solar Energy, 1977. 19(1): p. 79-
85.
192. Ward, Ds, Cc Smith and Jc Ward, Operational modes of solar heating and cooling
systems. Solar Energy, 1977. 19(1): p. 55-61.
193. Ward, Ds, Ws Duff, Jc Ward, and Gog Löf, Intergration of evacuated tubular solar
collectors with lithium bromide absorption cooling systems. Solar Energy, 1979.
22(4): p. 335-341.
194. Muneer, T and M Hawas, Efficiency of solar energy use for residential heating and
cooling. Energy, 1981. 6(6): p. 519-527.
195. Uppal, Ah and T Muneer, Solar operated absorption air-conditioner for a Kufra
house. Applied energy, 1984. 16(4): p. 259-281.
196. Ayyash, S, An assessment of the feasibility of solar absorption and vapor
compression cooling systems. Energy Conversion and Management, 1981. 21(2): p.
163-169.
197. Al-Homoud, Aa, Rk Suri, Raed Al-Roumi, and Gp Maheshwari, Experiences with
solar cooling systems in Kuwait. Renewable energy, 1996. 9(1): p. 664-669.
198. Yeung, Mr, Pk Yuen, A Dunn, and Ls Cornish, Performance of a solar-powered air
conditioning system in Hong Kong. Solar Energy, 1992. 48(5): p. 309-319.
199. Sorour, Mm and Aa Ghoneim, Feasibility study of solar heating and cooling systems
at different localities in Egypt. Renewable energy, 1994. 5(1): p. 489-491.
200. Elsafty, A and Aj Al-Daini, Economical comparison between a solar-powered vapour
absorption air-conditioning system and a vapour compression system in the Middle
East. Renewable Energy, 2002. 25(4): p. 569-583.
201. Schwerdt, Peter and Ahmed Hamza H Ali, German/Egyptian demonstration project
on solar cooling in a hot arid climate. Energy Procedia, 2014. 48: p. 991-996.

232
202. Izquierdo, M, F Hernandez and E Martin, Solar cooling in Madrid: available solar
energy. Solar energy, 1994. 53(5): p. 431-443.
203. Syed, A, M Izquierdo, P Rodriguez, G Maidment, J Missenden, A Lecuona, and R
Tozer, A novel experimental investigation of a solar cooling system in Madrid.
International Journal of refrigeration, 2005. 28(6): p. 859-871.
204. Martínez, Pedro J, José C Martínez and Manuel Lucas, Design and test results of a
low-capacity solar cooling system in Alicante (Spain). Solar Energy, 2012. 86(10): p.
2950-2960.
205. Balghouthi, Moncef, Mohamed Hachemi Chahbani and Amenallah Guizani, Solar
powered air conditioning as a solution to reduce environmental pollution in Tunisia.
Desalination, 2005. 185(1): p. 105-110.
206. Balghouthi, M, Mh Chahbani and A Guizani, Feasibility of solar absorption air
conditioning in Tunisia. Building and Environment, 2008. 43(9): p. 1459-1470.
207. Pongtornkulpanich, A, S Thepa, M Amornkitbamrung, and C Butcher, Experience
with fully operational solar-driven 10-ton LiBr/H 2 O single-effect absorption cooling
system in Thailand. Renewable Energy, 2008. 33(5): p. 943-949.
208. Al-Alili, A, Y Hwang, R Radermacher, and I Kubo, Optimization of a solar powered
absorption cycle under Abu Dhabi’s weather conditions. Solar Energy, 2010. 84(12):
p. 2034-2040.
209. Al-Alili, A, Md Islam, I Kubo, Y Hwang, and R Radermacher, Modeling of a solar
powered absorption cycle for Abu Dhabi. Applied Energy, 2012. 93: p. 160-167.
210. Ssembatya, Martin, Manoj K Pokhrel and Rajesh Reddy, Simulation studies on
performance of solar cooling system in UAE conditions. Energy Procedia, 2014. 48:
p. 1007-1016.
211. Tsoutsos, T, E Aloumpi, Z Gkouskos, and M Karagiorgas, Design of a solar
absorption cooling system in a Greek hospital. Energy and Buildings, 2010. 42(2): p.
265-272.
212. Praene, Jean Philippe, Olivier Marc, Franck Lucas, and Frédéric Miranville,
Simulation and experimental investigation of solar absorption cooling system in
Reunion Island. Applied Energy, 2011. 88(3): p. 831-839.
213. Ayadi, Osama, Alberto Mauro, Marcello Aprile, and Mario Motta, Performance
assessment for solar heating and cooling system for office building in Italy. Energy
Procedia, 2012. 30: p. 490-494.
214. Fasfous, A, J Asfar, A Al-Salaymeh, A Sakhrieh, Z Al_Hamamre, A Al-Bawwab, and
M Hamdan, Potential of utilizing solar cooling in The University of Jordan. Energy
conversion and management, 2013. 65: p. 729-735.
215. Sim, Lik Fang, Numerical modelling of a solar thermal cooling system under arid
weather conditions. Renewable Energy, 2014. 67: p. 186-191.
216. El-Sharkawy, Ibrahim I., Hossam Abdelmeguid and Bidyut Baran Saha, Potential
application of solar powered adsorption cooling systems in the Middle East. Applied
Energy, 2014. 126: p. 235-245.
217. Ozgoren, Muammer, Mehmet Bilgili and Osman Babayigit, Hourly performance
prediction of ammonia–water solar absorption refrigeration. Applied Thermal
Engineering, 2012. 40: p. 80-90.
218. Khalid, A, M Mahmood, Muhammad Asif, and T Muneer, Solar assisted, pre-cooled
hybrid desiccant cooling system for Pakistan. Renewable Energy, 2009. 34(1): p. 151-
157.
219. Gupta, Mc and P Gandhidasan. Open cycle 3-ton solar airconditioner-Concept,
design and cycle analysis. in Sun: Mankind's Future Source of Energy. 1978.

233
220. Bansal, Nk, J Blumenberg, Hj Kavasch, and T Roettinger, Performance testing and
evaluation of solid absorption solar cooling unit. Solar Energy, 1997. 61(2): p. 127-
140.
221. Dilip Batukray Jani, Manish Mishra and P.K.Sahoo, Simulation of Solar Assisted Slod
Desiccant Cooling Systems Using TRNSYS., in 22nd National and 11th International
ISHMT-ASME Heat and Mass Transfer Conference. 2013: IIT Kharagpur, India.
222. Mittal, V, Ks Kasana and Ns Thakur, Modelling and simulation of a solar absorption
cooling system for India. Journal of Energy in Southern Africa, 2006. 17(3): p. 65-70.
223. Kumar, Yogender, Thermal design and performance evaluation of vapour
absorption/adsorption solar space conditioning systems. 1990, Indian Institute of
Technology, Delhi New Delhi.
224. Kaushik, S. C., Y. Kumar and J. V. Kaudinya, Feasibility of an open cycle absorption
solar cooling system with solution storage for continuous operation. International
Journal of Ambient Energy, 1991. 12(2): p. 101-106.
225. Kaushik, S. C., S. M. B. Gadhi, R. S. Agarwal, and Y. Kumar, Feasibility studies on
an alcohol-salt mixture for absorption refrigeration systems. Energy Conversion and
Management, 1991. 31(5): p. 459-469.
226. Kaushik, S. C. and Y. Kumar. Yadav, Thermodynamic design and assessment of
hybrid double absorption solar cooling systems. Heat Recovery Systems and CHP,
1991. 11(4): p. 255-262.
227. Yadav, Y. K. and S. C. Kaushik, Psychometric technoeconomic assessment and
parametric studies of vapor-compression and solid/liquid desiccant hybrid solar
space conditioning systems. Heat Recovery Systems and CHP, 1991. 11(6): p. 563-
572.
228. Habib, Khairul, Biplab Choudhury, Pradip Kumar Chatterjee, and Bidyut Baran Saha,
Study on a solar heat driven dual-mode adsorption chiller. Energy, 2013. 63: p. 133-
141.
229. Cabrera, Fj, A Fernández-García, Rmp Silva, and M Pérez-García, Use of parabolic
trough solar collectors for solar refrigeration and air-conditioning applications.
Renewable and Sustainable Energy Reviews, 2013. 20: p. 103-118.
230. Kalogirou, Soteris A., Chapter 11 - Designing and Modeling Solar Energy Systems, in
Solar Energy Engineering (Second Edition), S.A. Kalogirou, Editor. 2014, Academic
Press: Boston. p. 583-699.
231. Mangual, Rafael a Salgado, Optimized solar cooling facility configurations for the
Mediterranean warm climate. 2008, Universidad Carlos III de Madrid. p. 166.
232. Parke, Emily, Experiments, Simulations, and Lessons from Experimental Evolution.
2015.
233. Hinotani, Katsuhiro, Keiichi Kanatani and Masato Osumi, An evacuated glass tube
solar collector and its application to a solar cooling, heating and hot water supply
system for the hospital in Kinki University. Solar Energy, 1979. 22(6): p. 535-545.
234. Ayyash, S, Rk Suri and H Al-Shami, Performance results of solar absorption cooling
installation. International journal of refrigeration, 1985. 8(3): p. 177-183.
235. Van Hattem, D and P Actis Data, Description and performance of an active solar
cooling system, using a LiBr H 2 O absorption machine. Energy and Buildings,
1981. 3(2): p. 169-196.
236. Sayigh, Aam and Mk Saada. A three and a half ton solar absorption air conditioner's
performance in Riyadh, Saudi Arabia. in Proceedings of the International Solar
Energy Society Congress. 1981.

234
237. Ward, Hs, Zc Huang, Wc Wong, Cy Chu, Zh Zheng, and Hh Huang. Shenzhen solar
cooling and hot water supply system. in Proceedings of the Biennial Congress of the
International Solar Energy Society. 1987. ISES Hamburg, Germany.
238. Bong, Ty, Kc Ng and Ao Tay, Performance study of a solar-powered air-
conditioning system. Solar Energy, 1987. 39(3): p. 173-182.
239. Mak, Kwok-Keung, Design and operation of a solar-powered air-conditioning system
in Hong Kong. 1989, The University of Hong Kong (Pokfulam, Hong Kong).
240. Lazzarin, Rm, P Romagnoni and L Casasola, Two years of operation of a large solar
cooling plant. International journal of refrigeration, 1993. 16(3): p. 185-190.
241. Boubakri, A, M Arsalane, B Yous, L Ali-Moussa, M Pons, F Meunier, and Jj
Guilleminot, Experimental study of adsorptive solar-powered ice makers in Agadir
(Morocco)—1. Performance in actual site. Renewable Energy, 1992. 2(1): p. 7-13.
242. Hammad, M. A., Experimental study of the performance of a solar thermal-
photovoltaic integrated system. Renewable Energy, 1994. 4(8): p. 897-905.
243. Hammad, M. A. and M. S. Audi, Performance of a solar LiBr-water absorption
refrigeration system. Renewable Energy, 1992. 2(3): p. 275-282.
244. Sumathy, K, Zc Huang and Zf Li, Solar absorption cooling with low grade heat
source—a strategy of development in South China. Solar energy, 2002. 72(2): p. 155-
165.
245. Le Pierrès, Nolwenn, Nathalie Mazet and Driss Stitou, Experimental results of a solar
powered cooling system at low temperature. International Journal of Refrigeration,
2007. 30(6): p. 1050-1058.
246. Hidalgo, Mc Rodríguez, P Rodríguez Aumente, M Izquierdo Millán, A Lecuona
Neumann, and R Salgado Mangual, Energy and carbon emission savings in Spanish
housing air-conditioning using solar driven absorption system. Applied Thermal
Engineering, 2008. 28(14): p. 1734-1744.
247. Ali, Ahmed Hamza H, Peter Noeres and Clemens Pollerberg, Performance
assessment of an integrated free cooling and solar powered single-effect lithium
bromide-water absorption chiller. Solar Energy, 2008. 82(11): p. 1021-1030.
248. Rosiek, S and Fj Batlles, Integration of the solar thermal energy in the construction:
Analysis of the solar-assisted air-conditioning system installed in CIESOL building.
Renewable Energy, 2009. 34(6): p. 1423-1431.
249. Helm, M, C Keil, S Hiebler, H Mehling, and C Schweigler, Solar heating and cooling
system with absorption chiller and low temperature latent heat storage: energetic
performance and operational experience. International journal of refrigeration, 2009.
32(4): p. 596-606.
250. Li, Zf and K Sumathy, Performance study of a partitioned thermally stratified storage
tank in a solar powered absorption air conditioning system. Applied Thermal
Engineering, 2002. 22(11): p. 1207-1216.
251. Shin, Mi-Soo, Hey-Suk Kim, Dong-Soon Jang, Sang-Nam Lee, Young-Soo Lee, and
Hyung-Gi Yoon, Numerical and experimental study on the design of a stratified
thermal storage system. Applied thermal engineering, 2004. 24(1): p. 17-27.
252. Zhong, Li, Nie Jingjing, Zhang Xinyu, Li Guoli, Li Changling, Wei Lifeng, and
Zheng Ruicheng, Application of solar cooling system in a campus library in Hainan,
China. Energy Procedia, 2012. 30: p. 730-737.
253. Yin, Yl, Zp Song, Y Li, Rz Wang, and Xq Zhai, Experimental investigation of a mini-
type solar absorption cooling system under different cooling modes. Energy and
Buildings, 2012. 47: p. 131-138.
254. Balghouthi, M, Mh Chahbani and A Guizani, Investigation of a solar cooling
installation in Tunisia. Applied Energy, 2012. 98: p. 138-148.

235
255. Allouche, Yosr, Chiheb Bouden and Saffa Riffat, A solar-driven ejector refrigeration
system for Mediterranean climate: experience improvement and new results
performed. Energy Procedia, 2012. 18: p. 1115-1124.
256. Ajib, Salman and Wolfgang Günther, Solar thermally driven cooling systems: Some
investigation results and perspectives. Energy Conversion and Management, 2013.
65: p. 663-669.
257. Helm, Martin, Kilian Hagel, Werner Pfeffer, Stefan Hiebler, and Christian
Schweigler, Solar Heating and Cooling System with Absorption Chiller and Latent
Heat Storage–A Research Project Summary. Energy Procedia, 2014. 48: p. 837-849.
258. Yong, Cui, Wang Yiping and Zhu Li, Performance analysis on a building-integrated
solar heating and cooling panel. Renewable Energy, 2015. 74: p. 627-632.
259. Armanasco, Fabio, Luigi Pietro Maria Colombo, Andrea Lucchini, and Andrea
Rossetti, Performance analysis of a solar cooling plant based on a liquid desiccant
evaporative cooler. International Journal of Refrigeration, 2015. 53: p. 163-176.
260. Agyenim, Francis, Ian Knight and Michael Rhodes, Design and experimental testing
of the performance of an outdoor LiBr/H 2 O solar thermal absorption cooling system
with a cold store. Solar energy, 2010. 84(5): p. 735-744.
261. Huang, Bj, Cw Yen, Jh Wu, Jh Liu, Hy Hsu, Vo Petrenko, Jm Chang, and Cw Lu,
Optimal control and performance test of solar-assisted cooling system. Applied
Thermal Engineering, 2010. 30(14): p. 2243-2252.
262. Bermejo, Pablo, Francisco Javier Pino and Felipe Rosa, Solar absorption cooling
plant in Seville. Solar Energy, 2010. 84(8): p. 1503-1512.
263. Qu, Ming, Hongxi Yin and David H Archer, A solar thermal cooling and heating
system for a building: experimental and model based performance analysis and
design. Solar energy, 2010. 84(2): p. 166-182.
264. Venegas, M, Mc Rodríguez-Hidalgo, R Salgado, A Lecuona, P Rodríguez, and G
Gutiérrez, Experimental diagnosis of the influence of operational variables on the
performance of a solar absorption cooling system. Applied Energy, 2011. 88(4): p.
1447-1454.
265. Ayompe, Lm, Aidan Duffy, Sj Mccormack, and Michael Conlon, Validated TRNSYS
model for forced circulation solar water heating systems with flat plate and heat pipe
evacuated tube collectors. Applied Thermal Engineering, 2011. 31(8): p. 1536-1542.
266. Boudéhenn, François, Hélène Demasles, Joël Wyttenbach, Xavier Jobard, David
Chèze, and Philippe Papillon, Development of a 5 kW cooling capacity ammonia-
water absorption chiller for solar cooling applications. Energy Procedia, 2012. 30: p.
35-43.
267. Joseph Luzzi Experimental Research. 2005. 1.
268. Odle, Teresa and Richard Mayer, Experimental Research. 2011. p. 1-7.
269. Best, R and N Ortega, Solar refrigeration and cooling. Renewable Energy, 1999.
16(1): p. 685-690.
270. Druckman, Daniel, Doing research: Methods of inquiry for conflict analysis. 2005:
Sage.
271. Sheridan, Nr, Kj Bullock and Ja Duffie, Study of solar processes by analog computer.
Solar Energy, 1967. 11(2): p. 69-77.
272. Gupta, Cl, On generalizing the dynamic performance of solar energy systems. Solar
Energy, 1971. 13(3): p. 301-310.
273. Close, Dj, A design approach for solar processes. Solar Energy, 1967. 11(2): p. 112-
122.
274. Gupta, Cl and Hp Garg, System design in solar water heaters with natural circulation.
Solar Energy, 1968. 12(2): p. 163-182.

236
275. Buchberg, H and Jr Roulet, Simulation and optimization of solar collection and
storage for house heating. Solar Energy, 1968. 12(1): p. 31-50.
276. Oonk, Rl, Wa Beckman and Ja Duffie, Modeling of the CSU heating/cooling system.
Solar Energy, 1975. 17(1): p. 21-28.
277. Lof, Gog and Ra Tybout, Model for optimizing solar heating design. 1972.
278. Löf, George Og and Richard Alton Tybout, The design and cost of optimized systems
for residential heating and cooling by solar energy. Solar Energy, 1974. 16(1): p. 9-
18.
279. Lorsch, Harold G, Active solar heating and cooling systems: II. Performance and
cost. Energy and Buildings, 1981. 3(2): p. 137-167.
280. Enibe, So and Oc Iloeje, Design optimization of the flat plate collector for a solid
absorption solar refrigerator. Solar energy, 1997. 60(2): p. 77-87.
281. Ghaddar, Nk, M Shihab and F Bdeir, Modeling and simulation of solar absorption
system performance in Beirut. Renewable Energy, 1997. 10(4): p. 539-558.
282. Li, Zf and K Sumathy, Simulation of a solar absorption air conditioning system.
Energy Conversion and management, 2001. 42(3): p. 313-327.
283. Florides, Ga, Sa Kalogirou, Sa Tassou, and Lc Wrobel, Modelling and simulation of
an absorption solar cooling system for Cyprus. Solar Energy, 2002. 72(1): p. 43-51.
284. Florides, Ga, Sa Kalogirou, Sa Tassou, and Lc Wrobel, Modelling, simulation and
warming impact assessment of a domestic-size absorption solar cooling system.
Applied Thermal Engineering, 2002. 22(12): p. 1313-1325.
285. Atmaca, Ibrahim and Abdulvahap Yigit, Simulation of solar-powered absorption
cooling system. Renewable Energy, 2003. 28(8): p. 1277-1293.
286. Eicker, Ursula and Dirk Pietruschka, Design and performance of solar powered
absorption cooling systems in office buildings. Energy and Buildings, 2009. 41(1): p.
81-91.
287. Casals, Xavier Garcia, Solar absorption cooling in Spain: Perspectives and outcomes
from the simulation of recent installations. Renewable energy, 2006. 31(9): p. 1371-
1389.
288. Zambrano, Darine, Carlos Bordons, Winston Garcia-Gabin, and Eduardo F Camacho,
Model development and validation of a solar cooling plant. International Journal of
Refrigeration, 2008. 31(2): p. 315-327.
289. Calise, F, M Dentice D'accadia and R Vanoli, Dynamic simulation and parametric
optimisation of a solar-assisted heating and cooling system. International Journal of
Ambient Energy, 2010. 31(4): p. 173-194.
290. Calise, F, A Palombo and L Vanoli, Maximization of primary energy savings of solar
heating and cooling systems by transient simulations and computer design of
experiments. Applied Energy, 2010. 87(2): p. 524-540.
291. Sanjuan, C, S Soutullo and Mr Heras, Optimization of a solar cooling system with
interior energy storage. Solar Energy, 2010. 84(7): p. 1244-1254.
292. Fong, Kf, Chun Kwong Lee, Tin Tai Chow, Z Lin, and Ls Chan, Solar hybrid air-
conditioning system for high temperature cooling in subtropical city. Renewable
energy, 2010. 35(11): p. 2439-2451.
293. Calise, F, Thermoeconomic analysis and optimization of high efficiency solar heating
and cooling systems for different Italian school buildings and climates. Energy and
Buildings, 2010. 42(7): p. 992-1003.
294. Calise, F, M Dentice D’accadia and A Palombo, Transient analysis and energy
optimization of solar heating and cooling systems in various configurations. Solar
Energy, 2010. 84(3): p. 432-449.

237
295. Fong, Kf, Chun Kwong Lee, Z Lin, Tin Tai Chow, and Ls Chan, Application potential
of solar air-conditioning systems for displacement ventilation. Energy and Buildings,
2011. 43(9): p. 2068-2076.
296. Soutullo, S, C San Juan and Mr Heras, Comparative study of internal storage and
external storage absorption cooling systems. Renewable Energy, 2011. 36(5): p.
1645-1651.
297. Calise, Francesco, High temperature solar heating and cooling systems for different
Mediterranean climates: dynamic simulation and economic assessment. Applied
Thermal Engineering, 2012. 32: p. 108-124.
298. Hassan, Hz, Aa Mohamad and R Bennacer, Simulation of an adsorption solar cooling
system. Energy, 2011. 36(1): p. 530-537.
299. Calise, F, M Dentice D’accadia and L Vanoli, Thermoeconomic optimization of solar
heating and cooling systems. Energy Conversion and Management, 2011. 52(2): p.
1562-1573.
300. Molero-Villar, Natividad, Jm Cejudo-López, F Domínguez-Muñoz, and Antonio
Carrillo-Andrés, A comparison of solar absorption system configurations. Solar
energy, 2012. 86(1): p. 242-252.
301. Henning, Hans-Martin and Jochen Döll, Solar systems for heating and cooling of
buildings. Energy Procedia, 2012. 30: p. 633-653.
302. Montero, Andrés, Jesús López-Villada, Carlos Naranjo-Mendoza, and Jerko Labus.
Comparative Study of Solar Assisted Cooling Technologies for Two Different
Climates. in ASME 2014 8th International Conference on Energy Sustainability
collocated with the ASME 2014 12th International Conference on Fuel Cell Science,
Engineering and Technology. 2014. American Society of Mechanical Engineers.
303. Hallström, Olof, Gerrit Füldner, Hans-Joseph Spahn, Lena Schnabel, and Frank Salg,
Development of collector integrated sorption modules for solar heating and cooling:
Performance simulation. Energy Procedia, 2014. 48: p. 67-76.
304. Eicker, Ursula, Antonio Colmenar-Santos, Lya Teran, Mariela Cotrado, and David
Borge-Diez, Economic evaluation of solar thermal and photovoltaic cooling systems
through simulation in different climatic conditions: An analysis in three different
cities in Europe. Energy and Buildings, 2014. 70: p. 207-223.
305. López-Villada, Jesús, Dereje S Ayou, Joan Carles Bruno, and Alberto Coronas,
Modelling, simulation and analysis of solar absorption power-cooling systems.
International Journal of Refrigeration, 2014. 39: p. 125-136.
306. Chargui, R and H Sammouda, Modeling of a residential house coupled with a dual
source heat pump using TRNSYS software. Energy Conversion and Management,
2014. 81: p. 384-399.
307. Eicker, Ursula, Dirk Pietruschka, Andreas Schmitt, and Maximilian Haag,
Comparison of photovoltaic and solar thermal cooling systems for office buildings in
different climates. Solar Energy, 2015. 118: p. 243-255.
308. Fong, Kf and Ck Lee, Investigation of separate or integrated provision of solar
cooling and heating for use in typical low-rise residential building in subtropical
Hong Kong. Renewable Energy, 2015. 75: p. 847-855.
309. Lamnatou, Chr, Jayanta Deb Mondol, D Chemisana, and C Maurer, Modelling and
simulation of Building-Integrated solar thermal systems: Behaviour of the coupled
building/system configuration. Renewable and Sustainable Energy Reviews, 2015. 48:
p. 178-191.
310. Blackman, Corey, Chris Bales and Eva Thorin, Techno-economic Evaluation of
Solar-assisted Heating and Cooling Systems with Sorption Module Integrated Solar
Collectors. Energy Procedia, 2015. 70: p. 409-417.
238
311. D. Thevenard. A simple tool for the simulation of active solar systems: WATSUN
reborn. in Third Solar Building Conference. 2008. Fredericton N.B.
312. Klein, Sanford Alan, Wa Beckman and Ja Duffie, A design procedure for solar
heating systems. Solar Energy, 1976. 18(2): p. 113-127.
313. Beckman, Wa, Ja Duffie and Sa Klein, Simulation of solar heating systems, in
Applications of Solar Energy for Heating and Cooling of Buildings, Chap. IV. 1977,
ASHRAE New York.
314. Energy Plus, Getting Stared with EnergyPlus, in Energy Plus Documentation. 2015,
NREL: United States. p. 1-78.
315. Crawley, Drury B., Linda K. Lawrie, Frederick C. Winkelmann, W. F. Buhl, Y. Joe
Huang, Curtis O. Pedersen, Richard K. Strand, Richard J. Liesen, Daniel E. Fisher,
Michael J. Witte, and Jason Glazer, EnergyPlus: creating a new-generation building
energy simulation program. Energy and Buildings, 2001. 33(4): p. 319-331.
316. Arasteh, Dariush, Modeling windows in energy plus with simple performance indices.
Lawrence Berkeley National Laboratory, 2010.
317. Rhodes, Joshua D, William H Gorman, Charles R Upshaw, and Michael E Webber,
Using BEopt (EnergyPlus) with energy audits and surveys to predict actual
residential energy usage. Energy and Buildings, 2015. 86: p. 808-816.
318. Zhao, Jie, Khee Poh Lam, B Erik Ydstie, and Vivian Loftness, Occupant-oriented
mixed-mode EnergyPlus predictive control simulation. Energy and Buildings, 2015.
319. Logue, Jennifer M, William Jn Turner, Iain S Walker, and Brett C Singer, A
simplified model for estimating population-scale energy impacts of building envelope
air tightening and mechanical ventilation retrofits. Journal of Building Performance
Simulation, 2015(ahead-of-print): p. 1-16.
320. Ng, Lisa C., Andrew K. Persily and Steven J. Emmerich, Improving infiltration
modeling in commercial building energy models. Energy and Buildings, 2015. 88: p.
316-323.
321. Blight, Thomas S and David A Coley, Sensitivity analysis of the effect of occupant
behaviour on the energy consumption of passive house dwellings. Energy and
Buildings, 2013. 66: p. 183-192.
322. Attia, Shady, Elisabeth Gratia, André De Herde, and Jan L. M. Hensen, Simulation-
based decision support tool for early stages of zero-energy building design. Energy
and Buildings, 2012. 49: p. 2-15.
323. Ham, Sang-Woo, Min-Hwi Kim, Byung-Nam Choi, and Jae-Weon Jeong, Energy
saving potential of various air-side economizers in a modular data center. Applied
Energy, 2015. 138: p. 258-275.
324. Ascione, Fabrizio, Nicola Bianco, Rosa Francesca De Masi, Filippo De’rossi, and
Giuseppe Peter Vanoli, Energy refurbishment of existing buildings through the use of
phase change materials: energy savings and indoor comfort in the cooling season.
Applied Energy, 2014. 113: p. 990-1007.
325. Ies, Ve, Virtual Environment (VE) by Integrated Environment Solutions (IES), 2009.
326. Aldossary, Naief A., Yacine Rezgui and Alan Kwan, Consensus-based low carbon
domestic design framework for sustainable homes. Renewable and Sustainable
Energy Reviews, 2015. 51: p. 417-432.
327. Aldossary, Naief A., Yacine Rezgui and Alan Kwan, Domestic energy consumption
patterns in a hot and humid climate: A multiple-case study analysis. Applied Energy,
2014. 114: p. 353-365.
328. Shameri, Ma, Ma Alghoul, Omkalthum Elayeb, M Fauzi M Zain, Ms Alrubaih,
Halizawati Amir, and K Sopian, Daylighting characterstics of existing double-skin
façade office buildings. Energy and Buildings, 2013. 59: p. 279-286.

239
329. Al-Tamimi, Nedhal A and Sharifah Fairuz Syed Fadzil, The potential of shading
devices for temperature reduction in high-rise residential buildings in the tropics.
Procedia Engineering, 2011. 21: p. 273-282.
330. Kamarudin, Mohd Salleh, Ahmad Kamil Kamarudin, Sabarinah Sh Ahmad, and Elias
Salleh, Efficiency of monitor roof in maintaining the thermal conditions of indoor air
and water in a medium scale enclosed tropical prawn hatchery building. Asian
Fisheries Science, 2015. 28(2): p. 71-82.
331. Ozdenefe, Murat and Jonathan Dewsbury, Simulation and real weather data: A
comparison for Cyprus case. Building Services Engineering Research and
Technology, 2015: p. 0143624415603581.
332. Ghasemi, Mohsen, Maliheh Noroozi, Marzieh Kazemzadeh, and Mohsen Roshan, The
influence of well geometry on the daylight performance of atrium adjoining spaces: A
parametric study. Journal of Building Engineering, 2015. 3: p. 39-47.
333. Adam, Alexandros, Eric S Fraga and Dan Jl Brett, Options for residential building
services design using fuel cell based micro-CHP and the potential for heat
integration. Applied Energy, 2015. 138: p. 685-694.
334. Kirimtat, Ayca, Basak Kundakci Koyunbaba, Ioannis Chatzikonstantinou, and Sevil
Sariyildiz, Review of simulation modeling for shading devices in buildings.
Renewable and Sustainable Energy Reviews, 2016. 53: p. 23-49.
335. Gill, Zachary M, Michael J Tierney, Ian M Pegg, and Neil Allan, Measured energy
and water performance of an aspiring low energy/carbon affordable housing site in
the UK. Energy and Buildings, 2011. 43(1): p. 117-125.
336. Kalogirou, Soteris A., Optimization of solar systems using artificial neural-networks
and genetic algorithms. Applied Energy, 2004. 77(4): p. 383-405.
337. Almeida, P, Mj Carvalho, Ricardo Amorim, J Farinha Mendes, and V Lopes,
Dynamic testing of systems–Use of TRNSYS as an approach for parameter
identification. Solar Energy, 2014. 104: p. 60-70.
338. Klein, Sh and Wa Beckman, TRNSYS, a Simulation program. ASHRAE Trans, 1971.
76.
339. Kalogirou, Soteris A. and Christos Papamarcou, Modelling of a thermosyphon solar
water heating system and simple model validation. Renewable Energy, 2000. 21(3–4):
p. 471-493.
340. Kalogirou, Soteris, Thermal performance, economic and environmental life cycle
analysis of thermosiphon solar water heaters. Solar Energy, 2009. 83(1): p. 39-48.
341. Oishi, Masahiro and Tetsuo Noguchi. The evaluation procedure on performance of
SDHW system by TRNSYS simulation for a yearly performance prediction. in
Proceedings of Eurosun. 2000.
342. Jordan, Ulrike and Klaus Vajen, Influence Of The DHW Load Profile On The
Fractional Energy Savings:: A Case Study Of A Solar Combi-System With TRNSYS
Simulations. Solar Energy, 2001. 69: p. 197-208.
343. Kalogirou, Soteris, The potential of solar industrial process heat applications.
Applied Energy, 2003. 76(4): p. 337-361.
344. S.A. Klein, W.A. Beckman , J.A. Duffie, TRNSYS version 17 program manual, S.E.
Laboratory, Editor. 2010: University of Wisconsin, Madison.
345. Mitchell, Jw, Wa Beckman and Mj Pawelski, Comparisons of measured and
simulated performance for CSU house I. Journal of Solar Energy Engineering, 1980.
102(3): p. 192-195.
346. Beckman, William A, Lars Broman, Alex Fiksel, Sanford A Klein, Eva Lindberg,
Mattias Schuler, and Jeff Thornton, Trnsys the most complete solar energy system
modeling and simulation software. Renewable energy, 1994. 5(1): p. 486-488.

240
347. Monfet, Danielle and Radu Zmeureanu. Simulation of a large central cooling and
heating plant using TRNSYS and calibration with monitored data. in Proceeding.
2009.
348. Hang, Yin, Ming Qu and Satish Ukkusuri, Optimizing the design of a solar cooling
system using central composite design techniques. Energy and Buildings, 2011. 43(4):
p. 988-994.
349. Almeidaa, Patrícia, Ricardo Amorim, Maria João Carvalho, João Farinha Mendes,
and Vitor Lopes, Dynamic testing of systems–use of TRNSYS as an Approach for
Parameter Identification. Energy Procedia, 2012. 30: p. 1294-1303.
350. Banister, Carsen J, William R Wagar and Michael R Collins, Validation of a single
tank, multi-mode solar-assisted heat pump TRNSYS model. Energy Procedia, 2014.
48: p. 499-504.
351. He, Tao, Xinyu Zhang, Conghui Wang, Min Wang, Bojia Li, Ning Xue, Kazuo
Shimizu, Kenji Takahashi, and Youyi Wu, Application of Solar Thermal Cooling
System Driven by Low Temperature Heat Source in China. Energy Procedia, 2015.
70: p. 454-461.
352. Bava, Federico, Simon Furbo and Bengt Perers, Simulation of a Solar Collector Array
Consisting of two Types of Solar Collectors, with and Without Convection Barrier.
Energy Procedia, 2015. 70: p. 4-12.
353. Eicker, Ursula, Dirk Pietruschka and Ruben Pesch, Heat rejection and primary energy
efficiency of solar driven absorption cooling systems. International Journal of
Refrigeration, 2012. 35(3): p. 729-738.
354. Palacín, F., C. Monné and S. Alonso, Improvement of an existing solar powered
absorption cooling system by means of dynamic simulation and experimental
diagnosis. Energy, 2011. 36(7): p. 4109-4118.
355. D’antoni, Matteo, Gabriele Ferruzzi, Davide Bettoni, and Roberto Fedrizzi,
Validation of the numerical model of a turnkey Solar Combi+ system. Energy
Procedia, 2012. 30: p. 551-561.
356. De Keizer, Corry, Stefan Kuethe, Ulrike Jordan, and Klaus Vajen, Simulation-based
long-term fault detection for solar thermal systems. Solar Energy, 2013. 93: p. 109-
120.
357. Duffie, John A and William A Beckman, Solar Engineering of Thermal Processes,
Fourth Edition. 2013, USA: John Wiley & Sons. 928.
358. Forejt, L, Jlm Hensen, Frantisek Drkal, and P Barankova. Weather data around the
world for design of field hospital HVAC. in Proc. 17th Int. Air Conditioning and
Ventilation Conference, Prague, CZ. 2006.
359. Hall, Irving J, Rr Prairie, He Anderson, and Ec Boes, Generation of a typical
meteorological year. 1978, Sandia Labs., Albuquerque, NM (USA).
360. Diego Ibarra, Understanding Weather Files and Visualizing Data Using
Computerized Tools, in Digital Workshops Series. 2009, Havard university.
361. Hong, Tianzhen, Wen-Kuei Chang and Hung-Wen Lin, A fresh look at weather
impact on peak electricity demand and energy use of buildings using 30-year actual
weather data. Applied Energy, 2013. 111: p. 333-350.
362. Schmitt, David D, Sanford A Klein and Douglas T Reindl, Automated generation of
hourly design sequences. 2000, Univ. of Wisconsin, Madison, WI (US).
363. Us Department of Energy. Weather Data Sources. Energy Efficiency & Renewable
Energy 2015 12-October-2015]; Available from:
http://apps1.eere.energy.gov/buildings/energyplus/weatherdata_sources.cfm.

241
364. Thevenard, Didier J and Alfred P Brunger, The development of typical weather years
for international locations: Part I, algorithms. ASHRAE Transactions, 2002. 108: p.
376.
365. Liggett, R and M Milne, Climate Consultant, version 5.5. UCLA Design Tool Group,
USA, 2014.
366. Remund, Jan and Stefan Kunz, METEONORM: Global meteorological database for
solar energy and applied climatology. 2003: Meteotest.
367. Ahmed, Tauseef and S Mubashir Ali, Characteristics of Households and
Respondents. Pakistan Demographic and Health Survey, 1992. 1: p. 990-991.
368. Nazli, Hina, Syed Hamza Haider, Stephanie Hausladen, Asjad Tariq, Hassan Shafiq,
Saqib Shahzad, Amina Mehmood, Asma Shahzad, and Edward Whitney, Pakistan
Rural Household Panel Survey 2012 (Round 1): Household characteristics. 2012,
International Food Policy Research Institute (IFPRI).
369. Zafar, Nabeel. 5 Marla Single Storey House Safari Villas Bahria Town Lahore 2012
[cited 2014 15 October]; Available from: http://www.kirayadaar.com/.
370. Khan, Kamran Muzaffar, Sustainability of Different Pakistani Building Systems.
International Poster Journal of Science and Technology. 1(2-3): p. 52-55.
371. Colbeck, Ian, Zaheer Ahmad Nasir and Zulfiqar Ali, Characteristics of
indoor/outdoor particulate pollution in urban and rural residential environment of
Pakistan. Indoor air, 2010. 20(1): p. 40-51.
372. Lee, W. L., Benchmarking energy use of building environmental assessment schemes.
Energy and Buildings, 2012. 45: p. 326-334.
373. Tenwolde, Anton, J Dobbin Mcnatt and Lorraine Krahn, Thermal properties of wood
and wood panel products for use in buildings. 1988, Oak Ridge National Lab., TN
(USA); Forest Service, Madison, WI (USA). Forest Products Lab.
374. Mathur, V. K., Composite materials from local resources. Construction and Building
Materials, 2006. 20(7): p. 470-477.
375. Sakraida, Va, Basics for absorption chillers. Engineered Systems, 2009. 26(3): p. 36-
48.
376. Brunold, Stefan, R Frey and Ulrich Frei. Comparison of three different collectors for
process heat applications. in Optical Materials Technology for Energy Efficiency and
Solar Energy Conversion XIII. 1994. International Society for Optics and Photonics.
377. Zambolin, E. and D. Del Col, Experimental analysis of thermal performance of flat
plate and evacuated tube solar collectors in stationary standard and daily conditions.
Solar Energy, 2010. 84(8): p. 1382-1396.
378. Institute for Solar Technology. SPF Online Collector Catalogue. Test Reports 2014
[cited 2014 January 10]; Available from: www.spf.ch.
379. Hang, Yin and Ming Qu, The impact of hot and cold storages on a solar absorption
cooling system for an office building. 2010.
380. Raab, S., D. Mangold and H. Müller-Steinhagen, Validation of a computer model for
solar assisted district heating systems with seasonal hot water heat store. Solar
Energy, 2005. 79(5): p. 531-543.
381. Heatec, TEC-NOTE, in Publication No.8-03-108. 2003: USA. p. 1-4.
382. Pokhrel, Manoj Kumar, Gaurav Pravinkumar Raval and Sujata Dahal, Experimental
Analysis on Performance of Solar Cooling System in UAE Conditions.
383. Kennish, William J, An approach to the validation of computer simulation codes.
1978: Department of Energy.
384. Anand, Dk, Wj Kennish, Tm Knasel, and Ac Stolarz, Validation methodology for
solar heating and cooling systems. Energy, 1979. 4(4): p. 549-560.
242
385. Thacker, Ben H, Scott W Doebling, Francois M Hemez, Mark C Anderson, Jason E
Pepin, and Edward A Rodriguez, Concepts of model verification and validation. 2004,
Los Alamos National Lab., Los Alamos, NM (US).
386. Bales, Chris, Parameter identification manual for TRNSYS models at SERC. 2001:
SERC, Högskolan i Dalarna.
387. Kaplan, Michael, Phoebe Caner and Gw Vincent, Guidelines for energy simulation of
commercial buildings. 1992: Bonneville Power Administration.
388. Balaras, Constantinos A., Gershon Grossman, Hans-Martin Henning, Carlos A.
Infante Ferreira, Erich Podesser, Lei Wang, and Edo Wiemken, Solar air conditioning
in Europe—an overview. Renewable and Sustainable Energy Reviews, 2007. 11(2): p.
299-314.
389. Shirazi, Ali, Robert A Taylor, Stephen D White, and Graham L Morrison, Transient
simulation and parametric study of solar-assisted heating and cooling absorption
systems: An energetic, economic and environmental (3E) assessment. Renewable
Energy, 2016. 86: p. 955-971.
390. Fong, Kf and Ck Lee, Performance advancement of solar air-conditioning through
integrated system design for building. Energy, 2014. 73: p. 987-996.
391. Thomas, Sébastien and Philippe André. Dynamic simulation of a complete solar
assisted conditioning system in an office building using TRNSYS. in Proceedings of
11th International IBPSA Conference, Glasgow, Scotland. 2009. Citeseer.
392. Yazaki. Yazaki WFC-SC5 Specification. 2014 [cited 2014 15 November];
2007:[Available from: http://www.yazaki-airconditioning.com.
393. Saltelli, Andrea, Stefano Tarantola and Kp-S Chan, A quantitative model-independent
method for global sensitivity analysis of model output. Technometrics, 1999. 41(1): p.
39-56.
394. Lunde, Pj, Solar thermal engineering: Space heating and hot water systems. New
York, John Wiley and Sons, Inc., 1980. , 1980. 1: p. 353-385.
395. Hang, Yin, Ming Qu and Fu Zhao, Economical and environmental assessment of an
optimized solar cooling system for a medium-sized benchmark office building in Los
Angeles, California. Renewable Energy, 2011. 36(2): p. 648-658.
396. Praene, Jean Philippe, Olivier Marc, Habiba Ennamiri, and Hery Tiana
Rakotondramiarana, Sensitivity analysis to optimize a solar absorption cooling
system. Energy Procedia, 2014. 57: p. 2636-2645.
397. Arsalis, Alexandros and Andreas N Alexandrou, Parametric study and cost analysis
of a solar-heating-and-cooling system for detached single-family households in hot
climates. Solar Energy, 2015. 117: p. 59-73.

243
Appendices
Appendix A: Annual and Monthly Maximum Average Temperature
and Relative Humidity for District Cities of Pakistan

244
Sr.No City Latitude Longitude Elevation Jan Feb Mar Apr May Jun July Aug Sep Oct Nov Dec Annual1 Mirpur khas 25.32 69 20 24.8 27.3 32.8 36.3 38.2 36.8 34.1 33.3 34.3 34.8 31 26.8 32.602 Nawabshah /Sanghar/Shahdadkot/Nosheroferoz 26.15 68.25 33 23.3 26.1 31.8 36.2 39.2 38.7 35.5 34.4 35.3 34.6 30.1 25.3 32.603 Sukkur / Larkana/ Shikarpur/khairpur 27.42 68.52 51 22.1 25 30.9 35.8 39.6 40 36.7 35.1 36 34.3 29.4 24.2 32.404 Umar kot 26.15 69.4 51 23.4 26.1 31.9 36.1 38.7 37.9 35 33.8 34.7 34.5 30.1 25.4 32.305 Hyderabad / Jamshoro 25.23 68.25 26 24.6 27.1 32.4 26 37.8 36.6 34 33.2 34.1 34.7 30.9 26.6 32.206 Tharparker 25 70.15 125 24.7 27.2 32.7 36 38 36.2 33.5 32.6 33.9 34.3 30.7 26.6 32.207 Badin 24.39 68.5 6 25.8 27.9 32.6 35.4 36.4 35.1 32.9 32.2 33.1 34.5 31.5 27.7 32.108 Dadu 26.44 67.47 244 22.1 24.9 30.7 35.4 38.9 38.4 35.1 34.3 35 33.8 29.2 24.2 31.909 Ghotki 28.05 69.21 150 20.6 23.5 29.5 34.4 38.2 38.6 35.5 33.7 34.7 33.2 28.2 22.9 31.10
10 Rahim yar khan 28.26 70.19 84 20.8 23.6 29.8 34.5 38 38.1 35.1 33.5 34.3 33.3 28.4 23 31.1011 Karachi city / Thatta 24.54 67.08 12 25.3 27.3 31.5 33.9 34.7 33.6 31.7 31 31.5 33.6 31 27.2 31.0012 Bahawalpur 29.2 71.47 108 19.9 22.8 29.1 34.1 38 38.7 35.5 33.7 34.2 32.8 27.7 22.2 30.8013 Multan / Muzaffargarh 30.12 71.26 124 18.6 21.6 28 33.3 37.7 39.5 36.2 34 34.1 31.9 26.7 21.1 30.3014 Jafarabad /Nasirabad /Jhal Magsi 28.16 67.86 390 18.7 21.5 27.3 32.7 37.3 38.7 35.8 34 34.6 31.3 26.4 21.1 30.0015 Okara /Sahiwal /Vehari /Pakpatan 30.49 73.27 162 19 22 28.1 33.6 37.6 38.5 35 33.2 33 31.5 26.9 21.5 30.0016 Kech (Turbat) 26 63 782 19.3 21.6 26.5 32.2 36.2 38 34.3 33.5 33.5 31.2 26.6 21.7 29.6017 Jhang /Rajanpur /Toba Tek Singh 31.16 72.19 164 17.9 20.8 26.8 32.8 37.4 39.5 36.1 33.8 33.1 30.8 25.8 20.4 29.6018 Awaran 26.1 65.3 692 19.9 22.2 27.2 32.3 36 36.7 33 32.3 33 31.1 26.7 22.1 29.4019 Bhakkar / Layyah 31.4 71.05 165 17.3 20.2 26.5 32.2 37.1 39.6 36.4 33.9 33.4 30.7 25.4 20 29.4020 Panjgur 26.58 64.06 925 19.5 21.8 26.6 32.1 35.9 37.3 33.3 32.6 33.1 31 26.6 21.8 29.3021 Faisalabad 31.26 73.08 186 18 20.9 26.7 32.7 37 38.6 35.1 33.1 32.4 30.4 25.8 20.4 29.3022 Lasbella 25.45 66.35 88 22.5 24.1 27.9 31.1 33.3 32.7 30.6 29.9 30.4 30.9 28.1 24.5 28.8023 Gawadar 25.07 62.19 76 22 23 26.4 30.4 33.3 34.2 31.4 30.1 30.4 30.5 27.6 23.9 28.6024 Chaghi 28.52 63.33 623 15.1 17.9 23.5 30.2 35.2 39 38.2 37.1 34.5 29 23.6 17.9 28.5025 Dera bugti / Barkhan 29.02 69.09 906 17.5 20.3 26.3 31.4 35.8 36.8 33.8 31.9 32.7 30.4 25.4 20.1 28.5026 Khuzdar 27.1 66.2 1299 17.3 20 25.5 30.9 35.5 37.2 34.1 33 33.1 29.4 24.6 19.6 28.4027 Kharan 28 64.3 832 15.2 18 23.4 30 35 38.8 37.2 36.4 34.3 28.9 23.6 18.1 28.3028 Lahore 31.33 74.2 206 17.7 20.4 26.1 32 36 37 33.4 31.6 30.9 29.2 25 20.1 28.3029 Sargodha 32.05 72.4 373 16.4 19.1 24.8 31 35.8 38.4 35.3 33 31.9 29.2 24.3 19 28.2030 DG Khan 30.03 70.38 492 16.5 19.4 25.6 30.8 35.4 37.2 34.2 32.1 32.4 29.8 24.6 19.1 28.1031 Jacobabad 28.2 68.29 888 14.5 16.9 21.5 27.7 32.2 35.6 36.9 37.7 35.8 30.3 22 16.4 27.4032 Jhelum 32.56 73.44 248 16.2 18.7 24.2 30.3 34.8 36.7 33.5 31.6 30.7 28.5 23.9 18.8 27.4033 Karachi Keemari 24.54 66.56 1 22.9 23.5 25.7 27.9 29.5 29.6 28.9 28 27.8 28.6 27.4 24.9 27.1034 Sibi / Bolan / 29.33 67.53 805 15 17.7 23.5 29.2 34.2 36.1 33.6 31.9 32 28 23.1 17.8 26.9035 Bannu 32.59 70.36 517 12.7 15.4 21.3 27.3 32.5 35.7 33.8 31.8 30.7 26.7 21.4 15.7 25.5036 Chakwal/ Attock 33.54 72.15 420 23.8 16 21.3 27.8 32.7 35.5 32.5 30.4 29.2 26.6 21.9 16.7 25.4037 Hangu / Karak / Kohat 33.32 71.04 655 12.8 14.9 20.4 26.9 32.3 35.7 33.3 31.2 30 26.5 21.4 15.7 25.1038 Mastung / Kalat/Nushki 29.5 66.56 1789 12.3 15.1 20.7 26.9 32.2 35.1 33.1 31.7 30.9 26 20.7 15.3 25.0039 Sialkot / Narowal / Gujrat/Mandi Bahuddin 32.3 74.13 280 14.4 16.6 21.8 27.8 32 33.3 30.3 28.7 27.9 25.8 21.7 17.1 24.8040 Gujranwala/Hafizabad/Shekhupura 32.09 74.11 280 14.4 16.6 21.8 27.8 32 33.3 30.3 28.7 27.9 25.8 21.7 17.1 24.8041 Chaman / Qilla Abdullah 30.58 66.25 1522 10.5 13.2 18.9 25.4 31 34.4 33.3 32 30.3 24.7 19.3 13.7 23.9042 Qilla Saifullah / Loralai 30.43 68.21 1608 11.9 14.5 20.1 25.7 30.8 33 31.3 29.8 29.3 25 20 14.8 23.9043 Quetta / Pishin 30.2 67 2073 10.2 12.6 18.3 24.4 29.8 32.5 31.2 29.8 28.7 23.7 18.6 13.2 22.8044 Islamabad / Rawalpindi 33.4 73.1 770 11.8 13.7 18.8 24.9 29.6 31.8 29.1 27.6 26.6 24 19.7 14.8 22.7045 Zhob 31.1 68.5 2065 8.65 11 16.6 22.4 27.7 30.7 30.3 29 27.2 22 16.9 11.6 21.20
46 Peshawar/charsadda/noshera 34.01 71.33 913 6.57 8.08 13.3 19.8 25.5 29.9 29.8 28.4 25.9 20.7 15.4 9.65 19.50
47 Mardan / Swabi 34.2 72 1016 7.02 8.44 13.5 20.1 25.4 29 27.8 26 24 20.1 15.4 10 18.90
48 Muzaffarabad / Balakot 34.22 73.29 2275 3.7 4.91 9.28 15.5 20.9 24.3 23.7 22.3 20.4 16.3 11.6 6.78 15.00
22 Year Monthly & Annual Average Maximum Temperature Degree Centigrade (at 10 m from surface) for District cities of Pakistan

245
Sr.No City Latitude Longitude Elevation Jan Feb Mar Apr May Jun July Aug Sep Oct Nov Dec Annual1 Karachi Keemari 24.54 66.56 1 46.6 53.1 60.7 64.2 69.7 76 79.2 79.1 74.3 62.5 52.1 45 63.602 Muzaffarabad / Balakot 34.22 73.29 2275 65.6 67.4 62.3 50.7 43.2 43.1 61 69.1 58.8 45.8 45.7 55.9 55.703 Karachi city / Thatta 24.54 67.08 12 37.6 41.5 46.4 50.9 58.5 66.5 72.6 72.3 65.8 49.9 39.6 34 53.004 Gawadar 25.07 62.19 76 49.5 49.3 49.3 45.4 47.1 53.9 69.1 70.7 60.4 45.9 44.3 47.3 52.705 Lasbella 25.45 66.35 88 40.6 42.7 45.3 47 52.7 65 74.3 73.6 64.2 47.3 40.9 37.5 52.606 Mardan / Swabi 34.2 72 1016 60 62 56.6 44.5 36.5 35.9 54.2 63 54.4 41.8 41.4 52.3 50.207 Islamabad / Rawalpindi 33.4 73.1 770 54.4 54.3 47.7 37.5 33.8 38.9 62.6 69.8 58.5 39.5 36.9 45.6 48.308 Sialkot / Narowal / Gujrat 32.3 74.13 280 53.1 51.5 43.8 33.3 31.7 40.1 64.7 72.1 61.4 41.4 37.2 44.3 47.909 Gujranwala/Hafizabad/Shekhupura 32.09 74.11 280 53.1 51.5 43.8 33.3 31.7 40.1 64.7 72.1 61.4 41.4 37.2 44.3 47.90
10 Lahore 31.33 74.2 206 53.9 49.2 40 30.2 30 39.4 63.5 71 61.8 42.3 38.2 45.9 47.1011 Badin 24.39 68.5 6 34 34.6 36.6 42 51.3 60.9 68.6 68.3 59.3 41.6 32.2 30.7 46.8012 Attock / Chakwal 33.54 72.15 420 52.9 52 45.4 35.3 30.9 34.2 57.1 65.9 56.5 37.8 35.6 45.1 45.7013 Okara /Sahiwal /Vehari /Pakpatan 30.49 73.27 162 51.8 44.4 35.1 28.7 29.9 40.4 61.3 68.6 58.4 38.7 36.1 44.9 44.9014 Jhelum 32.56 73.44 248 52.4 49.2 41.4 31.7 29.2 35.4 58.4 66.6 56.8 37.8 35.7 44.1 44.9015 Faisalabad 31.26 73.08 186 53.1 47.3 38.5 29.7 28.6 36.3 58.9 67.2 57.7 38.8 36.7 45.7 44.9016 Peshawar/charsadda/noshera 34.01 71.33 913 58.8 60.6 55.6 44.3 34.1 29.4 40 44.6 38.3 35.6 39 51.5 44.2017 Sargodha 32.05 72.4 373 52 48.2 40.7 32.1 28.9 33.4 54.9 63.9 55.2 36.9 35.3 44.2 43.8018 Hyderabad / Jamshoro 25.23 68.25 26 34.4 32.8 32 36.2 44.7 55.7 65.2 65.4 55.7 37 30.5 30.3 43.4019 Jhang /Rajanpur /Toba Tek Singh 31.16 72.19 164 51.1 45.3 37 29.8 28.2 34.7 56.5 65.7 55.8 36.9 35.1 43.7 43.3020 Hangu / Karak / Kohat 33.32 71.04 655 51.8 51.5 44.7 35.4 29.5 30 50.1 58.2 46.8 33.3 33.2 43.9 42.3021 Mirpur khas 25.32 69 20 33 30.1 28.1 33 42.2 54.3 64.5 65.3 54.2 34.6 27.7 29.4 41.4022 Tharparker 25 70.15 125 32.7 28.8 25.6 30.7 40.3 54.6 65.6 66.8 54.3 33.8 26.6 29.5 40.9023 Bhakkar / Layyah 31.4 71.05 165 47.1 41.9 33.8 28.9 26.8 31.9 53.1 63.2 51.2 31.8 30.7 39.2 40.0024 Bahawalpur 29.2 71.47 108 42.4 35.8 27.7 26.4 28.7 40.6 58.9 65.5 51.9 30.1 29.2 36.3 39.5025 Multan / Muzaffargarh 30.12 71.26 124 44.8 38.5 30.3 27.2 27.1 35.3 55.6 64.1 50.9 30.5 29.7 37.6 39.3026 Umar kot 26.15 69.4 51 34.2 29.6 25.4 28.9 36.4 49.3 61.7 64 51.4 30.8 26.7 29.8 39.1027 Bannu 32.59 70.36 517 49.4 46.1 39.2 33.1 28.3 29 47.1 54.9 41.1 29 30.5 40.9 39.1028 Awaran 26.1 65.3 692 39 35.4 32.2 28.6 29.9 42 62.1 61.7 46.1 28.9 29.2 33.6 39.1029 Panjgur 26.58 64.06 925 42.1 37.9 34.2 28.3 28.7 38.2 59.9 59.4 44.2 28.1 30 36.2 39.0030 Nawabshah /Sanghar/Shahdadkot/Nosheroferoz 26.15 68.25 33 34.4 30 26 28.3 34.3 47 60.1 61.7 49.3 29.9 26.7 29.4 38.2031 Rahim yar khan 28.26 70.19 84 38 31.8 25 25.9 29.6 43.1 59.5 65.5 50.6 28.3 27 32.7 38.1032 Kech (Turbat) 26 63 782 44.6 39.6 35.1 27.4 37.1 33.6 55.3 55.1 41.1 27.2 30.5 38.6 38.0033 DG Khan 30.03 70.38 492 42.8 37 29.7 27.5 26.4 34.6 55.4 64.1 46.6 27.1 27 35.4 37.8034 Dadu 26.44 67.47 244 34.4 30.5 27 27.3 31.6 45.3 59.7 60.1 47.4 29.1 26.6 29.5 37.4035 Dera bugti / Barkhan 29.02 69.09 906 39 33.4 26.5 25.6 25.3 36.7 56.7 64.3 44.8 25.2 25.1 32.6 36.3036 Zhob 31.1 68.5 2065 51.8 46 39.9 31.8 25.2 28.1 41.1 44.8 29.2 23.5 29.1 42.8 36.1037 Ghotki 28.05 69.21 150 36.4 30.3 24 24.6 26.6 39.2 56.7 63.3 46.6 25.9 25.3 30.9 35.9038 Quetta / Pishin 30.2 67 2073 52.4 45.3 36.6 27.6 21.2 27.3 45.4 50.3 30.6 22 27.7 42.3 35.7039 Qilla Saifullah / Loralai 30.43 68.21 1608 46.5 40.2 32.8 27.6 23.3 30.6 49.4 54.7 34.7 22.9 26.2 38 35.6040 Sukkur / Larkana/ Shikarpur/khairpur 27.42 68.52 51 34.8 28.6 23.1 23.4 26 38.2 54.6 58.9 43.6 25.2 24.5 29.4 34.3041 Chaman / Qilla Abdullah 30.58 66.25 1522 56 47.4 37.7 26.1 18.4 21 38.2 41.8 24.4 20.2 28 44.4 33.6042 Mastung / Kalat/Nushki 29.5 66.56 1789 51.5 42.4 33.2 24.3 18.1 23.2 43.8 47.8 28.4 20.5 26.9 41 33.4043 Sibi / Bolan / 29.33 67.53 805 43.1 36.1 28 23.2 19.7 28.5 49.1 55.5 34 20.9 23.9 35.2 33.1044 Khuzdar 27.1 66.2 1299 40 33.2 27.2 22.6 20.8 30.1 51.3 53.1 35.6 22.4 25 33.4 32.90
45 Jafarabad /Nasirabad /Jhal Magsi 28.16 67.86 390 37.6 30.7 23.8 21.1 19.6 29.2 48.9 54.6 35.4 20.6 22.4 31.2 31.30
46 Jacobabad 28.2 68.29 888 50.3 39.1 33.3 25.2 18.8 17.7 19 19.7 20.3 28.9 43.7 51.8 30.60
47 Kharan 28 64.3 832 49.5 40.1 32.3 21.1 15.6 15.7 33.2 32.6 20.3 18.9 26 39.7 28.70
48 Chaghi 28.52 63.33 623 51.1 41.8 33.2 20.7 15.2 13.5 27.3 26.9 17.8 19 27 41.6 27.90
25 Year Monthly & Annual Average Relative Humidity (%) for Districtcities of Pakistan

246
Appendix B: World and Pakistan Solar Energy Maps with Solar
Insolation for District Cities of Pakistan

247

248

249

250

251

252
Sr.No City Latitude Longitude Elevation Jan Feb Mar Apr May Jun July Aug Sep Oct Nov Dec Annual1 Karachi Keemari 24.54 66.56 1 4.76 5.67 6.68 7.31 7.6 7.23 6.3 6.11 6.32 5.91 5.11 4.53 6.122 Jacobabad 28.2 68.29 888 3.87 4.84 5.72 6.48 7.13 7.98 7.67 7.12 6.18 4.88 3.9 3.52 5.773 Kech 26 63 782 4.18 4.95 5.62 6.56 6.83 6.89 6.47 6.27 5.92 5.28 4.44 3.81 5.604 Chaman / Qilla Abdullah 30.58 66.25 1522 3.57 4.48 5.36 6.41 7.2 7.6 7.17 6.72 6.08 5.03 3.91 3.3 5.575 Panjgur 26.58 64.06 925 4.13 4.93 5.62 6.49 6.75 6.91 6.41 6.16 5.83 5.27 4.38 3.78 5.556 Awaran 26.1 65.3 692 4.15 4.99 5.68 6.44 6.74 6.79 6.29 6.06 5.86 5.28 4.44 3.86 5.547 Mastung / Kalat/Nushki 29.5 66.56 1789 3.63 4.4 5.19 6.48 7.13 7.41 6.97 6.56 6 5.08 3.99 3.39 5.528 Khuzdar 27.1 66.2 1299 4.01 4.87 5.54 6.34 6.81 6.82 6.4 6.11 5.64 5.14 4.29 3.69 5.479 Chaghi 28.52 63.33 623 3.74 4.61 5.18 6.28 6.84 6.89 6.67 6.42 6.1 5.18 4.07 3.39 5.45
10 Karachi city / Thatta 24.54 67.08 12 4.38 5.18 5.93 6.65 6.67 6.4 5.44 5.27 5.62 5.24 4.5 4.11 5.4411 Kharan 28 64.3 832 3.8 4.62 5.26 6.23 6.76 6.85 6.56 6.26 5.95 5.15 4.12 3.47 5.4212 Quetta / Pishin 30.2 67 2073 3.61 4.46 5.34 6.23 6.94 7.14 6.67 6.21 5.76 4.99 4.08 3.42 5.4013 Lasbella 25.45 66.35 88 4.13 4.88 5.61 6.42 6.72 6.69 5.95 5.65 5.62 5.09 4.24 3.85 5.4014 Sukkur / Larkana/ Shikarpur/khairpur 27.42 68.52 51 3.97 4.78 5.44 6.25 6.64 6.73 6.21 5.81 5.66 4.99 4.12 3.64 5.3515 Sialkot / Narowal / Gujrat 32.3 74.13 280 3.2 4.12 5.22 6.51 7.37 7.47 6.15 5.75 5.77 5.19 4.03 3.15 5.3316 Gujranwala/Hafizabad/Shekhupura 32.09 74.11 280 3.2 4.12 5.22 6.51 7.37 7.47 6.15 5.75 5.77 5.19 4.03 3.15 5.3317 Mirpur khas 25.32 69 20 4.12 4.88 5.61 6.3 6.51 6.56 5.85 5.57 5.55 4.95 4.2 3.9 5.3318 Lahore / Qasur 31.33 74.2 206 3.31 4.3 5.41 6.53 7.34 7.26 6.14 5.69 5.58 5.04 4.01 3.24 5.3219 Zhob 31.1 68.5 2065 3.53 4.49 5.36 6.08 6.79 6.85 6.55 6.07 5.78 4.96 3.99 3.36 5.3220 Mardan / Swabi 34.2 72 1016 3.08 3.77 4.76 6.18 7.31 7.88 6.96 6.21 5.87 5.01 3.76 2.86 5.3121 Qilla Saifullah / Loralai 30.43 68.21 1608 3.65 4.55 5.25 5.99 6.75 6.83 6.41 5.95 5.62 4.91 3.98 3.46 5.2822 Dadu 26.44 67.47 244 3.88 4.62 5.32 6.29 6.67 6.72 6.08 5.83 5.46 4.91 4.01 3.61 5.2823 Hyderabad / Jamshoro 25.23 68.25 26 3.7 4.42 5.41 6.41 6.88 6.98 6.2 5.95 5.62 4.54 3.7 3.42 5.2724 Ghotki 28.05 69.21 150 3.76 4.47 5.09 6.22 6.94 7.01 6.42 5.93 5.28 4.55 3.77 3.4 5.2425 Nawabshah /Sanghar/Shahdadkot/Nosheroferoz 26.15 68.25 33 3.99 4.71 5.41 6.09 6.42 6.41 5.77 5.6 5.56 5 4.21 3.75 5.2426 Islamabad / Rawalpindi 33.4 73.1 770 3.18 3.87 4.95 6.31 7.27 7.54 6.44 5.72 5.69 5.07 3.89 2.77 5.2427 Sibi / Bolan / 29.33 67.53 805 3.59 4.34 4.96 6.15 6.72 6.92 6.43 6.02 5.65 4.78 3.91 3.29 5.2328 Peshawar/charsadda/noshera 34.01 71.33 913 3.09 3.79 4.78 5.99 7.07 7.68 6.96 6.19 5.69 4.86 3.72 2.88 5.2329 Badin 24.39 68.5 6 4.19 4.92 5.64 6.38 6.5 6.4 5.41 5.12 5.31 4.91 4.24 3.84 5.2330 Jhelum 32.56 73.44 248 3.21 4.13 5.18 6.43 7.32 7.35 5.88 5.64 5.47 4.93 3.92 3.12 5.2131 Dera bugti / Barkhan 29.02 69.09 906 3.66 4.42 5.09 6.18 6.83 6.92 6.39 5.98 5.47 4.51 3.67 3.27 5.2032 Attock / Chakwal 33.54 72.15 420 3.19 3.92 4.87 6.22 7.16 7.43 6.48 5.75 5.51 4.93 3.84 2.97 5.1933 Rahim yar khan 28.26 70.19 84 3.65 4.46 5.13 6.11 6.82 6.86 6.41 5.89 5.26 4.58 3.77 3.39 5.1934 Gawadar 25.07 62.19 76 3.92 4.61 5.22 6.1 6.4 6.46 5.88 5.58 5.36 5 4.19 3.59 5.1935 Jafarabad /Nasirabad /Jhal Magsi 28.16 67.86 390 3.78 4.55 5.05 5.96 6.49 6.49 5.88 5.63 5.51 4.96 4.11 3.48 5.1636 Tharparker 25 70.15 125 4.08 4.74 5.47 6.1 6.4 6.36 5.47 5.21 5.32 4.87 4.15 3.15 5.1537 Bahawalpur 29.2 71.47 108 3.61 4.47 5.25 5.99 6.53 6.67 6.21 5.67 5.31 4.65 3.84 3.34 5.1338 Umar kot 26.15 69.4 51 3.93 4.61 5.26 5.96 6.32 6.39 5.77 5.51 5.44 4.79 4.01 3.62 5.1339 Sargodha 32.05 72.4 373 3.26 4.13 5.08 6.24 7.12 7.14 6.01 5.56 5.19 4.63 3.76 3.08 5.1040 Muzaffarabad / Balakot 34.22 73.29 2275 2.95 3.57 4.55 5.88 6.99 7.46 6.6 5.94 5.7 4.88 3.69 2.79 5.0941 Faisalabad 31.26 73.08 186 3.25 4.19 5.09 6.01 6.71 6.65 5.99 5.6 5.37 4.65 3.73 3.14 5.0342 Jhang /Rajanpur /Toba Tek Singh 31.16 72.19 164 3.35 4.29 5.12 5.84 6.78 6.92 6.19 5.67 5.16 4.33 3.53 3.09 5.0243 Hangu / Karak / Kohat 33.32 71.04 655 3.18 3.89 4.74 5.92 6.86 6.96 6.12 5.64 5.33 4.86 3.79 2.98 5.0244 Okara /Sahiwal /Vehari /Pakpatan 30.49 73.27 162 3.26 4.29 5.07 5.94 6.48 6.62 6 5.53 5.24 4.59 3.8 3.18 5.0045 Bannu 32.59 70.36 517 3.34 4.09 4.88 6.04 6.46 6.72 5.8 5.51 5.15 4.67 3.81 3.15 4.97
46 Bhakkar / Layyah 31.4 71.05 165 3.44 4.35 5.13 5.76 6.21 6.35 5.79 5.56 5.23 4.53 3.67 3.13 4.93
47 DG Khan 30.03 70.38 492 3.59 4.33 5.01 5.65 6.18 6.1 5.7 5.45 5.23 4.75 3.86 3.32 4.93
48 Multan / Muzaffargarh 30.12 71.26 124 3.44 4.22 4.99 5.78 6.19 6.36 5.76 5.44 5.21 4.69 3.79 3.19 4.92
22 year Monthly & Annual Average Solar Insolation (Kwh/m2/day) on a horizontal surface in District cities of Pakistan
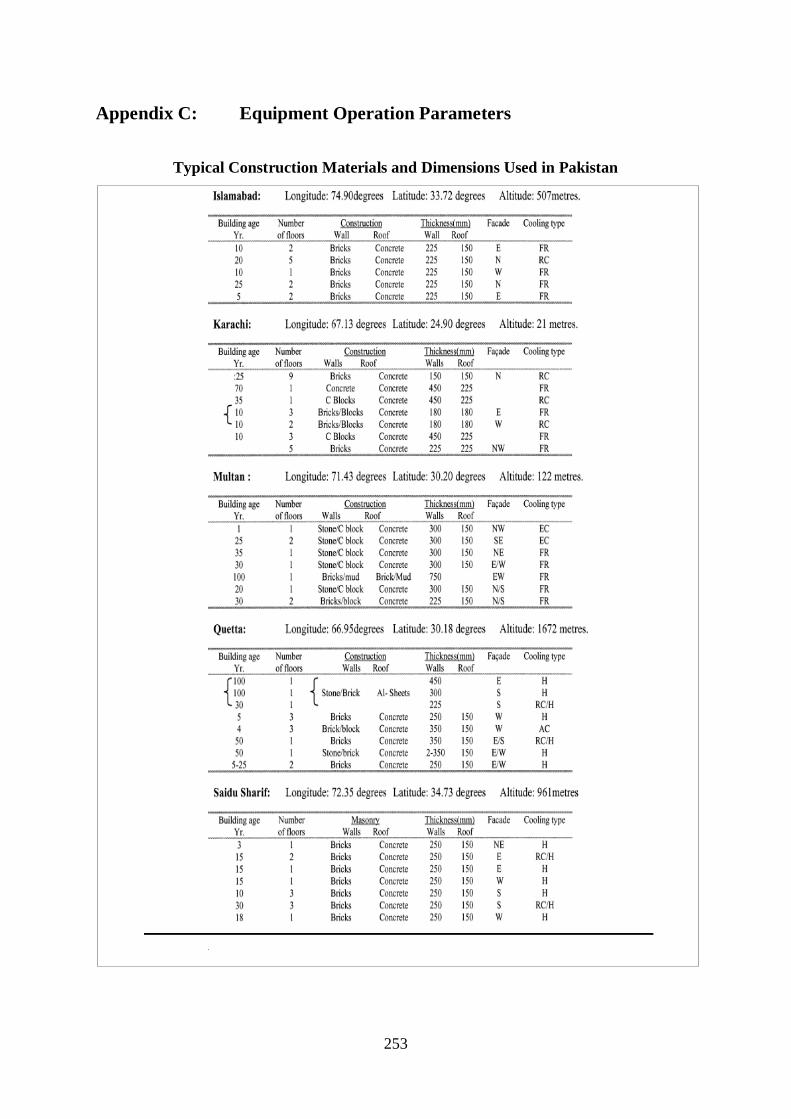
253
Appendix C: Equipment Operation Parameters
Typical Construction Materials and Dimensions Used in Pakistan

254
Evacuated Tube Collector Type71 Parameters
Parameter Value Unit
Number in series 1 -
Collector area 12 m2 ( optimised value)
Fluid specific heat 4.19 kJ/kg.K
Efficiency mode 2 (optimised Value)
Flow rate at test conditions 3 kg/hr.m2
Intercept efficiency 0.7 (default)
Negative of first order efficiency coefficient 9 kJ/hr.m2.K (Reference Model)
Negative of second order efficiency coefficient 0.03 kJ/hr.m2.K2(Reference Model)
Logical unit of file containing biaxial IAM data 60 (default)
Number of longitudinal angles for which IAMs are provided 5 (default)
Number of transverse angles for which IAMs are provided 5 (default)
Inlet temperature °C (Storage tank cold side temperature)
Inlet flow rate 165kg/hr
Ambient temperature
Input from weather data
Incident radiation
Incident diffuse radiation
Solar incidence angle
Solar zenith angle
Solar azimuth angle
Collector slope 0 Degrees (optimised)
Collector azimuth 90 Degrees (optimised)
Auxiliary cooler Type 1246
Parameter Value Unit
Rated capacity 21000 kJ/hr (optimised)
Specific heat of fluid 4.19 kJ/kg.K
Inlet fluid temperature
°C (Chiller outlet cooling water)
Inlet flow rate 800 kg/hr (optimised)
Control function 1 -
Set point temperature 25 °C (optimised)
Overall loss coefficient 0 kJ/hr.K (default)
Temperature of surroundings
°C (Input from weather data)

255
Hot water storage tank Type4a
Parameter value Unit
Fixed inlet positions 1 default
Tank volume 2.0 m3 (optimised )
Fluid specific heat 4.19 kJ/kg.K
Fluid density 1000 kg/m3
Tank loss coefficient 0.6 kJ/hr.m2.K (Referenced)
Height of node-1 0.1 m
Height of node-2 0.1 m
Height of node-3 0.1 m
Height of node-4 0.1 m
Height of node-5 0.1 m
Height of node-6 0.1 m
Height of node-7 0.1 m
Height of node-8 0.1 m
Height of node-9 0.1 m
Height of node-10 0.1 m
Auxiliary heater mode 1 (off)
Node containing heating element 1 1 (top most element)
Node containing thermostat 1 1 (top most element)
Set point temperature for element 1 0 (off)
Dead band for heating element 1 5 delta °C (default)
Maximum heating rate of element 1 0 kJ/hr (off)
Node containing heating element 2 1 (top most element)
Node containing thermostat 2 1 (top most element)
Set point temperature for element 2 0 (off)
Dead band for heating element 2 5 delta °C (default)
Maximum heating rate of element 2 0 kJ/hr (off)
Not used (Flue UA) 0 W/K (not in use for storage tank)
Not used (T flue) 20 (not in use for storage tank)
Boiling point 100 °C
Hot-side temperature
°C (Collector Outlet water Temperature)
Hot-side flow rate 165 Kg/hr
Cold-side temperature
°C (Chiller Outlet water Temperature)
Cold-side flow rate 150 Kg/hr
Environment temperature °C(Input from weather data)
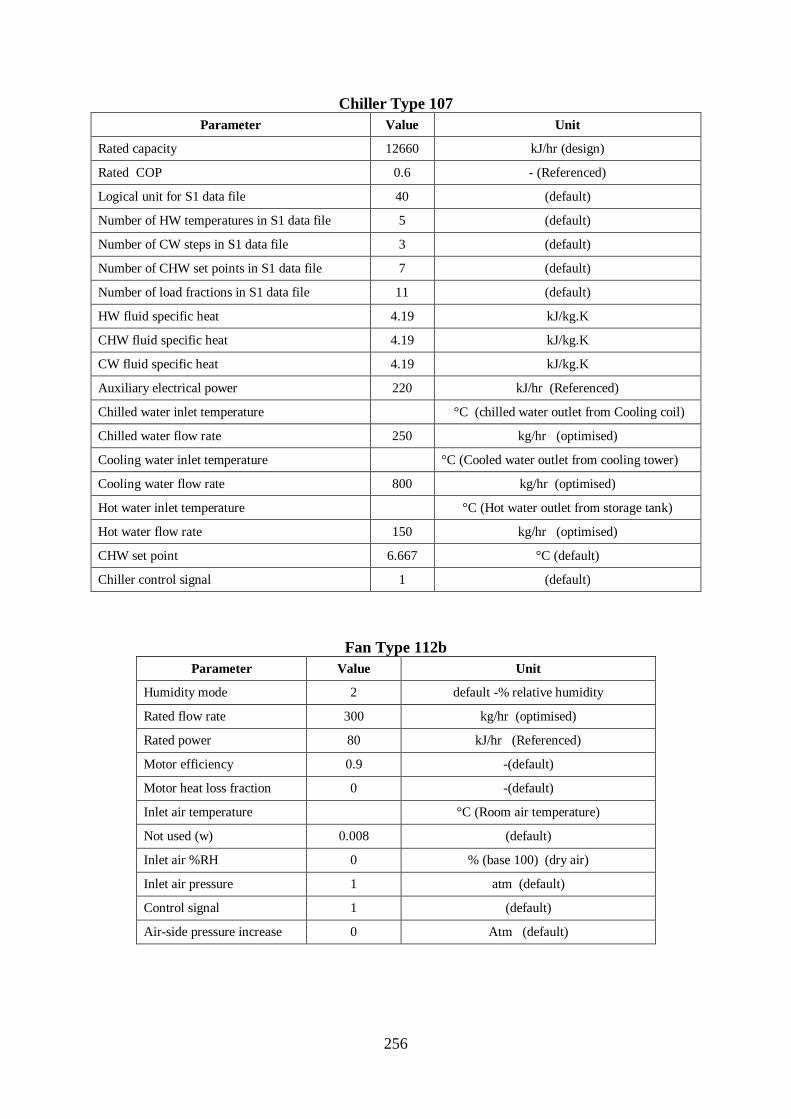
256
Chiller Type 107
Parameter Value Unit
Rated capacity 12660 kJ/hr (design)
Rated COP 0.6 - (Referenced)
Logical unit for S1 data file 40 (default)
Number of HW temperatures in S1 data file 5 (default)
Number of CW steps in S1 data file 3 (default)
Number of CHW set points in S1 data file 7 (default)
Number of load fractions in S1 data file 11 (default)
HW fluid specific heat 4.19 kJ/kg.K
CHW fluid specific heat 4.19 kJ/kg.K
CW fluid specific heat 4.19 kJ/kg.K
Auxiliary electrical power 220 kJ/hr (Referenced)
Chilled water inlet temperature
°C (chilled water outlet from Cooling coil)
Chilled water flow rate 250 kg/hr (optimised)
Cooling water inlet temperature
°C (Cooled water outlet from cooling tower)
Cooling water flow rate 800 kg/hr (optimised)
Hot water inlet temperature
°C (Hot water outlet from storage tank)
Hot water flow rate 150 kg/hr (optimised)
CHW set point 6.667 °C (default)
Chiller control signal 1 (default)
Fan Type 112b
Parameter Value Unit
Humidity mode 2 default -% relative humidity
Rated flow rate 300 kg/hr (optimised)
Rated power 80 kJ/hr (Referenced)
Motor efficiency 0.9 -(default)
Motor heat loss fraction 0 -(default)
Inlet air temperature
°C (Room air temperature)
Not used (w) 0.008 (default)
Inlet air %RH 0 % (base 100) (dry air)
Inlet air pressure 1 atm (default)
Control signal 1 (default)
Air-side pressure increase 0 Atm (default)

257
Cooling Coil Type 697
Parameter Value Unit
Humidity mode 2 default -% relative humidity
Logical unit - water corrections 52 (default)
Number of water flow rates 3 -(default)
Number of water temperatures 3 -(default)
Logical unit - air flow corrections 53 -(default)
Number of air flows 7 -(default)
Logical unit - air temperature corrections 54 -(default)
Number of dry-bulb temperatures 7 -(default)
Number of wet-bulb temperatures 6 -(default)
Fluid density 1000 kg/m3
Fluid specific heat 4.19 kJ/kg.K
Rated volumetric air flow rate 200 l/s (optimised)
Rated volumetric liquid flow rate 0.3 l/s (default)
Total cooling capacity 9000 kJ/hr (optimised)
Sensible cooling capacity 7150 kJ/hr (optimised)
Fluid inlet temperature 7 °C (Chilled water from chiller outlet)
Fluid flow rate 250 kg/hr
Inlet air temperature
Fan outlet air
Inlet air flow rate 300 kg/hr (Fan outlet flow rate)
Inlet air pressure 1 atm (default)
Air-side pressure drop 0 atm (default)
Thermostat Type 108
Parameter Value Unit
No of oscillations permitted 5 (default)
1st stage heating in 2nd stage? 0 No heating
2nd stage heating in 3rd stage? 0 No heating
1st stage heating in 3rd stage? 0 No heating
1st stage cooling in 2nd stage? 1 cooling
Temperature dead band 0.5 Delta °C (optimised)
Monitoring temperature Room air temperature
1st stage heating set point 10 °C
2nd stage heating set point 10 °C
3rd stage heating set point 10 °C
1st stage cooling set point 20.65 °C (optimised)
2nd stage cooling set point 28 °C (optimised)

258
YAZAKI (HWF-SC5) ABSORPTION CHILLER PERFORMANCE
CHARACTERISTICS

259
Appendix D: System Heat Balance
ENERGY IN PUTS (kWh)
Month Collector Heat Gain Heat from Room Pumps Electricity
January 192.18 0.00 120.81
February 288.16 63.01 114.46
March 762.33 453.27 137.35
April 1163.05 683.82 132.92
May 1584.59 998.43 137.35
June 1904.82 1165.58 132.92
July 1778.11 1085.48 137.35
August 1637.03 1008.11 137.35
September 1409.45 807.24 132.92
October 1065.22 669.86 137.35
November 667.41 332.05 132.92
December 208.03 24.04 120.81
Total 12660.38 7290.90 1574.48
ENERGY OUT PUT (kWh)
Month Cooler Heat Rejected Tank Heat Loss Pipes Heat Loss
January 48.65 319.97 41.63
February 210.81 520.45 39.76
March 1245.47 228.36 28.17
April 1854.15 90.51 7.94
May 2686.79 22.43 -4.75
June 3126.14 -56.26 -16.09
July 2916.40 -64.56 -16.26
August 2712.29 -30.49 -11.32
September 2180.42 5.81 -5.25
October 1818.59 23.96 0.12
November 924.24 71.98 11.40
December 112.51 295.93 38.40
Total 19836.46 1428.10 113.76

260
System Total Energy Balance (kWh)
Month Total input Total output Internal Energy
Change
Net Balance
(Input-Output)
January 313.00 410.24 -97.03 -97.25
February 465.63 771.02 12.07 -305.39
March 1352.95 1502.01 62.24 -149.06
April 1979.79 1952.60 4.83 27.19
May 2720.36 2704.48 76.04 15.89
June 3203.31 3053.78 2.39 149.52
July 3000.94 2835.59 -7.62 165.35
August 2782.49 2670.48 19.04 112.01
September 2349.60 2180.99 -63.87 168.62
October 1872.42 1842.67 54.40 29.76
November 1132.37 1007.62 -82.01 124.75
December 352.89 446.84 -80.87 -93.95
Total 21525.76 21378.32 -100.40 147.45