Embed Size (px)
Citation preview
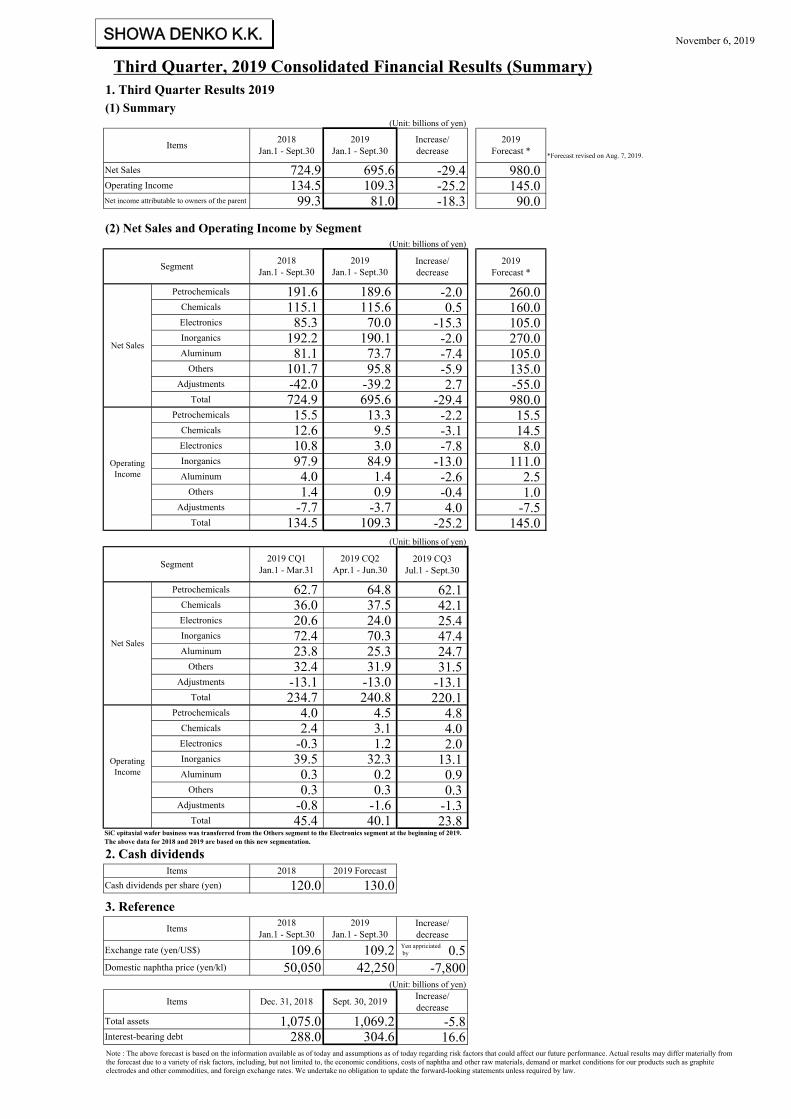
(1) Summary (Unit: billions of yen)
*Forecast revised on Aug. 7, 2019.
-29.4 980.0-25.2 145.0-18.3 90.0
(2) Net Sales and Operating Income by Segment (Unit: billions of yen)
Increase/decrease
2019Forecast *
-2.0 260.00.5 160.0
-15.3 105.0-2.0 270.0-7.4 105.0-5.9 135.02.7 -55.0
-29.4 980.0-2.2 15.5-3.1 14.5-7.8 8.0
-13.0 111.0-2.6 2.5-0.4 1.04.0 -7.5
-25.2 145.0 (Unit: billions of yen)
2019 CQ3Jul.1 - Sept.30
62.142.125.447.424.731.5
-13.1220.1
4.84.02.0
13.10.90.3
-1.323.8
2. Cash dividends
3. ReferenceIncrease/decrease
0.5-7,800
Increase/decrease
-5.816.6Interest-bearing debt 288.0 304.6
(Unit: billions of yen)
Items Dec. 31, 2018 Sept. 30, 2019
Total assets 1,075.0 1,069.2
Exchange rate (yen/US$) 109.6 109.2Domestic naphtha price (yen/kl) 50,050 42,250
Cash dividends per share (yen) 120.0 130.0
Items2018
Jan.1 - Sept.302019
Jan.1 - Sept.30
SiC epitaxial wafer business was transferred from the Others segment to the Electronics segment at the beginning of 2019.The above data for 2018 and 2019 are based on this new segmentation.
Items 2018 2019 Forecast
Others 0.3 0.3Adjustments -0.8 -1.6
OperatingIncome
Petrochemicals 4.0 4.5Chemicals 2.4 3.1Electronics -0.3 1.2
Total 45.4 40.1
23.8 25.3Others 32.4 31.9
Inorganics 39.5 32.3Aluminum 0.3 0.2
37.5Electronics 20.6 24.0Inorganics 72.4 70.3
Segment2019 CQ1
Jan.1 - Mar.312019 CQ2
Apr.1 - Jun.30
Net Sales
Petrochemicals 62.7 64.8Chemicals 36.0
Adjustments -13.1 -13.0Total 234.7 240.8
Aluminum
Total 134.5 109.3
Others 1.4 0.9Adjustments -7.7 -3.7
Electronics 10.8 3.0Operating
Income
Petrochemicals 15.5 13.3Chemicals 12.6 9.5
Inorganics 97.9 84.9Aluminum 4.0 1.4
Adjustments -42.0 -39.2Total 724.9 695.6
Aluminum 81.1 73.7Others 101.7 95.8
Chemicals 115.1 115.6
Segment2018
Jan.1 - Sept.302019
Jan.1 - Sept.30
Net Sales
Petrochemicals 191.6 189.6
Electronics 85.3 70.0Inorganics 192.2 190.1
Net income attributable to owners of the parent 99.3 81.0
Net Sales 724.9 695.6Operating Income 134.5 109.3
November 6, 2019
1. Third Quarter Results 2019
Items2018
Jan.1 - Sept.302019
Jan.1 - Sept.30Increase/decrease
2019Forecast *
SHOWA DENKO K.K.
Third Quarter, 2019 Consolidated Financial Results (Summary)
Yen appriciatedby
Note : The above forecast is based on the information available as of today and assumptions as of today regarding risk factors that could affect our future performance. Actual results may differ materially from the forecast due to a variety of risk factors, including, but not limited to, the economic conditions, costs of naphtha and other raw materials, demand or market conditions for our products such as graphite electrodes and other commodities, and foreign exchange rates. We undertake no obligation to update the forward-looking statements unless required by law.

Ⅰ. Consolidated Financial Results November 6th, 2019
(1) Results of operations:
\ \ % $ Net sales 724,938 695,575 (4.1) 6,445,284 Operating income 134,495 109,313 (18.7) 1,012,908 Ordinary income 134,185 107,587 (19.8) 996,919 Net income attributable to owners of the parent 99,272 80,963 (18.4) 750,209 Net income attributable to owners of the parent per share: Basic 676.47 555.01 ― 5.14 Net income attributable to owners of the parent per share: Diluted ― ― ― ―
Notes Important changes in accounting policies : not applicable Comprehensive income : Results for the year ended September 30, 2019 \75,929 million Results for the year ended September 30, 2018 \98,572 million
(2) Financial position:
\ \ $ Total assets 1,074,983 1,069,185 9,907,204 Total equity 465,340 518,326 4,802,870
% % % Stockholders' equity ratio 41.5 46.6 46.6
(3) Dividends:
Q1 dividends per share (\) ― ― Q2 dividends per share (\) 20.00 50.00 Q3 dividends per share (\) ― ― End of Term dividends per share (\) 100.00 80.00 Annual dividends per share (\) 120.00 130.00
Ⅱ. Forecast of performance for the year ending December 31, 2019
\ $ Net sales 980,000 9,080,801 Operating income 145,000 1,343,588 Ordinary income 142,000 1,315,789 Net income attributable to owners of the parent 90,000 833,951 Net income attributable to owners of the parent per share: Basic 616.96 5.72*There is no change from the full-year 2019 performance forecast announced on August 7th, 2019.The above forecast is based on the information available at this point of time. Actual results may differ materially due toa variety of reasons, including such economic factors as fluctuations in foreign currency exchange rates as well as marketsupply and demand conditions. Note Yen amounts have been translated into U.S.dollars for convenience only, at the rate of \107.92 to US$1.00, the approximate rate of exchange as of September 30, 2019.
Sep.30, 2019
(\ in millions, US$ in thousands,except for stockholders' equity ratio)
Sep.30, 2019
fiscal year
2018 2019 Forecast
Dec.31, 2018
(\ in millions, US$ in thousands, except fornet income attributable to owners of the parent per share)
Consolidated Financial StatementsFor the first three quarters ended September 30, 2019
Results for the first three quarters (Jan.1-Sep.30)
2018 2019Increase
2019(Decrease)
(\ in millions, US$ in thousands, except fornet income attributable to owners of the parent per share)
SHOWA DENKO K.K.
1

[Business Results and Financial Conditions] 1. Analysis of consolidated business results (1) Summary During the first three quarters of 2019 (January 1 – September 30), the Japanese economy continued to recover gradually. Consumer spending remained firm against the background of good employment situation. Corporate earnings showed downward trend centering on manufacturing industry due to a slowdown in export and a decrease in domestic production. Overseas economies were slowing down. Though the U.S. economy continued to recover gradually, a feeling of slowdown of the European economy was strengthened. Chinese economy was slowing down due to US-China trade friction, and it is desired that measures to stimulate the slowing down economy taken by relevant authorities be fully effective. The economies of ASEAN countries also showed a sign of slowdown. Mood of uncertainty over future prospects for global economy has been enhanced by global issues such as prolonged adjustment of production in the semiconductor industry, and lowering production in the automotive industry centering on Europe and China, in addition to the tense economic environment caused by US-China trade friction and the unstable situation in the Middle East. In the petrochemicals industry, domestic plants to produce ethylene and its derivatives maintained high operating rate. However, in the East Asian market, the supply-demand situation of petrochemicals was slightly eased due to a slowdown in the Chinese economy. In the electronics parts/materials industry, semiconductors and display panels remained under the harsh adjustment of production due to continuing low-level shipment volumes of PCs and smartphones. Under these circumstances, the Showa Denko Group started its new medium-term consolidated business plan “The TOP 2021” in January 2019. It is very important for the Showa Denko Group to enhance the value of the Group and satisfy all stakeholders including shareholders, customers, suppliers, local communities and employees in order that the Group continuously grows and becomes trusted and acclaimed by society. The Showa Denko Group defines this idea as the Group’s business philosophy, thereby promoting management to maximize shareholders’, customers’ and social value. The Group will change its course toward long-term business growth, strengthen its earning power and reduce the range of fluctuation in income through promotion of “The TOP 2021,” enhance the value of the Group, and establish a stable foundation which will continuously support the Group’s growth far into the future. The Group recorded consolidated net sales of ¥695,575 million in the first three quarters of 2019, down 4.1% from the same period of the previous year. Sales in the Chemicals segment slightly increased. However, sales in the Electronics segment decreased due to a decrease in shipment volumes of HD media. Sales in the Aluminum and other segments also decreased. Operating income of the Group in the first three quarters of 2019 decreased 18.7%, to ¥109,313 million. In the Inorganics segment, we reduced production volumes of graphite electrodes. In the Electronics segment, shipment volumes of HD media decreased especially in the first half of the year. The Group recorded ordinary income of ¥107,587 million, down 19.8% from the same period of the previous year. The Group recorded net income attributable to owners of the parent of ¥80,963 million in the first three quarters of 2019, down 18.4% from the same period of the previous year.
2

(Unit: millions of yen)
2018 1Q - 3Q
(Jan.-Sept.)
2019 1Q – 3Q
(Jan.-Sept.)
Increase/ decrease
2018 July-Sept.
2019 July-Sept.
Increase/ decrease
Sales 724,938 695,575 -29,362 269,093 220,081 -49,012
Operating income 134,495 109,313 -25,182 56,630 23,842 -32,788
Ordinary income 134,185 107,587 -26,597 56,613 22,757 -33,856Net income attributable to owners of the parent 99,272 80,963 -18,309 41,323 15,149 -26,173
(2) A breakdown of net sales and operating income by segment (January 1 - September 30, 2019) [Petrochemicals segment] In the Petrochemicals segment, sales decreased 1.1%, to ¥189,578 million. Sales volumes of ethylene and propylene in the first three quarters of 2019 increased from the same period of the previous year because there was no once-in-four-year large-scale shutdown maintenance of ethylene production facilities which took place in the first half of 2018. However, sales of petrochemical products decreased due to a fall in market prices in Asia resulting from easing supply-demand situation. Sales of organic chemicals decreased due partly to a decline in market prices of vinyl acetate and ethyl acetate. Operating income of the segment decreased 14.2 %, to ¥13,279 million.
(Unit: millions of yen) 2018
1Q - 3Q (Jan.-Sept.)
2019 1Q – 3Q
(Jan.-Sept.)
Increase/ decrease
2018 July-Sept.
2019 July-Sept.
Increase/ decrease
Sales 191,622 189,578 -2,044 76,211 62,098 -14,113
Operating income 15,480 13,279 -2,201 8,068 4,814 -3,254
[Chemicals segment] In the Chemicals segment, sales increased 0.4%, to ¥115,577 million. In the basic chemicals business, sales slightly decreased. Sales of liquefied ammonia and chloroprene rubber were at the same levels of the year-before period. However, sales of acrylonitrile decreased due to a fall in the market price. Shipment volumes and sales of electronic chemicals decreased due to adjustment of production in the semiconductor and display industries. On the other hand, in the industrial gases and functional chemicals businesses, sales slightly increased. In addition, non-stick coating materials companies which we acquired in recent years were newly consolidated. As a result, sales in the Chemicals segment increased. However, operating income of the segment decreased 24.5%, to ¥9,514 million.
(Unit: millions of yen) 2018
1Q - 3Q (Jan.-Sept.)
2019 1Q – 3Q
(Jan.-Sept.)
Increase/ decrease
2018 July-Sept.
2019 July-Sept.
Increase/ decrease
Sales 115,073 115,577 505 40,453 42,052 1,599
Operating income 12,608 9,514 -3,094 4,856 3,992 -864
[Electronics segment] In the Electronics segment, sales decreased 18.0%, to ¥70,020 million. Sales of HD media decreased due partly to the bearish shipment volumes of media for PCs. In
3

addition, shipment volumes of HD media for use in data centers in the first half of 2019 decreased due to a global slowdown in investment in the field of information technology (IT). Sales of rare earth magnetic alloys decreased due to structural reforms. Sales of compound semiconductors decreased due to a decrease in shipment volumes. Sales of lithium-ion battery (LIB) materials decreased due to a decrease in shipment volumes. As for SiC epitaxial wafer business, sales increased due mainly to an increase in sales volumes of products for use in electric railcars and other equipment. Operating income of the segment decreased 72.5%, to ¥2,981 million.
(Unit: millions of yen) 2018
1Q - 3Q (Jan.-Sept.)
2019 1Q – 3Q
(Jan.-Sept.)
Increase/ decrease
2018 July-Sept.
2019 July-Sept.
Increase/ decrease
Sales 85,340 70,020 -15,321 28,618 25,432 -3,186
Operating income 10,829 2,981 -7,848 4,817 2,034 -2,782
SiC epitaxial wafer business was transferred from the Others segment to the Electronics segment at the beginning of 2019. Data in the table above are based on this new segmentation retrospective to 2018.
[Inorganics segment] In the Inorganics segment, sales decreased 1.1%, to ¥190,119 million. Sales of graphite electrodes in the first three quarters of 2019 increased from the same period of the previous year, due to a rise in sales prices of graphite electrodes in the global market caused by tight supply-demand situation that occurred in 2018, despite a reduction in the Company’s production and sales volumes of graphite electrodes starting from the middle of 2019 in order to respond to the weakening supply-demand situation mainly in the European market resulting from a slowdown in steel production and partial-clearance of our customers’ graphite-electrode inventory. Sales of ceramics decreased due mainly to a fall in shipment volumes of general-purpose alumina, though the shipment volumes of fine ceramics for electronics remained at the same level of the year-before period. The segment recorded operating income of ¥84,902 million, down 13.3% from the same period of the previous year.
(Unit: millions of yen)
2018 1Q - 3Q
(Jan.-Sept.)
2019 1Q – 3Q
(Jan.-Sept.)
Increase/ decrease
2018 July-Sept.
2019 July-Sept.
Increase/ decrease
Sales 192,151 190,119 -2,033 75,693 47,406 -28,287
Operating income 97,885 84,902 -12,982 39,778 13,066 -26,712
[Aluminum segment] In the Aluminum segment, sales decreased 9.1%, to ¥73,698 million. Sales of aluminum rolled products decreased due to a decline in shipment volumes of high-purity foil for aluminum electrolytic capacitors, especially for use in industrial equipment and devices for data centers, resulting from adjustment of production. Sales of aluminum specialty components decreased due to a decline in shipment volumes of those for use in automotive parts and industrial equipment. Sales of aluminum cans remained at the same level of the year-before period. Operating income of the segment decreased 64.8%, to ¥1,424 million.
(Unit: millions of yen) 2018
1Q - 3Q (Jan.-Sept.)
2019 1Q – 3Q
(Jan.-Sept.)
Increase/ decrease
2018 July-Sept.
2019 July-Sept.
Increase/ decrease
Sales 81,060 73,698 -7,362 27,781 24,681 -3,100
Operating income 4,039 1,424 -2,615 1,370 944 -426
4

[Others segment] In the Others segment, sales decreased 5.8%, to ¥95,830 million. SHOKO CO., LTD.’s sales decreased. Operating income of the segment decreased 31.2%, to ¥937 million.
(Unit: millions of yen) 2018
1Q - 3Q (Jan.-Sept.)
2019 1Q – 3Q
(Jan.-Sept.)
Increase/ decrease
2018 July-Sept.
2019 July-Sept.
Increase/ decrease
Sales 101,686 95,830 -5,856 34,436 31,527 -2,910
Operating income 1,362 937 -424 431 325 -106
SiC epitaxial wafer business was transferred from the Others segment to the Electronics segment at the beginning of 2019. Data in the table above are based on this new segmentation retrospective to 2018.
(3) Major steps taken or decided after the settlement of accounts for the first half of 2019 [General] Set 2030 GHG reduction target conforming to global standard
In July 2019, SDK set a medium-term target figure to reduce emissions of greenhouse gases (GHGs) by 2030. In addition, recognizing importance of information disclosure to the global community, SDK has decided to announce the amount of the Showa Denko Group’s GHG emissions in conformity with “GHG Protocol,” which is the global standard, starting from the data for FY 2018 (April 2018 - March 2019). Based on these policies, the Showa Denko Group set a goal of 11% reduction of GHG emissions from its domestic bases for FY 2030 compared with that for FY 2013. In addition, with the announcement of data for FY2018 as its beginning, the Showa Denko Group has started to disclose the total amount of GHG emissions from bases at home and abroad in accordance with GHG Protocol, namely, the amount of direct GHG emissions from the Group’s own facilities (Scope 1), the amount of indirect GHG emissions from purchased or acquired electricity, steam and heat (Scope 2), and the amount of indirect GHG emissions from the corporate value chain (Scope 3). The Group will announce these data through its integrated report (Showa Denko Report), its Website explaining the Group’s CSR activities, and other media. Moreover, aiming to set the Group’s global warming mitigation measures as a part of its business strategy, the Group will introduce Internal Carbon Pricing* mechanism and incorporate reduction of GHG emissions into the decision-making process for investment as a factor to be considered. The Showa Denko Group will continue introducing environment-conscious production equipment and technologies, promoting environment protection measures, and providing products that support recycling-oriented society, thereby contributing to creation of society where affluence and sustainability are harmonized.
*Internal Carbon Pricing: This mechanism assumes a situation in which emission of CO2 is taxed, makes target organizations recognize the value of low-carbon operation, and motivates them to choose investment programs with less CO2 emission.
Acquired ILAG Group, global non-stick coatings manufacturer
In July 2019, SDK acquired all shares in ILAG Industrielack AG, which leads the ILAG Group (ILAG), a specialty non-stick coating materials manufacturing company. Non-stick coating materials (NSCs) are used on consumer goods such as cookware, bakeware, and home electrical appliances, and also on industrial goods including automotive parts and other industrial equipment, for the purposes of preventing sticking of substances on their surfaces and supporting low friction and release during use. The global market for NSCs is put about ¥130 billion (about $1.2 billion) a year (SDK’s estimate as of May 2019). ILAG has the fourth largest share in the consumer-goods NSC market of worldwide operating companies. ILAG exports its products to more than 50 countries. On the other hand, SDK already acquired GMM Group, another large manufacturer of NSCs for
5
consumer goods, in November 2016. Therefore, SDK Group can pursue a synergy effect of integrated operation and marketing between ILAG and GMM groups because they have competitive market shares in different geographic areas in the world. In addition, after the acquisition of ILAG, annual sales figure of SDK’s NSC business leaped up to about $60 million, and now has strong presence and competitiveness in global market, especially in the field of consumer goods. SDK’s functional polymer/monomer business sector manufactures and sells materials for coatings for various purposes, and have rich expertise in prescription and manufacturing of raw materials for high-performance coatings and evaluation of performance of those coatings. NSCs can be classified into three categories in terms of raw materials, namely, fluorinated-resin based, silicon based, and Sol-Gel based coatings. Therefore, SDK can offer optimum solutions to its own NSC business by taking advantage of its wide-ranging businesses, products and technologies as an integrated chemical company. Established a technology to joint aluminum alloy and polycarbonate directly
SDK developed a technology to joint aluminum alloy and polycarbonate resin directly. Mechanical joining with bolts and nuts and gluing is widely used to joint metal and plastics. Technologies to joint metal and resins directly when resin materials are injected for molding are now attracting manufacturers’ attention because such technologies enable manufacturers to simplify manufacturing processes, improve productivity, and process parts with complicated shapes. It has been believed difficult to joint aluminum alloy with amorphous engineering plastics including polycarbonate resin by utilizing joining technologies depending on mechanical cohesiveness including anchoring. However, SDK has successfully developed a technology to joint aluminum alloy and polycarbonate resin directly by utilizing our special surface-treatment technology and expertise in primers. This new technology is characterized with joining mechanism utilizing not only anchoring effect but also chemical cohesiveness. In addition, in experiments, this technology successfully achieved cohesiveness of more than 25Mpa between aluminum alloy and polycarbonate under normal molding condition for polycarbonate resin. Since this technology realizes direct joining between polycarbonate resin, which has wide multiplicity of use, and light aluminum alloy, it is applicable to molding of composite housings for smartphones and other equipment. For the future, we will aim to strengthen cohesiveness and durability of this joining, apply this technology to heat-resistant super-engineering plastics, and put automotive parts made with this technology to practical use. Gained government approval for the Company’s plan for innovative use of data
In July this year, SDK’s plan for establishing a new information platform was approved by the government as one of the “Plans for Innovative Use of Data for Industrial Activities.” In accordance with the Article 22 of the Act on Special Measures for Productivity Improvement, Minister for Internal Affairs and Communications as well as Minister of Economy, Trade and Industry approve capital investment plans for productivity improvement (in terms of labor productivity and return on investment) through coordination and utilization of data with prescribed cybersecurity measures. In cases of capital investments based on such approved plans, companies can receive government support in the form of tax credit and special depreciation. SDK has decided to introduce “SAP S/4HANA,” an enterprise resource planning (ERP) system developed by SAP SE. Based on the system, SDK will establish a platform for unified management of information on sales, accounting and procurement pertaining to various sites it operates globally. The unified data under “SAP/S4HANA” will be supplied to new systems of sales target and profit/loss simulation, and analyzes. Thus SDK will achieve a proactive management style, and its plan for establishing the new information platform has been approved as a
6

Plan for innovative Use of Data for Industrial Activities. Under its medium-term business plan “The TOP 2021,” SDK aims to maximize CUSTOMER Experience through utilization of artificial intelligence (AI) and internet of things (IoT). By establishing the new information platform, SDK will continue increasing management efficiency and creating best solutions through integration of various products and services.
[Petrochemicals segment] Decided to commercialize 1,3-BG
In October this year, SDK decided to commercialize 1,3-butylene glycol (1,3-BG), which is mainly used as raw material for cosmetics. SDK will finish installation of facilities to produce 1,3-BG in its Oita Complex by the end of 2019, and plans to start sale of the product in April 2020. 1,3-BG is mixed into many kinds of cosmetics as moisturizing component. Due to rapid growth in Asian demand for cosmetics, the demand for 1,3-BG is expected to increase 10% every year*. SDK will support the growth of cosmetics market centering on Asia from supply side of raw materials including 1,3-BG. In addition, SDK will realize production of 1,3-BG with quality good enough to be used as an ingredient of cosmetics by utilizing its original technology. In Oita Complex, SDK will practice integrated production of 1,3-BG from ethylene. SDK will continue striving to make its petrochemicals business the most competitive one in East Asia by enhancing its profitability through commercialization of new derivatives and improvement in mutual cooperation among members of the regional complex, including strengthening of its acetyl chain.
*SDK’s estimate
[Chemicals segment] Started shipments of BMC for TOYOTA’s hybrid vehicles in China
SDK started supplying bulk molding compound (BMC) to Toyota Motor Corporation (TOYOTA) as sealing material for generator motors used in COROLLA HYBRID and LEVIN HYBRID recently launched in China. SDK’s BMC has such characteristics as high heat conductivity, insulation properties, heat resistance, fluidity, dimensional stability and chemical resistance. The material has been used as sealing material for generator motors for hybrid vehicles (HVs), such as TOYOTA’s PRIUS. This time, TOYOTA decided to develop and produce electric-vehicle power trains in China on the occasion of the introduction of two new HV models for the Chinese market. In response to this new policy, Shanghai Showa Highpolymer started producing BMC for HVs for the first time since its foundation in 2010, and supplying the material to Toyota Motor (Changshu) Auto Parts. The Chinese government introduced this year a new environmental regulation, obliging car makers to produce a certain number of new energy vehicles (NEVs). There is a move to spread the use of HVs as fuel-efficient cars for environmental protection. Thus, the HV market in China is expected to grow further.
[Electronics segment] Developed second generation of high-grade SiC epitaxial wafers
SDK has developed a second generation of high-grade silicon carbide (SiC) epitaxial wafers (HGE-2G) for power semiconductors. SDK has been mass-producing the first generation of high-grade epitaxial wafers under the trade name of “High-Grade Epi” (HGE). HGE-2G achieved further improvement in quality. When compared with the currently mainstream silicon-based semiconductors, SiC-based power semiconductors can operate under high-temperature, high-voltage, and high-current conditions while substantially reducing energy loss. These features enable device manufacturers to produce smaller, lighter and more energy-efficient power control modules, and the products’ market is rapidly expanding. SiC power semiconductors are already used in
7

power modules for servers in data centers, on-board battery chargers and rapid charging stands for EVs. In addition, SiC power semiconductors are expected to be used in power control units (PCU) for EVs in the first half of 2020s. Thus the demand for SiC-based semiconductors is expected to grow further. In recent years, improvement in quality of SiC epitaxial wafers and advances in device manufacturing process enabled manufacturers to put SiC-MOSFET into practical use, and full-SiC-based inverters with higher energy efficiency has begun to spread. For applications to inverter modules to drive motors for EVs and railcars, meanwhile, large chips measuring around 10mm square are made out of epitaxial wafers. This is because one device needs to handle a current as high as 100A. To prevent deterioration in the production yield of such large chips, the defect density on the surface of epitaxial wafers should be controlled to be less than 0.1/cm2. In the new product “HGE-2G,” SDK has succeeded in controlling the density of surface defect (SD), which affects production yield of power semiconductors, to be half of the current HGE by improving epitaxial SiC growth process. In addition, SDK has succeeded in enhancing reliability of power semiconductors through improving the basal plane dislocation (BPD) conversion rate by more than ten times compared with that of HGE. The global demand for SiC epitaxial wafers is expected to increase to be about ¥150 billion by 2025. As the largest independent manufacturer of SiC epitaxial wafers, and under a motto of “Best in Class,” SDK will continue coping with rapid expansion of the market for SiC epitaxial wafers, developing reliable products, and investing positively to expand its production capacity, thereby making its SiC epitaxial wafer business a Koseiha business.
2. Consolidated financial conditions as of September 30, 2019 Total assets at September 30, 2019 amounted to ¥1,069,185 million, a decrease of ¥5,798 million from the level at December 31, 2018. Total assets decreased due partly to a decrease in accounts receivable-trade, despite an increase in inventories. Total liabilities decreased ¥58,783 million from the level at December 31, 2018, to ¥550,860 million, due partly to a decrease in notes and accounts payable-trade, despite an increase in interest-bearing debts. Interest-bearing debts increased ¥16,603 million, to ¥304,571 million. Net assets increased ¥52,986 million from the level at December 31, 2018, to ¥518,326 million, due partly to the posting of net income attributable to owners of the parent. 3. Consolidated performance forecast The consolidated performance forecast for full year 2019 we announced on August 7, 2019 remains unchanged.
(Unit: millions of yen)
Net sales Operating income
Ordinary income
Net income attributable to owners of the parent
Forecast of results for full-year 2019
980,000 145,000 142,000 90,000
8

(\ in millions, US$ in thousands)
Assets \ \ $ Current assets Cash and deposits 113,186 119,675 1,108,920Notes and accounts receivable-trade 203,730 162,314 1,504,024Merchandise and finished goods 65,882 75,195 696,766Work in process 26,160 32,952 305,340Raw materials and supplies 60,758 66,235 613,741Other 28,202 27,746 257,095Allowance for doubtful accounts (1,386) (857) (7,943)Total current assets 496,533 483,260 4,477,943
Noncurrent assets Property, plant and equipment
Buildings and structures, net 78,777 80,181 742,966Machinery, equipment and vehicles, net 146,764 139,526 1,292,870Land 234,987 236,755 2,193,805Other, net 17,879 25,942 240,383Total property, plant and equipment 478,406 482,405 4,470,023
Intangible assets Other 14,950 22,138 205,138Total intangible assets 14,950 22,138 205,138
Investments and other assets Investment securities 71,886 70,381 652,163Other 21,540 18,867 174,821Allowance for doubtful accounts (8,332) (7,866) (72,884)Total investments and other assets 85,094 81,382 754,100
Total noncurrent assets 578,450 585,926 5,429,261Total assets 1,074,983 1,069,185 9,907,204
Liabilities Current liabilities Notes and accounts payable-trade 139,420 107,557 996,638Short-term loans payable 61,747 54,029 500,642Current portion of long-term loans payable 41,403 34,497 319,653Commercial papers 20,000 - -Provision 3,714 7,994 74,076Other 95,791 60,894 564,250Total current liabilities 362,074 264,972 2,455,259
Noncurrent liabilities Bonds payable 42,000 62,000 574,500Long-term loans payable 122,818 154,045 1,427,397Provision 4,133 3,609 33,442Net defined benefit liability 22,018 12,133 112,422Other 56,599 54,102 501,314Total noncurrent liabilities 247,569 285,888 2,649,075
Total liabilities 609,643 550,860 5,104,334Net assets
Shareholders' equity Capital stock 140,564 140,564 1,302,479Capital surplus 78,911 78,912 731,208Retained earnings 197,717 257,123 2,382,533Treasury stock (11,659) (11,663) (108,068)Total shareholders' equity 405,532 464,936 4,308,152
Accumulated other comprehensive incomeValuation difference on available-for-sale securities 7,489 9,108 84,395Deferred gains or losses on hedges 836 (108) (1,003)Revaluation reserve for land 33,281 32,990 305,692Foreign currency translation adjustment 7,069 (2,018) (18,698)Remeasurements of defined benefit plans (8,244) (6,807) (63,072)Total accumulated other comprehensive income 40,431 33,165 307,315
Non-controlling interests 19,377 20,224 187,402Total net assets 465,340 518,326 4,802,870
Total liabilities and net assets 1,074,983 1,069,185 9,907,204
Consolidated Balance Sheets
Dec. 31, Sep. 30, Sep. 30,2018 2019 2019
9
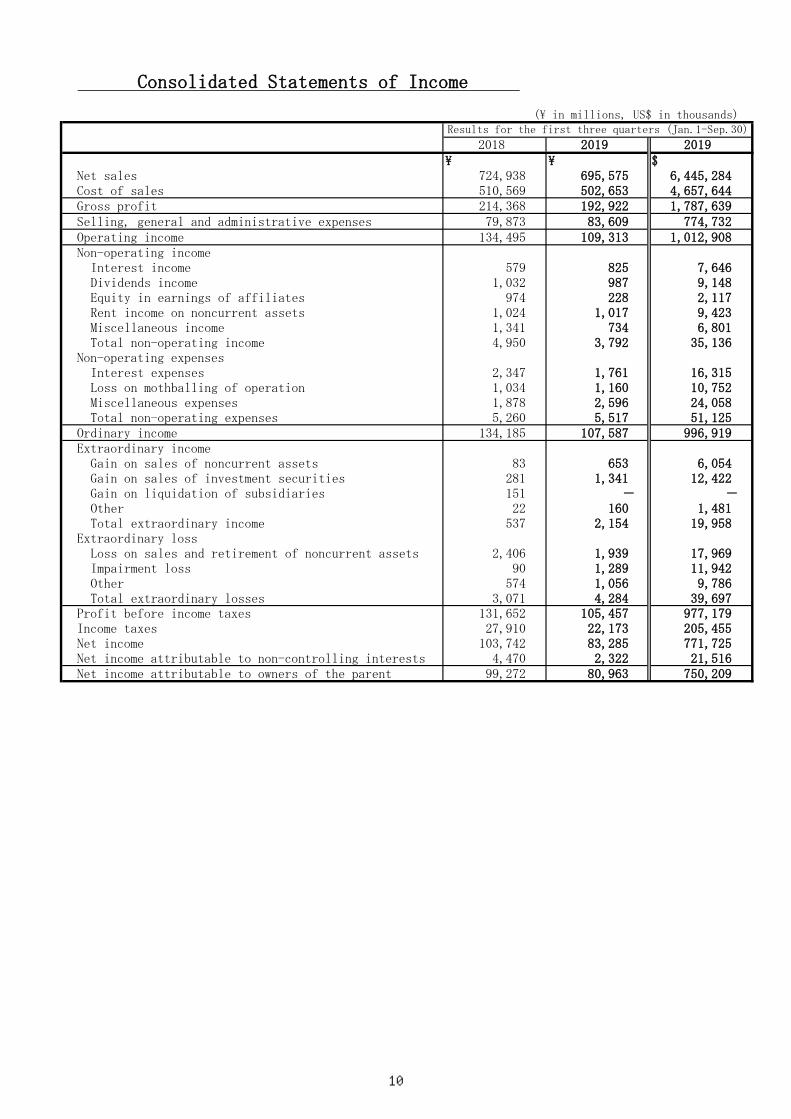
Consolidated Statements of Income
(\ in millions, US$ in thousands)
\ \ $Net sales 724,938 695,575 6,445,284Cost of sales 510,569 502,653 4,657,644Gross profit 214,368 192,922 1,787,639Selling, general and administrative expenses 79,873 83,609 774,732Operating income 134,495 109,313 1,012,908Non-operating income
Interest income 579 825 7,646Dividends income 1,032 987 9,148Equity in earnings of affiliates 974 228 2,117Rent income on noncurrent assets 1,024 1,017 9,423Miscellaneous income 1,341 734 6,801Total non-operating income 4,950 3,792 35,136
Non-operating expenses Interest expenses 2,347 1,761 16,315Loss on mothballing of operation 1,034 1,160 10,752Miscellaneous expenses 1,878 2,596 24,058Total non-operating expenses 5,260 5,517 51,125
Ordinary income 134,185 107,587 996,919Extraordinary income
Gain on sales of noncurrent assets 83 653 6,054Gain on sales of investment securities 281 1,341 12,422Gain on liquidation of subsidiaries 151 - -Other 22 160 1,481Total extraordinary income 537 2,154 19,958
Extraordinary loss Loss on sales and retirement of noncurrent assets 2,406 1,939 17,969Impairment loss 90 1,289 11,942Other 574 1,056 9,786Total extraordinary losses 3,071 4,284 39,697
Profit before income taxes 131,652 105,457 977,179Income taxes 27,910 22,173 205,455Net income 103,742 83,285 771,725Net income attributable to non-controlling interests 4,470 2,322 21,516Net income attributable to owners of the parent 99,272 80,963 750,209
Results for the first three quarters (Jan.1-Sep.30)
2018 2019 2019
10

Consolidated Statements of Comprehensive Income
(\ in millions, US$ in thousands)
\ \ $ Profit 103,742 83,285 771,725Other comprehensive income:Valuation difference on available-for-sale securities (3,015) 1,642 15,217Deferred gains or losses on hedges (1,993) (945) (8,758)Foreign currency translation adjustments (1,214) (9,391) (87,019)Remeasurements of defined benefit plans, net of tax 1,099 1,452 13,458Share of other comprehensive income of entitiesaccounted for using equity methodTotal other comprehensive income (5,170) (7,355) (68,155)
Comprehensive income 98,572 75,929 703,570(Comprehensive income attributable to)Comprehensive income attributable to owners of the parent 94,400 73,988 685,583Comprehensive income attributable to non-controlling interests 4,172 1,941 17,987
Results for the first three quarters (Jan.1-Sep.30)
(114) (1,053)(48)
2018 2019 2019
11

(Reference)SEGMENT INFORMATION Imformation about sales and operating income :
9 Months ended September 30, 2018 Millions of yen
Petrochemicals Chemicals Electronics Inorganics Aluminum Others Elimination ConsolidatedSalesOutside customers・・・・・・・・・・・・・・・・・・ ¥183,948 ¥102,314 ¥84,060 ¥185,847 ¥74,230 ¥94,539 \- ¥724,938Inter-segment・・・・・・・・・・・・・・・・・・・・・ 7,674 12,759 1,280 6,304 6,830 7,147 (41,995) -Total・・・・・・・・・・・・・・・・・・・・・・・・・・・・ 191,622 115,073 85,340 192,151 81,060 101,686 (41,995) 724,938Operating income (loss)・・・・・・・・・・・・・・ ¥15,480 ¥12,608 ¥10,829 ¥97,885 ¥4,039 ¥1,362 (¥7,707) ¥134,495
9 Months ended September 30, 2019 Millions of yen
Petrochemicals Chemicals Electronics Inorganics Aluminum Others Elimination ConsolidatedSalesOutside customers・・・・・・・・・・・・・・・・・・ ¥182,026 ¥102,574 ¥69,503 ¥184,516 ¥68,269 ¥88,687 \- ¥695,575Inter-segment・・・・・・・・・・・・・・・・・・・・・ 7,552 13,003 517 5,603 5,429 7,143 (39,247) -Total・・・・・・・・・・・・・・・・・・・・・・・・・・・・ 189,578 115,577 70,020 190,119 73,698 95,830 (39,247) 695,575Operating income (loss)・・・・・・・・・・・・・・ ¥13,279 ¥9,514 ¥2,981 ¥84,902 ¥1,424 ¥937 (¥3,725) ¥109,313
9 Months ended September 30, 2019 Thousands of U.S. dollars
Petrochemicals Chemicals Electronics Inorganics Aluminum Others Elimination ConsolidatedSalesOutside customers・・・・・・・・・・・・・・・・・・ $1,686,675 $950,468 $644,020 $1,709,744 $632,592 $821,785 $- $6,445,284Inter-segment・・・・・・・・・・・・・・・・・・・・・ 69,978 120,486 4,791 51,918 50,306 66,189 (363,668) -Total・・・・・・・・・・・・・・・・・・・・・・・・・・・・ 1,756,653 1,070,954 648,811 1,761,662 682,898 887,974 (363,668) 6,445,284Operating income (loss)・・・・・・・・・・・・・・ $123,042 $88,161 $27,627 $786,717 $13,191 $8,684 ($34,514) $1,012,908
12