Embed Size (px)
Citation preview
SHO
WA
DEN
KO K.K. A
NN
UA
L REPORT 2016
Showa Denko K.K. Annual Report 2016

ProfileRanking as one of Japan’s leading chemical companies, Showa Denko K.K. (SDK) operates in the six major segments of petrochemicals, chemicals, electronics, inorganics, aluminum, and others.
The Showa Denko Group initiated in its medium-term consolidated business plan “Project 2020+” in 2016. Under this new business plan, the Group will expand and strengthen its “individualized businesses,” which are expected to maintain their high-level profitability and stability, and promote these businesses in the global market. The Group will enhance its capability to resist fluctuations in market prices by providing customers with attractive products and services. Moreover, the Group will reform its business model, and improve its existing businesses’ earning power. Thus, the Group will enhance its corporate value.
In the business portfolio we aim to realize under “Project 2020+,” we classified our businesses into four categories: “Growth-accelerating,” “Advantage-establishing,” “Base-shaping,” and “Rebuilding.” We defined missions for each business category in order to strengthen our businesses.
In addition, aiming to promote globalization of our business activities and expand our “individualized businesses” further, we will implement strategic capital investment in the growing Asian/ASEAN market, and also pursue growth opportunities in developed countries in Europe and North America.
Concerning our businesses classified as “Growth-accelerating,” we decided to strengthen our business in high-purity gases by establishing a joint corporation in South Korea to produce and sell high-purity monofluoromethane gas (CH3F). As for our aluminum can business, we installed a new line to produce sleek cans at our production base in Vietnam.
We will further strengthen the earning power of our existing businesses by reforming business models, and also promote M&A and business alliances with other companies aiming to introduce new growth businesses from outside entities.
Showa Denko aims to earn the full trust and confidence of the market and society, always managing operations based on the principles of corporate social responsibility. The Company is also committed to the principles of Responsible Care and is vigorously carrying out an action plan to protect the environment as well as health and safety.
Forward-Looking Statements:This annual report contains statements relating to management’s projections of future profits, the possible achievement of the Company’s financial goals and objectives, and management’s expectations for the Company’s product development program. The Company cannot guarantee that these expectations and projections will be realized or correct. Actual results may differ materially from the results anticipated in the statements included herein due to a variety of factors, including, but not limited to, the economic conditions, costs of naphtha and other raw materials, demand for our products, market conditions, and foreign exchange rates. The timely commercialization of products under development by the Company may be disrupted or delayed by a variety of factors, including market acceptance, the introduction of new products by competitors, and changes in regulations or laws. The foregoing list of factors is not inclusive. We undertake no obligation to update the forward-looking statements unless required by law. Any projections or forecasts in this annual report do not include the effect of planned integration of graphite electrode businesses of SDK and SGL GE, which we announced in October 2016, because the date of business integration has not been specified yet as of the date of publication of this report.
PetrochemicalsOlefins (ethylene and propylene), polymer (polypropylene), and organic chemicals (vinyl acetate monomer, ethyl acetate, and allyl alcohol)
ChemicalsFunctional chemicals (polymer emulsion and unsaturated polyester resin), industrial gases (liquefied carbon dioxide, dry ice, oxygen, nitrogen, and hydrogen), basic chemicals (liquefied ammonia, acrylonitrile, and chloroprene rubber), and electronic chemicals (high-purity gases for electronics)
ElectronicsHard disks (HDs), compound semiconductors (LED chips), and rare earth magnetic alloys
InorganicsGraphite electrodes and ceramics (alumina and abrasives)
AluminumRolled products (high-purity foils for capacitors), specialty components (cylinders for laser beam printers [LBPs], forged products, and heat exchangers), and beverage cans
OthersLithium-ion battery (LIB) materials, building products, and general trading
26.0%
18.8%
14.4%
7.1%
13.8%
19.9%
¥671.2billion
Net sales 2016
Note: The ratios of respective segments have been calculated after adding the amount of adjustments to net sales.
Our VisionWe at the Showa Denko Group will provide products and services that are useful and safe and exceed our customers’ expectations, thereby enhancing the value of the Group, giving satisfaction to our shareholders, and contributing to the sound growth of international society as a responsible corporate citizen.
Showa Denko at a Glance
See pages 6-7 for segment performances.

Global positions are Showa Denko estimates.
1 2 3 4 5 6 7
Contents
Our StrengthsShowa Denko has many products maintaining high market shares in the world. Let us introduce products of high priority in our business portfolio designed under the medium-term business plan “Project 2020+.”
Aluminum laminated film for LIB packaging
SiC epitaxial wafers for power devices
High-purity gases for electronics
Aluminum cans
HD media Graphite electrodes
High-purity aluminum foil for capacitors
The second largest manufacturer in the worldWe provide packaging materials for pouch- type lithium ion batteries (LIBs) used in smartphones and tablet PCs. Demand for pouch-type LIBs is growing due to such advantages as high levels of heat dissipation and flexibility in molding.
The second largest independent manufacturer in the worldWe have been contributing to the commercialization and market expansion of “full SiC” power modules through production of high-grade SiC epi-wafers for power transistors since 2015, in addition to those for diodes. SiC-based power devices are attracting attention due to their features that enable production of smaller, lighter, and more energy-efficient next-generation power control modules.
The world’s largest manufacturer of specialty gases like NH3, Cl2, HBr, C4F6, etc.High-purity gases for electronics are used as etching and cleaning gases, and materials for membrane formation, which are necessary for production of electronic devices including semiconductors, LCD panels, and solar batteries.
The second largest manufacturer in Vietnam and the fourth largest in JapanSince 1971, we have been operating our aluminum can business as a pioneer who produced the first aluminum can for beverages in Japan. In 2014, we acquired the largest can manufacturer in northern Vietnam, aiming to expand our aluminum can business in the ASEAN region, with a focus on the Vietnamese market where rapid market expansion for cans of beer is expected due to population growth and the rise in the standard of living.
The world’s largest independent manufacturerHD media, one of the major parts of HD drives, are used in notebook PCs, consumer electronics, and external hard disk drives. Demand is expected to grow further for use in servers for cloud computing.
The world’s leading manufacturer of large-diameter (30- and 32-inch) graphite electrodes We are a representative manufacturer in Asia of graphite electrodes used in electric arc furnaces for steel production. In terms of large-diameter electrodes of 30 inches or more, we are the leading company in the world.
The world’s largest manufacturerWe provide high-purity aluminum foil for aluminum electrolytic capacitors, which are widely used in air conditioners, automotive parts, and solar power generation. Our proprietary manufacturing process has enabled us to realize high productivity and quality.
Advantage-establishing
Base-shaping
Growth-accelerating
1 2 3 4
5 6 7
1 Our Strengths2 Consolidated Five-Year Summary4 Message from the Management
Segment PerformanceNew Medium-Term Business Plan: "Project 2020+"
12 Management Team14 Corporate Governance16 Research and Development18 Corporate Social Responsibility Activities19 Management’s Discussion and Analysis
22 Financial Data44 Corporate Data
No.2No.2 No.1 No.2
No.1 No.1 No.1
1

Financial Highlights
Showa Denko K.K. and Consolidated Subsidiaries Millions of yen Thousands of U.S. dollars (Note 1)
December 31 2012 2013 2014 2015 2016 2016
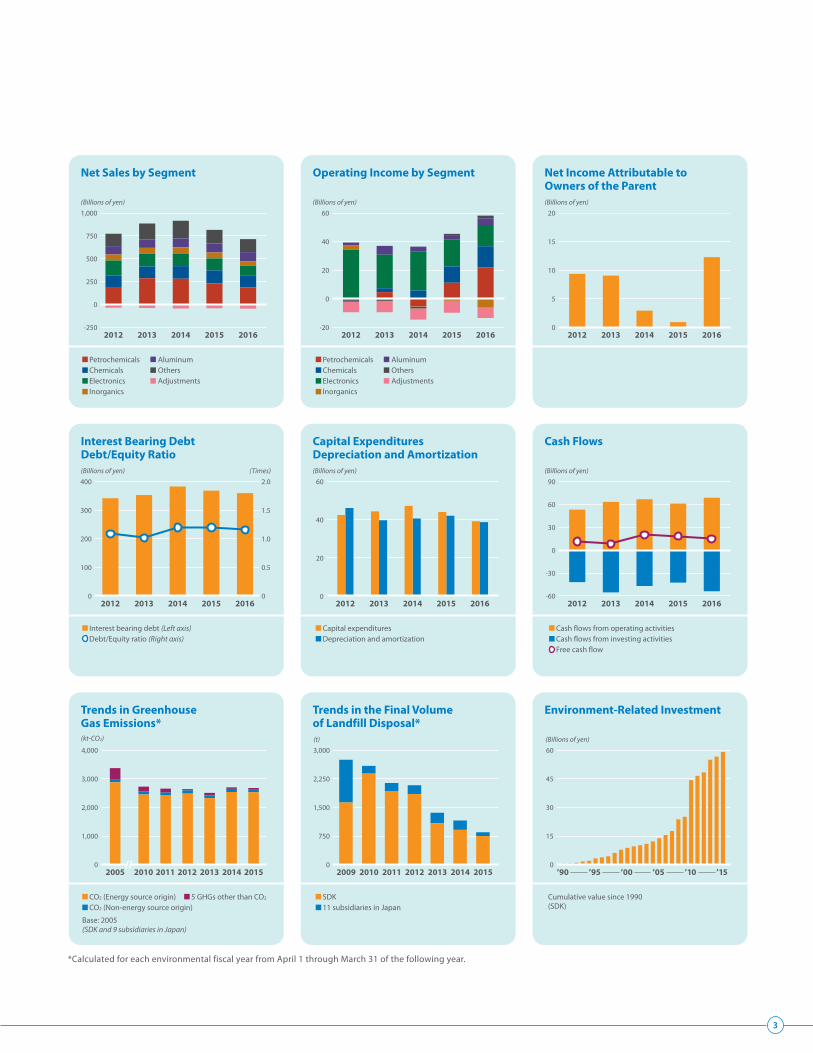
For the yearNet sales ¥ 739,675 ¥ 847,803 ¥ 872,785 ¥ 775,732 ¥ 671,159 $ 5,761,512
Petrochemicals 190,939 286,732 281,400 231,288 185,783 1,594,841Chemicals 127,252 130,402 138,695 142,292 134,529 1,154,854Electronics 163,306 136,548 138,537 131,492 103,339 887,105Inorganics 65,573 65,919 67,557 63,476 50,870 436,688Aluminum 92,194 90,369 97,946 100,756 98,575 846,211Others 135,280 176,516 191,610 147,233 142,364 1,222,110Adjustments (34,870) (38,684) (42,959) (40,805) (44,301) (380,296)
Operating income 28,108 25,953 20,551 33,508 42,053 361,005Net income attributable to owners of the parent 9,368 9,065 2,929 921 12,305 105,629Net cash provided by operating activities 53,310 63,565 66,996 61,170 68,949 591,891Net cash provided by (used in) investing activities (41,741) (55,203) (46,876) (42,497) (53,754) (461,449)Free cash flow 11,569 8,362 20,120 18,674 15,195 130,442R&D expenditures 20,633 20,435 20,362 20,289 17,313 148,625Capital expenditures 42,503 44,370 47,318 44,059 39,276 337,158Depreciation and amortization 46,232 39,779 40,673 42,137 38,761 332,741
At year-endTotal assets 933,162 985,771 1,009,843 940,494 932,698 8,006,676 Total net assets 314,966 345,811 319,087 308,142 311,231 2,671,739Interest bearing debt 342,262 353,686 383,124 368,835 359,929 3,089,788Debt/equity ratio (times) 1.09 1.02 1.20 1.20 1.16
Yen U.S. dollars (Note 1)
Per shareNet income — primary (Note 2) ¥ 6.26 ¥ 6.06 ¥ 1.99 ¥ 6.45 ¥ 86.27 $ 0.74 Net income — fully diluted (Note 2) — — — — — —Net assets 182.24 201.27 209.76 2,076.05 2,080.85 17.86 Cash dividends (applicable to the period) (Note 4) 3.00 3.00 3.00 3.00 — —Number of employees at year-end 9,890 10,234 10,577 10,561 10,146
The columns for 2012 to 2015 in the above table show summaries of consolidated financial statements for relevant years after amendments announced on April 25, 2017. Those amendments were made mainly to numbers related to sales and cash flows due to corrections in accounting of transactions at our consolidated subsidiaries.For details, please see http://www.sdk.co.jp/english/news/2017.html “SDK Submits Annual Securities Report and Prior-year Amendments.”Notes: 1. Yen amounts have been translated into U.S. dollars, for convenience only, at the rate of ¥116.49 to US$1.00, the approximate rate of exchange at December 31, 2016.
2. Net income per share has been computed based on the average number of shares of common stock outstanding during the respective fiscal year. Fully diluted net income per share additionally assumes the conversion of the convertible bonds. Diluted net income per share for 2015 and 2014 were not disclosed because there were no dilutive shares. Diluted net income per share for 2013 and 2012 was not disclosed because the Company had no securities with dilutive effects.
3. SDK consolidated every ten shares of its common stock into one share on July 1, 2016. “Per share” indicators for 2015 and 2016 are calculated on the basis of the number of outstanding shares after this consolidation.
4. SDK plans to resolve payment of a dividend of Yen 30.00 per share based on the record date of May 11, 2017 at the extraordinary general meeting of shareholders to be held in June 2017.
Non-Financial Highlights2011 2012 2013 2014 2015
Environmental data*Discharged amounts of greenhouse gases (kt-CO2) (Showa Denko Group) 2,695 2,509 2,679 2,681 2,683Final landfill volumes of industrial waste (t) (Showa Denko Group) 2,144 2,085 1,360 1,158 851
Social dataFrequency rate of lost-time injuries (Showa Denko Group) 0.13 0.14 0.22 0.43 0.15
*Calculated for each environmental fiscal year from April 1 through March 31 of the following year.
2 S H O W A D E N K O K . K . A N N U A L R E P O R T 2 0 1 6
Consolidated Five-Year Summary
60
40
20
0
-20
(Billions of yen)1,000
750
500
250
0
-250
(Billions of yen) (Billions of yen)
(Billions of yen) (Billions of yen) (Billions of yen)
20
15
10
5
0
400
300
200
100
0
60
40
20
0
90
60
30
0
-30
-60
PetrochemicalsChemicalsElectronicsInorganics
AluminumOthersAdjustments
PetrochemicalsChemicalsElectronicsInorganics
AluminumOthersAdjustments
Interest bearing debt (Left axis)Debt/Equity ratio (Right axis)
Capital expendituresDepreciation and amortization
Cash flows from operating activitiesCash flows from investing activitiesFree cash flow
(Billions of yen)(kt-CO2) (t)4,000
3,000
2,000
1,000
0
3,000
2,250
1,500
750
0
60
45
30
15
0
CO2 (Energy source origin)CO2 (Non-energy source origin)
5 GHGs other than CO2
Base: 2005(SDK and 9 subsidiaries in Japan)
SDK11 subsidiaries in Japan
Cumulative value since 1990(SDK)
2015 2016
Net Sales by Segment
2015 20162012 2013 2014
Operating Income by Segment
2012 2013 2014
Net Income Attributable to Owners of the Parent
2015 20162012 2013 2014
Interest Bearing DebtDebt/Equity Ratio
Capital ExpendituresDepreciation and Amortization
Cash Flows
2015 20162012 2013 2014 2015 20162012 2013 2014 2015 20162012 2013 2014
(Times)2.0
1.5
1.0
0.5
0
Trends in Greenhouse Gas Emissions*
Trends in the Final Volume of Landfill Disposal*
Environment-Related Investment
2005 2010 2011 2012 2013 2014 2015 2009 2010 2011 2012 2013 2014 2015 ’90 ’15’10’05’00’95
*Calculated for each environmental fiscal year from April 1 through March 31 of the following year.
3
Consolidated Five-Year Summary
similar problems, which are to be done by Shoko as early as possible,
recognize strengthening of group-wide risk management system
as an urgent task, and further strengthen internal control system
of the Showa Denko Group.
Business Results for 2016With regard to the Showa Denko Group’s business environment in
2016, the Japanese economy continued to gradually recover. As for
the dollar-yen exchange rates, the appreciation of the yen progressed
for quite a while. However, a relatively weak yen against the dollar
returned after the presidential election in the U.S. Exports and
production by corporations showed signs of recovery. Corporate
earnings maintained a high level, though the speed of improvement
was not fast. There was an improvement in the employment
situation, and consumer spending showed signs of recovery.
As for overseas economies, the U.S. economy continued to recover.
As for the European economy, despite some risk factors including
terrorist incidents and the United Kingdom’s decision to exit from
the European Union, there was gradual economic recovery in
Germany and the United Kingdom. Though the economies of China
and ASEAN countries showed signs of recovery, those of South Korea
and Indonesia showed signs of a slowdown during the second half
of the year. There was a business slowdown in resource-producing
countries and emerging countries, including Russia and Brazil.
In the petrochemical industry, crude oil price, which affect the
To our deep regret, we had to give up the idea of submitting
proposals related to the consolidated financial statements to the
ordinary general meeting of shareholders held in March 2017 due
to a delay in our account settlement procedures caused by the
similar delay at our consolidated subsidiary, Shoko Co., Ltd. The
delay at Shoko was caused by the emergence of the necessity for
Shoko’s Special Examination Committee to examine the details of
certain transactions between a subsidiary of Shoko and its specific
customer and whether similar transactions exist. Therefore, we
decided to forgo the appropriation of surplus based on the record
date of December 31, 2016.
In April 2017, Shoko Co., Ltd. received a report from the Special
Examination Committee. According to the report, it was necessary
to correct accounting of relevant transactions in 2016 and prior
years, and there was no similar transaction which requires correction of
accounting. Based on the report, Showa Denko announced consolidated
financial results for 2016 and corrected those for prior years. Showa
Denko also decided to convoke an extraordinary general meeting of
shareholders on June 27 based on the record date of May 11, 2017,
report on 2016 Consolidated Financial Statements to shareholders and
propose a resolution to pay a dividend of ¥30 per share.
We sincerely apologize for any inconvenience and anxiety caused
by these delays to our shareholders, investors, and other parties
concerned. We will give full support to formulation and
implementation of specific measures to prevent recurrence of
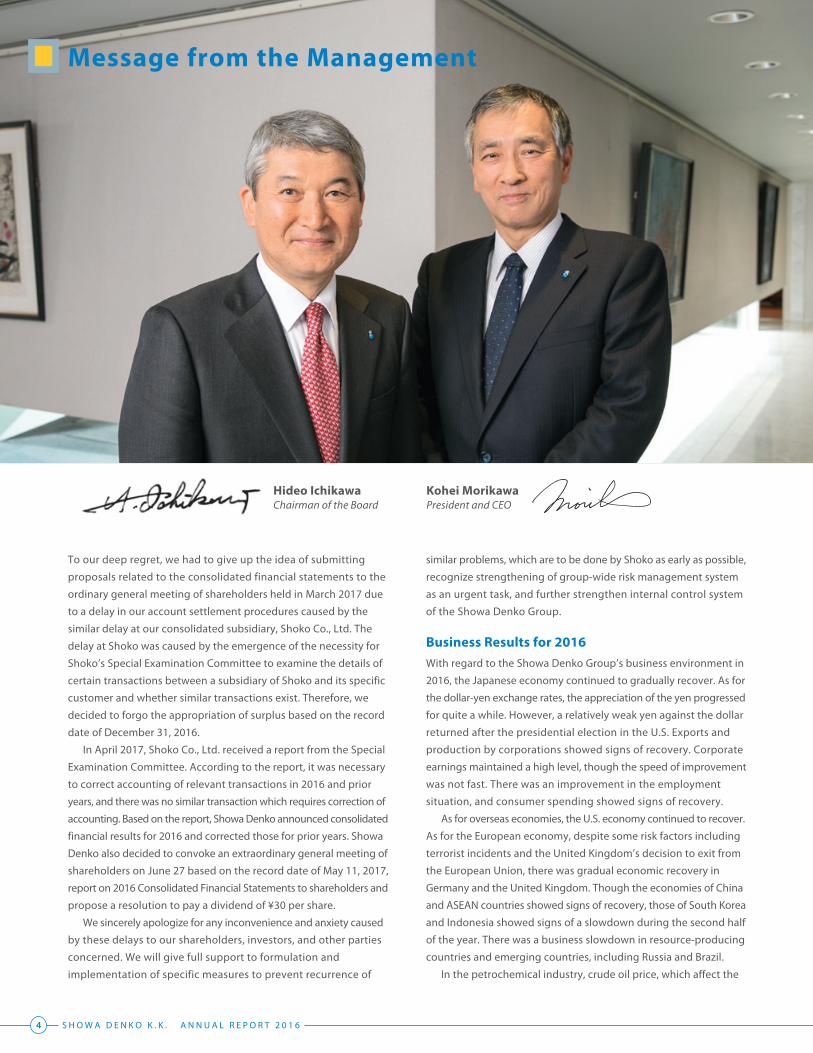
Chairman of the Board President and CEOHideo Ichikawa Kohei Morikawa
4 S H O W A D E N K O K . K . A N N U A L R E P O R T 2 0 1 6
Message from the Management

demand for and prices of products in the market, remained low.
Operating rates at domestic petrochemical plants maintained high
levels due to strong demand for petrochemical products in Asia.
In the electronic parts/materials industry, production of PCs
remained sluggish during the first half of the year. However, that
sluggishness eased in the second half of the year. Production of
semiconductors increased, especially in the second half of the
year, due to increasing demand for memory chips for smartphones
and other electronic devices.
The Showa Denko Group started its new medium-term consolidated
business plan “Project 2020+” in January 2016. Under this new business
plan, in order to achieve continuous growth of the Showa Denko
Group, we will expand and strengthen our “individualized businesses,”
reform our business structure, and strengthen our revenue base,
thereby enhancing our corporate value.
The Group recorded consolidated net sales of ¥671,159 million
in 2016, down 13.5% from the previous year. Sales decreased in all
segments, including the Petrochemicals segment where sales decreased
due to a fall in prices of products resulting from a decline in raw
naphtha price. Operating income of the Group increased 25.5%, to
¥42,053 million. The Electronics segment recorded lower income
due to lower shipment volumes of HD media. The Inorganics segment
also recorded lower income. However, the Petrochemicals segment
recorded considerably higher income due to strong demand in Asia.
The Chemicals, Aluminum, and Others segments also recorded
higher income. In comparison with the target operating income
of “Project 2020+” for 2016, which was ¥36,000 million, the Group’s
actual operating income for 2016 was higher than that mainly due
to cost reductions greater than the target figure, though the yen
was stronger than expected against the dollar. The Group recorded
net income attributable to owners of the parent of ¥12,305 million
in 2016, up 1,236.1% from the previous year due to a significant
decrease in extraordinary losses and income taxes.
Measures Taken in the First Year of “Project 2020+”In 2016, the first year of the medium-term consolidated business
plan “Project 2020+,” we took measures to promote structural
reform of the “Rebuilding businesses” including posting an
impairment loss in our aluminum specialty components business.
We also took measures to expand and strengthen “individualized
businesses” including aggressive investment in our business to
produce high-purity gases for electronics, and our aluminum can
business in Vietnam. In the “Base-shaping businesses,” which include
HD media, graphite electrodes, and petrochemicals businesses,
we took or decided on drastic measures to strengthen their
competitiveness and earning power. The details of these measures
are described on pages 9 to 11.
• Rebuilding businesses: Enforced structural reform.
We enforced structural reform in the aluminum specialty components
business, among others, by posting impairment losses.
• Base-shaping businesses: Strengthened revenue base.
Centering on HD media and graphite electrode businesses, we
streamlined production capacities and thoroughly reduced costs.
• Growth-accelerating businesses: Strengthened business activities
worldwide, centering on Asia.
In high-purity gases, aluminum can, and functional chemicals
businesses, we made capital investment at home and abroad, and
took measures to expand the market.
• Advantage-establishing businesses: Expanded production
capacities to cope with market expansion.
Increased capacities to produce LIB materials and SiC epitaxial
wafers for power devices.
While rapid economic growth in emerging countries is bringing
about a rise in the standard of living, there is a growing need for
concerted efforts to reduce impact on the global environment. We
will provide our customers with components, materials, and solutions
based on our advanced and proprietary technologies, and contribute
toward creating a society where affluence and sustainability are
harmonized. Moreover, while promoting our businesses, we will make
every effort to ensure safety in operations, promote conservation
of resources and energy, reduce the discharge of industrial waste
and chemicals, and positively contribute to the preservation of
the global environment.
On January 4, 2017, Hideo Ichikawa, the former President and
CEO, took office as Representative Director, Chairman of the Board,
and Kohei Morikawa, former Managing Corporate Officer, Chief
Technology Officer, took office as Representative Director,
President and CEO. The new management team will continue
strengthening the Group’s earning power and competitiveness
through improvement of the business structure.
We look forward to the continued support of shareholders and
all other stakeholders.
April 25, 2017
5
Message from the Management

higher than that in the same period of the previous year. Under this
market environment, sales of HD media decreased due to the decrease
in shipment volumes mentioned above and the impact of a strong
yen. Sales of rare earth magnetic alloys and compound semiconductors
also decreased. Operating income of the segment decreased 20.4%,
to ¥13,907 million due to the decrease in shipment volumes of HD
media, especially in the first half of the year, which could not be
compensated by the increase in shipment volumes in the second
half of the year. Nevertheless, operating income from HD media
business in the second half of 2016 increased from that in the same
period of the previous year due to the realization of effects of our
efforts during the first half of 2016 to streamline production capacity
and reinforce cost competitiveness of the HD media business.
In the Inorganics segment, sales decreased 19.9%, to ¥50,870 million.
Production volume of graphite electrodes increased slightly from
the previous year. However, sales of graphite electrodes decreased
due to a decline in market prices resulting from the adjustment of
production in the steel industry in Asia and the U.S. under the influence
of overproduction in China. Sales of ceramics decreased due to a
decline in shipment volumes. The segment recorded an operating
loss of ¥5,758 million, a deterioration of ¥4,510 million. However,
aiming to revitalize profitability of the graphite electrode business, the
Showa Denko Group took measures to improve cost competitiveness
of this business at its production bases in Japan and the U.S.
In the Aluminum segment, sales decreased 2.2%, to ¥98,575 million.
Production of high-purity foil for aluminum electrolytic capacitors
increased from the previous year due to an increase in production
of air conditioners and electronic parts for automobiles. Sales of
rolled products increased due partly to the increase in shipment
volumes of high-purity foil for aluminum electrolytic capacitors in
China recorded by Showa Denko Aluminum (Nantong) Co., Ltd. in
addition to the abovementioned sales increase in the domestic
market. Sales of aluminum specialty components decreased due
to a fall in aluminum metal price and lower shipment volumes for
some automotive applications. Sales of aluminum cans increased
due to higher shipment volumes recorded by Hanacans Joint Stock
Company of Vietnam. Operating income of the segment increased
72.3%, to ¥4,416 million due to an increase in shipment volumes of
rolled products and higher shipment volumes of aluminum cans
recorded by Hanacans.
In the Petrochemicals segment, sales decreased 19.7%, to ¥185,783
million. Production of ethylene and propylene decreased slightly
from the previous year due to coinciding shutdowns of plants to
produce derivatives for periodic maintenance at Oita Complex.
Sales of olefins decreased due to a decline in prices of products
caused by a drop in the raw naphtha price, despite strong demand
for olefins in the Asian market. Sales of organic chemicals also
decreased due to a fall in sales prices of vinyl acetate and ethyl
acetate resulting from a decline in prices of raw materials. Operating
income of the segment significantly increased to ¥20,690 million,
up 96.2% due to a decline in prices of raw materials and continued
high operating rates in olefins and organic chemicals businesses in
response to strong demand in the Asian market.
In the Chemicals segment, sales decreased 5.5%, to ¥134,529 million.
Production of liquefied ammonia and high-purity gases for electronics
increased from the previous year. Sales of electronic chemicals
increased slightly due to continued high-level shipment volumes,
despite the impact of a strong yen. Sales of industrial gases increased
slightly. On the other hand, sales of basic chemicals decreased,
due partly to a decline in sales prices of some products including
acrylonitrile following a fall in raw material prices, despite continuing
high shipment volumes of products. Sales of functional chemicals
decreased due to the transfer of our phenolic resin business to
another company, which took place in the second half of the previous
year. Operating income from basic chemicals business increased
due to a reduction in costs of materials resulting partly from an
increase in the ratio of recycled plastics among raw materials to
produce ammonia. Operating income from industrial gases and
functional chemicals businesses also increased, while that from
electronic chemicals business decreased due to a strong yen. Overall,
operating income of the segment rose 29.1%, to ¥13,824 million.
In the Electronics segment, sales decreased 21.4%, to ¥103,339 million.
Production of HD media in 2016 decreased from the previous year
due to a decrease in shipment volumes of media for PCs, which
could not be compensated by the increase in shipment volumes of
media for servers. However, shipment volumes of HD media for
PCs in the second half of the year recovered from the level of the
first half of the year, and that in the fourth quarter of 2016 was
Segment Performances
Petrochemicals Segment
Chemicals Segment
Electronics Segment
Inorganics Segment
Aluminum Segment
6 S H O W A D E N K O K . K . A N N U A L R E P O R T 2 0 1 6
Message from the Management (cont.)

In the Others segment, sales decreased 3.3%, to ¥142,364 million.
Sales of LIB materials increased slightly due to an increase in
shipment volumes for automotive applications, in addition to
higher shipment volumes for use in smartphones. However,
Shoko Co., Ltd.’s sales decreased. Operating income of the
segment increased 33.6%, to ¥1,775 million, due partly to higher
shipment volumes of LIB materials.
(Billions of yen)
Earnings structure: Being improved to be “well balanced”
PetrochemicalsChemicalsElectronicsInorganicsAluminumOthers
70.0
60.0
50.0
40.0
30.0
20.0
10.0
0.0
-10.02011 2012 2013 2014 2015 2016 2017 2018
47.4
28.1 26.0 20.633.5
42.154.5 57.0
forecast* plan*Announced on April 25, 2017.The total does not match consolidated operating income since adjustments are not included.
As the new President and CEO of Showa Denko, I believe all employees and executives of the Showa
Denko Group must have a strong will and make unremitting efforts to realize our idea of changing the
Group’s unique characteristics into strong points and make the Group an aggregate of “individualized
businesses.” We will prepare a wide variety of growth stories of the Group, cope with changes in the
economic and business environments, and take speedy action, thereby achieving the targets we set
out in “Project 2020+.”
New Medium-Term Business Plan: “Project 2020+” (2016-2020)
Operating income margin (return)
Rate of change (risk)
Expand individualized businesses
Stabilize income Showa Denko in 2015
Improve pro�tability
Low
Hig
h
Low High
in 2025
*Businesses with sustainable high-level pro�tability and stability
Aiming to have individualized businesses* account for 50% of net sales
Individualized businesses
30%
Aiming to have overseas sales account for 60% of net sales
Overseas salesDomestic sales 40%
in 202550%
in 202560%
Numerical Targets(Billions of yen)
2015 results
2016 results
2017 forecast
2018 plan
2020 image
Net sales 775.0 671.2 745.0 855.0 930.0
Operating income 33.5 42.1 54.5 57.0 70.0
Net income*1 0.9 12.3 25.0 30.0
Free cash flow 18.7 15.2 30.0
ROA*2 3.4% 4.5% 6.0%
ROE 0.3% 4.1% 9.0%
*1 Net income attributable to owners of the parent *2 ROA: Operating income / Total assets2017 forecast was announced on April 25, 2017. 2018 plan and 2020 image were announced in December 2015.
Numerical Targets
2016results2017
forecast
Project 2020+
Operating Income
(Billions of yen)0 50
36.0Total 86.0
50.0
42.1 54.5Total
96.6
Total143.057.0
2016 2017 2018
100 150
Progress ratio68%
President and CEOKohei Morikawa
Others Segment
7
Message from the Management (cont.)

Business Strategy
• LIB materials• SiC epi-wafer for
power devices
• Rare earths• Ceramics• Aluminum specialty
components
• HD • Graphite electrodes• Petrochemicals • Basic chemicals• Industrial gases • ShoticTM
• High-purity aluminum foil
To cope with prospective market growth, establish business model with competitive advantage in terms of business and technical development.
Increase profit and cash flow by rebuilding business environment, profitability and business model.
Market and business have certain scale. Have more power to resist market fluctuation, and make stable profit and cash flow.
Actively take strategic measures.Realize rapid expansion of business
by preempting market growth.
• High-purity gases for electronics
• Functional chemicals• Aluminum cansAdvantage-
establishing
Concentrate management resources
Accelerate business reform
Rebuilding
Growth-accelerating
Base-shaping
The world economy is undergoing drastic changes
in market structure. Under the medium-term
consolidated business plan “Project 2020+,” started
in 2016, the Group will expand and strengthen its
“individualized businesses,” which are expected to
maintain their high-level profitability and stability,
and promote these businesses in the global market.
Aiming to promote expansion in overseas markets,
the Group will strive to take growth opportunities
not only in the rapidly growing Asian/ASEAN market,
but also in the markets of developed countries in
Europe and North America, and will provide
sophisticated high-performance products and
technologies. Thus, we will continue meeting customer
requirements and social needs.
Business Portfolio
For our financial strategy, we will improve the Company’s financial
standing and strengthen return to shareholders. We will aim to
generate ¥68 billion in free cash flow for the three-year period
from 2016 to 2018. We aim to lower the D/E ratio to 1.0 times by
the end of 2018. In order to further improve our financial standing,
we will not only increase our net income but also develop an index
system shared among Group companies to evaluate the efficiency
of every investment in order to make efficient use of our assets.
Though we did not
set any numerical targets
concerning return to
shareholders in the past,
this time, we have set a
target dividend payout
ratio of 30%.
Strengthen the Group strategically to achieve sustainable growthWe have designated a five-year period from 2016 to 2020 as a period
of strategic growth, aiming to maximize the operating income and
cash flow of each business. This will enable us to enhance the earning
power of our existing businesses.
Measures taken in 2016Additional measures were taken to increase the earning power of
the Group.
• Maximize operating income and cash flow
• Expand individualized businesses
• Generate research results early on
• Make the best use of M&As and partnerships with other companies
• Find growth opportunities overseas
• Concentrate management resources on R&D to strengthen existing
businesses and peripheral fields
• Create next-generation businesses/themes by making the best
use of open innovation and M&As
Boost profitability of existing businesses through renewal of business models
Expand and create individualized businesses
R&D strategy
High-purity gases for electronics: Capital investment at home and abroadFunctional chemicals: Expanded business for infrastructure and carsAluminum cans: Deeply cultivating Vietnamese market
Growth-accelerating: Deployed globally, centering on Asia
LIB materials: Expanded production capacitySiC epitaxial wafers for power devices: Started mass production of 6-inch wafers and high-quality wafers.
Advantage-establishing: Expanded capacities to meet market growth
HD media: Streamlined production capacity, Thorough cost reductionGE: Self-help cost reduction effort, Replaced hydropower plants,
Decided to acquire SGL GE Petrochemicals: Consolidated polypropylene businessShoticTM: Decided to integrate bases in Malaysia and Singapore
Base-shaping: Executed structural reforms
(Billions of yen) (times)400
350
300
250
200
2.0
1.5
1.0
0.5
0
Interest bearing debt
’15 ’16 ’17 ’18forecast plan
1.20 1.161.0
D/E ratio
8 S H O W A D E N K O K . K . A N N U A L R E P O R T 2 0 1 6
Message from the Management (cont.)

HD: Increase internal production of substrates, Increase productivity, Reduce fixed costsGE: Reduce labor and raw material costsChemicals: Improve yields, Reduce distribution costsAluminum: Improve yields, Reduce fixed costs
Aluminum cans: Expand production facilities in VietnamHigh-purity gases for electronics: Expand capacities of base in Japan and abroadFunctional chemicals: Expand business in Asia
LIB materials: Expand capacityR&D: Mass production of SiC epitaxial wafers will take off
HD: Take the lead in next-generation technologyPetrochemicals: Strengthen Oita Complex’s cooperation with surrounding facilities
Capital Investment Strategy
“Project 2020+” target: ¥30.0 billion (2016-18 accumulated)
2016-17: Total ¥27.8 billion
2017 cost reduction measures
Growth-accelerating
Advantage-establishing
Base-shaping
Base-shaping
Carry out positive and strategic investment in Growth-accelerating and Advantage-establishing businesses
Strategic investmentMaintenance investment
25%
70%
5%
Enforce investment/business management with ROIC as a guide
2016-2018Capital
investment¥130 billion
2016-2018 Depreciation¥130 billion
2016-2017 Capex planned
¥91.2 billion
Balance
Advantage-establishing
Growth-accelerating
Base-shaping & Rebuilding
Cost Reduction Strategy
Strategy for Major Businesses
We expect that demand for high-purity gases used for processing
electronic materials, including semiconductors and LEDs, will remain
strong worldwide. The market for semiconductors continues to expand,
and progress is being made in the enhancement of microscopic
and multi-layer structures in microchips. As such, consumption of
high-purity gases in production of semiconductors has been
continuously increasing. The global semiconductor market is forecast
to grow at an annual rate of about 3% until 2018. However, we expect
the global market for high-purity gases to grow at an annual rate of
about 10% during the same period, or about three times that of
the global semiconductor market. Due to this buoyant demand, we
are expanding the ratio of individualized, high-performance, and
high-value-added gas products to our overall high-purity gas
production. We will expand and strengthen our overseas outlets to
supply high-purity gases in order to maximize advantages in our
supply chain in terms of distribution, procurement, and marketing.
Thus, we aim to set the stage for further growth of our business
supplying high-purity gases for electronics.
Growth-accelerating
High-purity gases for electronics Product Use 2015 2016 2017
NH3
Film forming
Expansion (China, Taiwan)
N2OExpansion
(Japan)
HBr
Etching
Expansion (Japan)
Cl2
Expansion (Japan)
New (Taiwan)
Expansion (Japan)
Fluorine-based gases
New (Japan, Singapore)Expansion
(Japan)
InfrastructureExpansion (Taiwan,
Singapore)
New (Japan, U.S.)Expansion
(Korea)
Demand shifts from film forming gas to etching gas
Increasing demand for 3D NAND
9
Message from the Management (cont.)

The market for LIB materials is expanding for LIBs for small devices,
including smartphones, not only in developed countries but also
in emerging and developing countries. On the other hand, the
market for materials for large LIBs just started to emerge in the
fields of plug-in hybrid electric vehicles (PHEVs) and EVs. In China,
where we foresee especially strong demand for large LIBs, the
market for EVs has started to emerge as social infrastructure is
developed in response to stricter environment policies. The
lineup of the Group’s LIB materials includes anode materials,
conductivity enhancers, and aluminum laminated film for
packaging LIBs. The shipment volumes of these LIB materials
increased throughout 2016, and to cope with this increase in
demand, we started to expand our production facilities for LIB
materials. We increased production capacity for SCMG TM anode
materials, both at home and abroad. We are also developing
Si-graphite composite anode materials. We will ensure stable
supply of the VGCF TM conductivity enhancer by boosting
productivity. Furthermore, we will expand VGCF TM production
capacity to meet growing demand for large LIBs used in cars. We
will also respond to growing demand for SPALF TM aluminum
laminated film package by improving productivity. Moreover, we
will make SPALF TM highly distinctive by enhancing performance,
reducing thickness, and enhancing gas permeability.
In our business to produce aluminum cans for beverages, we have
been pursuing expansion of our business through a combination
of the domestic market, where the demand for aluminum cans is
expected to remain stable despite saturated demand for canned
beer/beer-like beverages, and the overseas market in the ASEAN
region, where demand for canned beer/beer-like beverages is rapidly
expanding. In response to the expansion of the market for canned
beer in Vietnam, where the annual growth rate exceeds 10%, we
will explore new opportunities to invest in both Hanacans Joint
Stock Company in Vietnam and in Southeast Asia.
Aluminum cans
LIB materials
2.0
1.5
1.0
0.5
0.02015 2016 2017 2018 2019
(Billion cans)Production by Hanacans of Vietnam
• Decision to establish a monofluoromethane gas JV in South Korea
In December 2016, SDK and SK Materials Co., Ltd., which is
headquartered in Yeongjyu-si, South Korea, concluded an
agreement to establish a joint corporation to produce and sell
high-purity monofluoromethane gas (CH3F) to be used in the
manufacturing process of semiconductor chips. CH3F is a specialty
gas used in manufacturing semiconductor chips for micromachining
nitride film by etching. Since CH3F’s etching selectivity is higher
than that of other industrial gases, the demand for CH3F is increasing,
especially in the field of micromachining of multi-layer structures
of 3D NAND flash. SDK will continue expanding the business to
produce and sell high-purity gases for the production of
semiconductor memory chips.
• Increasing capacity to produce high-purity boron trichloride In March 2016, SDK increased the capacity of the facilities in its
Kawasaki Plant to produce high-purity boron trichloride (BCl3),
which is a kind of high-purity gas for electronics, to 1.5 times of the
previous level and started operation of the expanded facilities.
High-purity BCI3 is a specialty gas mainly used for fine etching
aluminum circuits in the manufacturing process of LCD panels and
silicon semiconductors. In recent years, electronic material
manufacturers have been making capital investments in organic
light emitting diode (OLED) display panels and low-temperature
poly-silicon (LTPS) LCD panels, both of which are equipped with
aluminum circuits. Therefore, the demand for high-purity BCl3 gas
is expected to be stable in the future.
• Installation of a plant to produce a new grade of super-high-purity solvent, “SolfineTM”
In December 2016, SDK developed new-grade products with
enhanced high purity to be added to the lineup of its SolfineTM
series high-purity solvents and decided to install a new plant to
make the new-grade products at the Tokuyama Plant.
Commercial operation started in June 2017. SDK will offer the
new-grade super-high-purity solvents mainly as solvents for
photoresist for the manufacture of semiconductor integrated
circuits (ICs).
Advantage-establishing
10 S H O W A D E N K O K . K . A N N U A L R E P O R T 2 0 1 6
Message from the Management (cont.)

Wiesbaden
La Coruna
Steeg
Meitingen
Omachi Tokyo
Sichuan
Banting
Japan/China/Asia Paci�c
Europe/CIS/Middle East/Africa
Hickman/Ozark
Ridgeville
North/Central/South America
Head O�ce (SDK)
Plant (SDK)
Head O�ce (SGL GE)
Plant (SGL GE)
Growth in global demand for steel is expected to remain low, at
around 1% going forward, and it will take time to solve the problem
of overcapacity in the Chinese steel industry. However, we expect
a gradual recovery in demand for graphite electrodes in and after 2017,
due to definitive demand for reusing scrap steel. We will review our
production system for graphite electrodes with three production
bases located in the United States, Japan and China. In the United
States and Japan, we will rebuild optimum production systems that
correspond to the scale of demand and establish competitive cost
structures to cope with the harsh business environment. Given
these circumstances, we decided to integrate the graphite electrode
business of SGL GE Holding GmbH (SGL GE) in October 2016. We will
maintain top quality in the world and technical advantage, and pursue
cost competitiveness and synergistic effects through this acquisition.
This acquisition is subject to the approval of the relevant authorities
under the applicable competition laws of the relevant countries.
Graphite electrodes
Production bases of SDK and SGL GE
SDK’s LIB materials
SPALF TM
Al packaging film
Polysol TM
Water-based emulsion for anodes
SCMG TM
Anode materials
SDX TM
Carbon-coated Al foilsVGCF TM
Additive in anodes/cathodes
Base-shaping
11
Message from the Management (cont.)

KOHEI MORIKAWA Representative Director, President April 1982 Joined the Company January 2013 Corporate Officer; General Manager,
Electronic Chemicals Division January 2016 Managing Corporate Officer;
Chief Technology Officer (CTO)March 2016 Director; Managing Corporate Officer,
in charge of Electronics Chemicals and Functional Chemicals divisions, Business Development Center, Isesaki and Tatsuno plants, and Corporate R&D Department; Chief Technology Officer (CTO)
January 2017 President and Chief Executive Officer (CEO)
JUN TANAKA
April 1982 Joined the CompanyJanuary 2013 Corporate Officer; General Manager,
Advanced Battery Materials DepartmentJanuary 2017 Managing Corporate Officer;
Chief Technology Officer (CTO)March 2017 Director; Managing Corporate Officer,
in charge of Electronics Chemicals and Functional Chemicals divisions, Business Development Center, Isesaki and Tatsuno plants, and Corporate R&D Department; Chief Technology Officer (CTO)
HIDEO ICHIKAWA Representative Director, chairman of the Board
April 1975 Joined the Company January 2006 Corporate Officer; General Manager,
Corporate Strategy Office March 2008 Director; Corporate Officer;
General Manager, Corporate Strategy Office September 2008 Director; Corporate Officer;
Executive Officer, HD Sector January 2010 Director; Managing Corporate Officer;
Executive Officer, HD Sector January 2011 President and Chief Executive Officer (CEO)January 2017 Chairman of the Board
TOSHIHARU KATO
April 1981 Joined Showa Aluminum CorporationMarch 2001 Joined the CompanyJanuary 2016 Corporate Officer; General Manager, Finance
& Accounting DepartmentJanuary 2017 Corporate Officer; Chief Financial Officer (CFO)March 2017 Director; Corporate Officer,
in charge of Information Systems Department; General Manager, Finance & Accounting Department; Chief Financial Officer (CFO)
TOMOFUMI AKIYAMA Outside Member
April 1959 Joined Fukoku Mutual Life Insurance Company July 1998 President, Fukoku Mutual Life Insurance Company March 2008 Director, of the Company (incumbent) July 2010 Chairman, Fukoku Mutual Life Insurance Company
AKIYOSHI MORITA Outside Member
April 1967 Joined Toyota Motor Co., Ltd. (currently Toyota Motor Corporation) June 1999 Senior Managing Director, Toyota Motor Corporation June 2000 Executive Vice President, Aichi Steel Corporation June 2004 President, Aichi Steel Corporation June 2008 Chairman, Aichi Steel Corporation June 2011 Advisor, Aichi Steel Corporation March 2012 Director, of the Company (incumbent) June 2015 Counselor, Aichi Steel Corporation
HIDEHITO TAKAHASHI
April 1986 Joined The Mitsubishi Bank, Ltd. (currently The Bank of Tokyo-Mitsubishi UFJ, Ltd.)
February 2002 Joined GE Japan Holding CorporationJanuary 2013 President and CEO, GKN Driveline Japan plcOctober 2015 Joined the Company, Senior Corporate Fellow,
Assistant to PresidentJanuary 2016 Corporate Officer; General Manager,
Corporate Strategy DepartmentJanuary 2017 Managing Corporate OfficerMarch 2017 Director; Managing Corporate Officer,
in charge of Ceramics and Carbon divisions, Omachi Plant and Corporate Strategy Department
KEIICHI KAMIGUCHI
April 1983 Joined the CompanyJanuary 2011 Corporate Officer; General Manager,
Corporate Strategy Office
January 2015 Corporate Officer, in charge of Industrial Gases and Basic Chemicals divisions, Kawasaki and Higashinagahara plants
January 2017 Corporate Officer; Chief Risk Management Officer (CRO)
March 2017 Director; Corporate Officer, in charge of Internal Audit, Legal & Intellectual Property, General Affairs & Human Resources and Purchasing & SCM departments; Chief Risk Management Officer (CRO)
MASAHARU OSHIMA Outside Member
April 1974 Joined Nippon Telegraph and Telephone Public Corporation (currently Nippon Telegraph and Telephone Corporation)
November 1995 Professor, Applied Chemistry Department, Graduate School of Engineering, The University of Tokyo
April 2006 Director, Synchrotron Radiation Research Organization, The University of Tokyo October 2009 Chairman, The Japanese Society for Synchrotron Radiation Research April 2013 Project Professor, Synchrotron Radiation Research Organization,
The University of Tokyo May 2013 Chairman, The Surface Science Society of Japan June 2013 Emeritus Professor, The University of Tokyo (incumbent) April 2014 Project Researcher, Synchrotron Radiation Research Organization,
The University of Tokyo (incumbent) March 2015 Director, of the Company (incumbent) April 2015 Special Professor, Tokyo City University
From top left to bottom right: Akiyoshi Morita, Toshiharu Kato, Keiichi Kamiguchi, Tomofumi Akiyama, Masaharu Oshima, Jun Tanaka, Hideo Ichikawa, Kohei Morikawa, Hidehito Takahashi
Directors
12 S H O W A D E N K O K . K . A N N U A L R E P O R T 2 0 1 6
Management Team as of March 30, 2017

Chief Executive Officer
KOHEI MORIKAWA
Senior Managing Corporate Officer
JIRO ISHIKAWAGeneral Manager, HD Division; Officer in charge of Electronics Materials and Advanced Battery Materials divisions
Managing Corporate Officers
TATSUHARU ARAIGeneral Manager, Petrochemicals Division; Officer in charge of Oita Complex
JUN TANAKAChief Technical Officer (CTO); Officer in charge of Electronic Chemicals and Functional Chemicals divisions, Business Development Center, Isesaki and Tatsuno plants, and Corporate R&D Department
HIDEHITO TAKAHASHIOfficer in charge of Ceramics and Carbon divisions, Omachi Plant, and Corporate Strategy Department
Corporate Officers
ROBERT C. WHITTENAssistant to President in charge of the Carbons Business Integration Promotion Team
KEIICHI KAMIGUCHIChief Risk Management Officer (CRO); Officer in charge of Internal Audit, Legal & Intellectual Property, General Affairs & Human Resources, and Purchasing & SCM departments
AKIRA KOINUMA
April 1975 Joined the Company January 2008 Corporate Officer; Deputy Executive Officer, Technology Headquarters January 2010 Corporate Officer; Executive Officer, Production Technology Headquarters March 2011 Director; Corporate Officer; Executive Officer,
Production Technology Headquarters
January 2012 Director; Managing Corporate Officer; Executive Officer, Production Technology Headquarters
January 2013 Director; Managing Corporate Officer January 2015 Director; Senior Managing Corporate Officer, in charge of Production Technology,
Energy & Electricity, SPS Innovation, and CSR departments; Chief Technology Officer (CTO)
March 2016 Audit & Supervisory Board Member
HIROYUKI TEZUKA Outside Member
April 1986 Registered with Dai-ichi Tokyo Bar Association Joined Nishimura & Sanada Law Offices (currently Nishimura & Asahi)
September 1992 Clearly, Gottlieb, Steen & Hamilton, New York January 1993 Admitted to the bar of the State of New York June 1993 Returned to Nishimura & Sanada Law Offices (currently Nishimura & Asahi) as
Partner (incumbent) March 2008 Audit & Supervisory Board Member, of the Company
KIYOMI SAITO Outside Member
April 1973 Joined Nikkei Inc. September 1975 Joined Sony Corporation August 1984 Joined Morgan Stanley investment bank January 1990 Executive Director, Morgan Stanley investment bank April 2000 President, JBond Co., Ltd. (currently JBond Totan Securities Co., Ltd.) (incumbent) April 2011 President, The Totan Information Technology Co., Ltd. March 2012 Audit & Supervisory Board Member, of the Company
YUKIO OBARA Outside Member
July 1969 Joined The Fuji Bank, Limited (currently Mizuho Bank, Limited)March 2003 Deputy President, Mizuho Bank, Ltd.June 2004 Corporate Auditor, Mizuho Financial Group, Inc.June 2005 President & CEO, Mizuho Information & Research Institute, Inc.March 2010 Chairman of the Board, Shoei Co., Ltd.March 2010 Audit & Supervisory Board Member, of the Company
KANJI TAKASAKIOfficer in charge of Aluminum Rolled Products, Aluminum Specialty Components,and Aluminum Can divisions, Oyama and Kitakata plants
YOUICHI TAKEUCHIOita Complex Representative
TAKAYUKI SATOGeneral Manager, Electronics Materials Division; Officer in charge of Chichibu Plant
MOTOHIRO TAKEUCHIGeneral Manager, Corporate Strategy Department
TAICHI NAGAIOfficer in charge of Production Technology, Energy & Electricity, and CSR departments
KOICHI NISHIMURAGeneral Manager, Industrial Gas Division; Officer in charge of Basic Chemicals Division and Kawasaki and Higashinagahara plants
TOSHIHARU KATOChief Financial Officer (CFO); General Manager, Finance & Accounting Department;Officer in charge of Information Systems Department
MASAMICHI YAGISHITAGeneral Manager, Electronic Chemicals Division; Officer in charge of Tokuyama Plant
MASUNORI KAIHOGeneral Manager, Kawasaki Plant
HIROSHI DAIOGeneral Manager, Ceramics Division; Officer in charge of Yokohama and Shiojiri plants
TAKUJI YAMAMOTOGeneral Manager, Production Technology Department;Officer in charge of SPS Innovation Department
MASAO SHIBUYAGeneral Manager, Advanced Battery Materials Division
AKIHIRO JIMBOGeneral Manager, Basic Chemicals Division
TESTUO WADAGeneral Manager, Business Development Center
Senior Corporate Fellows
HIROSHI SAKAIGeneral Manager, Technology Development Control Department, HD Division
YOSHIYUKI NISHIMURAAssistant to President in charge of market development for electronics and battery materials
TETSU MORIKIGeneral Manager, Legal & Intellectual Property Department
Saburo Muto, Yukio Obara, Akira Koinuma, Kiyomi Saito, Hiroyuki Tezuka
Audit & Supervisory Board Members
Corporate Officers and Senior Corporate Fellows
SABURO MUTO
April 1976 Joined the Company January 2011 Corporate Officer; General Manager, Finance Office January 2013 Corporate Officer; General Manager, Finance & Accounting Department January 2014 Chief Financial Officer (CFO)March 2014 Director; Corporate Officer; General Manager, Finance & Accounting Department August 2014 Director; Corporate Officer January 2015 Director; Managing Corporate Officer, in charge of Finance & Accounting and
Information Systems departments; Chief Financial Officer (CFO)March 2017 Audit & Supervisory Board Member
13
Company’s Articles of Incorporation as well as important matters for the execution of the Company’s operations, ensuring a speedy and vigorous decision-making process. We appoint directors from the viewpoint of strengthening corporate governance, aiming to strengthen the Board of Directors’ supervisory functions and ensure the propriety of the decision-making process. We make sure that corporate officers whose duties are primarily business execution will not concurrently serve as directors, in principle. Furthermore, we have abolished the positions of managing directors and senior managing directors to put all directors (except for the Chairman, the President, and the Executive Vice President) on an equal footing, while strengthening the supervision by Audit & Supervisory Board members (including outside members) and mutual supervision among directors. The term of office of directors has been shortened to one year to ensure a quick response to changes in the business environment and to clarify the management responsibility of directors. At the Company’s ordinary general meeting of shareholders held on March 30, 2017, nine directors, including three outside directors, were appointed.
3. Condition of Business Execution The Management Committee, which meets once a week in principle and is chaired by the President, deliberates and decides on matters to be referred to the Board of Directors’ meetings and important matters pertaining to the overall management of the Company. The decisions are made after deliberations on two occasions. As for investment plans, their risks are examined by task teams before referral to the Management Committee, and their progress is monitored after authorization. The Company’s medium-term business plans are decided not only by the Management Committee but also by the participation of all corporate officers.
The Company considers that responsible execution forms the basis of corporate activities. The Company evaluates performances of respective business segments to ensure the effective implementation of the performance-based evaluation system. The Company has Security Export Control and Safety Measures committees under the CSR Committee chaired by the President. The Company also has Responsible Care, Risk Management, Human Rights/Corporate Ethics, and IR promotion councils. These committees and councils investigate, study, and deliberate on specific matters important for the execution of businesses.
1. Basic Concept regarding Corporate GovernanceWe will promote corporate governance to ensure the soundness, effectiveness, and transparency of management, and to continue enhancing our corporate value, thereby contributing to the sound growth of society and earning its full trust and confidence. To that end, it is essential for us to strengthen relations with our stakeholders, including shareholders, customers, suppliers, community residents, and employees. Based on the above, we have clarified our mission in the form of the Group’s vision, as stated below, and we are working hard to realize this vision.
VISIONWe at the Showa Denko Group will provide products and services that are useful and safe and exceed our customers’ expectations, thereby enhancing the value of the Group, giving satisfaction to our shareholders, and contributing to the sound growth of international society as a responsible corporate citizen.* Please visit our website (URL: http://www.sdk.co.jp/english/about/governance.html) for
our “Corporate Governance Basic Policies” (established in December 2015).
2. Condition of the Company’s Supervisory and Decision-Making Functions
We have adopted the Audit & Supervisory Board system to enhance the fairness and transparency of management, ensuring efficient management of the Company. To clearly separate management supervisory functions from business execution functions, we have introduced the corporate officer system. The top management team, consisting of the President and corporate officers in charge of respective operations, is working to increase the speed of decision making and vitalize operations. Meanwhile, the Company has substantially reduced the number of directors. In addition, we have strengthened the supervisory functions by appointing outside directors. In order to strengthen independence and objectivity of the function of the Board of Directors, and accountability of the Board of Directors, the Company has established the Nomination Advisory Committee and the Remuneration Advisory Committee as advisory bodies to the Board of Directors, while the majority of each Committee consists of independent outside directors and outside members of the Audit & Supervisory Board. At Board meetings held once or twice a month, the Board decides the Company’s basic policy and decides, after full deliberation, on matters provided for in the Companies Act and the
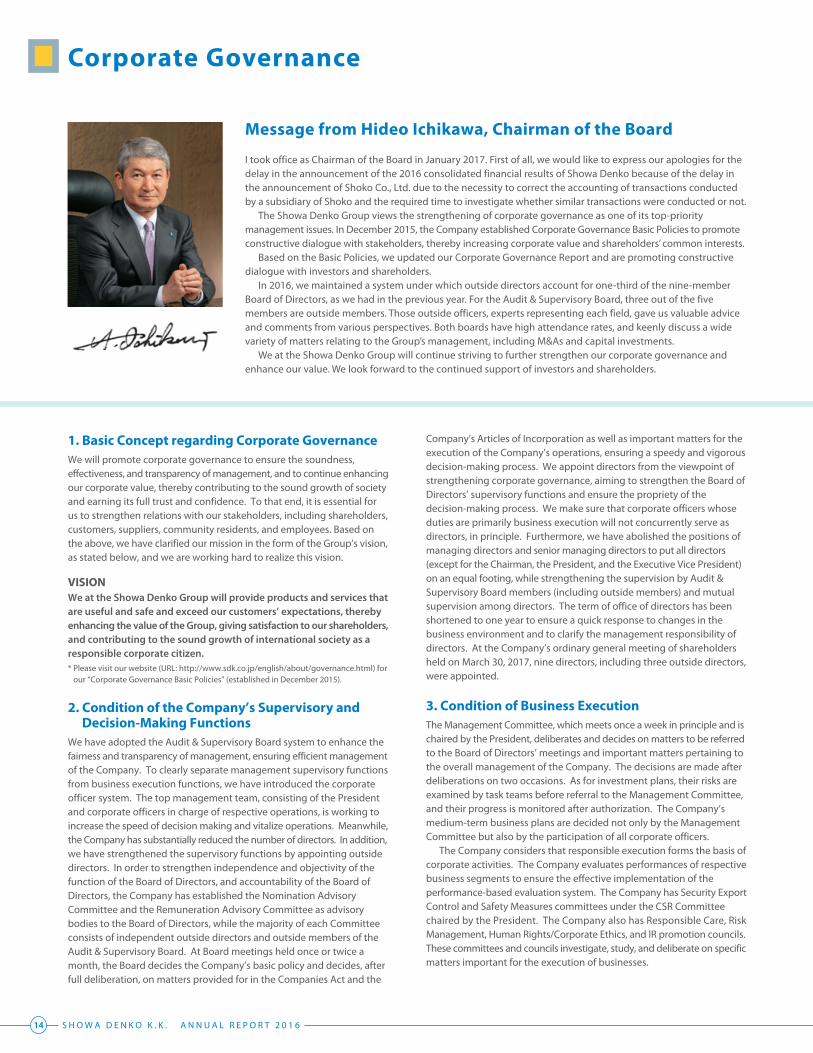
Message from Hideo Ichikawa, Chairman of the Board
I took office as Chairman of the Board in January 2017. First of all, we would like to express our apologies for the delay in the announcement of the 2016 consolidated financial results of Showa Denko because of the delay in the announcement of Shoko Co., Ltd. due to the necessity to correct the accounting of transactions conducted by a subsidiary of Shoko and the required time to investigate whether similar transactions were conducted or not.
The Showa Denko Group views the strengthening of corporate governance as one of its top-priority management issues. In December 2015, the Company established Corporate Governance Basic Policies to promote constructive dialogue with stakeholders, thereby increasing corporate value and shareholders’ common interests.
Based on the Basic Policies, we updated our Corporate Governance Report and are promoting constructive dialogue with investors and shareholders.
In 2016, we maintained a system under which outside directors account for one-third of the nine-member Board of Directors, as we had in the previous year. For the Audit & Supervisory Board, three out of the five members are outside members. Those outside officers, experts representing each field, gave us valuable advice and comments from various perspectives. Both boards have high attendance rates, and keenly discuss a wide variety of matters relating to the Group’s management, including M&As and capital investments.
We at the Showa Denko Group will continue striving to further strengthen our corporate governance and enhance our value. We look forward to the continued support of investors and shareholders.
14 S H O W A D E N K O K . K . A N N U A L R E P O R T 2 0 1 6
Corporate Governance

persons, the decision whether to sell the Company’s shares in response to such a proposal shall eventually be made based on the opinion of the shareholders, which is reached after being given the sufficient information necessary for making an appropriate decision and sufficient time for consideration.
In light of the basic policy stated above, the Company introduced and renewed the “Reaction Policy on Large-scale Purchases of the Company’s Stock Certificates (Takeover Defense),” aimed at preventing inappropriate persons from controlling its financial and business policy decisions. However, the Company decided not to renew the term of validity of this Takeover Defense at its Board of Directors’ meeting held on March 6, 2017, and the Takeover Defense was repealed at the close of the Company’s ordinary general meeting of shareholders held on March 30, 2017 due to the expiration of the validity period.
7. OtherRemuneration, etc., to the members of the Board of Directors and the Audit & Supervisory Board as well as the auditing corporation (for the period from January 1 through December 31, 2016) is as follows:
Remuneration, etc., to the board membersNumber of
applicable persons Paid amount
Members of the Board of Directors (excluding outside members) 7 ¥218 million
Members of the Audit & Supervisory Board (excluding outside members) 3 ¥ 56 million
Outside board members 6 ¥ 68 million
Total 16 ¥342 million
Remuneration to the auditing corporationPaid amount
Name of accounting auditor: KPMG AZSA LLC Remuneration for the issuance of auditing certification based on the auditing contract
¥205 million
8. Personal/Financial Relations and Interests between the Company and Outside Board Members
The Company has three outside members each for its Board of Directors and the Audit & Supervisory Board. None of them has special interests in the Company. An outline of the Company’s corporate governance system is shown below.
4. Condition of Audit & Supervisory Functions The Company’s Audit & Supervisory Board consists of five members, including three outside members. The members attend the Board of Directors’ meetings and other important internal meetings, offering opinions as necessary. They audit and supervise the execution of operations through such means as field investigations, hearing sessions, and reading important documents, making proposals and providing advice and recommendations to ensure the sound management of the Company. They are working to strengthen the consolidated audit & supervisory board system in cooperation with auditors of major associated companies.
We have a department for internal audit reporting directly to the President. The Internal Audit Department investigates the overall execution of business, checking for accuracy, propriety, and efficiency. It also investigates the management policies, business plans, and their execution, checking for consistency and soundness. The results of internal auditing are reported to the members of the Audit & Supervisory Board to ensure consistency with their audits.
For matters relating to the environment and safety, the respective divisions in charge conduct Responsible Care audits. KPMG AZSA LLC conducts auditing of the Company based on an auditing contract and an annual plan agreed upon with the Audit & Supervisory Board, and provides the board with audit results. The auditing corporation and the Audit & Supervisory Board exchange information and views from time to time to strengthen their cooperation.
5. Compliance and Risk ManagementThe Company’s Board of Directors has decided to strengthen compliance and promote risk management as key components of the internal control system. The Board will continue to work on these issues.
For the details of our policies on compliance and risk management, please visit our websites:http://www.sdk.co.jp/english/csr/risk_management.htmlhttp://www.sdk.co.jp/english/csr/compliance.html
6. Reaction Policy on Large-Scale Purchases of the Company’s Stock Certificates, etc.
The Company believes that the shareholders should be determined through the free movement of the shares in the market. Although proposals regarding the large-scale purchases of the Company’s shares are made by specific
Shareholders’ Meeting
Decision Making and Supervision
Auditing
Execution of Duty
Board of DirectorsNomination Advisory Committee
Responsible Care Promotion Council
Risk Management Promotion Council
Human Rights/Corporate Ethics Promotion Council
IR Promotion Council
Security Export Control Committee
Safety Measures CommitteeR&D Committee
Management Committee
CSR Committee
AccountingAuditor
Business Divisions
Sta� Sections
Audit & Supervisory Board
Audit & Supervisory Board
Members
Internal Audit Department
Top ManagementPresident
Corporate O�cers in ChargeInternalAudits
Job Audits
Accounting Audits
Links
Advisory/ReportRemuneration Advisory Committee
15
Corporate Governance

Creating new valueIn January 2016, the Showa Denko Group started its new medium-term
consolidated business plan “Project 2020+.” Under this new business
plan, the Group will strengthen the revenue bases of its diverse
businesses and expand its individualized businesses, aiming to contribute
to solving global social issues by providing high-value-added
products and services in five market domains, namely, “Infrastructure,”
“Energy,” “Mobility,” “Living environment,” and “Electronics.”
In recent years, customer requirements for materials and parts
have diversified so much that it is necessary for us to secure
competitiveness by reconciling technologies with products. We
think we can take advantage of this diversity in customers’ needs
by making the most of our wide-ranging chemical technologies
that cover inorganic, aluminum, and organic chemicals, and our
diverse human resources that support these technologies.
Therefore, we made it our basic policy on R&D to “create new value
by forging, polishing, and linking diverse individualized technologies.”
Under this basic policy, we will deepen and fuse our “diverse business
domains,” our “core technologies” that consist of elemental
technologies with competitive advantage, and our “strategic
technologies” that consist of the world-top-level technologies
we cultivated over many years. Thus, we will promote R&D in a
way that is all our own.
At the beginning of 2016, in order to conduct this individualized
R&D, we established the Institute for Integrated Product Development,
which we organized by combining with the research facilities of six
locations, centering on aluminum and inorganics technologies,
with the former Institute for Polymers and Chemicals. On the initiative
of this new R&D organization, we will enhance cooperation
among divisions and plants, develop our retained materials into
multi-material components, and quickly respond to our customers’
needs in a creative way.
The Institute for Advanced and Core Technology will deepen our
strategic technologies consisting of “nano-carbon, thin-film, and
catalyst technologies,” and will focus on creating breakthrough
technologies that lead to the development of next-generation
businesses. On the other hand, in order to realize and maximize
the fruits of R&D as early as possible while making our original
businesses and technologies the pivot of our R&D activities, we
will positively utilize open innovation and M&A, and strengthen
cooperation with our partners.
The Showa Denko Group will make its R&D grow strongly at
a world level by providing customers with original solutions,
deepening and fusing the individualized technologies which are
expected to become the sprouts of next-generation growth
businesses.
Create new value by forging, polishing, and linking diverse individualized technologies
Organics, Inorganics, Aluminum
Infrastructure, Living environment, Mobility, Energy, Electronics
Diverse needs: Weight saving, Heat management, High integration,High durability
World-top-level technologies we cultivated over many years
Power module,Resin composite
materials
Deepening and fusion of retained materials/technologies
Develop multi-material components
Core technologies
Strategic technologies
(Nano-carbon/Thin-�lm/Catalyst)
Diverse business domains
Material design
Synthesis and
Reaction
Processing
Analysis support
Elemental technologies with competitive advantage
R&D expenditures in 2016 (Millions of yen)
Petrochemicals Chemicals Electronics Inorganics Aluminum Others Total
775 2,379 3,503 253 1,843 8,559 17,313
16 S H O W A D E N K O K . K . A N N U A L R E P O R T 2 0 1 6
Research and Development

R&D plan under “Project 2020+”During the first three years of “Project 2020+,” the Group plans to
invest ¥60 billion in R&D. We will invest about 70% of our R&D budget
in the two market domains of “Energy,” to which we mainly provide
LIB materials and SiC epitaxial wafers for power devices, and
“Electronics,” to which we mainly provide high-purity gases and
solvents for electronics, optical film, and resins for electronics,
aiming to accelerate development of new technologies and
products. On the other hand, we will invest 30% of our R&D budget
in the three other market domains of “Infrastructure,” “Living
environment,” and “Mobility,” which are newly defined this time,
aiming to expand individualized businesses.
Through these R&D investments, we will create new individualized
businesses. At the same time, we aim to contribute to the solution of
global social issues by providing high-value-added products and
services to the five market domains.
The following are examples of our R&D themes that we expect to
become sprouts of next-generation growth businesses.
1. Power modulesPower modules are a typical and promising example of multi-material
components that we design through the application of our proprietary
technologies, materials, and solution know-how. Power modules
consist of diverse materials, including aluminum, resins, and ceramics.
Therefore, designing and producing power modules with
multi-material structures require a heat-radiating solution to cope
with higher-output and down-sizing, know-how to solve material-
matching issues, and sealing agents to bond and seal different
materials. We will pioneer the market for SiC-based power modules
by responding to such sophisticated needs through the fusion of
our individualized technologies in various fields including power
elements, heat-radiating panels, insulating sheets, cooling devices,
and sealing resins with enhanced heat resistance.
2. Resins for electronic materialsResins for electronic materials
have various uses, including
precision circuit boards for
high-definition televisions and
smartphones (COF: chip on film)
and circuit boards for color filters
used in flat panel displays. To
meet electronic device manufacturers’ demand for slimming of
smartphones and higher definition for flat panel displays, resins for
electronic materials are required to have improvement in various
properties including reliability, flexibility, and thermal resistance.
The Showa Denko Group will continue responding speedily to the
needs of electronic device manufacturers, who are actively involved
in this rapidly changing market, by continuously accumulating and
improving its technology for designing various polymers including
acrylic, epoxy, and urethane resins, technology for blending
additives, and technology for evaluating properties of materials.
3. Nano-carbonsWe have already started
commercial production of
VGCFTM carbon nanotube, and
we are developing new
nano-carbon materials including
fullerene and graphene. In the
near future, we will develop
technologies that give new functions to nano-carbons, including
technology to create fullerene derivatives, and technology to
produce nano-thin-film materials. We will also establish methods to
evaluate nano-materials. Thus, we will promote the application of
nano-carbons to composite components, battery/wiring materials,
and materials for storage media and devices.
Next-generation magnetic alloys
Strategic technologies (Nano-carbon, Thin-�lm, Catalyst)
Materials for cosmetics,Separation/re�ning base, Plant-cultivation system
LIB materials, SiC epi-wafers for power devices
Printed electronics, Optical �lm, Functional monomers
Others
MobilityLiving
environment
¥60 billion(2016-2018)
R&D budgetInfrastructure
Electronics
Energy
Functional resins
Accelerate R&D centering on “Energy” and “Electronics”
SiC epitaxial wafers for power devices
Fullerene and its molecular model
Resins for electronic materials
17
Research and Development
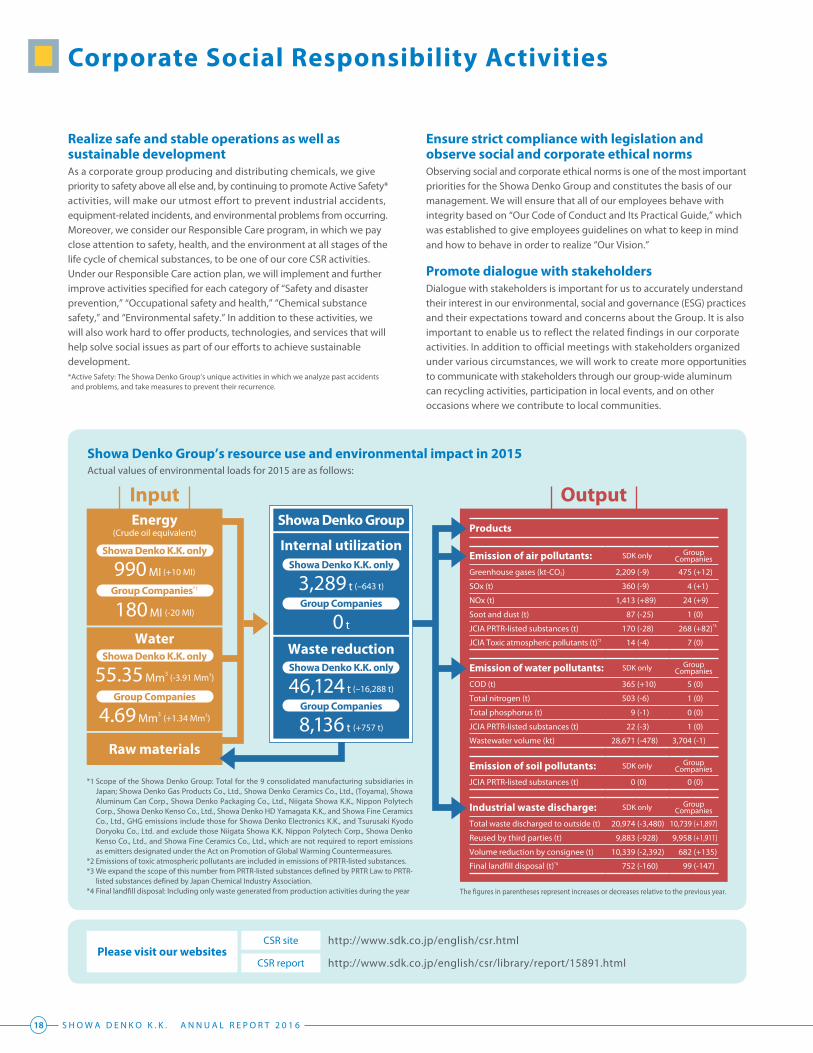
Emission of air pollutants: SDK only Group Companies
Greenhouse gases (kt-CO2) 2,209 (-9) 475 (+12)
SOx (t) 360 (-9) 4 (+1)
NOx (t) 1,413 (+89) 24 (+9)
Soot and dust (t) 87 (-25) 1 (0)
JCIA PRTR-listed substances (t) 170 (-28) 268 (+82)*4
JCIA Toxic atmospheric pollutants (t)*2 14 (-4) 7 (0)
Products
Emission of water pollutants: SDK only Group Companies
COD (t) 365 (+10) 5 (0)
Total nitrogen (t) 503 (-6) 1 (0)
Total phosphorus (t) 9 (-1) 0 (0)
JCIA PRTR-listed substances (t) 22 (-3) 1 (0)
Wastewater volume (kt) 28,671 (-478) 3,704 (-1)
Industrial waste discharge: SDK only Group Companies
Total waste discharged to outside (t) 20,974 (-3,480) 10,739 (+1,897)
Reused by third parties (t) 9,883 (-928) 9,958 (+1,911)
Volume reduction by consignee (t) 10,339 (-2,392) 682 (+135)
Final landfill disposal (t)*4 752 (-160) 99 (-147)
Emission of soil pollutants: SDK only Group Companies
JCIA PRTR-listed substances (t) 0 (0) 0 (0)
Raw materials
Ensure strict compliance with legislation and observe social and corporate ethical normsObserving social and corporate ethical norms is one of the most important priorities for the Showa Denko Group and constitutes the basis of our management. We will ensure that all of our employees behave with integrity based on “Our Code of Conduct and Its Practical Guide,” which was established to give employees guidelines on what to keep in mind and how to behave in order to realize “Our Vision.”
Promote dialogue with stakeholdersDialogue with stakeholders is important for us to accurately understand their interest in our environmental, social and governance (ESG) practices and their expectations toward and concerns about the Group. It is also important to enable us to reflect the related findings in our corporate activities. In addition to official meetings with stakeholders organized under various circumstances, we will work to create more opportunities to communicate with stakeholders through our group-wide aluminum can recycling activities, participation in local events, and on other occasions where we contribute to local communities.
Realize safe and stable operations as well as sustainable developmentAs a corporate group producing and distributing chemicals, we give priority to safety above all else and, by continuing to promote Active Safety* activities, will make our utmost effort to prevent industrial accidents, equipment-related incidents, and environmental problems from occurring. Moreover, we consider our Responsible Care program, in which we pay close attention to safety, health, and the environment at all stages of the life cycle of chemical substances, to be one of our core CSR activities. Under our Responsible Care action plan, we will implement and further improve activities specified for each category of “Safety and disaster prevention,” “Occupational safety and health,” “Chemical substance safety,” and “Environmental safety.” In addition to these activities, we will also work hard to offer products, technologies, and services that will help solve social issues as part of our efforts to achieve sustainable development.* Active Safety: The Showa Denko Group’s unique activities in which we analyze past accidents and problems, and take measures to prevent their recurrence.
Showa Denko Group’s resource use and environmental impact in 2015 Actual values of environmental loads for 2015 are as follows:
CSR site
CSR report
http://www.sdk.co.jp/english/csr.html
http://www.sdk.co.jp/english/csr/library/report/15891.html
*1 Scope of the Showa Denko Group: Total for the 9 consolidated manufacturing subsidiaries in Japan; Showa Denko Gas Products Co., Ltd., Showa Denko Ceramics Co., Ltd., (Toyama), Showa Aluminum Can Corp., Showa Denko Packaging Co., Ltd., Niigata Showa K.K., Nippon Polytech Corp., Showa Denko Kenso Co., Ltd., Showa Denko HD Yamagata K.K., and Showa Fine Ceramics Co., Ltd., GHG emissions include those for Showa Denko Electronics K.K., and Tsurusaki Kyodo Doryoku Co., Ltd. and exclude those Niigata Showa K.K. Nippon Polytech Corp., Showa Denko Kenso Co., Ltd., and Showa Fine Ceramics Co., Ltd., which are not required to report emissions as emitters designated under the Act on Promotion of Global Warming Countermeasures.
*2 Emissions of toxic atmospheric pollutants are included in emissions of PRTR-listed substances.*3 We expand the scope of this number from PRTR-listed substances defined by PRTR Law to PRTR-
listed substances defined by Japan Chemical Industry Association. *4 Final landfill disposal: Including only waste generated from production activities during the year The figures in parentheses represent increases or decreases relative to the previous year.
Please visit our websites
Energy(Crude oil equivalent)
Water
990 MI (+10 MI)
Showa Denko K.K. only
55.35 Mm3 (-3.91 Mm3)
Showa Denko K.K. only
180 MI (-20 MI)
Group Companies*1
4.69 Mm3 (+1.34 Mm3)
Group Companies
Internal utilization
Waste reduction
Showa Denko Group
3,289 t (–643 t)
Showa Denko K.K. only
46,124 t (–16,288 t)
Showa Denko K.K. only
0 t
Group Companies
8,136 t (+757 t)
Group Companies
Input Output
18 S H O W A D E N K O K . K . A N N U A L R E P O R T 2 0 1 6
Corporate Social Responsibility Activities

Results of Operations Consolidated net sales in 2016 totaled ¥671,159 million (US$5,762 million), a decrease of ¥104,573 million, or 13.5%, from the previous year. Sales figures decreased in all segments including the Petrochemicals segment where sales decreased due to a fall in product prices, reflecting a decline in raw naphtha price.
The cost of sales decreased ¥108,930 million, or 16.7%, to ¥544,994 million (US$4,678 million), reflecting the decrease in net sales.
Selling, general and administrative expenses decreased ¥4,189 million, or 4.7%, to ¥84,111 million (US$722 million). R&D expenditures decreased ¥2,976 million, to ¥17,313 million (US$149 million).
We recorded operating income of ¥42,053 million (US$361 million), up ¥8,545 million, or 25.5%, from the previous year due to the major increase in operating income of the Petrochemicals segment resulting from strong demand in Asia, and due also to the increase in operating income of Chemicals, Aluminum, and Others segments. On the other hand, the operating income of the Electronics segment decreased due to lower shipment volumes of HD media. The operating income of the Inorganics segment also decreased.
Information by Business SegmentA breakdown of net sales and operating income by business segment is as follows.
PetrochemicalsProduction of ethylene and propylene slightly decreased from the previous year due to coinciding shutdowns of plants to produce derivatives for periodic maintenance at Oita Complex in the first half of the year. Sales of olefins decreased due to a decline in prices of products caused by a drop in raw naphtha price, despite strong demand for olefins in the Asian market. Sales of organic chemicals also decreased due to a fall in the sales prices of vinyl acetate and ethyl acetate resulting from a decline in prices of raw materials.
As a result, the Petrochemicals segment’s sales decreased ¥45,505 million, or 19.7%, from the previous year, to ¥185,783 million (US$1,595 million). The segment recorded operating income of ¥20,690 million (US$178 million), up ¥10,147 million, or 96.2% due to a decline in prices of raw materials and the continued high operating rates in olefins and organic chemicals businesses in response to strong demand in the Asian market.
ChemicalsProduction of liquefied ammonia and high-purity gases for electronics increased from the previous year. Sales of electronic chemicals slightly increased due to continued high-level shipment volumes, despite the
impact of a strong yen. Sales of industrial gases slightly increased. On the other hand, sales of basic chemicals decreased due partly to a decline in the sales prices of some products including acrylonitrile following a fall in prices of raw materials, despite continuously high shipment volumes of products. Sales of functional chemicals decreased due to the transfer of our phenolic resin business to another company, which took place in the second half of the previous year.
As a result, the Chemicals segment’s sales decreased ¥7,763 million, or 5.5%, to ¥134,529 million (US$1,155 million). Operating income from basic chemicals business increased due to a reduction in costs of materials resulting partly from an increase in the ratio of recycled plastics among raw materials to produce ammonia. Operating income from industrial gases and functional chemicals businesses also increased, while that from electronic chemicals business decreased due to a strong yen. Overall, the segment recorded operating income of ¥13,824 million (US$119 million), up ¥3,118 million, or 29.1% from the previous year.
ElectronicsProduction of HD media in 2016 decreased from the previous year due to a decrease in shipment volumes of media for use in PCs, which could not be compensated by the increase in shipment volumes of media for use in servers. However, shipment volumes of HD media for use in PCs in the second half of the year recovered from the level of the first half of the year, and that in the fourth quarter of 2016 was higher than that in the same period of the previous year. Under this market environment, overall sales of HD media decreased due to the decrease in shipment volumes mentioned above and the impact of a strong yen. Sales of rare earth magnetic alloys and compound semiconductors also decreased.
As a result, the Electronics segment’s sales decreased ¥28,153 million, or 21.4%, to ¥103,339 million (US$887 million). Operating income of the segment decreased ¥3,565 million, or 20.4%, to ¥13,907 million (US$119 million) due to the decrease in shipment volumes of HD media especially in the first half of the year, which could not be compensated by the increase in shipment volumes in the second half of the year. Nevertheless, operating income from HD media business in the second half of 2016 increased from that in the same period of the previous year due to the realization of effects of our efforts during the first half of 2016 to streamline production capacity and reinforce cost competitiveness of the HD media business.
InorganicsProduction volume of graphite electrodes slightly increased from the previous year. However, sales of graphite electrodes decreased due to a decline in market prices resulting from the adjustment of production in the steel industry in Asia and the United States under the influence of
60
40
20
0
-20
(Billions of yen)1,000
750
500
250
0
-250
(Billions of yen)
PetrochemicalsChemicalsElectronics
AdjustmentsInorganicsAluminumOthers
PetrochemicalsChemicalsElectronics
AdjustmentsInorganicsAluminumOthers
2015 2016
Net Sales by Segment
2015 20162012 2013 2014
Operating Income by Segment
2012 2013 2014
19
Corporate Social Responsibility Activities Management’s Discussion and Analysis

(Billions of yen)20
15
10
5
0
(Billions of yen)1,000
900
800
700
0
Net Income Attributable to Owners of the Parent Total Assets
2015 20162012 2013 20142015 20162012 2013 2014
overproduction in China. Sales of ceramics decreased due to a decline in shipment volumes.
As a result, the Inorganics segment’s sales decreased ¥12,607 million, or 19.9%, to ¥50,870 million (US$437 million). The segment recorded an operating loss of ¥5,758 million (US$49 million), a deterioration of ¥4,510 million from the previous year. However, aiming to revitalize profitability of the graphite electrode business, the Showa Denko Group took measures to improve cost competitiveness of this business at production bases in Japan and the United States.
AluminumDomestic sales of high-purity foil for aluminum electrolytic capacitors increased from the previous year due to an increase in production of air conditioners and electronic parts for automobiles. Overall sales of rolled products increased due partly to the increase in shipment volumes of high-purity foil for aluminum electrolytic capacitors in China recorded by Showa Denko Aluminum (Nantong) Co., Ltd. in addition to the abovementioned sales increase in the domestic market. Sales of aluminum specialty components decreased due to a fall in aluminum metal price and lower shipment volumes for some automotive applications. Sales of aluminum cans increased due to higher shipment volumes recorded by Hanacans Joint Stock Company of Vietnam.
As a result, the Aluminum segment’s sales decreased ¥2,181 million, or 2.2%, to ¥98,575 million (US$846 million). Operating income of the segment increased ¥1,854 million, or 72.3%, to ¥4,416 million (US$38 million) due to an increase in shipment volumes of rolled products and higher shipment volumes of aluminum cans recorded by Hanacans.
OthersSales of lithium ion battery (LIB) materials increased slightly due to an increase in shipment volumes for automotive applications in addition to higher shipment volumes for use in smartphones. However, Shoko Co., Ltd.’s sales decreased.
As a result, the Others segment’s sales decreased ¥4,870 million, or 3.3%, to ¥142,364 million (US$1,222 million). However, the segment recorded an operating income of ¥1,775 million (US$15 million), up ¥446 million, or 33.6% from the previous year due to the increase in shipment volumes of LIB materials.
Information by Geographic AreaSales in JapanThe Petrochemicals segment’s sales decreased due to a fall in market prices of products reflecting a drop in raw naphtha price. The Chemicals segment’s sales decreased due to a decline in the market price of acrylonitrile and the transfer of our phenolic resin business to another
company. Sales figures of the Electronics segment decreased due to lower shipment volumes of compound semiconductors, rare earth magnetic alloys, and HD media. In the Inorganics segment, sales of ceramics decreased due to lower sales volumes, and sales of graphite electrodes decreased due to a decline in market prices, despite an increase in shipment volumes. The Aluminum segment’s sales decreased due to a decline in sales prices of aluminum specialty components resulting from a fall in aluminum metal price, and due also to a decrease in sales volumes of aluminum specialty components, despite an increase in sales volumes of high-purity foil for aluminum electrolytic capacitors. Sales figures of the Others segment decreased due to a decrease in Shoko Co., Ltd.’s sales.
As a result, consolidated sales from operations in Japan decreased ¥43,763 million, or 9.2%, to ¥430,639 million (US$3,697 million).
Sales in Asia (excluding Japan)The Chemicals segment’s sales decreased due partly to a decline in sales of high-purity gases for electronics, which are products of our electronic chemicals business, resulting from a strong yen. For the functional chemicals business, a decline in Shanghai Showa Highpolymer Co., Ltd.’s sales also contributed to the decrease in sales figures of the Chemicals segment. The Electronics segment’s sales decreased due to a decrease in the demand for HD media for PCs and the strong yen. The Inorganics segment’s sales decreased due partly to a decline in market prices of graphite electrodes. The Aluminum segment’s sales increased due partly to the installation of a line to produce can ends at Hanacans Joint Stock Company. The Others segment’s sales decreased due partly to significant decreases in Shoko Co. Ltd.’s sales and Shoko (Shanghai) Co., Ltd.’s sales.
As a result, consolidated sales from operations in Asia (excluding Japan) decreased ¥50,306 million, or 19.4%, to ¥208,626 million (US$1,791 million).
Sales in the Rest of the WorldThe Inorganics segment’s sales decreased due to a fall in market prices of graphite electrodes manufactured by Showa Denko Carbon, Inc. of the United States.
As a result, consolidated sales from operations in the rest of the world decreased ¥10,505 million, or 24.8%, to ¥31,893 million (US$274 million).
Other Income (Expenses) and Net Income Attributable to Owners of the ParentThe gap between interest expenses and interest and dividends income improved ¥565 million to expenses of ¥1,590 million (US$14 million), due mainly to the decrease in interest expenses. We recorded a gain in the equity in earnings of unconsolidated subsidiaries and affiliates to which the equity method is applied in the amount of ¥4,328 million (US$37 million), an improvement of ¥2,412 million, due partly to an improvement
20 S H O W A D E N K O K . K . A N N U A L R E P O R T 2 0 1 6
Management’s Discussion and Analysis (cont.)

(Billions of yen)400
300
200
100
0
(Billions of yen)400
350
300
250
0
(Billions of yen)80
60
40
20
0
Total Net Assets
2015 20162012 2013 2014
Interest Bearing Debt
2015 20162012 2013 2014
Cash Flows from Operating Activities
2015 20162012 2013 2014
in business results of affiliates in synthetic resin-related operations in consequence of market recovery and higher operating rates.
With regard to foreign exchange gain (losses), the Group recorded foreign exchange losses of ¥1,658 million (US$14 million), a deterioration of ¥1,217 million due mainly to the appreciation of the yen.
We recorded a loss of ¥3,222 million (US$28 million), net, on retirement and sales of noncurrent assets, an improvement of ¥647 million, due partly to retirement losses resulting from replacements of facilities in the Inorganics and Chemicals segments. We also recorded a loss of ¥15,644 million (US$134 million) for the impairment loss, an increase of ¥4,966 million, due partly to our recognition of an impairment loss amounting to ¥7,743 million as a result of the write-down of the book value of fixed assets used in the aluminum specialty components business operated in Oyama City, Tochigi Prefecture, a part of which became excessive assets after the divestiture of the automotive heat exchanger business in 2012 and the following decrease in shipment volumes. We also posted an impairment loss amounting to ¥4,530 million concerning the Electronics segment’s electronics materials business.
Gain on sales of investment securities decreased ¥7,984 million, to ¥72 million (US$1 million), because we did not record a gain on sales of listed stocks, which we had recorded in 2015. We did not post a loss on provision of allowance for doubtful accounts, which we had posted ¥13,404 million in 2015. The sum of extraordinary losses other than those mentioned above improved ¥3,090 million, to ¥3,125 million (US$27 million), due mainly to decrease in loss on valuation of investment securities.
Overall, the total of other income (expenses), net, i.e., the total of non-operating income (expenses) and extraordinary income (expenses), net, improved ¥2,920 million, to a loss of ¥24,524 million (US$211 million).
As a result, the Company posted income before taxes and non-controlling interests of ¥17,529 million (US$150 million), up ¥11,465 million from the previous year.
Corporate tax decreased ¥19,271 million, to ¥3,691 million (US$32 million), due to the rebound from the previous year’s increase in corporate tax caused by a revision of the taxation system and a partial liquidation of deferred tax assets resulting from a revision of the Company’s income forecast accompanied by the formulation of the new medium-term consolidated business plan. Thus, the Company recorded net income attributable to owners of the parent of ¥12,305 million (US$106 million), up ¥11,384 million from the previous year.
Financial PositionTotal AssetsTotal assets decreased ¥7,797 million from the end of the previous year, to ¥932,698 million (US$8,007 million), due partly to the decrease in inventory reflecting falls in material and fuel prices, notwithstanding the
increase in accounts receivable. Cash and deposits increased ¥5,860 million, to ¥69,914 million (US$600 million).
Net property, plant and equipment decreased ¥15,158 million, to ¥487,135 million (US$4,182 million), due partly to the posting of impairment losses, despite the new consolidation of SunAllomer Ltd.
Total investments and other assets increased ¥3,810 million, to ¥110,486 million (US$948 million), due partly to the decrease in allowance for doubtful accounts.
LiabilitiesInterest bearing debt decreased ¥8,906 million, to ¥359,929 million (US$3,090 million). Total liabilities decreased ¥10,885 million, to ¥621,467 million (US$5,335 million), due partly to the decreases in interest bearing debt and notes and accounts payable-trade.
Net AssetsNet assets increased ¥3,089 million from the end of the previous year, to ¥311,231 million (US$2,672 million), due partly to the posting of net income attributable to owners of the parent.
Capital ExpendituresCapital expenditures decreased ¥4,784 million from the previous year, to ¥39,276 million (US$337 million). We replaced hydropower plants and expanded facilities to produce electronic chemicals. We also implemented construction works for various purposes, including reinforcement of production facilities, efficiency improvement, maintenance of production facilities, and environmental preservation.
Cash FlowsNet cash provided by operating activities increased ¥7,779 million from the previous year, to ¥68,949 million (US$592 million), due partly to the increase in operating income. Net cash used in investing activities increased ¥11,257 million, to ¥53,754 million (US$461 million), due partly to an expenditure to acquire additional shares in a subsidiary accompanying a change in the scope of consolidation, and an increase in term deposits. Thus, free cash flow ended up in the proceeds of ¥15,195 million (US$130 million), a deterioration of ¥3,478 million. Net cash used in financing activities decreased ¥8,116 million due to less reduction in interest bearing debt than the previous year, and ended up in the payment of ¥13,220 million (US$113 million).
As a result, taking the effects of exchange rate fluctuations into account, cash and cash equivalents at the end of 2016 increased ¥1,589 million, to ¥56,186 million (US$482 million).
21
Management’s Discussion and Analysis (cont.)

Millions of yen Thousands ofU.S. dollars (Note 5)
ASSETS 2016 2015 2016
Current assets
Cash and deposits (Notes 6 and 7) ¥ 69,914 ¥ 64,054 $ 600,170
Notes and accounts receivable (Notes 7 and 10) 157,846 146,810 1,355,022
Allowance for doubtful accounts (699) (880) (5,997)
Inventories 91,347 105,926 784,162
Deferred tax assets (Note 13) 4,092 3,029 35,129
Other current assets (Notes 7 and 9) 12,576 12,586 107,957
Total current assets 335,077 331,525 2,876,442
Property, plant and equipment (Note 11)
Land (Note 19) 242,816 251,851 2,084,440
Buildings and structures 267,889 265,136 2,299,670
Machinery, equipment and vehicles 791,398 773,229 6,793,701
Construction in progress 49,575 48,660 425,574
1,351,678 1,338,877 11,603,385
Less : Accumulated depreciation (864,544) (836,583) (7,421,612)
Net property, plant and equipment 487,135 502,293 4,181,773
Investments and other assets
Investment securities (Notes 7, 8 and 11) 74,951 76,568 643,415
Long-term loans 6,922 3,300 59,418
Net defined benefit asset (Note 12) 365 19 3,131
Deferred tax assets (Note 13) 9,115 8,877 78,249
Other (Notes 7 and 9) 27,940 33,777 239,851
Allowance for doubtful accounts (8,807) (15,864) (75,602)
Total investments and other assets 110,486 106,676 948,462
Total assets ¥ 932,698 ¥ 940,494 $ 8,006,676
See notes to financial statements.
22 S H O W A D E N K O K . K . A N N U A L R E P O R T 2 0 1 6
Consolidated Balance SheetsShowa Denko K.K. and Consolidated SubsidiariesAt December 31, 2016 and 2015

Millions of yen Thousands ofU.S. dollars (Note 5)
LIABILITIES AND NET ASSETS 2016 2015 2016
Current liabilities
Short-term debt (Notes 7 and 11) ¥ 71,895 ¥ 81,000 $ 617,176
Current portion of long-term debt (Notes 7 and 11) 58,234 59,386 499,908
Notes and accounts payable (Notes 7, 10 and 11) 143,556 153,451 1,232,343
Income taxes payable 3,890 2,429 33,397
Provision for repairs 38 62 326
Provision for bonuses 2,253 1,904 19,339
Provision for stock payments (Note 4) 25 — 216
Provision for business structure improvement 382 83 3,276
Provision for Niigata Minamata Disease 118 126 1,010
Other current liabilities (Notes 7, 9 and 13) 30,402 32,651 260,980
Total current liabilities 310,792 331,093 2,667,971
Noncurrent liabilities
Long-term debt less current portion (Notes 7 and 11) 229,800 228,449 1,972,703
Deferred tax liabilities (Note 13) 4,041 3,873 34,693
Provision for repairs 2,759 1,377 23,685
Provision for business structure improvement 1,121 475 9,623
Provision for director retirement 73 — 627
Provision for stock payments (Note 4) 59 — 508
Net defined benefit liability (Note 12) 21,923 15,185 188,194
Deferred tax liabilities for land revaluation (Note 19) 33,144 35,893 284,522
Other noncurrent liabilities (Notes 7 and 9) 17,754 16,006 152,411
Total noncurrent liabilities 310,675 301,259 2,666,966
Contingent liabilities (Note 17)
Net assets (Note 18)
Shareholders' equity
Capital stock
Authorized, 330,000,000 shares
Issued , 2016– 149,711,292 shares 140,564 — 1,206,657
Issued , 2015– 1,497,112,926 shares — 140,564 —
Capital surplus (Note 3) 62,033 62,221 532,521
Retained earnings 65,358 55,202 561,061
Less: Treasury stock at cost, 2016– 7,192,815 shares (10,502) — (90,153)
Less: Treasury stock at cost, 2015– 68,858,573 shares — (10,157) —
Total shareholders' equity 257,453 247,829 2,210,086
Accumulated other comprehensive income
Valuation difference on available-for-sale securities 4,519 3,927 38,789
Deferred gains or losses on hedges 320 (326) 2,750
Revaluation reserve for land (Note 19) 31,026 31,307 266,339
Foreign currency translation adjustments 14,239 18,611 122,231
Remeasurements of defined benefit plans (Note 12) (10,996) (4,835) (94,397)
Total accumulated other comprehensive income 39,107 48,683 335,712
Non-controlling interests 14,671 11,629 125,941
Total net assets 311,231 308,142 2,671,739
Total liabilities and net assets ¥ 932,698 ¥ 940,494 $ 8,006,676
23
Consolidated Balance Sheets

Millions of yen Thousands of U.S. dollars (Note 5)
2016 2015 2016
Net sales ¥ 671,159 ¥ 775,732 $ 5,761,512
Cost of sales (Note 21) 544,994 653,924 4,678,464
Gross profit 126,164 121,808 1,083,048
Selling, general and administrative expenses (Notes 20 and 21) 84,111 88,299 722,043
Operating income 42,053 33,508 361,005
Other income (expenses)
Interest and dividends income 1,641 1,922 14,085
Equity in earnings of unconsolidated subsidiaries and affiliates 4,328 1,917 37,157
Gain on sales of investment securities, net (Note 8) 72 8,056 620
Loss on valuation of investment securities (Note 8) (66) (1,813) (567)
Foreign exchange gains (losses) (1,658) (441) (14,234)
Rent income on noncurrent assets 1,506 1,613 12,928
Gain (loss) on sales of noncurrent assets, net 808 (415) 6,935
Interest expenses (3,231) (4,077) (27,738)
Loss on retirement of noncurrent assets (4,030) (3,454) (34,596)
Impairment loss (Note 14) (15,644) (10,678) (134,291)
Gain on bargain purchase 686 — 5,889
Loss on mothballing of operation (3,122) (1,710) (26,797)
Provision of allowance for doubtful accounts (Note 22) — (13,404) —
Other, net (5,815) (4,960) (49,920)
Total (24,524) (27,444) (210,528)
Income before income taxes and Non-controlling interests 17,529 6,064 150,477
Income taxes (Note 13)
Current 3,168 3,437 27,194
Deferred 523 10,525 4,492
Net income (loss) 13,838 (7,898) 118,791
Net income (loss) attributable to non-controlling interests 1,533 (8,819) 13,162
Net income (loss) attribute to owners of the parent ¥ 12,305 ¥ 921 $ 105,629
Yen U.S. dollars (Note 5)
Per share amounts
Net income – primary ¥86.27 ¥6.45 $0.74
Net income – fully diluted — — —
Cash dividends (applicable to the period) — 3.00 —
Note: 1. Net income per share has been computed based on the average number of shares of common stock outstanding during the respective fiscal year. Diluted net income per share for 2016 and 2015 were not disclosed because there were no dilutive shares.
2. The Company plans to resolve payment of a dividend of ¥30 per share based on the record date of May 11, 2017 at the extraordinary general meeting of shareholders to be held in June 2017.See notes to financial statements.
24 S H O W A D E N K O K . K . A N N U A L R E P O R T 2 0 1 6
Consolidated Statements of IncomeShowa Denko K.K. and Consolidated SubsidiariesFor the years ended December 31, 2016 and 2015

Millions of yen Thousands of U.S. dollars (Note 5)
2016 2015 2016
Net income (loss) ¥13,838 ¥ (7,898) $ 118,791
Other comprehensive income:
Valuation difference on available-for-sale securities 516 (3,212) 4,429
Deferred gains or losses on hedges 629 (1,421) 5,399
Revaluation reserve for land 1,824 3,779 15,661
Foreign currency translation adjustments (4,520) (2,320) (38,803)
Remeasurements of defined benefit plans, net of tax (6,167) 9 (52,943)
Share of other comprehensive income of unconsolidated subsidiaries and affiliates accounted for using equity method 41 119 350
Total other comprehensive income (Note 15) ¥ (7,678) ¥ (3,046) $ (65,907)
Comprehensive income ¥ 6,160 ¥ (10,945) $ 52,883
Comprehensive income attributable to:
Owners of parent 4,807 (1,661) 41,266
Non-controlling interests 1,353 (9,284) 11,618
See notes to financial statements.
25
Consolidated Statements of Income Consolidated Statements of Comprehensive IncomeShowa Denko K.K. and Consolidated SubsidiariesFor the years ended December 31, 2016 and 2015

Thousands Millions of yen
Number ofshares of
capital stock
Capitalstock
Capital surplus
Retainedearnings
Treasurystock
Valuation difference
on available-for-sale
securities
Deferred gains
or losseson hedges
Revaluation reserve for
land
Foreign currency
translation adjustments
Remeasure-ments
of defined benefit plans
Non-controlling
interests
Totalnet assets
Balance at December 31, 2014 1,497,113 ¥ 140,564 ¥ 62,221 ¥ 56,896 ¥ (10,153) ¥ 6,783 ¥ 1,262 ¥ 27,908 ¥ 19,018 ¥ (4,899) ¥ 19,488 ¥ 319,087
Cumulative effects of changes in accounting policies — — — 29 — — — — — 2,668 — 2,697
Restated balance 1,497,113 140,564 62,221 56,925 (10,153) 6,783 1,262 27,908 19,018 (2,231) 19,488 321,784
Dividends from surplus — — — (4,285) — — — — — — — (4,285)
Net income (loss) attributable to owners of the parent — — — 921 — — — — — — — 921
Purchase of treasury stock — — — — (5) — — — — — — (5)
Disposal of treasury stock — — 0 — 0 — — — — — — 0
Increase by increase of consolidated subsidiaries — — — 1,084 — — — — — — — 1,084
Decrease by increase of consolidated subsidiaries — — — (304) — — — — — — — (304)
Decrease by decrease of consolidated subsidiaries — — — (225) — — — — — — — (225)
Increase by increase of associates accounted for using equity method — — — 637 — — — — — — — 637
Change in treasury shares of parent arising from transactions with non-controlling shareholders — — — — — — — — — — — —
Reversal of revaluation reserve for land — — — 355 — — — — — — — 355
Other — — — 93 — — — — — — — 93
Net changes of items other than shareholders' equity — — — — — (2,856) (1,588) 3,398 (407) (2,604) (7,858) (11,915)
Balance at December 31, 2015 1,497,113 ¥ 140,564 ¥ 62,221 ¥ 55,202 ¥ (10,157) ¥ 3,927 ¥ (326) ¥ 31,307 ¥ 18,611 ¥ (4,835) ¥ 11,629 ¥ 308,142
Cumulative effects of changes in accounting policies — — — — — — — — — — — —
Restated balance 1,497,113 140,564 62,221 55,202 (10,157) 3,927 (326) 31,307 18,611 (4,835) 11,629 308,142
Dividends from surplus — — — (4,285) — — — — — — — (4,285)
Net income (loss) attributable to owners of the parent — — — 12,305 — — — — — — — 12,305
Purchase of treasury stock — — — — (345) — — — — — — (345)
Disposal of treasury stock — — (0) — 0 — — — — — — 0
Increase by increase of consolidated subsidiaries — — — 70 — — — — — — — 70
Decrease by increase of consolidated subsidiaries — — — — — — — — — — — —
Decrease by decrease of consolidated subsidiaries — — — — — — — — — — — —
Increase by increase of associates accounted for using equity method — — — — — — — — — — — —
Change in treasury shares of parent arising from transactions with non-controlling shareholders — — (188) — — — — — — — — (188)
Reversal of revaluation reserve for land — — — 2,093 — — — — — — — 2,093
Other (1,347,402) — — (27) — — — — — — — (27)
Net changes of items other than shareholders' equity — — — — — 592 646 (281) (4,372) (6,161) 3,042 (6,535)
Balance at December 31, 2016 149,711 ¥ 140,564 ¥ 62,033 ¥ 65,358 ¥ (10,502) ¥ 4,519 ¥ 320 ¥ 31,026 ¥ 14,239 ¥ (10,996) ¥ 14,671 ¥ 311,231
Thousands Thousands of U.S. dollars (Note 5)
Number ofshares of
capital stock
Capitalstock
Capital surplus
Retainedearnings
Treasurystock
Valuation difference
on available-for-sale
securities
Deferred gains
or losseson hedges
Revaluation reserve for
land
Foreign currency
translation adjustments
Remeasure-ments
of defined benefit plans
Non-controlling
interests
Totalnet assets
Balance at December 31, 2015 1,497,113 $ 1,206,657 $ 534,132 $ 473,878 $ (87,193) $ 33,711 $ (2,797) $ 268,751 $ 159,765 $ (41,510) $ 99,831 $ 2,645,225
Cumulative effects of changes in accounting policies — — — — — — — — — — — —
Restated balance 1,497,113 1,206,657 534,132 473,878 (87,193) 33,711 (2,797) 268,751 159,765 (41,510) 99,831 2,645,225
Dividends from surplus — — — (36,782) — — — — — — — (36,782)
Net income (loss) attributable to owners of the parent — — — 105,629 — — — — — — — 105,629
Purchase of treasury stock — — — — (2,962) — — — — — — (2,962)
Disposal of treasury stock — — (1) — 2 — — — — — — 2
Increase by increase of consolidated subsidiaries — — — 599 — — — — — — — 599
Decrease by increase of consolidated subsidiaries — — — — — — — — — — — —
Decrease by decrease of consolidated subsidiaries — — — — — — — — — — — —
Increase by increase of associates accounted for using equity method — — — — — — — — — — — —
Change in treasury shares of parent arising from transactions with non-controlling shareholders — — (1,610) — — — — — — — — (1,610)
Reversal of revaluation reserve for land — — — 17,971 — — — — — — — 17,971
Other (1,347,402) — — (234) — — — — — — — (234)
Net changes of items other than shareholders' equity — — — — — 5,078 5,547 (2,412) (37,534) (52,887) 26,110 (56,098)
Balance at December 31, 2016 149,711 $ 1,206,657 $ 532,521 $ 561,061 $ (90,153) $ 38,789 $ 2,750 $ 266,339 $122,231 $ (94,397) $125,941 $2,671,739
See notes to financial statements.
26 S H O W A D E N K O K . K . A N N U A L R E P O R T 2 0 1 6
Consolidated Statements of Changes in Net AssetsShowa Denko K.K. and Consolidated SubsidiariesFor the years ended December 31, 2016 and 2015

Millions of yen Thousands ofU.S. dollars (Note 5)
2016 2015 2016Cash flows from operating activities
Income before income taxes and Non-controlling interests ¥ 17,529 ¥ 6,064 $ 150,477 Adjustments for:
Depreciation and amortization 38,761 42,137 332,741 Impairment loss 15,644 10,678 134,291 Amortization of goodwill — 1,354 —Amorization of negative goodwill (11) — (97) Increase (decrease) in allowance for doubtful accounts (6,441) 14,220 (55,291) Increase (decrease) in net defined benefit liability 6,744 (6,903) 57,895 Interest and dividends income (1,641) (1,922) (14,085) Interest expenses 3,231 4,077 27,738 Equity in (earnings) losses of unconsolidated subsidiaries and affiliates (4,328) (1,917) (37,157) Loss (gain) on sales and valuation of investment securities (6) (6,243) (53) Loss on retirement of noncurrent assets 4,030 3,454 34,596 Loss (gain) on sales of noncurrent assets (808) 415 (6,935) Decrease (increase) in notes and accounts receivable-trade (2,380) 22,134 (20,432) Decrease (increase) in inventories 20,112 18,119 172,647 Increase (decrease) in notes and accounts payable-trade (10,315) (24,502) (88,548) Other, net (10,044) (16,733) (86,219)
Subtotal 70,076 64,430 601,566 Interest and dividends income received 5,565 4,193 47,773 Interest expenses paid (3,227) (4,115) (27,698) Income taxes paid (refund) (3,466) (3,337) (29,750)
Net cash provided by (used in) operating activities 68,949 61,170 591,891 Cash flows from investing activities
Payments into time deposits (29,438) (28,962) (252,709) Proceeds from withdrawal of time deposits 25,287 31,006 217,078 Purchase of property, plant and equipment (38,317) (41,263) (328,930) Proceeds from sales of property, plant and equipment 1,724 697 14,799 Purchase of investment securities (3,163) (23,446) (27,155) Proceeds from sales of investment securities 173 23,725 1,487 Purchase of investments in subsidiaries — (862) —Purchase of investments in subsidiaries resulting in change in scope of consolidation (2,132) — (18,302) Net decrease (increase) in short-term loans receivable (1,231) (386) (10,567) Payments of long-term loans receivable (4,077) (2,810) (34,996) Collection of long-term loans receivable 322 520 2,766 Other, net (2,903) (715) (24,921)
Net cash provided by (used in) investing activities (53,754) (42,497) (461,449) Cash flows from financing activities
Net increase (decrease) in short-term debt (7,242) 5,713 (62,170) Proceeds from long-term loans payable 42,288 50,240 363,018 Repayments of long-term loans payable (49,273) (71,006) (422,976) Proceeds from issuance of bonds 17,000 10,000 145,935 Redemption of bonds (10,000) (10,000) (85,844) Proceeds from share issuance to non-controlling shareholders — 129 —Cash dividends paid (4,267) (4,272) (36,627) Cash dividends paid to non-controlling shareholders (376) (435) (3,229) Other, net (1,350) (1,705) (11,589)
Net cash provided by (used in) financing activities (13,220) (21,336) (113,482) Effect of exchange rate changes on cash and cash equivalents (523) (1,058) (4,488) Net increase (decrease) in cash and cash equivalents 1,453 (3,721) 12,472 Cash and cash equivalents at beginning of the year 54,597 55,162 468,682 Increase in cash and cash equivalents resulting from newly consolidated subsidiaries 136 3,002 1,167 Decrease in cash and cash equivalents resulting from exclusion of subsidiaries from consolidation — (7) —Increase in cash and cash equivalents resulting from merger — 161 —Cash and cash equivalents at end of the year (Note 6) ¥ 56,186 ¥ 54,597 $ 482,321
See notes to financial statements.
27
Consolidated Statements of Changes in Net Assets Consolidated Statements of Cash FlowsShowa Denko K.K. and Consolidated SubsidiariesFor the years ended December 31, 2016 and 2015

1. BASIS OF REPORTING AND FINANCIAL STATEMENTS
The accompanying consolidated financial statements have been prepared in accordance with accounting principles and practices generally accepted in Japan, which are different in certain respects as to application and disclosure requirements from International Financial Reporting Standards, and restructured and translated into English from the consolidated financial statements which have been filed with the Kanto Local Finance Bureau as required by the Financial Instruments and Exchange Law of Japan.
2. SUMMARY OF SIGNIFICANT ACCOUNTING POLICIES
(a) Principles of ConsolidationThe consolidated financial statements for the years ended December 31, 2016 and 2015 include the accounts of the Company and its 48 and 48, respectively, significant subsidiaries (collectively “the Companies”).
For the purposes of the consolidated financial statements, all significant intercompany transactions, account balances and unrealized profits among the Companies are entirely eliminated and the portions thereof attributable to minority interests are credited or charged to minority interests.
Accounts of subsidiaries whose business year-ends differ by more than three months from December 31 have been included using appropriate interim financial information.
In the initial consolidation, assets and liabilities of subsidiaries including those attributable to minority stockholders are recorded based on fair value in the accompanying consolidated financial statements.
Goodwill is amortized on a straight-line basis over a period during which the effect of such goodwill lasts but does not exceed 20 years from booking. In addition, negative goodwill arising from business combinations prior to April 1, 2010 is amortized on a straight-line basis over a period during which the effect of such negative goodwill lasts but does not exceed 20 years from booking.
(b) Investments in Unconsolidated Subsidiaries and AffiliatesThe Company applied the equity method of accounting for investments in 2 unconsolidated subsidiary in 2016 and 1 that of in 2015, and 10 affiliates in 2016 and 12 affiliates in 2015.
All underlying intercompany profits obtained from transactions among the Companies and unconsolidated subsidiaries and affiliates to which the equity method is applied are eliminated in the consolidated financial statements.
(c) Translation of Foreign Currency AccountsAll receivables and payables denominated in foreign currencies at the balance sheet date are translated into Japanese yen at the current exchange rates.
The resulting exchange gains or losses are credited or charged to income.
The financial statements of certain consolidated subsidiaries of foreign nationality are translated into Japanese yen at the year-end rate for assets and liabilities, at historical rates for the other balance sheet accounts exclusive of the current year’s net income, and at the average annual rate for revenue and expense accounts and net income.
Translation adjustments resulting from the process of translating the financial statements of foreign subsidiaries into Japanese yen are accumulated and reported as a component of net assets on the consolidated balance sheets.
(d) Cash and Cash EquivalentsCash and cash equivalents in the consolidated statements of cash flows are composed of cash on hand, bank deposits available for withdrawal on demand and short-term investments with original maturities of three months or less and minor risk of value fluctuation.
(e) SecuritiesDebt securities that are intended to be held to maturity (“held-to-maturity debt securities”) are stated at amortized cost on the balance sheets. Available-for-sale securities with available fair market values are stated at fair market values. Unrealized gains and unrealized losses on these available-for-sale securities are reported, net of applicable income taxes, as a separate component of the net assets.
Realized gains or losses on sale of the available-for-sale securities are computed using primarily the moving-average cost.
Available-for-sale securities with no available fair market values are stated primarily at moving-average cost.
(f) Allowance for Doubtful AccountsTo provide for losses from bad debts, the allowance is provided according to the actual rate of default for ordinary receivables and in view of the probability of recovery for specific doubtful receivables.
(g) InventoriesInventories are stated at the lower of cost or market, using principally the gross-average cost method. The carrying value on the consolidated balance sheets is stated by the devaluation method based on declines in profitability.
(h) Property, Plant and Equipment Property, plant and equipment is stated at cost, in principle. Depreciation of property, plant and equipment is computed by the straight-line method.
(i) Intangible Assets The Company and some of the consolidated subsidiaries principally apply the straight-line method over 5 years to amortize intangible assets.
28 S H O W A D E N K O K . K . A N N U A L R E P O R T 2 0 1 6
Notes to Financial StatementsShowa Denko K.K. and Consolidated Subsidiaries

(j) Leased Assets Leased assets in finance lease transactions that do not transfer ownership to the lessee are depreciated using the straight-line method on the assumption that the useful life is equal to the lease term and the residual value is equal to zero. For leases with a residual value guarantee, the contracted residual value is considered to be the residual value for financial accounting purposes.
Please note that finance lease transactions, other than those involving the transfer of ownership and which commenced on or before December 31, 2008, are accounted for by the same methods as for operating lease transactions.
(k) Provision for Business Structure ImprovementThe Company and some of the consolidated subsidiaries record the provision for business structure improvement on an accrual basis to provide for expenses and losses resulting from their restructuring programs.
(l) Provision for Bonuses A provision for bonuses is provided at an amount estimated based on the bonus to be paid subsequent to the balance sheet date.
(m) Provision for Repairs The Company and some of the consolidated subsidiaries provide a provision for repairs in an amount estimated to be necessary for the scheduled maintenance for certain production equipment.
(n) Provision for Stock PaymentsTo provide for the Company’s share payment to its directors and corporate officers, the provision is provided based on the Director Share Payment Regulations.
(o) Provision for Niigata Minamata Disease To provide for lump-sum payments pursuant to the Special Measures Law Regarding Relief to Persons Suffering from Minamata Disease and Regarding Solutions to the Minamata Disease Problem, the Company makes a provision in the expected amount of such payments.
(p) Accouting Policy for Retirement Benefits(1) Method of attributing expected benefits to periods The attribution of expected benefits to periods up to the current consolidated fiscal year, upon calculating retirement benefit obligations, is done on the benefit formula basis.
(2) Method of amortization of actuarial gain or loss and past service costs
The actuarial gain or loss is amortized starting from the year after such an actuarial loss is determined on a straight-line basis over certain periods (mainly 12 years) within the average remaining service periods.
Past service costs are amortized on a straight-line basis over certain periods (mainly 12 years) within the average remaining service periods.
(3) Application of a simplified method to small businessesFor the calculation of liabilities concerning retirement benefits and retirement benefit expenses, some consolidated subsidiaries have adopted a simplified method, which deems term-end amounts payable for voluntary retirement related to retirement benefits as retirement benefit obligations.
(q) Income Taxes Income taxes consist of corporation, enterprise and inhabitants taxes. The provision for income taxes is computed based on the pretax income of each of the Company and its consolidated subsidiaries with certain adjustments required for consolidation and tax purposes. The asset and liability approach is used to recognize deferred tax assets and liabilities for the expected future tax consequences of temporary differences between the carrying amounts and the tax bases of assets and liabilities. (Valuation allowances are recorded to reduce deferred tax assets based on the assessment of the realizability of the tax benefits.)
Application of the Consolidated Taxation System The Company and certain domestic subsidiaries adopt the consolidated taxation system.
(r) Derivative Financial Instruments and Hedge AccountingThe Company and certain subsidiaries state all derivative financial instruments at fair value and recognize changes in fair value as gains or losses unless the derivative financial instruments are used for hedging purposes.
If the derivative financial instruments meet certain hedging criteria, the Company and certain subsidiaries defer recognition of gains or losses resulting from changes in fair value of derivative financial instruments until the related gains or losses on hedged items are recognized.
However, when forward exchange contracts meet certain hedging criteria, the hedged items are stated by the forward exchange contracts rate. If interest rate swap contracts meet certain hedging criteria, the net amount to be paid or received under the interest rate swap contracts is added to or deducted from interest on the assets or liabilities for which the interest rate swap contracts were executed.
Hedge accounting is not applied at some of the foreign subsidiaries.
(s) ReclassificationsCertain reclassifications have been made in the 2015 financial statements to conform to the presentation of 2016.
29
Notes to Financial Statements

3. CHANGES IN ACCOUNTING POLICIES Application of Accounting Standard for Business Combinations The Accounting Standard for Business Combinations (Accounting Standards Board of Japan [ASBJ] Statement No. 21, revised on September 13, 2013, “Accounting Standard for Business Combinations”), the Accounting Standard for Consolidated Financial Statements (ASBJ Statement No. 22, revised on September 13, 2013, “Accounting Standard for Consolidated Financial Statements”), and the Accounting Standard for Business Divestitures (ASBJ Statement No. 7, revised on September 13, 2013, “Accounting Standard for Business Divestitures”) have been applied effective from the fiscal year ended December 31, 2016. Under these adopted accounting standards, the Company records differences arising from changes in its ownership interests in subsidiaries over which it retains control as capital surplus. In addition, the Company records acquisition-related costs as expenses in the consolidated fiscal year in which the costs are incurred. Regarding business combinations taking place on and after the beginning of the year ended December 31, 2016, the Company changed the method to reflect changes in the allocation of acquisition costs arising from the finalization of provisional accounting treatment in the consolidated financial statements for the consolidated fiscal year in which the acquisition occurs. Furthermore, a change in presentation has been made to net income, and the presentation of minority interests has been changed to non-controlling interests. To reflect these changes in presentation, the consolidated financial statements for the previous year have been restated.
In the consolidated statement of cash flows for the fiscal year ended December 31, 2016, cash flows related to purchase or sales of shares of subsidiaries not resulting in change in scope of consolidation are included in the section of cash flows from financing activities, while expenses related to purchase of shares in subsidiaries resulting in a change in the scope of consolidation, and cash flows related to expenses arising from purchase or sales of shares in subsidiaries not resulting in a change in the scope of consolidation, are included under the operating activities section on the statements of cash flows.
As a result, operating income, ordinary income and income before income taxes for the fiscal year ended December 31,2016, decreased by ¥1,137 million, respectively, and the effect of capital surplus at the end of December 2016 was immaterial.
In the consolidated statement of cash flows for the fiscal year ended December 31, 2016, cash flows related to purchase or sales of shares of subsidiaries not resulting in change in scope of consolidation are included in the section of cash flows from financing activities, while expenses related to purchase of shares in subsidiaries resulting in a change in the scope of consolidation, and cash flows related to expenses arising from purchase or sales of shares in subsidiaries not resulting in a change in the scope of consolidation, are included under the operating activities section on the statements of cash flows.
The effect on per-share information is described in Per share amounts, Consolidated Statement of Income.
4. ADDITIONAL INFORMATION(a) Board Benefit Trust (BBT)The Company reviewed its director compensation scheme and has introduced a new stock compensation scheme called Board Benefit Trust (BBT) (“the Scheme”) for directors and corporate officers from the fiscal year ended December 31, 2016, with the aim of enhancing their awareness of the importance of contributing to improvement in enterprise value and business performance over the medium to long term.
For accounting treatment concerning this trust agreement, the Company applied the gross method in which the assets and liabilities of the trust are recorded as assets and liabilities in the balance sheet by referring to the Practical referring to the Practical Solution on Transactions of Delivering the Company’s Own Stock to Employees etc. through Trusts (ASBJ Practical Issues Task Force [PITF] No. 30, issued on March 26, 2015).
(1) Outline of the transactionIn this Scheme, the shares of the Company are granted to its directors (excluding outside directors) and corporate officers pursuant to the Director Share Grant Regulations set forth by the Company.
The Company grants performance-linked points to its directors and corporate officers every year, and grants shares of the Company to them based on the number of points granted when they resign from the Company. Provided that, however, with regard to a certain portion of the points, an amount of money corresponding to the prevailing market price of the Company’s shares will be paid to any director or corporate officer meeting the relevant requirements set forth in the Director Share Grant Regulations. The Company’s shares that are granted to directors and corporate officers, including those to be granted in the future, shall be acquired by the trust using the entrusted funds and separately managed as trusted assets.
(2) Residual shares of the Company in the trustResidual shares of the Company in the trust have been recorded as treasury stock under net assets at the book value in the trust (excluding the amount of ancillary expenses). The book value and the number of such treasury stock at the end of the fiscal year ended December 31, 2016 were ¥337 million and 300,000 shares, respectively.
(b) Acquisition of Shares in the Graphite Electrode Business of SGL Carbon SE
The Company reached an agreement with SGL Carbon SE (“SGL Carbon”) that the Company will acquire all shares of SGL GE Holding GmbH (“SGL GE”), which engages in the graphite electrode business, from SGL CARBON GmbH, a wholly owned subsidiary of SGL Carbon, for an enterprise value of 350 million euros, and that SGL GE will become a subsidiary of the Company. A sale and purchase agreement was concluded on October 20, 2016, upon the approval obtained at the Company’s Board of Directors’ meeting held on the same day.
30 S H O W A D E N K O K . K . A N N U A L R E P O R T 2 0 1 6
Notes to Financial StatementsShowa Denko K.K. and Consolidated Subsidiaries
(1) Background of the acquisitionThe global steel demand is predicted to be low at around 1% per year and the business environment in the graphite electrode industry remains challenging due to the weak demand and the severe competition. In these circumstances, the Company has decided to increase the competitiveness of its graphite electrode business through the effect of integration with SGL GE, which has highly cost-competitive business in three key regions: Europe, the United States, and Southeast Asia.
(2) Name of the target of share acquisitionSGL CARBON GmbH
(3) Company name, business description and size of the acquisition target
( i ) Name: SGL GE Holding GmbH( ii ) Description of major businesses: Manufacture, research,
development and sales of graphite electrodes(iii) Size
Capital: 25,002 eurosSales: 375 million euros (for the fiscal year ended December
2015, for reference only)
(4) Timing for share acquisitionMid-2017 (provisional)The share acquisition is subject to the approval of the relevant authorities under applicable competition laws in Germany, the United States and other countries. Depending on the progress with obtaining the approval, the timing of the share acquisition may be changed.
(5) Number of shares to be acquired, acquisition price and shareholding ratio after acquisition
( i ) Number of shares to be acquired: 25,002 shares( ii ) Acquisition price: ¥15.6 billion (estimated price)
The acquisition price mentioned above has been calculated by adding the estimated advisory and other fees to the acquisition price of SGL GE at the conversion rate of ¥115 to 1 euro. The acquisition price will be finalized to reflect price adjustments at the time of execution of the share purchase set under the share purchase agreement. Although the acquisition price listed above reflects current estimates, the final acquisition price is subject to price adjustments.
(iii) Shareholding ratio after acquisition: 100%
(6) Funding method for acquisitionThe Company’s cash on hand and borrowings.
5. JAPANESE YEN AND TRANSLATION INTO U.S. DOLLARS
The Companies’ accounting records are maintained in yen. Yen amounts included in the financial statements are rounded to the nearest one million unit. Therefore, the total and subtotal amounts presented in the financial statements may not equal the exact sum of the individual balances. The U.S. dollar amounts appearing in the accompanying financial statements and notes thereto represent the arithmetical results of translating yen into U.S. dollars at the rate of ¥116.49 to US$1.00, the approximate rate of exchange at December 31, 2016. The inclusion of such U.S. dollar amounts is solely for the convenience of readers; it does not carry with it any implication that yen amounts have been or could be converted into U.S. dollars at that rate.
6. CASH FLOW STATEMENTSCash and deposits as of December 31, 2016 and 2015 on the consolidated balance sheets and cash equivalents at December 31, 2016 and 2015 on the consolidated statements of cash flows were reconciled as follows:
Millions of yen Thousands ofU.S. dollars
2016 2015 2016
Cash and deposits ¥ 69,914 ¥ 64,054 $ 600,170
Original maturities more than three months (13,728) (9,457) (117,849)
Cash and cash equivalents ¥ 56,186 ¥ 54,597 $ 482,321
7. FINANCIAL INSTRUMENTS(a) Overview (1) Management policy relating to financial instruments The Companies finance necessary long-term funds by bank loans and bond issues following the capital investment plans and finance short-term operating funds by bank loans and commercial paper. Temporary excess funds are invested exclusively in financial instruments which have fixed returns and low risk of falling below par values. The Companies use derivative transactions to hedge the following risks and do not enter into derivative transactions for speculative purposes.
(2) Types of financial instruments and related risksOperating receivables, such as notes and accounts receivable, are exposed to credit risk. Foreign-currency-denominated accounts receivable incurred through exports are exposed to foreign currency fluctuation risk. However, the Companies hedge the risk by utilizing forward exchange contracts, currency options, and currency swaps based on internal rules that set out foreign currency risk management principles.
Marketable securities and investment securities mainly consist of the stocks of partner companies to maintain and strengthen their business relationships and are exposed to market fluctuation risk.
31
Notes to Financial Statements

Operating payables, such as notes and accounts payable–trade and other, are due within one year. Foreign-currency-denominated accounts payable incurred through imports of raw materials are exposed to foreign currency fluctuation risk. The Companies hedge the risk by utilizing forward exchange contracts following internal rules that set out the foreign currency risk management principles. Short-term debt and commercial paper are mainly used to finance short-term operating funds, and long-term debts and bonds are mainly used to finance equipment funds. Since some of long-term debt is made up of variable interest rate loans, it is exposed to interest rate fluctuation risk. However, interest rate swaps are used for most loans to hedge the risk.
The Companies utilize derivative transactions, such as forward exchange contracts, currency options, and currency swaps, to hedge the foreign currency fluctuation risk of operating receivables and payables denominated in foreign currencies and financing transactions denominated in foreign currencies. Interest rate swaps are utilized to hedge the interest rate fluctuation risk, and aluminum forward transactions are utilized to hedge the market fluctuation risk.
(3) Risk management relating to financial instruments ( i ) Credit risk management (risk of default by the
counterparties) The Company follows internal rules that set out accounts receivable management principles. The compliance department works with the sales division in each sector and monitors the customers’ credit conditions periodically and reviews the sales policy checking the sales volume and balances. The Company takes measures to obtain information on and minimize the credit risk that may arise due to the deterioration in the financial condition of their customers. Consolidated subsidiaries monitor their customers’ financial and credit conditions based on their internal rules.
The held-to-maturity debt are limited to only highly rated securities.
The Companies utilize derivative transactions only with creditworthy financial institutions and trading companies to minimize credit risk.
The maximum credit risk as of December 31, 2016 is disclosed as the balance sheet amount of financial instruments exposed to credit risk.
(ii) Market risk management (risk of fluctuations in foreign currency and interest rates)
For operating receivables and payables and loans denominated in foreign currencies, the Company and certain consolidated subsidiaries utilize forward exchange contracts, currency options, and currency swaps to hedge some of the foreign currency fluctuation risk, which is categorized by currency and maturity date. The Company and certain consolidated subsidiaries utilize currency swaps to hedge the interest rate fluctuation risk of loans.
For marketable securities and investment securities, the Companies regularly review the fair value and issuers’ financial
conditions and review the Companies’ portfolio on an ongoing basis, except for held-to-maturity debt securities, according to market conditions and the business relationships with counterparties.
The Company has internal management rules that set out the approval authorities and procedures of the derivative transactions.
The derivative transactions are carried out based on the appropriate approver set out in the internal rules. For currency-related derivative transactions, each division and the treasury department perform and manage transactions and report to the director in charge periodically. For interest-related derivative transactions, the treasury department performs and manages the transactions and reports to the director in charge periodically. For commodity-related derivative transactions, each division performs and manages the transactions and reports to the director in charge periodically. Consolidated subsidiaries perform and manage derivative transactions based on their internal management standards.
(iii) Liquidity risk management (risk of default on payment due dates)
The Company manages liquidity risk by requiring the treasury department to prepare and update cash plans, based on the schedule for cash inflows and disbursements in each division. In addition, the Company signs commitment line contracts and makes other arrangements with financial institutions to secure the necessary liquidity. Consolidated subsidiaries manage their liquidity risk through similar procedures.
(4) Supplemental explanation on fair value of financial instruments
As well as the values being based on market prices, fair value of financial instruments includes values which are reasonably calculated in case market prices do not exist. As the calculation of those values uses certain assumptions, those values may vary in the case of different assumptions being applied. Also, for the contract amount and others regarding derivative transactions described in Note 9. DERIVATIVE FINANCIAL INSTRUMENTS, the contract amount itself does not indicate market risk related to derivative transactions.
32 S H O W A D E N K O K . K . A N N U A L R E P O R T 2 0 1 6
Notes to Financial StatementsShowa Denko K.K. and Consolidated Subsidiaries

(b) Fair Value of Financial InstrumentsAt December 31, 2016 and 2015 book value, fair value and difference were as follows.
The financial instruments whose fair value is extremely difficult to determine are not included below.Year ended December 31, 2016 Millions of yen
Book value Fair value Difference
(1) Cash and deposits ¥ 69,914 ¥ 69,914 ¥ —
(2) Notes and accounts receivable-trade 143,816 143,816 —
(3) Investment securities 44,184 44,184 —
Total assets ¥ 257,914 ¥ 257,914 ¥ —
(1) Notes and accounts payable-trade ¥ 104,005 ¥ 104,005 ¥ —
(2) Short-term debt 71,895 71,895 —
(3) Current portion of long-term debt 58,234 58,352 118
(4) Accounts payable-other 53,790 53,790 —
(5) Long-term debt less current portion 229,800 230,003 203
Total liabilities ¥ 517,724 ¥ 518,045 ¥ 320
Derivative transactions* ¥ 381 ¥ 381 ¥ —
Year ended December 31, 2015 Millions of yen
Book value Fair value Difference
(1) Cash and deposits ¥ 64,054 ¥ 64,054 ¥ —
(2) Notes and accounts receivable-trade 135,077 135,077 —
(3) Investment securities 43,439 43,439 —
Total assets ¥ 242,570 ¥ 242,570 ¥ —
(1) Notes and accounts payable-trade ¥ 103,737 ¥ 103,737 ¥ —
(2) Short-term debt 81,000 81,000 —
(3) Current portion of long-term debt 59,386 59,546 159
(4) Accounts payable-other 62,063 62,063 —
(5) Long-term debt less current portion 228,449 228,779 330
Total liabilities ¥ 534,636 ¥ 535,125 ¥ 490
Derivative transactions* ¥ (542) ¥ (542) ¥ —
Year ended December 31, 2016 Thousands of U.S. dollars
Book value Fair value Difference
(1) Cash and deposits $ 600,170 $ 600,170 $ —
(2) Notes and accounts receivable-trade 1,234,580 1,234,580 —
(3) Investment securities 379,296 379,296 —
Total assets $ 2,214,046 $ 2,214,046 $ —
(1) Notes and accounts payable-trade $ 892,820 $ 892,820 $ —
(2) Short-term debt 617,176 617,176 —
(3) Current portion of long-term debt 499,908 500,917 1,009
(4) Accounts payable-other 461,761 461,761 —
(5) Long-term debt less current portion 1,972,703 1,974,444 1,741
Total liabilities $ 4,444,368 $ 4,447,118 $ 2,750
Derivative transactions* $ 3,271 $ 3,271 $ —
*Derivative assets and liabilities are on a net basis.
Notes 1. Valuation method for financial instruments and information on marketable securities and derivative transactions
AssetsCash and deposits and Notes and accounts receivable-trade
The book value is deemed to approximate the fair value since these are scheduled to be settled in a short period of time.
Investment securitiesFair value of these securities is based on the price on stock exchanges. Refer to Note 8. SECURITIES regarding the securities categorized by holding purposes.
LiabilitiesNotes and accounts payable-trade, Short-term debt, Commercial paper (included in the above Short-term debt), and Accounts payable-other
The book value is deemed to approximate the fair value since these are scheduled to be settled in a short period of time.
Current portion of long-term debt and Long-term debt (included in the above Long-term debt less current portion)
The fair value is measured as the net present value of estimated cash flows by discounting the principal and interest value using the interest rate applied to the new loans. Part of the long-term loans are variable rate loans, and they are subject to special treatment of interest rate swaps (refer to Note 9. DERIVATIVE FINANCIAL INSTRUMENTS); the fair value is measured as the net present value of estimated cash flows by discounting the total amount of principal and interest processed as interest rate swaps using the interest rate applied to the new loans.
Current portion of bonds (included in the above Current portion of long-term debt) and Bonds (included in the above Long-term debt less current portion)
As for bonds with short maturities, the book value is deemed to approximate the fair value since these are scheduled to be settled in a short period of time. For others, fair value is based on the market prices.
Derivative transactionsRefer to Note 9. DERIVATIVE FINANCIAL INSTRUMENTS.
2. Financial instruments for which fair value is extremely difficult to determine
Millions of yen Thousands ofU.S. dollars
2016 2015 2016
Non-listed equity securities ¥30,767 ¥33,129 $264,119
These securities are not included in the above Investment securities, as there was no quoted market value, estimating the future cash flows is deemed to be practically impossible and it is extremely difficult to determine the fair value.
3. The redemption schedule for financial assets and securities with maturities
Year ended December 31, 2016 Millions of yen
Due in 1 yearor less
Due after 1 yearthrough 5 years
Due after 5 yearsthrough 10 years
Due after10 years
Cash and deposits ¥ 69,914 ¥ — ¥ — ¥ —
Notes and accounts receivable-trade 143,802 14 — —
Total ¥ 213,716 ¥ 14 ¥ — ¥ —
Year ended December 31, 2015 Millions of yen
Due in 1 yearor less
Due after 1 yearthrough 5 years
Due after 5 yearsthrough 10 years
Due after10 years
Cash and deposits ¥ 64,054 ¥ — ¥ — ¥ —
Notes and accounts receivable-trade 134,655 422 — —
Total ¥ 198,709 ¥ 422 ¥ — ¥ —
Year ended December 31, 2016 Thousands of U.S. dollars
Due in 1 yearor less
Due after 1 yearthrough 5 years
Due after 5 yearsthrough 10 years
Due after10 years
Cash and deposits $ 600,170 $ — $ — $ —
Notes and accounts receivable-trade 1,234,458 122 — —
Total $ 1,834,628 $ 122 $ — $ —
33
Notes to Financial Statements

8. SECURITIES(a) Available-for-sale securitiesYear ended December 31, 2016 Millions of yen
Book value Acquisition cost Difference
Available-for-sale securities whose book value exceeds their acquisition cost Equity securities ¥ 24,315 ¥ 14,341 ¥ 9,974
Available-for-sale securities whose book value is less than their acquisition cost Equity securities 19,869 22,027 (2,158)
Total ¥ 44,184 ¥ 36,368 ¥ 7,816
Year ended December 31, 2015 Millions of yen
Book value Acquisition cost Difference
Available-for-sale securities whose book value exceeds their acquisition cost Equity securities ¥ 22,817 ¥ 14,569 ¥ 8,247
Available-for-sale securities whose book value is less than their acquisition cost Equity securities 20,622
21,755 (1,133)
Total ¥ 43,439 ¥ 36,324 ¥ 7,115
Year ended December 31, 2016 Thousands of U.S. dollars
Book value Acquisition cost Difference
Available-for-sale securities whose book value exceeds their acquisition cost Equity securities $ 208,733 $ 123,110 $ 85,623
Available-for-sale securities whose book value is less than their acquisition cost Equity securities 170,563 189,086 (18,523)
Total $ 379,296 $ 312,197 $ 67,100
(b) Available-for-sale securities sold in the years ended December 31, 2016 and 2015:
Year ended December 31, 2016 Millions of yen
Sales Gross gain Gross loss
Equity securities ¥30 ¥26 ¥ —
Total ¥30 ¥26 ¥ —
Year ended December 31, 2015 Millions of yen
Sales Gross gain Gross loss
Equity securities ¥23,725 ¥8,053 ¥ (1)
Total ¥23,725 ¥8,053 ¥ (1)
Year ended December 31, 2016 Thousands of U.S. dollars
Sales Gross gain Gross loss
Equity securities $259 $224 $ —
Total $259 $224 $ —
(c) Impairment of securitiesFor the years ended December 31, 2016 and 2015, the Companies recorded an impairment loss of ¥55 million (US$473 thousand) on available-for-sale securities and ¥1,812 million on available-for-sale securities with fair market values, respectively.
Securities are deemed to be “substantially declined” when their fair values have declined 30% or more. When their fair values have declined 50% or more, the impairment losses are recorded on those securities. When their fair values have declined between 30% and 50%, the impairment losses are recorded on those securities unless such values are considered to be recoverable on an individual basis.
4. The scheduled maturities of bonds and long-term debt after December 31, 2016 and 2015
Year ended December 31, 2016 Millions of yen
Due in 1 year or less Due after 1 year through 2 years
Due after 2 years through 3 years
Due after 3 years through 4 years
Due after 4 years through 5 years Due after 5 years
(1) Short-term debt ¥ 71,895 ¥ — ¥ — ¥ — ¥ — ¥ —
(2) Long-term debt 58,234 57,808 41,293 29,227 41,676 59,796
Total ¥ 130,129 ¥ 57,808 ¥ 41,293 ¥ 29,227 ¥ 41,676 ¥ 59,796
Year ended December 31, 2015 Millions of yen
Due in 1 year or less Due after 1 year through 2 years
Due after 2 years through 3 years
Due after 3 years through 4 years
Due after 4 years through 5 years Due after 5 years
(1) Short-term debt ¥ 81,000 ¥ — ¥ — ¥ — ¥ — ¥ —
(2) Long-term debt 59,386 53,068 51,228 48,454 16,599 59,100
Total ¥ 140,387 ¥ 53,068 ¥ 51,228 ¥ 48,454 ¥ 16,599 ¥ 59,100
Year ended December 31, 2016 Thousands of U.S. dollars
Due in 1 year or less Due after 1 year through 2 years
Due after 2 years through 3 years
Due after 3 years through 4 years
Due after 4 years through 5 years Due after 5 years
(1) Short-term debt $ 617,176 $ — $ — $ — $ — $ —
(2) Long-term debt 499,908 496,251 354,481 250,899 357,761 513,312
Total $ 1,117,085 $ 496,251 $ 354,481 $ 250,899 $ 357,761 $ 513,312
34 S H O W A D E N K O K . K . A N N U A L R E P O R T 2 0 1 6
Notes to Financial StatementsShowa Denko K.K. and Consolidated Subsidiaries

9. DERIVATIVE FINANCIAL INSTRUMENTS(a) Derivative Transactions to Which Hedge Accounting is Not Applied
Millions of yen Thousands of U.S. dollars
2016 2015 2016
Contract amount
Contract amount
over 1 yearFair value Valuation
gain (loss)Contract amount
Contract amount
over 1 yearFair value Valuation
gain (loss)Contract amount
Contract amount
over 1 yearFair value Valuation
gain (loss)
(1) Currency related:
Forward exchange contracts:
Buying
U.S.Dollar ¥ 4 ¥ — ¥ (0) ¥ (0) ¥ — ¥ — ¥ — ¥ — $ 36 $ — $ (0) $ (0)
Selling
U.S.Dollar ¥ 616 ¥ — ¥ (39) ¥ (39) ¥ 678 ¥ — ¥ (14) ¥ (14) $ 5,285 $ — $ (335) $ (335)
Euro 42 — (2) (2) 31 — 1 1 357 — (20) (20)
(2) Interest rate related:
Interest rate swaps: Receipt-variable rate/Payment-fixed rate ¥ 442 ¥ — ¥ (1) ¥ (1) ¥ 5,291 ¥529 ¥(44) ¥(44) $ 3,796 $ — $ (12) $ (12)
Note: Fair value calculation method:Fair values of forward exchange contracts are stated by the forward exchange rates. Fair values of currency and interest rate swaps are measured at the quoted price obtained from the financial institutions.
(b) Derivative Transactions to Which Hedge Accounting is Applied Millions of yen Thousands of U.S. dollars
2016 2015 2016
Contractamount
Contract amount
over 1 yearFair value Contract
amountContract amount
over 1 yearFair value Contract
amountContract amount
over 1 yearFair value
(1) Currency related:
Principle method
Forward exchange contracts:
Buying
U.S.Dollar ¥ 8,680 ¥ 1,250 ¥ 154 ¥ 6,748 ¥ 1,034 ¥ (10) $ 74,516 $ 10,734 $ 1,325
Euro 5 — 0 6 — (0) 42 — 1
Selling
U.S.Dollar 11,880 — (842) 11,556 — 131 101,980 — (7,229)
Euro 211 — (5) 685 — 8 1,807 — (44)
Allocation method
Forward exchange contracts:
Buying
U.S.Dollar ¥ 16,157 ¥ — ¥ — ¥ 6,533 ¥ — ¥ — $ 138,696 $ — $ —
Euro 3 — — 6 — — 29 — —
Selling
U.S.Dollar 13,307 — — 9,745 — — 114,237 — —
Euro 1,567 — — 2,906 — — 13,450 — —
Yuan Renminbi 1,296 — — 103 — — 11,122 — —
Currency swaps:
Receipt Yen
Payment U.S.Dollar ¥ 10,400 ¥ 10,400 ¥ — ¥10,400 ¥ 10,400 ¥ — $ 89,278 $ 89,278 $ —
(2) Interest rate related:
Special method
Interest rate swaps:
Receipt-variable rate/Payment-fixed rate ¥ 39,175 ¥ 29,990 ¥ — ¥65,606 ¥ 52,356 ¥ — $ 336,294 $ 257,446 $ —
(3) Commodity related:
Principle method
Aluminum forward contracts:
Buying ¥ 23,470 ¥ 16,392 ¥ 1,118 ¥ 13,923 ¥ 6,131 ¥ (575) $ 201,473 $ 140,719 $ 9,599
Selling 1,792 — (4) 1,556 — (40) 15,385 — (31)
35
Notes to Financial Statements

The aggregate annual maturities of the noncurrent portion of long-term debt were as follows:
Years ending December 31 Millions of yen Thousands ofU.S. dollars
2018 ¥ 57,808 $ 496,251
2019 41,293 354,481
2020 29,227 250,899
2021 41,676 357,761
2022 and thereafter 59,796 513,312
Total ¥229,800 $1,972,703
At December 31, 2016 and 2015, the assets pledged as collateral for long-term debt were as follows:
Millions of yen Thousands ofU.S. dollars
2016 2015 2016Assets pledged as collateral
Investment securities ¥ 3,786 ¥ 3,790 $ 32,504
Property, plant and equipment, less accumulated depreciation 144,501 150,890 1,240,462
Total ¥ 148,288 ¥ 154,681 $ 1,272,967
Secured short-term debt and long-term debt
Long-term debt (includes due within 1 year) ¥ 400 ¥ 4 $ 3,434
Notes and accounts payable-trade 121 137 1,039
Total ¥ 521 ¥ 141 $ 4,472
12. RETIREMENT BENEFITS(a) Defined-benefit pension plan, includes the plans using
the simplified method(1) Reconciliation of opening and closing balance of
retirement benefit obligation for the years ended December 31, 2016 and 2015 was as follows:
Millions of yen Thousands ofU.S. dollars
2016 2015 2016Balance of retirement benefit obligation
at the beginning of year ¥92,752 ¥96,351 $796,224
Cumulative effects of changes in accounting policies — (4,249) —
Restated balance at the beginning of year 92,752 92,102 796,224
Service cost 2,346 2,335 20,143
Interest cost 657 757 5,637
Actuarial gain and loss 9,513 3,573 81,664
Retirement benefits paid (6,824) (6,037) (58,580)
Past service cost (686) 159 (5,889)
Increase from changes in scope of consolidation 1,378 — 11,829
Other 33 (136) 280
Balance of the retirement benefit obligation at the end of year ¥99,169 ¥92,752 $851,308
Notes: 1. Main items hedged by forward exchange contracts are accounts payable for buying, accounts receivable for selling and long-term debt by interest rate swaps. Main items hedged by aluminum forward transactions are aluminum metal transactions.
Notes: 2. Fair value calculation method:Fair values of forward exchange contracts are stated by the forward exchange rates. Fair values of currency swaps are measured at the quoted price obtained from the financial institutions. Fair values of aluminum forward transactions are stated by forward quotations of the London Metal Exchange.
Notes: 3. Fair values of forward exchange contracts and currency swaps that meet allocation method criteria are reflected in the fair values of accounts receivable, accounts payable and debts of their hedged items.
Notes: 4. Fair values of interest rate swaps that meet special treatment criteria are reflected in the fair values of long-term debt of their hedged item.
10. EFFECT OF YEAR-END DATE ON FINANCIAL STATEMENTS
The year-end date of 2016, namely, December 31, 2016, was a bank holiday. Although notes receivable and payable maturing on this date were accordingly settled on January 4, 2017, the Companies accounted for those notes in their financial statements as if they had been settled on the maturity date.
Notes outstanding at December 31, 2016 and 2015 dealt with in the above-mentioned manner were as follows:
Millions of yen Thousands ofU.S. dollars
2016 2015 2016Notes receivable ¥726 ¥ 684 $6,234
Notes payable 816 1,066 7,009
11. SHORT-TERM DEBT AND LONG-TERM DEBT At December 31, 2016 and 2015, the short-term debt of the Companies consisted of the following:
Millions of yen Thousands ofU.S. dollars
2016 2015 2016Bank loans at the average interest rate
of 0.59% ¥66,895 ¥69,000 $574,254
Commercial paper 5,000 12,000 42,922
Total ¥71,895 ¥81,000 $617,176
At December 31, 2016 and 2015, the long-term debt of the Companies consisted of the following:
Millions of yen Thousands ofU.S. dollars
2016 2015 20160.67% bonds due 2016 ¥ — ¥ 10,000 $ —
0.63% bonds due 2017 10,000 10,000 85,844
0.63% bonds due 2021 15,000 15,000 128,766
0.20% bonds due 2021 10,000 — 85,844
0.734% bonds due 2022 10,000 10,000 85,844
0.50% bonds due 2026 7,000 — 60,091 Loans principally from banks and
insurance companies due 2017 to 2074 at the average interest rate of 0.84% 236,035 242,835 2,026,222
288,035 287,835 2,472,612
Less: current portion (58,234) (59,386) (499,908)
Total ¥229,800 ¥228,449 $1,972,703
36 S H O W A D E N K O K . K . A N N U A L R E P O R T 2 0 1 6
Notes to Financial StatementsShowa Denko K.K. and Consolidated Subsidiaries

(5) Remeasurements of defined benefit plansThe components of items (before tax) reported under remeasurements of defined benefit plans for the years ended December 31, 2016 and 2015 were as follows:
Millions of yen Thousands ofU.S. dollars
2016 2015 2016
Past service cost ¥ (102) ¥ 852 $ (872)
Actuarial gain and loss 8,983 (1,224) 77,118
Total ¥8,882 ¥ (372) $76,246
(6) Accumulated remeasurements of defined benefit plansThe components of items (before tax) reported under accumulated remeasurements of defined benefit plans for the years ended December 31, 2016 and 2015 were as follows:
Millions of yen Thousands ofU.S. dollars
2016 2015 2016
Unrecognized past service cost ¥ (18) ¥ 83 $ (157)
Unrecognized actuarial gain and loss 15,966 6,983 137,063
Total ¥15,948 ¥7,066 $136,907
(7) Matters regarding plan assets( i ) Major content of the plan assetsThe percentages of major asset types that account for the total plan assets as of December 31, 2016 and 2015 were as follows:
Ratio
2016 2015
Bonds 29 % 27 %
Stocks 44 44
General accounts of life insurance company 24 27
Cash and deposits 3 2
Total 100 % 100 %
(ii) Method for setting the long-term rate of expected return on plan assets
To determine the long-term rate of expected return on plan assets, the current and anticipated long-term yield rates of various assets that constitute the plan assets as well as the current and projected distribution of plan assets, have been taken into account.
(8) Matters regarding the assumptions for actuarial calculationsKey assumptions for actuarial calculations as of December 31, 2016 and 2015 were as follows:
Ratio
2016 2015
Discount rate Mainly 0.2% Mainly 0.7%
Long-term rate of expected return on plan assets Mainly 2.0% Mainly 2.0%
(b) Defined contribution pension planThe amounts required to be contributed by consolodated subsidiaries for the years ended December 31, 2016 and 2015 were ¥314 million (US$2,696 thousand), and ¥362 million, respectively.
(2) Reconciliation of opening and closing balance of plan assets for the years ended December 31, 2016 and 2015 was as follows:
Millions of yen Thousands ofU.S. dollars
2016 2015 2016
Balance of plan assets at the beginning of year ¥77,587 ¥74,256 $666,041
Expected return on plan assets 1,634 1,477 14,024
Actuarial gain and loss (1,021) (629) (8,763)
Contribution from employer 4,613 8,149 39,598
Retirement benefits paid (6,695) (5,632) (57,473)
Increase from changes in scope of consolidation 1,458
— 12,516
Other 38 (34) 323
Balance of plan assets at the end of year ¥77,613 ¥77,587 $666,265
(3) Reconciliation of the ending balance of retirement benefit obligations and plan assets, and the net defined benefit liability and the net defined benefit asset for the years ended December 31, 2016 and 2015 was as follows:
Millions of yen Thousands ofU.S. dollars
2016 2015 2016
Funded retirement benefit obligations ¥95,994 ¥89,877 $824,058
Plan assets (77,613) (77,587) (666,265)
18,381 12,289 157,792
Unfunded retirement benefit obligations 3,176 2,877 27,264
Net amount of relevant liabilities and assets on the consolidated balance sheets 21,557 15,166 185,056
Net defined benefit liability 21,923 15,185 188,187
Net defined benefit asset (365) (19) (3,131)
Net amount of relevant liabilities and assets on the consolidated balance sheets 21,557 15,166
185,056
(4) Retirement benefit expenses and the components of the amounts thereof for the years ended December 31, 2016 and 2015 were as follows:
Millions of yen Thousands ofU.S. dollars
2016 2015 2016
Service cost ¥2,346 ¥2,335 $20,143
Interest cost 657 757 5,637
Expected return on plan assets (1,634) (1,477) (14,024)
Amortization of actuarial gain and loss 990 1,299 8,501
Amortization of past service cost 0 (695) 2
Retirement benefit expenses related to the defined-benefit pension plan ¥2,360 ¥2,219 $20,259
37
Notes to Financial Statements
Note: Amendments to the amount of deferred tax assets and deferred tax liabilities due to a change in the income tax rate.
The Law for Partial Revision of the Income Tax Law (Law No. 15 of 2016) and the Law for Partial Revision of the Local Tax Law (Law No. 13 of 2016) were enacted by the Japanese Diet on March 29, 2016, resulting in a reduction in the rates of corporate income taxes from consolidated fiscal years beginning on or after April 1, 2016. Accordingly, the effective statutory tax rate used to calculate deferred tax assets and deferred tax liabilities has changed from the previously applicable rate of 32.3% to 30.9% for temporary differences expected to be reversed in the consolidated fiscal years beginning on January 1, 2017 and January 1, 2018, and to 30.6% for temporary differences expected to be reversed in the consolidated fiscal years beginning on or after January 1, 2019.
Further, with respect to the deduction of tax loss carryforwards, the limits are applied to the amount corresponding to 60% of income before the deduction of said carryforwards for the fiscal year beginning on or after January 1, 2017, the amount corresponding to 55% of income before the deduction of said carryforwards for the fiscal year beginning on or after January 1, 2018, and the amount corresponding to 50% of income before the deduction of said carryforwards for the year beginning on or after January 1, 2019.
As a result of these changes, compared with the previous methods, deferred tax assets (net of deferred tax liabilities) decreased by ¥599 million (US$5,139 thousand), remeasurements of defined benefit plans decreased by ¥262 million (US$2,248 thousand), deferred gains or losses on hedges increased by ¥2 million (US$19 thousand), valuation difference on available-for-sale securities increased by ¥25 million (US$215 thousand), and income taxes–deferred increased by ¥314 million (US$2,697 thousand) for the fiscal year ended December 31, 2016.
In addition, deferred tax liabilities for land revaluation decreased by ¥1,764 million (US$15,141 thousand) and revaluation reserve for land increased by the same amount.
14. IMPAIRMENT LOSSAt December 31, 2016, major impairment losses on fixed assets were as follows:
Location Major use Asset category Millions of yen Thousands ofU.S. dollars
Oyama City, Tochigi Prefecture
Production facilities
Land,etc.¥ 7,743 $ 66,468
Chichibu City Saitama Prefecture
Production facilities
Land,etc. 4,530 38,891
Hanam, Vietnam Production facilities
Machinery and equipment, etc. 932 8,003
Hsinchu, Taiwan Production facilities
Machinery and equipment, etc. 926 7,948
Johor, Malaysia Production facilities
Construction in progress, etc. 594 5,096
Other 919 7,886 Total ¥15,644 $134,291
13. INCOME TAXES(a) At December 31, 2016 and 2015, significant components
of deferred tax assets and liabilities were as follows:
Millions of yen Thousands of U.S. dollars
2016 2015 2016Deferred tax assets:
Tax loss carryforwards ¥18,815 ¥21,164 $161,516 Write-down of marketable and
investment securities 13,915
14,605 119,449 Allowance for doubtful accounts 5,079 7,221 43,596 Impairment loss 7,894 6,081 67,767 Net defined benefit liabillity 6,655 4,930 57,127 Depreciation and amortization 884 1,348 7,590 Loss on valuation of inventories 529 849 4,543 Unrealized earnings from the sale of fixed assets 693 765 5,947 Provision for bonuses 703 614 6,036 Deduction of foreign corporation tax
carried forward
407 557 3,493 Undetermined accrued liabilities 753 462 6,464 Provision for repairs 869 461 7,463 Write-down of golf club memberships 352 363 3,020 Deferred gains or losses on hedges 131 171 1,125 Other 3,256 2,817 27,952 Subtotal of deferred tax assets 60,935 62,407 523,089 Valuation allowance (41,653) (44,240) (357,567) Total deferred tax assets 19,282 18,169 165,523
Deferred tax liabilities:Amount of revaluation from the book value (3,524) (3,649) (30,252) Valuation difference on available-for-sale securities (2,498) (2,322) (21,446) Foreign subsidiaries' undistributed
retained earnings (1,699) (1,710) (14,585) Special depreciation reserve (1,558) (1,677) (13,372) Reserve for advanced depreciation of fixed assets (158) (183) (1,359) Other (774) (691) (6,643) Total deferred tax liabilities (10,211) (10,232) (87,657)
Net deferred tax assets ¥ 9,071 ¥ 7,937 $ 77,865
(b) The net deferred tax assets at December 31, 2016 and 2015 were included in the consolidated balance sheets as follows:
Millions of yen Thousands of U.S. dollars
2016 2015 2016Deferred tax assets — current ¥4,092 ¥3,029 $35,129 Deferred tax assets — noncurrent 9,115 8,877 78,249 Other current liabilities (95) (95) (819) Deferred tax liabilities — noncurrent (4,041) (3,873) (34,693)
(c) Significant items in the reconciliation of the normal income tax rate to the effective at December 31, 2016 and 2015 were as follows:
2016 2015Statutory tax rate 33.1 % 35.6 %Consolidated adjustment for loss on valuation of investments
in capital of subsidiaries and associates, etc. (4.0) (111.0) Differences of statutory tax rate in subsidiaries (5.8) (2.5) Effect on the reexamination of recoverability (0.9) 256.3 Deferred taxes on undistributed earnings of foreign subsidiaries (0.1) 4.5 Amortization of goodwill (0.0) 7.5 Effects of changes in the effective statutory tax rate, etc. 1.2 57.4 Unrealized earnings from the sale of fixed assets — (7.8) Other (2.4) (9.8)
Effective tax rate 21.1 % 230.2 %
38 S H O W A D E N K O K . K . A N N U A L R E P O R T 2 0 1 6
Notes to Financial StatementsShowa Denko K.K. and Consolidated Subsidiaries

(b) Operating Leases as a LesseeAt December 31, 2016 and 2015, assets leased under noncapitalized operating leases were as follows:
Future minimum lease payments for the remaining lease periods:
Millions of yen Thousands of U.S. dollars
2016 2015 2016Due within 1 year ¥ 301 ¥ 332 $ 2,584
Due over 1 year 2,460 1,560 21,118
Total ¥ 2,761 ¥ 1,893 $ 23,702
(c) Operating Leases as a LessorAt December 31, 2016 and 2015, noncancellable operating lease receivables for the remaining lease periods were as follows:
Future minimum lease receivables for the remaining lease periods:
Millions of yen Thousands of U.S. dollars
2016 2015 2016Due within 1 year ¥ 80 ¥ 83 $ 683
Due over 1 year 594 707 5,099
Total ¥ 674 ¥ 790 $ 5,782
17. CONTINGENT LIABILITIESAt December 31, 2016 and 2015, the Companies were guarantors for the borrowings below. The guarantees were principally for unconsolidated subsidiaries, affiliates and others.
Millions of yen Thousands of U.S. dollars
2016 2015 2016Guarantees ¥5,032 ¥5,550 $43,198
As the amounts include joint and several guarantors’ portions as well as the Companies’, the actual amounts that the Companies were contingently liable to pay were smaller than the above.
The amount for 2016 in the above table includes ¥3,963 million (US$34,019 thousand) of guarantee liabilities for PT Indonesia Chemical Alumina (ICA; an equity method affiliate owned 20% by the Company). In addition to the guarantee liabilities, the Company has invested in and provided long-term loans to ICA as described below. ICA did not pay back a loan due on December 15, 2016 to a syndicate of banks, and ICA is negotiating with them about its request for rescheduling of debt. The above-mentioned amount of guarantee liabilities (¥3,963 million, or US$34,019 thousand) is based on the Company’s investment ratio of 20% in ICA, as agreed with the syndicate of banks.
Millions of yen Thousands of U.S. dollars
Investment securities ¥4,109 $35,273
Long-term loans ¥6,889 $59,138
Other 1,134 9,732
Total ¥8,023 $68,870
18. NET ASSETSThe Corporation Law of Japan (the “Law”) provides that the entire amount paid for new shares may be credited to the stated capital, with the provision that, by resolution of the Board of Directors,
15. CONSOLIDATED STATEMENTS OF COMPREHENSIVE INCOME (LOSS)
Reclassification adjustments and tax effects for components of other comprehensive income (loss) for the year ended December 31, 2016, were as follows:
Millions of yen Thousands ofU.S. dollars
Valuation difference on available-for-sale securities
Increase during the year ¥ 686 $ 5,893
Reclassification adjustments — —
Amount before income tax effect 686 5,893
Income tax effect (171) (1,464)
Total 516 4,429
Deferred gains or losses on hedges
Increase during the year ¥ (95) $ (814)
Reclassification adjustments 10 83
Adjustments of acquisition cost of assets 994 8,533
Amount before income tax effect 909 7,802
Income tax effect (280) (2,403)
Total 629 5,399
Revaluation reserve for land
Income tax effect ¥ 1,824 $ 15,661
Foreign currency translation adjustments
Increase during the year ¥ (4,520) $ (38,803)
Reclassification adjustments — —
Amount before income tax effect (4,520) (38,803)
Income tax effect — —
Total (4,520) (38,803)
Remeasurements of defined benefit plans, net of tax
Increase during the year ¥ (9,872) $ (84,745)
Reclassification adjustments 990 8,499
Amount before income tax effect (8,882) (76,246)
Income tax effect 2,715 23,303
Total (6,167) (52,943)
Share of other comprehensive income of unconsolidated subsidiaries and affilites accounted for using equity method
Increase during the year ¥ 21 $ 181
Reclassification adjustments 20 170
Total 41 350
Total other comprehensive income ¥ (7,678) $ (65,907)
16. LEASES(a) Finance Leases as a LesseeFinance lease transactions other than those involving transfer of ownership to the lessee
(1) Type of leased assetsa) Tangible fixed assets: Principally equipment for manufacturing
hard discs and steam-powered electric generation equipment (machinery and equipment)
b) Intangible fixed assets: Software
(2) Method of depreciationThe depreciation method of leased assets is described in Note 2. SUMMARY OF SIGNIFICANT ACCOUNTING POLICIES ( j ) Leased Assets.
39
Notes to Financial Statements

in Item 5 of Article 2 (Estimation by Experts). The excess of the carrying amount of the revalued land over the market value at December 31, 2016 was ¥69,623 million (US$597,676 thousand).
20. SELLING, GENERAL AND ADMINISTRATIVE EXPENSES
Selling, general and administrative expenses for the years ended December 31, 2016 and 2015 were summarized as follows:
Millions of yen Thousands of U.S. dollars
2016 2015 2016
Freight ¥20,379 ¥19,865 $174,944
Employees' compensation 19,997 20,124 171,663
Other 43,735 48,287 375,437
Total ¥84,111 ¥88,276 $722,043
Research and development expenses included in selling, general and administrative expenses for the years ended December 31, 2016 and 2015 were ¥17,304 million (US$148,545 thousand) and ¥20,270 million, respectively.
21. RESEARCH AND DEVELOPMENTResearch and development costs included in manufacturing costs, selling, general and administrative expenses for the years ended December 31, 2016 and 2015 were ¥17,313 million (US$148,625 thousand) and ¥20,289 million, respectively.
22. PROVISION OF ALLOWANCE FOR DOUBTFUL ACCOUNTS
The provision of allowance for doubtful accounts by consolidated subsidiary Shoko Co., Ltd. and its subsidiary Shoko (Shanghai) Co., Ltd. was against receivables from Chinese steel-related manufacturing groups, etc.
up to one-half of such amount paid for new shares may be credited to additional paid-in capital, which is included in capital surplus.
The Law provides that an amount equal to 10% of cash appropriations of retained earnings shall be set aside as additional paid-in capital or a legal earnings reserve until the total of such reserve and additional paid-in capital equals 25% of the stated capital. Additional paid-in capital and the legal earnings reserve may be used to eliminate or reduce a deficit, if any, or be capitalized by resolution at the Ordinary General Meeting of Shareholders. All additional paid-in capital and the legal earnings reserve may be transferred to other capital surplus and retained earnings, respectively, which are potentially available for dividends. Additional paid-in capital and the legal earnings reserve are included in capital surplus and retained earnings, respectively.
The Law does not have a definition about the classification of paid-in capital between common stock and preferred stock. Accordingly, the Company states its capital in the total amount paid by issuing common stock and preferred stock.
The maximum amount that the Company can distribute as dividends is calculated based on the unconsolidated financial statements of the Company in accordance with Japanese laws and regulations.
19. REVALUATION RESERVE FOR LAND The Company and some of its consolidated subsidiaries revalued the land they own for business in accordance with the Law concerning Revaluation of Land. The difference between the revalued amount and the book value, after the deduction of applicable tax, is stated as a land revaluation reserve. The revaluation was conducted using methods stipulated in the ordinance for enforcement of the law, specifically, the method in Item 4 of Article 2 (Reasonable Adjustment of the Appraised Value Relating to Land Price Tax), and the method
23. SEGMENT INFORMATION(a) Information about sales, operating income, assets, and other items by reportable segmentYear ended December 31, 2016 Millions of yen
Petrochemicals Chemicals Electronics Inorganics Aluminum Others Total Adjustments Consolidated
Sales
Outside customers ¥ 180,178 ¥ 118,433 ¥ 102,053 ¥ 43,776 ¥ 90,715 ¥ 136,004 ¥ 671,159 ¥ — ¥ 671,159
Inter-segment 5,605 16,096 1,286 7,094 7,860 6,359 44,301 (44,301) —
Total 185,783 134,529 103,339 50,870 98,575 142,364 715,459 (44,301) 671,159
Operating income (loss) ¥ 20,690 ¥ 13,824 ¥ 13,907 ¥ (5,758) ¥ 4,416 ¥ 1,775 ¥ 48,855 ¥ (6,802) ¥ 42,053
Assets ¥ 135,411 ¥ 205,555 ¥ 133,094 ¥ 152,976 ¥ 148,415 ¥ 174,146 ¥ 949,598 ¥ (16,900) ¥932,698
Depreciation and amortization 5,715 7,350 11,711 4,087 5,678 2,835 37,377 1,384 38,761
Amortization of goodwill — (261) 12 8 228 1 (11) — (11)
Investments in unconsolidated subsidiaries and affiliates 10,793 2,167 — 5,820 — 288 19,067 — 19,067
Increase in property, plant and equipment and intangible assets 3,397 12,937 6,390 8,221 5,193 2,292 38,430 846 39,276
Notes: 1. Adjustments are as follows:(1) Elimination of intersegment transactions of ¥145 million(US$1,245 thousand) and total corporate expenses of ¥6,657 million (US$57,147 thousand)
which were not allocated to any reportable segment were included in “Adjustments” for “Operating income” of ¥(6,802) million (US$(58,390) thousand). Total corporate expenses principally consist of total corporate common research expenses which are not attributable to any reportable segment.
40 S H O W A D E N K O K . K . A N N U A L R E P O R T 2 0 1 6
Notes to Financial StatementsShowa Denko K.K. and Consolidated Subsidiaries

(2) Elimination of intersegment receivables and payables and assets of ¥(58,323) million (US$500,670 thousand) and total corporate assets of ¥41,422 million (US$355,584 thousand) which were not allocated to any reportable segment were included in “Adjustments” for “Assets” of ¥(16,900) million (US$(145,081) thousand). Total corporate assets principally consist of surplus funds of the Companies under management (in the form of cash and deposits), deferred tax assets and assets related to total corporate common research and development expenses.
Notes: 2. Amortization of negative goodwill was included in “Amortization of goodwill.”
Year ended December 31, 2015 Millions of yen
Petrochemicals Chemicals Electronics Inorganics Aluminum Others Total Adjustments Consolidated
Sales
Outside customers ¥ 226,442 ¥ 130,150 ¥ 129,759 ¥ 55,223 ¥ 93,377 ¥ 140,781 ¥ 775,732 ¥ — ¥ 775,732
Inter-segment 4,846 12,142 1,733 8,253 7,380 6,452 40,805 (40,805) —
Total 231,288 142,292 131,492 63,476 100,756 147,233 816,537 (40,805) 775,732
Operating income (loss) ¥ 10,543 ¥ 10,707 ¥ 17,472 ¥ (1,249) ¥ 2,563 ¥ 1,329 ¥ 41,365 ¥ (7,857) ¥ 33,508
Assets ¥ 120,242 ¥ 198,359 ¥ 146,590 ¥152,814 ¥ 155,180 ¥ 178,711 ¥ 951,896 ¥(11,402) ¥ 940,494
Depreciation and amortization 5,752 7,569 13,964 4,132 6,042 2,863 40,322 1,815 42,137
Amortization of goodwill — (273) 12 1,354 256 4 1,354 — 1,354
Investments in unconsolidated subsidiaries and affiliates 14,230 2,538 — 6,486 — 232 23,486 —
23,486
Increase in property, plant and equipment and intangible assets 1,969 10,345 11,130 10,218 6,135 2,369
42,166 1,893 44,059
Notes: 1. Adjustments are as follows:(1) Elimination of intersegment transactions of ¥220 million(US$1,827 thousand) and total corporate expenses of ¥8,077 million (US$66,971 thousand)
which were not allocated to any reportable segment were included in “Adjustments” for “Operating income” of ¥(7,857) million (US$(65,143) thousand). Total corporate expenses principally consist of total corporate common research expenses which are not attributable to any reportable segment.
(2) Elimination of intersegment receivables and payables and assets of ¥(46,544) million (US$385,905 thousand) and total corporate assets of ¥35,142 million (US$291,369 thousand) which were not allocated to any reportable segment were included in “Adjustments” for “Assets” of ¥(11,402) million (US$(94,537) thousand). Total corporate assets principally consist of surplus funds of the Companies under management (in the form of cash and deposits), deferred tax assets and assets related to total corporate common research and development expenses.
Notes: 2. Amortization of negative goodwill was included in “Amortization of goodwill.”
Year ended December 31, 2016 Thousands of U.S. dollars
Petrochemicals Chemicals Electronics Inorganics Aluminum Others Total Adjustments Consolidated
Sales
Outside customers $ 1,546,726 $ 1,016,676 $ 876,065 $ 375,790 $ 778,738 $ 1,167,517 $ 5,761,512 $ — $ 5,761,512
Inter-segment 48,115 138,178 11,040 60,898 67,474 54,592 380,296 (380,296) —
Total 1,594,841 1,154,854 887,105 436,688 846,211 1,222,110 6,141,808 (380,296) 5,761,512
Operating income (loss) $ 177,613 $ 118,674 $ 119,387 $ (49,432) $ 37,910 $ 15,241 $ 419,394 $ (58,389) $ 361,005
Assets $ 1,162,426 $ 1,764,572 $ 1,142,540 $ 1,313,215 $ 1,274,058 $ 1,494,947 $ 8,151,756 $ (145,081) $ 8,006,676
Depreciation and amortization 49,063 63,100 100,536 35,086 48,741 24,335 320,861 11,880 332,741
Amortization of goodwill — (2,238) 101 72 1,959 9 (97) — (97)
Investments in unconsolidated subsidiaries and affiliates 92,648 18,602 — 49,959 — 2,468 163,677 — 163,677
Increase in property, plant and equipment and intangible assets 29,161 111,057 54,854 70,570 44,581 19,675 329,898 7,260 337,158
(b) Information about geographical areasYear ended December 31, 2016 Millions of yen
Japan Asia Others Total
Sales ¥430,639 ¥208,626 ¥31,893 ¥671,159
Year ended December 31, 2015 Millions of yen
Japan Asia Others Total
Sales ¥474,402 ¥258,932 ¥42,398 ¥775,732
Year ended December 31, 2016 Thousands of U.S. dollars
Japan Asia Others Total
Sales $3,696,793 $1,790,936 $273,783 $5,761,512
Year ended December 31, 2016 Millions of yen
Japan Others Total
Property, plant and equipment ¥410,099 ¥77,035 ¥487,135
Year ended December 31, 2015 Millions of yen
Japan Others Total
Property, plant and equipment ¥414,540 ¥87,753 ¥502,293
Year ended December 31, 2016 Thousands of U.S. dollars
Japan Others Total
Property, plant and equipment $3,520,469 $661,304 $4,181,773
41
Notes to Financial Statements

(c) Information about impairment loss on property, plant and equipment by reportable segmentYear ended December 31, 2016 Millions of yen
Petrochemicals Chemicals Electronics Inorganics Aluminum Others Elimination TotalImpairment loss on assets ¥31 ¥210 ¥6,401 ¥ 133 ¥8,569 ¥299 ¥ — ¥15,644
Year ended December 31, 2015 Millions of yenPetrochemicals Chemicals Electronics Inorganics Aluminum Others Elimination Total
Impairment loss on assets ¥12 ¥ 60 ¥1,955 ¥6,180 ¥2,092 ¥380 ¥ — ¥10,678
Year ended December 31, 2016 Thousands of U.S. dollarsPetrochemicals Chemicals Electronics Inorganics Aluminum Others Elimination Total
Impairment loss on assets $266 $1,802 $54,949 $1,142 $73,562 $2,571 $ — $134,291
(d) Information about amortization of goodwill and unamortized balance by reportable segmentYear ended December 31, 2016 Millions of yen
Petrochemicals Chemicals Electronics Inorganics Aluminum Others Elimination TotalAmortization ¥ — ¥ 47 ¥ 44 ¥ 8 ¥ 282 ¥ 29 ¥ — ¥ 411 Unamortized balance — 232 332 55 3,006 175 — 3,801
Year ended December 31, 2015 Millions of yenPetrochemicals Chemicals Electronics Inorganics Aluminum Others Elimination Total
Amortization ¥ — ¥ 35 ¥ 44 ¥1,354 ¥ 316 ¥ 32 ¥ — ¥1,782 Unamortized balance — 294 376 63 3,494 202 — 4,429
Year ended December 31, 2016 Thousands of U.S. dollarsPetrochemicals Chemicals Electronics Inorganics Aluminum Others Elimination Total
Amortization $ — $ 405 $ 380 $ 72 $ 2,419 $ 251 $ — $ 3,528 Unamortized balance — 1,993 2,852 470 25,809 1,504 — 32,628
Amortization of negative goodwill arose from business combinations prior to April 1, 2010 and its unamortized balance are as follows:Year ended December 31, 2016 Millions of yen
Petrochemicals Chemicals Electronics Inorganics Aluminum Others Elimination TotalAmortization ¥ — ¥ 308 ¥ 33 ¥ — ¥ 54 ¥ 28 ¥ — ¥ 422 Unamortized balance — 2,396 358 — 593 259 — 3,606
Year ended December 31, 2015 Millions of yenPetrochemicals Chemicals Electronics Inorganics Aluminum Others Elimination Total
Amortization ¥ — ¥ 308 ¥ 33 ¥ — ¥ 60 ¥ 28 ¥ — ¥ 429 Unamortized balance — 2,704 390 — 647 288 — 4,028
Year ended December 31, 2016 Thousands of U.S. dollarsPetrochemicals Chemicals Electronics Inorganics Aluminum Others Elimination Total
Amortization $ — $ 2,643 $ 279 $ — $ 460 $ 243 $ — $ 3,626 Unamortized balance — 20,568 3,071 — 5,092 2,226 — 30,956
24. RELATED PARTY INFORMATION(a) Related party transactionsThe information for the fiscal years ended December 31, 2016 and 2015 was not disclosed because there were no significant transactions with related parties.
(b) Summary financial statements of significant affiliatesA significant affillate as of December 31, 2016 was Japan Polyethylen corporation., and summary of its financial statements was as follows;
Millions of yen Thousands ofU.S. dollars
Balance SheetTotal current assets ¥ 41,536 $ 356,563 Total noncurrent assets 14,161 121,564 Total current liabilities 32,348 277,689 Total noncurrent liabilities 262 2,249 Total net assets 23,087 198,189
Statement of IncomeNet sales 122,702 1,053,326 Income before income taxes 12,027 103,245 Net income 8,503 72,993
A significant affillate as of December 31, 2015 was Union Showa K.K., and summary of its financial statements was as follows;
Millions of yen Thousands ofU.S. dollars
Balance SheetTotal current assets ¥ 4,187 $ 34,715 Total noncurrent assets 1,275 10,570 Total current liabilities 1,482 12,284 Total noncurrent liabilities 11 93 Total net assets 3,969 32,908
Statement of IncomeNet sales 16,910 140,206 Income before income taxes 3,723 30,866 Net income 2,518 20,877
42 S H O W A D E N K O K . K . A N N U A L R E P O R T 2 0 1 6
Notes to Financial StatementsShowa Denko K.K. and Consolidated Subsidiaries

43
Notes to Financial Statements Report of Independent Certified Public Accountants

Major Subsidiaries and Affiliates (As of December 31, 2016)
Subsidiaries
Name Ownership (%)* Main Product(s) or Business(es)
SunAllomer Ltd. 65.0 Polypropylene and advanced polypropylene-based materials
Showa Denko Gas Products Co., Ltd. 100.0 Liquefied carbon dioxide, dry ice, industrial gases, etc.
Shanghai Showa Highpolymer Co., Ltd. 98.4 Plastics and molding compounds
Showa Denko HD Singapore Pte. Ltd. 100.0 Hard disks
Showa Denko HD Trace Corporation 99.4 Hard disks, aluminum substrates for hard disks
Showa Denko HD Yamagata K.K. 100.0 Hard disks
Showa Denko Carbon, Inc. 100.0 Graphite electrodes
Showa Denko Sichuan Carbon Inc. 67.0 Graphite electrodes
Showa Aluminum Can Corporation 100.0 Beer and soft drink cans
Hanacans Joint Stock Company 91.8 Beer and soft drink cans
SHOTIC MALAYSIA SDN. BHD. 100.0 Aluminum casting products
Shoko Co., Ltd.** (T8090) 44.0 General trading
Showa Denko Packaging Co., Ltd. 100.0 Aluminum laminated film for LIB packaging, packaging/containers for food and medicine
Showa Denko Kenzai K.K. 100.0 Plaster materials, fireproofing pipe etc.
Affiliates
Name Equity Participation (%) Main Product(s) or Business(es)
Japan Polyethylene Corporation 42.0 High- and low-density polyethylene
Union Showa K.K. 50.0 Molecular sieves
* Proportion of ownership interest (direct or indirect) by Showa Denko K.K. and its subsidiaries in terms of the number of shares with exercisable voting rights ** Tokyo Stock Exchange listed company
As of December 31, 2016, Showa Denko K.K. had 48 consolidated subsidiaries, including the above.
As of December 31, 2016, Showa Denko K.K. had 12 subsidiaries or affiliates to which the equity method was applied, including the above.
44 S H O W A D E N K O K . K . A N N U A L R E P O R T 2 0 1 6
Corporate Data

Ordinary General MeetingThe Ordinary General Meeting of Shareholders was held on March 30, 2017.
Head OfficeShowa Denko K.K.13-9, Shiba Daimon 1-chome, Minato-ku, Tokyo 105-8518, Japan URL: http://www.sdk.co.jp/english Phone: +81-3-5470-3235 Fax: +81-3-3431-6215 E-mail: [email protected]
Number of Shares Outstanding149,711,292 at December 31, 2016SDK consolidated every ten shares of its common stock into one share on July 1, 2016.
Number of Shareholders79,064 at December 31, 2016
Classification of StockAll stock issued by Showa Denko is common stock.
Stock Transfer AgentMizuho Trust & Banking Co., Ltd. 2-1, Yaesu 1-chome, Chuo-ku, Tokyo 103-8670, Japan
Shareholders by Sector (At December 31, 2016)
ShareholderNumber of
Shares Held (in thousands)
Rate of Shareholding
(%)
The Master Trust Bank of Japan Ltd. (T) 6,516 4.56
Japan Trustee Services Bank Ltd. (T) 5,554 3.89
Fukoku Mutual Life Insurance Company 5,517 3.86
Japan Trustee Services Bank Ltd. (T9) 4,512 3.16
The Dai-ichi Life Insurance Company Limited 3,600 2.52
STATE STREET BANK AND TRUST COMPANY 3,110 2.18
Sompo Japan Nipponkoa Insurance Inc. 3,007 2.11
Meiji Yasuda Life Insurance Company 2,645 1.85
Showa Denko Employee Shareholding Association 2,544 1.78
Nippon Life Insurance Company 2,006 1.40
Shareholders (Top 10) (At December 31, 2016)
Financial �rms54,593 thousand
36.47%
Securities �rms1,812 thousand
1.21%
Individuals37,785 thousand
25.24%
Foreign corporateentities, etc.40,994 thousand
27.38%
Japanese corporate entities7,633 thousand
5.10%
Treasury shares6,893 thousand
4.60%
Total numberof shares held
149,711thousand
Commercial Subsidiaries Abroad (As of December 31, 2016)
Showa Denko America, Inc.420 Lexington Avenue, Suite #2335A, New York, NY 10170, U.S.A. Phone: +1-212-370-0033 Fax: +1-212-370-4566
Showa Denko Europe GmbHKonrad-Zuse-Platz 3, 81829 Munich, Germany Phone: +49-89-939-9620 Fax: +49-89-939-96250
Showa Denko Singapore (Pte.) Ltd.2 Shenton Way #15-03/04, SGX Centre 1, Singapore 068804 Phone: +65-6223-1889 Fax: +65-6223-6007
Showa Denko (Shanghai) Co., Ltd.18F, Wang-Wang Building No. 211, Shimen Yi Road, Shanghai, 200041, People’s Republic of China Phone: +86-21-6217-5000 Fax: +86-21-6217-9840
Note: Each rate of shareholding was calculated after deducting the number of treasury shares (6,893 thousand) from the number of shares outstanding.
Investor Information
45
Corporate Data

Delay in Announcement of 2016 Financial Results and Other Related Documents
SDK released the consolidated financial results for the year ended December 2016 on April 25, 2017,
originally scheduled to be released on February 14, 2017. This delay was caused by the need to investigate
details of transactions between BE International Corporation (BE, a subsidiary of Shoko Co., Ltd.) and a
specific customer. Shoko Co., Ltd. (Shoko) is a consolidated subsidiary of SDK.
Shoko established the Special Examination Committee, including outside experts, to review the issue from
a professional, objective viewpoint, and they made an enormous effort to find the facts. Later, the Special
Examination Committee reported the results of their examination to the management of Shoko, and
Shoko disclosed the report on April 17, 2017. In their report, the committee concluded that the subject of
the transactions had no substance, that none of the officers or employees of Shoko or BE knew about the
nonexistence of the subject of the transactions, that the transactions were only the circulation of funds,
and that there were no similar transactions at Shoko or its subsidiaries.
SDK amended the accounting for those transactions as normal commercial transactions, which had been
posted as sales, then submitted an annual securities report for the 108th business term with amended
prior-year annual securities reports to the Kanto Local Finance Bureau on April 25, 2017. On the same day,
SDK also disclosed the 2016 financial statements and the amended prior-year financial statements. Earlier,
SDK had applied to the Kanto Local Finance Bureau for an extension of the deadline for releasing its
annual securities report for the 108th business term and gained approval for the extension with a new
deadline: May 1, 2017.
Under these circumstances, SDK could not report business results and consolidated financial statements
for the fiscal year ended December 2016 at the 108th ordinary general meeting of shareholders held on
March 30, 2017. This meeting was based on the record date of December 31, 2016. Accordingly, the
Company’s executives chose not to issue a year-end dividend. SDK will have an extraordinary general
meeting of shareholders on June 27, 2017, based on the record date of May 11, 2017. The Company will
submit a business report, consolidated financial statements, and other related documents for the fiscal
year ended December 2016, and is proposing to pay a dividend of ¥30 per share.
We sincerely apologize for any inconvenience caused to our shareholders, investors, and other stakeholders.
SDK will give its full support to formulating and implementing specific measures to prevent a recurrence
of this and similar problems, which will be done by Shoko as early as possible. As well, the Company
recognizes reinforcing group-wide risk management as an urgent task and will further strengthen internal
controls within the Showa Denko Group.
46 S H O W A D E N K O K . K . A N N U A L R E P O R T 2 0 1 6

SHOWA DENKO K.K.13-9, Shiba Daimon 1-chome,Minato-ku, Tokyo 105-8518, Japanhttp://www.sdk.co.jp/english
SHO
WA
DEN
KO K.K. A
NN
UA
L REPORT 2016
Printed in Japan