Embed Size (px)
Citation preview
Showa Denko K.K. c1
SHOWA DENKO K.K.
Annual Report 2005
Interconnection of Inorganic, Aluminum and Organic Chemical Technologies

CRanking as one of Japan’s leading chemical companies,
Showa Denko K.K. operates in the five major sectors of petro-
chemicals, chemicals, electronics, inorganics, and aluminum.
Showa Denko has launched a new three-year consolidated
business plan, the “Passion Project,” that runs from 2006
through 2008. Under the plan, we will give top priority to
development and expansion of growth businesses, with a
view to meeting the expectations of all stakeholders. To
that end, we will create individualized businesses with
competitive edges by deepening our wide-ranging material
technologies and nurturing their interconnections.
Showa Denko aims to earn the full trust and confidence of
the market and society, always managing operations based
on the principles of corporate social responsibility. The
Company is also committed to the principles of Responsible
Care and is vigorously carrying out an action plan to pro-
tect the environment as well as health and safety.
PPROFILE
VVISION
CONTENTS
Performance and StrategiesConsolidated Financial Highlights/Showa Denko at a Glance 1
Message from the Management 2
New Business Plan “Passion Project” 6
Review of Operations 8
Management SystemCorporate Social Responsibility 12
Responsible Care Activities 13
Corporate Governance 14
Board of Directors 15
Research and Development 16
Financial SectionConsolidated Six-Year Summary 18
Management’s Discussion and Analysis 19
Consolidated Balance Sheets 22
Consolidated Statements of Income 24
Consolidated Statements of Stockholders’ Equity 25
Consolidated Statements of Cash Flows 26
Notes to Financial Statements 27
Report of Independent Certified Public Accountants 40
Corporate InformationMajor Subsidiaries and Affiliates 41
Corporate Data 42
Forward-Looking StatementsThis annual report contains statements relating to management’s pro-jections of future profits, the possible achievement of the Company’sfinancial goals and objectives, and management’s expectations for theCompany’s product development program. The Company cannot guar-antee that these expectations and projections will be realized or correct.Actual results may differ materially from the results anticipated in thestatements included herein due to a variety of factors, including sucheconomic factors as fluctuations in foreign currency exchange rates aswell as market supply and demand conditions. The timely commer-cialization of products under development by the Company may bedisrupted or delayed by a variety of factors, including market acceptance,the introduction of new products by competitors, and changes in regula-tions or laws. The foregoing list of factors is not inclusive. Please refer topage 38 for more information concerning risk factors.
We at the Showa Denko Group will provide products and
services that are useful and safe and exceed our cus-
tomers’ expectations, thereby enhancing the value of the
Group, giving satisfaction to our shareholders, and con-
tributing to the sound growth of international society as a
responsible corporate citizen.
S

Showa Denko K.K. 1
Thousands ofMillions of yen U.S. dollars (Note 1)
2005 2004 2003 2005
For the yearNet sales............................................................................ ¥811,899 ¥740,706 ¥689,366 $6,876,417Operating income .............................................................. 57,191 52,071 38,546 484,379Net income ........................................................................ 15,647 7,596 10,317 132,526Depreciation and amortization............................................ 34,203 34,115 34,543 289,687
At year-endTotal assets ....................................................................... 986,233 943,908 939,879 8,352,949Total stockholders’ equity .................................................. 206,738 177,701 166,087 1,750,980
Yen U.S. dollars (Note 1)
Per shareNet income—primary (Note 2)............................................ ¥013.70 ¥006.66 ¥009.07 $0.116Net income—fully diluted (Note 2) ...................................... 12.82 6.35 — 0.109Stockholders’ equity .......................................................... 180.96 155.53 145.96 1.53Cash dividends (applicable to the period) ........................... 3.00 3.00 2.00 0.025
Number of employees at year-end ................................... 11,118 11,166 10,623Notes: 1. Yen amounts have been translated into U.S. dollars, for convenience only, at the rate of ¥118.07 to US$1, the approximate rate of exchange
at December 31, 2005.2. Net income per share has been computed based on the average number of shares of common stock outstanding during the respective fiscal
year. Fully diluted net income per share additionally assumes the convertible bonds.
Showa Denko K.K. and Consolidated SubsidiariesDecember 31, 2005, 2004 and 2003
CONSOLIDATED FINANCIAL HIGHLIGHTSC
SSHOWA DENKO AT A GLANCE
Electronics
HDs, compound semiconduc-tors, rare earth magnetic alloys,specialty gases, alternatives tochlorinated solvents and otherhigh-purity chemicals, ceramicmaterials for semiconductors,and fine carbons
Petrochemicals
Chemicals
Electronics
Inorganics
Aluminum
37.1%
9.1%16.5%7.6%
29.7%
NET SALES BY SEGMENT
Petrochemicals
Olefins (ethylene and propyl-ene), organic chemicals (aceticacid, vinyl acetate monomer,and ethyl acetate) and plasticproducts
Chemicals
Chemicals (caustic soda, chlo-rine, acrylonitrile, and ammonia),gases (fluorocarbons, oxygen,nitrogen, and hydrogen), spe-cialty chemicals (amino acids,stabilized vitamin C, analyticalcolumns, and specialty polymers)
Inorganics
Ceramics (aluminum hydroxide,alumina, abrasives, and refracto-ries) and carbons (graphiteelectrodes)
Aluminum
Ingots, sheets, extrudedproducts, high-purity foilsfor capacitors, fabricatedproducts (forged products,heat exchangers, aluminumcylinders for laser printers,and beverage cans)
Passion Project (2006-2008):The three-year action plan to realize 2010 targets
Targets for 2010Realizing our vision:
Contribute to the interests of all stakeholdersContribute to society on a global scale
20002001
2002
2004
20062005
20072008
2003
•Develop and establish new growth drivers•Steadily improve profitability•Improve financial strength
Strategic reduction in scale through
the Cheetah Project (2000-2002)
Growth strategy through

of useful and safe products, thereby earning the
full trust and confidence of all stakeholders,
including our shareholders and customers. The
Passion Project serves as an action plan to enable
us to establish, by the end of 2008, the ground-
work for long-term sustainable growth. We will
preferentially allocate our resources to “growth
driver” businesses, centering on the hard disk
media business, while accelerating the develop-
ment of new “growth driver” businesses and
improving the earning power of “cash cow” base
businesses. At the same time, we will work hard
to improve our financial strength.
Business Results for 2005
In the chemical and nonferrous metals industries
in Japan, costs of naphtha, aluminum ingots, and
other raw materials soared throughout 2005.
However, shipments of chemical products to
China and other Asian countries were maintained
at high levels. The electronic parts/materials
industry showed signs of recovery, although the
recovery was not strong enough.
Under the circumstances, the Showa Denko
Group proceeded with the development of the
“strategic growth businesses” as defined in the
Sprout Project, while continuing to restructure
operations and reduce costs.
As a result, consolidated net sales in 2005
increased 9.6%, to ¥811,899 million, and operat-
ing income rose 9.8%, to ¥57,191 million.
Ordinary income jumped 20.7%, to ¥46,960 mil-
lion, due partly to improvement in the balance
between interest expense and interest and divi-
dend income. Net income was up 106.0%, to
¥15,647 million. An extraordinary profit of ¥10,375
million was recorded due to a gain on the sale of
fixed assets and investment securities. Meanwhile,
an extraordinary loss of ¥39,570 million was regis-
tered due partly to the collective amortization of
unrecognized transition amounts resulting from
the adoption of the new accounting method for
employees’ retirement benefits.
MMESSAGE FROM THE MANAGEMENT
2 Annual Report 2005
In 2005, the final year of the Sprout Project, we
successfully accomplished the financial goals and
achieved major tasks as defined in the project.
We implemented our growth strategy in the
2003–2005 period, aiming to establish ourselves
as the “unique chemical company with individual-
ized products” through a market-oriented
approach and interconnections of proprietary
inorganic/aluminum and organic chemical tech-
nologies.
Based on that achievement, we established a
new medium-term consolidated business plan,
the “Passion Project,” that runs from 2006 through
2008. Under the plan, we will enhance the value
of the Showa Denko Group through the provision
Business Portfolio
Petrochemicals
Chemicals
Electronics
Inorganics
Aluminum andOthers
Defined the mission of each business unitIn 2008, growth businesses and base businesses will account for 40% and 60%, respectively, of total operating income.
Growth businessesNew “growth
drivers”“Growth drivers”
Life sciencesFine chemicals
Ultrabright LEDs Capacitors
Fine carbons
Hard disksSpecialty gases for semiconductor processing
High purity foils for capacitorsAluminum cans, Heat exchangers, Alloys, Commodity and functional aluminum parts
Base businesses
“Cash cows”
OlefinsOrganic chemicalsSpecialty polymers
AmmoniaIndustrial chemicals(Industrial gases, Inorganic industrial chemicals, etc.)
Existing compound semiconductors,Rare earth magnetic alloys
Graphite electrodesCommodity ceramics
������������ � �����������������
What We Want to Achieve by 2010
Contribute to the good of society
Unique company with individualized products
Technology-oriented company
Financial strength
CSR
Newly establish individualized businesses with competitive advantages
Deepen and integrate core technologies covering wide range of materials and develop new technologies, including those for devices and modules
Establish financial strength by lowering interest-bearing debt and increasing stockholders’ equity
Obtain trust and high evaluation from society and markets
By enhancing the Company's value, we will contribute to the interests of all stakeholders.

Showa Denko K.K. 3
Dividends of ¥3.00 per share, the same
amount as in the preceding year, were paid to
shareholders on record at the end of December
2005.
Our capital expenditures in 2005 totaled
¥41,218 million, including those for the expansion
of production facilities for HD media, blue LEDs,
and large-diameter graphite electrodes; for the
construction of production facilities for very-small-
diameter HD media; as well as for further expan-
sion, rationalization, production maintenance,
and environmental protection.
As a result of an increase in operating income
and continued debt-reduction efforts centering
on the sale of affiliates and fixed assets, the out-
standing balance of interest-bearing debt as
of the end of 2005 decreased ¥53,602 million,
to ¥448,831 million.
Segment Performances
In terms of net sales for the year, the Petrochemicals
segment contributed 37.1%, Chemicals 9.1%,
Electronics 16.5%, Inorganics 7.6%, and
Aluminum 29.7%. A breakdown of net sales and
operating income by segment is as follows:
In the Petrochemicals segment, sales rose
18.4%, to ¥301,189 million, and operating income
increased 8.5%, to ¥21,837 million. Sales of
olefins were up due to higher selling prices,
reflecting soaring raw material costs. Sales of
organic chemicals were also up due to the rise
in selling prices of acetic acid, vinyl acetate, and
ethyl acetate, reflecting steady demand and high
feedstock costs. Sales of plastics by Showa
Highpolymer Co., Ltd., increased due to an
increase in selling prices, reflecting the rise in
feedstock costs. Meanwhile, sales of plastic prod-
ucts by Heisei Polymer Co., Ltd., were maintained
at the same level as in the preceding year due
partly to stagnant shipment volumes of plastic
products for industrial use.
In the Chemicals segment, sales fell 7.7%, to
¥74,001 million, and operating income decreased
2.2%, to ¥4,740 million. Sales of industrial gases
fell as a result of the transfer in 2004 of the com-
modity gas business to TG Showa K.K. Sales of
industrial chemicals, including acrylonitrile and
ammonia, were up due to steady shipment vol-
umes and selling prices. In the area of specialty
chemicals, sales of Shoprene polychloroprene
synthetic rubber increased due to steady shipment
volumes and selling prices. Shipment volumes of
feed-additive vitamin C and chelating agents fell.
Sales of agrochemicals fell sharply following the
sale of SDS Biotech K.K. in March 2005.
In the Electronics segment, sales increased
19.1%, to ¥133,902 million, and operating income
rose 32.2%, to ¥19,727 million. Shipment vol-
umes of HD media increased substantially follow-
ing the full-year consolidation of Showa Denko HD
Trace Corporation in Taiwan. Meanwhile, ship-
ment volumes of gallium phosphide (GaP) for
LEDs declined substantially due to inventory
Mitsuo Ohashi, Representative Director and Chairman of the Board of Directors (left)Kyohei Takahashi, President and CEO

New HD media plant in Singapore(conceptual drawing)
4 Annual Report 2005
adjustments by the electronic parts industry. In
all, combined sales of HD media and compound
semiconductors were up. Sales of electronic
materials were also up as increases in sales of
semiconductor-processing specialty gases, rare
earth magnetic alloys, and electronic ceramics
due to the rise in shipment volumes more than
offset a slight decline in sales of fine carbons.
In the Inorganics segment, sales increased
11.9%, to ¥61,882 million, and operating income
jumped 36.3%, to ¥8,310 million. Sales of ceram-
ics were up due to brisk demand for alumina. The
graphite electrode business of both Showa Denko
K.K. and its U.S. subsidiary Showa Denko Carbon,
Inc., recorded increased sales, reflecting growing
demand for steel worldwide.
In the Aluminum segment, sales increased
1.1%, to ¥240,924 million. However, operating
income decreased 32.6%, to ¥8,310 million, due
to the fall in selling prices of aluminum cans as
well as lower shipments of heat exchangers and
higher raw material costs. Sales from ingot mar-
keting rose slightly, reflecting the trends in the
international market. Sales of Shotic forged prod-
ucts increased due to growing demand for auto-
motive parts applications. Sales of rolled products
fell as increases in the shipment volumes of high-
purity foils for capacitors were more than offset
by decreases in the shipment volumes of com-
modity sheets. In the extrusions/specialty
products business, shipment volumes of extru-
sions decreased while those of aluminum cylin-
ders for laser printers increased, resulting in lower
overall sales. Sales of heat exchangers decreased
slightly as shipment volumes fell in Japan and
Europe, notwithstanding increased shipment vol-
umes in the United States. Sales of aluminum
cans were maintained at the previous year’s level
as increases in shipment volumes were offset by
decreases in selling prices.
Expanding HD Media Production Capacity
We will continue expanding our HD media opera-
tions as a typical “growth driver” business under
the Passion Project. We have already increased
our HD media production capacity by 3.05 million
disks a month, to 13.75 million disks a month, to
meet growing demand mainly for small-diameter
media for use in mobile music players. The expan-
sion was completed in March 2006 through the
construction of new lines and the debottlenecking
of existing lines with capital investment of approxi-
mately ¥12 billion. Furthermore, we decided to
build a new HD media plant in Singapore for start-
up in the fourth quarter of 2006. As a result of the
construction of the new plant and other expan-
sionary measures, our HD media production
capacity will further increase to 24 million disks
per month by the end of 2008.
Launching New HD Media Products
In June 2005, we started the world’s first com-
mercial production of HD media based on the
perpendicular magnetic recording technology,
enabling a dramatic increase in media recording
density. They are 1.89-inch-diameter media for
use in mobile music players, having the capacity
of 40 gigabytes per disk—double the capacity of
conventional longitudinal-recording-technology-
based products of the same size.
We also started commercial production of the
world’s smallest 0.85-inch-diameter HD media.
MMESSAGE FROM THE MANAGEMENT
HDs with diameters of 0.85, 1.8, 2.5, and 3.5 inches
Showa Denko K.K. 5
Demand for very-small-diameter HD media,
including the 0.85-inch type, is expected to grow
rapidly in the near future. This is because such HD
media will be installed in cellular phones, enabling
the handling of music and TV programs.
We decided to build a new R&D facility in
Ichihara City, Chiba Prefecture, to promote the
development of the next-generation HD media
with still-higher recording capacity. The facility,
costing around ¥3 billion, is scheduled for com-
pletion by the end of April 2006.
Strengthening the Petrochemicals Business
We aim to ensure the sustainable profitability
of our petrochemicals operations as a typical
“cash cow” business under the Passion Project.
We will modify our ethylene plant at the Oita
Petrochemical Complex to increase the use of
non-naphtha feedstock. The modification work is
to be conducted during the maintenance shut-
down starting in the middle of March 2006. At the
same time, we will modify certain production lines
of the ethylene plant to increase efficiency, there-
by increasing the production capacity by 24,000
tons per year, to 677,000 tons per year. The total
cost will be approximately ¥2 billion. We will also
expand our annual production capacity of acetic
acid from 100,000 tons to 130,000 tons, and that
of vinyl acetate from 120,000 tons to 175,000
tons, in the first half of 2006.
Managing All Operations Based on the CSR Principles
We attach great importance to corporate gover-
nance and compliance as a means to ensure sus-
tainable growth and long-term corporate value,
taking various measures to enhance our levels of
compliance and corporate ethics. In July 2005,
we established a CSR Committee to promote our
corporate social responsibility (CSR) initiatives. We
will manage all operations based on the principles
of CSR in an effort to earn the full trust and confi-
dence of the market and society.
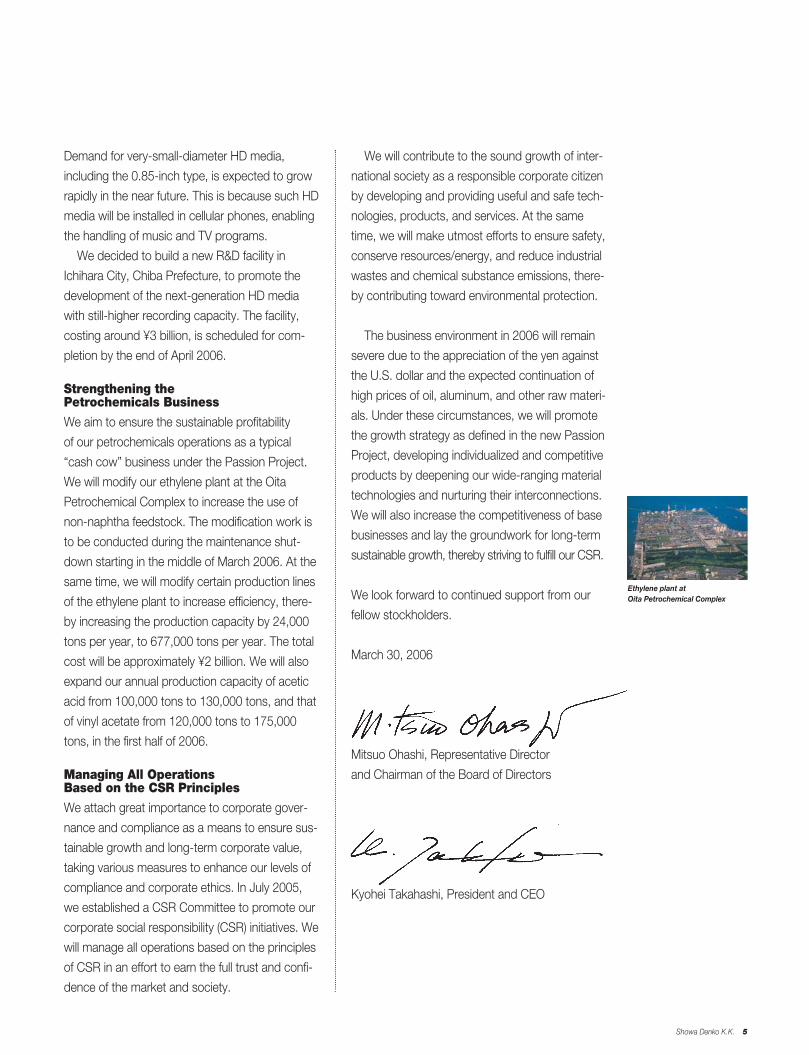
We will contribute to the sound growth of inter-
national society as a responsible corporate citizen
by developing and providing useful and safe tech-
nologies, products, and services. At the same
time, we will make utmost efforts to ensure safety,
conserve resources/energy, and reduce industrial
wastes and chemical substance emissions, there-
by contributing toward environmental protection.
The business environment in 2006 will remain
severe due to the appreciation of the yen against
the U.S. dollar and the expected continuation of
high prices of oil, aluminum, and other raw materi-
als. Under these circumstances, we will promote
the growth strategy as defined in the new Passion
Project, developing individualized and competitive
products by deepening our wide-ranging material
technologies and nurturing their interconnections.
We will also increase the competitiveness of base
businesses and lay the groundwork for long-term
sustainable growth, thereby striving to fulfill our CSR.
We look forward to continued support from our
fellow stockholders.
March 30, 2006
Mitsuo Ohashi, Representative Director
and Chairman of the Board of Directors
Kyohei Takahashi, President and CEO
Ethylene plant at Oita Petrochemical Complex
6 Annual Report 2005
NNEW BUSINESS PLAN “PASSION PROJECT”
The Showa Denko Group has launched its newmedium-term consolidated business plan, thePassion Project. Under the project, which runsfrom 2006 through 2008, the Group will furtherincrease its value and fulfill its social responsi-bility, contributing to the interests of all stake-holders.
1. Accomplishments under the Sprout ProjectDuring the Sprout Project covering the 2003–2005 period,we promoted our growth strategy by creating high-value-added and competitive new product lines through theinterconnections of inorganic/aluminum and organicchemical technologies. We also continued our restructur-ing efforts that started under the previous CheetahProject, which covered the 2000–2002 period. In the pastsix years, we took 47 restructuring measures, includingalliances and withdrawal from certain operations.
As a result, we exceeded major financial goals underthe Sprout Project as shown below:
2005 Sprout Project Resultsresults target vs. target
Operating income ¥57.2 billion ¥50.0 billion 114%
Profit ratio 7.0% 7.0% or over Accomplished
ROA 5.8% 5.1% +0.7 point
Interest-bearing debt ¥448.8 billion ¥520.0 billion Exceeded the target by
¥71.2 billion
D/E ratio 2.17 times 3.00 times Exceededthe target
Cost reductions (aggregatefigures for the three years) ¥22.5 billion ¥20.0 billion 113%
2. Concept of the Passion ProjectAt the basis of the new Passion Project is an “image” ofthe Showa Denko Group in 2010. Specifically, we want tofurther increase our corporate value and fulfill the expecta-tions of all stakeholders. To that end, we will develop newdevice/module technologies in addition to our wide-rang-ing material technologies, thereby establishing individual-ized businesses with competitive edges. In financial terms,our image of goals in 2010 will be operating income of
¥100 billion, a profit ratio of 10% (operating income basis),and a D/E ratio of 1.0 times. Thus, we aim to substantiallyimprove our financial strength, earning the full trust andconfidence of the market and society. The Passion Projectwill serve as an action plan for the 2006–2008 period torealize the “image” of Showa Denko in 2010.
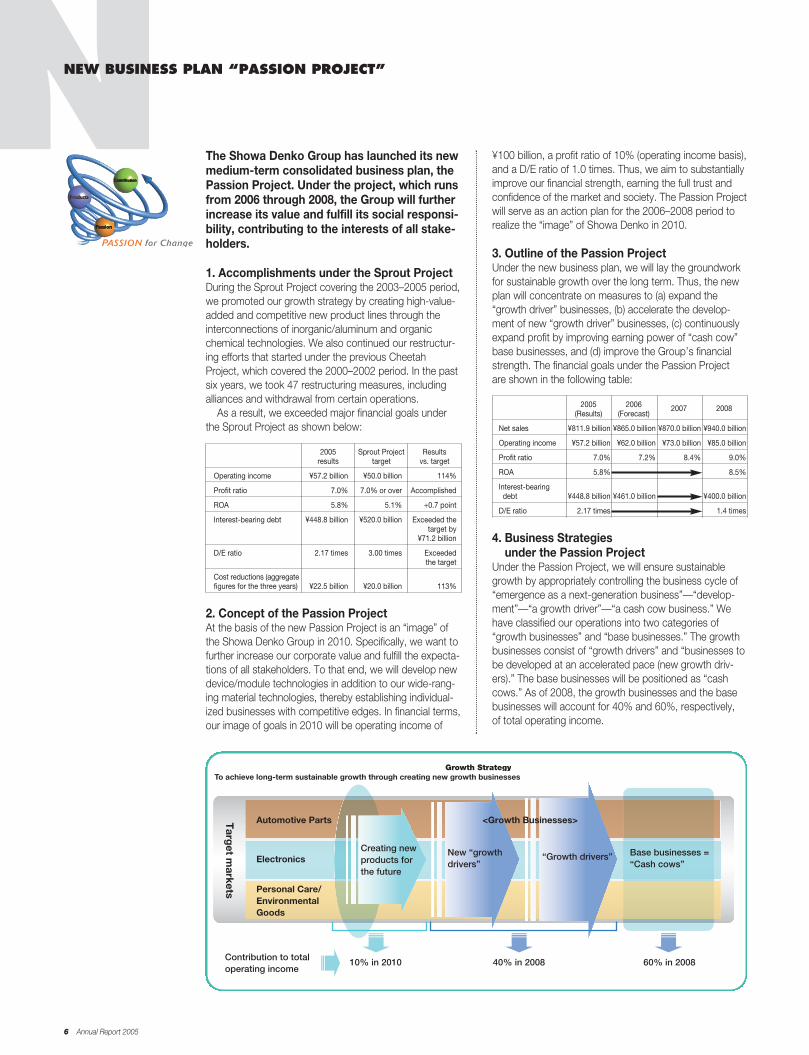
3. Outline of the Passion ProjectUnder the new business plan, we will lay the groundworkfor sustainable growth over the long term. Thus, the newplan will concentrate on measures to (a) expand the“growth driver” businesses, (b) accelerate the develop-ment of new “growth driver” businesses, (c) continuouslyexpand profit by improving earning power of “cash cow”base businesses, and (d) improve the Group’s financialstrength. The financial goals under the Passion Projectare shown in the following table:
2005 2006(Results) (Forecast)
2007 2008
Net sales ¥811.9 billion ¥865.0 billion ¥870.0 billion ¥940.0 billion
Operating income ¥57.2 billion ¥62.0 billion ¥73.0 billion ¥85.0 billion
Profit ratio 7.0% 7.2% 8.4% 9.0%
ROA 5.8% 8.5%
Interest-bearing debt ¥448.8 billion ¥461.0 billion ¥400.0 billion
D/E ratio 2.17 times 1.4 times
4. Business Strategies under the Passion Project
Under the Passion Project, we will ensure sustainablegrowth by appropriately controlling the business cycle of“emergence as a next-generation business”—“develop-ment”—“a growth driver”—“a cash cow business.” Wehave classified our operations into two categories of“growth businesses” and “base businesses.” The growthbusinesses consist of “growth drivers” and “businesses tobe developed at an accelerated pace (new growth driv-ers).” The base businesses will be positioned as “cashcows.” As of 2008, the growth businesses and the basebusinesses will account for 40% and 60%, respectively,of total operating income.
To achieve long-term sustainable growth through creating new growth businesses Growth Strategy
Targ
et markets
Automotive Parts
Electronics
Personal Care/EnvironmentalGoods
<Growth Businesses>
Base businesses = “Cash cows”
New “growth drivers”
“Growth drivers”Creating newproducts forthe future
Contribution to total operating income
10% in 2010 40% in 2008 60% in 2008

Showa Denko K.K. 7
As for major businesses of respective categories, we willimplement the following strategies:
(1) “Growth driver” businesses with established business models
(a) HD mediaWe are already the world’s largest independent HD mediasupplier, providing both glass- and aluminum-basedmedia. We will further consolidate this position by launch-ing advanced products based on our leading technologieswhile expanding our production capacity to meet growingdemand.
We will invest approximately ¥90 billion during the threeyears under the Passion Project, building a new plant inSingapore and expanding facilities at other locations. Asa result, our HD media production capacity will increasefrom 13.75 million disks per month as of March 2006to 24 million disks per month by the end of 2008.
(b) Semiconductor-processing materialsIn the areas of high-purity specialty gases for productionof advanced semiconductors, we have a 30% marketshare in the world’s high-purity ammonia production. Wewill further strengthen our lineup of high-performance,high-value products, developing new materials and pro-viding total solutions. Specifically, we will provide C4F6
advanced etching gas, innovative film-forming materialsfor a chemical vapor deposition process, next-generationcleaning gases, and other new materials.
(2) Developing new “growth driver” businessesthrough concentration of resources in selected areasand strengthening of marketing activities
(a) Ultrabright LEDsIn November 2005, we succeeded in commercializingultrabright LEDs that emit green and ultraviolet light.Showa Denko is now the only company in the world thatcan provide ultrabright LED chips for all wavelengths fromultraviolet to infrared. Demand for these products isexpected to grow for such applications as LCD backlight-ing, car headlights, and general lighting. We aim toexpand the LED business by increasing sales in thesenew market areas.
(b) High-performance capacitorsOur conductive polymer aluminum capacitor representsthe fruit of interconnections of our proprietary inorganic/aluminum and organic chemical technologies. We will improvethe product by increasing its rated voltage and lowering itsheight. Furthermore, we will launch innovative high-capacitance capacitors using new materials.
(3) Establishment of new SMU projectsWe established six new SMU (strategic market unit)projects for our three major target markets of electronics,automotive parts, and personal care/environmental goods.We will preferentially allocate resources into these projectsto create next-generation products. We aim to developthese new businesses so that they will account for 10% ofthe total operating income by 2010.
(4) Base businesses: Further strengthening their com-petitive positions to ensure their role as “cash cows”
(a) PetrochemicalsWe will further improve our manufacturing processes andcatalyst/operation technologies to enhance efficiency andcost-competitiveness. We will also aim to diversify crackerfeedstock and increase the value of naphtha fractions.Thus, we aim to make our Oita Petrochemical Complexone of the most competitive complexes in Asia.
(b) InorganicsWe will further consolidate our position as a leader in theworld’s graphite electrode industry in terms of quality andcost-competitiveness. We will strengthen our competitiveposition by ensuring the mass production of large-diame-ter electrodes. In the ceramics business, we will firmlyestablish our position as the leading abrasive supplier inAsia with production sites in Japan and China.
(c) AluminumWe will invest about ¥22 billion in our aluminum businessunder the Passion Project to increase its cost-competi-tiveness and profitability. Specifically, we will invest in suchcompetitive product lines as high-purity aluminum foils forcapacitors, aluminum cylinders for laser printers, andShotic forgings. At the same time, we will recover theprofitability of our automotive heat exchanger business byintroducing new products, expanding operations in China,and reducing costs drastically.
(5) Capital investment and R&D programWe will make capital investments of approximately¥200 billion in the three-year period, of which investmentsin growth businesses will account for 60%. The budgetfor research and development in the same period willtotal around ¥70 billion.
(6) Cash flowsNet cash provided by operating activities for the three-year period will total ¥260 billion, while net cash used ininvesting activities for the same period will reach ¥200 bil-lion. Thus, free cash flow for the period is expected toamount to ¥60 billion.
2002 2003 2004 2005 2007 Passion
2006 Forecast
2008 Passion
2002 2003 2004 2005 2006 Forecast
2007 Passion
2008 Passion
300
400
500
600
0
20
60
80
40
100
INTEREST-BEARING DEBT (Billions of yen)
OPERATING INCOME (Billions of yen)
581.1
527.4
502.4
448.8461.0
435.3
400.0 31.3
38.5
52.157.2
62.0
73.0
85.0
INTEREST-BEARING DEBT/OPERATING INCOME
PetrochemicalsCONSOLIDATED BUSINESS RESULTS (Millions of yen)
2005 2004 Difference Rate of change (%)
Sales 301,189 254,351 +46,838 +18.4%
Operating income 21,837 20,132 +1,705 +8.5%
The Petrochemicals segment’s sales for 2005increased 18.4%, to ¥301,189 million, as sales ofolefins and organic chemicals rose due to higher sellingprices. Operating income increased 8.5%, despite ris-ing naphtha costs, to ¥21,837 million, as our ethyleneplant continued to operate at full capacity and the risein raw material costs for organic chemicals wasabsorbed by higher selling prices.
OlefinsEthylene production in Japan totaled 7.62 million tonsin 2005, an increase of 0.7% from the preceding year,reflecting continued high demand for petrochemicalsamid economic recovery in Japan. Showa Denko’sethylene production was 668,000 tons, almostunchanged from the 2004 level. Shipment volumes ofethylene declined slightly due to increased captive useat Japan Ethyl Acetate Co., Ltd.’s plant, which beganoperations in April 2004. However, sales of olefinswere up, as selling prices rose in overseas markets,reflecting rising naphtha prices. Operating incomedeclined slightly, due to the sluggish market in thefourth quarter.
TopicsWe decided to modify our ethylene plant at the OitaPetrochemical Complex to increase the use of non-naphtha feedstock. The modification work is to beconducted during the maintenance shutdown startingin the middle of March 2006. At the same time, we willmodify certain production lines of the ethylene plant toincrease efficiency, thereby increasing the productioncapacity by 24,000 tons per year, to 677,000 tons peryear. The total cost will be approximately ¥2 billion.
Organic ChemicalsSales of organic chemicals increased due to the risein selling prices, reflecting higher raw material costs,and due to the continuation of full-capacity production.Shipment volumes increased, due partly to the full-yearcontribution of Japan Ethyl Acetate’s operations.Operating income also increased, as we were able toraise selling prices of acetic acid, vinyl acetate, ethyl
acetate, and allyl alcohol at home and abroad, owingto tight supply.
PlasticsSales of plastics by Showa Highpolymer Co., Ltd.,were up due to an increase in selling prices, reflectingthe rise in feedstock costs. Meanwhile, sales of plasticproducts by Heisei Polymer Co., Ltd., were maintainedat the previous year’s level due partly to stagnant ship-ment volumes of plastic products for industrial use.
TopicsIn July, we transferred our shares in Hymold Co., Ltd.,a consolidated subsidiary engaged in the plastic pro-cessing business, to the Toyo Denka Kogyo Group.We also took restructuring measures at Heisei Polymerand Showa Denko Plastic Products Co., Ltd., bothengaged in the plastic processing business. Thus,we completed overall restructuring in this sectorin accordance with the Sprout Project.
ChemicalsCONSOLIDATED BUSINESS RESULTS (Millions of yen)
2005 2004 Difference Rate of change (%)
Sales 74,001 80,188 -6,187 -7.7%
Operating income 4,740 4,845 -105 -2.2%
The Chemicals segment’s sales decreased 7.7%,despite steady demand for acrylonitrile and ammonia,to ¥74,001 million, owing to the transfer of the com-modity gas business to TG Showa K.K. in 2004 andthe sale of SDS Biotech K.K. in March 2005. Operatingincome also decreased, down 2.2%, to ¥4,740 million,due partly to stagnant sales of feed-additive stabilizedvitamin C and other specialty chemicals.
Gases & ChemicalsSales of industrial gases fell as a result of the transferin the second half of 2004 of the oxygen/nitrogen/hydrogen businesses to TG Showa. Meanwhile, salesof industrial chemicals, including acrylonitrile and am-monia, were up due to steady shipment volumes andprices. As a result, overall sales of gases & chemicalsrose. Operating income from gases & chemicals oper-ations increased slightly as the fall in operating incomefrom industrial gases was offset by price hikes in otherproduct lines.
R
8 Annual Report 2005
REVIEW OF OPERATIONS
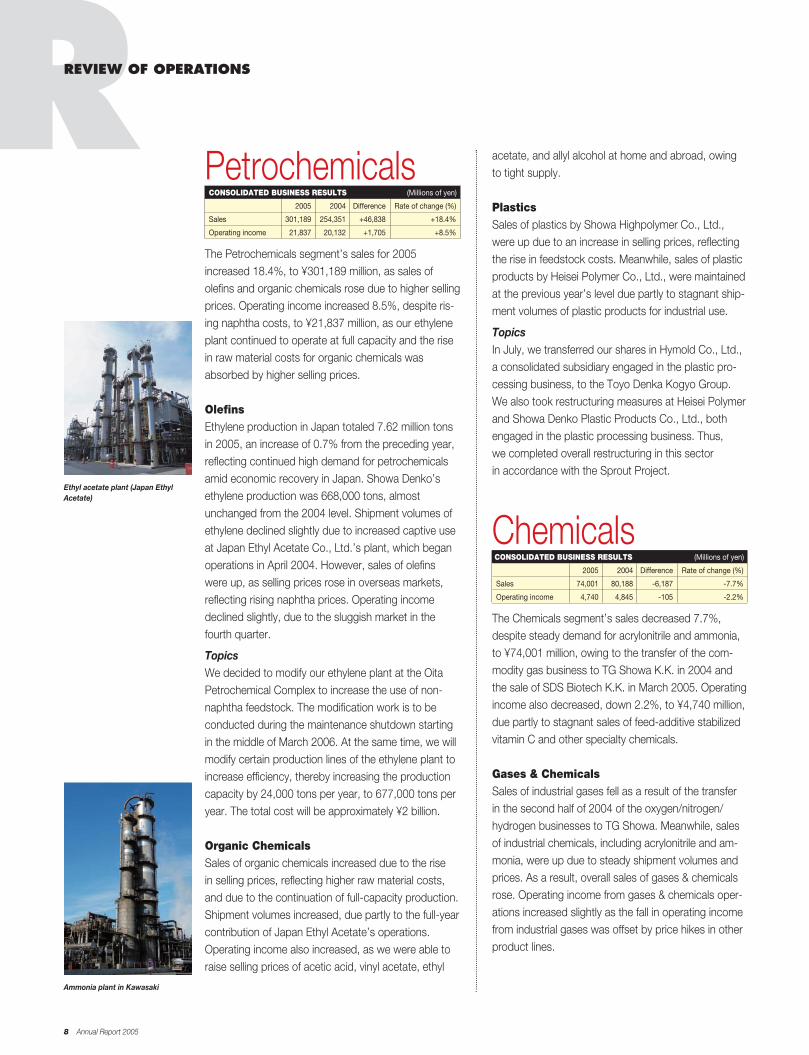
Ammonia plant in Kawasaki
Ethyl acetate plant (Japan EthylAcetate)

Showa Denko K.K. 9
Hard DisksThe world’s shipments of both HD drives and HDmedia increased in 2005, reflecting a sharp increase indemand for such consumer electronics applications asmobile music players and DVD recorders. At ShowaDenko, both sales and operating income grew due toincreases in shipment volumes, centering on 1.8-inchand 2.5-inch glass-substrate media, as well as the full-year consolidation of Showa Denko HD Trace andcontinued full-capacity operations at all of our threemedia plants.
TopicsWe started the world’s first commercial productionof HD media based on the perpendicular magneticrecording technology, enabling a dramatic increase inrecording density. They are 1.89-inch media for use inmobile music players, having the storage capacity of40 gigabytes per disk.
We also started the commercial production of theworld’s smallest 0.85-inch HD media. Demand for very-small-diameter HD media, including the 0.85-inch type,is expected to grow rapidly in the near future as theywill be installed in mobile phones to enable the handlingof music and TV programs.
We are increasing our HD media production capaci-ty by 3.05 million disks a month, to 13.75 million disksa month, by the end of March 2006 to meet growingdemand for small-diameter media. The expansion iscarried out through the construction of new lines andthe debottlenecking of existing lines, with capitalinvestment of approximately ¥12 billion. Furthermore,we decided to build a new HD media plant inSingapore for start-up in the fourth quarter of 2006. Asa result of the construction of the new plant and otherexpansionary measures, our HD media productioncapacity will increase to 24 million disks per monthby the end of 2008.
We decided to build a new R&D facility in Ichihara,Japan, to promote the development of the next-generation HD media. The facility is scheduled forcompletion by the end of April 2006 at the cost ofaround ¥3 billion.
Specialty ChemicalsSales of Shoprene polychloroprene synthetic rubberincreased due to steady shipment volumes and prices.However, shipment volumes of feed-additive stabilizedvitamin C and chelating agents fell, and so did salesof agrochemicals following the sale of SDS Biotech.As a result, overall sales and operating income fromspecialty chemicals operations declined.
TopicsIn March, we transferred our shares in SDS Biotech, aconsolidated subsidiary engaged in the agrochemicalsbusiness, to the board members of SDS Biotech andMizuho Capital Partners Co., Ltd., through a manage-ment buyout scheme.
In June, we transferred our shares in EC-SHOWADENKO K.K. to the joint venture partner EMS-CHEMIEAG, of Switzerland, withdrawing completely from thenylon specialty business.
We started selling a new grade of high-performanceisocyanate monomer, Karenz BEI, for the precisionsurface treatment of LCDs and semiconductors. Thenew product provides photo-setting speed two timesthat of conventional grades.
ElectronicsCONSOLIDATED BUSINESS RESULTS (Millions of yen)
2005 2004 Difference Rate of change (%)
Sales 133,902 112,455 +21,447 +19.1%
Operating income 19,727 14,919 +4,808 +32.2%
The Electronics segment’s sales increased 19.1%,to ¥133,902 million, and operating income jumped32.2%, to ¥19,727 million.
While shipment volumes of compound semiconduc-tors declined substantially due to inventory adjust-ments by the LED industry, those of hard disk (HD)media increased markedly following the consolidationof Showa Denko HD Trace Corporation in Taiwan inthe second half of 2004.
Overall sales of electronic materials increased assales of semiconductor-processing specialty gases,rare earth magnetic alloys, and electronic ceramicsrose, despite a slight decline in the sales of fine carbons.
New R&D facility for large capacityHD media (conceptual drawing)

CarbonsSales of fine carbons, including VGCF carbonnanofibers, slipped due to decreases in selling prices.Demand for VGCF remained steady for lithium-ionbattery applications.
CapacitorsSales of solid conductive polymer aluminum surface-mount capacitors rose due to increased shipmentvolumes.
TopicsIn August, we began joint research efforts with theNational Institute of Advanced Industrial Science andTechnology and the Central Research Institute ofElectric Power Industry for the commercial productionof silicon carbide (SiC) epitaxial wafers. Compared withconventional silicon-based semiconductors, SiC epi-taxial wafers offer such advantages as smaller size andlower electricity loss.
InorganicsCONSOLIDATED BUSINESS RESULTS (Millions of yen)
2005 2004 Difference Rate of change (%)
Sales 61,882 55,295 +6,587 +11.9%
Operating income 8,310 6,099 +2,211 +36.3%
The Inorganics segment’s sales increased 11.9%, to¥61,882 million, and operating income jumped 36.3%,to ¥8,310 million, due to increases in shipment vol-umes and selling prices of ceramics and carbons.
CeramicsSales of ceramics increased due mainly to steady ship-ments of alumina. Operating income also increased.
Carbons & Metallic MaterialsBoth sales and operating income from this businessrose as sales of graphite electrodes by Showa DenkoK.K., and its U.S. subsidiary Showa Denko Carbon,Inc., increased due to steady shipment volumes andselling prices, reflecting growing demand for steelworldwide.
Compound SemiconductorsSales of compound semiconductors decreased, owingto the fall in shipment volumes of gallium-phosphideepitaxial wafers for LEDs as well as lower marketdemand for epitaxial wafers used in laser diodes andphotodiodes. Operating income from the compoundsemiconductor business also decreased.
TopicsIn November, we started selling high-power near ultra-violet LED chips and bright green LED chips, bothbased on gallium nitride (GaN). With the launch ofthese two types, we became the world’s first companyto provide high-brightness LED chips for all wave-lengths, ranging from near ultraviolet to infrared.
Rare EarthsSales of our rare earth magnetic alloys rose due toincreases in demand for neodymium-based magnetsfor HD drives and auto parts. Operating income fell,however, due to the delay in raising selling prices inresponse to soaring raw material costs.
Specialty Gases for SemiconductorProcessingSales of specialty gases for semiconductor processingrose due to higher shipment volumes on overseasmarkets.
TopicsTaiwan Showa Chemicals Manufacturing Co., Ltd.,one of our Taiwan subsidiaries, started up its high-puri-ty ammonia production facility. Demand for high-purityammonia is increasing as a nitrogen source in the pro-duction of GaN LEDs and electronic devices as well asa nitride-film-forming gas in the production of semicon-ductors and LCDs.
CeramicsDespite lower shipment volumes of titanium oxide forcapacitors in the first half of 2005, sales of electronicceramics grew due to increased shipment volumesof Shorox polishing materials for LCDs and glass-substrate HD media.
10 Annual Report 2005
RREVIEW OF OPERATIONS
Shipment of graphite electrodes (Omachi Plant)
High-purity gases and chemicals used in etching and cleaning for semiconductor production

Showa Denko K.K. 11
Aluminum cylinders for laser printers
Annealing furnace for high-purity foilproduction (Sakai Plant)
TopicsWe started the commercial production of 32-inch-diameter graphite electrodes for use in electric arcfurnaces for steel production. The product representsthe largest size on the world market.
In March, we transferred our shares in MiddelburgTechnochrome (Pty) Ltd., a joint venture withSamancor Limited, of South Africa, and MarubeniCorporation for the production of low-carbonferrochrome, to Samancor, completing withdrawalfrom the metallic materials business.
In November, we withdrew from the carbon blackbusiness by dissolving a joint venture with CabotCorporation, of the United States.
We developed a high-performance separator forpolymer electrolyte fuel cells, which will be used as apower source for homes, cars, and mobile devices.The new separator, made by molding a composite ofartificial graphite and resins, offers such advantages ashigher crack resistance and lower cost.
AluminumCONSOLIDATED BUSINESS RESULTS (Millions of yen)
2005 2004 Difference Rate of change (%)
Sales 240,924 238,419 +2,505 +1.1%
Operating income 8,310 12,321 -4,011 -32.6%
The Aluminum segment’s sales increased 1.1%, to¥240,924 million. Sales of aluminum ingots increaseddue to higher selling prices, reflecting rising LondonMetal Exchange (LME) prices. Sales of Shotic forgedproducts also increased, due to the rise in shipmentvolumes for auto parts applications. Meanwhile, salesof rolled products decreased, due to the fall in ship-ment volumes of commodity rolled sheets. Sales ofheat exchangers also decreased, reflecting lower ship-ment volumes in Japan and Europe. The Aluminumsegment’s operating income decreased 32.6%, to¥8,310 million, mainly due to the fall in selling pricesof aluminum cans and lower shipment volumes of heat exchangers.
Rolled ProductsSales of rolled products were down, due to lower ship-ment volumes of commodity sheets, notwithstandinga slight increase in sales of high-purity foils for capacitors.
Extrusions & Specialty ProductsOverall sales from these operations decreased due tothe fall in the shipment volumes of commodity extru-sions. Shipment volumes of large extrusions, rods,and tubes as well as specialty products, centeringon aluminum cylinders for laser printers, were up.
TopicsTo meet growing demand for aluminum cylinders forlaser printers, we decided to build a new productionline based on advanced technologies. Together withthe upgrading of existing lines, we are investing a totalof approximately ¥2 billion.
ShoticSales of Shotic forged products were up due toincreased shipments in Japan and Singapore for carair-conditioner parts applications, notwithstandinglower sales in Europe.
Heat ExchangersAlthough shipment volumes in the United Statesincreased, those in Japan and Europe decreased,resulting in lower sales from heat exchanger operations.
TopicsWe developed a new high-performance condenserfor car air conditioners and started selling the productunder the trade name of NRT (new refrigerant tube) III.The product, though thin and small, provides higherefficiency of condensation, helping reduce the volumeof refrigerants to be used. Some Japanese and foreigncarmakers have decided to install NRT III in their newmodels.
Aluminum CansSales of aluminum cans were maintained at the previ-ous year’s level as increases in shipment volumes wereoffset by decreases in selling prices.
12 Annual Report 2005
RCORPORATE SOCIAL RESPONSIBILITYCSHOWA DENKO VISION
We at the Showa Denko Group will provide productsand services that are useful and safe and exceed ourcustomers’ expectations, thereby enhancing the valueof the Group, giving satisfaction to our shareholders, andcontributing to the sound growth of international societyas a responsible corporate citizen.
We defined our vision in 2002 when we formulatedthe Sprout Project and partially revised its wording in2005 from the viewpoint of corporate social responsi-bility (CSR). The vision, though brief, clarifies our mis-sion of fulfilling the expectations of all our stakeholders,including shareholders, customers, suppliers, citizens,and employees. We will work hard to realize this visionand earn the full trust of all stakeholders by providingexcellent products and services in line with the newPassion Project.
CODE OF CONDUCT AND GUIDELINESWe established the code of conduct for Showa DenkoGroup employees in 1998. We then enacted its guide-lines in the following year, clarifying the meaning of thecode through details and examples. We then partiallyrevised the guidelines in 2005 to better reflect the prin-ciples of CSR. In their daily activities, all officers andemployees of the Showa Denko Group are followingthe code and its guidelines to retain public confidence,contribute to the prosperity of international society, andensure the continued growth of the Group.
The code of conductAs Showa Denko officers and employees,1. We will develop and provide useful and safe technolo-
gies, products, and services to contribute to the soundgrowth of society;
2. We will observe the laws of Japan and of the foreigncountries in which we operate, abide by the Companyrules, and strive to maintain the social order;
3. We will conduct business in Japan and abroad basedon the principle of fair and free competition;
4. We will do our best to ensure safety and to protect theglobal environment;
5. We will make sure that we maintain good communica-tions with the public and disclose accurate informationon our Company in a timely manner;
6. We will respect human rights and create a cheerful andcomfortable working environment; and
7. We will act as a member of the international societyand contribute to the development of the regions inwhich we operate.
COMPLIANCEWe give the highest priority to social justice and corpo-rate ethics. To ensure full compliance with the lawsand regulations throughout the Group, we establisheda Corporate Ethics Committee in 2003. At the sametime, we opened new channels of communicationwhereby anyone who is concerned about possible vio-lation of compliance can report the matter directly to aCompany official by intranet, e-mail, telephone, or letter.The Company will guard the informant’s privacy andmake sure that there will be no unfavorable treatment.
As from 2004, we started observing CorporateEthics Month in Japan. Every January, all officers andemployees will carefully reread the code of conductand its guidelines to renew their awareness and rechecktheir behavior so as to further enhance the level ofcompliance and corporate ethics. These measures willhelp us prevent the occurrence of transgressions.
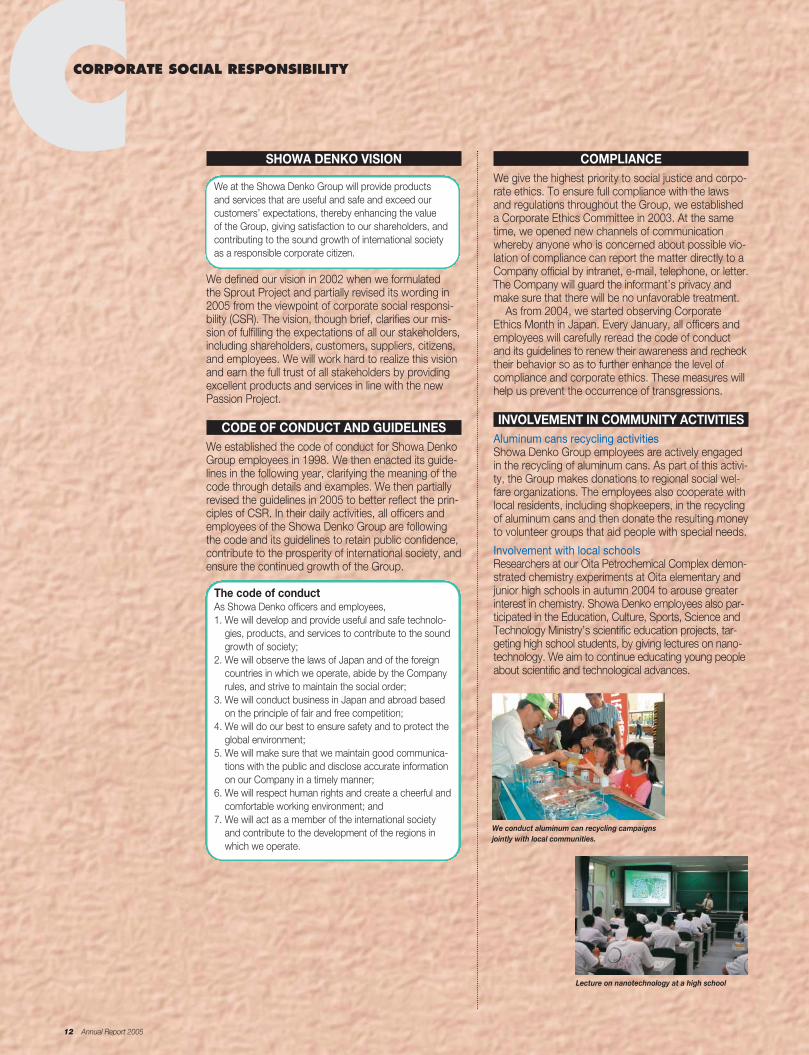
INVOLVEMENT IN COMMUNITY ACTIVITIESAluminum cans recycling activitiesShowa Denko Group employees are actively engagedin the recycling of aluminum cans. As part of this activi-ty, the Group makes donations to regional social wel-fare organizations. The employees also cooperate withlocal residents, including shopkeepers, in the recyclingof aluminum cans and then donate the resulting moneyto volunteer groups that aid people with special needs.
Involvement with local schoolsResearchers at our Oita Petrochemical Complex demon-strated chemistry experiments at Oita elementary andjunior high schools in autumn 2004 to arouse greaterinterest in chemistry. Showa Denko employees also par-ticipated in the Education, Culture, Sports, Science andTechnology Ministry’s scientific education projects, tar-geting high school students, by giving lectures on nano-technology. We aim to continue educating young peopleabout scientific and technological advances.
We conduct aluminum can recycling campaignsjointly with local communities.
Lecture on nanotechnology at a high school

Showa Denko K.K. 13
Responsible Care is the chemical industry’s globalvoluntary initiative, representing a commitment towork together to continuously improve the environ-mental, health, and safety performance of chemicalsover their entire life cycles, namely, the develop-ment, production, distribution, use, final consump-tion, and disposal. Showa Denko has beenperforming its Responsible Care activities since1995, when it established action guidelines to imple-ment the program. Responsible Care activities areconducted within our five business segments (12business divisions and 13 regional offices), threebranches, an R&D Center, and 16 subsidiaries andaffiliates, based on voluntary, specific action plansprepared in line with the Responsible CareCommittee’s basic plan. The following are someexamples of our activities:
ENERGY CONSERVATIONWe are making our best efforts to conserve energy in orderto contribute to the prevention of global warming and pro-tect natural resources. Our rate of energy consumption bybasic energy unit in 2004 was reduced to 79% of the 1990figure, due partly to the successful implementation of on-lineoptimizing control systems. Approximately 20% of our totalelectricity requirements are now met by our hydroelectricpower plants, a clean source of energy.
REDUCTION OF INDUSTRIAL WASTEWe are committed to effectively using industrial waste andto reducing the volume of its discharge. Owing to variousmeasures, such as the use of inorganic sludge (in cement,for example), the final volume of landfill disposal in 2004 wasreduced by 84% from the 1990 base level.
ENVIRONMENT-RELATED INVESTMENT (Cumulative value since 1990)
(Billions of yen)
0
2
4
6
8
10
14
12
’90 ’91 ’92 ’93 ’94 ’95 ’96 ’97 ’98 ’99 ’00 ’01 ’02 ’03 ’04
ENERGY CONSUMPTION RATE TRANSITION
(Relative value: base year 1990)
70
80
90
100
110
’90 ’91 ’92 ’93 ’94 ’95 ’96 ’97 ’98 ’99 ’00 ’01 ’02 ’03 ’04’90 ’91 ’92 ’93 ’94 ’95 ’96 ’97 ’98 ’99 ’00 ’01 ’02 ’03 ’04
TRENDS IN THE FINAL VOLUME OF LANDFILL DISPOSAL
(Tons per year)
0
3,000
6,000
9,000
12,000
18,000
15,000
TRENDS IN THE USAGE OF ALUMINUM RECOVERED (Compared with 1990)
Ratio of aluminum recovered to total usage (%) (Base year 1990)
0
50
100
150
200
250
350
300
Target value
’90 ’91 ’92 ’93 ’94 ’95 ’96 ’97 ’98 ’99 ’00 ’01 ’02 ’03 ’04’90 ’91 ’92 ’93 ’94 ’95 ’96 ’97 ’98 ’99 ’00 ’01 ’02 ’03 ’04’90 ’91 ’92 ’93 ’94 ’95 ’96 ’97 ’98 ’99 ’00 ’01 ’02 ’03 ’04 Target value
R
Showa Denko K.K. 13
RESPONSIBLE CARE ACTIVITIES
PROMOTION OF RESOURCE CONSERVATION AND RECYCLING
We are promoting resource conservation and recycling at allof our operation sites. For example, under the leadership ofa special committee, Showa Denko employees are activelyrecycling aluminum cans, and the Company is employing anincreasing amount of recycled aluminum cans and sashesas raw materials. In addition, we started utilizing waste plas-tic—industrial waste and used containers and wrapping forconsumer products—as feedstock at our Kawasaki Plant in2003. The collected waste plastic is crushed, formed, andgasified for use as synthesis gas for ammonia production.The impurities in collected waste plastics are recovered inthe form of valuable metals, construction materials, roadbedmaterials, etc., leaving no wastes at all.
DEVELOPMENT OF ENVIRONMENT-FRIENDLY PRODUCTS ANDTECHNOLOGIES
We are working hard to develop products and technologiesthat contribute to the protection of the environment, health,and safety. Examples include fuel cell separators made bymolding a composite of artificial graphite and resins, as wellas the world’s first system for recovering and disposing ofvolatile, waste anesthetic gas (Anesclean).
ACQUISITION OF ISO 14001 CERTIFICATIONAll of our operation sites have already acquired certificationunder the ISO 14001 international standard for environmen-tal management systems. As of January 2006, environmen-tal management activities were being implemented at 18 ofour subsidiaries and affiliates, as well as at our operationsites, in accordance with the standard.
Responsible Careactivities logo
B
14 Annual Report 2005
CCORPORATE GOVERNANCE
1. Basic concept regarding corporate governanceWe fully recognize the importance of corporate gover-nance and compliance, and have been taking variousmeasures in this regard to ensure the sustainablegrowth and long-term value of the Company.
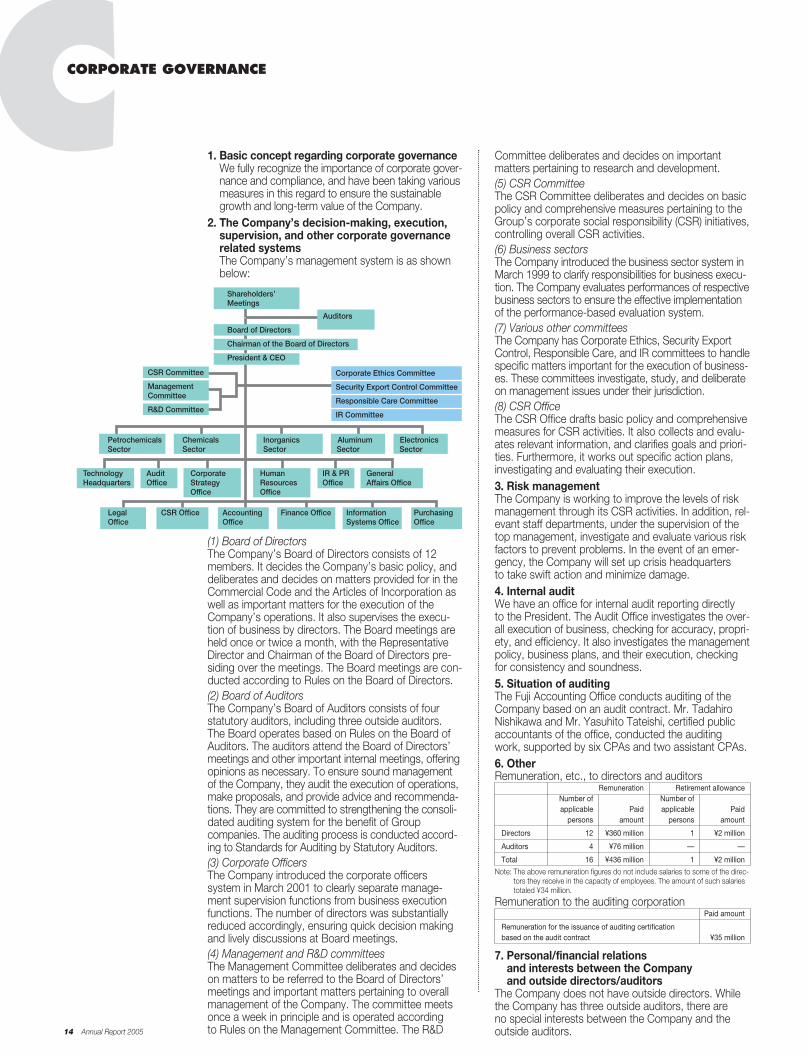
2. The Company’s decision-making, execution,supervision, and other corporate governancerelated systemsThe Company’s management system is as shownbelow:
(1) Board of Directors The Company’s Board of Directors consists of 12members. It decides the Company’s basic policy, anddeliberates and decides on matters provided for in theCommercial Code and the Articles of Incorporation aswell as important matters for the execution of theCompany’s operations. It also supervises the execu-tion of business by directors. The Board meetings areheld once or twice a month, with the RepresentativeDirector and Chairman of the Board of Directors pre-siding over the meetings. The Board meetings are con-ducted according to Rules on the Board of Directors.(2) Board of AuditorsThe Company’s Board of Auditors consists of fourstatutory auditors, including three outside auditors.The Board operates based on Rules on the Board ofAuditors. The auditors attend the Board of Directors’meetings and other important internal meetings, offeringopinions as necessary. To ensure sound managementof the Company, they audit the execution of operations,make proposals, and provide advice and recommenda-tions. They are committed to strengthening the consoli-dated auditing system for the benefit of Groupcompanies. The auditing process is conducted accord-ing to Standards for Auditing by Statutory Auditors.(3) Corporate OfficersThe Company introduced the corporate officerssystem in March 2001 to clearly separate manage-ment supervision functions from business executionfunctions. The number of directors was substantiallyreduced accordingly, ensuring quick decision makingand lively discussions at Board meetings.(4) Management and R&D committeesThe Management Committee deliberates and decideson matters to be referred to the Board of Directors’meetings and important matters pertaining to overallmanagement of the Company. The committee meetsonce a week in principle and is operated accordingto Rules on the Management Committee. The R&D
Shareholders’Meetings
CSR Committee
ManagementCommittee
R&D Committee
Corporate Ethics Committee
Security Export Control Committee
Responsible Care Committee
IR Committee
Corporate Ethics Committee
Security Export Control Committee
Responsible Care Committee
IR Committee
Petrochemicals Chemicals Inorganics Aluminum ElectronicsSector Sector Sector Sector Sector
Technology Audit Corporate Human IR & PR General Headquarters Office Strategy Resources Office Affairs Office Office Office
Legal CSR Office Accounting Finance Office Information PurchasingOffice Office Systems Office Office
Auditors
Board of Directors
Chairman of the Board of Directors
President & CEO
Committee deliberates and decides on importantmatters pertaining to research and development. (5) CSR CommitteeThe CSR Committee deliberates and decides on basicpolicy and comprehensive measures pertaining to theGroup’s corporate social responsibility (CSR) initiatives,controlling overall CSR activities.(6) Business sectorsThe Company introduced the business sector system inMarch 1999 to clarify responsibilities for business execu-tion. The Company evaluates performances of respectivebusiness sectors to ensure the effective implementationof the performance-based evaluation system.(7) Various other committeesThe Company has Corporate Ethics, Security ExportControl, Responsible Care, and IR committees to handlespecific matters important for the execution of business-es. These committees investigate, study, and deliberateon management issues under their jurisdiction.(8) CSR OfficeThe CSR Office drafts basic policy and comprehensivemeasures for CSR activities. It also collects and evalu-ates relevant information, and clarifies goals and priori-ties. Furthermore, it works out specific action plans,investigating and evaluating their execution.3. Risk managementThe Company is working to improve the levels of riskmanagement through its CSR activities. In addition, rel-evant staff departments, under the supervision of thetop management, investigate and evaluate various riskfactors to prevent problems. In the event of an emer-gency, the Company will set up crisis headquartersto take swift action and minimize damage.4. Internal auditWe have an office for internal audit reporting directlyto the President. The Audit Office investigates the over-all execution of business, checking for accuracy, propri-ety, and efficiency. It also investigates the managementpolicy, business plans, and their execution, checkingfor consistency and soundness.5. Situation of auditingThe Fuji Accounting Office conducts auditing of theCompany based on an audit contract. Mr. TadahiroNishikawa and Mr. Yasuhito Tateishi, certified publicaccountants of the office, conducted the auditingwork, supported by six CPAs and two assistant CPAs. 6. OtherRemuneration, etc., to directors and auditors
Remuneration Retirement allowanceNumber of Number ofapplicable Paid applicable Paid
persons amount persons amount
Directors 12 ¥360 million 1 ¥2 million
Auditors 4 ¥76 million — —
Total 16 ¥436 million 1 ¥2 million
Note: The above remuneration figures do not include salaries to some of the direc-tors they receive in the capacity of employees. The amount of such salariestotaled ¥34 million.
Remuneration to the auditing corporationPaid amount
Remuneration for the issuance of auditing certification based on the audit contract ¥35 million
7. Personal/financial relations and interests between the Company and outside directors/auditors
The Company does not have outside directors. Whilethe Company has three outside auditors, there areno special interests between the Company and theoutside auditors.
BBOARD OF DIRECTORS
Standing Statutory AuditorsMinoru KiyonoHiroshi Ito
AuditorsTakashi KobayashiShogo ItodaHideshi Iwai
CORPORATE OFFICERS AND CHIEF TECHNOLOGISTS
Corporate OfficersToshio OhiGeneral Manager, Chemicals ProductionCenter, Chemicals Sector
Kenji TsukamotoGeneral Manager, Corporate TechnicalOffice, Technology Headquarters; GeneralManager, Strategic Marketing Center
Takumi UiDeputy Executive Officer, Aluminum Sector; General Manager, Heat Exchanger Division
Hisao TakamatsuGeneral Manager, Chemicals Division,Chemicals Sector; General Manager,Development Department, ChemicalsDivision
Takashi MiyazakiGeneral Manager, Olefins Divisionand Organic Chemicals Division,Petrochemicals Sector
Takao FujiwaraGeneral Manager, Ceramics Division,Inorganics Sector
Masayuki MiyauchiGeneral Manager, Carbons Division,Inorganics Sector
Toshio NishideGeneral Manager, Extrusions/SpecialtyProducts Division, Aluminum Sector
Eiichi SatoOita Complex Representative,Petrochemicals Sector
Yasumichi MurataGeneral Manager, General Affairs Office
Shunichi ShiraishiGeneral Manager, Shotic Division,Aluminum Sector
Kenichi IzumiGeneral Manager, HD Division,Electronics Sector
Hideo IchikawaGeneral Manager, Corporate Strategy Office
Senior Chief TechnologistTadahiro HashimotoIn charge of rare earth business strategy,Electronics Sector
Chief TechnologistShigeru YanagimotoGeneral Manager, Aluminum TechnologyCenter, Aluminum Sector
(As of March 30, 2006)
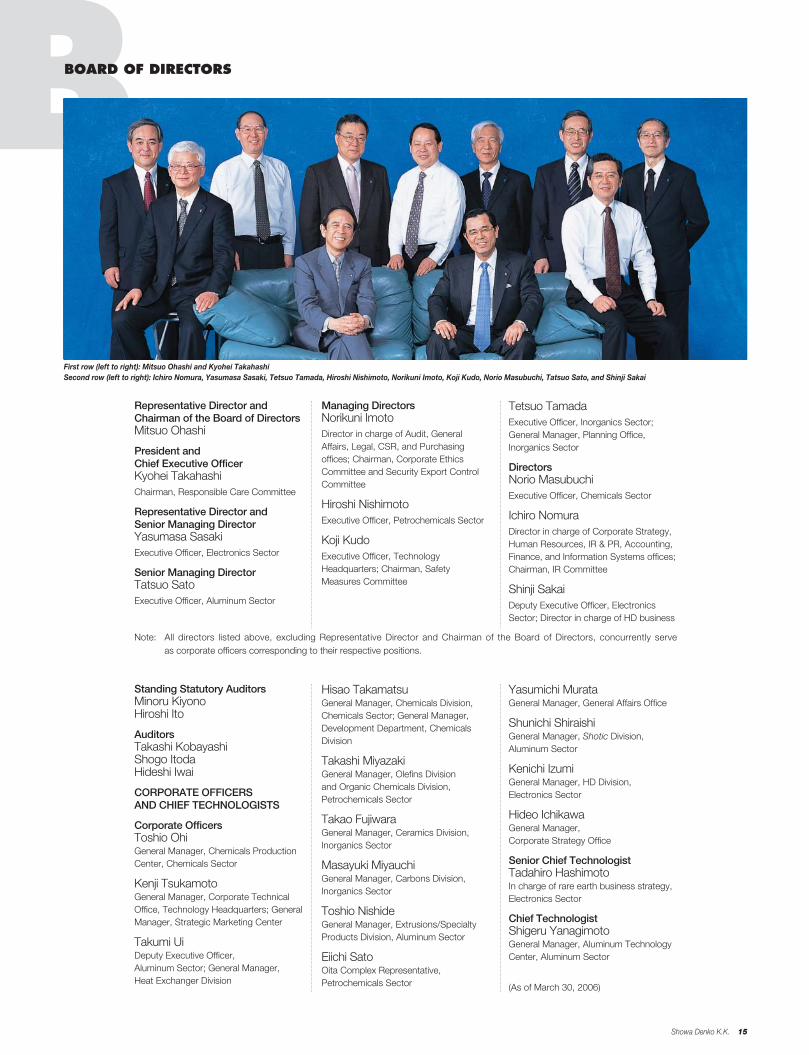
First row (left to right): Mitsuo Ohashi and Kyohei TakahashiSecond row (left to right): Ichiro Nomura, Yasumasa Sasaki, Tetsuo Tamada, Hiroshi Nishimoto, Norikuni Imoto, Koji Kudo, Norio Masubuchi, Tatsuo Sato, and Shinji Sakaintative Director andChairman of the Board of Directors (left), Kyohei Takahashi, President and CEO
Representative Director andChairman of the Board of DirectorsMitsuo Ohashi
President and Chief Executive OfficerKyohei TakahashiChairman, Responsible Care Committee
Representative Director andSenior Managing DirectorYasumasa SasakiExecutive Officer, Electronics Sector
Senior Managing DirectorTatsuo SatoExecutive Officer, Aluminum Sector
Managing DirectorsNorikuni ImotoDirector in charge of Audit, GeneralAffairs, Legal, CSR, and Purchasingoffices; Chairman, Corporate EthicsCommittee and Security Export ControlCommittee
Hiroshi NishimotoExecutive Officer, Petrochemicals Sector
Koji KudoExecutive Officer, TechnologyHeadquarters; Chairman, SafetyMeasures Committee
Tetsuo TamadaExecutive Officer, Inorganics Sector;General Manager, Planning Office,Inorganics Sector
DirectorsNorio MasubuchiExecutive Officer, Chemicals Sector
Ichiro NomuraDirector in charge of Corporate Strategy,Human Resources, IR & PR, Accounting,Finance, and Information Systems offices;Chairman, IR Committee
Shinji SakaiDeputy Executive Officer, ElectronicsSector; Director in charge of HD business
Note: All directors listed above, excluding Representative Director and Chairman of the Board of Directors, concurrently serve as corporate officers corresponding to their respective positions.
Showa Denko K.K. 15

16 Annual Report 2005
Showa Denko and its Group companies arepromoting R&D in line with their medium-termconsolidated business plan to establish techno-logical advantages in the fields of petrochemicals,fine chemicals, electronics, aluminum, and newinorganic materials.
Under the new Passion Project that started in2006, we will aim to establish ourselves as the“unique chemical company with individualizedproducts” by continuing to pursue and improvesynergies through the interconnection of ourinorganic/aluminum and organic chemical tech-nologies. We will invest a total of approximately¥70 billion in the three-year period under thePassion Project, of which roughly 60% will beused for R&D for “growth driver” businesses andnew “growth drivers”, 30% for base businessesand common projects, and 10% for creating newproducts for commercialization by 2010.
Showa Denko and its Group companies invest-ed ¥17,384 million in R&D in 2005. A breakdownby segment of R&D efforts and investmentsduring the year is as follows:
PETROCHEMICALSIn this segment, we are fully utilizing our proprietarytechnologies for catalysts, organic synthesis, and poly-mer synthesis to meet the needs of organic chemicalmanufacturers. In the area of acetyl chemicals, we areimproving catalysts for the production of acetic acidand ethyl acetate to consolidate our leading cost-competitive position. We are also improving catalystsfor the production of vinyl acetate and allyl alcohol tofurther strengthen our competitiveness. To increase theuse of non-naphtha feedstock at our ethylene plant,we are developing various technologies, ranging fromcatalysts to plant operations. In the area of allyl prod-ucts, we are developing applications for our proprietaryallyl ester resin mainly for optical material applications.At the same time, we are developing other allyl deriva-tives for environment/IT-related applications. ThePetrochemicals segment invested ¥2,447 million inR&D in 2005.
CHEMICALSTo quickly meet wide-ranging customer needs, weare developing photosensitive materials, solderresists, high-performance gels, organic intermediates,base materials for cosmetics, and photosensitive-resin/nano-material composites. We are also develop-ing a waste anesthetic gas disposal system as part ofour efforts to protect the global environment.
Regarding photosensitive materials, we are develop-ing functional isocyanate monomers and photoinitiatorsto support the production of high-performance LCDs.We launched a new isocyanate monomer “KarenzBEI,” having improved photo-setting speed. We are
accelerating the development of solder resists for flexi-ble circuit boards used in LCDs and mobile phones.
In the area of high-performance gels, we are expand-ing the variety of liquid chromatography columns. Weplaced on the market our sample-preparation cartridgesfor analysis of trace amounts of chemical substancesthat could cause sick building syndrome and otherproblems. We are developing organic intermediates fordisinfectants and agrochemicals by fully utilizing ourposition in raw materials. We are also developing newmaterials for metal-organic chemical vapor deposition(MOCVD) processes on the strength of our functionalmolecular design technology.
We also placed on the market new vitamin C de-rivatives, which have high anti-aging properties, underthe trade name of “Apprecier” for use in cosmetics.Development is under way for new vitamin E derivativesand other performance chemicals as base materials forcosmetics. We are also developing photosensitivemaster batches in which nanoparticles of surface-modified metal oxides are mixed with resins. We areaiming to develop applications in textiles having photo-catalytic and ultraviolet shielding functions. We arefurther improving our waste anesthetic gas disposalsystem technology, which is the world’s first system todecompose global warming N2O gas into oxygen andnitrogen. This system has already been introduced atsome university hospitals. The Chemicals segment’sR&D investment amounted to ¥1,590 million in 2005.
ELECTRONICSWe are accelerating the development of state-of-the-art technologies to meet the increasingly sophisticatedmarket requirements. As for storage materials, we arecontinuing to develop new technologies as a leadingHD media manufacturer. Along with increasing therecording density based on the longitudinal recording
RRESEARCH AND DEVELOPMENT
Waste anesthetic gas disposal sys-tem (trade name: Anesclean-SW) toreduce N2O emissions from hospitals
Demand for ultrabright LEDs
GaN-based LEDs (From left, ultraviolet, green, and blue)

Showa Denko K.K. 17
technology and developing small-diameter HD mediafor use in mobile applications, we have commercializedthe world’s first HD media based on the perpendicularmagnetic recording technology.
In the area of display elements and materials, we arecontinuing to develop LEDs with higher brightness anddiverse colors. As for gallium nitride (GaN) LEDs, wehave increased the power of blue LEDs and developednear ultraviolet and green LEDs. As we have increasedthe brightness of aluminum indium gallium phosphide(AlInGaP) LEDs that emit red and yellow light, we arenow able to provide high-brightness LEDs for all wave-lengths, ranging from near ultraviolet to infrared. Wewill continue to improve their performances, developingsuch new applications as backlighting for large LCDsand white lighting. We are conducting joint researchwith the National Institute of Advanced IndustrialScience and Technology, and the Central ResearchInstitute of Electric Power Industry, for the commercialproduction of silicon carbide (SiC) epitaxial wafers forpower device applications.
Regarding solid conductive polymer aluminumcapacitors, we are developing new grades with higherperformance for PC applications. At the same time, weare developing other new applications by increasingcapacitance and operating voltage.
In the area of neodymium-iron-boron magneticalloys, we are meeting market requirements for high-performance magnets through sophisticated castingtechnologies and the better control of alloy microstruc-tures. We are also developing high-performance partsfor noise control devices by fully utilizing our alloy pro-duction expertise and related technologies.
To serve the growing market for advanced displays,we are developing organic electroluminescent materi-als, based on an innovative phosphorescent polymer.In the area of semiconductor processing materials, weare developing CMP slurries for metal polishing at verysmall line widths and high-purity gases for etching,cleaning, and film formation. We are also developinghigh-purity chemicals for detergents and solvents aswell as new charge dissipating agents for electron-beam
lithography processes. The Electronics segmentinvested ¥5,629 million in R&D in 2005.
INORGANICSOur development efforts in this segment focus onnanotechnology-based materials. Having developednew grades of carbon nanotubes with optimized fiberdiameter and length, we are developing applications ofthe product in the area of resin and metal composites.The development of ultrafine particles of titanium oxide,zinc oxide, and composite oxides is progressing. In par-ticular, we are developing applications of nanoparticletitanium oxide, for use in multilayered ceramic capacitors,as a visible-light-responsive photocatalyst for deodorantand stain-proofing agents, and as slurry paste for dye-sensitized solar cells. We are also developing variousfunctional ceramic fillers for heat sink applications andsuper abrasive ceramic grains. The Inorganics segmentspent ¥370 million on R&D in 2005.
ALUMINUMWe are developing light, strong, and high-performancematerials, parts, and products to meet market needswhile conducting research on basic technologies per-taining to their production. Development is under wayfor alloys for automotive applications having such char-acteristics as light weight, high strength, and highformability. We launched a new condenser for car airconditioners using newly developed high-performancerefrigerant tubes. Compared with conventional extrud-ed tubes, the new refrigerant tubes (trade name: NRTIII) provide lighter weight and higher performanceas they are produced by a high-speed continuousprocess. We are also developing innovative heatexchangers based on new types of refrigerants tomeet tighter environmental regulations in the future.
We are developing high-efficiency heat sinks forIT equipment and optical/power devices. At theAluminum Technology Center, we established a dietechnology team in view of the crucial importance ofhigh-performance dies for extrusion, forging, and pressworking processes. The Aluminum segment’s R&Dinvestment amounted to ¥2,034 million in 2005.
COMMON R&D PROJECTSShowa Denko’s Corporate R&D Center conductsbasic research into new areas with a view to fosteringnew businesses and developing technologies commonto different segments. The Analysis & PhysicalProperties Center and the Safety Evaluation Centersupport each segment’s R&D efforts by conductinganalyses and investigations.
In the area of energy-related devices, we are conduct-ing collaborative research for commercializing the carbonseparators for solid polymer-type fuel cells as part of anational project. The first phase of development under anational project was completed in March 2005. CommonR&D expenditures in 2005 totaled ¥5,313 million.
Wind tunnel test of automotiveheat exchangers (Oyama Plant)
Power electronics (For heavy-current switching devices)

C
18 Annual Report 2005
CONSOLIDATED SIX-YEAR SUMMARY MThousands ofU.S. dollars
Millions of yen (Note 1)
2005 2004 2003 2002 2001 2000 2005
For the yearNet sales............................................................. ¥811,899 ¥740,706 ¥689,366 ¥674,018 ¥ 708,900 ¥ 747,000 $6,876,417
Petrochemicals ............................................... 301,189 254,351 235,124 227,753 233,647 232,294 2,550,933Chemicals ....................................................... 74,001 80,188 78,232 68,530 73,020 78,782 626,759Electronics ...................................................... 133,902 112,455 94,735 75,248 77,742 94,393 1,134,090Inorganics ....................................................... 61,882 55,295 50,969 56,878 54,555 57,778 524,112Aluminum........................................................ 240,924 238,419 230,306 245,610 269,936 283,752 2,040,522
Operating income ............................................... 57,191 52,071 38,546 31,303 19,169 29,594 484,379Net income (loss) ................................................ 15,647 7,596 10,317 13,024 (34,260) 2,763 132,526R&D expenditures ............................................... 17,384 17,576 16,983 15,443 15,447 16,588 147,235Capital expenditures ........................................... 41,218 29,916 40,848 28,446 32,299 40,023 349,098Depreciation and amortization............................. 34,203 34,115 34,543 36,956 38,893 40,752 289,687
At year-endTotal assets ........................................................ 986,233 943,908 939,879 986,544 1,030,872 1,088,623 8,352,949Total stockholders’ equity ................................... 206,738 177,701 166,087 150,121 139,458 144,676 1,750,980
U.S. dollarsYen (Note 1)
Per shareNet income (loss)—primary (Note 2) .................... ¥013.70 ¥006.66 ¥009.07 ¥011.44 ¥ (30.78) ¥ 2.66 $0.116Net income—fully diluted (Note 2) ....................... 12.82 6.35 — — — — 0.109Stockholders’ equity ........................................... 180.96 155.53 145.96 131.92 122.54 139.34 1.53Cash dividends (applicable to the period) ................................... 3.00 3.00 2.00 — — — 0.025
Number of employees at year-end..................... 11,118 11,166 10,623 10,933 11,970 13,207Notes: 1. Yen amounts have been translated into U.S. dollars, for convenience only, at the rate of ¥118.07 to US$1, the approximate rate of exchange at December 31, 2005.
2. Net income (loss) per share has been computed based on the average number of shares of common stock outstanding during the respective fiscal year. Fully diluted net income pershare additionally assumes the convertible bonds.
Showa Denko K.K. and Consolidated SubsidiariesDecember 31
Showa Denko K.K. 19
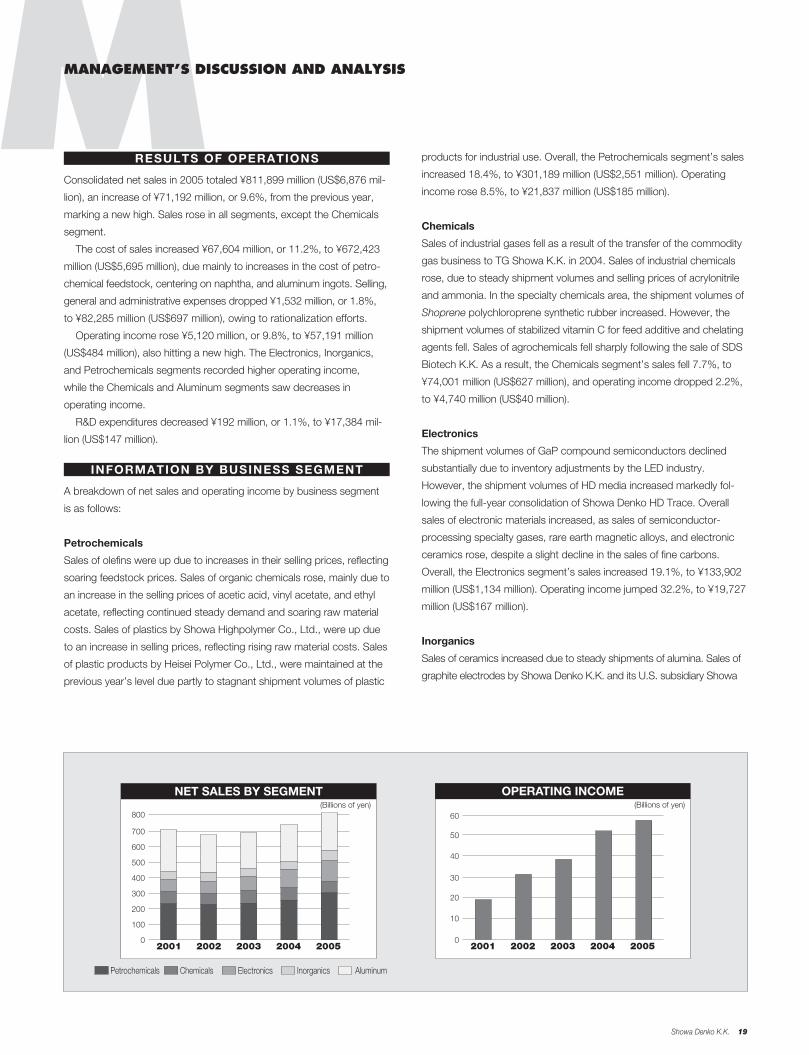
Consolidated net sales in 2005 totaled ¥811,899 million (US$6,876 mil-
lion), an increase of ¥71,192 million, or 9.6%, from the previous year,
marking a new high. Sales rose in all segments, except the Chemicals
segment.
The cost of sales increased ¥67,604 million, or 11.2%, to ¥672,423
million (US$5,695 million), due mainly to increases in the cost of petro-
chemical feedstock, centering on naphtha, and aluminum ingots. Selling,
general and administrative expenses dropped ¥1,532 million, or 1.8%,
to ¥82,285 million (US$697 million), owing to rationalization efforts.
Operating income rose ¥5,120 million, or 9.8%, to ¥57,191 million
(US$484 million), also hitting a new high. The Electronics, Inorganics,
and Petrochemicals segments recorded higher operating income,
while the Chemicals and Aluminum segments saw decreases in
operating income.
R&D expenditures decreased ¥192 million, or 1.1%, to ¥17,384 mil-
lion (US$147 million).
A breakdown of net sales and operating income by business segment
is as follows:
Petrochemicals
Sales of olefins were up due to increases in their selling prices, reflecting
soaring feedstock prices. Sales of organic chemicals rose, mainly due to
an increase in the selling prices of acetic acid, vinyl acetate, and ethyl
acetate, reflecting continued steady demand and soaring raw material
costs. Sales of plastics by Showa Highpolymer Co., Ltd., were up due
to an increase in selling prices, reflecting rising raw material costs. Sales
of plastic products by Heisei Polymer Co., Ltd., were maintained at the
previous year’s level due partly to stagnant shipment volumes of plastic
INFORMATION BY BUSINESS SEGMENT
RESULTS OF OPERATIONS
NET SALES BY SEGMENT(Billions of yen)
0
100
200
300
400
500
600
700
800
2001 2002 2003 2004 2005
Petrochemicals Chemicals Electronics Inorganics Aluminum
products for industrial use. Overall, the Petrochemicals segment’s sales
increased 18.4%, to ¥301,189 million (US$2,551 million). Operating
income rose 8.5%, to ¥21,837 million (US$185 million).
Chemicals
Sales of industrial gases fell as a result of the transfer of the commodity
gas business to TG Showa K.K. in 2004. Sales of industrial chemicals
rose, due to steady shipment volumes and selling prices of acrylonitrile
and ammonia. In the specialty chemicals area, the shipment volumes of
Shoprene polychloroprene synthetic rubber increased. However, the
shipment volumes of stabilized vitamin C for feed additive and chelating
agents fell. Sales of agrochemicals fell sharply following the sale of SDS
Biotech K.K. As a result, the Chemicals segment’s sales fell 7.7%, to
¥74,001 million (US$627 million), and operating income dropped 2.2%,
to ¥4,740 million (US$40 million).
Electronics
The shipment volumes of GaP compound semiconductors declined
substantially due to inventory adjustments by the LED industry.
However, the shipment volumes of HD media increased markedly fol-
lowing the full-year consolidation of Showa Denko HD Trace. Overall
sales of electronic materials increased, as sales of semiconductor-
processing specialty gases, rare earth magnetic alloys, and electronic
ceramics rose, despite a slight decline in the sales of fine carbons.
Overall, the Electronics segment’s sales increased 19.1%, to ¥133,902
million (US$1,134 million). Operating income jumped 32.2%, to ¥19,727
million (US$167 million).
Inorganics
Sales of ceramics increased due to steady shipments of alumina. Sales of
graphite electrodes by Showa Denko K.K. and its U.S. subsidiary Showa
OPERATING INCOME(Billions of yen)
0
10
20
30
40
50
60
2001 2002 2003 2004 2005
MMANAGEMENT’S DISCUSSION AND ANALYSIS
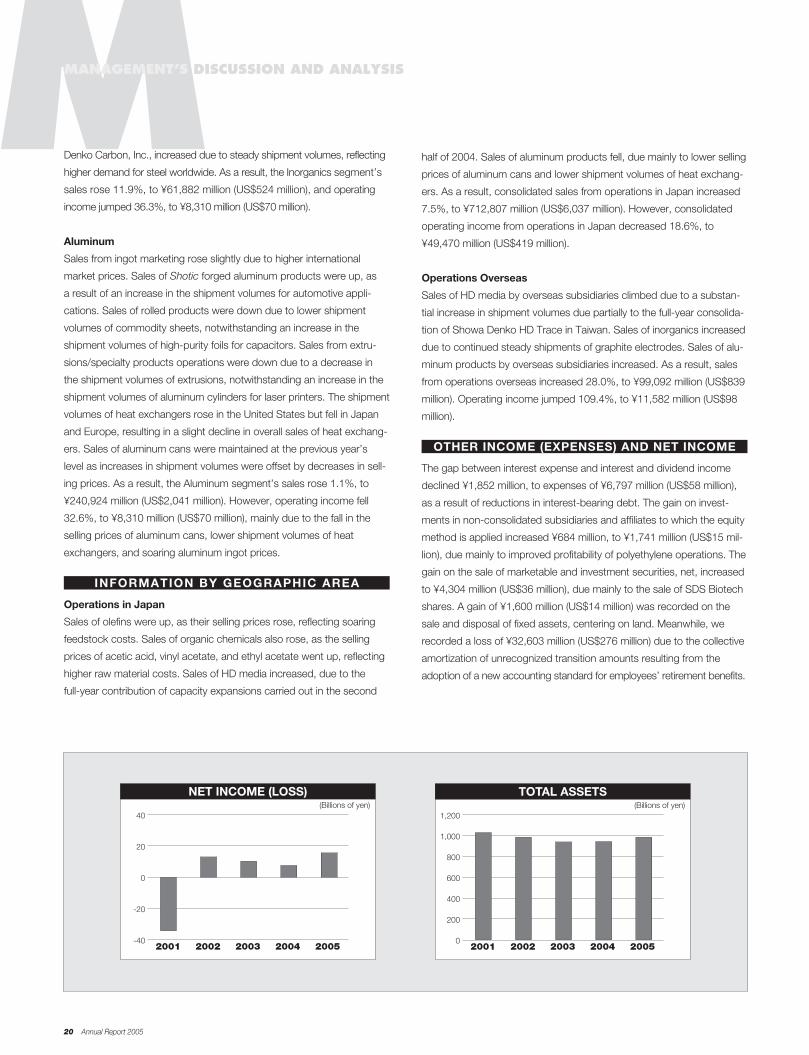
20 Annual Report 2005
MMANAGEMENT’S DISCUSSION AND ANALYSIS
Denko Carbon, Inc., increased due to steady shipment volumes, reflecting
higher demand for steel worldwide. As a result, the Inorganics segment’s
sales rose 11.9%, to ¥61,882 million (US$524 million), and operating
income jumped 36.3%, to ¥8,310 million (US$70 million).
Aluminum
Sales from ingot marketing rose slightly due to higher international
market prices. Sales of Shotic forged aluminum products were up, as
a result of an increase in the shipment volumes for automotive appli-
cations. Sales of rolled products were down due to lower shipment
volumes of commodity sheets, notwithstanding an increase in the
shipment volumes of high-purity foils for capacitors. Sales from extru-
sions/specialty products operations were down due to a decrease in
the shipment volumes of extrusions, notwithstanding an increase in the
shipment volumes of aluminum cylinders for laser printers. The shipment
volumes of heat exchangers rose in the United States but fell in Japan
and Europe, resulting in a slight decline in overall sales of heat exchang-
ers. Sales of aluminum cans were maintained at the previous year’s
level as increases in shipment volumes were offset by decreases in sell-
ing prices. As a result, the Aluminum segment’s sales rose 1.1%, to
¥240,924 million (US$2,041 million). However, operating income fell
32.6%, to ¥8,310 million (US$70 million), mainly due to the fall in the
selling prices of aluminum cans, lower shipment volumes of heat
exchangers, and soaring aluminum ingot prices.
Operations in Japan
Sales of olefins were up, as their selling prices rose, reflecting soaring
feedstock costs. Sales of organic chemicals also rose, as the selling
prices of acetic acid, vinyl acetate, and ethyl acetate went up, reflecting
higher raw material costs. Sales of HD media increased, due to the
full-year contribution of capacity expansions carried out in the second
INFORMATION BY GEOGRAPHIC AREA
half of 2004. Sales of aluminum products fell, due mainly to lower selling
prices of aluminum cans and lower shipment volumes of heat exchang-
ers. As a result, consolidated sales from operations in Japan increased
7.5%, to ¥712,807 million (US$6,037 million). However, consolidated
operating income from operations in Japan decreased 18.6%, to
¥49,470 million (US$419 million).
Operations Overseas
Sales of HD media by overseas subsidiaries climbed due to a substan-
tial increase in shipment volumes due partially to the full-year consolida-
tion of Showa Denko HD Trace in Taiwan. Sales of inorganics increased
due to continued steady shipments of graphite electrodes. Sales of alu-
minum products by overseas subsidiaries increased. As a result, sales
from operations overseas increased 28.0%, to ¥99,092 million (US$839
million). Operating income jumped 109.4%, to ¥11,582 million (US$98
million).
The gap between interest expense and interest and dividend income
declined ¥1,852 million, to expenses of ¥6,797 million (US$58 million),
as a result of reductions in interest-bearing debt. The gain on invest-
ments in non-consolidated subsidiaries and affiliates to which the equity
method is applied increased ¥684 million, to ¥1,741 million (US$15 mil-
lion), due mainly to improved profitability of polyethylene operations. The
gain on the sale of marketable and investment securities, net, increased
to ¥4,304 million (US$36 million), due mainly to the sale of SDS Biotech
shares. A gain of ¥1,600 million (US$14 million) was recorded on the
sale and disposal of fixed assets, centering on land. Meanwhile, we
recorded a loss of ¥32,603 million (US$276 million) due to the collective
amortization of unrecognized transition amounts resulting from the
adoption of a new accounting standard for employees’ retirement benefits.
OTHER INCOME (EXPENSES) AND NET INCOME
NET INCOME (LOSS)(Billions of yen)
2001 2002 2003 2004 2005-40
-20
0
20
40
TOTAL ASSETS(Billions of yen)
2001 2002 2003 2004 20050
200
400
600
800
1,000
1,200

Showa Denko K.K. 21
While we recorded a substantial loss in 2004 due to the early implemen-
tation of an accounting standard for the impairment of fixed assets, the
relevant figure for 2005 dropped to ¥1,163 million (US$10 million).
As a result, the Company posted pretax income of ¥17,766 million
(US$150 million), down ¥1,072 million from the previous year. After income
taxes, current, of ¥3,953 million (US$33 million), income taxes, deferred, of
minus ¥3,976 million (US$34 million), and minority interests of ¥2,142 mil-
lion (US$18 million), the Company recorded net income of ¥15,647 million
(US$133 million), an increase of 106.0%, over the previous year.
Total Assets
Total assets increased ¥42,325 million from the end of the previous
year, to ¥986,233 million (US$8,353 million). Cash and cash equivalents
increased ¥8,081 million, to ¥37,233 million (US$315 million). Notes and
accounts receivable increased ¥6,506 million, to ¥180,070 million
(US$1,525 million), due mainly to an increase in net sales. Inventories
rose ¥8,599 million, to ¥77,336 million (US$655 million), as the effect
of the rise in raw material costs more than offset inventory reduction
efforts. Tangible fixed assets fell ¥7,467 million, to ¥510,904 million
(US$4,327 million), due mainly to the sale of land, notwithstanding an
increase in capital investments. Total investments and other assets
increased ¥20,964 million, to ¥143,918 million (US$1,219 million). This
was due mainly to an increase of ¥17,713 million in investment securi-
ties that resulted from a rise in the appraised value at the year-end.
Liabilities
Interest-bearing debt fell ¥53,602 million, from the end of the previous
year, to ¥448,831 million (US$3,801 million), as a result of continued
debt reduction efforts and an increase in free cash flow. Meanwhile,
FINANCIAL POSITION
accrued pension and severance costs increased ¥33,738 million as a
result of the collective amortization of unrecognized transition amounts
resulting from the adoption of a new accounting method for employees’
retirement benefits. Total liabilities increased ¥9,384 million, to ¥730,444
million (US$6,187 million).
Stockholders’ Equity
Total stockholders’ equity increased ¥29,038 million, to ¥206,738 mil-
lion (US$1,751 million), mainly reflecting increases in retained earnings
and the securities valuation surplus.
Capital Expenditures
Capital expenditures increased ¥11,302 million, to ¥41,218 million
(US$349 million). Chief items were an expansion of the supply capaci-
ties of HD media, blue LEDs, and large-diameter graphite electrodes
as well as the construction of a new production facility for very-small-
diameter HD media.
Cash Flows
Net cash provided by operating activities increased ¥18,438 million,
to ¥77,966 million (US$660 million), due to a substantial increase in
operating income and an increase in trade payables. Net cash used in
investing activities increased ¥5,575 million, to ¥17,987 million (US$152
million), primarily due to an increase in capital expenditures. Net cash
used in financing activities increased ¥8,323 million, to ¥53,446 million
(US$453 million), mainly due to a reduction in interest-bearing debt.
As a result, cash and cash equivalents at the end of 2005 increased
¥8,080 million, to ¥37,233 million (US$315 million).
TOTAL STOCKHOLDERS’ EQUITY(Billions of yen)
2001 2002 2003 2004 20050
40
80
120
160
200
240
INTEREST-BEARING DEBT(Billions of yen)
0
300
400
500
600
700
2001 2002 2003 2004 2005
~~
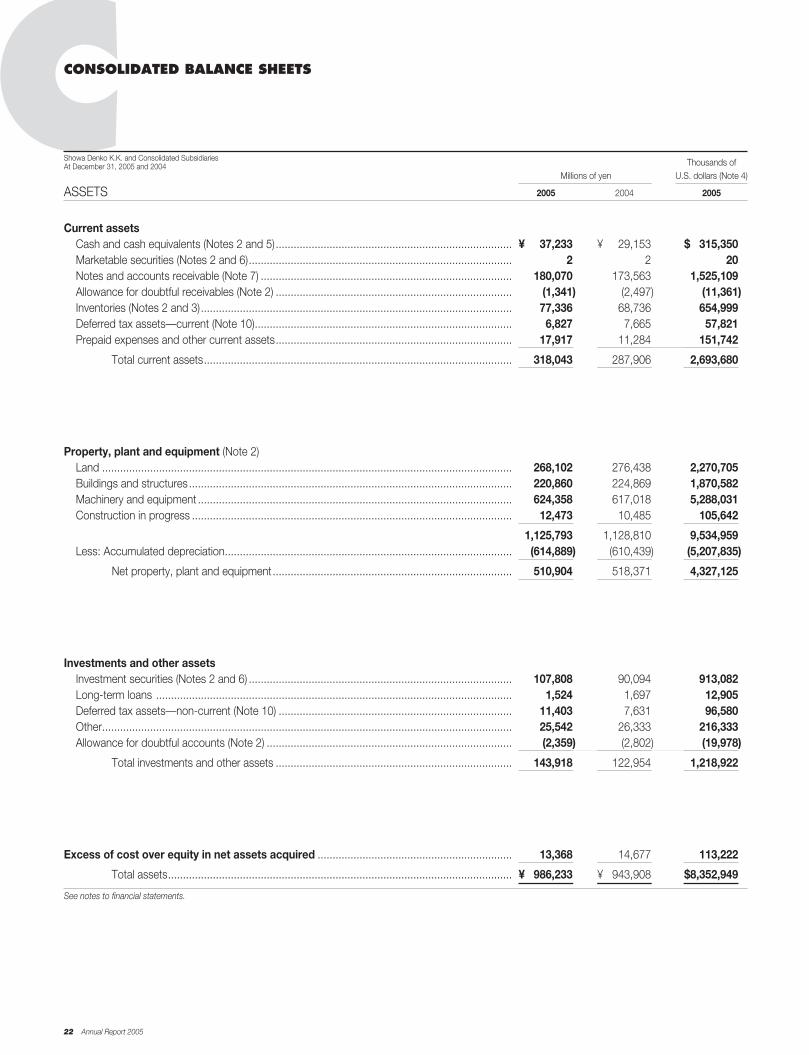
22 Annual Report 2005
CCONSOLIDATED BALANCE SHEETS
Thousands ofMillions of yen U.S. dollars (Note 4)
ASSETS 2005 2004 2005
Current assetsCash and cash equivalents (Notes 2 and 5)............................................................................... ¥0,037,233 ¥0,029,153 $0,315,350Marketable securities (Notes 2 and 6)........................................................................................ 2 2 20Notes and accounts receivable (Note 7) .................................................................................... 180,070 173,563 1,525,109Allowance for doubtful receivables (Note 2) ............................................................................... (1,341) (2,497) (11,361)Inventories (Notes 2 and 3)........................................................................................................ 77,336 68,736 654,999Deferred tax assets—current (Note 10)...................................................................................... 6,827 7,665 57,821Prepaid expenses and other current assets............................................................................... 17,917 11,284 151,742
Total current assets....................................................................................................... 318,043 287,906 2,693,680
Property, plant and equipment (Note 2)Land ......................................................................................................................................... 268,102 276,438 2,270,705Buildings and structures............................................................................................................ 220,860 224,869 1,870,582Machinery and equipment ......................................................................................................... 624,358 617,018 5,288,031Construction in progress ........................................................................................................... 12,473 10,485 105,642
..................................................................................................................................................... 1,125,793 1,128,810 9,534,959Less: Accumulated depreciation................................................................................................ (614,889) (610,439) (5,207,835)
Net property, plant and equipment................................................................................ 510,904 518,371 4,327,125
Investments and other assetsInvestment securities (Notes 2 and 6) ........................................................................................ 107,808 90,094 913,082Long-term loans ....................................................................................................................... 1,524 1,697 12,905Deferred tax assets—non-current (Note 10) .............................................................................. 11,403 7,631 96,580Other......................................................................................................................................... 25,542 26,333 216,333Allowance for doubtful accounts (Note 2) .................................................................................. (2,359) (2,802) (19,978)
Total investments and other assets ............................................................................... 143,918 122,954 1,218,922
Excess of cost over equity in net assets acquired ................................................................. 13,368 14,677 113,222
Total assets................................................................................................................... ¥0,986,233 ¥0,943,908 $8,352,949
See notes to financial statements.
Showa Denko K.K. and Consolidated SubsidiariesAt December 31, 2005 and 2004

Showa Denko K.K. 23
Thousands ofMillions of yen U.S. dollars (Note 4)
LIABILITIES AND STOCKHOLDERS’ EQUITY 2005 2004 2005
Current liabilitiesShort-term debt (Note 8)................................................................................................................. ¥097,773 ¥100,471 $0,828,089Current portion of long-term debt (Note 8) ...................................................................................... 108,390 133,698 918,011Notes and accounts payable (Note 7) ............................................................................................. 148,644 131,158 1,258,948Accrued liabilities
Income taxes.............................................................................................................................. 1,528 2,014 12,939Other .......................................................................................................................................... 5,798 5,609 49,104
Reserve for restructuring expenses (Note 2).................................................................................... 918 5,569 7,772Reserve for periodic repairs (Note 2) ............................................................................................... 2,740 106 23,205Other current liabilities .................................................................................................................... 25,595 23,485 216,782
Total current liabilities ......................................................................................................... 391,384 402,109 3,314,851
Long-term liabilitiesLong-term debt less current portion (Note 8) .................................................................................. 242,668 268,264 2,055,293Deferred tax liabilities—non-current (Note 10) ................................................................................. 7,394 6,224 62,627Accrued pension and severance costs (Notes 2, 3 and 9)............................................................... 42,617 8,879 360,949Reserve for directors’ retirement allowance (Note 2) ....................................................................... 365 1,332 3,091Reserve for periodic repairs (Note 2) ............................................................................................... 30 924 254Deferred tax liabilities due to land revaluation.................................................................................. 29,082 22,864 246,308Other long-term liabilities ................................................................................................................ 16,903 10,463 143,161
Total long-term liabilities ..................................................................................................... 339,059 318,951 2,871,682
Minority interests............................................................................................................................. 49,050 45,147 415,435
Contingent liabilities (Note 12)
Stockholders’ equityCommon stock
Authorized, 3,300,000,000 sharesIssued, 2005 and 2004—1,142,832,934 shares......................................................................... 110,451 110,451 935,474
Capital surplus................................................................................................................................ 11,090 11,089 93,931Retained earnings........................................................................................................................... 21,868 18,316 185,213Revaluation reserve (Note 13) ......................................................................................................... 42,339 33,280 358,592Securities valuation surplus............................................................................................................. 19,485 7,842 165,032Foreign currency translation adjustments (Note 2)........................................................................... 1,600 (3,213) 13,553Less: Treasury stock at cost, 2005—408,465 shares ..................................................................... (96) — (815)Less: Treasury stock at cost, 2004—255,396 shares ..................................................................... — (64) —
Total stockholders’ equity................................................................................................... 206,738 177,701 1,750,980
Total liabilities and stockholders’ equity .............................................................................. ¥986,233 ¥943,908 $8,352,949
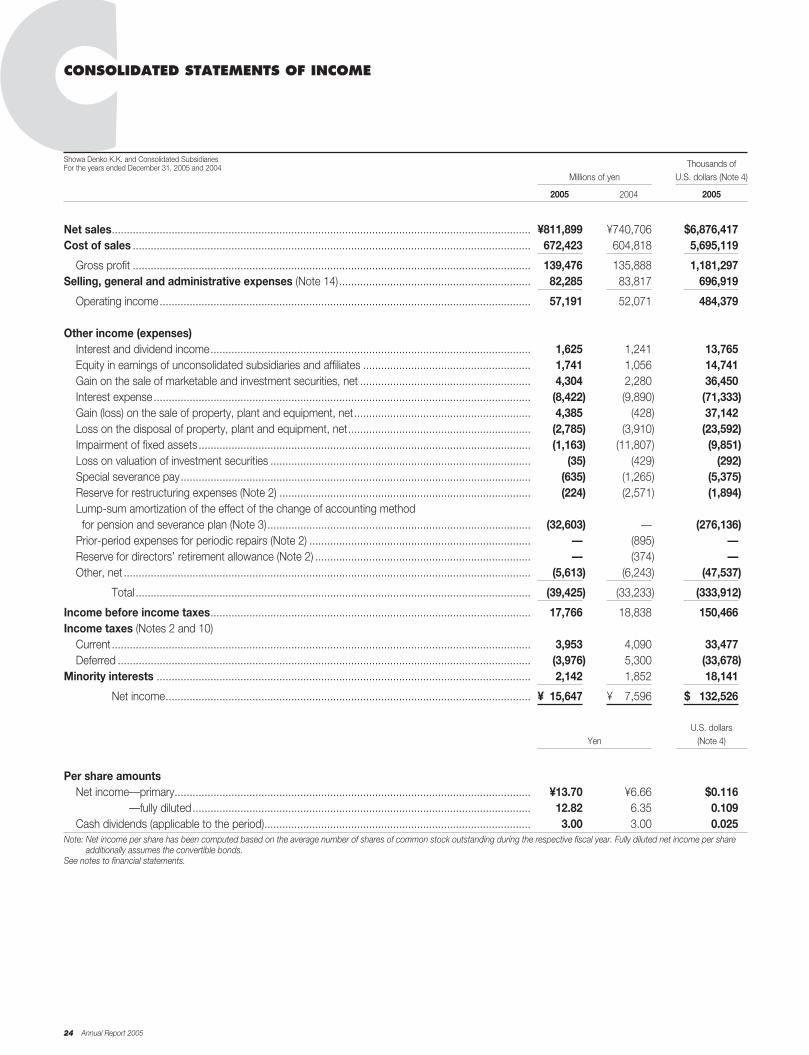
C
24 Annual Report 2005
CCONSOLIDATED STATEMENTS OF INCOME
Thousands ofMillions of yen U.S. dollars (Note 4)
2005 2004 2005
Net sales............................................................................................................................................ ¥811,899 ¥740,706 $6,876,417Cost of sales ..................................................................................................................................... 672,423 604,818 5,695,119
Gross profit ..................................................................................................................................... 139,476 135,888 1,181,297Selling, general and administrative expenses (Note 14) ................................................................ 82,285 83,817 696,919
Operating income............................................................................................................................ 57,191 52,071 484,379
Other income (expenses)Interest and dividend income........................................................................................................... 1,625 1,241 13,765Equity in earnings of unconsolidated subsidiaries and affiliates ........................................................ 1,741 1,056 14,741Gain on the sale of marketable and investment securities, net ......................................................... 4,304 2,280 36,450Interest expense .............................................................................................................................. (8,422) (9,890) (71,333)Gain (loss) on the sale of property, plant and equipment, net........................................................... 4,385 (428) 37,142Loss on the disposal of property, plant and equipment, net............................................................. (2,785) (3,910) (23,592)Impairment of fixed assets ............................................................................................................... (1,163) (11,807) (9,851)Loss on valuation of investment securities ....................................................................................... (35) (429) (292)Special severance pay..................................................................................................................... (635) (1,265) (5,375)Reserve for restructuring expenses (Note 2) .................................................................................... (224) (2,571) (1,894)Lump-sum amortization of the effect of the change of accounting method for pension and severance plan (Note 3)........................................................................................ (32,603) — (276,136)
Prior-period expenses for periodic repairs (Note 2) .......................................................................... — (895) —Reserve for directors’ retirement allowance (Note 2) ........................................................................ — (374) —Other, net ........................................................................................................................................ (5,613) (6,243) (47,537)
Total .................................................................................................................................... (39,425) (33,233) (333,912)
Income before income taxes........................................................................................................... 17,766 18,838 150,466Income taxes (Notes 2 and 10)
Current ............................................................................................................................................ 3,953 4,090 33,477Deferred .......................................................................................................................................... (3,976) 5,300 (33,678)
Minority interests ............................................................................................................................. 2,142 1,852 18,141
Net income.......................................................................................................................... ¥015,647 ¥007,596 $0,132,526
U.S. dollarsYen (Note 4)
Per share amountsNet income—primary....................................................................................................................... ¥13.70 ¥6.66 $0.116
—fully diluted................................................................................................................. 12.82 6.35 0.109Cash dividends (applicable to the period)......................................................................................... 3.00 3.00 0.025
Note: Net income per share has been computed based on the average number of shares of common stock outstanding during the respective fiscal year. Fully diluted net income per shareadditionally assumes the convertible bonds.
See notes to financial statements.
Showa Denko K.K. and Consolidated SubsidiariesFor the years ended December 31, 2005 and 2004
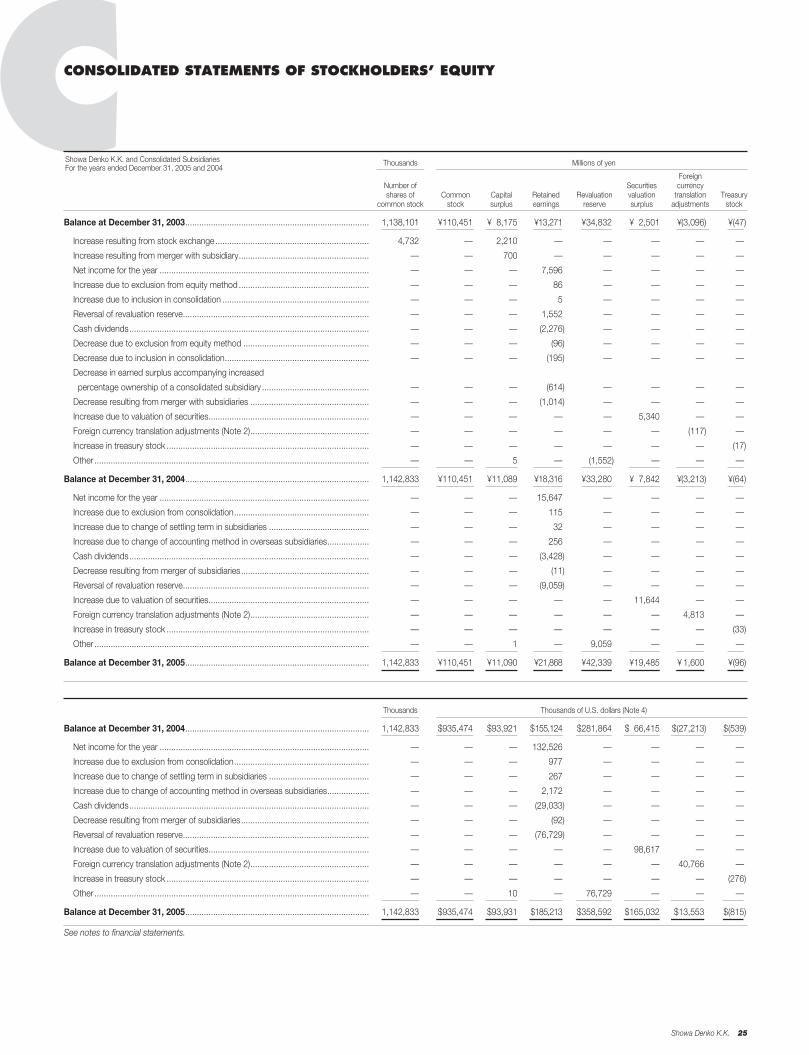
CONSOLIDATED STATEMENTS OF STOCKHOLDERS’ EQUITYC
Showa Denko K.K. 25
Thousands Millions of yen
ForeignNumber of Securities currencyshares of Common Capital Retained Revaluation valuation translation Treasury
common stock stock surplus earnings reserve surplus adjustments stock
Balance at December 31, 2003............................................................................... 1,138,101 ¥110,451 ¥08,175 ¥13,271 ¥34,832 ¥ 2,501 ¥(3,096) ¥(47)
Increase resulting from stock exchange .................................................................. 4,732 — 2,210 — — — — —
Increase resulting from merger with subsidiary........................................................ — — 700 — — — — —
Net income for the year .......................................................................................... — — — 7,596 — — — —
Increase due to exclusion from equity method ........................................................ — — — 86 — — — —
Increase due to inclusion in consolidation ............................................................... — — — 5 — — — —
Reversal of revaluation reserve................................................................................ — — — 1,552 — — — —
Cash dividends....................................................................................................... — — — (2,276) — — — —
Decrease due to exclusion from equity method ...................................................... — — — (96) — — — —
Decrease due to inclusion in consolidation.............................................................. — — — (195) — — — —
Decrease in earned surplus accompanying increased
percentage ownership of a consolidated subsidiary .............................................. — — — (614) — — — —
Decrease resulting from merger with subsidiaries ................................................... — — — (1,014) — — — —
Increase due to valuation of securities..................................................................... — — — — — 5,340 — —
Foreign currency translation adjustments (Note 2)................................................... — — — — — — (117) —
Increase in treasury stock ....................................................................................... — — — — — — — (17)
Other ...................................................................................................................... — — 5 — (1,552) — — —
Balance at December 31, 2004............................................................................... 1,142,833 ¥110,451 ¥11,089 ¥18,316 ¥33,280 ¥ 7,842 ¥(3,213) ¥(64)
Net income for the year .......................................................................................... — — — 15,647 — — — —
Increase due to exclusion from consolidation.......................................................... — — — 115 — — — —
Increase due to change of settling term in subsidiaries ........................................... — — — 32 — — — —
Increase due to change of accounting method in overseas subsidiaries.................. — — — 256 — — — —
Cash dividends....................................................................................................... — — — (3,428) — — — —
Decrease resulting from merger of subsidiaries....................................................... — — — (11) — — — —
Reversal of revaluation reserve................................................................................ — — — (9,059) — — — —
Increase due to valuation of securities..................................................................... — — — — — 11,644 — —
Foreign currency translation adjustments (Note 2)................................................... — — — — — — 4,813 —
Increase in treasury stock ....................................................................................... — — — — — — — (33)
Other ...................................................................................................................... — — 1 — 9,059) — — —
Balance at December 31, 2005............................................................................... 1,142,833 ¥110,451 ¥11,090 ¥21,868 ¥42,339 ¥19,485 ¥ 1,600 ¥(96)
Thousands Thousands of U.S. dollars (Note 4)
Balance at December 31, 2004............................................................................... 1,142,833 $935,474 $93,921 $155,124 $281,864 $ 66,415 $(27,213) $(539)
Net income for the year .......................................................................................... — — — 132,526 — — — —
Increase due to exclusion from consolidation.......................................................... — — — 977 — — — —
Increase due to change of settling term in subsidiaries ........................................... — — — 267 — — — —
Increase due to change of accounting method in overseas subsidiaries.................. — — — 2,172 — — — —
Cash dividends....................................................................................................... — — — (29,033) — — — —
Decrease resulting from merger of subsidiaries....................................................... — — — (92) — — — —
Reversal of revaluation reserve................................................................................ — — — (76,729) — — — —
Increase due to valuation of securities..................................................................... — — — — — 98,617 — —
Foreign currency translation adjustments (Note 2)................................................... — — — — — — 40,766 —
Increase in treasury stock ....................................................................................... — — — — — — — (276)
Other ...................................................................................................................... — — 10 — 76,729 — — —
Balance at December 31, 2005............................................................................... 1,142,833 $935,474 $93,931 $185,213 $358,592 $165,032 $13,553 $(815)
See notes to financial statements.
Showa Denko K.K. and Consolidated SubsidiariesFor the years ended December 31, 2005 and 2004
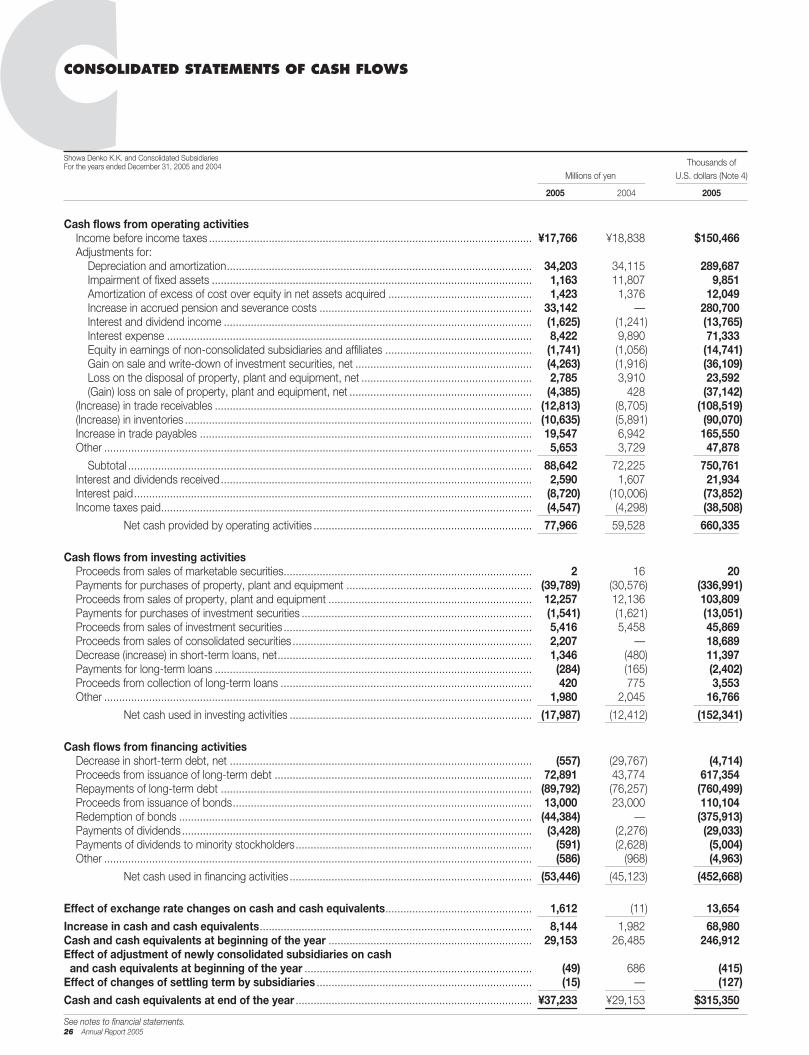
26 Annual Report 2005
CCONSOLIDATED STATEMENTS OF CASH FLOWS NThousands of
Millions of yen U.S. dollars (Note 4)
2005 2004 2005
Cash flows from operating activitiesIncome before income taxes ............................................................................................................ ¥17,766 ¥18,838 $150,466Adjustments for:
Depreciation and amortization...................................................................................................... 34,203 34,115 289,687Impairment of fixed assets ........................................................................................................... 1,163 11,807 9,851Amortization of excess of cost over equity in net assets acquired ................................................ 1,423 1,376 12,049Increase in accrued pension and severance costs ....................................................................... 33,142 — 280,700Interest and dividend income ....................................................................................................... (1,625) (1,241) (13,765)Interest expense .......................................................................................................................... 8,422 9,890 71,333Equity in earnings of non-consolidated subsidiaries and affiliates ................................................. (1,741) (1,056) (14,741)Gain on sale and write-down of investment securities, net ........................................................... (4,263) (1,916) (36,109)Loss on the disposal of property, plant and equipment, net ......................................................... 2,785 3,910 23,592(Gain) loss on sale of property, plant and equipment, net ............................................................. (4,385) 428 (37,142)
(Increase) in trade receivables .......................................................................................................... (12,813) (8,705) (108,519)(Increase) in inventories .................................................................................................................... (10,635) (5,891) (90,070)Increase in trade payables ............................................................................................................... 19,547 6,942 165,550Other ............................................................................................................................................... 5,653 3,729 47,878
Subtotal ....................................................................................................................................... 88,642 72,225 750,761Interest and dividends received........................................................................................................ 2,590 1,607 21,934Interest paid..................................................................................................................................... (8,720) (10,006) (73,852)Income taxes paid............................................................................................................................ (4,547) (4,298) (38,508)
Net cash provided by operating activities ......................................................................... 77,966 59,528 660,335
Cash flows from investing activitiesProceeds from sales of marketable securities................................................................................... 2 16 20Payments for purchases of property, plant and equipment .............................................................. (39,789) (30,576) (336,991)Proceeds from sales of property, plant and equipment .................................................................... 12,257 12,136 103,809Payments for purchases of investment securities ............................................................................. (1,541) (1,621) (13,051)Proceeds from sales of investment securities ................................................................................... 5,416 5,458 45,869Proceeds from sales of consolidated securities ................................................................................ 2,207 — 18,689Decrease (increase) in short-term loans, net..................................................................................... 1,346 (480) 11,397Payments for long-term loans .......................................................................................................... (284) (165) (2,402)Proceeds from collection of long-term loans .................................................................................... 420 775 3,553Other ............................................................................................................................................... 1,980 2,045 16,766
Net cash used in investing activities ................................................................................. (17,987) (12,412) (152,341)
Cash flows from financing activitiesDecrease in short-term debt, net ..................................................................................................... (557) (29,767) (4,714)Proceeds from issuance of long-term debt ...................................................................................... 72,891 43,774 617,354Repayments of long-term debt ........................................................................................................ (89,792) (76,257) (760,499)Proceeds from issuance of bonds.................................................................................................... 13,000 23,000 110,104Redemption of bonds ...................................................................................................................... (44,384) — (375,913)Payments of dividends..................................................................................................................... (3,428) (2,276) (29,033)Payments of dividends to minority stockholders............................................................................... (591) (2,628) (5,004)Other ............................................................................................................................................... (586) (968) (4,963)
Net cash used in financing activities ................................................................................. (53,446) (45,123) (452,668)
Effect of exchange rate changes on cash and cash equivalents................................................. 1,612 (11) 13,654
Increase in cash and cash equivalents........................................................................................... 8,144 1,982 68,980Cash and cash equivalents at beginning of the year .................................................................... 29,153 26,485 246,912Effect of adjustment of newly consolidated subsidiaries on cash and cash equivalents at beginning of the year ............................................................................ (49) 686 (415)
Effect of changes of settling term by subsidiaries ........................................................................ (15) — (127)
Cash and cash equivalents at end of the year ............................................................................... ¥37,233 ¥29,153 $315,350
See notes to financial statements.
Showa Denko K.K. and Consolidated SubsidiariesFor the years ended December 31, 2005 and 2004
Showa Denko K.K. 27
Showa Denko K.K. and Consolidated Subsidiaries
1. BASIS OF REPORTING FINANCIAL STATEMENTSThe accompanying consolidated financial statements have beenprepared in accordance with accounting principles and practicesgenerally accepted in Japan, which are different in certain respectsas to application and disclosure requirements of InternationalFinancial Reporting Standards, and from the consolidated financialstatements which had been or will be filed with the Kanto Local FinanceBureau as required by the Securities and Exchange Law of Japan.
2. SUMMARY OF SIGNIFICANT ACCOUNTING POLICIES
(a) Principles of ConsolidationThe consolidated financial statements for the years ended December31, 2005 and 2004 include the accounts of the Company and its 42and 47 significant subsidiaries (collectively “the Companies”).
For the purposes of the consolidated financial statements, all sig-nificant intercompany transactions, account balances and unrealizedprofits among the Companies are entirely eliminated and the portionsattributable to minority interests are credited or charged to income.
Accounts of subsidiaries whose business year-ends differ by morethan three months from December 31 have been included usingappropriate interim financial information.
The excess of cost over equity in net assets is amortized on astraight-line basis within a period of 20 years.
(b) Investments in Non-Consolidated Subsidiaries and Affiliates The Company applies the equity method of accounting for invest-ments in 4 non-consolidated subsidiaries and 20 affiliates for the yearended December 31, 2005 and investments in 4 non-consolidatedsubsidiaries and 22 affiliates for the year ended December 31, 2004.
All underlying intercompany profits obtained from transactionsamong the Companies and non-consolidated subsidiaries and affili-ates to which the equity method is applied are eliminated in theconsolidated financial statements.
(c) Translation of Foreign Currency AccountsAll receivables and payables denominated in foreign currencies at thebalance sheet date are translated into Japanese yen at the currentexchange rates.
The resulting exchange gains or losses are credited or chargedto income.
The monetary amounts stated in the financial statements of certainconsolidated subsidiaries of foreign nationality are translated intoJapanese yen at the year-end rate for assets and liabilities, at histori-cal rates for other balance sheet accounts exclusive of net income,and at the average annual rate for revenue and expense accountsand net income.
Translation adjustments resulting from the process of translatingthe financial statements of foreign subsidiaries into Japanese yen areaccumulated and reported as a component of stockholders’ equityon the consolidated balance sheet.
(d) Cash and Cash EquivalentsCash and cash equivalents in the consolidated statement of cashflows are composed of cash on hand, bank deposits available forwithdrawal on demand and short-term investments with originalmaturities of three months or less and minor risk of value fluctuation.
(e) SecuritiesDebt securities that are intended to be held to maturity (“held-to-maturity debt securities”) are measured at amortized cost in thebalance sheet. Other securities with quoted market prices arestated at their market prices prevailing at the balance sheet date.
Other securities without quoted market prices are stated at costby the moving-average method.
(f) Allowance for Doubtful ReceivablesTo provide for losses from bad debts, the allowance is providedaccording to the actual rate of non-recovery for ordinary claims andin view of the probability of recovery for specific doubtful receivables.
(g) InventoriesFinished goods are stated principally at the lower of cost or market,using the gross-average cost method. Other inventories are statedprincipally at cost as determined by the gross-average method.
(h) Property, Plant and EquipmentProperty, plant and equipment is stated at cost, in principle. With theadoption of the fixed asset impairment accounting standard from2004, however, aggregated amounts of impairment losses arededucted directly from respective items. Depreciation of property,plant and equipment is stated at cost. Depreciation of property, plantand equipment is computed principally by the straight-line methodwith the exception that the declining-balance method is applied tocertain factories of the Company and some of the consolidated sub-sidiaries.
(i) Intangible AssetsThe Company and some of the consolidated subsidiaries principallyapply the straight-line method to amortize intangible assets.
( j ) Reserve for Restructuring ExpensesThe Company and some of the consolidated subsidiaries record thereserve for restructuring expenses on an accrual basis to providefor expenses and losses resulting from their restructuring programs.
(k) Accrued Pension and Severance CostsAccrued pension and severance costs are provided based onthe estimated retirement benefit obligation and the pension assets.The figure is based on the amount of severance benefit obligationsat the balance sheet date and the estimated amount of the pensionfund. Transition amounts resulting from the initial adoption of the newaccounting method for employees’ retirement benefits are lump-sumamortized in 2005 (before being amortized over 15 years), except fora certain consolidated subsidiary in which the amount is amortized over5 years.
Prior service costs are amortized on a straight-line basis over certainperiods (mainly 12 years) within the average remaining service periods.
Unrecognized actuarial loss is amortized starting the year aftersuch actuarial loss is determined on a straight-line basis over certainperiods (mainly 12 years) within the average remaining service peri-ods. However, a certain consolidated subsidiary recognized suchtotal actuarial loss as a one-time loss when determined.
NNOTES TO FINANCIAL STATEMENTS
28 Annual Report 2005
NNOTES TO FINANCIAL STATEMENTS
3. CHANGES IN ACCOUNTING POLICIES
(a) InventoriesIn order to ensure a sound financial structure, the Company and some of its consolidated subsidiaries state finished goods at the lower of cost ormarket using the gross-average cost method. Due to this change, the cost of sales increased by ¥409 million (US$3,463 thousand) from the num-ber calculated under the previous policy.
(b) Accrued Pension and Severance CostsThe Company and some of its consolidated subsidiaries lump-sum amortized the effect of the change in accounting method for the pension andseverance plan (before, they amortized this amount over 15 years). The loss is due to collective amortization of unrecognized transition amountsresulting from the adoption of the new accounting method for employees’ retirement benefits. Due to this change, the extraordinary loss increased by¥32,603 million (US$276,136 thousand) from the number calculated under the previous policy.
4. TRANSLATION INTO U.S. DOLLARSThe Companies’ accounting records are maintained in yen. The U.S. dollar amounts appearing in the accompanying financial statements and notesthereto represent the arithmetical results of translating yen into U.S. dollars at the rate of ¥118.07 to US$1.00, the approximate rate of exchange atDecember 31, 2005. The inclusion of such U.S. dollar amounts is solely for the convenience of readers; it does not carry with it any implication thatyen amounts have been or could be converted into U.S. dollars at that rate.
5. CASH AND CASH EQUIVALENTSCash as of December 31, 2005 and 2004 on the consolidated balance sheets and cash equivalents at December 31, 2005 and 2004 on the consoli-dated statements of cash flows are reconciled as follows:
Thousands ofMillions of yen U.S. dollars
2005 2004 2005
Cash ........................................................................................................................................................... ¥37,273 ¥29,627 $315,689Original maturities of more than three months.............................................................................................. (40) (474) (339)
Cash and cash equivalents.......................................................................................................................... ¥37,233 ¥29,153 $315,350
(l) Reserve for Directors’ Retirement AllowanceSome of the consolidated subsidiaries provide for the retirementallowance for directors and statutory auditors in an amount deter-mined by those companies’ internal guidelines.
The Company abolished the system on March 30, 2005, andreversed the reserve. The payment in arrears included “Other long-term liabilities” as long-term arrears.
(m) Reserve for Periodic RepairsThe Company provides a reserve for periodic repairs in an amountestimated by the maintenance schedule for production equipment.
(n) Income TaxesPeriodical allocation of corporate tax is being made, in principle,regarding taxes pertaining to all temporary differences (differencesbetween the assets/liabilities on the consolidated financial state-ments and the assets/liabilities in the calculation of taxable income).
(o) LeasesFinance leases other than those that are deemed to transfer the own-ership of the leased assets to the lessees are principally accounted forby the method that is applicable to ordinary operating leases.

6. SECURITIESThe tables that follow summarize acquisition costs and book values of marketable securities as of December 31, 2005 and 2004.
(a) Securities are judged to be “substantially declined” when their market values have declined 30% or more. When their market values have declined50% or more, the impairment losses are recorded on those securities. When their market values have declined between 30% and 50%, the impair-ment losses are recorded on those securities unless such values are considered to be recoverable individually. The following tables summarize bookvalues of marketable securities as of December 31, 2005 and 2004:Year ended December 31, 2005 Millions of yen
Acquisition Bookcosts value Difference
Securities whose book value exceeds their acquisition costEquity securities .............................................................................................................................................. ¥37,545 ¥72,123 ¥34,578
Other securitiesEquity securities .............................................................................................................................................. 819 742 (77)
Total ............................................................................................................................................................... ¥38,364 ¥72,865 ¥34,501
Year ended December 31, 2004 Millions of yen
Acquisition Bookcosts value Difference
Securities whose book value exceeds their acquisition costEquity securities .............................................................................................................................................. ¥21,375 ¥35,843 ¥14,468
Other securitiesEquity securities .............................................................................................................................................. 7,515 7,013 (502)
Total ............................................................................................................................................................... ¥28,890 ¥42,856 ¥13,966
Year ended December 31, 2005 Thousands of U.S. dollars
Acquisition Bookcosts value Difference
Securities whose book value exceeds their acquisition costEquity securities............................................................................................................................................ $317,989 $610,849 $292,860
Other securitiesEquity securities............................................................................................................................................ 6,937 6,284 (652)
Total ............................................................................................................................................................. $324,926 $617,134 $292,208
(b) The following tables summarize marketable securities sold in the years ended December 31, 2005 and 2004:Year ended December 31, 2005 Millions of yen
Sale Gross gain Gross loss
Equity securities ...................................................................................................................................................... ¥5,042 ¥1,455 ¥(92)
Year ended December 31, 2004 Millions of yen
Sale Gross gain Gross loss
Equity securities ...................................................................................................................................................... ¥4,987 ¥2,253 ¥(176)
Year ended December 31, 2005 Thousands of U.S. dollars
Sale Gross gain Gross loss
Equity securities ................................................................................................................................................... $42,703 $12,323 $(779)
Showa Denko K.K. 29

30 Annual Report 2005
(c) The following table summarizes book values of securities with no quoted market values as of December 31, 2005 and 2004:
Thousands ofMillions of yen U.S. dollars
2005 2004 2005
Held-to-maturity debt securitiesLocal bonds ............................................................................................................................................ ¥00,018 ¥00,021 $000,152Privately placed corporate bonds ............................................................................................................ 1,001 1,001 8,478
Available-for-sale securitiesNon-listed equity securities...................................................................................................................... 11,328 23,323 95,943Preferred securities.................................................................................................................................. 1,000 1,000 8,470Privately placed local bonds .................................................................................................................... — 115 —
Total ........................................................................................................................................................ ¥13,347 ¥25,460 $113,043
(d) The following tables summarize marketable securities with maturities and held-to-maturity debt securities at December 31, 2005 and 2004 (all securities have a maturity of 10 years or less):Year ended December 31, 2005 Millions of yen
Over 1 year but Over 5 years butWithin 1 year within 5 years within 10 years
Government bonds ...................................................................................................................... ¥2 ¥09 ¥0,007Corporate bonds ......................................................................................................................... — — 1,000
Total ........................................................................................................................................ ¥2 ¥09 ¥1,007
Year ended December 31, 2004 Millions of yen
Over 1 year but Over 5 years butWithin 1 year within 5 years within 10 years
Government bonds ...................................................................................................................... ¥2 ¥10 ¥0,009Corporate bonds ......................................................................................................................... — — 1,000
Total ........................................................................................................................................ ¥2 ¥10 ¥1,009
Year ended December 31, 2005 Thousands of U.S. dollars
Over 1 year but Over 5 years butWithin 1 year within 5 years within 10 years
Government bonds .................................................................................................................... $17 $76 $0,059Corporate bonds........................................................................................................................ — — 8,470
Total....................................................................................................................................... $17 $76 $8,529
7. EFFECT OF YEAR-END DATE ON FINANCIAL STATEMENTSThe year-end date of 2005, namely, December 31, 2005, was a bank holiday. Although notes receivable and payable on this date were accordinglysettled on January 4, 2006, the Companies accounted for those notes in their financial statements as if they had been settled on the earlier date.
Notes outstanding at December 31, 2005 and 2004 dealt with in the above-mentioned manner were as follows:
Thousands ofMillions of yen U.S. dollars
2005 2004 2005
Notes receivable................................................................................................................................................... ¥0,503 ¥1,392 $04,260Notes payable ...................................................................................................................................................... 1,225 2,370 10,375Trade notes discounted by banks......................................................................................................................... 472 519 3,998
NNOTES TO FINANCIAL STATEMENTS
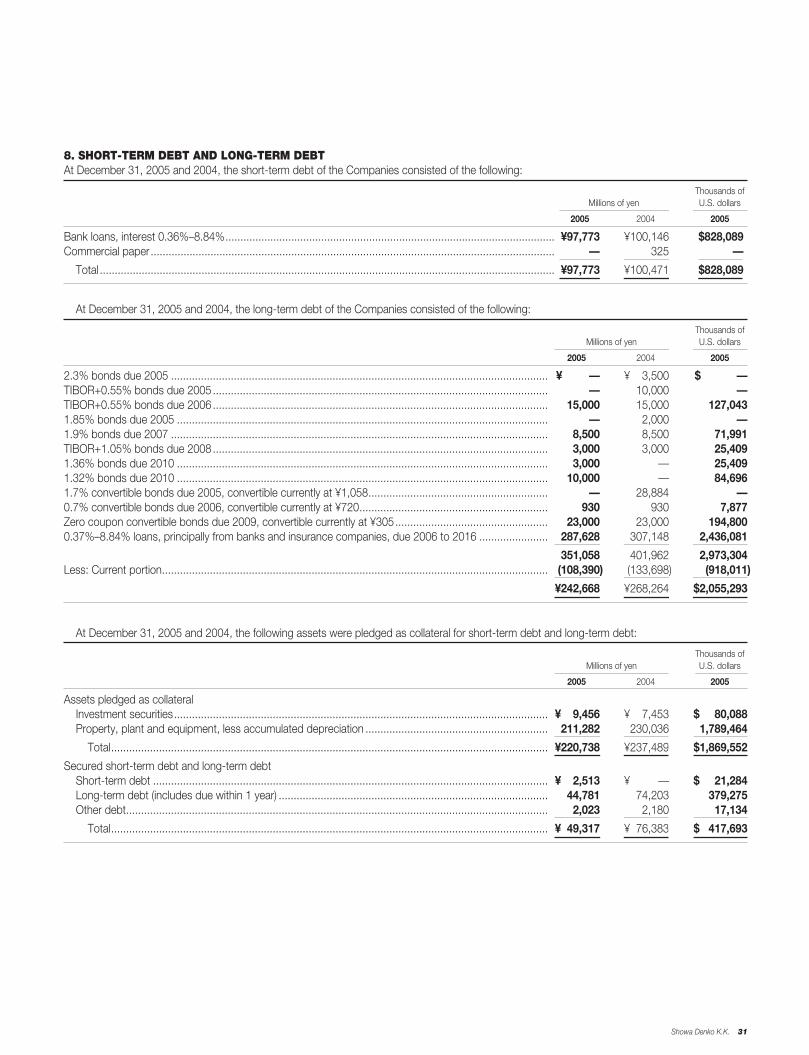
Showa Denko K.K. 31
8. SHORT-TERM DEBT AND LONG-TERM DEBTAt December 31, 2005 and 2004, the short-term debt of the Companies consisted of the following:
Thousands ofMillions of yen U.S. dollars
2005 2004 2005
Bank loans, interest 0.36%–8.84%.............................................................................................................. ¥97,773 ¥100,146 $828,089Commercial paper....................................................................................................................................... — 325 —
Total ........................................................................................................................................................ ¥97,773 ¥100,471 $828,089
At December 31, 2005 and 2004, the long-term debt of the Companies consisted of the following:
Thousands ofMillions of yen U.S. dollars
2005 2004 2005
2.3% bonds due 2005 .............................................................................................................................. ¥ — ¥003,500 $ —TIBOR+0.55% bonds due 2005 ................................................................................................................ — 10,000 —TIBOR+0.55% bonds due 2006 ................................................................................................................ 15,000 15,000 127,0431.85% bonds due 2005 ............................................................................................................................ — 2,000 —1.9% bonds due 2007 .............................................................................................................................. 8,500 8,500 71,991TIBOR+1.05% bonds due 2008 ................................................................................................................ 3,000 3,000 25,4091.36% bonds due 2010 ............................................................................................................................ 3,000 — 25,4091.32% bonds due 2010 ............................................................................................................................ 10,000 — 84,6961.7% convertible bonds due 2005, convertible currently at ¥1,058............................................................ — 28,884 —0.7% convertible bonds due 2006, convertible currently at ¥720............................................................... 930 930 7,877Zero coupon convertible bonds due 2009, convertible currently at ¥305................................................... 23,000 23,000 194,8000.37%–8.84% loans, principally from banks and insurance companies, due 2006 to 2016 ....................... 287,628 307,148 2,436,081
................................................................................................................................................................ 351,058 401,962 2,973,304Less: Current portion................................................................................................................................. (108,390) (133,698) (918,011)
................................................................................................................................................................. ¥242,668 ¥268,264 $2,055,293
At December 31, 2005 and 2004, the following assets were pledged as collateral for short-term debt and long-term debt:
Thousands ofMillions of yen U.S. dollars
2005 2004 2005
Assets pledged as collateralInvestment securities............................................................................................................................. ¥009,456 ¥007,453 $0,080,088Property, plant and equipment, less accumulated depreciation ............................................................. 211,282 230,036 1,789,464
Total.................................................................................................................................................. ¥220,738 ¥237,489 $1,869,552
Secured short-term debt and long-term debtShort-term debt .................................................................................................................................... ¥002,513 ¥ — $0,021,284Long-term debt (includes due within 1 year) .......................................................................................... 44,781 74,203 379,275Other debt............................................................................................................................................. 2,023 2,180 17,134
Total.................................................................................................................................................. ¥049,317 ¥076,383 $0,417,693
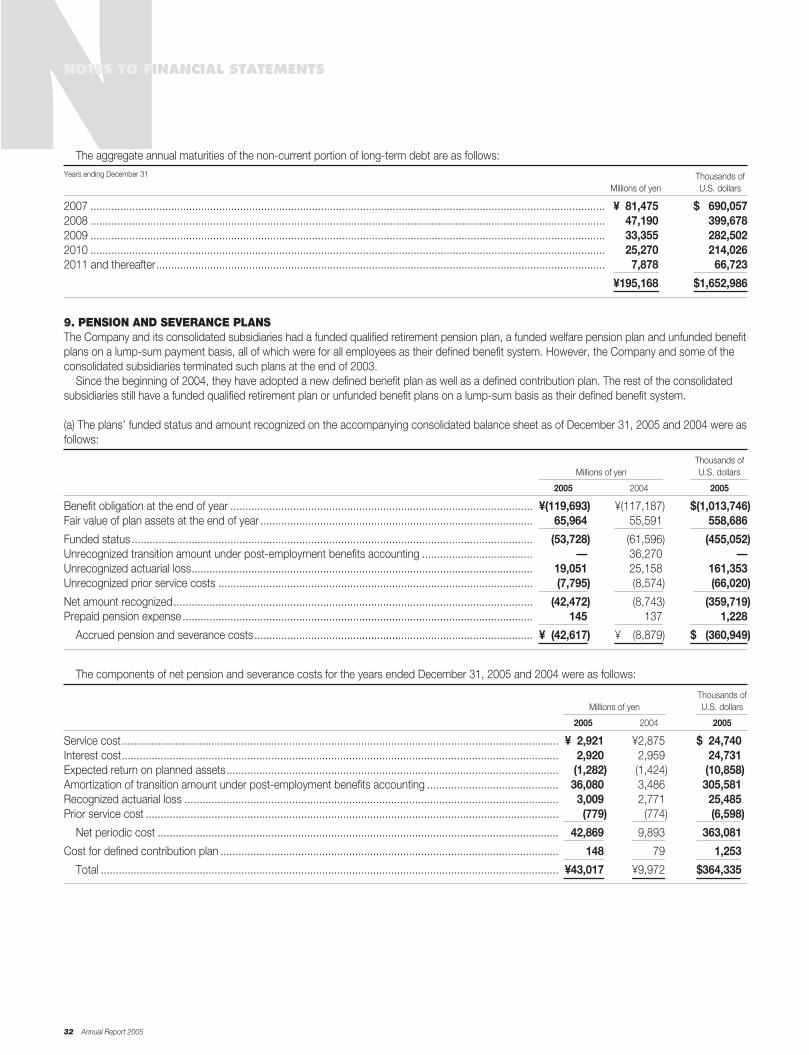
The aggregate annual maturities of the non-current portion of long-term debt are as follows:Years ending December 31 Thousands of
Millions of yen U.S. dollars
2007 ............................................................................................................................................................................ ¥081,475 $0,690,0572008 ............................................................................................................................................................................ 47,190 399,6782009 ............................................................................................................................................................................ 33,355 282,5022010 ............................................................................................................................................................................ 25,270 214,0262011 and thereafter...................................................................................................................................................... 7,878 66,723
.................................................................................................................................................................................... ¥195,168 $1,652,986
9. PENSION AND SEVERANCE PLANSThe Company and its consolidated subsidiaries had a funded qualified retirement pension plan, a funded welfare pension plan and unfunded benefitplans on a lump-sum payment basis, all of which were for all employees as their defined benefit system. However, the Company and some of theconsolidated subsidiaries terminated such plans at the end of 2003.
Since the beginning of 2004, they have adopted a new defined benefit plan as well as a defined contribution plan. The rest of the consolidatedsubsidiaries still have a funded qualified retirement plan or unfunded benefit plans on a lump-sum basis as their defined benefit system.
(a) The plans’ funded status and amount recognized on the accompanying consolidated balance sheet as of December 31, 2005 and 2004 were asfollows:
Thousands ofMillions of yen U.S. dollars
2005 2004 2005
Benefit obligation at the end of year ..................................................................................................... ¥(119,693) ¥(117,187) $(1,013,746)Fair value of plan assets at the end of year ........................................................................................... 65,964 55,591 558,686
Funded status ...................................................................................................................................... (53,728) (61,596) (455,052)Unrecognized transition amount under post-employment benefits accounting ..................................... — 36,270 —Unrecognized actuarial loss.................................................................................................................. 19,051 25,158 161,353Unrecognized prior service costs ......................................................................................................... (7,795) (8,574) (66,020)
Net amount recognized........................................................................................................................ (42,472) (8,743) (359,719)Prepaid pension expense ..................................................................................................................... 145 137 1,228
Accrued pension and severance costs............................................................................................. ¥0(42,617) ¥00(8,879) $0,(360,949)
The components of net pension and severance costs for the years ended December 31, 2005 and 2004 were as follows:
Thousands ofMillions of yen U.S. dollars
2005 2004 2005
Service cost.................................................................................................................................................. ¥02,921 ¥2,875 $024,740Interest cost.................................................................................................................................................. 2,920 2,959 24,731Expected return on planned assets............................................................................................................... (1,282) (1,424) (10,858)Amortization of transition amount under post-employment benefits accounting ............................................ 36,080 3,486 305,581Recognized actuarial loss ............................................................................................................................. 3,009 2,771 25,485Prior service cost .......................................................................................................................................... (779) (774) (6,598)
Net periodic cost ...................................................................................................................................... 42,869 9,893 363,081
Cost for defined contribution plan ................................................................................................................. 148 79 1,253
Total ......................................................................................................................................................... ¥43,017 ¥9,972 $364,335
32 Annual Report 2005
NNOTES TO FINANCIAL STATEMENTS

Showa Denko K.K. 33
The assumptions and basis as of December 31, 2005 and 2004 were as follows:Year ended December 31, 2001 2005 2004
Discount rate .................................................................................................................................... Mainly 2.0% Mainly 2.5%Expected return rate on planned assets............................................................................................ Mainly 2.5% Mainly 3.0%Amortization period for actuarial loss................................................................................................. Mainly 12 years Mainly 12 yearsAmortization period for unrecognized transition amount under post-employment benefits accounting ............................................................................................ Lump-sum amortized Mainly 15 years
Amortization period for prior service cost .......................................................................................... Mainly 12 years Mainly 12 years
10. INCOME TAXESAt December 31, 2005 and 2004, significant components of deferred tax assets and liabilities were as follows:
Thousands ofMillions of yen U.S. dollars
2005 2004 2005
Deferred tax assetsTax loss carryforwards............................................................................................................................. ¥12,802 ¥14,271 $108,427Write-down of marketable and investment securities ............................................................................... 7,270 7,659 61,574Reserve for restructuring expenses.......................................................................................................... 375 2,662 3,176Unrealized earnings from the sale of fixed assets ..................................................................................... 1,341 1,397 11,358Accrued pension and severance costs .................................................................................................... 17,163 3,308 145,363Reserve for bonus payment..................................................................................................................... 765 837 6,479Reserve for directors’ retirement allowance ............................................................................................. — 538 —Unpaid for directors’ retirement allowance............................................................................................... 430 — 3,642Impairment of fixed assets ....................................................................................................................... 2,496 3,876 21,140Reserve for periodic repairs ..................................................................................................................... 1,123 419 9,511Non-deductible expenses:
Allowance for doubtful accounts.......................................................................................................... 618 1,427 5,234Depreciation ........................................................................................................................................ 361 484 3,058
Write-down of inventories ........................................................................................................................ 379 — 3,210Other....................................................................................................................................................... 2,090 2,098 17,701Subtotal of deferred tax assets ................................................................................................................ 47,213 38,976 399,873Valuation allowance ................................................................................................................................. (11,830) (15,157) (100,195)
Total deferred tax assets ..................................................................................................................... 35,382 23,819 299,670
Deferred tax liabilitiesAmount of revaluation from the book value.............................................................................................. (5,027) (5,022) (42,576)Special depreciation reserve.................................................................................................................... (2,959) (1,778) (25,061)Securities valuation surplus...................................................................................................................... (13,875) (5,603) (117,515)Other....................................................................................................................................................... (2,818) (2,345) (23,867)
Total deferred tax liabilities................................................................................................................... (24,679) (14,748) (209,020)
Net deferred tax assets ............................................................................................................................... ¥10,704 ¥09,072 $090,658
The net deferred tax assets at December 31, 2005 and 2004 are included in the consolidated balance sheets as follows:
Thousands ofMillions of yen U.S. dollars
2005 2004 2005
Deferred tax assets—current ....................................................................................................................... ¥06,827 ¥7,665 $57,821Deferred tax assets—non-current................................................................................................................ 11,403 7,631 96,580Other current liabilities ................................................................................................................................. (132) — (1,118)Deferred tax liabilities—non-current ............................................................................................................. (7,394) (6,224) (62,627)

11. INFORMATION FOR CERTAIN LEASESAt December 31, 2005 and 2004, assets leased under non-capitalized financial leases were as follows:
Thousands ofMillions of yen U.S. dollars
2005 2004 2005
Machinery and equipment ........................................................................................................................... ¥22,828 ¥25,162 $193,346Other........................................................................................................................................................... 588 483 4,981Less: Accumulated depreciation and amortization ....................................................................................... 8,750 9,608 74,108
Total ........................................................................................................................................................ ¥14,667 ¥16,037 $124,219
At December 31, 2005 and 2004, future minimum lease payments for the remaining lease periods were as follows:
Thousands ofMillions of yen U.S. dollars
2005 2004 2005
Due within one year ..................................................................................................................................... ¥02,860 ¥02,969 $024,226Due over one year ....................................................................................................................................... 11,806 13,068 99,993
Total ........................................................................................................................................................ ¥14,667 ¥16,037 $124,219
At December 31, 2005 and 2004, paid lease fees and equivalent depreciation expense amounts were as follows:
Thousands ofMillions of yen U.S. dollars
2005 2004 2005
Paid lease fees.................................................................................................................................................. ¥3,436 ¥2,913 $29,101Equivalent depreciation expense amounts ........................................................................................................ 3,436 2,913 29,101Note: Equivalent depreciation expense amounts are calculated using the straight-line method, with the lease period as the useful life and zero (0) as the residual value.
At December 31, 2005 and 2004, assets leased under non-capitalized operating leases were as follows:
Future minimum lease payments for the remaining lease periods:
Thousands ofMillions of yen U.S. dollars
2005 2004 2005
Due within one year .......................................................................................................................................... ¥2,508 ¥1,687 $21,242Due over one year............................................................................................................................................. 4,138 2,067 35,047
Total ............................................................................................................................................................. ¥6,646 ¥3,754 $56,289
12. CONTINGENT LIABILITIESAt December 31, 2005, the Companies were contingently liable for outstanding trade notes discounted by banks in the ordinary course of businessin an aggregate amount of ¥848 million (US$7,182 thousand).
They were also guarantors for the borrowing below. The guarantees were principally for non-consolidated subsidiaries, affiliates and others.
Thousands ofMillions of yen U.S. dollars
2005 2004 2005
Guarantee ................................................................................................................................................... ¥16,266 ¥16,454 $137,766
As the amounts include joint and several guarantors’ portions as well as the Companies’, actual amounts we were contingently liable to pay weresmaller than the above.
34 Annual Report 2005
NNOTES TO FINANCIAL STATEMENTS

Showa Denko K.K. 35
13. REVALUATION RESERVEThe Company and some of its consolidated subsidiaries revalued the land they own for business in accordance with the Law Concerning Revaluationof Land. The difference between the revalued amount and the book value, after the deduction of applicable tax, is stated as a revaluation reserve.The revaluation was conducted using methods stipulated in the ordinance for enforcement of the law, specifically, the method in Item 4 of Article 2(Reasonable Adjustment of the Appraised Value Relating to Land Price Tax), and the method in Item 5 of Article 2 (Estimation by Experts). The differ-ence between the market value on the revaluated land as of December 31, 2005 was ¥54,144 million (US$458,575 thousand).
14. SELLING, GENERAL AND ADMINISTRATIVE EXPENSESSelling, general and administrative expenses for the years ended December 31, 2005 and 2004 were summarized as follows:
Thousands ofMillions of yen U.S. dollars
2005 2004 2005
Freight ......................................................................................................................................................... ¥17,564 ¥17,863 $148,761Employees’ compensation .......................................................................................................................... 18,948 19,094 160,483Other........................................................................................................................................................... 45,773 41,209 387,675
Total ........................................................................................................................................................ ¥82,285 ¥83,817 $696,919
Research and development expenses included in this summary for the years ended December 31, 2005 and 2004 were ¥16,223 million(US$137,402 thousand) and ¥16,559 million, respectively.
15. RESEARCH AND DEVELOPMENTResearch and development costs included in the cost of sales and selling, general and administrative expenses for the years ended December 31,2005 and 2004 were ¥17,384 million (US$147,235 thousand) and ¥17,576 million, respectively.
16. DERIVATIVE FINANCIAL INSTRUMENTSThe Company and certain subsidiaries enter into forward exchange contracts, interest rate swaps and commodity forwards for aluminum metal. TheCompany and its subsidiaries have a basic policy of using derivative financial instruments for risk hedging within the limit of hedged receivables andpayables and do not hold or issue derivative financial instruments for trading purposes. Forward exchange contracts are used to hedge risk arisingfrom future fluctuations of foreign currency exchange with respect to receivables and payables denominated in foreign currencies.
Interest rate swaps are used to hedge risk arising from future fluctuations of interest rates and reduce interest expenses. Commodity forwards foraluminum metal are used to hedge risk arising from future fluctuations of commodity market prices with respect to commodity transactions.
Under the Japanese Accounting Standards for Financial Instruments, which have been effective for fiscal years beginning on or after April 1, 2000,the Companies have applied hedge accounting.
At December 31, 2004, the derivative financial instruments of the Companies were as follows:
Millions of yen
2004
Contract Valuationamount Fair value gain (loss)
Related to interest ratesInterest rate swaps:
Paying fixed rates and receiving floating rates ...................................................................... ¥500 ¥(15) ¥(15)Note: No swap balance at December 31, 2005, related to interest rates.
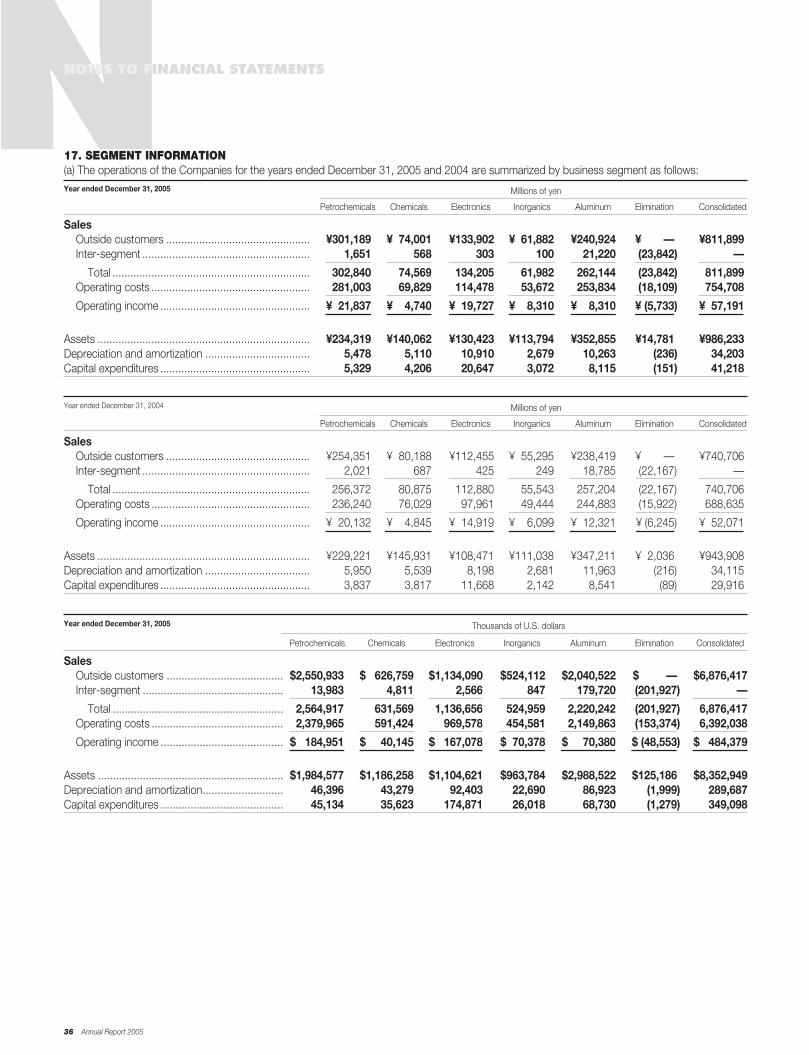
17. SEGMENT INFORMATION(a) The operations of the Companies for the years ended December 31, 2005 and 2004 are summarized by business segment as follows:Year ended December 31, 2005 Millions of yen
Petrochemicals Chemicals Electronics Inorganics Aluminum Elimination Consolidated
SalesOutside customers ................................................ ¥301,189 ¥074,001 ¥133,902 ¥061,882 ¥240,924 ¥ — ¥811,899Inter-segment ........................................................ 1,651 568 303 100 21,220 (23,842) —
Total .................................................................. 302,840 74,569 134,205 61,982 262,144 (23,842) 811,899Operating costs ..................................................... 281,003 69,829 114,478 53,672 253,834 (18,109) 754,708
Operating income .................................................. ¥021,837 ¥004,740 ¥019,727 ¥008,310 ¥008,310 ¥ (5,733) ¥057,191
Assets ....................................................................... ¥234,319 ¥140,062 ¥130,423 ¥113,794 ¥352,855 ¥14,781 ¥986,233Depreciation and amortization ................................... 5,478 5,110 10,910 2,679 10,263 (236) 34,203Capital expenditures .................................................. 5,329 4,206 20,647 3,072 8,115 (151) 41,218
Year ended December 31, 2004 Millions of yen
Petrochemicals Chemicals Electronics Inorganics Aluminum Elimination Consolidated
SalesOutside customers ................................................ ¥254,351 ¥080,188 ¥112,455 ¥055,295 ¥238,419 ¥ — ¥740,706Inter-segment ........................................................ 2,021 687 425 249 18,785 (22,167) —
Total .................................................................. 256,372 80,875 112,880 55,543 257,204 (22,167) 740,706Operating costs ..................................................... 236,240 76,029 97,961 49,444 244,883 (15,922) 688,635
Operating income .................................................. ¥020,132 ¥004,845 ¥014,919 ¥006,099 ¥012,321 ¥ (6,245) ¥052,071
Assets ....................................................................... ¥229,221 ¥145,931 ¥108,471 ¥111,038 ¥347,211 ¥02,036 ¥943,908Depreciation and amortization ................................... 5,950 5,539 8,198 2,681 11,963 (216) 34,115Capital expenditures .................................................. 3,837 3,817 11,668 2,142 8,541 (89) 29,916
Year ended December 31, 2005 Thousands of U.S. dollars
Petrochemicals Chemicals Electronics Inorganics Aluminum Elimination Consolidated
SalesOutside customers ....................................... $2,550,933 $0,626,759 $1,134,090 $524,112 $2,040,522 $ — $6,876,417Inter-segment ............................................... 13,983 4,811 2,566 847 179,720 (201,927) —
Total ......................................................... 2,564,917 631,569 1,136,656 524,959 2,220,242 (201,927) 6,876,417Operating costs ............................................ 2,379,965 591,424 969,578 454,581 2,149,863 (153,374) 6,392,038
Operating income ......................................... $0,184,951 $0,040,145 $0,167,078 $070,378 $0,070,380 $ (48,553) $0,484,379
Assets .............................................................. $1,984,577 $1,186,258 $1,104,621 $963,784 $2,988,522 $125,186 $8,352,949Depreciation and amortization........................... 46,396 43,279 92,403 22,690 86,923 (1,999) 289,687Capital expenditures ......................................... 45,134 35,623 174,871 26,018 68,730 (1,279) 349,098
36 Annual Report 2005
NNOTES TO FINANCIAL STATEMENTS

Showa Denko K.K. 37
(b) The operations of the Companies for the years ended December 31, 2005 and 2004 are summarized by geographic area as follows:Year ended December 31, 2005 Millions of yen
Domestic companies Overseas companies Elimination Consolidated
SalesOutside customers ............................................................................................... ¥712,807 ¥099,092 ¥ — ¥811,899Inter-segment....................................................................................................... 20,908 8,957 (29,865) —
Total................................................................................................................. 733,715 108,048 (29,865) 811,899Operating costs.................................................................................................... 684,245 96,466 (26,004) 754,708
Operating income................................................................................................. ¥049,470 ¥011,582 ¥ (3,861) ¥057,191
Assets ...................................................................................................................... ¥889,698 ¥095,539 ¥00,996 ¥986,233
Year ended December 31, 2004 Millions of yen
Domestic companies Overseas companies Elimination Consolidated
SalesOutside customers ............................................................................................... ¥663,311 ¥77,395 ¥ — ¥740,706Inter-segment....................................................................................................... 27,740 6,242 (33,982) —
Total................................................................................................................. 691,051 83,637 (33,982) 740,706Operating costs.................................................................................................... 630,284 78,107 (19,755) 688,635
Operating income................................................................................................. ¥060,767 ¥05,531 ¥(14,227) ¥052,071
Assets ...................................................................................................................... ¥879,446 ¥80,440 ¥(15,978) ¥943,908
Year ended December 31, 2005 Thousands of U.S. dollars
Domestic companies Overseas companies Elimination Consolidated
SalesOutside customers ............................................................................................ $6,037,156 $839,261 $ — $6,876,417Inter-segment.................................................................................................... 177,081 75,859 (252,940) —
Total.............................................................................................................. 6,214,237 915,119 (252,940) 6,876,417Operating costs................................................................................................. 5,795,250 817,028 (220,240) 6,392,038
Operating income.............................................................................................. $0,418,987 $098,092 $ (32,700) $0,484,379
Assets................................................................................................................... $7,535,341 $809,173 $008,434 $8,352,949
Overseas sales, which represent sales to customers outside of Japan, of the Companies for the years ended December 31, 2005 and 2004 weresummarized by geographic area as follows:Year ended December 31, 2005 Millions of yen
Asia Others Overseas sales
Overseas sales.......................................................................................................................................... ¥173,311 ¥51,032 ¥224,342Consolidated net sales .............................................................................................................................. — — 811,899Ratio of overseas sales to consolidated net sales ...................................................................................... 21.3% 6.3% 27.6%
Year ended December 31, 2004 Millions of yen
Asia Others Overseas sales
Overseas sales.......................................................................................................................................... ¥143,908 ¥50,362 ¥194,270Consolidated net sales .............................................................................................................................. — — 740,706Ratio of overseas sales to consolidated net sales ...................................................................................... 19.4% 6.8% 26.2%
Year ended December 31, 2005 Thousands of U.S. dollars
Asia Others Overseas sales
Overseas sales....................................................................................................................................... $1,467,863 $432,215 $1,900,078

18. RISK FACTORS
Operational and Other RisksShowa Denko K.K. and its Group companies are taking steps to minimize risks to the Group’s operations. While the SDK Group started implement-ing its three-year (2006-2008) consolidated business plan, the “Passion Project,” we consider we face the risks, as explained below, that couldadversely affect our future performance and financial conditions. The following covers important risk factors considered being present as of thisMarch 30, 2006. This is not inclusive.
(a) Substantial Fluctuations in the Performances of Individual BusinessesThe SDK Group is manufacturing and sells a wide variety of products, such as petrochemicals, chemicals, electronics, inorganics and aluminum.The following risks are expected in major business fields, but those are not limited to the businesses mentioned below.
PetrochemicalsThe SDK Group purchases and imports a large amount of feedstock naphtha. When the naphtha price rises due to an increase in crude oil prices,tight supply or a weaker yen, and when we cannot absorb the manufacturing cost increase in the form of higher product prices, the Group’sperformance and financial conditions can be affected. Furthermore, earnings from petrochemicals largely depend on the supply-demand balance.Construction of large plants by competitors and resultant oversupply as well as a sharp decrease in demand due to unfavorable changes in theJapanese or world economies can affect the Group’s performance and financial conditions.
AluminumThe Group imports a large amount of aluminum ingots from overseas sources. When the aluminum ingot price rises due to fluctuations in LMEprices or a weaker yen, and when we cannot absorb the manufacturing cost increase in the form of higher product prices, the Group’s performanceand financial conditions can be affected. Furthermore, in some of the product lines, sales to specific customers account for a large portion.Those customers’ performances, which are beyond our control, can substantially affect such businesses.
HDsIn the Group’s HD business, the sales volume is largely influenced by demand for electric appliances and PCs. The business requires innovations ata rapid pace and involves fierce international competition. The Group is prepared to develop and provide products meeting the market requirementsand has established a global production/marketing setup. However, when customer requirements change more quickly than we expected, andwhen the supply-demand balance changes substantially, the Group’s performance and financial conditions can be affected.
Overseas operationsThe Group is producing and selling in Asia, North America and Europe. Operations overseas involve such special risks as unexpected changes in laws and regulations, deterioration in political/economic situations and social disorder due to war and terrorism. Such risks can become real and affect our overseas operations, resulting in an adverse impact on the Group’s performance and financial conditions.
(b) Unexpected Fluctuations in Financial Conditions and Cash FlowsSubstantial fluctuations in exchange ratesThe Group imports part of its feedstock requirements from overseas and exports part of its domestic production to foreign countries. The Group makesits best efforts to minimize relevant exchange rate fluctuation risks, mainly through exchange contracts. However, substantial fluctuations in exchangerates can affect the Group’s foreign-currency-based transactions and assets/liabilities, affecting the Group’s performance and financial conditions.
Exchange rate fluctuations can affect the Group’s overseas subsidiaries in the like manner. Furthermore, the exchange rate fluctuations canaffect the Group’s performance and financial conditions through conversion of overseas subsidiaries’ financial statements into Japanese yen.
Trends in financial marketsThe Group has been making continuous efforts to reduce its interest-bearing debt, resulting in a substantial decline in the ratio of interest-bearingdebt to stockholders’ equity. However, the trends in the financial markets can change the fund-raising and interest-rate situations, affecting theGroup’s performance and financial conditions.
Employees’ severance indemnitiesThe Group’s employees’ severance indemnities and expenses are calculated based on various basic rates and the yield of pension assets used in pension calculations. Fluctuations in the current price of pension assets, trends in interest rates and changes in the retirement benefit/pension systems can affect the Group’s performance and financial conditions.
SecuritiesAs the Group owns securities with current prices, fluctuations in stock prices can result in valuation losses, affecting the Group’s performanceand financial conditions.
38 Annual Report 2005
NNOTES TO FINANCIAL STATEMENTS

Showa Denko K.K. 39
Accounting for impairment of fixed assetsThe Group adopted the accounting standard regarding impairment of fixed assets in 2004. The Group may incur additional losses from impairmentof fixed assets as a result of future changes in the current prices of land and other fixed assets or a substantial change in the business environment.
Deferred tax assetsThe Group’s financial statements include deferred tax assets in relation to temporary differences (differences between the assets/liabilities on theconsolidated financial statements and the assets/liabilities in calculation of taxable income). The calculation of deferred tax assets is based on vari-ous projections for future taxable income. Thus, when actual taxable income differs from the projections and when it becomes necessary to revisedeferred tax assets, that can affect the Group’s performance and financial conditions.
(c) Specific RegulationsThe Group’s businesses are subject to various restrictions as stipulated by laws and regulations. The restrictions relate to industrial safety (suchas the Law for Prevention of Disasters at Petroleum Complexes, Etc.; the Fire Service Law; and the High Pressure Gas Safety Law) and the en-vironment and chemical substances (such as the Basic Environment Law; the Air Pollution Control Law; and the Law concerning the Examinationand Regulation of the Manufacture, Etc., of Chemical Substances). The Group observes these laws and regulations as it conducts its respectivebusinesses. In the event the Group fails to observe any of the laws and regulations, the Group’s activities could be restricted. In case stricterregulations are introduced, resulting in higher costs, the Group’s performance and financial conditions can be affected.
(d) Important LawsuitsWhile the Group makes its best efforts to observe pertinent laws and regulations, the Group may be sued as it conducts its wide-ranging businesses.
(e) OthersR&DIn line with its policy of securing market orientation and establishing technical advantages, the Group is engaged in continuous R&D to improve itscore technologies in inorganic/aluminum and organic chemical technologies and achieve synergies in an effort to create individualized products andhigh-value businesses. However, in case the actual results materially differ from original plans, the Group’s performance and financial conditionscould be affected.
Intellectual propertyThe Group is making its best efforts to protect its accumulated patent rights and know-how in recognition of their ability to make the Group’s busi-nesses more competitive. However, in the event of failure to duly protect any of the patent rights or know-how, infringement by a third party, or if the Group is considered to have infringed on a third party’s patent rights, the Group’s operations can be hindered and the Group’s performanceand financial conditions could be affected.
Product quality and product liabilityThe Group has established its internal rules on quality assurance and quality control, as well as organizations for managing and promoting qualityassurance. Furthermore, the Group has obtained certification under ISO 9001 standards to ensure strict quality control. However, in the event of aserious quality defect or being sued for product liability, the Group’s reputation could be damaged and the Group may be forced to pay compensa-tion to customers. This could affect the Group’s performance and financial conditions.
Accidents and disastersThe Group is committed to securing steady and safe operations. The Group conducts regular inspections of all manufacturing facilities in an effortto minimize any risk factors pertaining to suspension of operations or accidents due to problems with manufacturing facilities. In the event of injuryor damage to property due to an accident or a natural disaster, the Group’s reputation could be damaged and the Group may incur substantialcosts and lose business opportunities due to suspension of production. This can affect the Group’s performance and financial conditions.
Impact on environmentThe Group is committed to the principles of Responsible Care, which means that we are working to ensure the health and safety of everyone and toprotect the environment from harm caused by chemical substances throughout their life cycles, namely, the development, production, distribution,use and disposal. In the event of causing impact on the environment, the Group’s reputation can be damaged. The Group may incur substantialcosts, including compensation, lose business opportunities due to suspension of production and/or pay compensation to customers. These factorscan affect the Group’s performance and financial conditions.

40 Annual Report 2005
RREPORT OF INDEPENDENT CERTIFIED PUBLIC ACCOUNTANTS M

Showa Denko K.K. 41
Name Equity Participation (%) (Note 1) Main Product(s) or Business(es)
Heisei Polymer Co., Ltd. 100.0 Plastic cloth, bags, sheeting, etc.
Kokusai Eisei Co., Ltd. 100.0 Insecticides and fumigants, etc.
PT. Showa Esterindo Indonesia 67.0 Ethyl acetate
Shoko Co., Ltd.* (T8090) 43.9 General trading
Showa Aluminum Alloy K.K. 100.0 Aluminum alloy
Showa Aluminum Can Corporation 75.0 Beer and soft drink cans
Showa Aluminum Corporation of America (Note 2) 100.0 Heat exchange equipment for automobiles, aluminum cylinders for laser beam printers
Showa Aluminum Powder K.K. 100.0 Aluminum paste
Showa Denko Aluminum Trading K.K. 100.0 Aluminum products trading in western Japan
Showa Denko Carbon, Inc. 100.0 Graphite electrodes
Showa Denko HD K.K. 80.1 Hard disks
Showa Denko HD Malaysia Sdn. Bhd. 100.0 Aluminum substrates for hard disks
Showa Denko HD Singapore Pte. Ltd. 100.0 Hard disks
Showa Denko HD Trace Corporation 66.7 Hard disks, aluminum substrates for hard disks
Showa Denko Kenzai K.K. 100.0 Plaster materials, fireproofing pipe, wall siding, etc.
Showa Denko Packaging Co., Ltd. 100.0 Packaging/containers for food, medicine, and electronic parts
Showa Denko Plastic Products Co., Ltd. 100.0 Packaging, plastic parts for OA equipment, etc.
Showa Engineering Co., Ltd. 100.0 Engineering, construction, maintenance
Showa Financing K.K. 100.0 Provision of finance to subsidiaries and affiliates
Showa Highpolymer Co., Ltd.* (T4214) 40.5 Unsaturated polyester, vinyl ester, etc.
SUBSIDIARIES
Name Equity Participation (%) Main Product(s) or Business(es)
Japan Polyethylene Corporation 42.0 High- and low-density polyethylene
Showa Tansan Co., Ltd.* (T4096) 20.8 Liquid carbon dioxide, dry ice
SunAllomer Ltd. 50.0 Polypropylene and advanced polypropylene-based materials
Tokyo Liquefied Oxygen Co., Ltd. 35.0 Liquefied oxygen, nitrogen, argon
Union Showa K.K. 50.0 Molecular sieves
AFFILIATES
*Tokyo Stock Exchange listed companies
As of December 31, 2005, Showa Denko K.K. had 24 subsidiaries or affiliates to which the equity method was applied.
* Tokyo Stock Exchange listed companies
As of December 31, 2005, Showa Denko K.K. had 42 consolidated subsidiaries, including the above.
Notes: 1. Proportion of ownership interest (direct or indirect) by SDK and its subsidiaries2. In January 2005, Showa Aluminum Corporation of America absorbed Shotic America Corporation.
MMAJOR SUBSIDIARIES AND AFFILIATES (As of December 31, 2005)

42 Annual Report 2005
CORPORATE DATA
Regular General MeetingThe regular general meeting of stockholders was held onMarch 30, 2006.
Number of Shares Outstanding1,142,832,934 at December 31, 2005
Number of Stockholders90,198 at December 31, 2005
Classification of StockAll stock issued by Showa Denko is common stock.
Stock Transfer AgentMizuho Trust & Banking Co., Ltd.
2-1, Yaesu 1-chome, Chuo-ku, Tokyo 103-8670, Japan
Stockholders by Sector (At December 31, 2005)
Number of shares held (thousands) %
Financial firms 540,170 47.27
Individuals 290,503 25.41
Foreign corporate entities, etc. 221,208 19.36
Japanese corporate entities 77,508 6.78
Securities firms 13,442 1.18
Governmental bodies 2 0.00
Total 1,142,833 100.00
Head OfficeShowa Denko K.K.
13-9, Shiba Daimon 1-chome,Minato-ku, Tokyo 105-8518, JapanFax: +81-3-3436-2625
e-mail: [email protected]: http://www.sdk.co.jp/html/english/index.html
INVESTOR INFORMATION
Showa Denko America, Inc.
Head Office489 Fifth Avenue, 18th Fl.,New York, NY 10017,U.S.A.Phone: +1-212-370-0033Fax: +1-212-370-4566
Santa Clara Office2880 Lakeside Drive, Suite 253,Santa Clara, CA 95054,U.S.A.Phone: +1-408-327-8878Fax: +1-408-327-8870
Showa Denko Europe GmbHMartin-Kollar-Str. 10,D-81829 Munich,GermanyPhone: +49-89-939-96234Fax: +49-89-939-96250
Showa Denko Singapore (Pte.) Ltd.4 Shenton Way, #16-01 SGX Centre 2,Singapore 068807Phone: +65-6223-1889Fax: +65-6223-6007
Showa Denko (Shanghai) Co., Ltd.11F-A Zhong Cheng Bldg., 818 Dong Fang Rd., Pudong,Shanghai, People’s Republic of ChinaPhone: +86-21-5820-6120Fax: +86-21-5820-2034
COMMERCIAL SUBSIDIARIES ABROAD
This annual report is printed on 100% recycled paper.
C


Printed in Japan
13-9, Shiba Daimon 1-chome,Minato-ku, Tokyo 105-8518, Japan