Embed Size (px)
Citation preview

SH
OR
T AN
D LO
NG
TERM
EFFECTS
OF EA
RLY
NU
TRITIO
N IN
BR
OILER
CH
ICK
ENS
MA
AR
TEN S
. HO
LLEMA
NS
SHORT AND LONG TERM EFFECTS OF EARLY NUTRITION IN BROILER CHICKENS
MAARTEN S. HOLLEMANS

Propositions
1. Broiler chickens in Dutch husbandry do benefit from immediate provision of feed and water after hatching. (this thesis)
2. Not only the genotype, but also environmental conditions should be included when studying natural auto-antibodies. (this thesis)
3. Preventing ammonia emissions in pig houses reduces health risks for pigs and their caretakers.
4. Synthetic amino acids are key for circular intensive livestock farming without loss of production efficiency.
5. Current legislation on animal experiments hampers further improvement of animal wellbeing in intensive livestock farming.
6. Securing future food supply is no justification to ignore wellbeing of farm animals.
Propositions belonging to the thesis entitled:
Short and long term effects of early nutrition in broiler chickens
Maarten S. Hollemans
Wageningen, the Netherlands, 20 November 2020

Short and long term effects of early nutrition in broiler chickens
Maarten S. Hollemans

Thesis committee
PromotorProf. Dr B. KempProfessor of Adaptation PhysiologyWageningen University & Research
Co-promotorsDr A. LammersResearcher, Adaptation Physiology GroupWageningen University & Research
Dr S. de VriesAssistant professor, Animal Nutrition GroupWageningen University & Research
Other membersProf. Dr R. Ducatelle, Ghent University, BelgiumProf. Dr G.F. Wiegertjes, Wageningen University & ResearchDr E. van Eerden, Schothorst Feed Research B.V., LelystadDr I.C. de Jong, Wageningen Livestock Research
This research was conducted under the auspices of the Graduate School Wageningen Institute of Animal Sciences.

Short and long term effects of early nutrition in broiler chickens
Thesissubmitted in fulfilment of the requirements for the degree of doctor
at Wageningen Universityby the authority of the Rector Magnificus,
Prof. Dr A.P.J. Mol,in the presence of the
Thesis Committee appointed by the Academic Boardto be defended in public
on Friday 20 November 2020at 4 p.m. in the Aula.
Maarten S. Hollemans

Short and long term effects of early nutrition in broiler chickens174 pages
PhD thesis, Wageningen University, Wageningen, the Netherlands (2020)With references, with summary in English
ISBN: 978-94-6395-491-4DOI: https://doi.org/10.18174/528572


Table of contents
Preface and acknowledgementsList of abbreviationsSummary
Chapter 1 General introduction
Chapter 2 Effects of early nutrition and transport of 1-day-old chickens on production performance and fear response
Chapter 3 Intestinal epithelium integrity after delayed onset of nutrition in broiler chickens
Chapter 4 Early and later life effects of early nutrition and sanitary conditions on humoral immunity in broiler chickens
Chapter 5 Effects of early nutrition and sanitary conditions on oral tolerance and antibody responses in broiler chickens
Chapter 6 General discussion
ReferencesAbout the author
91215
21
41
63
83
105
131
159175


Proloog en dankwoord
Zo, dat was het dan, mijn promotieonderzoek (bijna) afgerond. Dit onderzoek is het resultaat van een samenwerking tussen Coppens Diervoeding en Wageningen UR, en de resultaten zijn gepresenteerd in deze thesis. Ik heb onderzocht wat de consequenties van vroege voeding zijn voor vleeskuikens op het gebied van darmontwikkeling en -integriteit, het immuunsysteem en dierprestaties. De resultaten komen uitgebreid aan bod in de hierop volgende hoofdstukken. Ik hoop dat dit onderzoek bijdraagt aan de onderbouwing van maatregelen ter verbetering van gezondheid en welzijn van vleeskuikens.
Ik ben niet de eerste, en waarschijnlijk ook niet de laatste, die zal zeggen dat je tijdens een promotieonderzoek anderen nodig hebt. Toch komt het grootste deel van het werk op je eigen schouders terecht. Dan is de steun van familie en vrienden prettig en motiverend. Daarnaast had ik mijn promotieonderzoek ook niet helemaal alleen uit kunnen voeren: het blijf tenslotte een leertraject én ik heb maar 2 handen. Op deze plek wil ik gebruik maken van de mogelijkheid mijn dank uit te spreken aan de vele mensen die ieder op hun eigen manier bijgedragen hebben aan dit promotieonderzoek.
Het belangrijkste zijn voor mij de personen in de privésfeer, niet zozeer vanwege de technische ondersteuning maar wel voor de mentale ondersteuning. Anna-Lena, je weet waar ik je dankbaar voor ben en wat we samen hebben meegemaakt. Gelukkig was en ben jij er altijd. Mijn ouders en zus ben ik dankbaar voor hun nimmer aflatende steun, interesse, en de vrijheid in alles die ons altijd zo gegund is. Dick, Hilde, Jannick, dank voor jullie gastvrijheid en de gezellige uurtjes klussen en spitten. Dank aan de club Kaas (Madelon, Dave, Melle, Tryntsje, Yannis, Adam: gelukkig hebben we allemaal onze kaas wel teruggevonden), en mijn fiets-en-Mallorca vriendjes (MW, KO, Conny, Kappertje, Huub). Yuri en Kim, bedankt voor alles en in het speciaal de gezellige wok-avondjes: handig om te leren waar je een vrieskist allemaal voor kan gebruiken! Gretje en Anne-Marieke: bedankt voor alles tijdens de studie en daarna, jullie inspireerden mij voor stelling 6. Bedankt Marjolein en J(e)annet(te)(!), ik denk met plezier terug aan onze squash-activiteiten. Ten slotte ook de leden van RZC Renkum bedankt voor de gezellige trainingen, borrels, Opheusden-zwem-picknicks (die vaak eindigden met regen en onweer), gezamenlijke wedstrijden, steun, humor en vele Whatsappgroepen (met bijzondere titels). Sportverenigingen hebben ook in de huidige tijd van individualisering nog steeds een grote maatschappelijke waarde.
Dank aan mijn paranimfen Jerine en Anne. Jerine, dank voor de vele gesprekken en het vergelijken van onze projecten: zo hebben we toch maar veel van elkaar geleerd. Gelukkig deed ík wel iets met de Klipper papers. Fijn dat je mijn vraagbaak in de laatste
9

maanden was. Anne, altijd fijn om iemand tegenover je te hebben die er hetzelfde over denkt, bedankt voor de gesprekken en je kennis. De wekelijkse koffiepauzes waren een fijne onderbreking.
Mijn collega’s van Coppens wil ik hartelijk bedanken: ik vind dat we supertrots mogen zijn op wat we gezamenlijk weten te presteren en de goede sfeer. Een aantal collega’s wil ik hier wat uitgebreider bedanken. Huub, je bent een prettige sparringpartner en ik waardeer je ideeën en steun op het persoonlijke vlak. Dank voor je commerciële inzichten. Patrick dank voor de wijze “Hurkiaanse” uitspraken die ik ook goed kon gebruiken in mijn promotieonderzoek: terug naar de “grote getallen” en het wegnemen van de oorzaak van problemen. Wouter, bedankt voor je grote nauwkeurigheid waarmee jij meer dan eens wat “slordigheidsfoutjes” hebt weten te voorkomen en je oprechte interesse in mijn PhD. Jan, bedankt voor je nuchterheid en het delen van je kennis, mede door jou zijn we dit onderzoek gestart. De discussies theorie versus praktijk houden onze werkwijze scherp. Iris en Saskia, bedankt voor jullie interesse, meedenken en flexibiliteit om de Coppens projecten en proeven feilloos over te nemen wanneer het weer even te druk werd in Wageningen. Hendrik, in 2014 wist je mijn dilemma (industrie of universiteit) om te zetten in enthousiasme voor een mooie combinatie van deze twee. Dank voor je oprechtheid en luisterend oor, maar bovenal alle vrijheid die ik heb gekregen in de laatste 6 jaar. Daar heb ik misschien nog wel het meeste van geleerd.
During the last 5 years, I conducted my research at the Adaptation Physiology group and the Animal Nutrition group at Wageningen UR. I would like to thank everyone from both groups for their contributions to this thesis, but also for the nice atmosphere and frequent drinks. I hope we’ll meet again in the future.
Aart, we hebben elkaar pas echt leren kennen toen ik begon met mijn afstudeervak over immuniteit en genetica. Na 3 maanden wist je mij te overtuigen en enthousiasmeren voor een promotieonderzoek in de toekomst. Twee jaar later kwam daar een mooi project uit naar onze gezamenlijke interesse, met jou als mijn eerste begeleider! Vanaf het begin ben ik al heel blij met jouw input en begeleidingsstijl; ik waardeer je mechanistische benadering en je grote kennis van de literatuur. Op deze plek wil ik ook Jan van der Poel en Leon de Jonge bedanken voor hun aanmoedigingen om te starten met een promotieonderzoek. Sonja, we hebben elkaar wat later leren kennen, maar daarom ben ik niet minder positief over jou. Hoewel we het vaak ook niet eens zijn in verregaande discussies, heb je daardoor wel een betere onderzoeker van mij gemaakt. De ‘waarom’ vraag brengt je op lange termijn verder. Bedankt daarvoor, en natuurlijk je hulp bij het schrijven en de proeven. Ik vind het knap hoe jij vaak uit lange en kronkelige zinnen feilloos weet te destilleren wat ik eigenlijk wil zeggen. Bas, dank voor je bijdrage tijdens
10

de cruciale momenten in mijn promotieonderzoek. Ik vind het knap hoe je het overzicht weet te houden over de uiteenlopende projecten in de leerstoelgroep. Het was prettig te weten dat ik op jouw kennis en kunde kon terugvallen wanneer dat nodig was. Je plaatjes-ideeën hebben het niet allemaal gehaald, maar degenen die het wel haalden zorgen zeker dat de boodschap nu beter overkomt. Henk P., professor NA(A)b! Bedankt voor je bijdrage aan mijn immunologie-hoofdstukken; hoewel ik erg kritisch over NAAb was, wist je mij misschien iets té goed te overtuigen, want we moesten aardig wat schrappen… Een overleg met jou staat garant voor interessante discussies en goede gesprekken, en bovenal veel plezier! Ger, bedankt voor je onvoorwaardelijke inzet, geduld en meedenken tijdens de veelal monsterlijke proeven. Mede door jou zijn de proeven tot een goed einde gekomen en hebben we mooie data kunnen verkrijgen voor dit proefschrift. Joop, ook dank voor jouw hulp op het lab en ondersteuning. Ook heb ik vaak op het laatste moment nog hulp van anderen in moeten schakelen; Fleur, Mike, Monique, Rudie, Ilona, Marcel en Manon: hartelijk dank voor jullie hulp! Hier wil ik ook mijn dank uitspreken aan de dierverzorgers die tijdens mijn proeven de dagelijkse verzorging van de dieren op zich namen, zowel in Vlierden (Carin en Theo), als in Wageningen (Ries, Bert, Sabine, Sherine, Ronald). In het specifiek wil ik ook de heren van de klimaat-respiratiecellen bedanken: Marcel, Sven, en Tamme. Dank allemaal voor jullie grote inzet, flexibiliteit en betrokkenheid!
Tot slot wil ik ook twee mensen bedanken die helaas deze promotie niet mee kunnen maken. Stefan, Marc, jullie beiden had ik graag op mijn promotie gezien, maar helaas, het leven blijkt maar tot op zekere hoogte maakbaar te zijn. Het doet mij realiseren, dat we ons vaak onbewust zijn van de kansen die we krijgen op iedere nieuwe dag.
Blijkbaar ben je geïnteresseerd anders was je niet tot hier gekomen, dus bedankt, beste lezer. Ik hoop dat je de inhoud van dit boekje kan waarderen en wens je veel leesplezier.
Maarten Hollemans
3 juli 2020
11

List of abbreviations
ADG Average daily gainBCR B-cell receptorBSA Bovine serum albuminBW Body weightCD4, 8 Cluster of differentiation 4 or 8CFU Colony forming unitsCLD ClaudinCLH Chicken liver homogenateCOX Cyclo-oxygenaseCpG oligonucleotides 5`-> 3` direction of cytosine, phosphate group, guaninedays p.i. days post immunizationDN Delayed nutrition (feeding strategy)EN Early nutrition (feeding strategy)FITC-d Fluorescein isothiocyanate-dextranHSC High sanitary conditionsHuSA Human serum albumini.m. intramusculari.t. intratrachealIgM, Y, A Immunoglobulin M, Y, or AIL InterleukinIP Intestinal permeabilityJAM Junctional adhesion moleculeKLH Keyhole limpet hemocyaninLPS LipopolysaccharideLSC Low sanitary conditionsMAb Maternal antibodyMALT Mucosal associated lymphoid tissueMAMP Microbial associated molecular patternsMDP Muramyl dipeptidemRNA Messenger ribonucleic acidMUC MucinNAAb Natural auto-antibodyNAb Natural antibodyrADG Relative average daily gainRGG Rabbit γ-globulinRRBC Rabbit red blood cellsrRNA Ribosomal ribonucleic acid
12

SpAb Specific antibodySRBC Sheep red blood cellsTGF-β Transforming growth factor βTJ Tight JunctionTLR Toll-like receptorT
regRegulatory T-cell
ZO Zonula occludens
13

14

Summary
After hatch, broiler chickens may have immediate (early nutrition; EN) or delayed (delayed nutrition; DN) access to feed and water (nutrition) up to 72 h. In several countries, EN is frequently applied to improve broiler growth performance and health. In the Netherlands, legislation is being developed that obliges hatcheries to provide nutrition to broilers within 36 h after hatch, and multiple retailers demand EN for their private label chicken meat products. The aim of this thesis was to study early and later life effects of EN compared with DN on growth performance, intestinal integrity, and the immune system.
Broiler performance and compensatory growthEarly nutrition and transport of day-old-chicks is confounded in studies assessing the effect of transport of day-old-chicks on growth performance and broiler welfare, including behavior. Therefore, early and later life effects of feeding strategy (EN versus DN (38 h1)) and post-hatch transport on growth performance and fear response were tested in a 2*2 factorial approach (chapter 2). Post hatch broiler transport did not affect broiler performance, but EN compared with DN increased fear responses in transported broilers at 3 d of age, likely due to early expression of fear responses in EN broilers. As transport was not found to affect growth performance, it was decided not to study transport of day-old broilers further. Nevertheless, the higher fear response in DN compared with EN broilers at 30 d of age, suggests that further optimization of transport of day-old broilers may have long-term effects on broiler behavior.
A meta-analysis on body weight (BW) data of EN versus DN broilers obtained for this thesis indicated that DN broilers can partially compensate their lower BW by short-term compensatory growth (chapter 6). Full compensation at later ages (> 33 d) seems however only possible after shorter durations of DN (< 38 h).
Intestinal development and integrityBroilers receiving EN compared with DN are ahead in intestinal development during approximately the first 7 d of age. Likely, EN broilers have earlier onset of intestinal development, as post hatch intestinal development appears to be stimulated by feed intake. However, it was unknown whether this also affects integrity of the intestinal epithelium, for example via enhanced paracellular permeability due to greater tight junction pore size. Therefore, broilers were subjected to EN or DN (72 h) and paracellular permeability and mRNA abundance of genes involved in maintaining and regulating intestinal integrity were compared (chapter 3). Paracellular permeability was
15
1Time between brackets represents the duration from hatch until onset of feeding

not affected by feeding strategy (EN versus DN) at 4 d of age, but mRNA expression levels of most tight junction and host defense genes in ileum and ceca were higher in EN broilers. This likely indicates the earlier onset of intestinal and immune development in EN broilers due to earlier feed intake, rather than differences in intestinal integrity. Also no damage of the intestinal epithelium was observed at 4 d of age. Whether intestinal integrity is affected before the onset of feeding, especially during DN, remains unclear. As no effects were present at 4 d of age, possible effects on intestinal integrity are limited and short-term.
Induction of low and high sanitary conditionsTo obtain better insight in effects of EN on growth performance and immune responses in broilers, low (LSC) and high sanitary conditions (HSC) were induced by supplying litter from commercial broiler farms every 4 d, from 3 d of age onwards, in LSC pens. This allowed to study the immune system of broilers under relatively high (LSC) and low (HSC) antigenic pressure. Depression of growth performance was observed in broilers kept under LSC, compared with HSC (chapter 5). Low sanitary conditions compared with HSC resulted in higher levels of natural antibodies (NAb; IgY) from 14 d of age onwards, and higher levels of natural auto-antibodies (NAAb; IgM and IgY) and IgM and IgY binding lipopolysaccharide (LPS) or muramyl di-peptide (MDP) at 33 d of age. Higher NAAb levels (IgM and IgY) were observed in LSC compared with HSC broilers. Higher fold change of specific antibodies (SpAb) after immunization was observed in HSC broilers, but absolute levels of SpAb at 7 d post immunization did not differ between LSC and HSC broilers. This was likely caused by higher levels of NAb in LSC broilers prior to immunization. This suggests that broilers housed under LSC increase levels of NAb. Higher NAb levels may thus be the result of increased exposure to antigens and contribute to the first line of defense against pathogenic microorganisms.
Effects of early nutrition on the immune system: early life effectsEarly nutrition could be used as a potential strategy to enhance disease resistance in broilers, as early antigenic stimulation (e.g. via feed intake and microbial colonization) may result in earlier development of the humoral immune system. The first 3 d after hatch are identified as an important developmental window for immune maturation, including the development of oral tolerance in chickens. In chapter 4 higher levels of systemic IgM in EN compared with DN broilers at 7 d of age, including NAb, NAAb, and anti-MDP were found. Although underlying mechanisms have not been studied in this thesis, I speculate that greater exposure of the immune system to antigens in EN broilers, may have stimulated B-cell differentiation resulting in higher levels of antibodies. The higher levels of NAb up to 7 d of age in EN, compared with DN broilers, suggest an improved first line of defense during the first week of age. This is likely due to greater exposure of the immune system to antigens.
16

Later life effects of early nutrition on the immune system under different sani-tary conditionsAlthough consensus seems to have been reached in literature that early life maturation of the immune system is enhanced after EN, there seems to be no consensus on later life effects. Most studies reported no differences in immune responses between EN and DN broilers. This might be caused by the relatively clean environment in which these broiler experiments were conducted, so that less regulation of immune responses was required. This makes translation to commercial broiler husbandry difficult, as broiler farms are expected to vary widely in sanitary conditions. Furthermore, EN broilers might be better able to control their immune responses, which would result in better coping with LSC by EN, compared with DN broilers. Therefore, later life immunity was studied in EN and DN broilers kept under LSC and HSC in chapter 4 and chapter 5. The aim of chapter 4 was to study effects of EN compared with DN and its interaction with sanitary conditions on levels of NAb and NAAb. Between 14 and 33 d of age, feeding strategy or its interaction with sanitary conditions, did not affected NAb and NAAb levels. Broilers receiving EN, compared with DN, are likely exposed to a greater number and diversity of antigens during the window of opportunity to develop oral tolerance. In chapter 5 I therefore studied whether the feeding strategy (EN versus DN) influenced the development of oral tolerance, resulting in different later life antibody responses (IgM, IgY, IgA), under LSC versus HSC. Broilers were fed a relatively low dose of bovine serum albumin (BSA) during the first 3 d of age, and received an intra tracheal immunization with BSA and rabbit γ-globulin (RGG) at 21 or 24 d of age. Antibody responses towards both antigens were measured afterwards. Irrespective of sanitary conditions, attenuated systemic IgM and IgY responses towards BSA, but not RGG, were observed. This suggests specific attenuation of antibody responses. Early nutrition, however, did not affect systemic antibody responses towards BSA or RGG. Levels of biliary IgA binding BSA or RGG were inconsistently elevated in EN versus DN broilers among different experiments. The higher levels of biliary IgA suggest that EN compared with DN may contribute to immune homeostasis, but the biological relevance of these differences are not yet clear. Furthermore, minimal interactions between EN and sanitary conditions on growth performance between 7 and 33 d of age were present (chapter 4 and chapter 5). Minimal interactions were present between EN and sanitary conditions on systemic antibody levels or growth performance between 7 and 33 d of age. Taken together, it appears that broilers reared in LSC do not benefit from EN, compared with DN, with respect to immunity and growth performance.
ConclusionIn conclusion, EN can be applied to induce the earlier onset of intestinal development, but intestinal integrity is not permanently affected by the feeding strategy (EN versus
17

DN). Higher levels of systemic antibodies (NAb, NAAb, anti-MDP) up to 7 d of age in EN compared with DN broilers, may imply a better first line of defense during the first week of age. It appeared that broilers do not benefit from this altered immune development in later life: levels of systemic antibodies did not differ between EN and DN broilers, and EN did not modulate later life antibody responses. Because of minimal interactions between EN and sanitary conditions on levels of antibodies or growth performance, it is suggested that broilers do not benefit from EN under high antigenic pressure during rearing. Compensatory growth up to 14 d of age was observed in all experiments in DN broilers, but only shorter durations of DN (38 h) resulted in full compensation of BW at slaughter.
18

19

1CHAPTER 1

General Introduction

Chapter 1
22

General introduction
23
Chap
ter
1
Early nutrition (EN) for broiler chicks, meaning immediate access to feed and water after hatch, gained attention in the last decades, especially the last 10 years. The opposite of EN, whereas broilers have no access to feed and water upon placement in the broiler house, is delayed (access to) nutrition (DN). Delayed nutrition has become subject of debate in the Netherlands. A Dutch NGO raised attention to the current practice of DN and suggested impaired broiler welfare and excessive starvation in broilers receiving DN, compared with EN (Wakker Dier, 2013), and initiated a lawsuit to change regulation to prevent extended periods of DN. In a recent meta-analysis, investigators concluded that prolonged DN (> 36 h) resulted in a relative increase (56 %) of broiler mortality up to 42 d of age compared with EN (De Jong et al., 2016; de Jong et al., 2017). Altogether, new legislation will be therefore developed in the future obliging hatcheries to provide feed and water to broilers within 36 h, from 2024 onwards (Dutch Trade and Industry Appeals Tribunal, 2019, ECLI:NL:CBB:2018:309). However, this may not oblige hatcheries to apply EN when they can maintain the duration of DN below 36 h, and it is still not clear what the starting point (e.g. counting after first hatcher, first 5% hatchers, or after pulling) of this 36 h time window will be. For specific market segments, however, two large Dutch1 and one large German2 retailer already demand EN for broilers within their private label products. Furthermore, EN has become an interesting concept for broiler farmers as it is suggested a potential strategy to reduce antibiotic usage and growth performance by improving broiler health. Studies supporting the suggestion that EN contributes to improved broiler health are however scarce. The many assumptions present on EN yet are based on “gut-feeling”, rather than solid experimental evidence.
In this introduction, I will first further explain the concept of EN and provide an overview of the current application of EN and DN in commercial practice, and the legislation around EN and DN in the Netherlands. This will be followed by a summary of current knowledge on effects of EN on growth performance and intestinal tract physiology and integrity. Second, I will describe how EN may affect activation and education (development) of the immune system of broilers, and whether this may affect later life immune responses3. The introduction closes with an overview of the research done by me as reported in this thesis, and how this relates with existing knowledge gaps.
1 https://www.ah.nl/over-ah/duurzaamheid/dierenwelzijn/kip; https://www.plus.nl/info-verantwoord/een-verantwoord-assortiment/onze-kip. Both accessed at 17-04-2020.
2 https://www.rewe-group.com/de/newsroom/pressemitteilungen/1630-early-feeding-fuer-mehr-tierwohl-von-kueken. Accessed at 13-05-2020.
3 With regard to the immune system, I focused on investigating effects of EN versus DN on antibody levels, rather than underlying mechanisms causing differences in antibody levels. Antibodies are effector molecules playing a significant role in protecting and regulating the immune system, making them good indicators for effects of EN on development of the immune system and later life immune responses (reviewed by Vollmers and Brändlein, 2005).

Chapter 1
24
1. Early nutrition in broiler husbandry
1.1. Definition of early nutritionThroughout this thesis, the provision of nutrition at hatch facilitating voluntary, immediate feed and water intake is defined as early nutrition (EN), and any delay in access to feed and water is defined as delayed nutrition (DN).
In commercial broiler chicken husbandry, chicks hatch in hatcheries and are subsequently transported to the broiler farm. After arrival on the farm, they are placed in a broiler house and raised upon approximately 42 d, where exact days of age varies depending on market demands or realized growth rate. Chickens do not hatch at the same moment after onset of incubation: the duration (e.g. hatch window) between the first and last broiler hatching in one batch of eggs, may vary between 24 to 48 h (Careghi et al., 2005; Willemsen et al., 2010). Thus, the time between hatch and placement is longer for early hatchers, than for late hatchers (Willemsen et al., 2010). There is commonly no provision of nutrition from hatch upon placement in the broiler house. Especially long transport durations (> 12 h) that may occur during export or inland transport, may increase duration of DN up to 72 h (Van De Ven et al., 2009; Willemsen et al., 2010). Immediate collection of just-hatched chicks during the hatch window is not feasible. Frequent opening of hatchers disturbs the hatching process of the unhatched chicks, increases labor demand, and requires transport of multiple small batches of day-old-chicks to broiler farms. However, precocial avian species such as chickens, have higher relative weight and caloric value of residual yolk after hatch, making them less dependent on immediate feed availability (from their parents), compared with altricial species (Ar and Yom-Tov, 1978). Broiler chicks may therefore survive prolonged periods of DN as they possess residual yolk containing macronutrients that can be absorbed in the intestinal tract (Noy et al., 1996). Residual yolk, however, supplies insufficient amounts of nutrients to induce growth of the broiler. It rather seems that residual yolk is used to maintain minimal requirements in order to survive until first feeding, as body weight (BW) of DN broilers often decreases during the period of DN, especially during prolonged DN up to 72 h (de Jong et al., 2017). Broilers receiving EN compared with DN, were shown to have greater BW at 0 and 7 d of age, and prolonged DN (up to 72 h) resulted in greater BW at 42 d of age (Uni and Ferket, 2004; de Jong et al., 2017). This implies that residual yolk may fulfill minimal nutrient requirements to survive, but that EN is required to fully support the growth potential of broilers.
1.2. Application of early nutrition1.2.1. Systems to apply early nutrition in practiceThe current systems that apply EN in commercial practice can be roughly divided based on the location of hatch: either in hatchers in the hatchery (in-hatchery EN) where

General introduction
25
Chap
ter
1
nutrition is provided in hatching baskets, or in the broiler house on the broiler farm (on-farm EN), as illustrated in Figure 1. The on-farm EN systems can be divided into single-use (“disposable”) and multiple-use (“non-disposable”) systems. In-hatchery EN systems allow better control of the incubation and hatch process, thereby potentially controlling day-old-chick quality, but transport of chicks to the broiler farm is still required. During on-farm EN, approximately 17 d incubated and candled eggs, are transported to the farm and placed in the broiler house to hatch. Thus, hatch takes place at the same location as rearing of the broilers, preventing transport of young broilers after hatch. The most pronounced differences between various on-farm EN systems on the market are the location of the eggs upon hatch (on litter, on egg trays, in racks), heating (floor heating, infra-red irradiation), the degree of automation, and the level of investment.
During on-farm EN, incubated eggs (embryos) are transported, while in-hatchery EN requires transport of broiler chicks to the farm. Whether omitting post hatch transport of broiler chicks has detrimental effects on growth performance or welfare, is however hardly studied. In the few available studies, transport is confounded with nutrition (Valros et al., 2008; Bergoug et al., 2013; Jacobs et al., 2016; De Jong et al., 2018). Therefore, the factor transport was included in the experimental design in the experiment described in chapter 2, However, another potentially explaining factor for differences in on farm hatching and hatchery hatching is that climate conditions before and after hatching may differ. For example higher concentration of CO2 and air speed may occur during on-hatchery EN, compared with on-farm EN. Furthermore, pulling, processing, and handling during on-hatchery EN could be regarded as potential stressors, but also allow effective vaccination, sexing, and removal of second grade chicks, compared with on-farm EN.
Taken this all together, application of EN in commercial practice by any of the aforementioned systems does not only result in a switch from DN to EN, but also affects other factors (transport, climate, chick processing) which may result in different outcomes when comparing for example growth performance between EN and DN systems. For this thesis, I was specifically interested in effects of EN compared with DN on growth performance, intestinal physiology, maturation of the immune system, and later life immunity. Therefore, confounding factors such as transport, climate and chick processing, were excluded as much as possible in the experiments. As a consequence, system comparisons are therefore not discussed, although these may still be considered for future research.

Chapter 1
26
1.2.2. Early nutrition in practice: unknown numbersCurrently, it is unknown how many broiler flocks receive either EN or DN in the Netherlands or other countries. However, the obligation to supply EN to broilers in specific market segments or private labels for retailers in the Netherlands1 (market shares in 2018 are 34.7 % for Albert Heijn, and 6.4 % for Plus (IRI Nederland, 2019)) and Germany2, indicates a relative large share of EN. For example, two Dutch retailers demand EN for slow-growing broilers reared under conditions of the “Eén Ster Beter Leven Keurmerk” (One Star Better Life Quality Mark). This demand is transcending the Beter Leven Keurmerk regulations, as these do not obligate EN (Dierenbescherming, 2016; Stadig, 2019). Also the REWE Group (German retailer) announced in 2018 to further implement EN as part of their private label for broiler meat2.
Furthermore, the wide variety of systems available to supply EN, provides indications on a wider use of EN in practice. Although a wide variety of systems does not directly mean a great market share of EN compared with DN, it indicates the interest and demand of such systems by farmers, which may stimulate system manufacturers to develop new EN systems. With regard to the Netherlands, two broiler hatcheries converted (part of their) hatchers into hatchers that allow provision of EN and to answer market demand on EN4. Furthermore, there has been an increasing number of broiler farmers that hatch broiler chicks in the broiler house, rather than in a hatchery (Coppens Diervoeding, personal communication, 2020). In summary, although official data on the application of EN in commercial practice is lacking, current market information indicates interest in the application of EN from different parties in the broiler production chain.
1.3. Legislation on delayed nutrition in the NetherlandsWakker Dier, a Dutch NGO, raised public attention to the fact that DN is a common practice in the Dutch broiler husbandry (Wakker Dier, 2013). The authors suggested that broilers are subjected to starvation and raised questions about legislation. Wakker Dier therefore initiated a lawsuit against 2 Dutch hatcheries to change legislation, that would result in a ban on DN. The verdict of the Dutch Trade and Industry Appeals Tribunal in 2019 (ECLI:NL:CBB:2018:309, 2019), required a change in legislation by the Ministry of Agriculture, Nature, and Food Quality. Although this new legislation is not published yet, it will likely imply that broiler chicks should have access to nutrition within 36 h after hatch from 2024 onwards, instead of the current 60 h. Whether hatch is defined as the first hatcher in a batch of eggs, the first 5 %, or after all broilers have hatched, or the median of the hatch window, is yet unclear. Remarkably, the exact delay (in hours) of DN broiler chicks that are hatched and reared in the Netherlands
4 https://www.probroed.com/nl/; http://www.lagerweybv.com/nl/index.html. Both accessed at 22-04-2020.

General introduction
27
Chap
ter
1
is unknown, making law enforcement questionable. I estimate that most Dutch broiler flocks receiving DN, do not exceed the 36 h delay. This can be explained by time between hatch of the first chicks in the hatch window and pulling being approximately 30 h and the relative short duration of transport in the Netherlands. It is therefore debatable whether the current regulation may improve broiler chicken health and welfare in the Netherlands, although valid data are required to support this speculation.
Incubation of
fertilized eggs (~ 18
days)
Placement in
conventional hatcher
(no nutrition)
Transport
(no nutrition)
Start of rearing
Placement in
hatcher
(with nutrition)
On farm-hatching
Chick storage
Processing
Early Nutrition
Broiler breeder
husbandry
Delayed Nutrition
Hatch
Single use systems Multiple use systems
Hatch
Placement
Transport
(with nutrition)
Figure 1: Visualization of processes in delayed nutrition (common standard) and early nutrition systems in commercial broiler husbandry. Single use systems are disposed after hatch, whereas multiple-use systems are cleaned and disinfected after hatch, and re-used for future production cycles.
2. Review on effects of early nutrition on broiler growth performance, intestinal tract development, and immunity
In this section I provide an overview of current scientific literature comparing EN and DN broilers and identify relevant knowledge gaps. I will focus on effects of EN on growth performance and its effects on intestinal tract development, with special attention to intestinal morphology, integrity, and bacterial colonization. Finally, I will review reported studies and suggested mechanisms for effects of EN, compared with

Chapter 1
28
DN, on the development of the post hatch immune system, and whether this may affect later life immune responses.
2.1. Early nutrition enhances growth performance of broilersComparing growth performance between EN versus DN broilers is relevant, as growth performance is directly related to production costs and slaughter earnings of broiler farms. In general, broilers receiving EN compared with DN, have higher BW at placement in the broiler farm which can be maintained up to slaughter (Uni and Ferket, 2004; de Jong et al., 2017). Furthermore, broiler production costs consist of approximately 70 % of costs for feeding (KWIN, 2019), which makes improvement of feed efficiency an effective measure to reduce cost price. Using EN as a strategy to improve feed efficiency gained attention in the broiler husbandry and was also addressed in a recent meta-analysis (de Jong et al., 2017). The meta-analysis found impaired feed conversion ratio (FCR) between 0 – 42 d of age after 60 to 84 h (3.8 % increase) and after ≥ 84 h of DN (10.3 % increase). This suggests that after ≥ 60 h DN, the DN broilers become more efficient compared with EN broilers. However, EN broilers have higher BW compared with DN at 42 h, especially after long DN (> 60 h5), EN broilers have up to 8.3 % higher BW at slaughter, compared with DN broilers (De Jong et al., 2017). As feed efficiency lowers with increasing BW, the comparison of DN versus EN on feed efficiency is confounded with greater BW, and should therefore be interpreted with care. However, the observation that EN broilers are heavier at slaughter, directly implicates shorter time-to-slaughter when applying EN compared with DN, especially after prolonged DN.
The meta-analysis of studies related to EN and DN (de Jong et al., 2017) also demonstrated that prolonged DN up to 72 h results in greater relative differences in BW. This meta-analysis also demonstrated that relative differences in BW after EN compared with DN, decline with age irrespective of duration of DN, also demonstrated by others (Juul-Madsen et al., 2004; Lamot et al., 2014). For example, EN compared with DN (48 h) broilers had 17 % higher BW at 7 d of age, but this declined to 5.5 % at 42 d of age (de Jong et al., 2017). This indicates that DN, compared with EN broilers, have higher relative growth rate which can be explained by compensatory growth. Compensatory growth is defined as a deviation of a standard growth curve, or accelerated growth after illness or feed restriction (Zubair and Leeson, 1996; Hornick et al., 2000). Therefore, I investigated if compensatory growth occurs after DN compared with EN (chapter 2), and performed a meta-analysis on all collected growth performance data in this thesis (chapter 6).
5 Time between brackets represents the duration from hatch until onset of feeding.

General introduction
29
Chap
ter
1
2.2. Intestinal morphology, integrity, and microbial colonization after early nutrition2.2.1. Early nutrition stimulates onset of intestinal development after hatchDevelopment of the GIT after EN, compared with DN, has been summarized by multiple reviews (Uni and Ferket, 2004; Lilburn and Loeffler, 2015; de Jong et al., 2017). From these reviews it becomes clear that EN studies on intestinal physiology have focused on intestinal weight, length, morphology, and mucus secretion after hatch or after onset of feeding of the DN group. The observed effects disappear after approximately 7 d of age depending on the duration of DN. These early life effects of EN, compared with DN, consist of greater jejunal weight at 4 d of age in broilers (Lamot et al., 2014, up to 26 h DN), and greater total intestinal tract length (van de Ven et al., 2013, up to 48 h DN). Duodenum, jejunum, and ileum of EN compared with DN broilers (up to 36 h DN), were also reported by others to have greater absolute weight and length (Gonzales et al., 2003). In the same study, greater absorptive area due to longer villi were observed in EN compared with DN broilers, which was also reported in other studies that conducted 48 h of DN (Geyra et al., 2001; Uni et al., 2003; Smirnov et al., 2004). Others, however, found no effects of EN on absorptive area in the small intestine of broilers (Lamot et al., 2014) or ileum of turkey poults (Potturi et al., 2005), likely due to relative short durations of DN varying between 13 – 26 (Lamot et al., 2014) and 48 h (Potturi et al., 2005). Reduced numbers of goblet cells (Uni et al., 2003), but greater thickness of the mucin layer (Smirnov et al., 2004) was observed in duodenum, jejunum, and ileum of broilers. In turkey poults receiving EN, less apoptosis of enterocytes in ileum (Potturi et al., 2005) was observed compared with DN poults.
Whether EN enhances development of the intestinal tract or that early feed uptake results in earlier onset of intestinal tract development, can be debated. However, earlier onset of development after EN seems plausible. For example, the percentage of proliferating enterocytes in crypts and villi of duodenum, jejunum, and ileum was found to increase after onset of feeding in DN broilers (Geyra et al., 2001), and ileum of DN turkey poults (Potturi et al., 2005). Furthermore, all studies on effects of EN versus DN demonstrated that differences in intestinal physiology disappear within the first week after hatch, as also discussed by others (De Jong et al., 2016).
In summary, EN compared with DN likely results in early onset of intestinal development, for example greater absorptive surface area, mucus thickness and higher levels of proliferating enterocytes. The observed differences disappear within the first week after hatch, suggesting mainly short-term effects of EN on intestinal physiology.
2.2.2. Unknown effects of early nutrition on intestinal integrityAlthough the aforementioned studies indicate delayed development of the intestinal tract after DN, compared with EN, it is unknown whether intestinal integrity is affected by

Chapter 1
30
DN. This is of importance, as reduced intestinal integrity causes pathogens and smaller antigens (e.g. endotoxins) to translocate from the intestinal lumen into the bloodstream (Turner, 2009). Also in chickens this is often suggested to increase the risk of onset of infectious diseases and inflammatory immune responses, resulting in reduced growth performance (reviewed by Gilani et al., 2016). Translocation of pathogens and antigens can either be the result of damage of the intestinal epithelium, for example resulting from heavy inflammation, or excessive paracellular transport of luminal contents via tight junctions (TJ). Tight junctions are composed of transmembrane proteins that seal intestinal epithelial cells, and dynamically regulate paracellular transport of molecules (e.g. water, ions, and small nutrients) from the intestinal lumen through the epithelium into the bloodstream (Schneeberger and Lynch, 2004; Anderson and Van Itallie, 2009; Turner, 2009). Studies in humans and rodents found that during nutrient shortages, fasting, and stress responses, hormones are secreted that increase TJ pore size, facilitating greater paracellular nutrient uptake (De Punder and Pruimboom, 2015). Also in older broilers up to 42 d, fasting results in lower intestinal integrity, including greater paracellular transport of marker molecules, as a result of greater TJ pore size (Kuttappan et al., 2015; Vicuña et al., 2015; Gilani et al., 2017). Although paracellular transport was not affected after 24 h of DN (Gilani et al., 2018), prolonged duration of DN up to 72 h may still affect paracellular transport.
In summary, research on intestinal physiology after EN (intestinal length and weight, villus morphology, absorptive area, mucus dynamics, and cell proliferation and apoptosis) suggests that EN broilers are ahead in intestinal development compared with DN broilers. However, effects of EN disappear within the first week after hatch. Nutrient shortages during prolonged DN (e.g. up to 72 h), may increase paracellular transport and facilitate transport of luminal contents into the bloodstream during these first 2 weeks. Therefore, I compared paracellular transport and gene expression of TJ-related genes and genes that are involved in TJ pore-size regulation, between EN and DN broilers (chapter 3).
2.2.3. Early nutrition enhances early bacterial colonizationColonization of the GIT by commensal bacteria present on eggshells and dust starts at hatch (Apajalahti et al., 2004; Awad et al., 2016), and is further enhanced by intake of feed as a source of substrate for the colonizing bacteria or containing bacteria itself (Shapiro and Sarles, 1949). Bacterial cell numbers in different segments of the intestinal tract increase from hatch onwards and stabilize around 14 d of age in both ileum and cecum (Apajalahti et al., 2004). With regard to the composition of the intestinal microbiota, the early microbiome consists of facultative aerobic bacteria, consuming available oxygen within the intestinal lumen (Wise and Siragusa, 2007; Awad et al., 2016). The resulting lack of oxygen facilitates a shift towards obligate anaerobes, which

General introduction
31
Chap
ter
1
is most obvious in ceca, followed by the ileum (Wise and Siragusa, 2007; Awad et al., 2016). Up to approximately 14 d of age, species richness and diversity increases in both jejunum and cecum (Awad et al., 2016). Bacterial colonization has been demonstrated being essential for both GIT and immune development. In germ free mammalian models (Hooper et al., 2012; Maynard et al., 2012), which are expected being comparable with avian species (Brisbin et al., 2008), it was shown that bacterial colonization contributes to maturation of the immune system. This includes regulatory functions such as the development of regulatory T-cells and IgA secretion, and further development of effector T- and B-cells (Hooper et al., 2012; Maynard et al., 2012). Furthermore, rapid colonization by commensal bacteria may prevent colonization by pathogens via occupation of mucosal sites and competition of substrates, also known as competitive exclusion (Lan et al., 2005). Early bacterial colonization of the intestinal tract can be further enhanced by feed intake (Shapiro and Sarles, 1949), suggesting that EN may enhance bacterial colonization, and subsequent maturation of the immune system. Bacterial colonization after EN, compared with DN, has been studied in hindgut of broilers (Binek et al., 2000; Karpinska et al., 2001), and ileum of turkey poults (Potturi et al., 2005). Taken together, these studies observed lower numbers of aerobic bacteria after EN compared with DN. With regard to the aforementioned shift from facultative aerobic to anaerobic bacteria, Binek et al. (2000) observed higher numbers of anaerobic bacteria after EN. This indicates that EN enhances the shift from facultative aerobes towards anaerobic bacteria. Studies genotyping (e.g. 16S rRNA) the composition of the intestinal microbiome between EN and DN broilers are scarce. An unpublished study (Simon, 2016) revealed temporal differences in ileal microbiota composition on the family level between EN and DN broilers, at 3 and 9 d of age, but these differences were no longer present at 21 d of age. This indicates only relatively short-term effects of EN on microbiota composition, probably due to delayed colonization in DN broilers as a result of delayed feed intake. Whether these short-term differences in microbiota composition also affect maturation of the broiler’s immune system, is yet unknown. However, studies have suggested that EN, compared with DN, results in greater exposure to antigens (deriving from ingested feed and commensal bacteria), thereby facilitating accelerated development of the adaptive immune system (Juul-Madsen et al., 2004; Bar-Shira et al., 2005; Simon et al., 2014).
2.3 Immune system maturation and later life immune responses are altered by early nutritionEffects of EN compared with DN, on the immune system of broiler chickens can be divided in early life effects (immune system maturation) and later life effects (immune responses). The latter is suggested being an effect of divergent immune development

Chapter 1
32
during the early life between EN and DN broilers (Taha-Abdelaziz et al., 2018). Within this section I will summarize the current knowledge on how EN and DN affect the development of the immune system after hatch, and subsequent later life immune responses.
2.3.1. Early nutrition enhances maturation of the immune systemAt hatch, chickens possess lymphoid organs, but the immune system is not yet functional and further development is required to produce adequate immune responses (Panda et al., 2014; Taha-Abdelaziz et al., 2018). As indicated in the previous section, a link is suggested between early life bacterial colonization and immune development (Brisbin et al., 2008). Especially in mammals, germ-free models provide clear evidence that bacterial colonization is required to develop a right balance between regulatory and effector immune responses (Hooper et al., 2012; Maynard et al., 2012), but also the absence of food proteins hampered immune development in mice (da Silva Menezes et al., 2003). Specifically for chickens, immune complexes consisting of maternal antibodies and indigenous E. coli were found to stimulate B-cell differentiation in the bursa (Ekino et al., 2012; Sonoda et al., 2013). This suggests an important role for intestinal bacteria and maternal antibodies for B-cell development. Also other studies concluded that presentation of antigens to the post-hatch immune system is required for maturation of both innate and acquired immunity (Bar-Shira et al., 2003; Bar-Shira and Friedman, 2006). Whether early presentation of antigens (deriving from diet and intestinal microbiome) in EN broilers may enhance maturation of the immune system, provides an interesting line of thought and is described hereafter.
Various studies comparing immune development between EN and DN broilers, focused on weight of the bursa of Fabricius and its morphological structure. Greater weight of the bursa in EN, compared with DN broilers was observed (Dibner et al., 1998; Bar-Shira et al., 2005; Ao et al., 2012), while others found no effects (Wyatt et al., 1986; Simon et al., 2014; Shinde et al., 2015). It is unclear what have caused these inconsistencies, and it therefore might be more of interest to study morphological development of the bursa. Dibner et al. (1998) observed greater number of germinal centers from 10 d onwards in EN broilers, compared with DN broilers, and in another study (Bar-Shira et al., 2005) greater amount of both Bu-1 and CD4+/CD8+ lymphocytes in EN, compared with DN broilers, were observed from approximately 7 d of age onwards. Taken together, the greater number of germinal centers and lymphocytes indicate accelerated maturation of the bursa. Furthermore, Bar-Shira et al. (2005) demonstrated that rectal immunization with hemocyanin at 6 d of age, resulted in a greater systemic and intestinal antibody response (to hemocyanin) at approximately 12 d of age in EN, compared with DN broilers. Another study (Juul-Madsen et al., 2004) compared effects of EN with 24, or 48 h DN, and found higher number of circulating B-cells and altered CD4+ / CD8+

General introduction
33
Chap
ter
1
cell ratio in EN, compared with DN broilers. The underlying mechanism for these differences may be that the greater exposure to antigens in EN, compared with DN broilers, results in earlier onset of immune development (Bar-Shira et al., 2003, 2005; Bar-Shira and Friedman, 2006; Simon et al., 2015). However, others (Taha-Abdelaziz et al., 2018) speculate that in DN broilers, delayed development of the acquired immune system may be caused by the absence of nutrients that are required for T and B-cell proliferation just after hatch (Rudrappa and Humphrey, 2007).
In summary, EN enhances maturation of the acquired immune system compared with DN. Although the exact mechanism is not clear yet, the early presence of antigens (deriving from feed and microbiota) in EN broilers may stimulate differentiation of T and B-cells in lymphoid organs, such as the bursa, and subsequent antibody production. Furthermore, the presence of nutrients after EN may fulfill the metabolic demand for immune development.
2.3.2. Early nutrition may affect levels of antibodiesIn chickens, the antibody isotypes IgM, IgY, and IgA are present and have the same effector functions as in mammals, whereas IgY is the functional homologue of mammalian IgG (Ratcliffe, 2006). Antibodies play a key role with regard to host defense and maintenance of immune homeostasis. Binding of pathogens by antibodies results in neutralization and facilitates innate immune responses such as phagocytosis and activation of the complement system via the classical pathway (Tizard, 2018). Antibodies are present as the B-cell receptor (BCR) on B-cells and are secreted by plasma cells. B-cells are stimulated to differentiate into antibody producing plasma cells and memory B-cells after antigen presentation towards the B-cell. Stimulation of B-cells occurs either via direct stimulation of BCR by antigens, or indirectly via presentation of the antigen by Th2 cells (Tizard, 2018). Mammalian B-cells possess toll-like receptors (TLR) recognizing microbial associated molecular patterns (MAMP), such as LPS or CpG oligo-nucleotides (Baumgarth, 2011). After BCR triggering by an antigen, co-stimulation of TLR by LPS or CpG was demonstrated to be required for induction of differentiation and proliferation of naïve B-cells (Bernasconi et al., 2003; Ruprecht and Lanzavecchia, 2006). Stimulation of TLR on memory B-cells was found to be required for differentiation and proliferation to maintain immunological memory (Bernasconi et al., 2002). Also in chicken’s B-cells, this mechanism is suggested to be present (St. Paul et al., 2012). It is therefore tempting to speculate that greater amounts of MAMP due to increased bacterial load after EN compared with DN, result in greater stimulation of TLR on naïve B-cells and subsequent differentiation, resulting in greater antibody production.
Antibodies can be subdivided based on the type of antigen they bind: specific antibodies (SpAb), natural antibodies (NAb), and natural auto-antibodies (NAAb). During a

Chapter 1
34
classical immune response towards an exogenous antigen, B-cells differentiate into plasma cells producing specific antibodies (SpAb), with high affinity towards this antigen, resulting in neutralization and removal of the antigen. Yet, the number of studies comparing SpAb responses between EN and DN broilers are scarce, and are inconsistent in their results (Juul-Madsen et al., 2004; Bar-Shira et al., 2005; Simon et al., 2015; Lamot et al., 2016). Whereas SpAb are produced during immune responses after exposure to an exogenous antigen, NAb bind antigens that have not been exposed to the host before (Parmentier et al., 2004). In laying hens, high systemic NAb levels were found associated with greater survival during rearing (Star et al., 2007; Sun et al., 2011), and after an avian pathogenic E. coli challenge (Berghof et al., 2019). Therefore, NAb could be considered as an important first line of defense. Greater levels of NAb in broilers, may therefore contribute to better disease resistance. Studies comparing NAb levels in EN versus DN in early life broilers are, however, scarce. Levels of KLH-binding NAb were lower in EN, compared with DN broilers at 14 d of age, but not in younger broilers (Simon et al., 2014). Other studies investigated levels of KLH-binding NAb during later life (≥ 21 d) immunizations with LPS + HuSA (Simon et al., 2015) or SRBC (Lamot et al., 2016), but found no effects among EN and DN broilers. Whereas SpAb and NAb bind exogenous antigens, natural auto-antibodies (NAAb) bind indigenous (“self ”) antigens, also called auto-antigens (de Jong et al., 2013; Van Dijk and Parmentier, 2020). Natural auto-antibodies bind cell debris and thereby facilitate phagocytosis and clearance of auto-antigens, preventing unwanted immune responses to self (Lutz, 2007; Xu et al., 2015). Therefore, NAAb are suggested to be involved in regulation of immune responses and auto-immune diseases, as studied in humans (Nagele et al., 2013). In broilers, due to their relatively short live span, the occurrence of auto-immune diseases is not expected but should not be excluded. The high metabolic activity due to the high growth rates in broilers, may cause tissue damage, which may require NAAb, but has not been studied yet. Furthermore, no studies have been conducted that compared NAAb levels of EN versus DN broilers. However, recent research demonstrated the role of intestinal microbiota for stimulation of NAAb producing B-cells (Kreuk et al., 2019), suggesting that accelerated bacterial colonization in EN broilers may affect NAAb levels.In summary, higher numbers of B-cells are demonstrated in the bursa after EN, compared with DN, resulting in elevated SpAb responses in EN broilers after immunization during the first two weeks of age, but not at later ages. Whether greater number of B-cells after EN affect the development of circulating antibodies such as NAb and NAAB, and how these may contribute to coping with later life immune challenges, is unclear. Therefore I studied development of systemic NAb and NAAb levels during the early and later life in EN and DN broilers in chapter 4.
2.3.3. Modulating later life immune responses via early nutritionIn this thesis, later life immune responses are defined as responses towards antigens that

General introduction
35
Chap
ter
1
are presented after the majority of maternal antibodies has been reduced, and endogenous antibody (secreted by plasma cells) production has started, which can be expected to start at approximately 21 d of age (Lammers et al., 2010; Simon et al., 2014). Also from this age, commercially kept broilers commonly face multiple challenges such as coccidiosis infection and bacterial dysbiosis, which may result in (necrotic) enteritis and wet feces (Van Immerseel et al., 2009; Teirlynck et al., 2011). Therefore, it is of interest to know whether immune development in early life after EN compared with DN, allows broilers to cope better with later life immune challenges. Broilers that received EN compared with DN, were found to differ minimally in ileal cytokine expression (Simon et al., 2014), and circulating levels of NAb (Simon et al., 2014, 2015; Lamot et al., 2016). Dibner et al. (1998), however, suggested higher levels of biliary IgA after EN, compared with DN, from approximately 8 d of age, while Simon et al. (2014) found no effects of EN on IgA+ plasma cells in ileum from 21 d of age onwards.
After an overdose (100 x) of a coccidiosis vaccine at 14 d of age, broilers that received EN had greater BW and improved feed efficiency compared with DN, at 20 d of age (Dibner et al., 1998). Although no immune parameters were measured during this challenge, these data suggest that EN broilers are better able to cope with coccidiosis infections. In a more recent study (Simon et al., 2015), humoral immune responses after LPS + HuSA immunization (28 d of age) were compared between EN and DN broilers, housed in either a low (cage-housing) or high antigenic (floor-housing) pressure condition. Interestingly, the authors observed that differences among EN and DN were most pronounced when housed in floor pens as compared to cage housing, showing lower levels of IgY binding HuSA in EN, compared with DN broilers. Furthermore, BW gain and feeding motivation of DN broilers was severely depressed after immunization, compared with EN broilers. Another study comparing antibody responses after SRBC immunization, found no differences among EN and DN broilers (Lamot et al., 2016).
Taken together, this leads to the formulation of two different hypotheses. Firstly, later life SpAb responses can be modulated by EN resulting in higher levels of biliary IgA (Dibner et al., 1998) and lower levels of IgY (Simon et al., 2015), as a result from greater antigen exposure after hatch in EN, compared with DN broilers, due to feed intake (Binek et al., 2000; Karpinska et al., 2001; Potturi et al., 2005; Simon et al., 2016). Secondly, differences in later life antibody responses between EN and DN broilers may be more pronounced when broilers are housed in an environment with high antigenic pressure. These differences in immune status and response, may contribute to smaller depression of growth performance during immunological challenges, as observed before (Simon et al., 2015). Therefore, I studied levels of systemic antibodies (chapter 4) and growth performance (chapter 5) between EN and DN broilers housed under high and low antigenic pressure

Chapter 1
36
Various studies have shown a “developmental window” during the first 3 d after hatch to modulate later life antibody responses. Feeding a model antigen during the first 3 d of age was shown to reduce antibody titers against this antigen after subsequent later life immunization (Klipper et al., 2001; Ifrah et al., 2016), which is regarded as oral tolerance in several studies (Klipper et al., 2001; Friedman, 2008; Yuan and Li, 2012; Ifrah et al., 2016). Oral exposure to a broad range of antigens, derived from both ingested feed and the intestinal microbiota, during the first 3 d of age, may thus modulate the immune responses towards the same antigens during later life. It is tempting to speculate that broilers receiving EN, compared with DN, have greater oral exposure to antigens, and therefore have modulated antibody responses in later life. Therefore, I studied in chapter 5 whether EN, compared with DN, modulates antibody responses in broilers that were previously exposed to an orally administered antigen within the developmental window (0 to 3 d post hatch). In a subsequent experiment in chapter 5, I tested whether differences in oral antigen exposure by means of EN versus DN, resulted in reduced antibody responses under high and low environmental antigenic pressure.
3. Aim and outline of this thesis
Broiler chickens may have either early (EN) or delayed (DN) access to nutrition after hatch. Efforts to implement EN have resulted in various systems that facilitate direct access to feed and water after hatch, taking place at either the hatchery or in the broiler house. Recent legislation compels access to nutrition within 36 h after hatch, instead of 60 h, which may further stimulate application of EN in commercial husbandry. The available literature describes typically positive effects of EN compared with DN, summarized as improved growth performance and accelerated maturation of the intestinal tract and immune system. With regard to the intestinal tract and immune system, the described effects are however often short-term.
Currently, it is unknown whether compensatory growth in present in DN compared with EN broilers, and whether intestinal integrity is impaired by DN or not. With regard to the immune system, EN enhances bacterial colonization of the GIT, which seems to accelerate immune development. It is unknown, however, how this modulates later life immune responses and shapes the antibody repertoire (including NAb and NAAb) in early and later life, and its interaction with environmental antigenic pressure.
The overall aim of this thesis is to provide deeper insight in effects of EN compared with DN on growth performance, GIT development, and immune development and subsequent immune responses. These insights may facilitate evidence based decision making on broiler farms with respect to application of EN.

General introduction
37
Chap
ter
1
Experiment I Experiment II Experiment III Experiment IV
EN vs. DN (38 h)*
Transport1 (0 vs. 3 h)EN vs. DN (72 h)
EN vs. DN (72 h)*
BSA vs. PBS feeding2
EN vs. DN (72 h)*
HSC vs. LSC3
Growth performance and fear responses
Chapter 2
Intestinal integrityChapter 3
Oral tolerance and antibody responses under different sanitary conditions
Chapter 5
Antibody levels4
Chapter 4
Figure 2: Graphical abstract of experiments conducted with their respective treatments and subject, and how these are incorporated in this thesis. 1Transport was conducted after all chickens had hatched. 2BSA: bovine serum albumin, PBS: phosphate buffered saline as control. 3LSC: low sanitary conditions, HSC: high sanitary conditions. 4Specific, natural, natural auto-antibodies, including maternal antibodies.
The studies described in this thesis are conducted on fast-growing broiler chickens (Ross 308) all incubated in commercial broiler hatcheries in the Netherlands. In the experiments described in chapter 2 and 3, 18 d incubated eggs were hatched on the experimental facility and were subsequently subjected to EN or DN within 3 h after hatch. A graphical abstract of the conducted studies and how these are embedded in this thesis is given in Figure 2. Chapter 2 describes the first study investigating effects of EN and transport separately on growth performance (including compensatory growth) and fearfulness in early and later life. Broilers received either EN or DN, and post hatch holding and transport was simulated for 3 h. In chapter 3, I studied whether early life feeding strategy influenced intestinal integrity. At 4, 10, and 14 d of age, broilers received an oral pulse dose with FITC-d, a marker molecule that can only enter the blood circulation via TJ. Concentration of FITC-d in the blood thereby reflects the degree of paracellular transport.
Next to FITC-d measurements, expression of TJ genes and genes involved in TJ regulation was measured at 4 d of age. In the experiments described in chapter 4 and 5, freshly hatched broilers (≤ 3 h after hatch) were obtained from the hatchery and either received EN or DN upon arrival at the experimental facility. In chapter 4, levels of systemic antibodies were studied between EN and DN broilers, housed under either high or low environmental antigenic pressure, with respect to early and later life. At 3 d of age, a contrast in antigenic pressure was obtained by either insertion of used litter from commercial broiler farms every 4 d (LSC), or not (HSC), up to 35 d of age. Levels of circulating specific antibodies were measured after SRBC immunization, while levels of NA(A)b were measured during the early (7 d) and later (33 d) life. Chapter 5 describes two separate studies on modulation of antibody responses by means of early post hatch

Chapter 1
38
feeding of the antigen BSA. Therefore, an existing model to study oral tolerance was adapted from literature (Klipper et al., 2001). During the first 3 d of age (parallel to the 72 h of DN; within the developmental window), broilers received 6 successive oral feedings with BSA, or a negative control (PBS). At 24 d of age, broilers were immunized with both BSA and RGG, and antibody responses towards BSA or RGG were studied. At the end of the experiment (42 d), bile was collected to measure levels of IgA binding BSA or RGG. This experiment was repeated to better understand effects of post-hatch oral antigen exposure on modulation of immune responses in EN and DN broilers housed in either HSC or LSC. In the general discussion (chapter 6) I integrate the findings of the aforementioned studies and their implications and perspectives for future research and commercial broiler husbandry.

General introduction
39
Chap
ter
1

CHAPTER 22

Effects of early nutrition and transport of 1-day-old chickens on production performance and fear response
M. S. Hollemans1,2,3, S. de Vries3, A. Lammers1, C. Clouard1
1 Adaptation Physiology Group, Wageningen University2 Coppens Diervoeding B.V.3 Animal Nutrition Group, Wageningen University
Poultry Science (2018) 0:1-9DOI: 10.3382/ps/pey106

Chapter 2
42
Abstract
The importance of optimal early life conditions of broilers to sustain efficient and healthy production of broiler meat is increasingly recognized. Therefore, novel husbandry systems are developed, in which immediate provision of nutrition post hatch is combined with on-farm hatching. In these novel systems, one-day-old-chick handling and transport are minimized. To study whether early nutrition and reduced transport are beneficial for broiler performance and behavior, the effects of early or delayed nutrition and post-hatch handling and transport were tested from hatch until 35 d of age, in a 2*2 factorial arrangement. In total, 960 eggs were hatched in 36 floor pens. After hatch, chicks were given immediate access to water and feed (early nutrition) or after 54 h (delayed nutrition). Eighteen hours after hatch, chicks remained in their pens (non-transported control), or were subjected to short-term handling and transport to simulate conventional procedures. Subsequently, chicks returned to their pens. Compared with delayed-fed chickens, early-fed chickens had greater body weight up to 21 d of age, but not at slaughter (35 d of age). No effects of transport or its interaction with moment of first nutrition were found on performance. At 3 d post hatch, transported, early-fed chicks had a greater latency to stand up in a tonic immobility test than transported, delayed-fed chicks, but only in chicks that were transported. At 30 days post hatch, however, latency was greater in transported, delayed-fed chickens than in transported, early-fed chicks. This may indicate long-term deleterious effects of delayed nutrition on fear response in transported chickens. It is concluded that early nutrition has mainly beneficial effects on performance during the first two weeks post hatch, but these beneficial effects are less evident in later life. The combination of transport and early nutrition may influence the chicken’s strategies to cope with stressful events in early and later life.

Early nutrition and transport
Chap
ter
2
43
1. Introduction
The majority of broiler chickens hatch in conventional hatcheries after 19 to 21 days of incubation, having a hatch window of approximately 24 to 48 hours (h) (Careghi et al., 2005; Jacobs et al., 2016). The length of the hatch window is mainly affected by parent stock and incubation conditions (Lourens et al., 2005). During hatch in conventional hatchers, chicks have no access to nutrition until placement at the farm, which is considered suboptimal for broiler development and health (Uni et al., 2003b; Bar-Shira et al., 2005; Van De Ven et al., 2011; Simon et al., 2015). At the end of the hatch window, all chicks are simultaneously pulled and processed (e.g. sorting, sexing, counting, vaccinating) following standard procedures, stored for approximately 1 – 4 h, and transported to broiler farms.
Immediate post hatch provision of nutrition (water and feed) has been suggested to improve intestinal (Lilburn and Loeffler, 2015) and immunological development (Panda et al., 2014). Previous studies (Gonzales et al., 2003; Van De Ven et al., 2011; Simon et al., 2014, 2015) showed that effects of early nutrition on performance parameters seem to vanish in later life, making the long-term benefits of early nutrition on performance unclear. Practical implementation of early nutrition is implemented by hatching eggs within a broiler house (on-farm hatching), or supplying water and feed in the hatcher. Both systems are meant to provide hatchlings with immediate access to nutrition.
Various studies suggest that one-day-old chick transport may have negative effects on production performance and the chickens’ ability to cope with stress, depending on transport duration (Valros et al., 2008; Mitchell, 2009; Bergoug et al., 2013; Jacobs et al., 2016). A drawback from these studies is that the effects of moment of first nutrition and transport are confounded, as the chicks that were subjected to a longer transport duration also did not have access to nutrition. It is therefore not clear whether the observed effects were caused by transport or delayed access to nutrition. Furthermore, to our best knowledge, interactions between access to nutrition and transport have not been studied so far.
The aim of the current study was to examine the effects of early nutrition and one-day-old-chick handling and transport, as well as their interaction, on growth performance and fear response of chickens in early and later life. Because both nutrition and transport in early life may affect neural and cognitive development (Candland et al., 1963; Jones and Waddington, 1992), we hypothesize that the chickens’ fear reactions in a stressful situation will be affected by early life nutrition and transport procedures. Therefore, a tonic immobility test was performed to gain preliminary insights in the fear response (Forkman et al., 2007) of the chickens in early and later life.

Chapter 2
44
2. Materials and methods
2.1. Experimental designEffects of delayed (DN) or early nutrition (EN) and no transport (NT) or transport (T) of one-day-old chicks were tested in a 2*2 factorial arrangement. This resulted in 4 treatment groups (DN|NT; DN|T; EN|NT and EN|T). In Figure 1 the start and duration of these interventions are presented. Chick ages are expressed as chronological age (Careghi et al., 2005), starting from the end of the hatch window (0 d) until slaughter (35 d), unless specified otherwise.
2.2. Housing and dietsThe facility consisted of 36 floor heated pens (1.55 * 0.95 m) covered with wood shavings. Before egg arrival, the bedding was covered with chick paper to prevent any litter uptake by the chicks. HatchCare baskets (HatchTech B.V., Veenendaal, The Netherlands) consisting of a chicken basket and an overlay egg tray were placed in each pen. Depending on the treatment, egg trays were filled with a commercial starter diet (EN) or left empty (DN), and 2 drinking nipples were attached to the basket (EN) or not (DN). Diets were produced by Research Diet Services (Wijk bij Duurstede, The Netherlands). Floor temperature was 34 °C and ambient temperature was controlled at 36 °C. Average humidity (27.4 ± 2.6 %) and CO2 (1100 ± 156 ppm) levels were logged from placement until hatch. As a result of minimal ventilation, air speed was negligible. Embryonic temperature of 3 eggs per treatment was monitored indirectly by egg shell temperature (EST) and recorded every 5 min until hatch. EST sensors (NTC Thermistors: type DC 95, Thermometrics, Somerset, UK) were attached to the egg following procedures of Maatjens et al. (2016b). EST was maintained between 35.3 and 36.7 °C by manually adjusting floor heating and ventilation before and during hatch, based on recommendations of Maatjens et al. (2016a; b).
After hatch, and before the chicks were taken out of the baskets and placed into the pen, each pen was provided with 2 trough feeders, and chick paper was removed.
Until 7 d post chick placement, 2 additional round feeding plates were placed in the pen to enhance feed uptake. A three-phase feeding schedule was applied including a starter, grower, and finisher diet (Table 1). Water was provided ad libitum by 2 drinking nipples per pen. From egg placement until end of hatch, the experimental room was lighted continuously with a light intensity varying between 20 and 40 lux on the egg and animal level. After placement, a 16-h light : 8-h dark schedule was applied.

Early nutrition and transport
Chap
ter
2
45
2.3. Animals and treatmentsIn total, 960 incubated and candled eggs (embryonic age: 18 d) were obtained from a commercial hatchery (Probroed & Sloot, Langenboom, The Netherlands) and transported in a climate conditioned van (34 °C) to the research facility. Eggs were produced by a 50-week-old Ross 308 parent stock. All eggs were randomly assigned to one of the 4 treatments, with 27 eggs per pen, except for 4 pens (1 per treatment) in which 24 eggs were placed, resulting in 9 replicates per treatment group.
During their stay in the hatching baskets, water and feed were provided ad libitum to the EN groups, while DN groups did not receive any form of nutrition. To simulate post hatch holding and transport, all T groups were moved to an unconditioned room (20 °C, no air circulation, continuous lighting) and kept for 1.5 h in their original hatching baskets. Subsequently, the baskets with chicks were placed in a climate controlled chick transport van (33 °C; dark) and transported for 1 h. After transport, baskets were moved to their original pens and, after 0.5 h, all baskets were emptied allowing all chicks ad libitum access to water and feed. Thus, the period of handling and transport simulation was 3 h. NT groups remained in their hatching baskets within the barn according to conditions described in “housing and diets” and were placed in the pens simultaneously to the T groups. The experiment was performed according to the Guide For the Care and Use of Agricultural Animals in Agricultural Research and Teaching (2010).
2.4. Measurements2.4.1. Eggs and chick qualityAfter arrival at the research facility, eggs were weighed per pen. Sixty hours after placement of the eggs, i.e. just before transport simulation, the number of unhatched eggs were counted and collected for break-out, to determine the cause of not hatching. Chick quality of the hatched chicks was assessed before transport simulation, using chick length and navel score (n = 100 per treatment group), according to Maatjens et al. (2016b). Cloacal temperature was measured in 97 randomly selected chicks divided over 28 pens. Chicks with chick length lower than 17 cm or malformations (e.g. open navel) were classified second grade, and removed from the study (Tona et al., 2004). All non-hatched eggs (n = 19) were opened to determine the reason of not hatching.
2.4.2. PerformanceAverage body weight (BW) was evaluated per pen at 0, 3, 7, 14, 21, 28 and 35 d post placement to calculate average daily gain (ADG). Relative ADG of each week was calculated as follows:

Chapter 2
46
Relative ADG =
BWendBWstart( * 100)
7
Average daily feed intake (ADFI) and feed efficiency (G:F) were determined per pen at 3, 7, 14, 28 and 35 d post placement.
2.4.3. Tonic immobilityTonic immobility tests were performed at 3 and 30 d post placement on 2 chickens per pen from 7 randomly chosen pens per treatment. Different chickens were selected for the measurements at 3 and 30 d, to prevent habituation to the procedure (Jones, 1986). Results were averaged for each pen, resulting in 7 observations per pen. The procedure was adapted from Valros et al. (2008) with minor modifications. Briefly, one chicken was taken from the home pen and transferred in a bin to a quiet testing room, to ensure isolation from the flock. There, the chicken was restrained on the back for 10 s, using one hand to hold the chest and one to cover the neck and head. All tests were performed by the same experimenter and observer, who did not made direct eye contact with the chicken during both handling and testing. Experimental conditions were similar at both 3 and 30 d of age (i.e. same procedure of handling and transport to the test room (Jones and Waddington, 1992)). If the chicken stood up within 10 s after the end of restraining, the restraint was carried out again up to a maximum of 5 times. After 5 attempts, the test was stopped and the chicken was placed back in the home pen and recorded as missing value. The chicken was judged immobile when it stayed down for at least 10 s after removal of the hands. The latency (s) from immobility until standing was recorded. If the latency of immobility was ≥ 300 s, the test was stopped and the maximum latency of 300 s was noted.
2.5. Statistical analysesData were processed and analyzed using SAS 9.3 software (SAS, 2011). Model residuals were inspected for outliers using histograms and QQ-plots. In total, 1 data point was removed because of erroneous recordings. Model residuals were tested to meet assumptions for homogeneity and normality. If needed, logarithmic or square root transformation was applied to normalize the data. Pen was the experimental unit, except for analyses of chick quality parameters, for which individual chicken was the experimental unit. All data are expressed as means and standard deviations.
Effects of treatments on ADG, relative ADG, ADFI and G:F were analyzed using a generalized linear mixed model (PROC GLIMMIX). Fixed factors were moment of feeding, transport, age, and the interaction between moment of feeding, transport, and age. Pen was included as random effect and age was modelled as R-side effect to account for repeated observations within pen. The covariance structure was selected based

Early nutrition and transport
Chap
ter
2
47
on assessing variograms, resulting in using a first order heterogeneous autoregressive structure (Wang and Goonewardene, 2004).
Effects of treatments on BW were analyzed per time point, due to heterogeneous variation between ages. Data were analyzed using a general linear model (PROC GLM) with moment of feeding, transport, and the interaction effect between moment of feeding and transport as fixed effects and pen as random effect.
Fixed effects of treatments (DN|NT; DN|T; EN|NT and EN|T) on the latency to stand up during the tonic immobility test were analyzed using a non-parametric Kruskal-Wallis H test, followed by two-by-two comparisons with a Mann-Whitney U test, when appropriate.
Data are presented as means and standard deviation, unless stated otherwise. Differences among means with P < 0.05 were considered statistically significant. Differences P < 0.10 were considered to represent statistical tendencies.
3. Results
3.1. Egg and hatching parametersThe length of the hatch window (HW) of the chicks was approximately 33 h (latency in between first and last hatch), therefore, the time between end of HW and start of transport simulation was 18 h. As time of transport simulation was 3 h, we estimate the delay in nutrition to be between 54 for the first hatchers and 21 h for the last hatchers.
Chick quality after hatch (60 h after placement of the eggs of 18d), before transport, is presented in (Supplementary Table 1). Average cloaca temperature immediately after placement was 0.7 °C higher (F1, 81 = 6.67, P < 0.001) in the EN groups compared with the DN groups. Of the non-hatched embryos, 10.5% (n = 2) did not turn, 10.5 % (n = 2) died during external pipping, 63 % (n = 12) were underdeveloped or malformed, and 16 % (n = 3) were found to be slow hatchers or had a damaged egg shell. After hatch, 1 chick was removed as it was classified second grade. Each pen contained between 23 and 27 chicks after hatch.
3.2. PerformanceNo interactions between moment of access to nutrition and transport were found on performance. BW was significantly greater (46 g) for EN chicks until at least 28 d (F1, 32 = 4.38, P = 0.045) compared with the DN chicks (Table 2). At slaughter (35 d), there was no significant difference between EN and DN chicks (F1, 32 = 2.13, P = 0.152). In

Chapter 2
48
Table 3, it is shown that moment of feeding affected ADG and ADFI, with a significant greater ADG at 0 – 3 and 3 – 7 d (1.3 and 1.4 g/d, respectively) in EN chicks than in DN chicks. Furthermore, relative ADG was significantly (F1, 170 = 4.38, P < 0.001) higher in DN chicks compared with EN chicks, from 0 until 14 d of age (Figure 3). G:F ratio was not affected by treatment. No effects of transport were found on BW (Table 2) or ADG, ADFI and G:F (Table 4).
3.3. Tonic immobilityLatencies to stand up after inducing tonic immobility are presented in Figure 2. Within transported chicks, at 3 d, latency to stand up was lower in the DN group compared with the EN group. At 30 d, DN|T chicks took more time to stand up than EN|T chicks. No differences of latency to stand up were found between EN and DN groups that were not subjected to transport. No significant correlations between body weight and latency to stand up were found (data not shown).
4. Discussion
This study shows that EN affects production performance in early life, but not in later life, which is consistent with prior research (Gonzales et al., 2003; Juul-Madsen et al., 2004; Van De Ven et al., 2011; Simon et al., 2014, 2015). It should be noted, however, that, in our study and those of others, chickens were kept at relatively non-challenging, experimental conditions. Effects of EN on later life production performance in more challenging, i.e. field conditions, can therefore not be excluded, which can be suggested from Simon et al. (2015). Transport, and its interactions with moment of first nutrition did not affect production performance. The analysis of the latencies to stand up after tonic immobility suggests that EN and DN chicks express a different fear response after transport at different ages. To the best of our knowledge, this study is the first to investigate effects of early nutrition and transport separately. This is in contrast to prior research on post-hatch transport, where effects of transport were confounded with nutritional effects (Valros et al., 2008; Bergoug et al., 2013).
4.1. Chick quality and progress of grow-out periodOur results indicate that chick quality was identical in the different treatment groups. The increased cloacal temperature in EN chicks compared with DN chicks, is presumably due to heat generated by metabolism (Van den Brand et al., 2010). This increase in body temperature in day-old chicks can be favorable, as these chicks might be less susceptible to temperature changes during transport and brooding.

Early nutrition and transport
Chap
ter
2
49
4.2. Moment of first nutrition * transportAt 3 d of age, latency to stand up after tonic immobility was higher in EN|T chicks than in DN|T chicks. Although latency to stand up after tonic immobility is known to be a valid measure of fear levels in chickens (Jones and Mills, 1983; Forkman et al., 2007), no consensus has been reached concerning the validity of the TI test in very young chickens (Ratner and Thompson, 1960; Salzen, 1963; Forkman et al., 2007). We, however, observed typical signs of immobility, such as no movement, and extended legs with tremor (Jones, 1986; Heiblum et al., 1998) at 3 d of age. This seems to support the validity of the TI test to assess fear levels in very young chicks, too. The higher latency to stand up after tonic immobility in 3-day-old EN|T chicks compared with DN|T chicks may therefore indicate that EN|T chicks were more fearful than DN|T chicks in early life.
That EN|T chicks expressed higher fear responses than DN|T chicks at 3 d might result directly from the impact of early nutrition on brain and cognitive development and, thus, on the ability for chicks to express fear responses at such a young age. Various studies (Candland et al., 1963; Andrew and Brennan, 1983; Cashman et al., 1989) have shown that fear responses develop parallel to body development. It is possible that a delay in access to nutrition might have led not only to impaired body and organ (brain) development, but also to a delayed development of fear-related behavior in DN chicks. Alternatively, early access to water and feed might have acted as an early life environmental enrichment, thus stimulating brain development and the early ability to express early fear responses in EN chicks (Jones and Waddington, 1992).
Unlike at 3 d of age, latency to stand up was shorter in the EN|T chicks compared with DN|T chicks at 30 d post placement, suggesting that EN|T chicks were less fearful than DN|T later in life. Although it remains unclear why the impact of early nutrition in transported chicks was reversed from 3 d to 30 d, our results seem to indicate that early nutrition provided long-term advantages for the chicken’s ability to cope with stress later in life.
It is worth noting that differences in fear responses between EN and DN chicks were only found in chicks that have been transported in early life. This implies that handling and transport at very young ages may accentuate the impact of early or delayed nutrition on the chickens’ fear responses in both early and later life. Accordingly, research has shown that stressful early life events (e.g. transport) can alter TI responses in chickens in later life (Al-Aqil et al., 2009) and brain development in rodents and humans (Teicher et al., 2003; Hoeijmakers et al., 2014). Although additional research using alternative fear tests would be needed to confirm the short- and long-term impact of early nutrition on fear responses of transported chicks, the reported findings could have important

Chapter 2
50
implication for hatcheries, chick transporters or slaughterhouses. For instance, our findings indicate that EN|T chicks may be able to cope better with stressful events in later life, such as thinning and pre-slaughter procedures (Jacobs et al., 2017).
4.3. Moment of first nutritionThe lower BW of DN chicks until 28 d of age is consistent with previous research (Juul-Madsen et al., 2004; Van De Ven et al., 2011; Lamot et al., 2014), and might be explained by impaired organ and body development and dehydration during feed and water deprivation (Uni et al., 2003a; b; Smirnov et al., 2004; Lamot et al., 2014; Lilburn and Loeffler, 2015). The significant higher relative ADG in EN chicks compared with DN chicks from 0 to 14 d of age (Figure 3), might indicate compensatory growth of DN chicks (Zubair and Leeson, 1996).
4.4. TransportOur results suggest that short-term holding time and transport simulation (3 h) do not affect early and later-life performance. This seems to be in contrast with other studies. Bergoug et al. (2013) transported broiler chicks from the hatchery under controlled climate conditions (0, 4, and 10 h transportation time) to an experimental facility and found that NT chicks had increased BW compared with T chicks until 21 d post hatch ADFI or G:F were not affected. Valros et al. (2008) found negative effects on fear-related behavior (e.g. latency to perch after transport, and latency to stand up after tonic immobility at 34 d post hatch) with increasing transport duration (4 and 10 h), but not on body weight. As no non-transported control was included in this study, effects of transport relative to no transport are unknown. As none of the above mentioned studies accounted for moment of access to nutrition after transport, the long-transported chicks were also deprived longer from nutrition than short-transported chicks. Therefore, the effects of transport reported in these studies could actually reflect the effect of DN instead of that of transport. This is in line for performance of the DN groups in the current study. We suggest that climate controlled transport of one-day-old chickens does not affects performance, as long as nutrition is provided. This is probably due to the fulfillment of the chicken’s needs. Further investigation is required to explain why transport on itself does not result in differences in production performance.
5. Acknowledgements
The authors are grateful to Conny Maatjens, Carla van der Pol, and Inge van Roovert-Reijrink (HatchTech B.V., Veenendaal, The Netherlands) for critical review of the experimental setup and technical assistance during the experiment. Furthermore, Lotte Schakel is kindly acknowledged for her help during the experiment and data processing

Early nutrition and transport
Chap
ter
2
51
within her MSc thesis project. The accurate animal caretaking by Carin and Theo Nooijen is greatly appreciated.

Chapter 2
52
Tables and Figures
Table 1: Composition of starter (0 – 14 d) grower (14 – 28 d) and finisher (28 – 35 d) diets (%, as-fed basis, unless indicated otherwise).
Starter Grower FinisherIngredients Wheat 41.39 50.59 56.52 Soybean meal 23.66 23.19 22.70 Maize 20.00 15.00 10.00 Soybean oil 4.26 5.22 5.82 Soy protein concentrate (CP: 55%) 1.50 1.00 1.50 Fishmeal 2.50 - - Potato protein 2.50 1.00 - Mineral and vitamin premix1 0.50 0.50 0.50 L-Lysine 0.17 0.31 0.27 DL-Methionine 0.28 0.31 0.29 L-Threonine 0.08 0.14 0.13 Limestone 1.34 1.20 1.01 Monocalcium phosphate 1.29 0.98 0.79 Sodium bicarbonate 0.27 0.33 0.31 Sodium chloride 0.07 0.07 0.08 Xylanase2 0.02 0.02 0.02 Anti-coccidiostat3 0.06 0.06 - Sodium butyrate coated 0.10 0.08 0.05Calculated nutrient composition4 Moisture 11.7 11.9 11.8 Crude protein 22.5 20.0 19.5 Digestible lysine 5 12.0 11.0 10.3 Digestible methionine + cysteine 5 8.9 7.9 7.5 Digestible threonine 5 8.0 7.2 6.9 Crude fat6 7.3 7.9 8.6 Crude fiber 2.5 2.6 2.6 Ash 5.8 4.9 4.8 Starch7 36 38.4 38.1 DE (kcal)5 3,000 3,040 3,080 Calcium 9.0 7.0 6.5 Available phosphorus 4.1 3.2 3.0
1 Containing Vitamin A (2,500,000 IU); D3 (600,000 IU); E (3,350 IU); K3 (600 mg); B1 (600 mg); B2 (1,500 mg); B6 (800 mg) ; B12 (6,000 mg); niacin (9,000 mg); panthothenic acid (2,000 mg); biotin (100,000 mg); choline chloride (100,000 mg); Mn (17,000 mg); Zn (18,000 mg); Cu (3,000 mg); Fe

Early nutrition and transport
Chap
ter
2
53
(16,000 mg); I (400 mg); Se (50 mg).2 Commercial bacterial endo-1,3-β-xylanase (Belfeed, Agrimex N.V., Lille, Belgium).3Starter diet: Mixture of 45 mg narasin and 45 mg nicarbazin /kg feed (Maxiban, Elanco, Greenfield, USA); Grower diet: Salinomycin (72 mg/kg feed) (Sacox, Huvepharma, St. Louis, USA).4 Calculated based on feed table of Schothorst Feed Research (2015) and specified in g/kg unless specified otherwise.5 Apparent total tract digestibility.6 Ether extract with acid hydrolysis (ISO 6492).7 Amyloglucosidase method (ISO 15914)

Chapter 2
54
Tabl
e 2:
Bod
y w
eigh
t of
chic
kens
that
rec
eive
d on
e of
4 tr
eatm
ents
gro
ups
(DN
| N
T, E
N |
NT,
DN
| T
or
EN
| T
). (
DN
= d
elay
ed n
utri
tion
; EN
= e
arly
nu
trit
ion;
NT
= n
o tr
ansp
ort;
T =
tran
spor
t; n
= 9
pen
s pe
r tr
eatm
ent)
.
Tr
eatm
ent
Eff
ects
1
DN
| N
T
DN
| T
EN
| N
T
EN |
T
Age
(d)
M
ean
SD
Mea
nSD
M
ean
SD
Mea
nSD
Fe
edin
g *
Tran
spor
tFe
edin
gTr
ansp
ort
0
42.7
0.9
42
.9
0.9
48
.9
1.6
48
.6
1.9
0.
539
< .0
001
0.99
53
80
2
81
2
90
6
914
0.
850
< .0
001
0.43
97
17
95
18
2 4
19
5 10
19
78
0.
897
< .0
001
0.38
414
48
4 15
49
8 20
50
6 16
51
413
0.
571
< .0
001
0.05
221
10
23
38
1015
22
10
47
32
1053
29
0.53
70.
005
0.93
028
15
9666
16
08
53
1652
87
16
4352
0.
923
0.04
50.
637
35
2163
79
2158
75
2192
88
2204
61
0.74
70.
154
0.87
41 M
odel
-esta
blish
ed p
-val
ues f
or fi
xed
effec
ts of
mom
ent o
f firs
t nut
ritio
n (w
ater
and
feed
), tr
ansp
ort,
and
thei
r int
erac
tion.

Early nutrition and transport
Chap
ter
2
55
Tabl
e 3:
Ave
rage
dai
ly g
ain,
ave
rage
dai
ly fe
ed in
take
and
gai
n to
feed
ratio
of
chic
kens
that
rece
ived
del
ayed
nut
ritio
n (5
4 h)
or i
mm
edia
te n
utrit
ion
afte
r hat
ch.
Age
(d)
Tr
eatm
ent
Fixe
d eff
ects
1
D
elay
ed fe
edin
g
Earl
y fe
edin
g
A
geFe
edin
gA
ge *
Fee
ding
n
Mea
nSD
n
Mea
nSD
Av
erag
e da
ily g
ain
<.00
010.
041
0.09
1(g
/d)
0
- 3
18
12.6
a, x
0.7
18
13.9
a, y
1.2
3
- 7
18
25.0
b, x
0.
9
1826
.4 b,
y1.
2
7 -
14
1844
.3 c
2.3
18
44.8
c1.
4
14
- 28
18
79.3
d3.
7
1881
.3 d
4.4
2
8 - 3
5
1879
.8 d
5.4
18
78.6
d6.
2
0 - 3
5
1860
.52.
1
1861
.42.
1
0.52
4
Aver
age
daily
feed
inta
ke
<.
0001
0.04
40.
269
(g/d
)
0 -
3
1713
.5 a
1.5
18
15.3
a2.
1
3 -
7
1834
.8 b
4.6
18
34.5
b1.
9
7 -
14
1851
.9 c
1.9
18
53.6
c1.
4
14
- 28
18
122.
0 d
3.6
18
124.
7 d
3.9
2
8 - 3
5
1815
9.0
e7.
7
1816
0.6
e7.
3
0 - 3
5
1896
.13.
1
1898
.02.
7
0.06
9
Gai
n to
feed
ratio
<.00
010.
686
0.13
6
0
- 3
17
0.95
a0.
07
180.
93 a
0.06
3
- 7
18
0.74
b0.
05
180.
77 b
0.05
7
- 14
18
0.85
c0.
02
180.
84 c
0.02
1
4 - 2
8
180.
65 d
0.02
18
0.65
d0.
02
28
- 35
18
0.50
e0.
02
180.
49 e
0.03
0
- 35
18
0.63
0.01
18
0.63
0.01
0.
337
1 M
odel
-esta
blish
ed p
-val
ues f
or fi
xed
effec
ts of
mom
ent o
f firs
t nut
ritio
n (w
ater
and
feed
), ag
e, a
nd th
eir i
nter
actio
n. S
uper
scrip
ts w
ithin
col
umns
(a, b
, c, d
, e)
indi
cate
diff
eren
ces b
etw
een
age-
inte
rval
s. Su
pers
crip
ts w
ithin
row
s (x,
y) i
ndic
ate
diffe
renc
es b
etw
een
treat
men
t gro
ups w
ithin
age
inte
rval
.

Chapter 2
56
Tabl
e 4:
Ave
rage
dai
ly g
ain,
ave
rage
dai
ly fe
ed in
take
and
gai
n to
feed
rat
io o
f ch
icke
ns th
at w
ere
not t
rans
port
ed a
fter
hat
ch a
nd c
hick
s th
at w
ere
tran
spor
ted
afte
r ha
tch.
Age
(d)
Tr
eatm
ent
Fixe
d eff
ects
N
o tr
ansp
ort
Tr
ansp
ort
Age
Tran
spor
tA
ge *
Tra
nspo
rt
nM
ean
SD
nM
ean
SD
Aver
age
daily
gai
n
<.
0001
0.40
20.
501
(g/d
)
0 -
3
1813
.1 a
1.3
18
13.4
a1.
1
3 -
7
1825
.6 b
1.4
18
25.8
b1.
1
7 -
14
1844
.0 c
1.6
18
45.2
c2.
0
14
- 28
18
80.6
d4.
8
1879
.9 d
3.3
2
8 - 3
5
1879
.0 d
6.7
18
79.4
e4.
9
0 - 3
5
1860
.92.
3
1861
.02.
0
0.87
7
Aver
age
daily
feed
inta
ke
<.
0001
0.85
60.
679
(g/d
)
0 -
3
1714
.2 a
1.5
18
15.0
a2.
4
3 -
7
1835
.1 b
4.4
18
34.3
b2.
3
7 -
14
1852
.4 c
1.8
18
53.1
c1.
9
14
- 28
18
123.
4 d
4.3
18
123.
3 d
3.6
2
8 - 3
5
1815
9.6
e7.
0
1816
0.2
e8.
1
0 - 3
5
1897
.03.
0
1897
.23.
1
0.84
5
Gai
n to
feed
ratio
<.00
010.
502
0.13
6
0
- 3
17
0.93
a0.
08
180.
96 a
0.05
3
- 7
18
0.75
b0.
05
180.
76 b
0.05
7
- 14
18
0.84
c0.
01
180.
85 c
0.02
1
4 - 2
8
180.
65 d
0.02
18
0.65
d0.
02
28
- 35
18
0.49
e0.
03
180.
50 e
0.02
0
- 35
18
0.63
0.01
0
180.
630.
008
0.
982
1 M
odel
-esta
blish
ed p
-val
ues f
or fi
xed
effec
ts of
tran
spor
t, ag
e, a
nd th
eir i
nter
actio
n. S
uper
scrip
ts w
ithin
col
umns
(a, b
, c, d
, e) i
ndic
ate
diffe
renc
es b
etw
een
age-
inte
rval
s. N
o di
ffere
nces
bet
wee
n tr
ansp
ort g
roup
s wer
e ob
serv
ed.

Early nutrition and transport
Chap
ter
2
57
Hatch window (33 h)
Yes / no Transport simulation Rearing
Egg placementProvision of nutrition to EN groups Assessment of chick quality Provision of nutrition to DN groups
Pre-hatch
-51 to -18 h 0 to 33 h 21 – 54 h21 h0 h- 63 hChronological age
Biological age
Yes / no Access to Nutrition
18 – 51 h18 h 35 d
Figure 1: Experimental procedures and start of treatments (DN = delayed nutrition; EN = early nutrition) in time. Chicks were pulled at 63 h post placement, resulting in a biological age (defined by Careghi et al. 2005) of 0 – 33 h at pulling (chronological age = 0 h). Treatments were applied from 3 h chronological age (corresponding with 3 – 36 h biological age).

Chapter 2
58
Figure 2: Latency to stand up in seconds after induced tonic immobility in the 4 treatment groups (DN|NT; DN|T; EN|NT and EN|T) at 2 ages (3 and 30 d). (DN = delayed nutrition; EN = early nutrition; NT = no transport; T = transport). Asterisks represent significant (P ≤ 0.05) differences between treatments and diamonds represent means.

Early nutrition and transport
Chap
ter
2
59
Figure 3: Relative average daily gain of chicks that received delayed nutrition (DN) or immediate nutrition (EN) after hatch. Asterisks represent significant (P < 0.001) differences between treatments and error bars represent standard deviation.

Chapter 2
60
Supp
lem
enta
ry T
able
1: E
gg w
eigh
t, ha
tcha
bilit
y, an
d ch
ick
qual
ity (c
hick
leng
th, c
loac
a te
mpe
ratu
re, a
nd n
avel
qua
lity)
of c
hick
s tha
t rec
eive
d de
laye
d nu
triti
on
(54
h) o
r im
med
iate
nut
ritio
n af
ter h
atch
and
prio
r to
tran
spor
t.
Egg
wei
ght (
g) 1
H
atch
abili
ty (%
) 1
Chi
ck le
ngth
(cm
)
Nav
el q
ualit
y (%
)2
Clo
aca
tem
pera
ture
(°
C)
nm
ean
SD
nm
ean
SD
nm
ean
SD
Scor
e 1
Scor
e 2
Scor
e 3
n
mea
nSD
Feed
acc
ess
Del
ayed
18
56.7
1.9
18
98.1
2.3
20
620
.10.
5
62.1
33.0
4.9
49
38.7
b0.
1Ea
rly
1856
.11.
4
1896
.92.
3
206
20.2
0.5
65
.030
.64.
4
4839
.4 a
0.1
P-va
lue
.661
.128
.085
.539
.597
.814
< .0
011 A
naly
zed
at th
e pe
n le
vel.
2 Exp
ress
ed a
s per
cent
age
of c
hick
s with
in e
ach
scor
e. N
avel
qua
lity
was
ass
esse
d an
d ea
ch c
hick
was
scor
ed fr
om 1
-3 (M
aatje
ns e
t al.,
201
6).

Early nutrition and transport
Chap
ter
2
61

CHAPTER 33

Intestinal epithelium integrity after delayed onset of nutrition in broiler chickens
M.S. Hollemans1,2,3, J. van Baal3, G. de Vries Reilingh1, B. Kemp1, A. Lammers1, S. de Vries3
1 Adaptation Physiology Group, Wageningen University2 Coppens Diervoeding B.V.3 Animal Nutrition Group, Wageningen University
Poultry Science (in press)DOI: 10.1016/j.psj.2020.08.079

Chapter 3
64
Abstract
Fasting older broiler chickens (> 7 d of age) enlarges intestinal tight junction pore size, resulting in high paracellular intestinal permeability. Broiler chickens often do not receive feed and water (nutrition) directly after hatch, which may result in fasting up to 72 h of age. Whether perinatal fasting affects intestinal permeability is minimally studied. We therefore investigated whether delayed access to nutrition after hatch increases intestinal permeability, compared with broilers receiving early access to nutrition. Therefore, 432 hatched broilers received nutrition 72 h post hatch (delayed nutrition; DN), or directly post hatch (early nutrition; EN), and were reared under similar conditions until 14 d of age. Two hours after application of an oral pulse dose (3.85 mg) of fluorescein isothiocyanate-dextran (4000 Da) at 4, 10, and 14 d of age, blood plasma concentrations of the marker were measured in 24 to 36 broilers per treatment and time point. Marker concentration in plasma did not differ between DN and EN broilers at any age. Villi width measured in at least 8 broilers per treatment, was smaller in DN versus EN broilers at 4 d for both ileum (92 ± 3 µm vs. 121 ± 4; P < 0.001), and colon (100 ± 3 vs. 120 ± 4; P < 0.01). Real-time quantitative PCR revealed that the expression of tight junction protein claudin 3 in ceca was elevated in DN, compared with EN broilers at 4 d of age, whereas that of zonula occludens 1 in ileum was reduced. Expression of host defense-related genes was reduced in DN, compared with EN broilers, in ileum (cyclo-oxygenase 2, mucin 2) and ceca (interleukin 1β, cyclo-oxygenase 2). We conclude that 72 h DN reduced body weight up to 14 d of age, coinciding with transient effects on villi width in ileum and colon, and divergent expression of genes involved in TJ formation and host defense. These effects likely reflect delayed onset of intestinal and immune development in DN, compared with EN broilers, whilst DN does not fundamentally alter intestinal permeability.

Intestinal integrity
Chap
ter
3
65
1. Introduction
Newly hatched broilers in conventional hatcheries can experience a delay in access to feed and water up to 72 h from hatch (delayed nutrition; DN), caused by a combination of spread in individual hatch moments, hatchery procedures, and transport duration to the farm. Previous studies observed that broilers receiving DN have lower body weight (BW) from farm placement onwards compared with broilers receiving early nutrition (EN) (reviewed by de Jong et al., 2017). In addition, intestinal length and weight, villus size, absorptive area, and thickness of the mucus layer in duodenal, jejunal, and ileal tissue were smaller in DN compared with EN broilers (e.g. Smirnov et al., 2004; Lamot et al., 2014). These data suggest that DN, compared with EN, delays intestinal development in broilers, but it is unclear whether severe DN up to 72 h hampers integrity of the intestinal epithelium, allowing for excessive paracellular transport. This may facilitate translocation of intestinal bacteria and microbial associated molecular patterns, causing (chronic) inflammation resulting in reduced feed efficiency. Furthermore, bacterial translocation is suggested to result in lameness in broilers, as translocated bacteria may adhere to cartilage of femora and tibiae, causing chondronecrosis (Wideman et al., 2012).
Intestinal epithelial cells are sealed together by tight junctions (TJ), which dynamically regulate paracellular transport of molecules from the intestinal lumen through the epithelium into the bloodstream. Tight junctions are composed of transmembrane proteins in which claudins (CLD) and junctional adhesion molecules (JAM) are suggested to form a physical barrier (Schneeberger and Lynch, 2004; Anderson and Van Itallie, 2009; Turner, 2009). Within this network of proteins, pores are present to facilitate transport of water, ions, and small nutrients. Zonula occludens (ZO) are peripheral scaffold proteins, linking the TJ complex to the actin cytoskeleton. In chicken, TJ are already established and functional at hatch (Karcher and Applegate, 2008; Ozden et al., 2010).
Fasting of broilers at 7 d of age and older was found to increase intestinal permeability (IP), likely via greater TJ pore size (Kuttappan et al., 2015b; Vicuña et al., 2015b; Gilani et al., 2017b). In mammals, it is hypothesized that stressors elevate cortisol levels, subsequently increasing TJ pore size to raise influx of nutrients that are required to meet increased metabolic demands (De Punder and Pruimboom, 2015). Broilers subjected to 32 h DN, had greater blood corticosterone levels, compared with EN broilers (van de Ven et al., 2013). This may suggest that DN induces a stress response, increasing IP, to ultimately facilitate nutrient uptake. Unfortunately, this strategy may also enhance paracellular translocation of bacteria and microbial associated molecular patterns via TJ into the bloodstream (De Punder and Pruimboom, 2015).

Chapter 3
66
Although a recent study (Gilani et al., 2018) did not show excessive IP in broilers subjected to 24 h DN, the effects of longer feed and water withdrawal periods on IP are unknown, whereas in common broiler husbandry systems broilers may be withheld from feed and water for up to 72h . The objective of this study was therefore to evaluate differences between severe DN (72 h) compared with EN on intestinal morphology, paracellular transport, and expression of several TJ and IP-regulatory genes in ileum and ceca, to better understand effects of DN on IP in broilers.
2. Materials and methods
2.1. Experimental designThe experimental design and procedures were ethically approved according to Dutch law under application number AVD104002016441. This manuscript describes part of a larger study testing effects of EN versus DN (72 h), and three dietary treatments starting from 4 d post hatch onwards, in a 2 x 3 factorial arrangement. Data from dietary treatments were pooled because no dietary treatment effects were observed (P > 0.10). To account for effects of hatch moment, EN and DN groups were divided into either early (first 12 h of hatch window) or late (second 12 h of hatch window) hatchers. Ages are expressed as biological ages (Careghi et al., 2005) in days post hatch throughout the manuscript.
2.2. Animals and nutritionSeventeen days incubated Ross 308 eggs (n = 477) were obtained from a commercial hatchery, transferred to the experimental facility, and placed in HatchCare baskets (HatchTech B.V., Veenendaal, the Netherlands). Eggs were hatched in a climate respiration cell with observed room temperature of 35.7 ± 0.1 °C and relative humidity of 55.7 ± 0.1 %. From the moment of first hatch, hatched broiler chicks were collected every 3 h and weighed, checked for absence of abnormalities, feather sexed, and neck-tagged for individual identification. First and last 5 % of hatchers, and broilers with abnormalities, were excluded from the experiment and culled. Broilers within each 3 h hatch block were alternately assigned to DN or EN treatments, and placed back in the climate respiration cell for 3 d in baskets containing either feed and flowing water (EN), or not (DN). This procedure was repeated every 3 h resulting in a total of 8 hatch groups within a time window of 3 h (total hatch window: 24 h). Hatch groups were pooled into early (0 – 12 h) or late hatchers (12 – 24 h). Average observed room temperature during holding was 34.4 ± 0.4 °C, and relative humidity was 55.8 ± 0.2 %. Seventy-two hours after hatch, 432 broilers were weighed and placed in 72 floor pens (3 males and 3 females per pen) until 14 d of age (end of experiment), and the surplus of broilers was culled. From placement onwards, all broilers had ad libitum access to water and a starter

Intestinal integrity
Chap
ter
3
67
diet (Supplementary Table 1, Supplementary material).
2.3. Body weightAll broilers were individually weighed within 3 h after hatch (0 d) and at 3 d of age. At 4, 10, and 14 d, two broilers per pen were weighed. Of these two broilers, the first was selected for organ collection, and the second for repeated measurements on IP as described hereafter.
2.4. In vivo intestinal permeabilityIntestinal paracellular transport of 4000 Da fluorescein isothiocyanate-dextran (FITC-d), reflecting paracellular transport, was measured by blood plasma concentration of FITC-d after an oral pulse dose of FITC-d, according to previous studies (Vicuña et al., 2015b; Gilani et al., 2018). Briefly, at 4, 10 and 14 d of age, 2 broilers per pen received an oral dosage of 3.85 mg FITC-d (4000 Da, Sigma-Aldrich CO, St. Louis, MO, U.S.A.) dissolved in 0.35 mL of phosphate buffered saline. After 2 h, one broiler was taken from the pen, weighed, and blood (0.4 mL) was collected from the jugular vein using heparin-flushed needles and syringes. After blood collection, the broiler was placed back in the pen for repeated procedures at 10 and 14 d of age. Blood was centrifuged directly after sampling (12000 x g, 2 min), and 100 µL of plasma were transferred to black 96 well plates and stored in the dark at –20 °C pending analyses. After thawing, fluorescence was measured at an excitation wavelength of 485 nm and an emission wavelength of 528 nm on a Spectramax M5 Multi-Mode Microplate Reader (Molecular Devices, Sunnyvale, California, USA). A linear standard curve was developed by adding known amounts of FITC-d to naive broiler blood plasma. An 8-step dilution series was made ranging from 1000 to 2 µg / mL with four replicates per dilution. A standard linear curve was fitted on optical density as a function of dilution (R2 = 0.98). Levels of FITC-d in plasma were expressed in µg / mL plasma. The detection limit was set at 2.4 µg / mL (mean + 2 x standard deviation) based on naive plasma.
2.5. Organ collectionSelected broilers were weighed and subsequently euthanized by decapitation for organ collection. An ileal mid-section of approximately 2 cm was collected between the Meckel’s diverticulum and the ileocecal junction, as well as the whole colon, and one randomly selected cecum from in total 12 broilers per treatment per age (4, 10, 14 d). Intestinal sections were laterally opened, and after removing intestinal contents, Swiss rolls (Moolenbeek and Ruitenberg, 1981) were made and directly frozen in liquid nitrogen and stored at – 80 °C. From broilers dissected at 4 d, residual yolk was collected and weighed.

Chapter 3
68
2.6. Villi widthA subset of collected ileum and colon tissues was selected with the random sampling procedure in base R version 3.5.0. (R Development Core Team, 2018), from both DN and EN broilers. Swiss rolls from ileum and colon were cut with a microtome at -20 °C (7 µm), 6 sequential tissue sections were mounted on a glass slide, and stained with hematoxylin and eosin. The software package LAS X (Leica Microsystems B.V., Amsterdam, the Netherlands) was used to measure villi width. Villus height could not be measured due to shrinkage of villi after freezing. Villi width was measured from at least 5 villi from 6 sections, resulting in 30 measurements per slide that were averaged per sample.
2.7. RNA isolation and cDNA synthesisA total of 10 ileal and 10 cecal tissue samples per treatment group (n = 40), obtained at 4 d of age, was randomly selected by the random sampling procedure in base R. Approximately 100 mg of tissue were ground in liquid nitrogen and total RNA was extracted using TRIzol reagent (ThermoFisher Scientific, Bleiswijk, the Netherlands) following the manufacturer’s instructions. Following extraction, genomic DNA was eliminated by an on-column DNase digestion step using an RNeasy kit (Qiagen, Venlo, the Netherlands). Concentration and purity of RNA was determined using a NanoDrop ND-1000 (Thermofisher Scientific). Integrity of RNA was evaluated using a Bioanalyzer 2100 and RNA 6000 Nano LabChip kit (Agilent, Santa Clara, California, U.S.A.) revealing RNA integrity (RIN) values ranging from 9 to 10. Four cecal tissues displaying a too low RNA concentration were discarded, resulting in a total of 36 samples for further analyses. For first strand cDNA synthesis, 200 ng RNA was reverse transcribed with Superscript III Reverse Transcriptase (200 U; Thermofisher Scientific) in the presence of random hexamer primers (250 ng; Roche Diagnostics, the Netherlands), DTT (10 mM), and dNTP (1 mM), in a 20 µL reaction volume at 50 °C for 60 min, followed by 55 °C for 15 min. Reactions were terminated at 70 °C (15 min). Upon real-time quantitative PCR (RT-qPCR) analysis, cDNA was stored at -20 °C.
2.8. Real-time quantitative PCRReal-time quantitative PCR (RT-qPCR) was performed with a QuantStudio 5 qPCR system (Thermofisher Scientific) using the SensiFAST SIBR Lo-ROX kit (Bioline, London, United Kingdom), following the manufacturer’s instructions. Primers were designed with Primer Express Software (Life Technologies, Bleiswijk, the Netherlands), and recommended primer sets that span an intron were selected (Table 1). Amplification conditions consisted of 95 °C for 2 min, followed by 40 cycles (95 °C for 15 s followed by 60 °C for 30 s). A final melting protocol with ramping from 60 °C to 95 °C with 0.1 °C increments / s confirmed PCR specificity. Absolute quantitative mRNA measurement was performed by establishing a linear calibration curve using 10-fold serial dilutions of

Intestinal integrity
Chap
ter
3
69
cDNA template for corresponding genes. Abundance of RNA was normalized to that of ribosomal protein lateral stalk subunit P0, since the Normfinder algorithm (Andersen et al., 2004) pointed out this gene was most stably expressed among our samples compared with β-actin and glyceraldehyde-3-phosphate dehydrogenase.
2.9. Statistical analysesAll data were processed, statistically analyzed, and presented using R version 3.5.0. General linear models were established using the nlme package (Pinheiro et al., 2018) to estimate effects of DN and EN per time point on BW (day 3, 4, 10, and 14), villi width (day 4, 10, and 14), and absolute and relative yolk weight (day 4 ), with treatment (DN, EN), hatch moment (early, late), and their 2-way interaction as fixed effects. Gene expression at day 4 was estimated for each gene within organ (ileum, ceca), with a general linear model using treatment as fixed effect. Model fits were assessed by normality and homoscedasticity of residuals by qq-plots, plotting residuals against fitted values, and if needed by testing likelihood ratios between models (Pinheiro and Bates, 2000). Logarithmic transformation was performed on the following dependent variables: BW at day 3, villi width, and residual yolk weights. Data from one broiler that represented a biological impossible value (DN; day 4) for body weight and residual yolk were excluded from further analyses. Data from FITC-d plasma levels (day 4, 10, and 14), and gene expression of ZO-1 in ileum, did not met model assumptions of homoscedasticity and were therefore analyzed with a Kruskal-Wallis test. All data are represented as (back-transformed) estimated marginal means ± standard error (SEM) unless stated otherwise. Differences among means were considered significant if P ≤ 0.05, and statistical tendencies were considered if P ≤ 0.10.
3. Results
3.1. Broiler performance parametersAt 3 d post hatch, DN broilers had smaller BW compared with EN broilers (Δ = 30.1 g; P < 0.001; Table 2), particularly in early hatchers (feeding x hatch moment P < 0.001). Residual feed intake of EN broilers varied between 7.2 to 18.8 g during holding (0 to 72 h after hatch). Body weight was smaller in DN compared with EN (P < 0.001; Table 3) at day 4 (Δ = 30.0 g), 10 (Δ = 85.0 g), and 14 (Δ = 122 g), without significant effects of hatch moment (data not shown). Absolute weight of residual yolk was not affected by hatch moment, nor by feeding (DN: 0.7 ± 0.09 g; EN: 0.7 ± 0.08 g P = 0.30).
3.2. Villi width and plasma FITC-d levelsIn DN versus EN broilers, villi width was smaller in ileum (Δ = 29 µm; P < 0.001) and colon (Δ = 20 µm; P < 0.01), however, no differences were observed at 10 and 14 d.

Chapter 3
70
(Table 3). Plasma levels of FITC-d at 4 d were not affected by feeding at 4, 10, and 14 d of age (Figure 1). Multiple plasma samples had FITC-d concentrations below detection limit at 10 (23 out of 47) and 14 d of age (37 out of 48), but not at 4 d.
3.31. Gene expressionRT-qPCR analysis in ileum and ceca collected at 4 d revealed that gene expression of TJ protein claudin 3 (CLD-3) was greater (P = 0.001) in ceca of DN broilers compared with EN, but not in ileum (Figure 2). Expression of scaffold protein zonula occludens 1 (ZO-1) was lower (P = 0.05) in ileum of DN broilers compared with EN broilers. Expression of junction adhesion molecule 2 (JAM-2) was not affected by treatment in both segments. With respect to genes related to host defense pathways, we found lower gene expression of cyclo-oxygenase 2 (COX-2) in both ileum (P = 0.01) and ceca (P = 0.003) in DN, compared with EN broilers. Expression of the cytokine interleukin 1β (IL-1β) tended to be lower (P = 0.10) in the ceca of DN broilers, whereas expression of mucin 2 (MUC-2) was greater (P = 0.05) in the ileum of DN broilers.
4. Discussion
The objective of this study was to study effects of 72 h DN, compared with EN, on intestinal epithelium integrity in broilers, as measured by villi width and IP. Abundance of RNA was measured by RT-qPCR to study gene expression of TJ related genes, and expression of genes related to host defense pathways. Our data are in line with current literature on effects of DN, compared with EN, with regard to BW, villi width, and IP. We observed smaller villi width and divergent expression levels of genes involved in TJ formation and organization in ileum and ceca of DN and EN broilers at 4 d of age, but no effects of feeding strategy on IP.
4.1. Effects of delayed nutrition on broiler growth performance and intestinal integrityBody weight was greater in EN compared with DN chickens throughout the experiment (77 % at 4 d to 39 % at 14 d), as expected (de Jong et al., 2017; Hollemans et al., 2018). Residual yolk weight was evaluated to compare yolk disappearance in EN versus DN broilers. We observed no differences in residual yolk weight between DN and EN broilers or among hatch moments, suggesting that yolk resources may be sufficient to meet nutrients requirements for periods of DN up to 72h. Width of intestinal villi was measured to confirm that in our study, DN resulted in impaired intestinal morphology. Villi width was smaller in ileum (32 %) and colon (20 %) at 4 d of age in DN, compared with EN broilers, and diminished rapidly upon feeding, as expected (Geyra et al., 2001; Lamot et al., 2014). These findings indicate smaller absorptive area in DN compared

Intestinal integrity
Chap
ter
3
71
with EN broilers (Kisielinski et al., 2002).
We are the first to report effects of prolonged DN for 72 h on IP, and found that levels of FITC-d in plasma were unaffected by feed and water deprivation after hatch. The absence of treatment effects on FITC-d plasma levels suggests that DN has no, or at least short-lasting, effects on paracellular transport across the intestinal epithelium. This is in accordance with previous findings in broilers subjected to a 24 h duration of DN (Gilani et al., 2018).
Claudin, JAM, and ZO proteins play an essential role in maintaining intestinal integrity and paracellular transport (Schneeberger and Lynch, 2004; Anderson and Van Itallie, 2009). In a dexamethasone model in broilers that invokes intestinal inflammation, greater paracellular transport of FITC-d via the intestinal epithelium was found to be associated with greater gene expression of CLD-3, ZO-1, ZO-2, and occludin, a TJ-associated transmembrane protein, in the ileum (Barekatain et al., 2019). These observations demonstrate a relation between paracellular transport and expression of certain TJ genes. This relation is further demonstrated in murine in vitro models, where greater CLD, JAM, and ZO gene expression resulted in elevated abundance of these proteins (Zhang et al., 2014). For example, greater gene expression of CLD-1, 2, 3, and 4 resulted in greater transepithelial resistance in intestinal cell monolayers (Lu et al., 2013).
To gain insight in effects of DN on epithelium integrity on the molecular level, we measured expression of genes involved in the construction of TJ (CLD-3, JAM-2, ZO-1). Whereas FITC-d plasma levels were unaffected by our feeding treatments (DN versus EN), we observed downregulation of CLD-3 and upregulation of ZO-1 in EN broilers. This may either indicate that the FITC-d method did not accurately reflect IP, or that IP was unaffected and that our observations on gene expression reflected maturation of the intestinal tract, rather than IP. With regard to maturation, it was found in rodents that expression of genes from the claudin family changes during the perinatal period (Holmes et al., 2006).
Other studies suggest that metabolites of intestinal bacteria play a role in the maintenance of intestinal integrity by affecting expression of TJ-related genes (reviewed by Ulluwishewa et al., 2011). The expression of genes related to host defense was also studied, including immune responses (IL-1β, COX-2), and mucin dynamics (MUC-2), which can indirectly control IP (Turner, 2009; Lee, 2015; Volynets et al., 2016). Gene expression levels of COX-2 and IL-1β were lower (P ≤ 0.05) in DN, compared with EN broilers, primarily in the ceca. Remarkably, we observed no differences in IP, while elevated levels of COX-2 and IL-1β are known to induce inflammatory processes and

Chapter 3
72
are associated with greater IP (Schneeberger and Lynch, 2004; Fredenburgh et al., 2011; Lee, 2015). For example, IL-1β levels were elevated during intestinal inflammation and decreased TJ integrity in CaCo-2 cells (Al-Sadi et al., 2008), probably via activation of myosin light chain kinase (Turner, 2009). The enzyme COX-2 is responsible for formation of prostanoids, and is involved in inflammatory processes (Fredenburgh et al., 2011). Mice deficient in COX-2 were shown to have greater IP, as COX-2 was found to upregulate expression of occludin, ZO-1, and CLD-1 (Fredenburgh et al., 2011). Mucin 2 is a gel forming glycoprotein which covers the luminal surface of the gut, and was elevated in EN compared with DN broilers. This finding is in accordance with other studies (Uni et al., 2003; Smirnov et al., 2004), and may suggest differences in colonization of the intestinal tract by bacteria (Deplancke and Gaskins, 2001).
In DN broilers, delayed bacterial colonization compared with EN broilers is suggested (Binek et al., 2000), including differences in microbiota composition in the ileum up to 9 d of age (Simon, 2016). In addition, it was suggested that development of gut associated lymphoid tissue (GALT) after first feeding post hatch may be accelerated, likely as a result of antigenic stimulation by intestinal microbiota and feed (Juul-Madsen et al., 2004; Bar-Shira et al., 2005; Bar-Shira and Friedman, 2006; Simon et al., 2014). Bar-Shira and Friedman (2006) suggested that immune stimulation by microbial colonization in the intestinal tract, and subsequent upregulated expression of pro-inflammatory cytokine genes in duodenum, colon, and ceca during the first days after hatch, is responsible for this accelerated development of GALT. We speculate, that the observed effects of DN on ileum and ceca gene expression, may reflect delayed development of GALT, due to the lack of feed intake and reduced bacterial colonization in DN compared with EN broilers, rather than differences in IP.
4.2. FITC-d procedure to measure paracellular intestinal permeabilityVarious methods to quantify IP are described in literature (reviewed by Gilani et al., 2016a; Wells et al., 2017). In this study we have used the FITC-d method to measure paracellular transport, as this a well-known method to evaluate IP in broilers between 4 to 38 d of age (Kuttappan et al., 2015a; b; Vicuña et al., 2015b; Gilani et al., 2016b, 2017b, 2018; Baxter et al., 2017; Barekatain et al., 2019). However, retrospectively, our results suggest that the method requires further optimization to accurately measure effects of dietary treatments on paracellular transport of FITC-d in young broilers. Firstly, we reported a relatively large number of plasma samples below detection limit at 10 (23 out of 47) and 14 (37 out of 48) d of age. We could not compare these values to literature, as detection limits were not reported (Kuttappan et al., 2015a; b; Vicuña et al., 2015b; Gilani et al., 2016b, 2017b, 2018; Baxter et al., 2017; Barekatain et al., 2019). However, our data indicate poor sensitivity of the method for broilers ≥ 10 days of age, using the dosing protocol according to the aforementioned studies.

Intestinal integrity
Chap
ter
3
73
In addition, we observed large contrasts in BW at all ages, as a result of the treatments (DN versus EN), pointing out the need for BW-correction of pulse doses. Remarkably, adjustment of the oral pulse dose of FITC-d for BW is commonly not reported (Tellez et al., 2014; Kuttappan et al., 2015a; Vicuña et al., 2015b; Gilani et al., 2017b; a, 2018; Barekatain et al., 2019). When not corrected for BW, FITC-d levels in blood may be confounded with absorptive capacity of the gastro-intestinal tract (GIT). Delayed nutrition broilers are reported to have a smaller GIT, compared with EN broilers (Lamot et al., 2014), and have lower absorptive area (e.g. Smirnov et al., 2005). This suggests lower absolute levels of paracellular transport of FITC-d in DN, compared with EN broilers. Apart from differences in absorptive area, BW is positively correlated with blood volume (Medway and Kare, 1959; Kotula and Helbacka, 1966). Due to their lower BW, DN broilers had lower blood volume compared with EN broilers, resulting in greater dilution of FITC-d plasma levels. Therefore, FITC-recovery in our study was calculated as follows. FITC-d levels in plasma were multiplied by the estimated blood volume (Kotula and Helbacka, 1966), and subsequently divided by the amount of FITC-d supplied as oral pulse dose. This resulted in estimated FITC-d recoveries ranging between 0.35 and 2.51 % w/v, which is in accordance with existing literature on broilers up to 10 d of age (0.3 to 1.3 % w/v) (Tellez et al., 2014, 2015; Vicuña et al., 2015a; Gilani et al., 2018). Baxter et al. (2017) concluded that accuracy of the FITC-d method can be optimized in 10 d old broilers by a greater oral pulse dose (up to 8.32 mg FITC-d / kg BW), and earlier collection of blood after the oral pulse dose (1 h after dosing). However, we were not able to determine whether FITC-d recovery after the oral pulse dose was indeed greater in this study compared with our study, as BW was not published.
Secondly, we also presume that measuring IP using FITC-d in the fed state, might be confounded by a lack of standardization of feed intake and gut fill. However, this standardization is also not reported in other studies measuring IP in vivo (Tellez et al., 2014, 2015; Vicuña et al., 2015a; Baxter et al., 2017; Gilani et al., 2018). Variation in the amounts of digesta in the GIT will result variable dilutions of FITC-d in the intestinal lumen, thus affecting the amount of FITC-d that will have contact with the intestinal epithelium. Finally, the 24 h habituation period after DN in our study, following procedures of Gilani et al. (2018), may have resulted in rapid regeneration of TJ pore size. As TJ pore size is known to be highly dynamic (Shen et al., 2008; De Punder and Pruimboom, 2015), this habituation period may have diminished potential effects on FITC-d permeability. In summary, we propose that future studies comparing IP between DN and EN broilers using the FITC-d procedure, should (1) adjust the amount of marker supplied as oral pulse dose for BW, (2) apply a short period of fasting to standardize gut fill, and (3) omit habituation periods. Nevertheless, our data obtained on 4 days of age, where all samples had plasma FITC-d concentrations above

Chapter 3
74
the detection limit, even if corrected for blood volume in DN versus EN broilers, did not point out any differences between DN and EN treatments. This confirms that DN has no, or at least short-lasting, effects on paracellular transport across the intestinal epithelium.
5. Conclusions
Our data confirm that impaired growth during the first 14 d observed in DN broilers, coincides with transient effects on ileal and colonic villi width. Paracellular transport through the intestinal epithelium, measured with FITC-d, was unaffected by DN. The divergent expression of TJ and host defense genes, together with findings on villi width, may reflect delayed intestinal and immune development in DN compared with EN broilers, whilst DN does not fundamentally alter intestinal permeability.
5. Acknowledgements
We thank Bert Beukers and Ries Verkerk (CARUS, Wageningen University & Research) for excellent animal caretaking. Marit Noorloos is kindly acknowledged for help during the experiment and laboratory analyses within her MSc thesis project. Leo Kruijt and Joop Arts (Wageningen University & Research) are thanked for their technical assistance of RNA isolation and RT-qPCR analysis. This study is part of a project on Early Nutrition that has been funded by Coppens Diervoeding B.V., Helmond, the Netherlands and Wageningen University & Research.

Intestinal integrity
Chap
ter
3
75
Tabl
e 1:
Chi
cken
gen
e-sp
ecifi
c pr
imer
s use
d fo
r RT-
qPC
R.
Gen
e 1
Acc
essi
on
num
ber
Effici
ency
(%
)A
mpl
icon
si
ze (b
p)
Prim
ers
Fo
rwar
dR
ever
se
CO
X-2
NM
_001
1677
1987
127
5’
-AT
TC
CT
GAC
CC
ACAA
GG
CAC
-3’
5’-A
GT
CAA
CC
CC
ATG
GC
CG
TAA-
3’
ZO-1
2X
M_0
1527
8975
9063
5’
-CC
GC
AGT
CG
TT
CAC
GAT
CT-
3’5’
-GG
AGAA
TG
TC
TG
GAA
TG
GT
CT
GA-
3’
JAM
-2 2
NM
_001
0062
5793
59
5’-A
GC
CT
CAA
ATG
GG
ATT
GG
ATT-
3’5’
-CAT
CAA
CT
TG
CAT
TC
GC
TT
CA-
3’
MU
C-2
NM
_001
3184
3490
214
5’
-AT
TG
AAG
CC
AGC
AAT
GG
TG
T-3’
5’-T
GAC
ATC
AGG
GC
ACAC
AGAT
-3’
CLD
-3N
M_2
0420
287
159
5’
-TAT
GG
GG
CT
GG
AGAT
CG
GT-
3’5’
-AC
CAC
GC
AGT
TC
ATC
CAC
AG-3
’
IL-1
βH
Q32
9098
9821
5
5’-G
ACAT
CT
TC
GAC
ATC
AAC
CAG
-3’
5’-C
CG
CT
CAT
CAC
ACAC
GAC
AT-3
’
ACT
BN
M_2
0551
896
162
5’
-GC
CC
TG
GC
ACC
TAG
CAC
AAT-
3’5’
-GC
GG
TG
GAC
AAT
GG
AGG
GT-
3’
GAP
DH
NM
_204
305
100
135
5’
-AT
CC
CT
GAG
CT
GAA
TG
GG
AAG
-3’
5’-A
GC
AGC
CT
TC
ACTA
CC
CT
CT-
3’
RPL
-P0
2N
M_2
0498
793
83
5’-T
TG
GG
CAT
CAC
CAC
AAAG
ATT-
3’5’
-CC
CAC
TT
TG
TC
TC
CG
GT
CT
TAA-
3’
1 C
OX
-2: C
yclo
-oxy
gena
se 2
; ZO
-1: Z
onul
a oc
clud
ens
1; J
AM-2
: Jun
ctio
n ad
hesiv
e m
olec
ule
2; M
UC
-2: m
ucin
2; C
LD-3
: Cla
udin
3; I
L-1β
: Int
erle
ukin
1β;
AC
TB:
Act
in β
; GAP
DH
: Gly
cera
ldeh
yde-
3-ph
osph
ate
dehy
drog
enas
e; R
PL-P
0: R
ibos
omal
pro
tein
late
ral s
talk
subu
nit P
0.
2 Th
e fo
llow
ing
prim
ers w
ere
take
n fro
m li
tera
ture
: ZO
-1 a
nd JA
M-2
(Che
n et
al.,
201
5), a
nd R
PL-P
0 (S
tain
es e
t al.,
201
6).

Chapter 3
76
Table 2: Effect of early (EN) or 72 h delayed nutrition (DN) on body weight (g) of broiler chickens at 3 days post hatch, for early and late hatched broilers.
Treatments Mean SEM n
Early hatchers 1
DN 39.4 a 0.46 115
EN 71.2 c 0.47 111
Late hatchers 1
DN 40.2 a 0.52 90
EN 68.5 b 0.54 85
P-values 2
Feeding*Hatch moment < 0.001
Feeding < 0.001
Hatch moment 0.07
Data are presented as estimated marginal means with their standard errors (SEM), and number of broilers within each group (n). Means lacking a common superscript differ (P ≤ 0.05)1 Early hatchers hatched in the first 12 h, and late hatchers in the second 12 h of the hatch window. First and last 5 % of hatchlings were removed from the study.2 Model established P-values for fixed effect of feeding, hatch moment, and their interaction.

Intestinal integrity
Chap
ter
3
77
Table 3: Effects of early (EN) or 72 h delayed nutrition (DN) on villi width in ileum and colon, and body weight (g), at 4, 10, and 14 days post hatch in broiler chickens. Villi width 1
Bodyweight Ileum Colon
Treatment Age (d) Mean SEM n Mean SEM n Mean SEM n
4
DN 92 3.18 8 100 3.45 9 39.2 0.86 34
EN 121 3.74 10 120 3.92 10 69.2 0.93 29
Fixed effect 2 <0.001 <0.01 <0.001
10
DN 134 7.33 4 126 6.05 4 175.0 4.19 23
EN 136 7.44 4 127 6.09 4 260.0 4.19 23
Fixed effect 2 0.92 0.92 <0.001
14
DN 132 8.32 4 132 6.43 4 315.0 8.03 23
EN 140 8.86 4 149 7.28 4 437.0 7.86 24
Fixed effect 2 0.12 0.12 <0.001
Data are presented as estimated marginal means with their standard errors (SEM), and number of broilers within each group (n).1 Mean width of 30 villi measurements per broiler in µm.2 Model established P-values for fixed effect of feeding.

Chapter 3
78
30 29 24 23 24 24
Figure 1: Effects of 72 h delayed (DN) or early nutrition (EN) on fluorescein isothiocyanate-dextran (FITC-d) blood plasma concentrations (µg FITC-d / mL) after an oral pulse dose of 3.85 mg FITC-d at 4, 10, and 14 days post hatch in broiler chickens. Circles represent concentrations measured in individual plasma samples. The horizontal line in the boxplots represents the median, and whiskers span the 1.5 * interquartile range from the box. The dotted horizontal line indicates the lower detection limit (2.4 µg / mL). No differences among means (P > 0.10) were observed. Numbers represent number of observations for each treatment group for each age.

Intestinal integrity
Chap
ter
3
79
*
* *
*
† **
Figure 2: Relative expression levels of genes involved in tight junction formation and organization affected by early (EN) or 72 h delayed nutrition (DN) in ileum (panel A) or cecum (panel B) at 4 d post hatch in broiler chickens. Absolute mRNA levels were normalized to the corresponding mRNA levels of RPL-P0. Circles represent individual broilers. The horizontal line in the boxplots represent the median and whiskers span the 1.5 * interquartile range from the box. Differences among means are indicated with ** (P ≤ 0.01) or * (P ≤ 0.05), and tendencies (P ≤ 0.10) with †. For all treatment groups and organs, n = 10, except for cecum from EN (n = 6).

Chapter 3
80
Supplementary Table 1: Ingredient and calculated nutrient composition of control diet provided during the experiment (in %, as-fed basis, unless indicated otherwise).
Ingredients (in %)
Wheat 36.4 Soybean meal 23.2
Extruded full-fat soybeans 10.0 Rye 20.0
Soybean oil 5.9 L-Lysine 0.3 DL-Methionine 0.3 L-Threonine 0.2 Limestone 1.4 Monocalcium phosphate 1.4 Sodium bicarbonate 0.4 Sodium chloride 0.1 Premix1 0.5 NSP enzyme2 0.03
Calculated nutrient composition3
Moisture 118
Crude protein 4 229
Digestible lysine5 12.0
Digestible methionine + cysteine5 8.6
Digestible threonine5 7.4
Crude fat6 84
Crude fiber 25
Ash 65
Starch7 304
DE (kcal/kg) 2850
Calcium 8 9.5
Phosphorus 8 6.5
1 Containing Vitamin A (2,500,000 IU); D3 (600,000 IU); E (3,350 IU); K3 (600 mg); B1 (600 mg); B2 (1,500 mg); B6 (800 mg) ; B12 (6,000 mg); niacin (9,000 mg); panthothenic acid (2,000 mg); biotin (100,000 mg); choline chloride (100,000 mg); Mn (17,000 mg); Zn (18,000 mg); Cu (3,000 mg); Fe (16,000 mg); I (400 mg); Se (50 mg).2 Commercial bacterial endo-1,3-β-xylanase (Belfeed, Agrimex N.V., Lille, Belgium).3 Calculated based on feed table of CVB (2007) and specified in g / kg unless specified otherwise.4 Conversion factor: 6.255 Apparent total tract digestibility.6 Ether extract with acid hydrolysis (ISO 6492).7 Amyloglucosidase method (ISO 15914)8 Total amount

Intestinal integrity
Chap
ter
3
81

CHAPTER 44

Effects of early nutrition and sanitary conditions on antibody levels in early and later life of broiler chickens
M.S. Hollemans1,2,3, G. de Vries Reilingh1, S. de Vries3, H.K. Parmentier1, A. Lammers1
1 Adaptation Physiology Group, Wageningen University2 Coppens Diervoeding B.V.3 Animal Nutrition Group, Wageningen University
Submitted toDevelopmental and Comparative Immunology

Chapter 4
84
Abstract
Immune maturation of broiler chickens may be affected by management, such as early life feeding strategy (early versus delayed nutrition) or by low or high sanitary conditions (LSC versus HSC). We compared systemic maternal (MAb), natural (NAb), natural auto- (NAAb), and antigen specific antibody (SpAb) levels (IgM, IgY) between broilers (n = 48 per treatment) that received early (EN) or delayed nutrition for 72 h (DN) housed in either low (LSC) or high sanitary conditions (HSC) between 7 and 35 d of age. We found minimal interactions between feeding strategy and sanitary conditions. At 7 d of age, broilers receiving EN compared with DN, had elevated levels of IgM binding keyhole limpet hemocyanin (KLH), phosphoryl-conjugated ovalbumin (PC-OVA), and muramyl dipeptide (MDP), whereas effects of feeding strategy diminished at later ages. In LSC compared with HSC broilers, levels of NAb agglutinating RRBC and sheep red blood cells (SRBC) were already elevated from 14 d of age onwards. At 33 d of age, antibody levels (NAb, NAAb, anti-LPS, anti-MDP) were all elevated in LSC, compared with HSC broilers, for both IgM and IgY, but not IgM against KLH. Western blotting revealed different binding patterns of NAAb against chicken liver homogenate, which may indicate that the NAAb repertoire is affected by antigenic pressure. Our data suggest that antibody levels are affected for an important part by environmental conditions (feeding strategy and sanitary conditions), but not by their interaction. However, it remains to be further studied whether the enhanced levels of antibodies as initiated by EN and LSC contribute to enhanced resistance to infectious diseases.

Humoral immunity
Chap
ter
4
85
1. Introduction
Activation and maturation of the immune system, including generation of antibodies, is suggested to be dependent on antigen exposure in the intestinal tract during the first days after hatch of broiler chickens (Bar-Shira et al., 2005; Bar-Shira and Friedman, 2006; Simon et al., 2014). Early exposure to intestinal microbiota and feed derived antigens may contribute to accelerated immune maturation (reviewed by Friedman et al., 2003). Therefore, the amount of these antigens after hatch may determine how fast antibody production will be established. Early (access to) nutrition (EN) and rapid exposure to dietary and microbial antigens in the intestinal tract as a result of feed intake (Binek et al., 2000; Karpinska et al., 2001; Potturi et al., 2005; Simon, 2016) may thus facilitate development of the immune system. In commercial broiler husbandry, however, broilers may experience a delay in access to feed and water up to 72h (DN), causing delayed maturation of the immune system (Bar-Shira et al., 2005), as antigen exposure is also in chickens essential for immune maturation (reviewed by Bar-Shira et al., 2003; Broom and Kogut, 2018). Studies comparing effects of EN versus DN on immune development, found accelerated maturation of the adaptive immune system, exemplified by higher lymphocyte numbers (Bar-Shira et al., 2005; Juul-Madsen et al., 2004), and earlier onset of antibody responses after rectal immunization (Bar-Shira et al., 2005). Whether EN contributes to improved later life immune responses, has been subject of debate. Most of these studies found little or no effects of EN on antibody levels (Dibner et al., 1998; Lamot et al., 2016; Simon et al., 2014; Walstra, 2011), but these studies were executed under relatively high sanitary conditions. Simon et al. (2015) observed lower antigen specific IgY responses in DN broilers, but not in EN broilers, housed under higher antigenic pressure compared with broilers housed under low antigenic pressure. This may indicate an interaction between feeding strategy and antigenic pressure on antibody responses in later life.Antibodies are important effector molecules of the immune system in both mammals and avian species (Vollmers and Brändlein, 2005), and are therefore good indicators for development and functioning of the immune system. Antibodies bind antigens and activate the complement cascade, resulting in neutralization of pathogens and removal of immune complexes by phagocytic cells (Ochsenbein and Zinkernagel, 2000). Three types of antibodies are distinguished: specific antibodies (SpAb) after antigenic stimulation, natural antibodies (NAb), and natural auto- (or self-binding) antibodies (NAAb). Classical SpAb responses rest on T-cell help after antigen presentation by antigen presenting cells, resulting in SpAb secreting plasma cells, with increasing affinity and specificity, and memory B-cells (Tizard, 2018). The existence of NAb, which bind to antigens to which the immune system has never been exposed, has been demonstrated in chicken (Matson et al., 2005; Parmentier et al., 2004). Natural antibodies have been found to contribute to resistance against bacterial pathogens, and higher levels of NAb

Chapter 4
86
correlated with reduced risk of mortality in laying hens (Berghof et al., 2019; Star et al., 2007; Sun et al., 2011). Antibodies binding towards (altered) self-antigens (NAAb) are present in chickens as well (Bao et al., 2016; De Jong et al., 2014; van der Eijk et al., 2019; Van Dijk and Parmentier, 2020), although their exact function in chickens need to be unraveled. It is unknown whether early exposure of the immune system to a greater antigenic load may affect levels of NAb and NAAb, and whether differences persist on the long term under low (LSC) or high sanitary conditions (HSC). To our knowledge, studies that compare immune development of broiler chickens under either LSC or HSC, and the interaction with feeding strategy are rare (Simon et al., 2015). Hence, we studied whether different feeding strategies (EN versus DN) and sanitary conditions (LSC versus HSC) affect development of NAb, NAAb, and SpAb levels. We propose that EN compared with DN, due to increased antigenic exposure, led to earlier stimulation of antibody producing B-cells, and thus higher antibody levels in EN broilers. This may ultimately improve the first line of defense towards infections and survival (Berghof et al., 2019; Star et al., 2007; Sun et al., 2011), and enhanced physiological homeostasis due to removal of damaged auto-antigens (Lutz et al., 2009; Ochsenbein, 1999).
2. Materials and methods
2.1. Experimental designThe experiment and procedures were ethically approved according to Dutch law under application number AVD104002016441. The experiment was executed in 3 consecutive batches and designed as a 2*2 factorial approach consisting of feeding strategy (EN versus DN) and sanitary conditions (LSC versus HSC). One separate climate respiration chamber (CRC) was used for each sanitary condition and each CRC contained 8 floor pens (1.1 * 1.8 m), each containing 10 broilers per pen at the start of the experiment (0 d of age). This resulted in a total of 16 pens divided over 2 CRC. Both CRC were completely identical in their set-up and were controlled for identical climate conditions (temperature, humidity, CO2, NH3). During the first 7 d of age, 1 broiler per pen was randomly selected and euthanized for another study (Hollemans et al., manuscript in preparation) at 0, 1, 2, 3, and 7 d of age. The broiler euthanized at 7 d of age, was used for blood plasma and liver collection for antibody measurements and Western blotting. From 7 d of age onwards, pens contained 5 broilers per pen. At 24 d of age, 1 broiler per pen was randomly selected for sheep red blood cell (SRBC) immunization and blood serum collection. At 33 d of age, 1 broiler per pen was randomly selected out of the remaining 4 broilers in the pen for blood plasma and liver collection. Random selection of broilers was done with the random sampling procedure in R version 3.6.1. (R Development Core Team, 2018).

Humoral immunity
Chap
ter
4
87
2.2. Animals, housing, and nutritionFor each respective batch, just hatched (< 4 h) Ross 308 male hatchlings (n = 160 / batch) without abnormalities (parent stock age: batch 1: 31 w, batch 2: 33, and batch 3: 48 weeks) were obtained from a commercial hatchery, and transported to the experimental facility. After arrival, chickens received an ID tag in the neck, and were distributed over floor pens. The pens contained SoftCell (Agromed GmbH, Kremsmünster, Austria) as bedding material, covered with chicken paper during the first 3 d to prevent litter uptake. Ambient temperature was set at 36 °C and was gradually reduced to 29 °C until 7 d of age, and then further gradually reduced to 18 °C at 42 d. Relative humidity was set at 55 % at the start of the trial and gradually increased to 75 % at 42 d. Levels of CO2 were maintained ≤ 2500 ppm and that of NH3 ≤ 20 ppm. Broilers had ad libitum access to water via drinking nipples and feed via a feeder, except for DN chickens, which had no access to nutrition (water and feed) during the first 72 h after hatch from placement onwards. Commercial pelletized broiler starter (0 – 7 d; DE: 2850 kcal / kg; total lysine: 11.8 g / kg), grower (7 – 28 d; DE: 2900 kcal / kg; total lysine: 11.2 g / kg), and a finisher diets (28 – 35 d; DE: 2950 kcal / kg; total lysine: 10.7 g / kg) were fed. The grower diet contained decoquinate (0.05 g / kg; Deccox 6 %, Zoetis, Capelle aan den IJssel, the Netherlands). Broilers were vaccinated against Newcastle disease at 3 d of age, but this was accidentally omitted in batch 1. We observed no indications that this may have influenced the outcome of the experiment.
2.3. Induction of low and high sanitary conditionsInduction of different sanitary conditions is described in detail elsewhere (Hollemans et al., in preparation). In short, LSC were induced from 3 d of age until the end of the experiment and consisted of spreading used litter (from 3 commercial broiler flocks per batch, obtained at approximately 35 d) in pens every 4 d, and the CRC was under-pressurized (- 65 ± 5 Pa). Broilers housed under HSC were kept in a separate over-pressurized (100 ± 5 Pa) CRC and caretakers and researchers were obliged to shower, and wear clean clothes, hairnet, gloves, and disinfected boots.
2.4. ImmunizationsTo induce a classical specific immune response, 2 broilers per pen received an intra-muscular (i.m.) immunization with 1 mL of 25 % packed sheep red blood cells (SRBC) in phosphate buffered saline (PBS) at 24 d of age (0 d post immunization (p.i.)). Packed SRBC were obtained by washing SRBC 5 times with PBS. Centrifugation was done at 1000 g for 15 min. Final packed SRBC were diluted in sterile PBS and stored at 4 °C upon immunization (within 24 h).

Chapter 4
88
2.5. Sample collectionWhole blood from 1 broiler per pen was collected at 14, 24, and 31 d of age (-10, 0, 7 d p.i.), incubated for 2 h at 4 °C, and subsequently centrifuged (12,000 g, 5 min) to obtain serum for haemagglutination assays. In batch 2 and 3, whole blood from 1 broiler per pen was collected in heparinized tubes, and centrifuged (12,000 g, 5 min) to obtain plasma at 7 and 33 d of age, for ELISA and Western blotting. Afterwards, the broiler was euthanized by decapitation (7 d) or intravenous injection with an overdose of pentobarbital (33 d), and approximately 5 g of liver was collected in cryovials, and snap frozen in liquid nitrogen. All plasma and serum samples were stored at -20 °C, and liver samples were stored at 80 °C , until further analyses.
2.6. Enzyme-Linked Immunosorbent AssayFlat-bottomed 96-well medium binding ELISA plates (Greiner Microlon, Sigma-Aldrich, Darmstadt, Germany) were coated with 100 μL / well of antigen dilutions in coating buffer (pH 9.6) and incubated at 4°C overnight. Antigens were either PC-OVA (2 µg / mL, Santa Cruz Biotechnology, SC-396491), KLH (2 µg / mL, Sigma-Aldrich, H7017), LPS (2 µg / mL, Sigma-Aldrich, L2880), and MDP (1 µg / mL, Sigma-Aldrich, A9519). After washing with PBS, plates were filled with 100 μL of PBS containing Tween 20 (0.05 %) and horse serum (1%) per well. Plasma (starting at 1:40 dilutions) was added followed by 4 dilution steps, as well as a standard positive control (in duplo) from pooled plasma, and plates were incubated for 1.5 h at 20 °C and subsequently washed with tap water. Conjugates (goat-anti-chicken IgM or goat-anti-chicken-IgY conjugated to horse radish peroxidase (Bethyl Laboratories Inc., Montgomery, TX); all 1:10,000 diluted for all antigens, and 1:40,000 for LPS-IgY) were added to the plates and incubated for 1.5 h at room temperature. After washing, binding of antibodies was visualized by adding 100 µl of substrate (reverse osmosis purified water, 10% tetramethylbenzidine buffer (15.0 g / L sodium acetate, 1.43 g / L urea hydrogen peroxide; pH 5.5), and 1 % tetramethylbenzidine (8 g / L DMSO) at 20 °C. After 15 min, the reaction was terminated with 50 µl of 1.25 M H2SO4. Extinctions were measured with a Multiskan GO (Thermo scientific, Breda, the Netherlands) at 450 nm. Titers were expressed as log2 values of the dilutions that gave an extinction closest to 50% of Emax, where Emax represents the highest mean extinction of the standard positive.
2.7. Haemagglutination assayHaemagglutination and lysis of SRBC and rabbit red blood cells (RRBC) were analyzed in serum collected at 14, 24, and 33 d of age following procedures of Matson et al. (2005), including treatment of serum with β-mercaptoethanol (2-ME) to cleave 2-ME sensitive antibodies for 30 min at 37 °C. Normal and 2-ME treated sera were then diluted with PBS in a twofold serial dilution in 96-well round bottom assay plates, resulting in a total of 11 dilutions, including PBS as a negative control, in a reaction volume of 25 µL. To

Humoral immunity
Chap
ter
4
89
all wells, 25 µL of 1 % RRBC (Innovative Research, Novi, U.S.A., IRBRBC25ML) or SRBC (ThermoFisher Scientific, Bleiswijk, the Netherlands, S0051D) suspension was added. Then the plates were gently vortexed for 10 s, and incubated for 24 h at room temperature. After incubation, the highest dilution showing haemagglutination, was scored. The ratio of levels of antibodies binding SRBC between 7 and 0 d post SRBC immunization was calculated to obtain fold change.
2.8. SDS-PAGE and Western blottingPreparation of chicken liver homogenate (CLH), and binding of IgM and IgY antibodies to CLH antigens in plasma of birds at 33 d of age by Western blotting after protein separation SDS-PAGE on 4 – 15 % precast gels (BIORAD, Hercules, CA, USA), was done following procedures as previously described (Van Dijk and Parmentier, 2020). Molecular weights were estimated by a color standard (10 to 250 kD, BIORAD). After scanning the blots with a flatbed scanner (GS-600, BIORAD), stained CLH fragments (bands) were counted by Image Lab 6.0 software (BIORAD). To know whether feeding and sanitary condition treatments affected the antigen composition of CLH contents, binding of antibodies was tested on CLH obtained from all treatments (EN-LSC, EN-HSC, DN-LSC, DN-HSC, n = 8 broilers per treatment). As there were no effects of the experimental treatments on CLH fragment composition (Supplementary Data), CLH from one adult laying hen (16 w of age) was used in all Western blot assays.
2.9. Statistical analysesData were processed, analyzed, and presented using R version 3.6.1 (R Development Core Team, 2018). General linear models were established to estimate fixed effects of sanitary conditions (LSC, HSC), feeding (DN, EN), and their interaction, on levels of antibodies binding KLH, PC-OVA, LPS, and MDP for 7 and 33 d of age separately. Identical models were established to analyze treatment effects on performance data (BW, ADG) on agglutination of SRBC and RRBC including fold change, and number of bands detected on Western blots. In all models, batch was added as a covariate including a batch * feeding and a batch * sanitary conditions interaction. Non-significant covariates (P ≤ 0.10) were excluded from the model.Model residuals of the linear models were tested to verify assumptions of normality and homogeneity by QQ-plots and residual plots. Logarithmic transformation was applied to normalize residuals if required. P-values ≤ 0.05 were considered statistically significant and P-values ≤ 0.10 were considered as tendencies. All data are presented as (back-transformed) estimated marginal means with standard errors unless specified otherwise.

Chapter 4
90
3. Results
3.1. Antibody levelsAt 7 d of age we measured plasma levels of IgM and IgY binding KLH, RRBC, and SRBC before immunization (as a parameter for NAb), PC-OVA (NAAb), LPS and MDP (Table 1, Figure 1 and 2), to study effects of early life feeding strategy (EN versus DN) on early life antibody levels and whether or not these are affected by sanitary conditions (LSC versus HSC). At 33 d of age, we again measured levels of antibodies (IgM, IgY) binding KLH, PC-OVA, LPS, and MDP (Table 2). Here, we investigated whether differences caused by feeding strategy at 7 d of age lasted up to 33 d of age, and whether sanitary conditions during rearing affect antibody levels at later life. Haemagglutination against SRBC after immunization (SpAb) was measured in serum to compare the classical specific antibody response between all treatment groups (Figure 1). With regard to all antigens and ages, no interaction effects (feeding strategy * sanitary conditions) were present (P > 0.10), with exception of NAb binding RRBC at 24 d of age (P = 0.08), and therefore results will be presented separately for feeding strategy and sanitary conditions.
3.1.1. NAbAt 7 d of age, levels of natural IgM, but not IgY, binding KLH tended (P = 0.08) to be higher in EN compared with DN broilers (Δ = 0.6; Table 1), whereas at 33 d of age no effects were observed (Table 2). Levels of IgY, but not IgM, binding KLH were lower in LSC compared with HSC at 7 d (Δ = 0.8; P = 0.09), but at 33 d of age levels of LSC were higher compared with HSC (Δ = 2.4; P < 0.001). Agglutination of RRBC was measured at 14, 24, and 31 d of age to study levels of NAb binding RRBC during aging, and were not affected by feeding strategy at any age. In LSC compared with HSC broilers, levels of RRBC agglutination tended to be higher (P = 0.10) at 24 d of age, and were higher (P = 0.01) at 31 d of age. Levels of NAb binding SRBC at 14 d of age were higher in both untreated (P < 0.01) and 2-ME treated serum (P = 0.07).
3.1.2. NAAbAt 7 d of age, IgM binding the auto-antigen PC-OVA was higher (Δ = 0.9; P = 0.01) in EN compared with DN, while IgY was lower (Δ = 1.4; P = 0.005). No effects of sanitary conditions were found. At 33 d of age, LSC compared with HSC broilers had higher levels of both IgM (Δ = 2.4, P < 0.001), and IgY (Δ = 1.6, P = 0.01) binding PC-OVA, whereas no effects of feeding strategy were found.

Humoral immunity
Chap
ter
4
91
3.1.3. Antibodies binding LPS and MDPAntibodies binding LPS or MDP are difficult to define as either NAb or SpAb, because the broilers are expected to be exposed to LPS and MDP. It is however uncertain whether this is the case for the antigens used in the ELISA. Therefore, no distinction has been made between NAb and SpAb for these antigens. At 7 d of age, we observed that IgM and IgY antibodies binding LPS from E. coli were not affected by feeding strategy or sanitary conditions. Levels of IgM binding MDP were higher (Δ = 1.1; P = 0.01) in EN compared with DN broilers, whereas IgY binding MDP was unaffected by early life feeding strategy. Both IgM and IgY binding MDP were not affected by sanitary conditions. At 33 d of age, levels of IgM binding LPS tended to be lower (Δ = 0.7; P = 0.07) in EN compared with DN, but IgY binding LPS and antibodies binding MDP were unaffected by feeding strategy. In 33 d old broilers, we observed higher levels of IgM binding LPS from E. coli (Δ = 1.0; P = 0.01) and IgY (Δ = 3.1; P = 0.002) in LSC compared with HSC broilers. Antibodies binding MDP were higher (P < 0.001) in LSC compared with HSC broilers, for both IgM (Δ = 1.2) and IgY (Δ = 1.5).
3.1.4. Specific antibody levelsAgglutination of SRBC before (-10 and 0 d p.i., as measure of NAb) and after (7 d p.i., as a measure of SpAb) immunization with SRBC in untreated and 2-ME treated serum (Figure 1) was not affected by feeding strategy (EN versus DN), while we observed higher levels of agglutination in LSC compared with HSC broilers in both untreated and 2-ME treated serum before immunization (NAb), but not at 7 d p.i. (SpAb). Because of different basal levels of agglutinating antibodies prior to immunization, the fold change between 0 and 7 d p.i. was calculated. We observed higher fold change in untreated (Δ = 2.0; P = 0.02) serum of HSC compared with LSC, and 2-ME treated serum (Δ = 2.0; P < 0.001) in HSC compared with LSC. We found a tendency (P = 0.06) for an interaction (feeding strategy * sanitary conditions) that indicated the lowest fold change in 2-ME treated serum of EN-LSC compared with other groups. Sheep red blood cell lysis titers varied between 0 to 2 among all ages, and were not different between treatments (data not shown).
3.2. Antibodies binding chicken liver lysateWestern blots were conducted to study whether feeding strategy and sanitary conditions affected antibody binding patterns to a pool of liver antigen fragments at 33 d of age, thereby reflecting the NAAb repertoire (Vaz, 2000). We observed divergent IgM (Figure 3) and IgY (Figure 4) patterns binding CLH, which was confirmed by higher number of IgM and IgY stained bands by LSC compared with HSC broilers (both P < 0.001; Table 3). For both isotypes, we did not find differences between EN and DN, but differences between sanitary conditions (LSC versus HSC) were clearly present. Western blots revealed more liver fragments stained and higher staining intensity of these fragments by

Chapter 4
92
IgM and IgY from birds kept under LSC, compared with HSC, indicating that higher levels of self-binding antibodies are present under LSC.
4. Discussion
We studied effects of feeding strategy (EN versus DN) and sanitary conditions (LSC versus HSC) on the presence and development of maternal (mAb), natural (NAb), natural-auto (NAAb), and specific antibody (SpAb) levels in broiler chickens. Specifically, we measured levels of antibodies (IgM, IgY) binding (1) KLH, RRBC, and SRBC before immunization, as parameters for natural antibodies (NAb), (2) PC-OVA as parameter for natural auto-antibodies (NAAb), and (3) LPS and MDP as an indication of exposure to microbial associated molecular patterns. In addition, we measured specific antibodies (SpAb) binding SRBC after immunization with SRBC, to study adaptive antibody responses, and Western blotting was performed to study the NAAb repertoire binding CLH. Interactions among feeding strategy and sanitary conditions were not present for any of the parameters, indicating that the observed short-term effects of EN, do not affect antibody levels when housed under LSC conditions. In EN, compared with DN broilers, we observed increased IgM levels of NAb and NAAb, and antibodies binding MDP at 7 d of age. These differences were no longer present at 33 d of age suggesting no long-term effects of EN on the humoral immune system. Broilers reared under LSC compared with HSC, had higher levels of NAb agglutinating SRBC (-10 and 0 d p.i.) and RRBC (14, 24 and 31 d of age), as well as higher levels of NAb binding KLH, NAAb binding PC-OVA, and antibodies binding LPS and MDP. Absolute levels of SpAb agglutinating SRBC were not affected by treatments, but a higher fold change of SpAb agglutinating SRBC was observed in HSC, compared with LSC broilers.
4.1. Maternal IgYIn chickens, maternal antibodies (mAb) are transferred via both yolk (IgY) and albumen (IgM and IgA) (Hamal et al., 2006; Ismiraj et al., 2019; Van Dijk and Parmentier, 2020). Studies investigating yolk utilization after hatch, suggested better utilization of yolk constituents after EN compared with DN broilers (Noy et al., 1996; Noy and Sklan, 2001), potentially increasing the uptake of mAb from yolk in the first days after hatch. However in this study we found no differences in residual yolk disappearance among EN and DN broilers at 0, 1, 2, 3, and 7 d of age (data not shown). It appears that no consensus has been reached yet on effects of EN on yolk disappearance, and the reasons for the inconsistent findings among studies are yet unknown (reviewed by van der Wagt et al., 2020). So far, it is unknown whether maternal IgY deriving from the yolk is transported through the intestinal epithelium. To obtain a first insight whether uptake of mAb still might be affected by EN, we tested whether EN compared with DN

Humoral immunity
Chap
ter
4
93
broilers, have higher levels of mAb in blood plasma, which may contribute to passive (maternal) protection. We assume that the measured IgY at d 7 is of maternal origin, as IgY secreting neonatal B-cells are not detectable in spleen up to 6 d of age (Lawrence et al., 1981), and IgY gene expression was not detectable in intestinal tissue up to 10 d of age (Lammers et al., 2010). Levels of systemic IgY binding KLH, LPS, and MDP were not affected by feeding strategy, providing a first suggestion that mAb uptake is not enhanced after EN. Speculatively, our observation of lower levels of IgY binding PC-OVA in EN compared with DN broilers, might suggest greater turnover of NAAb in EN broilers but this cannot be confirmed within this study.
4.2. Specific antibody responsesWhereas levels of SpAb binding SRBC were unaffected by sanitary conditions at 31 d of age, fold change ratio in levels of SpAb binding SRBC between 0 and 7 d p.i. (24 and 31 d of age) was lower in LSC compared with HSC broilers. As levels of NAb binding SRBC were higher in LSC compared with HSC broilers at 24 d of age (0 d p.i.), we suggest that in LSC broilers, NAb levels are elevated, while HSC broilers have lower NAb levels and generate higher SpAb responses. This observation was also reported in repeatedly immunized laying hens, (Parmentier et al., 2002). Also in goldfish with high levels of NAb, compared with goldfish having low levels of NAb, had lower fold change of antibodies after immunization (Sinyakov et al., 2002). These observations may imply that dependent on the sanitary conditions, different immune strategies are used. Under LSC, pre-existing antibodies (NAb) act as a first line of defense, whereas under HSC stronger adaptive antibody responses are required. Main effects of feeding strategy on SpAb responses were absent, and therefore in line with previous research (Lamot et al., 2016; Simon et al., 2015).
4.3. Natural (auto) antibodiesIn the current study, we observed that both feeding strategy (EN versus DN) and sanitary conditions (LSC versus HSC), affected levels of systemic antibodies (NAb, NAAb, anti-LPS and anti-MDP). Effects of feeding strategy, however, were only present at 7 d of age, whereas effects of sanitary conditions were present from 14 d of age until the end of the experiment (33 d of age). We observed no interactions between feeding strategy and sanitary conditions, suggesting that EN broilers do not respond differently to LSC than DN broilers.
4.3.1. Early versus delayed nutritionAs IgM is barely transferred maternally (Ismiraj et al., 2019), the detected IgM at 7 d is likely endogenously produced. Immunoglobulin M secreting B cells were demonstrated to be present from 3 d of age onwards (Lawrence et al., 1981). The observed higher levels of IgM binding KLH, PC-OVA, and MDP in EN compared with DN broilers

Chapter 4
94
at 7 d of age, indicate accelerated maturation of the neonatal humoral immune system during the early life. Greater levels of NAb (anti-KLH, anti-MDP) suggest that EN compared with DN, improves defense towards infections at young ages (Berghof et al., 2019) and reduces risk of mortality (Star et al., 2007; Sun et al., 2011), at least up to 7 d of age. Whether the increased levels of NAAb (anti-PC-OVA) after EN at 7 d of age may contribute to better regulation of immune responses towards auto-antigens, remains unclear. Natural auto-antibodies are expected being responsible for clearance of apoptotic or senescent cells and damaged auto-molecules, preventing auto-immune responses and chronic inflammation in humans (Lutz, 2007; Nagele et al., 2013; Xu et al., 2015). The implications for chickens are, however, yet unclear. Simon et al. (2014) found no effects of feeding strategy up to 9 d of age on levels of NAb, but observed lower levels of natural IgM binding KLH in EN, compared with DN broilers, at 14 d of age. So far we have no explanation for this inconsistency. From 14 d onwards, we observed no effects of EN, compared with DN, on NAb binding SRBC or RRBC, which is in accordance with most other studies on NAb binding SRBC (Lamot et al., 2016) or KLH (Lamot et al., 2016; Simon et al., 2015, 2014), that reported no long-term (21 to 28 d of age) effects of feeding strategy on NAb levels.Our observation that EN compared with DN enhances levels of systemic antibodies (NAb, NAAb, anti-LPS and anti-MDP) may be caused by higher numbers of T and B-cells in the bursa after EN, compared with DN (Bar-Shira et al., 2005). These authors suggested the higher T end B cell numbers to be the result of increased exposure to antigens (derived from ingested feed and bacterial colonization) in EN. The findings of Bar-Shira et al. are supported by another study (Haghighi et al., 2006) that reported higher NAb levels in 14 d old broilers receiving probiotic bacteria immediately after hatch. In mammals, activation of Toll-like receptors (TLR) on B-cells contributes to differentiation of naïve B-cells to antibody-secreting plasma cells (Bekeredjian-Ding and Jego, 2009; Bernasconi et al., 2003; Kreuk et al., 2019; Ruprecht and Lanzavecchia, 2006), which is also suggested to be the case in chickens (St. Paul et al., 2012). Thus, greater exposure to antigens and TLR ligands in EN compared with DN broilers, may cause greater stimulation of naïve B-cells, and differentiation into plasma cells, eventually resulting in higher levels of systemic antibodies. Altogether, our data confirms that EN enhances maturation of the humoral immune system, but only temporarily (up to 7 d of age).
4.3.2. Low versus high sanitary conditionsAt 7 d of age, we observed no effects (all P > 0.10) of sanitary conditions on antibody levels. The contrast in sanitary conditions was applied from 3 d of age onwards, which may have been too short to cause differences at 7 d of age. Levels of NAb agglutinating SRBC and RRBC were higher in LSC compared with HSC from 14 d of age onwards. This was also reflected at 33 d of age by higher (P < 0.001) levels of IgY binding KLH

Humoral immunity
Chap
ter
4
95
in LSC compared with HSC broilers. Furthermore, levels of both IgM and IgY binding PC-OVA (NAAb), LPS, and MDP were higher (all P < 0.01) in LSC groups. Higher antigenic pressure in LSC compared with HSC broilers, likely resulted in greater activation of B-cells. In addition, by Western blotting we revealed different binding patterns of both IgM and IgY against CLH between LSC and HSC broilers. These observations indicate that differences in antigenic pressure during rearing (LSC versus HSC), might affect the binding repertoire against auto-antigens. Especially the binding pattern of IgY differed between sanitary conditions, showing a greater range of bound liver antigens in LSC compared with HSC broilers (Table 3). Our data suggest that in chickens, environmental components (such as antigenic pressure) alter antibody levels (NAb and NAAb) and repertoire (NAAb), apart from the genotype (de Jong et al., 2013; Parmentier et al., 2017). The increased levels of NAAb under LSC, could represent an adaptive mechanism to maintain immune homeostasis under high antigenic pressure. However, the exact mechanism regulating NAAb levels in LSC, compared with HSC broilers, remains unclear and requires further study, as the origin and exact function of NAAb in chickens remains unknown.
5. Conclusions
We demonstrated marginal interaction effects of feeding strategy (EN versus DN) and sanitary conditions (LSC versus HSC) on antibody levels (SpAb, NAb, NAAb) up to 35 d of age in broiler chickens. Early nutrition, compared with DN, enhanced levels of NAb and NAAb up to 7 d of age, while effects of LSC compared with HSC were observed from 14 d of age onwards. Our study suggests that antibody levels (SpAb, NAb, NAAb, anti-LPS and anti-MDP) are affected for an important part by environmental conditions (feeding strategy and sanitary conditions). It remains to be studied which components of EN and LSC affect humoral immunity, although greater exposure to antigens is the most likely route.
6. Acknowledgements
We are grateful to technicians and animal caretakers of CARUS for excellent broiler chicken caretaking and managing sanitary conditions. Elise den Hartog, Ruizhi Peng, and Frédérique van Uffelen are kindly acknowledged for laboratory analyses, as part of their MSc thesis project. This experiment is part of a larger research project on Early Nutrition for broilers, funded by Coppens Diervoeding B.V. and Wageningen University & Research.

Chapter 4
96
Tabl
es a
nd F
igur
es
Tabl
e 1:
IgM
and
IgY
bind
ing
the
antig
ens K
LH, P
C-O
VA, L
PS, o
r MD
P in
pla
sma
of 7
d o
ld b
roile
r chi
cken
s rec
eivi
ng e
ither
del
ayed
(DN
) or e
arly
nut
ritio
n (E
N),
kept
und
er h
igh
(HSC
) or
low
sani
tary
con
ditio
ns (L
SC).
Dat
a ar
e pr
esen
ted
as e
stim
ated
mar
gina
l mea
ns w
ith st
anda
rd e
rror
s (SE
M).
KLH
= k
eyho
le
limpe
t hem
ocya
nin,
PC
-OVA
= p
hosp
hory
l cho
line
– ov
albu
min
, LPS
= li
popo
lysa
ccha
ride
from
E. c
oli,
MD
P =
mur
amyl
di-p
eptid
e.
Ant
igen
Isot
ype
Tr
eatm
ents
Fi
xed
effec
ts1
D
N -
HSC
D
N -
LSC
EN
- H
SC
EN -
LSC
M
ean
SEM
n2
Mea
nSE
Mn
M
ean
SEM
n
Mea
nSE
Mn
SC
* F
eedi
ngFe
edin
gSC
Bat
ch *
SC
Bat
ch
KLH
IgM
0.
20.
38
0.
20.
38
0.
70.
38
0.
90.
38
0.
730.
080.
700.
070.
01
Ig
Y
6.0
0.5
8
4.9
0.4
8
5.1
0.4
8
4.6
0.4
8
0.54
0.21
0.09
0.05
0.55
PC-O
VAIg
M
1.3
0.3
8
1.7
0.3
8
2.4
0.3
8
2.3
0.3
8
0.38
0.01
0.54
-30.
94
Ig
Y
10.7
0.4
8
10.5
0.4
8
9.3
0.4
8
9.1
0.4
8
0.92
< 0.
010.
59 -
0.07
LPS
IgM
0.
90.
68
1.
00.
68
1.
20.
68
1.
30.
68
0.
990.
620.
82-
0.87
Ig
Y
5.0
0.4
8
4.2
0.4
8
4.4
0.4
8
4.1
0.4
8
0.51
0.35
0.15
-0.
09
MD
PIg
M
0.7
0.3
7
0.8
0.3
7
2.1
0.3
8
1.7
0.3
8
0.41
0.01
0.61
-0.
31
Ig
Y
6.3
0.3
7
5.7
0.3
7
5.6
0.3
7
5.6
0.3
8
0.35
0.14
0.37
-0.
04
1 Mod
el e
stabl
ished
P-v
alue
s for
fixe
d eff
ects
of fe
edin
g, sa
nita
ry c
ondi
tion,
bat
ch, a
nd th
eir t
wo-
way
inte
ract
ions
.2 N
umbe
r of r
eplic
ate
broi
lers
, hou
sed
with
5 b
roile
rs p
er p
en.
3 In
the
case
of P
-val
ues >
0,1
0 fo
r bat
ch *
SC
inte
ract
ions
, the
fixe
d eff
ect w
as le
ft ou
t of t
he m
odel
.

Humoral immunity
Chap
ter
4
97
Tabl
e 2:
IgM
and
IgY
bind
ing
the
antig
ens K
LH, P
C-O
VA, L
PS, o
r MD
P in
pla
sma
of 3
3 d
old
broi
ler c
hick
ens r
ecei
ving
eith
er d
elay
ed (D
N) o
r ear
ly n
utrit
ion
(EN
), ke
pt u
nder
hig
h (H
SC) o
r low
sani
tary
cond
ition
s (LS
C).
Dat
a are
pre
sent
ed as
estim
ated
mar
gina
l mea
ns w
ith st
anda
rd er
rors
(SEM
). K
LH =
key
hole
lim
pet
hem
ocya
nin,
PC
-OVA
= p
hosp
hory
l cho
line
– ov
albu
min
, LPS
= li
popo
lysa
ccha
ride
from
E. c
oli,
MD
P =
mur
amyl
di-p
eptid
e.
Ant
igen
Isot
ype
Tr
eatm
ents
Fi
xed
effec
ts1
D
N -
HSC
D
N -
LSC
EN
- H
SC
EN -
LSC
M
ean
SEM
n2
Mea
nSE
Mn
M
ean
SEM
n
Mea
nSE
Mn
SC
* F
eedi
ngFe
edin
gSC
Bat
ch3
KLH
IgM
3.
40.
46
4.
10.
47
3.
60.
48
3.
40.
48
0.
250.
700.
550.
75
Ig
Y
2.1
0.3
8
4.4
1.0
7
1.8
0.3
8
4.3
0.7
8
0.69
0.79
< 0.
001
0.69
PC-O
VAIg
M
7.4
0.5
8
9.6
0.7
7
6.8
0.5
8
9.5
0.6
8
0.57
0.53
< 0.
001
0.01
Ig
Y
6.9
0.5
8
8.9
0.5
7
7.3
0.5
8
8.6
0.5
8
0.50
0.89
0.01
0.07
LPS
IgM
6.
50.
38
7.
50.
46
5.
80.
38
6.
80.
37
0.
900.
07<
0.00
10.
80
Ig
Y
2.3
0.7
8
6.1
0.7
6
2.3
0.7
8
4.6
0.7
7
0.58
0.62
< 0.
010.
09
MD
PIg
M
5.3
0.3
8
6.7
0.4
6
5.7
0.3
8
6.8
0.4
7
0.63
0.48
0.00
1<
0.00
1
Ig
Y
3.4
0.3
4
5.1
0.4
2
3.8
0.3
4
5.2
0.3
3
0.60
0.49
< 0.
001
0.04
1 Mod
el e
stabl
ished
P-v
alue
s for
fixe
d eff
ects
of fe
edin
g, sa
nita
ry c
ondi
tion,
bat
ch, a
nd th
eir t
wo-
way
inte
ract
ions
.2 N
umbe
r of r
eplic
ate
broi
lers
, hou
sed
with
5 b
roile
rs p
er p
en.
3 Ther
e w
ere
no in
tera
ctio
n w
ith b
atch
.

Chapter 4
98
#*
**
Figu
re 1
: Agg
lutin
atio
n of
shee
p re
d bl
ood
cells
(SR
BC) b
y un
treat
ed (I
g To
tal)
or β
-mer
capt
oeth
anol
trea
ted
seru
m fr
om b
roile
r chi
cken
s rec
eivi
ng d
elay
ed (D
N)
or e
arly
nut
ritio
n (E
N) a
nd k
ept u
nder
hig
h (H
SC) o
r low
sani
tary
con
ditio
ns (L
SC),
at -1
0, 0
, and
7 d
pos
t i.m
. im
mun
izatio
n w
ith S
RBC
. Tim
epoi
nts w
ith *
in
dica
te si
gnifi
cant
(P ≤
0,0
5) e
ffect
s of s
anita
ry c
ondi
tions
, whi
le #
indi
cate
s ten
denc
ies (
P ≤
0,10
) for
diff
eren
ces b
etw
een
sani
tary
con
ditio
ns. n
= 1
2 re
plic
ate
broi
ler h
ouse
d in
gro
ups o
f 5 b
roile
rs p
er p
en fo
r all
grou
ps, e
xcep
t for
7 a
nd 1
1 d
post
imm
uniza
tion,
whe
re n
= 1
0 re
plic
ate
broi
lers
for a
ll gr
oups
with
exc
eptio
n of
DN
-HSC
(n =
12
broi
lers
).

Humoral immunity
Chap
ter
4
99
# #^ *
Figure 2: Agglutination of rabbit red blood cells (RRBC) by untreated serum from broiler chickens receiving delayed (DN) or early nutrition (EN) and kept under high (HSC) or low sanitary conditions (LSC), at 14, 24, and 31 d of age. Broilers were i.m. immunized with sheep red blood cells (SRBC) at 24 d of age (0 d post immunization). Timepoints with * indicate significant (P ≤ 0,05) effects of sanitary conditions, while # indicates tendencies (P ≤ 0,10) for differences between sanitary conditions, and #^ indicates tendencies for interactions between sanitary condition and feeding strategy. n = 12 replicate broiler housed in groups of 5 broilers per pen for all groups, except for 7 and 11 d post immunization where n = 10 replicate broilers for all groups with exception of DN-HSC (n = 12 broilers).

Chapter 4
100
Sample NC 1 Plasma PC 2
Feeding DN EN DN EN DN EN DN EN
Sancon HSC HSC HSC HSC LSC LSC LSC LSC
75 kD
250 kD
10 kD
50 kD
Figure 3: Western blot representing immunoglobulin M binding chicken liver homogenate (CLH) in plasma collected at 33 d of age in broiler chickens receiving delayed (DN) or early nutrition (EN) and kept under high (HSC) or low sanitary conditions (LSC). Each lane represents CLH binding profile of an individual broiler.1 NC = Negative control (phosphate buffered saline).2 PC = Positive control containing reference plasma from an adult layer hen (16 w of age).

Humoral immunity
Chap
ter
4
101
Sample NC 1 Plasma PC 2
Feeding DN EN DN EN DN EN DN EN
Sancon HSC HSC HSC HSC LSC LSC LSC LSC
75 kD
250 kD
10 kD
50 kD
Figure 4: Western blot representing immunoglobulin Y binding chicken liver homogenate (CLH) in plasma collected at 33 d of age in broiler chickens receiving delayed (DN) or early nutrition (EN) and kept under high (HSC) or low sanitary conditions (LSC). Each lane represents CLH binding profile of an individual broiler.1 NC = Negative control (phosphate buffered saline).2 PC = Positive control containing reference plasma from an adult layer hen (16 w of age).

Chapter 4
102
Table 3: Number of stained bands of immunoglobulins M (IgM) and Y (IgY) in Western blots, binding chicken liver homogenate in 33 d old broiler chickens housed under low (LSC) or high sanitary conditions (HSC). Data are presented as raw means with standard deviation (SD).
Isotype LSC HSC Sanitary condition2
Mean SD1 Mean SD
IgM 27.3 3.0 20.8 5.1 <0.001
IgY 18.4 4.9 7.1 1.6 <0.001
2 Model established P-value, there were no significant batch effects.n = 16 replicate broilers per group, divided over 2 batches.

Humoral immunity
Chap
ter
4
103
Sam
ple
NC 1
PC 2
NC 1
PC
2
Feed
ing
ENDN
ENDN
ENDN
ENDN
ENDN
ENDN
ENDN
ENDN
Sani
tary
Con
ditio
nHS
CLS
CHS
CLS
C
Liver
hom
ogen
ate
EN -
HSC
EN -
LSC
**
75 k
D
250
kD
10 k
D
50 k
D
Supp
lem
enta
ry F
igur
e 1:
Wes
tern
blo
ts re
pres
entin
g eff
ects
of d
iffer
ent c
hick
en li
ver h
omog
enat
es (C
LH) o
n im
mun
oglo
bulin
Y b
indi
ng p
rofil
e. C
hick
en li
ver
hom
ogen
ate
was
pre
pare
d fro
m o
ne H
SC b
roile
r (le
ft bl
ot) o
r a L
SC b
roile
r (rig
ht b
lot).
As b
oth
left
and
right
blo
ts sh
ow id
entic
al d
iffer
ence
s in
bind
ing
profi
le,
it ap
pear
s tha
t the
sour
ce o
f CLH
min
imal
ly a
ffect
s the
bin
ding
pro
file.
Lan
es w
ith a
n as
teris
k in
dica
te la
nes c
onta
inin
g Ig
Y bi
ndin
g pr
ofile
on
the
CLH
of t
he
sam
e br
oile
r.

CHAPTER 55

Effects of early nutrition and sanitary conditions on oral tolerance and antibody responses in broiler chickens
M.S. Hollemans1,2,3, G. de Vries Reilingh1, S. de Vries3, H.K. Parmentier1, A. Lammers1
1 Adaptation Physiology Group, Wageningen University2 Coppens Diervoeding B.V.3 Animal Nutrition Group, Wageningen University
Veterinary Sciences (2020) 7, 148DOI: 10.3390/vetsci7040148

Chapter 5
106
Abstract
Greater antigenic exposure may accelerate activation and maturation of the humoral immune system. After hatch, commercial broiler chickens can have early (EN) or delayed (DN) access to nutrition up to 72 h after hatch. The immune system of EN versus DN broilers is likely more exposed to antigens after hatch. This may contribute to activation and maturation of the immune system, but may also influence the development of oral tolerance, thereby altering later life antibody responses. We studied antibody (IgM, IgY, IgA) responses between 21 and 42 d of age in fast-growing EN and DN broilers, kept under low (LSC) or high sanitary conditions (HSC). In a first experiment (n = 51 broilers), we tested whether early oral exposure to bovine serum albumin (BSA) affected later life antibody responses towards BSA and a novel antigen: rabbit γ-globulin (RGG), under HSC. In a second experiment, a total of 480 EN and DN broilers were housed under either LSC or HSC, and we studied antibody responses against both BSA and RGG (n = 48 broilers per treatment) and growth performance. Broilers kept under LSC versus HSC, had higher antibody levels and severely depressed growth performance. Interactions between feeding strategy (EN versus DN) and sanitary conditions, or main effects of feeding strategy, on natural and specific antibody levels, and growth performance were not observed. Levels of IgA were elevated in EN versus DN broilers, in experiment I and in batch 2 of experiment II, but not in other batches of experiment II. We conclude that EN versus DN minimally contributes to regulation of antibody responses, irrespective of antigenic pressure in the rearing environment.

Oral tolerance and antibody responses
Chap
ter
5
107
1. Introduction
Just hatched broiler chickens can experience a prolonged delay in access to nutrition up to 72 h (delayed nutrition; DN), especially in the case of long post hatch transport [for review, see 1]. Broilers that received early nutrition (EN), thus immediate provision of nutrition after hatch onwards, had enhanced immune activation and maturation compared with DN broilers [reviewed by 2]. This is likely caused by early exposure of the immune system to antigens derived from commensal microbiota or ingested feed [3,4]. Thus, broilers receiving EN compared with DN, are expected to be exposed to a higher and more diverse load of antigens, derived from ingested feed and subsequent microbial colonization [5–7]. In chicken, antibody responses towards antigens were reduced when these antigens are fed within the first 72 h after hatch (“window of opportunity”), which is known as oral tolerance [8]. Interestingly, this window of opportunity parallels with the application of different feeding strategies (EN versus DN) during the first 72 h after hatch. Hence, it can be postulated that increased antigenic exposure as a result of EN, compared with DN, may affect the development of oral tolerance, resulting in altered later life antibody responses.Indeed, EN versus DN broilers that were housed under relative high antigenic pressure (floor housing) had lower IgY in blood plasma and growth depression after immunization with LPS and HuSA, compared with broilers housed under relative low antigenic pressure (cage housing) [9]. These authors suggested that effects of EN compared with DN on antibody responses may be affected by antigenic pressure. Studies comparing the later life immune system between EN and DN broilers under lower antigenic pressure, observed no differences among treatments [9,10]. This suggests that later life immune responses may be regulated by EN, but only when kept in a high antigenic pressure environment. Hence, we hypothesize that better regulation of antibody responses in EN compared with DN broilers, will be beneficial when broilers are housed under high antigenic pressure. To test this hypothesis, we executed two consecutive experiments to understand effects of feeding strategy (EN versus DN) and its interaction with antigenic pressure on later life antibody responses. The aim of experiment I was to test, under low antigenic pressure, whether EN may modulate later life antibody responses. In experiment II, we modelled contrasts in antigenic pressure by creating low (LSC) and high sanitary conditions (HSC). This allowed us to test whether the effects of feeding strategy on regulation of antibody responses and growth performance, depend on environmental antigenic pressure.

Chapter 5
108
2. Materials and Methods
2.1. Experimental DesignsThe experiments and respective procedures were ethically approved according to Dutch law under application number AVD104002016441, and were performed in climate respiration chambers (CRC) at the experimental facility. In both experiments, Ross 308 males were collected from a commercial hatchery within 1 h after hatch to minimize age differences, and immediately transported to the experimental facility. After arrival, broilers received an ID neck tag, and were distributed within 2 h over floor pens (1.1 * 1.8 m) containing SoftCell (Agromed GmbH, Kremsmünster, Austria) as bedding material, covered with chicken paper during the first 3 d of age to prevent litter uptake. In both experiments, light and climate settings were identical. From placement onwards, a 16 h light : 8 h dark schedule was applied. Ambient temperature was set at 36 °C (55% relative humidity) at 0 d of age and gradually reduced to 29 °C until 7 d, and then further gradually reduced to 18 °C (75% relative humidity) at 35 d. Relative humidity was set at 55% at the start of the experiment and gradually increased to 75% at 42 d. Levels of CO2 were maintained ≤ 2500 ppm and that of NH3 ≤ 20 ppm. In both experiments, broilers had ad libitum access to water and a commercial broiler diet, except for DN chickens, which had no access to feed and water during the first 72 h from placement onwards.
2.1.1. Experiment IThe experiment was conducted in a single CRC, and designed as a 2 x 2 factorial approach, with antigen feeding (BSA feeding, PBS feeding) and early life feeding strategy (EN, DN) as factors. The 4 treatments were distributed over 12 floor pens, each containing 4 broilers. Three surplus broilers were distributed over the treatments, resulting in a total of 13 broilers for all treatments, except for EN-BSA-fed broilers (n = 12). Body weight (BW) of individual broilers was measured weekly. Broilers were not vaccinated in the hatchery or during the study. Commercial pelletized broiler starter (0 – 14 d; digestible energy (DE): 2950 kcal / kg; total lysine: 12.2 g / kg) and finisher diets (14 – 42 d; DE: 3000 kcal / kg; total lysine: 11.3 g / kg) were fed.
2.1.2. Experiment IIThe experiment was designed as a 2 x 2 factorial approach with early life feeding strategy (EN, DN) and sanitary conditions (LSC, HSC) as factors. Low sanitary conditions were induced by introduction of used litter from commercial broiler farms (see section 2.2). The experiment was executed in 3 consecutive batches to account for variations in antigenic pressure due to differences in health status of litter-donating farms, as previously demonstrated in a pig model (van der Meer et al., 2016). Broilers (parent stock age: batch 1: 31 w, batch 2: 33 w, batch 3: 48 w) were housed in either an LSC

Oral tolerance and antibody responses
Chap
ter
5
109
or an HSC CRC, each containing 8 floor pens. Both CRC were completely identical in their set-up and were controlled for identical climate conditions (temperature, humidity, CO2, NH3) (van der Meer, 2017). Body weight and feed intake were measured weekly until 33 d of age to calculate average daily gain (ADG), feed intake (ADFI), and feed conversion ratio (FCR). Broilers were vaccinated against Newcastle disease at 3 d of age, but this was accidentally omitted in batch 1. Broilers received no other vaccinations in the hatchery or during the study. Commercial pelletized broiler starter (0 – 7 d; DE: 2850 kcal / kg; total lysine: 11.8 g / kg), grower (7 – 28 d; DE: 2900 kcal / kg; total lysine: 11.2 g / kg), and finisher diets (28 – 35 d; DE: 2950 kcal / kg; total lysine: 10.7 g / kg) were fed. The grower diet contained decoquinate (0.05 g / kg; Deccox 6%, Zoetis, Capelle aan den IJssel, the Netherlands).
2.2. Sanitary ConditionsIn experiment I, broilers were kept under HSC from placement onwards as follows. The HSC chamber was cleaned with water and disinfected (Halamid, Veip Disinfectants, Wijk bij Duurstede, The Netherlands) following the manufacturer’s instructions, and over-pressurized (100 ± 5 Pa) to prevent influx of external pathogens. A strict hygiene protocol (consisting of showering, cleaning and disinfection boots, wearing gloves and hairnet, and minimal pen entrance) was maintained. All procedures, except for dissection, were performed inside the chamber to prevent introduction of novel antigens. In experiment II, all broilers were kept under HSC (similar to experiment I) until 3 d of age, after which contrasts in sanitary conditions were made as follows. The HSC broilers were kept under HSC until the end of the experiment. Low sanitary conditions were induced as follows: the LSC chamber was under-pressurized (- 65 ± 5 Pa) and no hygiene protocol was maintained. Coveralls and boots were not cleaned and disinfected. Seven days before onset of each respective batch, litter was obtained from 3 commercial broiler farms with flock age of at least 35 d. The litter was collected at once during cleaning of the broiler houses, and after arrival at the experimental facility, litter was pooled by weight and stored in 8 - 10 kg portions at 4 °C. From 3 d of age onwards, one portion (8 – 10 kg) of homogenized used litter was distributed in each pen, every 4 d.
2.3. Induction of Oral Tolerance and ImmunizationsFrom placement until 3 d of age, broilers were orally fed with either BSA to induce tolerance (V = 0.25 mL; 100 mg / mL; Sigma Aldrich CO, St. Louis, MO, USA) or phosphate buffered saline (PBS) as a control, every 12 h. In experiment I, BSA or PBS was administered by pipetting the volume in the beak of each broiler. In experiment II, BSA was administered by oral gavage in the esophagus via a blunted needle. An intratracheal dose (V = 0.5 mL) containing 0.5 mg BSA and 0.5 mg RGG (rabbit γ-globulin, Sigma) was given at 21 and 22 d of age (experiment I; all broilers) or 24 d of age (experiment II; 2 broilers per pen) via a blunted needle as a secondary immunization.

Chapter 5
110
2.4. Sample CollectionIn experiment I, blood was collected at 21, 24, 28, 35, and 42 d (0, 3, 7, 14, and 21 d post immunization (p.i.)) from the wing vein of all broilers in heparinized tubes, and subsequently centrifuged (12000 g, 5 min) to obtain plasma. In experiment II, blood was collected at 14, 24, 29, and 33 d (-10, 0, 5, and 9 d p.i.) from 1 broiler per pen in tubes, incubated for 2 h at 4 °C, and subsequently centrifuged (12000 g, 5 min) to obtain serum. Bile was collected from all broilers either at 42 d of age (experiment I) or 33 and 34 d of age (experiment II) as follows. After euthanizing the broiler, the bile bladder was located, and contents were collected with a syringe and needle, and placed in tubes. Spleens were located, collected and weighed. Plasma, sera, and bile were stored at -20 °C upon further analyses. In experiment II, after euthanizing the broiler, the whole right cecum with contents was collected within 6 h after hatch and at 1, 2, 3, and 7 d of age from one broiler per pen. The cecum was weighed, placed in sterile 0.9% NaCl, and homogenized with a tissue homogenizer (IKA T50, IKA-Werke, Staufen, Germany). Afterwards, the homogenate was diluted 1 : 1 in sterile 15% glycerol, and stored at -80 °C pending further analyses.
2.5. Bacterial Load in CecumAll procedures were performed under aseptic conditions. The specific culture media MacConkey agar (MAC; CM0007), De Man, Rogosa and Sharpe agar (MRS; CM0359), and blood agar (BA; OXOIPB5039A) were prepared according to the instructions of the supplier (Oxoid Microbiology Products, Hampshire, United Kingdom). After pouring the specific culture media, homogenates were thawed at 20 °C and singular, 10-fold serial dilutions in sterile PBS were spread on the agar plates (100 µl/ plate). Plates were incubated upside down at 37 °C in an incubator for 36 h (BA, MAC) or 48 h (MRS). After incubation, numbers of colony forming units (CFU) were counted and expressed per g of collected cecal tissue.
2.6. Antibody LevelsTwo-step indirect enzyme-linked immunosorbent assays (ELISA) were performed to measure IgM and IgY levels in plasma or serum, and IgA levels in bile, binding either BSA or rabbit γ-globulin (RGG). Flat-bottomed, 96-well medium binding plates (Greiner Bio-One) were coated with either 2.5 µg/mL BSA or 2.5 µg/mL RGG in 100 µl coating buffer (5.3 g / L Na2CO3, 4.2 g / L NaHCO3; pH 9.6), and incubated overnight at 4 °C. After washing with tap water containing 0.05% Tween® 20, plates were filled with 100 µl dilution buffer (PBS (10.26 g / L Na2HPO4·2H2O, 2.36 g / L KH2PO4, 4.5 g / L NaCl; pH 7.2) containing 0.5% normal horse serum and 0.05% Tween® 20). Prediluted samples (1:10 in dilution buffer) were further diluted to 1:40, 1:160, 1:640 and 1:2560, and a standard positive control was included in duplicate from pooled plasma, serum, or bile for each respective day. Plates were incubated for

Oral tolerance and antibody responses
Chap
ter
5
111
1.5 h at 20 ºC. After washing, plates were incubated with 1:20.000-diluted goat-anti-chicken IgA, goat-anti-chicken IgM, or goat-anti-chicken IgY, all labelled with horse radish peroxidase (Bethyl Laboratories Inc, Montgomery, U.S.A.), for 1.5 h at 20 °C. After washing, 100 µl substrate buffer (containing reverse osmosis purified water, 10% tetramethylbenzidine buffer (15.0 g / L sodium acetate, 1.43 g / L urea hydrogen peroxide; pH 5.5) and 1% tetramethylbenzidine (8 g / L DMSO) were added. After 15 min incubation at 20 °C, the reaction was stopped with 50 µl of 1.25 M H2SO4
solution. Extinctions were measured with a Multiskan GO (Thermo scientific, Breda, The Netherlands) at 450 nm. Titers were expressed as log2 values of the dilutions that gave an extinction closest to 50% of Emax, where Emax represents the highest mean extinction of the standard positive.
2.7. Statistical AnalysesData were processed, analyzed, and presented using R version 3.6.1 [11]. Linear mixed models were established with the nlme package version 3.1-140 [12]. Model residuals of the linear models were tested to verify assumptions of normality and homogeneity by QQ-plots and residual plots. Differences among means with P ≤ 0.05 were considered statistically significant, and with P ≤ 0.10 were considered tendencies. All data are presented as (back-transformed) estimated marginal means with standard errors unless specified otherwise.
2.7.1. Experiment IGeneral linear models were established to estimate effects of BSA feeding (PBS fed, BSA fed), feeding (DN, EN), and their interaction on antibody levels binding either BSA or RGG in plasma (IgM, IgY) on 0, 14, 21 d p.i., fold change (ratio between IgM or IgY levels at 7 versus 0 d p.i.), IgA levels in bile (21 d p.i.), BW (0, 21, 24, 42 d), and ADG (0 – 24, 21 – 24 , 24 – 42, 0 – 42) with individual broiler within pen as the experimental unit, and pen as random effect. Logarithmic transformation was applied to normalize residuals on all titer and performance data, except for IgA binding BSA and RGG.
2.7.2. Experiment IIGeneral linear models were established to estimate effects of sanitary condition (LSC, HSC), feeding (DN, EN), and their interaction on antibody levels binding either BSA or RGG in serum (IgM, IgY) on -10, 0, 7 d p.i., and fold change (ratio 5:0 levels d p.i.; IgM, IgY), with pen as the experimental unit. Batch (1, 2, 3) and its interaction with treatment effects was used as blocking factor. Comparable models were used to analyze levels of bile and spleen weights among treatments. As bile and spleens were collected on 2 consecutive days (10, 11 d p.i.), sampling day was added as blocking factor. Day was found not to be significant and therefore eliminated from the models. Effects of treatments on BW (3, 33 d), ADG (3 – 14; 14 – 28; 28 – 33 d), and FCR (3 – 14; 14

Chapter 5
112
– 28; 28 – 33 d) were estimated with general linear models using sanitary condition, feeding, and their respective interaction as fixed effects, with pen as the experimental unit. Fixed effects of treatments (EN, DN) on bacterial colonization in ceca were analyzed using the non-parametric Kruskal-Wallis test, for each day (0, 1, 2, 3, 7) separately. For day 7, effects of sanitary condition (HSC, LSC) were also analyzed. Logarithmic transformation was applied to normalize residuals of all titer and performance data. Interactions between batch and other main effects (feeding, sanitary condition, feeding * sanitary condition) were tested but excluded from the model if P > 0.10.
3. Results
3.1. Experiment I: Effects of Early Antigenic Exposure on Later Life Antibody ResponsesIn experiment I, we studied effects of BSA feeding and feeding strategy on antibody levels in blood plasma prior to immunization (0 d p.i.; natural antibody (NAb) levels), and specific antibodies (SpAb) after immunization with BSA (7, 14, 21 d p.i.). Both NAb and SpAb levels binding BSA were not affected by the interaction between BSA-feeding and EN, or main effects of EN (Figure 1-A). At 0 d p.i., a tendency (P = 0.10) for IgY binding BSA was found, indicating lower levels of NAb binding BSA, in BSA-fed broilers (1.3 ± 0.3), compared with PBS-fed broilers (2.1 ± 0.5). At 14 and 21 d p.i., levels of both IgM and IgY SpAb binding BSA were reduced (P ≤ 0.05) in the BSA-fed groups, compared with the PBS-fed group.Specific antibody responses towards RGG were measured to test whether BSA feeding at 0 to 3 d of age induced specific tolerance towards BSA or not. For this purpose, broilers were fed with BSA, but not with RGG, and were subsequently immunized with both BSA and RGG at 21 d of age. This approach enabled us investigate also whether EN versus DN affects regular antibody responses. No main effects (P > 0.10) of BSA feeding on antibodies binding RGG (Figure 1-B) were present, indicating that indeed antigen feeding in early life is required to modulate antibody responses. Also no interaction effects, or main effects of feeding strategy, were present on antibodies binding RGG. However, a tendency (P = 0.10) at 21 d p.i. indicated higher levels of IgY SpAb binding RGG in BSA-fed broilers (9.1 ± 0.4), compared with PBS-fed broilers (9.9 ± 0.5). The fold change at 7 d p.i. was lower (P = 0.05) for IgY binding RGG in broilers receiving EN (11.8 ± 1.9), compared with DN (16.7 ± 2.6).Levels of IgA binding BSA were compared between BSA and PBS fed broilers in bile collected at 21 d p.i.. Although no interaction between BSA feeding and EN was found (P = 0.47), both BSA-feeding (P = 0.05) and EN (P = 0.05) resulted in higher IgA levels binding BSA (Table 1). We confirmed that higher levels of IgA were BSA-specific, as IgA binding RGG was not affected by any of the treatments.

Oral tolerance and antibody responses
Chap
ter
5
113
No effects of BSA-feeding on BW and ADG were found (P > 0.05), and therefore BSA and PBS-fed groups were combined in Table 2. Body weight was greater (P ≤ 0.05) upon 24 d of age, and slaughter weight (d 42) tended to be greater (Δ = 216 g; P=0.09) in EN, compared with DN group. Average daily gain was greater in EN compared with DN groups between 0 – 21 d (P = 0.001) and 21 – 24 d (P = 0.07).
3.1.1. Antibody Levels and ResponsesSimilar as in experiment I, we measured levels of NAb and SpAb binding BSA or RGG in BSA fed (0 – 3 d of age) broilers after BSA and RGG immunization. We observed no interaction between feeding strategy and sanitary conditions on NAb and SpAb levels (IgM and IgY) binding BSA (Figure 3-A), or RGG (Figure 3-B). IgY binding RGG tended to be lower (Δ = 0.7; P = 0.09) at 14 d / -10 d p.i. in EN, compared with DN groups. Broilers housed under LSC compared with HSC, had increased levels of both NAb and SpAb. We observed increased (P ≤ 0.05) NAb levels binding BSA or RGG under LSC, at 14 d / -10 d p.i. (IgM) and 24 d / 0 d p.i. (IgM, IgY). Specific antibody levels binding RGG (IgM) and BSA (IgM, IgY) were increased (P < 0.05) in LSC groups. In LSC compared with HSC groups, we observed reduced fold change (within 7 d p.i.) of BSA binding IgM (P = 0.01), but not IgY (Table 3). With regard to antibodies binding RGG, fold change was higher in HSC, compared with LSC for IgM (P < 0.01) and a tendency was found for IgY (P= 0.07).We measured biliary levels of IgA binding BSA or RGG to study effects of feeding strategy (EN versus DN) and sanitary conditions (LSC versus HSC), which after release in the intestinal tract likely plays a role in maintenance of mucosal homeostasis [5–7]. Biliary IgA binding BSA at 11 d p.i. was not affected by the interaction between feeding strategy and sanitary conditions. However, in batch 2, a tendency for an interaction (P = 0.06) between batch and feeding strategy indicated higher (Δ = 0.9) levels of IgA binding BSA in EN compared with DN groups. Immunoglobulin A levels binding RGG were consistently higher (Δ = 0.3; P = 0.03) over all batches in EN compared with DN groups. With regard to sanitary conditions, LSC groups had higher (P < 0.001) IgA levels binding BSA (Δ = 1.7), and RGG (Δ = 1.3; Table 4).
3.1.2. Growth PerformanceAs we conducted experiment II in 3 consecutive batches, in which litter of different broiler farms was introduced to obtain LSC, we tested interactions between batch and sanitary conditions, which may indicate differences in antigenic pressure among batches in the LSC groups. Interactions between batch and sanitary conditions were present (P ≤ 0.05) for BW, ADG, and FCR. In general, greatest differences in BW between LSC and HSC were observed at 33 d of age, with greatest effect size in batch 1 (Δ = 623 ± 62.7 g), followed by batch 3 (Δ = 419 ± 62.7 g), and finally batch 2 (Δ = 301 ± 62.7 g).Broiler growth performance was measured in this experiment to study whether EN

Chapter 5
114
compared with DN broilers, were better able to cope with high antigenic pressure or not (LSC versus HSC). Average daily feed intake between 3 – 14 d of age was greatest in EN broilers housed under HSC (37 ± 0.7 g) and lowest in DN broilers housed under LSC (21 ± 0.7 g) (feeding strategy * sanitary conditions, P = 0.03). No interaction between feeding strategy and sanitary conditions was found for BW, ADG, and FCR (Table 5). At 3 d of age (after 72 h delay in nutrition), we observed greater (Δ = 30.2 g; P < 0.001) BW in EN compared with DN groups. Differences in BW between EN and DN groups persisted until 33 d of age (Δ = 210 g). Throughout the complete experiment, ADFI was affected by feeding strategy (P ≤ 0.001), resulting in greater (Δ = 14 g) ADFI between 3 and 33 d of age. We observed reduced (Δ = 0.06; P = 0.01) feed conversion ratio in EN compared with DN groups between 14 and 28 d. Between 3 and 33 d of age, FCR was higher (Δ = 0.04; P ≤ 0.001) in EN compared with DN groups. As large differences in final BW were present between EN and DN, we corrected FCR to a standardized BW of 2000 g at 33 d of age [5–7]. Standardized FCR was however unaffected by feeding strategy.The introduction of LSC from 3 d of age onwards resulted in a reduction (Δ = 448 g; P < 0.001) of BW at 33 d of age in LSC compared with HSC groups. Between 3 – 33 d of age, ADG was greater (Δ = 9 g; P < 0.001) in EN compared with DN, and lower (Δ = -17 g; P < 0.001) in LSC compared with HSC. Feed conversion ratio was unaffected by sanitary conditions up to 14 d, but FCR was increased in LSC compared with HSC groups at 14 – 28 d (Δ = 0.06; P < 0.01) and 28 – 33 d (Δ = 0.06; P = 0.03). Between 3 and 33 d of age, FCR was higher (Δ = 0.07; P < 0.001) in LSC compared with HSC. Feed conversion ratio standardized to 2000 g of BW at 33 d was greater (Δ = 0.11; P < 0.001) in LSC, compared with HSC groups.
3.2 Experiment II: Effects of early life feeding strategy on antibody responses under different sanitary conditions3.2.1. Bacterial colonizationBacterial load (CFU / g cecal tissue) for cultivable aerobic bacteria on BA, MAC, and MRS agar is presented in Figure 3. We observed relative great within group variation in colonization irrespective of feeding strategy, on all agars directly after hatch and at 1 d of age. At 1 d of age, it appeared that some broilers were already colonized, while others were not. Within group variation declined and aerobic counts stabilized between 107.5 and 1010 CFU from 2 d of age onwards for BA and MAC, and from 3 d of age for MRS. At 3 d of age tendencies (all P ≤ 0.10) were present suggesting more CFU on BA and MAC agar in DN broilers, compared with EN broilers. At 7 d of age, no differences between sanitary conditions were present (data not presented).
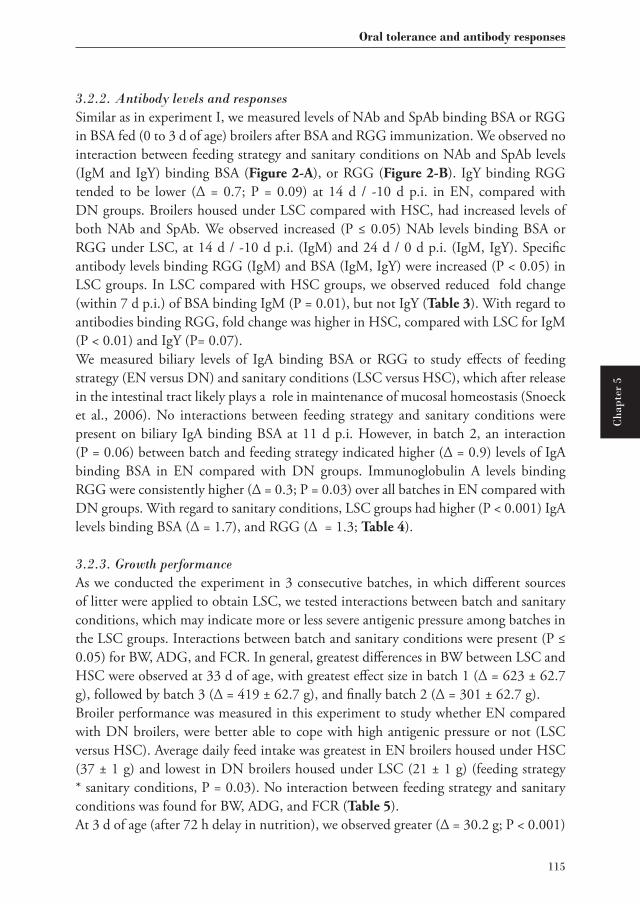
Oral tolerance and antibody responses
Chap
ter
5
115
3.2.2. Antibody levels and responsesSimilar as in experiment I, we measured levels of NAb and SpAb binding BSA or RGG in BSA fed (0 to 3 d of age) broilers after BSA and RGG immunization. We observed no interaction between feeding strategy and sanitary conditions on NAb and SpAb levels (IgM and IgY) binding BSA (Figure 2-A), or RGG (Figure 2-B). IgY binding RGG tended to be lower (Δ = 0.7; P = 0.09) at 14 d / -10 d p.i. in EN, compared with DN groups. Broilers housed under LSC compared with HSC, had increased levels of both NAb and SpAb. We observed increased (P ≤ 0.05) NAb levels binding BSA or RGG under LSC, at 14 d / -10 d p.i. (IgM) and 24 d / 0 d p.i. (IgM, IgY). Specific antibody levels binding RGG (IgM) and BSA (IgM, IgY) were increased (P < 0.05) in LSC groups. In LSC compared with HSC groups, we observed reduced fold change (within 7 d p.i.) of BSA binding IgM (P = 0.01), but not IgY (Table 3). With regard to antibodies binding RGG, fold change was higher in HSC, compared with LSC for IgM (P < 0.01) and IgY (P= 0.07).We measured biliary levels of IgA binding BSA or RGG to study effects of feeding strategy (EN versus DN) and sanitary conditions (LSC versus HSC), which after release in the intestinal tract likely plays a role in maintenance of mucosal homeostasis (Snoeck et al., 2006). No interactions between feeding strategy and sanitary conditions were present on biliary IgA binding BSA at 11 d p.i. However, in batch 2, an interaction (P = 0.06) between batch and feeding strategy indicated higher (Δ = 0.9) levels of IgA binding BSA in EN compared with DN groups. Immunoglobulin A levels binding RGG were consistently higher (Δ = 0.3; P = 0.03) over all batches in EN compared with DN groups. With regard to sanitary conditions, LSC groups had higher (P < 0.001) IgA levels binding BSA (Δ = 1.7), and RGG (Δ = 1.3; Table 4).
3.2.3. Growth performanceAs we conducted the experiment in 3 consecutive batches, in which different sources of litter were applied to obtain LSC, we tested interactions between batch and sanitary conditions, which may indicate more or less severe antigenic pressure among batches in the LSC groups. Interactions between batch and sanitary conditions were present (P ≤ 0.05) for BW, ADG, and FCR. In general, greatest differences in BW between LSC and HSC were observed at 33 d of age, with greatest effect size in batch 1 (Δ = 623 ± 62.7 g), followed by batch 3 (Δ = 419 ± 62.7 g), and finally batch 2 (Δ = 301 ± 62.7 g).Broiler performance was measured in this experiment to study whether EN compared with DN broilers, were better able to cope with high antigenic pressure or not (LSC versus HSC). Average daily feed intake was greatest in EN broilers housed under HSC (37 ± 1 g) and lowest in DN broilers housed under LSC (21 ± 1 g) (feeding strategy * sanitary conditions, P = 0.03). No interaction between feeding strategy and sanitary conditions was found for BW, ADG, and FCR (Table 5). At 3 d of age (after 72 h delay in nutrition), we observed greater (Δ = 30.2 g; P < 0.001)

Chapter 5
116
BW in EN compared with DN groups. Differences between BW of EN and DN groups persisted until 33 d of age (Δ = 210 g). Throughout the complete experiment, ADFI was affected by feeding strategy (P ≤ 0.001), resulting in greater (Δ = 14 g) ADFI between 3 and 33 d of age. We observed reduced (Δ = 0.06; P = 0.01) feed conversion ratio in EN compared with DN groups between 14 and 28 d. Between 3 and 33 d of age, FCR was higher (Δ = 0.04; P ≤ 0.001) in EN compared with DN groups. As large differences in final BW were present between EN and DN, we corrected FCR to a standardized end weight of 2000 g (Aviagen, 2014). Standardized FCR was however not affected by feeding strategy.The introduction of LSC from 3 d of age onwards resulted in a reduction (Δ = 448 g; P < 0.001) of BW at 33 d of age in LSC compared with HSC groups. Between 3 to 33 d of age, ADG was greater (Δ = 9 g; P < 0.001) in EN compared with DN, and lower (Δ = -17 g; P < 0.001) in LSC compared with HSC. Feed conversion ratio was unaffected by sanitary conditions up to 14 d, but FCR was increased in LSC compared with HSC groups at 14 – 28 d (Δ = 0.06; P < 0.01) and 28 – 33 d (Δ = 0.06; P = 0.03). Between 3 and 33 d of age, FCR was higher (Δ = 0.07; P < 0.001) in LSC compared with HSC. Feed conversion ratio standardized to a BW of 2000 g at 33 d was greater (Δ = 0.11; P < 0.001) in LSC, compared with HSC groups.
4. Discussion
We studied whether antibody responses of broilers are influenced (either increased or decreased) by early life feeding strategy (EN versus DN) and sanitary conditions (LSC versus HSC), in two consecutive experiments. First, we studied whether feeding BSA during the first 3 d of age (“window of opportunity”), affects later life antibody responses, and its interaction with feeding strategy, through the development of oral tolerance. Second, we tested the effects of EN on (regulation of ) antibody immune responses and growth performance under either HSC or LSC. We observed no effects of feeding strategy on antibody responses, irrespective of sanitary conditions. Broilers kept under LSC, compared with HSC, had higher levels of natural antibodies (NAb) and smaller fold change of specific antibodies (SpAb) after BSA and RGG immunization, and growth performance was reduced.
4.1. Aerobic Bacterial Colonization after Early NutritionAccelerated maturation of the immune system after EN compared with DN, has been suggested to be caused by enhanced bacterial colonization of the intestinal tract [5–7]. Short term effects of EN compared with DN, were found on intestinal bacterial load [13]. Data on effects of EN compared with DN on intestinal bacterial composition suggest temporal differences in ileal bacterial composition up to 9 d of age [13]. To

Oral tolerance and antibody responses
Chap
ter
5
117
relate these effects to antibody responses, we analyzed the colonization dynamics of culturable aerobic bacteria in ceca between EN and DN broilers in the first week post hatch (experiment II). The intestinal tract of broilers was rapidly colonized by bacteria within the first days after hatch and the total number of colonizing bacteria stabilized around 3 d of age, which is in accordance with previous research [reviewed by 14]. Relative high within treatment group variation up to 2 (BA, MAC) or 3 (MRS) d of age may suggest divergent colonization patterns among individuals. We observed no significant effects of feeding strategy (EN versus DN) up to 3 d of age on bacterial colonization, suggesting that EN, compared with DN, minimally affects aerobic bacterial load. In EN compared with DN broilers, aerobic bacterial load tended to be lower at 3 d, which was also observed before by others [5]. Speculatively, this may reflect earlier replacement of aerobes (E. coli, Enterococcus spp.) by obligate anaerobic species after EN, as suggested before [5].
4.2. Early-Life BSA Feeding Lowers Later Life Antibody Responses Towards BSA under High Sanitary ConditionsIn experiment I, we first tested whether early life oral exposure towards antigens affected later life antibody responses. Therefore, BSA or PBS (negative control) was orally administered during the first 3 d of age. At 21 d of age, broilers received an i.t. BSA immunization, following procedures derived from the oral tolerance model in laying hens [8]. Although broilers are known to be immunologically different from laying hens [15–17], our study demonstrates that the mechanism of oral tolerance also exists in broilers. Thus, our findings confirm that after immunization at 21 d in broilers, antibody responses are lowered towards antigens that have been fed in the first 3 d after hatch [8,18,19]. We also investigated whether BSA feeding in early life (0 – 3 d of age) affects SpAb responses to a non-BSA related antigen. Therefore, broilers were immunized i.t. with RGG at 21 d of age, to test whether antibody responses differed between BSA and PBS-fed groups. We observed that systemic IgM and IgY (Figure 1-B) and biliary IgA (Table 1) antibodies binding RGG were unaffected (P ≥ 0.05) by BSA feeding. Thus, early life oral antigen exposure affected antibody responses in a specific fashion towards the specifically fed antigen, and not to novel, unrelated antigens. Effects of BSA feeding on IgA responses in bile were studied at 21 d p.i. as an indicator for immune regulation: IgA is present at mucosal surfaces and contributes to immune homeostasis by binding antigens in the intestinal lumen and coating intestinal bacteria [20–22]. Our finding that BSA feeding results in higher levels of IgA binding BSA, suggests that early life antigen exposure also affects IgA responses. In summary, we demonstrated that the specific IgA response is increased, and specific IgM and IgY responses are lowered, by oral exposure to antigen (BSA) during the first 3 d of age. The main objective of experiment I was to test whether the feeding strategy (EN versus DN) affects later life antibody responses towards BSA and RGG in BSA-fed broilers.

Chapter 5
118
We observed no effects of feeding strategy on systemic antibody responses towards BSA or RGG, indicating that immediate provision of nutrition after hatch (EN) does not interfere with antibody responses at later life. Irrespective of BSA feeding or not, we observed higher levels of biliary IgA binding BSA in EN broilers, suggesting that EN contributes to a more anti-inflammatory immune status in EN broilers. We would like to emphasize that experiment I was conducted under HSC. Limited antigenic pressure in experiment I may explain the lack of differences in IgM and IgY responses between EN and DN broilers, as less regulation of immune responses was required. Therefore, we designed a second experiment where broilers were kept under LSC or HSC.
4.3. Introduction of Low Sanitary ConditionsTo model contrasts in antigenic pressure in experiment II, we introduced either LSC and HSC from 3 d of age onwards, according to a pig model [23,24]. As litter from 3 different broiler farms per batch was used in LSC, we consider the obtained antigenic pressure to be illustrative for the range of antigens found at typical commercial broiler farms. Throughout the experiment, growth performance of broilers was depressed in LSC compared with HSC groups. Relative spleen weights tended to be greater (P = 0.09) at 33 d of age in LSC (0.26 ± 0.09), compared with HSC broilers (0.11 ± 0.09), indicating greater activity of the immune system [25]. From these data we conclude that LSC were successfully induced. Batch and batch * treatment effects were present in this broiler model, which is in line with the pig model [26]. We observed interactions (P ≤ 0.05) between batch and sanitary conditions for IgM binding BSA or RGG at 14 d / -10 d p.i., as well for BW (33 d of age), ADG (all phases), FCR (3 – 14 d), and standardized FCR. The observed batch effects did not change the direction, but only magnitude, of the observed effects. Hence, batches were not analyzed separately.
4.4. Antibody Responses and Performance after Early Nutrition under Different Sanitary ConditionsIn experiment II we aimed to compare antibody responses and growth performance of EN and DN broilers kept under either LSC or HSC. We could not confirm our hypothesis that EN versus DN broilers housed under LSC, differed in growth performance or antibody responses after BSA and RGG immunization. This was unexpected, as lower IgY responses and enhanced performance in EN compared with DN broilers were reported in a previous study [27]. In that study, however, broilers were immunized at one time point with a combination of the model antigens HuSA and LPS at 28 d of age, while in our study, LSC broilers were continuously subjected to high antigenic pressure from 3 d of age onwards. In experiment II, we observed higher BSA specific IgA levels in EN compared with DN broilers in batch 2, but not in other batches (batch * feeding strategy interaction; P = 0.06). Levels of IgA binding RGG were found to be higher in EN compared with DN broilers, which is in contrast with experiment I, where we

Oral tolerance and antibody responses
Chap
ter
5
119
observed no effects of feeding strategy. Because titer differences (Δ = 0.3) between EN and DN groups were relatively small in experiment I, it is unclear whether the observed effects are biologically relevant. In summary, we conclude that EN compared with DN, minimally affects antibody responses, regardless of sanitary conditions, although effects of feeding strategy on biliary IgA (both BSA and RGG) remain debatable.
4.5. Low Sanitary Conditions Increase Antibody LevelsBroilers housed under LSC from 3 d onwards appeared to adapt towards the higher antigenic pressure from 14 d of age onwards. Levels of NAb binding BSA or RGG before immunization with BSA and RGG, were higher in LSC, compared with HSC broilers, at 14 d (-10 d p.i.; IgM) and 24 d (0 d p.i.; IgM, IgY) of age. Higher levels of natural IgM and the interaction between batch and sanitary condition on IgM levels, suggest that IgM NAb levels are affected by antigenic pressure from at least 14 d of age. Broilers kept under HSC, compared with LSC, had higher fold change of IgM binding BSA or RGG (P ≤ 0.01), and IgY binding RGG (P = 0.07) after immunization. It is tempting to speculate that the higher levels of NAb and lower fold change of SpAb after immunization in LSC broilers may indicate different defense strategies of the immune system. Whereas LSC broilers may depend on a less specific antibody (NAb) repertoire as a first line of defense, broilers under HSC need to generate higher specific immune responses (SpAb) after antigenic stimulation. Higher NAb levels, and lower fold change of specific antibodies, were reported in layer hens that were continuously immunized with other antigens, compared with non-immunized hens [27]. The observed higher levels of biliary IgA binding BSA or RGG (both P < 0.001) in LSC, compared with HSC broilers, indicates increased protection of mucosal surfaces in LSC broilers [20,21]. This suggests that the immune system prevents innocuous responses to antigens during higher antigenic pressure by increasing IgA levels.
5. Conclusions
We demonstrated that EN compared with DN marginally affected numbers of culturable aerobic bacteria in cecum. Early nutrition resulted in higher biliary levels of IgA, but systemic IgM and IgY responses were not affected. Irrespective of feeding strategy, LSC compared with HSC broilers were found to have depressed growth performance, and IgM and IgY NAb levels were increased. As there was no interaction between feeding strategy and sanitary conditions, we conclude that EN versus DN minimally contributes to regulation of antibody responses, irrespective of antigenic pressure in the rearing environment.

Chapter 5
120
6. Acknowledgments
Walter Gerrits and Bas Kemp are acknowledged for their input in the experimental design. We thank Ronald Wormgoor and Sherine Gasho-Assaad (CARUS staff of Wageningen UR) for excellent animal caretaking and procedures. Janine Koppes, Qiying Yang and Juan Arias Robledo are kindly acknowledged for help during the experiment and laboratory analyses within their MSc thesis project.

Oral tolerance and antibody responses
Chap
ter
5
121
Tables and Figures
* *
# * *
#
Figure 1: IgM and IgY binding bovine serum albumin (BSA; panel A) or rabbit γ-globulin (RGG; panel B) in plasma of broiler chickens fed with BSA during the first 3 d of age, or not, and receiving either delayed (DN) or early nutrition (EN) in experiment I. Broilers were intratracheally immunized with BSA and RGG at 21 d of age (0 d p.i.). Data are presented as estimated marginal means with error bars representing the standard error. Within different ages, differences between means of BSA and PBS-fed groups are indicated by * (P ≤ 0.05) or # (P ≤ 0.10). n = 13 replicate broilers, housed in groups of 4 to 5 broilers per pen for all groups, except for EN-BSA-fed, where n = 12 replicate broilers.

Chapter 5
122
Tabl
e 1:
IgA
bind
ing
bovi
ne se
rum
alb
umin
(BSA
) or r
abbi
t γ-g
lobu
lin (R
GG
) in
bile
of b
roile
r chi
cken
s fed
with
BSA
dur
ing
the
first
3 d
of a
ge,
or n
ot (P
BS),
rece
ivin
g de
laye
d (D
N) o
r ear
ly n
utrit
ion
(EN
) in
expe
rimen
t I. B
roile
rs w
ere i
ntra
trac
heal
ly im
mun
ized
with
BSA
and
RG
G a
t 21
d of
age
and
bile
was
col
lect
ed
at 2
1 d
post
imm
uniza
tion.
Dat
a ar
e pr
esen
ted
as e
stim
ated
mar
gina
l mea
ns w
ith st
anda
rd e
rror
s (SE
M).
Trea
tmen
ts
Fixe
d eff
ects
1
EN –
PB
S fe
d
EN –
BSA
fed
D
N –
PB
S fe
d
DN
– B
SA fe
d
Ant
igen
M
ean
SEM
n2
Mea
nSE
Mn
M
ean
SEM
n
Mea
nSE
Mn
B
SAFe
edin
gB
SA *
Fee
ding
BSA
5.
10.
3811
6.
40.
558
4.
40.
3312
5.
00.
3613
0.
050.
050.
47
RGG
5.
20.
1811
5.
60.
238
5.
00.
1712
5.
20.
1713
0.
180.
180.
68
1 M
odel
esta
blish
ed P
-val
ues f
or fi
xed
effec
t of B
SA-fe
edin
g, fe
edin
g str
ateg
y, an
d th
eir i
nter
actio
n.2 N
umbe
r of r
eplic
ate
broi
lers
, hou
sed
with
4 to
5 b
roile
rs p
er p
en.

Oral tolerance and antibody responses
Chap
ter
5
123
Table 2: Body weight and average daily gain (ADG) of broiler chickens receiving either delayed (DN) or early nutrition (EN) in experiment I. Data are presented as estimated marginal means with standard errors (SEM).
Feeding strategy Feeding effect1
EN DN
Parameter Age (d) Mean SEM n2 Mean SEM n
Body weight 0 43.8 0.39 27 44.1 0.40 26 0.60
(g) 21 889 19.8 25 737 16.1 26 0.001
24 1135 21.9 25 958 26.4 26 0.001
42 3418 79.1 25 3202 78.2 26 0.09
Average daily gain 0 - 21 40.2 0.94 25 33.0 0.76 26 0.001
(g / d) 21 - 24 83 2.9 25 74 2.8 26 0.07
24 - 42 125 3.9 25 124 3.9 26 0.79
0 - 42 80 1.9 25 75 1.9 26 0.09
1 Model established P-values for fixed effect of feeding strategy.2 Number of replicate broilers, housed with 4 to 5 broilers per pen.

Chapter 5
124
F * * #
* * * *F
* #
* * * *
Figure 2: IgM and IgY binding bovine serum albumin (BSA; panel A) or rabbit γ-globulin (RGG; panel B) in plasma of broiler chickens fed with BSA during the first 3 d of age, receiving delayed (DN) or early nutrition (EN), and kept under high (HSC) or low sanitary conditions (LSC) in experiment II. Broilers were intratracheally immunized with BSA and RGG at 24 d of age (0 d p.i.). Data are presented as estimated marginal means with error bars representing. Within different ages, differences between sanitary condition groups are indicated by * (P ≤ 0.05) or # (P ≤ 0.10), and tendencies between feeding groups are indicated by F (P ≤ 0.10). n = 12 replicate broiler housed in groups of 5 broilers per pen for all groups, except for 7 and 11 d p.i., where n = 10 replicate broilers for all groups with exception of DN-HSC (n = 12 broilers).

Oral tolerance and antibody responses
Chap
ter
5
125
F
F
Figure 3: Number of aerobic cultured bacteria on 3 different growth media (blood, MacConkey, and De Man, Rogosa and Sharpe (MRS) agar) expressed in log 10 CFU (colony forming units) per g of cecal tissue during the first week post hatch in cecum of broiler chickens receiving delayed (DN) or early nutrition (EN) in experiment II. Individual raw means (dots and triangles) are summarized by boxplots. Tendencies indicating age differences between feeding groups within age are indicated by F (P ≤ 0.10). The number of replicate broilers varies between 3 to 10 per age and feeding group. The horizontal line within each boxplot represents the median and whiskers extend to the 1.5 * interquartile range.

Chapter 5
126
Tabl
e 3:
Fol
d ch
ange
(7 d
rela
tive
to 0
d p
ost i
mm
uniza
tion)
of a
ntib
ody
titer
s (Ig
M, I
gY) b
indi
ng b
ovin
e se
rum
alb
umin
(BSA
) or r
abbi
t γ-g
lobu
lin (R
GG
) in
seru
m o
f bro
iler c
hick
ens f
ed w
ith B
SA d
urin
g th
e firs
t 3 d
of a
ge re
ceiv
ing
dela
yed
(DN
) or e
arly
nut
ritio
n (E
N) k
ept u
nder
hig
h (H
SC) o
r low
sani
tary
cond
ition
(L
SC) i
n ex
perim
ent I
I. Br
oile
rs w
ere
intr
atra
chea
lly im
mun
ized
with
BSA
and
RG
G a
t 21
d of
age
and
bile
was
col
lect
ed a
t 11
d po
st im
mun
izatio
n. D
ata
are
pres
ente
d as
esti
mat
ed m
argi
nal m
eans
with
stan
dard
err
ors (
SEM
).
Tr
eatm
ents
Fi
xed
effec
ts1
EN
- LS
C
EN -
HSC
D
N -
LSC
D
N -
HSC
Ant
igen
Isot
ype
M
ean
SEM
M
ean
SEM
M
ean
SEM
M
ean
SEM
SC
Feed
ing
Bat
ch2
SC *
Fee
ding
BSA
IgM
1.
30.
17
2.2
0.29
1.
40.
18
2.1
0.27
0.
010.
990.
070.
53
BSA
IgY
1.
30.
16
1.6
0.19
1.
30.
16
1.5
0.18
0.
210.
990.
250.
80
RGG
IgM
1.
30.
13
1.8
0.18
1.
20.
13
1.9
0.19
<
0.01
0.88
0.01
0.76
RGG
IgY
1.
30.
13
1.7
0.17
1.
20.
12
1.4
0.14
0.
070.
220.
020.
49
Num
ber o
f rep
licat
e br
oile
rs, h
ouse
d w
ith 5
bro
ilers
per
pen
, is 1
2 pe
r tre
atm
ent,
exce
pt fo
r EN
– L
SC w
here
n =
11.
1 M
odel
esta
blish
ed P
-val
ues f
or fi
xed
effec
t of s
anita
ry c
ondi
tion,
feed
ing
strat
egy,
batc
h, a
nd th
eir t
wo-
way
inte
ract
ions
.2 Th
ere
wer
e no
inte
ract
ions
bet
wee
n ba
tch
and
sani
tary
con
ditio
ns o
r fee
ding
stra
tegy
.

Oral tolerance and antibody responses
Chap
ter
5
127
Tabl
e 4:
IgA
bind
ing
bovi
ne se
rum
albu
min
(BSA
) or r
abbi
t γ-g
lobu
lin (R
GG
) in
bile
of b
roile
r chi
cken
s fed
with
BSA
dur
ing
the fi
rst 3
d o
f age
rece
ivin
g de
laye
d (D
N) o
r ear
ly n
utrit
ion
(EN
) kep
t und
er h
igh
(HSC
) or l
ow sa
nita
ry c
ondi
tion
(LSC
) in
expe
rimen
t II.
Broi
lers
wer
e in
trat
rach
eally
imm
unize
d w
ith B
SA a
nd
RGG
at 2
1 d
of a
ge a
nd b
ile w
as c
olle
cted
at 1
1 d
post
imm
uniza
tion.
Dat
a ar
e pr
esen
ted
as e
stim
ated
mar
gina
l mea
ns w
ith st
anda
rd e
rror
s (SE
M).
Trea
tmen
ts
Fi
xed
effec
ts1
EN -
LSC
EN
- H
SC
DN
- LS
C
DN
- H
SC
Ant
igen
M
ean
SEM
n2
Mea
nSE
Mn
M
ean
SEM
n
Mea
nSE
Mn
Fe
edin
gSC
Bat
chSC
* F
eedi
ngB
atch
*Fee
ding
BSA
7.
70.
2532
6.
00.
2435
7.
60.
2629
6.
00.
2435
0.
71<
0.00
10.
200.
910.
06
RGG
7.
50.
1532
6.
10.
1536
7.
10.
1629
5.
90.
1535
0.
03<
0.00
10.
370.
72 -3
1 M
odel
esta
blish
ed P
-val
ues f
or fi
xed
effec
t of s
anita
ry c
ondi
tion,
feed
ing
strat
egy,
batc
h, a
nd th
eir t
wo-
way
inte
ract
ions
.2 N
umbe
r of r
eplic
ate
broi
lers
, hou
sed
with
4 to
5 b
roile
rs p
er p
en.
3 Ba
tch
* Fe
edin
g eff
ect w
as le
ft ou
t of t
he m
odel
as P
> 0
.10.

Chapter 5
128
Tabl
e 5:
Bod
ywei
ght (
BW),
aver
age
daily
gai
n (A
DG
), an
d fe
ed c
onve
rsio
n ra
tio (F
CR
) of b
roile
r chi
cken
s rec
eivi
ng e
ither
del
ayed
(DN
) or e
arly
nut
ritio
n (E
N)
kept
und
er h
igh
(HSC
) or l
ow sa
nita
ry c
ondi
tion
(LSC
) in
expe
rimen
t II.
Dat
a ar
e pr
esen
ted
as e
stim
ated
mar
gina
l mea
ns w
ith st
anda
rd e
rror
s (SE
M).
Tr
eatm
ents
Fixe
d eff
ects
1
EN
- LS
C
EN -
HSC
D
N -
LSC
D
N -
HSC
Para
met
erA
ge
Mea
nSE
n2
Mea
nSE
n
Mea
nSE
n
Mea
nSE
n
Feed
ing
SCB
atch
Feed
ing
* SC
Bat
ch *
SC
Body
wei
ght
3
N /
A3
68.7
0.42
24
N /
A
38.5
0.42
24
<0.0
01 -
<0.0
01 -
-(g
)33
16
3336
.212
20
7136
.212
13
1336
.212
17
7136
.212
<0
.001
<0.0
010.
020.
78<0
.01
Aver
age
daily
3 -
14
260.
512
32
0.5
12
170.
512
23
0.5
12
<0.0
01<0
.001
<0.0
010.
73<0
.001
gain
(g /
d)14
- 28
59
1.5
12
781.
512
50
1.5
12
681.
512
<0
.001
<0.0
010.
120.
820.
01
28
- 33
90
2.6
12
112
2.6
12
772.
612
10
52.
612
<0
.01
<0.0
010.
320.
280.
04
3
- 33
52
1.2
12
671.
212
42
1.2
12
581.
212
<0
.001
<0.0
010.
030.
720.
01
Aver
age
daily
3 -
14
32 b
0.7
12
37 a
0.7
12
21 d
0.7
12
28 c
0.7
11
<0.0
01<0
.001
<0.0
010.
030.
07
feed
inta
ke (g
/ d)
14 -
28
862.
912
10
82.
912
70
2.9
12
903.
09
<0
.001
<0.0
010.
090.
830.
04
28
- 33
14
94.
810
17
35.
011
12
14.
812
16
04.
810
<0
.001
<0.0
010.
950.
140.
13
3
- 33
74
2.0
12
902.
111
58
2.0
12
772.
111
<0
.001
<0.0
010.
160.
420.
09
Feed
con
vers
ion
ratio
3 -
14
1.24
0.03
712
1.
150.
039
12
1.22
0.03
712
1.
230.
041
11
0.48
0.44
<0.0
010.
21<0
.001
14
- 28
1.
440.
017
12
1.39
0.01
712
1.
390.
017
12
1.32
0.01
89
0.
01<0
.01
0.11
0.47
0.63
28
- 33
1.
600.
023
10
1.54
0.02
211
1.
570.
020
12
1.51
0.02
210
0.
260.
030.
090.
890.
50
3
- 33
1.
430.
011
12
1.34
0.01
111
1.
370.
011
12
1.32
0.01
29
<0
.01
<0.0
010.
560.
180.
13
Cor
rect
ed F
CR
43
- 33
1.
460.
011
12
1.34
0.01
111
1.
440.
011
12
1.34
0.01
39
0.
71<0
.001
0.36
0.23
0.01
1 M
odel
esta
blish
ed P
-val
ues f
or fi
xed
effec
t of s
anita
ry c
ondi
tion,
feed
ing,
bat
ch, a
nd th
eir t
wo-
way
inte
ract
ions
.2 N
umbe
r of r
eplic
ate
pens
, con
tain
ing
7 (a
t 3 d
of a
ge) o
r 5 (>
7 d
of a
ge) b
roile
rs p
er p
en.
3 Unt
il 3
d. a
ll br
oile
rs w
ere
kept
und
er H
SC.
4 Fee
d co
nver
sion
ratio
stan
dard
ized
to 2
000
g sla
ught
er w
eigh
t.

Oral tolerance and antibody responses
Chap
ter
5
129

CHAPTER 66

General discussion

Chapter 6
132
1. Introduction
Immediate access to water and feed after hatch (early nutrition; EN) for broiler chickens has been introduced approximately two decades ago to improve broiler growth performance, accelerate development of the intestinal tract, and stimulate early maturation of the immune system. This is in contrast to delayed nutrition (DN), which is common practice in broiler husbandry and results in delayed access to water and feed, which can be up to 72 h. Earlier onset of post hatch intestinal development was observed in EN compared with DN broilers, including greater absorptive surface area of small intestine, different mucus dynamics, higher numbers of proliferating intestinal cells, and greater activity of digestive enzymes (reviewed by Uni and Ferket, 2004; Lilburn and Loeffler, 2015). Early nutrition has been proposed as a strategy to accelerate maturation (activation and education) of the adaptive immune system. In short, EN compared with DN broilers have higher numbers of germinal centers in the bursa between 10 and 20 d of age, increased numbers of T- and B-cells in the bursa, and the capability to produce specific antibody (SpAb) responses within 12 d after immunization at 6 d of age, compared with DN (reviewed by Panda et al., 2014; Taha-Abdelaziz et al., 2018).
Within this thesis, I reviewed current literature comparing EN and DN broilers to identify relevant knowledge gaps (chapter 1), that were further studied by experiments in broilers (chapter 2 to 5). In this chapter, I will discuss the findings of the aforementioned chapters, and compare them with the current literature. Effects of EN versus DN in broilers can be divided into early life (first 14 d of age) and later life effects, which will be taken into account in the discussion. The discussion will be closed with a discussion on implications of the findings in this thesis for commercial practice in the final paragraph.
2. Compensatory growth in delayed nutrition broilers
At 3 d of age, EN broilers appear larger compared with DN (72 h) broilers, although DN broilers appear still vitally (Figure 1). In general, EN compared with DN broilers have been observed in all experiments to express more perching behavior, whereas DN broilers express more foraging behavior and produce more squeaks. Broilers receiving EN compared with DN, do have higher BW from placement until slaughter at 42 d of age, but effect sizes depend on the duration of DN; longer durations result in greater differences in BW as reported in a meta-analysis (de Jong et al., 2017). These authors reported that BW at 42 d of age was increased by EN compared with DN, varying from a ~ 3 % increase in BW after 12 – 36 h of DN, up to a 8 % increase after 60 – 84 h of DN. In this thesis, differences (Δ) in BW were reported in experiment 1 (chapter 2: Δ = 2 %; 38 h DN at 35 d), experiment 3 (chapter 4: Δ = 7 %; 72 h DN at 42 d), and experiment 4 (chapter 4: Δ = 20 %; 72 h DN at 33 d). It appears that findings in

General discussion
Chap
ter
6
133
experiment 1 and 3 are in line with the reported differences in the literature, although greater differences in BW were reported in experiment 4. These findings indicate that differences in BW between EN and DN broilers vary among experiments.
Compensatory growth was observed in DN broilers during the first 14 d of age in chapter 2, which confirms suggestions in the literature (Juul-Madsen et al., 2004; Lamot et al., 2014). In this thesis, compensatory growth is defined according to Zubair and Leeson (1996): an “abnormally rapid growth relative to age”. This is expressed by calculating the average daily gain (ADG) relative to the BW, in order to obtain relative ADG (rADG) (Hornick et al., 2000). It is of importance to express ADG relative to BW, as ADG is confounded by differences in BW: heavier animals gain more weight in absolute terms. I conducted a meta-analysis (Hamer and Simpson, 2002) on the collected BW data in all experiments presented in this thesis, and calculated absolute and rADG of EN versus DN broilers to study the presence of compensatory growth. This analysis consisted of a total of 4 experiments conducted between 2015 and 2019 in Ross 308 broilers chickens, subjected to durations of 38 h (experiment 1) or 72 h (experiment 2, 3, 4) of DN. Experiment 4 was split in either LSC and HSC to obtain insight in effects of sanitary conditions on compensatory growth. Data were analyzed using a mixed model with feeding strategy (EN versus DN) and sanitary conditions (LSC versus HSC) as fixed effects and experiment (1, 2, …, 4) as random effect.
Combining and analyzing all experimental data revealed that absolute ADG was greater (P ≤ 0.01) in EN compared with DN broilers in all phases (Figure 2). Relative ADG was however smaller (P ≤ 0.01) after EN compared with DN, with greatest differences during the first 14 d of age. This resulted in a decline in standardized differences between EN and DN broilers over time, particularly during the first 14 d of age (Figure 3). It depends on the duration of DN whether broilers have recovered their BW at 35 d of age, or not (Figure 3), which is in accordance with de Jong et al (2017). Prolonged durations of DN up to 72 h, which may occur during export or long inland transports, is therefore unfavorable as broilers receiving prolonged DN are not able to fully compensate their lag in BW, which may result in lower BW at slaughter. In such situations, EN is an interesting strategy to maintain BW during long transport durations.

Chapter 6
134
Figure 1: Typical broiler chickens at 3 d of age that have been subjected to delayed (72 h, DN, broiler left) and early nutrition (EN, broiler right). Body weight (BW) of the DN group was 39 g and that of the EN group was 69 g (SEM = 0.4 g). No mortality was observed in the DN group and broilers appeared vitally.
Whether the observed short-term compensatory growth after DN may increase risk of growth disorders such as leg problems or development of breast myopathies such as wooden breast, is unknown yet and was not specifically investigated in this thesis. In a recent system comparison (on farm hatching EN versus on hatchery hatching DN), the authors reported no differences in gait score between EN and DN broilers (de Jong et al., 2018), although rADG appeared greater in DN broilers (from 0 to 41 d of age). Furthermore, as compensatory growth after feed restriction in broilers has been suggested to affect protein and fat deposition (Leeson and Zubair, 1997; Lippens et al., 2002), it might be of interest to investigate whether EN versus DN broilers may differ in body composition and nutrient requirements. This could have implications for diet formulations for EN versus DN broilers, and potentially for carcass composition at slaughter.

General discussion
Chap
ter
6
135
*** ***
*** ***
** **
Figure 2: Absolute (panel A, grams / day) and relative daily gain (panel B, % / day) for early (n = 251 pens) and delayed nutrition (n = 259 pens) broilers between 0 – 14, 14 – 28, and 28 – 35 d post placement. Data are presented as raw means and error bars represent standard deviations and asterisks indicate differences between EN and DN broilers (***: P < 0.001, **: P = <0.01). Relative average daily gain is calculated as the absolute daily gain relative to the body weight (BW) at the start of each respective phase. Presented data belongs to the following chapters: chapter 2 (exp 1), chapter 3 (exp 2), chapter 5 (exp 3 and 4).

Chapter 6
136
Δ��� = 𝐸𝐸𝐸𝐸 − 𝐷𝐷𝐸𝐸 Δ�������� =𝐸𝐸𝐸𝐸𝐷𝐷𝐸𝐸A B
Figure 3: Absolute (panel A, grams) and relative (panel B, ratio between EN and DN BW) differences in body weight (BW) of broilers receiving early (EN) or delayed nutrition (DN), for the experiments described in this thesis. In experiment 4, BW comparisons between EN and DN are presented for broiler chickens kept under both low (LSC) and high sanitary conditions (HSC). Individual points represent effect sizes (EN –/– DN) or standardized effect sizes (EN / DN) for BW within each experiment. Presented data belong to the following chapters: chapter 2 (exp 1), chapter 3 (exp 2), chapter 4 (exp 3 and 4).
In summary, DN broilers partially compensate their lower BW at placement (compared with EN broilers) during the first 14 d of age by increasing ADG relative to BW (rADG). Results from the meta-analysis indicate that compensatory growth is independent of the duration of DN (38 vs 72 h), or sanitary conditions, although confirmation with more studies is required. However, shorter durations of DN may allow almost full recovery, while longer durations up to 72 h severely impair BW at slaughter, as reported before (de Jong et al., 2017). Thus, EN compared with DN results in a short-term increase in BW, but later life effects of EN on BW are depending on the duration of DN.

General discussion
Chap
ter
6
137
3. Effects of early nutrition on intestinal development and integrity
3.1. Early nutrition: earlier onset of post hatch intestinal developmentEarly nutrition is often proposed as a strategy to enhance development of the intestinal tract of broilers. As summarized in chapter 1, the provision of nutrition is required to start post hatch development of the intestinal tract, indicating that EN compared with DN may result in earlier onset of intestinal development, rather than accelerated intestinal development (Figure 4). This early onset of intestinal development is illustrated by a small decrease (up to 1.5 fold), followed by a two to three-fold increase of proliferating enterocytes in duodenum, jejunum, and ileum (small intestine) after onset of feeding, in both EN and DN (48 h) broilers (Geyra et al., 2001). These authors also reported that fasting between 2 and 4, and 6 and 8 d of age, results in a decrease in the numbers of proliferating cells, followed by a short peak of proliferation, and recovery to levels similar as before fasting. Thus, DN seems to reduce and delay the onset of intestinal cell proliferation, but broiler chickens recover rapidly within approximately 4 d after refeeding. This was also found for the activity of digestive enzymes post hatch: trypsin and amylase activity in chyme increased within 24 h after onset of feeding, irrespective of feeding strategy (Sklan and Noy, 2000). Within approximately 2 days after onset of feeding of DN broilers, trypsin and amylase activity levels in DN broilers have reached those of EN broilers. In conclusion, this indicates that onset of feeding initiates post hatch development of the intestinal tract with rapid recovery within several days. This is further confirmed by the relative short-term (up to 7 d of age) effects of EN compared with DN on intestinal tract development, including intestinal weight, absorptive surface area, and mucus dynamics as described in chapter 1 and reviewed by others (Uni and Ferket, 2004; Lilburn and Loeffler, 2015).
Although effects of EN on intestinal development seem rather short-term, the 1.5 to 2 fold increase of greater absorptive surface area of EN compared with DN (48 h) broilers (Uni et al., 2003; Smirnov et al., 2005), suggests greater absorptive capacity of nutrients during the first days of age. This can be further supported by the approximately 1.5 fold increase of glucose and amino acid transport in small intestine (duodenum, jejunum, ileum) of EN compared with DN (48 h) up to 4 d of age (Sklan and Noy, 2000). However, only minor effects of EN compared with DN (48 h) were found on post hatch gene expression of Ca and P transporters in jejunum and ileum of broilers up to 14 d of age (Proszkowiec-Weglarz et al., 2018). Digestibility of dry matter was higher at approximately 14 d of age in broilers that received EN compared with DN (24 h: + 3.5 %; 48 h: + 5.3 %) (Cengiz et al., 2012). It is remarkable that in this study, effects were still present at later ages and digestibility of organic matter was unaffected by EN, requiring further confirmation by future studies.

Chapter 6
138
Figure 4: Author’s impression of proposed course of intestinal development in broiler chickens receiving early (EN) or delayed nutrition (DN). Examples of intestinal parameters (y-axis) are intestinal tract weight, villus size, absorptive area, enzyme activity, or numbers of proliferating cells. Uptake of feed and water will result in onset of intestinal development, irrespective of broiler age, and no long-term differences on intestinal tract physiology are present. The dashed line represents an alternative hypothesis describing that besides delayed onset of development, DN may also impair development of the intestinal tract. This has not been reported in the literature or in this thesis. Arrows indicate time of provision of feed and water for EN (0 d of age) and DN (3 d of age).
In summary, the reported differences in intestinal tract weight, absorptive surface area, and enzyme activity may contribute to better nutrient absorption, although future digestibility studies are required to confirm this suggestion. Provision of nutrition appears to stimulate the onset of post hatch intestinal tract development, thus EN compared with DN likely result in earlier onset of intestinal tract development. Whether DN results in long-term alterations on intestinal physiology (e.g. intestinal tract weight, villus size, enzyme activity) has not been proven in the literature. Thus effects of EN compared with DN on intestinal tract development are mainly present in early life, while later life (long-term) effects seem unlikely.
3.2. Intestinal integrity after delayed nutritionIntestinal epithelial cells are sealed via apical junctional complexes, in which adherence junctions maintain cellular proximity and tight junctions (TJ) facilitate paracellular transport of water, ions, and small nutrients from the intestinal lumen into the bloodstream (Turner, 2009). Also in chickens, TJ are present and are expected to be functional from hatch onwards (Karcher and Applegate, 2008). Tight junctions consist of transmembrane proteins, of which the most important for TJ structure and functioning are claudin (CLD), zonula occludens (ZO), occludin, and junctional adhesion molecules (JAM) (Schneeberger and Lynch, 2004; Anderson and van Itallie,

General discussion
Chap
ter
6
139
2009). Claudin, occludin and JAM proteins form pores that facilitate paracellular transport of water and small molecules, but that prevents influx of larger molecules such as endotoxins. The pore size of TJ is dynamically regulated and is increased during stress responses due to higher cortisol levels during stressful situations such as fasting (reviewed by de Punder and Pruimboom, 2015; Kelly et al., 2015). This pore size is controlled by the sympathetic nervous system and the hypothalamic-pituitary-adrenal axis. Broilers receiving DN compared with EN, had higher blood plasma levels of corticosterone, likely as the result of starvation (van de Ven et al., 2013), which may induce greater TJ pore size. De Punder and Pruimboom (2015) hypothesized that uptake of water and other nutrients via greater TJ pore size is a strategy to facilitate nutrient uptake to meet metabolic demands under stressful situations. Loss of epithelial integrity due to impaired TJ structure is often associated with increased risk of translocation of luminal bacteria and endotoxins across the epithelial lining, which will cause inflammatory immune responses. It is remarkable, however, that others (reviewed by Turner, 2009) indicate that proteins and LPS can be transported into the host via TJ, but that whole bacteria cannot pass. Thus, bacterial translocation may not be explained by influx of bacterial via TJ pores (Wideman et al., 2012; Tellez et al., 2014, 2015), but rather as an effect of damaged intestinal epithelium or loss of TJ structure. During intestinal inflammation, for example as a result of infectious disease, loss of the intestinal barrier function may appear due to apoptosis, erosion, or ulceration of the intestinal epithelium (Edelblum and Turner, 2009; Lee, 2015). This may allow influx of bacteria, or endotoxins, directly through the damaged intestinal barrier, also described as the “leaky gut syndrome” (Wells et al., 2017), which is also described in chickens (Kuttappan et al., 2015; Awad et al., 2017).
It is unknown whether broilers that are subjected to DN, have increased paracellular transport due to nutrient shortages or intestinal damage, and whether this intestinal damage may occur resulting in bacterial and endotoxin translocation. Although numbers of apoptotic cells decreased 1.5 fold after 1 d post feeding in ileum of EN, compared with DN (48 h) turkeys (Potturi et al., 2005), morphological damage of the intestinal epithelium after various durations of DN has not been reported (Geyra et al., 2001; Noy et al., 2001; Lamot et al., 2014). Differences in ileal cytokine gene expression were also not observed between EN and DN broilers and laying hens (Simon et al., 2014), that would be indicative for immune responses towards translocated bacteria. Taken together, this indicates that DN does not induce disturbance of intestinal integrity. Because it was not studied before whether prolonged DN up to 72 h would increase paracellular transport, this was investigated in EN and DN (72 h) broilers at 1 d after onset of feeding (4 d of age) in chapter 3. Paracellular transport of the marker fluorescein isothiocyanate-dextran (FITC-d), as an indicator for intestinal permeably (Vicuña et al., 2015; Baxter et al., 2017; Gilani et al., 2018), was measured in EN and DN (72 h) broilers at 1 d

Chapter 6
140
after onset of feeding (4 d of age) in chapter 3. No differences in paracellular transport were observed between EN and DN broilers at 4 d of age, and histological examination of ileal, colonal, and cecal tissues revealed no damage of the intestinal epithelium among treatments. This supports the hypothesis that prolonged DN does not result in long-term alteration of paracellular transport or intestinal damage. Also shorter durations of DN (24 h) did not affect intestinal permeability (Gilani et al., 2018).
In summary, there are no indications that DN induces long-term intestinal damage or greater paracellular transport. At least, DN broilers recover within 24 h after onset of feeding. As TJ pore size is known to be highly dynamic (Shen et al., 2008; de Punder and Pruimboom, 2015), measuring paracellular transport during the 72 h of DN may provide better insight in dynamics of intestinal permeability before onset of feeding. In addition, the FITC-d model reflects TJ pore size and thus paracellular transport, but does likely not reflect translocation of bacteria and endotoxins. Additional measurements, such as morphological examination of the intestinal epithelium for damage, bacterial translocation, and measurement of endotoxin could provide better insight in differences in of bacteria and endotoxins between EN and DN broilers.
4. Development of humoral immunity is accelerated by early nutrition
4.1. Transfer of maternal antibodies is not affected by early nutritionJust-hatched chickens already possess functional primary and secondary lymphoid organs such as the bursa of Fabricius, thymus, and mucosa associated lymphoid tissues (MALT), although the immune system, mainly the adaptive immune system, is not yet fully functional (reviewed by Friedman et al., 2003; Taha-Abdelaziz et al., 2018). After hatch, further differentiation and proliferation of B- and T-cells is required to mount sufficient immune responses (Bar-Shira et al., 2005). During this immunological “gap” caused by an immature immune system, chickens are passively protected by maternal antibodies (mAb) deriving from both yolk and albumen (Lawrence et al., 1981; Hamal et al., 2006; Ismiraj et al., 2019; van Dijk and Parmentier, 2020). IgY levels are a good indicator of mAb transfer during the first week of age because IgY positive neonatal B-cells are not detectable up to 6 d of age (Lawrence et al., 1981), and gene expression of IgY in ileum is minimal up to 10 d of age (Lammers et al., 2010; Simon et al., 2014). As maternal transfer of IgM is minimal (Ismiraj et al., 2019), circulating levels of IgM reflect the activity of neonatal IgM-positive B-cells.
Multiple reviews suggest (Noy et al., 1996; Noy and Sklan, 1998) that EN compared with DN, may result in greater residual yolk uptake. It is tempting to speculate that this

General discussion
Chap
ter
6
141
greater yolk uptake also enhances transfer of mAb from the yolk into the bloodstream. Levels of mAb were compared between EN and DN broilers in chapter 4, but no differences in systemic maternal IgY levels at 7 d of age were observed. Furthermore, residual yolk weights were not affected by EN (Textbox 1). It can, therefore, be concluded that EN does not contribute to transfer of maternal immunity, and its effects on residual yolk uptake are doubtful.
4.2. Early nutrition enhances first week immune maturationBecause mAb disappear with age and are at lowest levels from approximately 21 d of age onwards (Lammers et al., 2010; Simon et al., 2014), a functional adaptive immune system is required to produce effective amounts of antibodies. This is established during the first week post hatch, where antigenic stimulation activates innate immune cells (Bar-Shira and Friedman, 2006). Ultimately, this results in differentiation of naïve B- and T-cells, and homing of these cells to effector sites such as MALT (reviewed by Friedman et al., 2003). After hatch, broilers become inoculated with bacteria that will eventually form the intestinal microbiome (reviewed by Apajalahti et al., 2004). The immune system will then be exposed to antigens deriving from the intestinal microbiome, together with other ingested antigens (feed, but likely also dust, eggshells and litter material). Bacterial colonization and growth is further stimulated by uptake of feed, as this provides a substrate for the commensal microbiome to further colonize the intestinal tract, resulting in higher bacterial load and thus higher exposure to antigens (Vahjen et al., 1998; Apajalahti et al., 2004; Stanley et al., 2013).
Therefore, EN could be an interesting strategy to enhance maturation of the adaptive immune system: earlier feed intake increases exposure of the immune system to antigens deriving from feed and result in a more rapid colonization (Binek et al., 2000; Karpinska et al., 2001; Potturi et al., 2005). In addition, 16S rRNA sequencing revealed a temporal, divergent ileal microbiota composition up to 9 d of age between EN and DN (72 h) broilers (Simon, 2016), making it tempting to speculate that EN may also stimulate exposure to more and more diverse antigens. Thus, EN could be an opportunity for accelerating immune maturation, which has been subject of study before (Dibner et al., 1998; Juul-Madsen et al., 2004; Bar-Shira et al., 2005; Simon et al., 2014). In short, these authors observed in EN compared with DN (48 – 72 h) broilers, higher numbers of germinal centers in the bursa from 3 up to 21 d of age (Dibner et al., 1998), higher numbers of T- and B-lymphocytes in the bursa from 4 up to 14 d of age (Bar-Shira et al., 2005), and greater gene expression (mRNA abundance) of the T-cell marker CD3-γδ in colon up to 8 d of age (Bar-Shira et al., 2005). Other literature, however, observed no effects of EN on ileal gene expression of cytokine genes in broilers up to 42 d of age (Simon et al., 2014), indicating that effects of EN are more pronounced in the distal intestinal tract (colon, cecum). Bar-Shira et al. (2005) reported earlier onset of antibody

Chapter 6
142
Textbox 1: Residual yolk uptake and early nutrition
After hatch, the remainder of the yolk (residual yolk) provides water, fat, and protein (Yadgary et al., 2010) to the chicken (reviewed by van der Wagt et al., 2020). Residual yolk weight rapidly declines from approximately 6 g at hatch until 1 g at 3 d of age (Bigot et al., 2003). The residual yolk disappears in most chickens around 7 d of age (Figure 6). Whereas before hatch, contents of the residual yolk are transported into the blood circulation via the highly vascularized yolk sac membrane, after hatch, contents are transported into the jejunum via the yolk stalk (van der Wagt et al., 2020). This allows uptake of residual yolk contents through the intestinal epithelium into the blood circulation.
Noy et al. (1996) reported greater yolk disappearance up to 96 h after EN, compared with DN (96 h), and postulated that uptake of residual yolk via the yolk sac membrane was not affected by EN. However, these authors suggested that secretion of yolk contents into the jejunum could be increased by increased intestinal motility in EN broilers. Peristalsis of the jejunum, ileum, colon, and ceca is however already present around 9 d of embryonic age (Chevalier et al., 2017), although gut motility in animals in a fasted versus fed state differs (reviewed by Olsson and Holmgren, 2001). Studies demonstrating the relation between gut motility, and flow from yolk contents into the intestinal tract in EN compared with DN broilers, are however lacking.
There is no consensus whether EN may enhance residual yolk disappearance, with some studies showing greater yolk disappearance after EN (Noy et al., 1996; Sklan and Noy, 2000; Bhanja et al., 2009; van de Ven et al., 2013; de Jong et al., 2018), and others not (Pinchasov and Noy, 1993; Sklan et al., 2000; Bigot et al., 2003; Gonzales et al., 2003; Maiorka et al., 2003; Careghi et al., 2005; van den Brand et al., 2010; Abed et al., 2011; Lamot et al., 2014; Wang et al., 2014). Yet, there seems no explanation for these differences, although Van der Wagt et al. (2020) speculated that differences in breeder age or incubation and brooding temperature among these studies might play a role. In experiment 4 (chapter 4 and 5), residual yolk weight was measured in both EN and DN (72 h) broilers, at 0, 1, 2, 3, and 7 d of age. There were no differences in residual yolk disappearance between EN and DN broilers at any age (Figure 6), which is in accordance with measurements performed in experiment 2 (chapter 3).

General discussion
Chap
ter
6
143
The definition of residual yolk uptake is often used incorrectly as the aforementioned studies only measured yolk disappearance, rather than yolk uptake. To my best knowledge, uptake rather than disappearance of residual yolk between EN and DN broilers, has not been measured yet. However, constituents of the residual yolk may be fermented by commensal bacteria, or parts of the yolk itself may be excreted as feces. Secondly, composition of the residual yolk may differ between EN and DN broilers, as the intestinal tract of EN broilers is in a different developmental stage as described in chapter 1. In addition, the constituents of the residual yolk (e.g. water, carbohydrates, protein, lipids) may differ between EN and DN broilers. Thus, yolk absorbance and yolk disappearance should not be used interchangeably. Yet, no prove seems present that greater intestinal motility after EN enhances emptying residual yolk contents into the intestinal tract, as was proposed by Noy et al. (1996).
Figure 6: Absolute yolk weight at 0, 1, 2, 3, and 7 d of age in early (EN) and delayed nutrition (DN) broilers. Points represent residual yolk weight of individual broiler chickens. The horizontal line in the boxplots represents the median, and whiskers span the 1.5 * interquartile range from the box. n = 8 broilers per group per timepoint.

Chapter 6
144
responses after cloacal immunization with hemocyanin at 6 d of age. In EN compared with DN (48 h) broilers, systemic levels of T-cells were increased at 8 d of age (Juul-Madsen et al., 2004), but not B-cells. Taken together, multiple studies have indicated that EN, compared with DN, results in earlier activation and education of the immune system, which may result in earlier onset of antibody responses after hatch.
Effects of EN compared with DN on expression of host defense genes (IL-1β, COX-2) in ileal and cecal tissue at 4 d of age has been studied in chapter 3. For both IL-1β (ceca) and COX-2 (ileum, ceca), gene expression was higher in EN compared with DN broilers at 4 d post hatch, indicating greater activity of the innate immune system. This seems in accordance with another study concluding that the innate immune system is triggered by exposure to dietary and microbial antigens, due to higher levels of IL-1β gene expression (in duodenum, colon, and cecum) after feeding (Bar-Shira and Friedman, 2006). Another study, however, observed no differences in ileal cytokine expression between EN and DN broilers (Simon et al., 2014). It is unclear what causes the different outcomes of these studies. The higher levels of expression of the MUC-2 gene in ileum of EN compared with DN broilers is in line with measurements on mucus layer thickness which was found greater in EN broilers (Uni et al., 2003; Smirnov et al., 2004). As the intestinal microbiome has been found to affect mucus dynamics and composition (Smirnov et al., 2005; Forder et al., 2007), it could be that accelerated bacterial colonization in EN might have resulted in higher expression levels of the MUC-2 gene. However, this remains speculative as bacterial load was not measured in chapter 3. In summary, higher gene expression of host defense genes in ileal and cecal tissue of EN compared with DN broilers, indicate that EN initiates activation of the immune system in early life. Later life effects of EN on the expression of these genes in intestinal tissues are minimally studied, but are unlikely (Simon et al., 2014). It is reported in mammals that macrophages can be desensitized towards LPS as a result of continuous stimulation with LPS (reviewed Dobrovolskaia and Vogel, 2002). This is suggested as a mechanism to prevent excessive and uncontrolled immune responses. A future research topic would therefore be to investigate whether EN compared with DN, (but also different sanitary conditions), may induce long-term desensitization of innate immune cells, such as macrophages, towards MAMP such as LPS.
It remains however, unclear whether the accelerated maturation of adaptive immunity (Juul-Madsen et al., 2004; Bar-Shira et al., 2005) also affected development of NAb and NAAb levels. Whereas NAb are antibodies binding antigens that have not been exposed to the immune system before, NAAb are antibodies that bind self-antigens. Higher NAb levels contribute to first line of defense against infectious diseases (Berghof et al., 2019) and reduce risk of mortality (Star et al., 2007; Sun et al., 2011), and NAAb contribute to the removal of apoptotic cells and damaged self-molecules (Lutz,

General discussion
Chap
ter
6
145
2007; Nagele et al., 2013; Xu et al., 2015). Thus, elevating levels of both NAb and NAAb by EN might be of interest to enhance disease resistance and removal of cell debris. Especially during the first week post hatch, broilers are susceptible for infectious diseases, resulting in increased mortality and the antibiotic treatments compared with older broilers (de Bruijn et al., 2015; Joosten et al., 2019). Therefore, EN may be a useful strategy to increase the first line of defense, as early antigen exposure stimulates B-cells to produce NAb. This hypothesis was tested in chapter 4, where broilers were subjected to EN or DN and housed under LSC and HSC. Levels of natural (NAb) and natural auto-antibodies (NAAb) were measured at different time points between 7 and 33 d of age, but only at 7 d of age EN compared with DN broilers had higher levels of NAb and NAAb, indicating only short-term effects on antibody levels. Speculatively, this can be explained by greater antigenic stimulation as a result of earlier feed intake in EN compared with DN broilers. In short, exposure to greater numbers and variety of antigens may have led to higher levels of systemic antibodies (including NAb and NAAb) via activation of B-cells by MAMP. B-cells express Toll-like receptors (TLR), that can be activated by bacterial ligands (MAMP) such as LPS and CpG oligonucleotides (Bernasconi et al., 2003; Ruprecht and Lanzavecchia, 2006; Bekeredjian-Ding and Jego, 2009). These authors demonstrated that besides activation of the B-cell receptor with antigen, stimulation of TLR with MAMP is required to induce differentiation of naïve B-cells. Also in chickens, TLR signaling on B-cells has been suggested (st. Paul et al., 2012). This may explain why higher exposure to MAMP (or bacteria) enhances NAb (Haghighi et al., 2006; Berghof et al., 2010) and NAAb (Kreuk et al., 2019) levels, but also SpAb levels (Haghighi et al., 2005; Ploegaert et al., 2007). The absence of differences in levels of systemic antibodies between EN and DN broilers from 14 d of age onwards, may indicate that at these ages, differences in antigenic load or composition do not exist between EN and DN broilers.
In summary, it appears that EN enhances maturation of the broiler’s immune system, indicated by higher mRNA expression levels in intestinal tissues at 4 d of age and higher levels of systemic IgM (i.e. NAb, NAAb) up to 7 d of age. Delayed nutrition broilers rapidly recover, as later life effects on antibody levels were not reported between EN and DN broilers. Higher levels of natural IgM at 7 d of age in EN broilers, however, may contribute to a better first line of defense against avian pathogenic E. coli (Berghof et al., 2019). To study the biological relevance of increased NAb levels after EN, I propose further research using controlled challenge models with pathogens (e.g. Berghof et al., 2019), or field studies comparing morbidity and first week survival of EN versus DN broilers. Finally, better insight is required in the biological relevance of different NAAb levels between EN and DN broilers at 7 d of age.

Chapter 6
146
5. Modelling of antigenic pressure by low and high sanitary conditions
Antigenic pressure among experimental and commercial (field) conditions differs and is determined by total numbers of broilers in the broiler house, stocking density, litter management, biosecurity management. Broilers housed under experimental conditions are commonly housed under relatively low antigenic pressure, while the level of antigenic pressure likely varies among commercial broiler farms. Translating the reported effects of EN in the scientific literature directly into commercial practice, is therefore potentially unreliable. Besides translation to practice, it is also unknown whether effects of EN on immune development and responses are dependent on antigenic pressure during rearing. Studies comparing immune development and responses of EN versus DN, have been conducted under experimental conditions with relative low antigenic pressure (Dibner et al., 1998; Walstra, 2011; Simon et al., 2014; Lamot et al., 2016). Only Simon et al. (2015) induced a contrast in antigenic pressure by placing broilers either in cages (low antigenic pressure) or in floor pens on sawdust (high antigenic pressure). Therefore, in experiment 4 (described in chapter 4 and 5), broilers (EN versus DN) were housed under LSC and HSC. In this paragraph I will further explain and discuss the LSC versus HSC model, its advantages compared with challenge models based on infection with a specific antigen or pathogen, and provide future points for improvement. Thereafter, I will discuss in separate paragraphs the effects of sanitary conditions on the humoral immune system.
Common studies on broiler immunology and immune responses after EN or DN, comprise of immunization with a single (model) antigen or vaccination, while the interaction with antigens in the environment is minimized or not taken into account (Dibner et al., 1998; Bar-Shira et al., 2005; Simon et al., 2014; Lamot et al., 2016). In commercial husbandry, however, the broiler’s immune system is likely exposed to various antigens (including MAMP) for longer durations, which may modulate the immune system. In laying hens, for example, long-term exposure to various antigens between 42 to 63 d of age increased levels of NAb and fat deposition (Parmentier et al., 2002). Intratracheal exposure to MAMP in laying hens (≥ 9 weeks of age) decreased BW and increased SpAb responses (Ploegaert et al., 2007). Simon et al. (2015) reported higher levels of natural IgM (27 and 35 d of age) in floor housed (higher antigenic pressure), compared with cage housed (lower antigenic pressure) broilers. These studies demonstrate the relevance of studying effects of husbandry measures (e.g. EN versus DN), in both high and low antigenic pressure to obtain a relevant translation of results into practice.

General discussion
Chap
ter
6
147
Previously, contrasts in antigenic pressure were successfully established in a pig model (van der Meer et al., 2016, 2017; van der Meer, 2017). In short, pigs housed under LSC compared with HSC, had reduced growth performance, higher levels of the acute phase protein haptoglobin, and higher levels of natural IgG (van der Meer et al., 2016). Low sanitary conditions in chapter 4 and 5 were obtained from 3 d of age onwards, by repeatedly (every 4 d) introducing used litter from commercial broilers farms (broiler age ≥ 35 d). To obtain a representative sample of antigens present in commercial broiler husbandry, a mix of 3 litter origins (farms) was introduced, and the experiment was conducted in 3 separate batches all having different litter origins, resulting in a total of 9 different litter origins. As reported in chapter 4, contrasts in antigenic pressure were established as LSC broilers had reduced growth performance, compared with HSC broilers (Figure 5), likely as a result of reallocation of energy and protein for maintaining immune responses (reviewed by Humphrey and Klasing, 2004). Although the effects remained until the end of the experiment (33 d), it is unknown whether these remain up to older ages in chickens, as in pigs, contrasts in NAb levels between LSC and HSC were only present until approximately 34 d after induction of LSC (e.g. van der Meer, 2017).
The LSC versus HSC model in this thesis differs from the more common “used litter model”, in which broilers are reared on used litter from an older boiler flock. This used litter model is also applied to increase antigenic pressure to study growth performance, intestinal microbiota composition, and immunity of broilers (Corzo et al., 2007; Cressman et al., 2010; Lee et al., 2011, 2013; Shanmugasundaram et al., 2012; Wang et al., 2016; O’Reilly et al., 2017). In the used litter model, however, there is no repeated introduction of antigens, which is supposed to reduce antigenic stimulation over time. Furthermore, it can be questioned whether litter from 1 flock may be a representative sample for antigens present in litter of commercial broiler flocks. This was supported by greater differences in growth performance between LSC and HSC broilers, compared with the differences reported in the used litter model (Lee et al., 2011; O’Reilly et al., 2017).

Chapter 6
148
Figure 5: Typical broiler chickens at 28 d of age in experiment 4 that received early nutrition housed in either low (LSC; left picture) or high sanitary conditions (HSC; right picture) from 3 d of age onwards. At 28 d of age, body weight (raw means ± SD) of the LSC group was 1059 ± 246 g and that of the HSC group was 1374 ± 237 g. No differences in mortality between the groups were observed during the experiment.
6. Sanitary conditions determine the antibody defense strategy
In chapter 4, broilers reared under LSC, compared with HSC, were reported having higher levels of NAb from 14 d of age onwards. As LSC were introduced from 3 d of age onwards, indicating that young broilers, having an immature immune system, rapidly respond (within 11 d) to LSC irrespective of receiving EN or DN. At 33 d of age, broilers kept under LSC compared with HSC, had increased levels of NAb (IgM), NAAb (IgM, IgY), and antibodies binding LPS (IgM, IgY) or muramyl di-peptide (MDP; IgM, IgY)
. The mechanism causing higher levels of antibodies in LSC compared with HSC broilers, was not investigated in this study. Here, I speculate that high and repeated exposure of the immune system to MAMP stimulates naïve B-cells via activation of TLR (Bernasconi et al., 2003; Ruprecht and Lanzavecchia, 2006), as discussed in section 3.2. At 33 d of age, LSC compared with HSC broilers were found to have higher levels of NAAb, and likely a greater NAAb repertoire. As continuous exposure to high antigenic pressure may also affect antibodies that are directed towards auto-antigens, it is tempting to speculate that the NAAb repertoire in broilers is also affected by interactions between the host and its environment (exogenous antigens), rather than only endogenous (self )-antigens. Higher levels of both IgM and IgY binding PC-OVA in LSC compared with HSC broilers, indicate that antigenic stimulation (due to LSC) stimulates isotype switching (IgM IgY) of NAAb producing B-cells.

General discussion
Chap
ter
6
149
Specific antibody responses under LSC and HSC were measured after immunization of broilers with BSA and RGG i.t. (chapter 5), and with SRBC i.m. (chapter 4). Higher SpAb levels (especially IgM) were observed in LSC compared with HSC towards i.t. immunized antigens (BSA, RGG), but no differences in SpAb were observed towards i.m. immunized SRBC. These data indicate that differences in SpAb levels between sanitary conditions, are dependent on the route of immunization. Antigen-dependent effects that may cause these differences, rather than the route of immunization, cannot be excluded, but are unlikely.
The fold change (SpAb : NAb ratio) of antibodies binding BSA, RGG, or SRBC between 7 and 0 d p.i. were studied in chapter 4 and 5. For all antigens, fold change of antibodies was higher in HSC broilers, indicating greater elevation of SpAb binding BSA or RGG. This can be explained by the higher levels of NAb (or basal levels) and relative small increase of SpAb after immunization in LSC broilers, as discussed in chapter 4. Also in goldfish (Carassius auratus L.), individuals with higher levels of NAb were found to have lower SpAb responses, and vice-versa (Sinyakov et al., 2002). Also NAb binding RRBC (14, 24, 31 d of age) and KLH (33 d of age), and NAAb binding PC-OVA and chicken liver homogenate (CLH), were higher in LSC, compared with HSC broilers. Thus, LSC appears to stimulate production of NAb and NAAb, possibly via greater exposure of MAMP to TLR on B-cells (Ruprecht and Lanzavecchia, 2006; Kreuk et al., 2019). Taken together, I hypothesize that antigenic pressure during rearing may determine the defense strategy of the immune system: LSC broilers increase their first line of defense (NAb), while HSC broilers do not, but require higher adaptive immune responses (SpAb).
In summary, broilers exposed to high antigenic pressure have increased levels of systemic antibodies, likely as a result of MAMP stimulation. These higher antibody levels could contribute to the first line of defense against infectious diseases, which has been shown before in laying hens, where increased NAb levels were shown to be related to a reduced risk of mortality (Star et al., 2007; Sun et al., 2011), and increased survival after a pathogenic E. coli challenge (Berghof et al., 2019). Strategies to enhance NAb levels could therefore contribute to broiler health: due to the relative low affinity of NAb compared with SpAb, more immune complexes are formed resulting in neutralization of antigens, and as NAb are already present before immunization, antigens are more rapidly neutralized compared with the adaptive strategy that requires multiple days to develop (Stäger et al., 2003; Lammers et al., 2004).

Chapter 6
150
Textbox 2: Natural antibody levels are associated with body weight
Higher levels of natural antibodies (NAb) may not only contribute to survival and resistance towards bacterial infections (Star et al., 2007; Sun et al., 2011; Berghof et al., 2019), but may also contribute to enhanced growth performance. Appropriate neutralization of antigens by NAb may prevent immune responses that would demand energy and protein (Humphrey and Klasing, 2004; Iseri and Klasing, 2013, 2014) or induce sickness responses (Dantzer, 2001). To obtain first insight in effects of NAb levels on growth performance, we compared levels of NAb binding rabbit γ-globulin (RGG) at 24 d of age with body weight (BW) at 33 d of age. Antibodies binding RGG at 24 d of age were considered NAb as broilers were not exposed to RGG before. The linear relation between BW at 33 d of age and titers of natural IgM and IgY binding RGG at 24 d of age, under both LSC and HSC, was evaluated (Figure 7). It appears that variation in BW is partly explained by titers of IgM (36 %) and IgY (25 %) binding RGG. The non-parallel slopes of LSC and HSC for the IgM isotype (P = 0.07) indicate that especially IgM NAbs are affected by antigenic pressure, and that mainly under LSC, the IgM titer is most explanatory for final BW. Whether this is the result of a trade-off between immune defense and growth performance, remains uncertain and requires follow-up research with larger datasets.
Figure 7: Body weight (BW) at 33 d of age explained by IgM or IgY titer binding rabbit γ-globulin in broiler chickens kept under low (LSC) and high sanitary conditions (HSC). Points represent individual broilers, and lines represent the trendline of the linear model. Grey areas represent standard errors.

General discussion
Chap
ter
6
151
7. Modulation of later life antibody responses by early nutrition
Early nutrition compared with DN (72 h) broilers were reported having lower IgY responses and growth depression after LPS + HuSA immunization, when housed under relatively high antigenic pressure (Simon et al., 2015). This could indicate that EN, compared with DN, may modulate the immune system towards more controlled immune responses. This is supported by higher levels of biliary IgA in EN compared with DN (48 h) broilers from 8 to 22 d of age (Dibner et al., 1998). In contrast to IgM and IgY, IgA is not involved in activation of complement cascades, and prevents binding of antigens to innate immune receptors (Macpherson et al., 2008), thereby preventing further inflammatory responses. Effects of EN are however not consistent in all studies as Simon et al. (2014) found no effects of EN compared with DN on IgA+ plasma cells. Also other studies observed minimal effects of EN on later life immune responses in broilers (Huibers, 2009 unpublished results; Lamot et al., 2016) or laying hens (Walstra, 2011). These studies, however, were conducted under relatively low antigenic pressure, requiring less regulation of immune responses than chickens housed under high antigenic pressure. Therefore it was investigated whether EN may interact with development of oral tolerance and its interactions with sanitary conditions (LSC versus HSC) in chapter 5.
Oral tolerance can be defined as a state in which the immune system recognizes specific antigens, but mounts no or very limited specific antibody responses towards these antigens (Weiner et al., 2005; Cao et al., 2014). Whereas in human research oral tolerance induction has been subject of study in allergy development (Weiner et al., 2005; Cao et al., 2014), research in chickens mainly focused to prevent oral tolerance to improve efficacy of vaccinations up to 3 d of age (Klipper et al., 2000, 2001, 2004; Yuan and Li, 2012; Ifrah et al., 2016). Based on studies in mammals, oral tolerance can be defined as active suppression of immune responses by regulatory T-cells. Exposure of naïve T-cells to antigens MAMP (e.g. LPS) will stimulate polarization towards helper T-cells that further activate cellular and adaptive immune cascades (Hrncir et al., 2008). Exposure to antigens without co-stimulation of MAMP likely enhances proliferation of naïve T-cells in regulatory T-cells (Treg) by stimulation with TGF-β which is produced by dendritic and intra-epithelial cells (Hrncir et al., 2008). Regulatory T-cells have been identified in chickens as well and have comparable characteristics as mammalian Treg (reviewed by Selvaraj and Shanmugasundaram, 2013). Thus, chicken Treg will likely dampen further immune responses by secretion of the cytokine TGF-β, which also stimulates class switching of B-cells into IgA+ cells (reviewed by Cao et al., 2014). Therefore, MALT with high numbers of Treg and levels of IgA can be characterized as tolerogenic (Weiner et al., 2005; Cao et al., 2014). IgA contributes to (oral) immune tolerance by the neutralization of antigens by binding them on mucosal surfaces, thereby blocking binding of these antigens to innate immune receptors, which prevents further immune activation (Macpherson et al., 2008). Also in chickens, the homeostatic

Chapter 6
152
properties of IgA were demonstrated being similar to mammalian IgA (Lammers et al., 2010), including coating of the majority of intestinal bacteria (den Hartog et al., 2016).
The time window in which oral tolerance can be induced in chickens is approximately 3 d of age (“window of opportunity”; see also textbox 3), which overlaps the time window of DN, which may take up to 3 d (72 h). As the first days of age are critical for maturation of the immune system including activation (Bar-Shira and Friedman, 2006) and education (Bar-Shira et al., 2003, 2005), greater antigenic exposure after EN may interact with development of oral tolerance. Thus, it is likely that greater exposure of the immune system to antigens after EN compared with DN, may affect the development of oral tolerance, as suggested before (Simon et al., 2015). Based on the experiments described in chapter 5, three conclusions can be drawn: (1) oral tolerance can be induced in broiler chickens, but seems to be an attenuated immune response rather than complete ignorance, (2) oral tolerance is specific towards antigens that are present during the window of opportunity, and (3) EN does not affect systemic tolerance, but inconsistently increases biliary IgA levels.
Textbox 3: Induction of oral tolerance in avian species versus mammalians
A remarkable difference among mammals and avian species with respect to oral tolerance, is that in mammals, tolerance can be induced during the whole life, whereas in avian species tolerance can only be induced during incubation up to approximately 3 d of age (Miller and Cook, 1993; Klipper et al., 2001; Ameiss et al., 2004; Friedman, 2008; Wu et al., 2010; Yuan and Li, 2012). The reason for this difference is not yet unraveled, although it is suggested that the absence of the weaning process in avian species might play a role (Friedman, 2008). Whereas avian species would immediately start ingesting their “final” diet, resulting in low variation in antigens during the rest of their life, weaning in mammals results in a later life switch of ingested antigens. Thus mammals will be exposed to novel antigens in their diet at a later phase due to the weaning process. Whether this is the main explanation remains debatable, as not-domesticated Red Junglefowl were found to have seasonal changes in their diet (Collias and Collias, 1967), which may also result in exposure to different antigens throughout the year and life.
Specific antibody responses towards BSA were attenuated in BSA fed, compared with the non-PBS fed (control) broilers. As biliary IgA levels binding BSA were higher in BSA fed compared with PBS fed broilers in chapter 5, this indicates a more tolerogenic antibody response towards BSA (Weiner et al., 2005; Cao et al., 2014) and better maintenance of immune homeostasis (Macpherson et al., 2008) after BSA immunization. Further investigation on T-cell populations could provide more

General discussion
Chap
ter
6
153
insight in the mechanisms of immune regulation after BSA feeding and subsequent immunization, thereby elucidating what factors affect development of oral tolerance. Secondly, in BSA-fed broilers, attenuation of immune responses is specific towards BSA, but not RGG, indicating that oral tolerance is developed only towards antigens that have been present during the window of opportunity (up to 3 d of age). This suggests the involvement of specific Treg populations that dampen systemic SpAb responses towards BSA, but not RGG. Speculatively, greater exposure to antigens during this window, for example as a result of EN, may therefore result in attenuated immune responses in later life to higher numbers of antigens. Finally, EN was not found to affect systemic antibody responses in later life, and also not when reared under either HSC or LSC. This is in contrast with observations of Simon et al. (2015), where lower IgY responses were reported in EN broilers housed in floor pens (representing higher antigenic pressure). Due to the low number of studies comparing later life immune responses of EN versus DN broilers under high antigenic pressure (chapter 5, Simon et al., 2015), the reasons for the inconsistency between these studies cannot be explained yet. However, levels of biliary IgA were increased in EN compared with DN broilers, up to 42 d of age in experiment 3 and up to 35 d of age in batch 2 of experiment 4, but not in other batches of experiment 4. Also in literature, inconsistent effects of EN on mucosal IgA levels are reported (Dibner et al., 1998; Simon et al., 2014). Together, this indicates that other biological factors may play a role in modulating levels of IgA.
In summary, later life systemic antibody responses appear to be minimally affected by EN, compared with DN. Early nutrition does not modulate later life systemic antibody responses via oral tolerance, as suggested before (Simon et al., 2015). Inconsistent increases in biliary IgA levels in EN broilers at 33 and 42 d of age, indicate that EN may contribute to homeostasis of the mucosal immune system. The biological relevance of the increase in biliary IgA levels should be further confirmed in an intestinal challenge model, such as a necrotic enteritis model (Shojadoost et al., 2012).

Chapter 6
154
8. Concluding remarks
• Early nutrition (EN) compared with delayed nutrition (DN) results in greater body weight (BW) from placement until slaughter, the effect size being dependent on the duration of DN. Compensatory growth up to 14 d of age in DN broilers (decreased relative differences in BW) allows partial compensation of body weight.
• Low sanitary conditions (LSC) versus high sanitary conditions (HSC) depressed growth performance of broiler between 3 and 33 d of age. However, under LSC, growth performance and compensatory growth are not affected by EN or DN.
• Intestinal integrity is not affected by EN compared with DN and the short-term enhanced intestinal tract development after EN is an effect of earlier onset of development.
• Broilers receiving EN compared with DN, have higher levels of systemic antibodies up to 7 d of age, especially natural (NAb) and natural auto-antibodies (NAAb), which might improve resistance to infectious diseases during the first week of age. Later life effects are, however, not present.
• Later life systemic antibody responses or modulation of these responses are not affected by EN compared with DN, and minimal interactions between EN and sanitary conditions (LSC versus HSC) were present. These observations indicate that broilers kept under LSC, do not benefit from EN. Irrespective of sanitary conditions, EN may elevate mucosal homeostasis indicated by increased levels of biliary IgA, but its biological relevance is yet unclear.

General discussion
Chap
ter
6
155
9. Implications of early nutrition for commercial broiler husbandry
In this final paragraph I will provide an overview of the expected implications of the research reported in this thesis for commercial broiler husbandry. It is of importance to emphasize that the duration of DN plays a role in the effects of EN compared with DN: longer durations usually result in greater effect sizes. In the Netherlands, broilers receiving DN are expected to have no access to nutrition up to approximately 36 h, whereas in other countries, longer durations of DN (up to 72 h) are more common (chapter 1).
9.1. Intestinal integrity and morphology are minimally impaired after delayed nutritionDelayed nutrition appears to delay the onset of intestinal development (e.g. intestinal weight, absorptive surface area, cell proliferation, and digestive enzyme activity) up to approximately 7 d of age. At later ages, there are minimal differences on intestinal physiology between EN and DN broilers, thereby indicating that long-term effects are not present. Enhanced intestinal integrity in EN compared with DN (72 h) broilers is not reported in the literature or this thesis, although data on paracellular transport before onset of feeding (especially in DN broilers), is lacking. These data are required to confirm that risk of translocation of bacteria or endotoxins into the bloodstream is not affected by EN or DN.
9.2. Short-term, but not long-term, elevation of systemic antibody levels after early nutritionEarly nutrition has been proposed before to accelerate maturation of the adaptive immune system (Juul-Madsen et al., 2004; Bar-Shira et al., 2005). No evidence was found for greater uptake of maternal antibodies from the residual yolk, that may contribute to passive immunity. In addition, there seems no consensus in the literature that EN compared with DN may enhance disappearance of the residual yolk. Remarkably, the proposed mechanism for greater residual yolk uptake in EN broilers, has not been demonstrated yet.
Short-term effects of EN compared with DN were reported in this thesis: EN resulted in higher levels of systemic IgM (including NAb, NAAb, and IgM binding MDP) at 7 d of age, but no differences were observed at later ages. Higher levels of natural IgM in EN broilers may indicate a better first line of defense towards infectious diseases (Berghof et al., 2019) and greater chance of survival (Star et al., 2007; Sun et al., 2011). Thus, EN might contribute to reduction of mortality and antibiotic usage during the first week (de Bruijn et al., 2015; Joosten et al., 2019).

Chapter 6
156
Early nutrition may modulate later life immune responses during the first 3 days of age, as this is an important window of immune development (Friedman et al., 2003; Taha-Abdelaziz et al., 2018). However, later life (between 14 and 42 d of age) effects on systemic antibody levels (NAb, NAAb) or responses (SpAb) were not observed between EN and DN broilers. However, levels of biliary IgA were inconsistently elevated between experiments and batches, indicating that EN may contribute to mucosal homeostasis, although the biological relevance of these differences remain unclear. Also under low sanitary conditions, which likely have resulted in higher antigenic pressure, broilers did not benefit from EN under LSC in terms of immunity or growth performance.
9.3. Consequences of early nutrition on growth performanceEarly nutrition compared with DN has been shown to enhance broiler weight at farm placement up to slaughter (reviewed by de Jong et al., 2017). Relative differences in BW between EN and DN broilers decrease, due to compensatory growth during the first 14 d of age, but especially after prolonged DN up to 72 h, compensatory growth is insufficient to reach equal BW at slaughter. As DN broilers are not able to fully compensate their lower BW, especially after prolonged durations of DN, EN might be a potential strategy for broiler farmers to increase slaughter weights or reduce the length of the rearing period (Textbox 4). Whether EN compared with DN has implications for diet formulations, for example due to compensatory growth in DN broilers, was not studied and requires further investigation.

General discussion
Chap
ter
6
157
Textbox 4: Preliminary calculations of investments and returns of early nutrition
Currently, there are no scientific or independent reports or data available about return on investment of EN. Therefore, I would like to provide insight in required investments to apply EN on an average Dutch broiler farm (75,833 broilers, CBS, 2020), and what improvements in growth performance are required to reach break-even. In this paragraph, I provide an example for in-hatchery EN. Because on-farm EN investments vary widely among farms, a general approach may be too generic and likely results in non-representative estimations.
Acquiring fast-growing EN day-old-chicks requires an additional fee paid by the broiler farmer to the hatchery of approximately € 0.02 per chick (personal communication, Dutch hatchery, 2020). An average Dutch broiler farm housed 75,833 broilers in 2019 (CBS, 2020), thus acquiring in hatchery EN broilers on an average farm requires an additional investment of € 1517 for each rearing cycle of 42 d.The expected return on investment of EN can be calculated based on elevated slaughter weight, which may result in higher earnings at slaughter, or shorter time-to-slaughter due to greater ADG. With respect to enhancing slaughter weight by EN, I assume an average live weight price of € 1.00 / kg at slaughter, and no effects of EN versus DN on mortality. In the Netherlands, carcass composition is not determining slaughter earnings for farmers. Break-even of EN is reached when slaughter weight is increased by at least 20 g / slaughtered broiler1. Thus, in all experiments in this thesis in which broilers reached slaughter age (≥ 33 d), broilers passed this break-even point. Assuming a slaughter weight of 2800 g at 42 d of age, the meta-analysis of de Jong et al. (2018) shows that shorter durations of DN (24 h) also result in reaching break-even. With respect to reduction of time-to-slaughter, the daily rearing costs (all costs without interest and depreciation) are assumed € 0.04 per slaughtered broiler chicken (KWIN, 2019). Break-even of EN is reached when time-to-slaughter is reduced by 0.5 days2. Based on a BW of 45 g at placement, and slaughter weight of 2380 g, this requires 0.97 g higher average daily gain (ADG) of EN broilers. This increase in ADG was reached after longer durations of DN (72 h) in experiment 3 and 4 chapter 4, but not during shorter durations of DN (38 h) as reported in chapter 2. In summary, the above calculations indicate that costs of investment of EN appear to be relatively easily returned on investment. However, it should be noticed that this is a first attempt and rough estimation, and more in-depth farm specific simulations are required to obtain better insights in investments and returns of EN, compared with DN.
1Formula: (total investment / (placed chicks * (1-mortality))) / LW price
2Formula: Total daily cost / total investment


References

References
160
Abed, F., A. Karimi, G. Sadeghi, M. Shivazad, S. Dashti, and A. Sadeghi-Sefidmazgi. 2011. Do broiler chicks possess enough growth potential to compensate long-term feed and water depravation during the neonatal period? South African J. Anim. Sci. 41:33–39.
Al-Aqil, A., I. Zulkifli, A. Q. Sazili, A. R. Omar, and M. A. Rajion. 2009. The Effects of the hot, humid tropical climate and early age feed restriction on stress and fear responses, and performance in broiler chickens. Asian-Aust. J. Anim. Sci. 22:1581–1586.
Al-Sadi, R., D. Ye, K. Dokladny, and T. Y. Ma. 2008. Mechanism of IL-1B-Induced Increase in Intestinal Epithelial Tight Junction Permeability. J. Immunol. 180:5653–5661.
Ameiss, K. a, H. D. Danforth, a P. McElroy, A. Barri, L. R. Berghman, and D. J. Caldwell. 2004. Immunogenicity of ad libitum drinking water administration of bovine serum albumin in Leghorn chickens. Poult. Sci. 83:1535–1538.
Anderson, J. M., and C. M. Van Itallie. 2009. Physiology and function of the tight junction. Cold Spring Harb. Perspect. Biol. 1:1–16.
Andrew, R. J., and A. Brennan. 1983. The Lateralization of Fear Behavior in the Male Domestic Chick: A Developmental-Study. Anim. Behav. 31:1166–1176.
Ao, Z., A. Kocher, and M. Choct. 2012. Effects of dietary additives and early feeding on performance, gut development and immune status of broiler chickens challenged with clostridium perfringens. Asian-Australasian J. Anim. Sci. 25:541–551.
Apajalahti, J., A. Kettunen, and H. Graham. 2004. Characteristics of the gastrointestinal microbial communities, with special reference to the chicken. Worlds. Poult. Sci. J. 60:223–232.
Ar, A., and Y. Yom-Tov. 1978. The Evolution of Parental Care in Birds. Evolution (N. Y). 32:655.
Aviagen. 2014. Ross Broiler Management Handbook.
Awad, W., C. Hess, and M. Hess. 2017. Enteric Pathogens and Their Toxin-Induced Disruption of the Intestinal Barrier through Alteration of Tight Junctions in Chickens. Toxins (Basel). 9:60.
Awad, W. A., E. Mann, M. Dzieciol, C. Hess, S. Schmitz-Esser, M. Wagner, and M. Hess. 2016. Age-Related Differences in the Luminal and Mucosa-Associated Gut Microbiome of Broiler Chickens and Shifts Associated with Campylobacter jejuni Infection. Front. Cell. Infect. Microbiol. 6:1–17.
Bao, M., H. Bovenhuis, M. G. B. Nieuwland, H. K. Parmentier, and J. J. Van Der Poel. 2016. Genetic parameters of IgM and IgG antibodies binding autoantigens in healthy chickens. Poult. Sci. 95:458–465.
Bar-Shira, E., I. Cohen, O. Elad, and A. Friedman. 2014. Role of goblet cells and mucin layer in protecting maternal IgA in precocious birds. Dev. Comp. Immunol. 44:186–194.
Bar-Shira, E., and A. Friedman. 2006. Development and adaptations of innate immunity in the gastrointestinal tract of the newly hatched chick. Dev. Comp. Immunol. 30:930–941.
Bar-Shira, E., D. Sklan, and A. Friedman. 2003. Establishment of immune competence in the avian GALT during the immediate post-hatch period. Dev. Comp. Immunol. 27:147–157.
Bar-Shira, E., D. Sklan, and A. Friedman. 2005. Impaired immune responses in broiler hatchling hindgut following delayed access to feed. Vet. Immunol. Immunopathol. 105:33–45.
Barekatain, R., P. V Chrystal, G. S. Howarth, C. J. McLaughlan, S. Gilani, and G. S. Nattrass. 2019. Performance, intestinal permeability, and gene expression of selected tight junction proteins in broiler chickens fed reduced protein diets supplemented with arginine, glutamine, and glycine subjected to a leaky gut model. Poult. Sci.
Baumgarth, N. 2011. The double life of a B-1 cell: Self-reactivity selects for protective effector functions. Nat. Rev. Immunol. 11:34–46.
Baumgarth, N., J. W. Tung, and L. A. Herzenberg. 2005. Inherent specificities in natural antibodies: A

References
161
key to immune defense against pathogen invasion. Springer Semin. Immunopathol. 26:347–362.
Baxter, M. F. A., R. Merino-Guzman, J. D. Latorre, B. D. Mahaffey, Y. Yang, K. D. Teague, L. E. Graham, A. D. Wolfenden, X. Hernandez-Velasco, L. R. Bielke, B. M. Hargis, and G. Tellez. 2017. Optimizing fluorescein isothiocyanate dextran measurement as a biomarker in a 24-h feed restriction model to induce gut permeability in broiler chickens. Front. Vet. Sci. 4:1–6.
Bekeredjian-Ding, I., and G. Jego. 2009. Toll-like receptors - Sentries in the B-cell response. Immunology 128:311–323.
Berghof, T. V. L., M. G. R. Matthijs, J. A. J. Arts, H. Bovenhuis, R. M. Dwars, J. J. van der Poel, M. H. P. W. Visker, and H. K. Parmentier. 2019b. Selective breeding for high natural antibody level increases resistance to avian pathogenic Escherichia coli (APEC) in chickens. Dev. Comp. Immunol. 93:45–57.
Berghof, T. V. L., G. de Vries Reilingh, M. G. B. Nieuwland, and H. K. Parmentier. 2010. Effect of aging and repeated intratracheal challenge on levels of cryptic and overt natural antibodies in poultry. Poult. Sci. 89:227–235.
Bergoug, H., M. Guinebretière, Q. Tong, N. Roulston, C. E. B. Romanini, V. Exadaktylos, D. Berckmans, P. Garain, T. G. M. Demmers, I. M. Mcgonnell, C. Bahr, C. Burel, N. Eterradossi, and V. Michel. 2013. Effect of transportation duration of 1-day-old chicks on postplacement production performances and pododermatitis of broilers up to slaughter age. Poult. Sci. 92:3300–3309.
Bernasconi, N. L., N. Onai, and A. Lanzavecchia. 2003. A role for toll-like receptors in acquired immunity: Up-regulation of TLR9 by BCR triggering in naive B cells and constitutive expression in memory B cells. Blood 101:4500–4504.
Bernasconi, N. L., E. Traggiai, and A. Lanzavecchia. 2002. Maintenance of serological memory by polyclonal activation of human memory B cells. Science (80-. ). 298:2199–2202.
Bigot, K., S. Mignon-Grasteau, M. Picard, and S. Tesseraud. 2003. Effects of delayed feed intake on body, intestine, and muscle development in neonate broilers. Poult. Sci. 82:781–788.
Binek, M., W. Borzemska, R. Pisarski, B. Blaszczak, G. Kosowska, H. Malec, and E. Karpinska. 2000. Evaluation of the efficacy of feed providing on development of gastrointestinal microflora of newly hatched broiler chickens. Arch. fur Geflugelkd. 64:147–151.
Van den Brand, H., R. Molenaar, I. Van der Star, and R. Meijerhof. 2010. Early feeding affects resistance against cold exposure in young broiler chickens. Poult. Sci. 89:716–720.
Brisbin, J. T., J. Gong, and S. Sharif. 2008. Interactions between commensal bacteria and the gut-associated immune system of the chicken. Anim. Health Res. Rev. 9:101–110.
Broom, L. J., and M. H. Kogut. 2018. The role of the gut microbiome in shaping the immune system of chickens. Vet. Immunol. Immunopathol. 204:44–51 Available at https://doi.org/10.1016/j.vetimm.2018.10.002.
De Bruijn, N., T. Fabri, and J. Wiegel. 2015. Monitoringspilot : Uitval in de eerste levensweek. Deventer, The Netherlands.
Candland, D. K., Z. M. Nagy, and D. H. Conklyn. 1963. Emotional behavior in the domestic chicken (white leghorn) as a function of age and developmental environment. J. Comp. Physiol. Psychol. 56:1069–1073.
Cao, S., T. J. Feehley;, and Cathryn R. Nagler. 2014. The role of commensal bacteria in the regulation of sensitization to food allergens. Fed. Eur. Biochem. Sociaties 588:4258–4266.
Careghi, C., K. Tona, O. Onagbesan, J. Buyse, E. Decuypere, and V. Bruggeman. 2005. The effects of the spread of hatch and interaction with delayed feed access after hatch on broiler performance until seven days of age. Poult. Sci. 84:1314–1320.
Cashman, P. J., C. J. Nicol, and R. B. Jones. 1989. Effects of transportation on the tonic immobility fear

References
162
reactions of broilers. Br. Poult. Sci. 30:211–221.
CBS. 2020. Vleesproductie; aantal slachtingen en geslacht gewicht per diersoort. Available at https://opendata.cbs.nl/statline/#/CBS/nl/dataset/7123slac/table?ts=1587124671704.
Cengiz, O., B. H. Koksal, O. Yagin, A. S. Bakirci, D. Beyaz, S. Buyukyoruk, and A. G. Onol. 2012. Influence of dietary prebiotic addition on digestibility and intestinal microflora of young male broiler chickens exposed to delayed feed access after hatch. Int. J. Poult. Sci. 11:408–416.
Chevalier, N. R., V. Fleury, S. Dufour, V. Proux-Gillardeaux, and A. Asnacios. 2017. Emergence and development of gut motility in the chicken embryo (M Schubert, Ed.). PLoS One 12:e0172511.
College van Beroep voor het bedrijfsleven, 2019. ECLI:NL:CBB:2018:309
Collias, N. E., and E. C. Collias. 1967. A Field Study of the Red Jungle Fowl in North-Central India. Condor 69:360–386.
Corzo, A., M. T. Kidd, W. A. Dozier, G. T. Pharr, and E. A. Koutsos. 2007. Dietary threonine needs for growth and immunity of broilers raised under different litter conditions. J. Appl. Poult. Res. 16:574–582.
Cressman, M. D., Z. Yu, M. C. Nelson, S. J. Moeller, M. S. Lilburn, and H. N. Zerby. 2010. Interrelations between the microbiotas in the litter and in the intestines of commercial broiler chickens. Appl. Environ. Microbiol. 76:6572–6582.
Dantzer, R. 2001. Cytokine-induced sickness behavior: Where do we stand? Brain. Behav. Immun. 15:7–24.
Deplancke, B., and H. R. Gaskins. 2001. Microbial modulation of innate defense: Goblet cells and the intestinal mucus layer. Am. J. Clin. Nutr. 73.
Dibner, J. J., C. D. Knight, M. L. Kitchell, C. a Atwell, a C. Downs, and I. F. J. 1998. Early feeding and development of the immune system in neonatal poultry. J. Appl. Poult. Res. 7:425–436.
Dierenbescherming. 2016. Beter Leven keurmerk criteria BLk Vleeskuikens 1 ster.
Van Dijk, K. S. E., and H. K. Parmentier. 2020. Transfer of natural auto-antibodies via egg yolk in chickens divergently selected for natural antibodies binding keyhole limpet hemocyanin. Dev. Comp. Immunol. 102:103466.
Dobrovolskaia, M. A., and S. N. Vogel. 2002. Toll receptors, CD14, and macrophage activation and deactivation by LPS. Microbes Infect. 4:903–914.
Ducatelle, R., E. Goossens, F. De Meyer, V. Eeckhaut, G. Antonissen, F. Haesebrouck, and F. Van Immerseel. 2018. Biomarkers for monitoring intestinal health in poultry: Present status and future perspectives. Vet. Res. 49:1–9.
Edelblum, K. L., and J. R. Turner. 2009. The tight junction in inflammatory disease: communication breakdown. Curr. Opin. Pharmacol. 9:715–720.
Ekino, S., K. Suginohara, T. Urano, H. Fujii, K. Matsuno, and M. Kotani. 1985. The bursa of Fabricius: a trapping site for environmental antigens. Immunology 55:405–10.
Forder, R. E. a, G. S. Howarth, D. R. Tivey, and R. J. Hughes. 2007. Bacterial modulation of small intestinal goblet cells and mucin composition during early posthatch development of poultry. Poult. Sci. 86:2396–2403.
Forkman, B., A. Boissy, M. C. Meunier-Salaün, E. Canali, and R. B. Jones. 2007. A critical review of fear tests used on cattle, pigs, sheep, poultry and horses. Physiol. Behav. 92:340–374.
Fredenburgh, L. E., M. M. Suárez Velandia, J. Ma, T. Olszak, M. Cernadas, J. A. Englert, S. W. Chung, X. Liu, C. Begay, R. F. Padera, R. S. Blumberg, S. R. Walsh, R. M. Baron, and M. A. Perrella. 2011. Cyclooxygenase-2 Deficiency Leads to Intestinal Barrier Dysfunction and Increased Mortality during Polymicrobial Sepsis. J. Immunol. 187:5255–5267.

References
163
Friedman, A. 2008. Oral tolerance in birds and mammals: Digestive tract development determines the strategy. J. Appl. Poult. Res. 17:168–173.
Friedman, A., E. Bar-Shira, and D. Sklan. 2003. Ontogeny of gut associated immune competence in the chick. Worlds. Poult. Sci. J. 59.
Geyra, A., Z. Uni, and D. Sklan. 2001. The effect of fasting at different ages on growth and tissue dynamics in the small intestine of the young chick. Br. J. Nutr. 86:53–61.
Gilani, S., G. S. Howarth, S. M. Kitessa, R. E. A. Forder, C. D. Tran, and R. J. Hughes. 2016a. New biomarkers for intestinal permeability induced by lipopolysaccharide in chickens. Anim. Prod. Sci.
Gilani, S., G. S. Howarth, S. M. Kitessa, C. D. Tran, R. E. A. Forder, and R. J. Hughes. 2016b. Intestinal permeability induced by lipopolysaccharide and measured by lactulose, rhamnose and mannitol sugars in chickens. Animal 11:1174–1179.
Gilani, S., G. S. Howarth, G. Nattrass, S. M. Kitessa, R. Barekatain, R. E. A. Forder, C. D. Tran, and R. J. Hughes. 2017a. Gene expression and morphological changes in the intestinal mucosa associated with increased permeability induced by short-term fasting in chickens. J. Anim. Physiol. Anim. Nutr. (Berl).:1–9.
Gilani, S., G. S. Howarth, C. D. Tran, R. Barekatain, S. M. Kitessa, R. E. A. Forder, and R. J. Hughes. 2017b. Reduced fasting periods increase intestinal permeability in chickens. J. Anim. Physiol. Anim. Nutr. (Berl).:1–7.
Gilani, S., G. S. Howarth, C. D. Tran, S. M. Kitessa, R. E. A. Forder, R. Barekatain, and R. J. Hughes. 2018. Effects of delayed feeding, sodium butyrate and glutamine on intestinal permeability in newly-hatched broiler chickens. J. Appl. Anim. Res. 46:973–976.
Gonzales, E., N. Kondo, E. S. P. B. Saldanha, M. M. Loddy, C. Careghi, and E. Decuypere. 2003. Performance and physiological parameters of broiler chickens subjected to fasting on the neonatal period. Poult. Sci. 82:1250–1256.
Guide For the Care and Use of Agricultural Animals in Agricultural Research and Teaching. 2010. 3rd ed. Federation of Animal Science Societies, Champaign, IL, U.S.A.
Haghighi, H. R., J. Gong, C. L. Gyles, M. A. Hayes, B. Sanei, P. Parvizi, H. Gisavi, J. R. Chambers, and S. Sharif. 2005. Modulation of antibody-mediated immune response by probiotics in chickens. Clin. Diagn. Lab. Immunol. 12:1387–92.
Haghighi, H. R., J. Gong, C. L. Gyles, M. A. Hayes, H. Zhou, B. Sanei, J. R. Chambers, and S. Sharif. 2006. Probiotics stimulate production of natural antibodies in chickens. Clin. Vaccine Immunol. 13:975–980.
Hamal, K. R., S. C. Burgess, I. Y. Pevzner, and G. F. Erf. 2006. Maternal Antibody Transfer from Dams to Their Egg Yolks, Egg Whites, and Chicks in Meat Lines of Chickens. Poult Sci 85:1364–1372.
Hamer, R. M., and P. M. Simpson. 2002. SAS® Tools for Meta-Analysis.in SAS Users Group International 27. Orlando, Florida.
Den Hartog, G., G. De Vries-Reilingh, A. M. Wehrmaker, H. F. J. Savelkoul, H. K. Parmentier, and A. Lammers. 2016. Intestinal immune maturation is accompanied by temporal changes in the composition of the microbiota. Benef. Microbes 7:677–685.
Heiblum, R., O. Aizenstein, G. Gvaryahu, H. Voet, B. Robinzon, and N. Snapir. 1998. Tonic immobility and open field responses in domestic fowl chicks during the first week of life. Appl. Anim. Behav. Sci. 60:347–357.
Hoeijmakers, L., P. J. Lucassen, and A. Korosi. 2014. The interplay of early-life stress, nutrition, and immune activation programs adult hippocampal structure and function. Front. Mol. Neurosci. 7:103.
Hollemans, M. S., S. De Vries, A. Lammers, and C. Clouard. 2018. Effects of early nutrition and transport

References
164
of 1-day-old chickens on production performance and fear response. :1–9.
Holmes, J. L., C. M. Van Itallie, J. E. Rasmussen, and J. M. Anderson. 2006. Claudin profiling in the mouse during postnatal intestinal development and along the gastrointestinal tract reveals complex expression patterns. Gene Expr. Patterns 6:581–588.
Hooper, L. V., D. R. Littman, and a. J. Macpherson. 2012. Interactions Between the Microbiota and the Immune System. Science (80-. ). 336:1268–1273.
Hornick, J. L., C. Van Eenaeme, O. Gérard, I. Dufrasne, and L. Istasse. 2000. Mechanisms of reduced and compensatory growth. Domest. Anim. Endocrinol. 19:121–132.
Hrncir, T., R. Stepankova, H. Kozakova, T. Hudcovic, and H. Tlaskalova-Hogenova. 2008. Gut microbiota and lipopolysaccharide content of the diet influence development of regulatory T cells: studies in germ-free mice. BMC Immunol. 9:65.
Huibers, P. M. C. 2009. Effect of early feeding on the transfer of maternal antibodies and development of immune competence in the broiler chicken (Master dissertation, Wageningen University & Research, Wageningen, the Netherlands).
Humphrey, B. D., and K. C. Klasing. 2004. Modulation of nutrient metabolism and homeostasis by the immune system. Worlds. Poult. Sci. J. 60:90–100.
Ifrah, M. E., B. Perelman, A. Finger, and Z. Uni. 2016. The role of the bursa of Fabricius in the immune response to vaccinal antigens and the development of immune tolerance in chicks ( Gallus domesticus ) vaccinated at a very young age. Poult. Sci. 96:51–57.
Van Immerseel, F., J. I. Rood, R. J. Moore, and R. W. Titball. 2009. Rethinking our understanding of the pathogenesis of necrotic enteritis in chickens. Trends Microbiol. 17:32–36.
IRI Nederland. 2019. Persbericht: Jumbo en Hard Discount grootste winst marktaandeel. Available at www.IRIworldwide.nl.
Iseri, V. J., and K. C. Klasing. 2013. Dynamics of the systemic components of the chicken (Gallus gallus domesticus) immune system following activation by Escherichia coli; implications for the costs of immunity. Dev. Comp. Immunol. 40:248–257.
Iseri, V. J., and K. C. Klasing. 2014. Changes in the amount of lysine in protective proteins and immune cells after a systemic response to dead Escherichia coli: implications for the nutritional costs of immunity. Integr. Comp. Biol. 54:922–930.
Ismiraj, M. R., J. A. J. Arts, and H. K. Parmentier. 2019. Maternal Transfer of Natural (Auto-) Antibodies in Chickens. Poult. Sci. 98:2380–2391.
Jacobs, L., E. Delezie, L. Duchateau, K. Goethals, B. Ampe, E. Lambrecht, X. Gellynck, and F. A. M. Tuyttens. 2016. Effect of post-hatch transportation duration and parental age on broiler chicken quality, welfare, and productivity. Poult. Sci.
Jacobs, L., E. Delezie, L. Duchateau, K. Goethals, and F. A. M. Tuyttens. 2017. Impact of the separate pre-slaughter stages on broiler chicken welfare. Poult. Sci. 96:266–273.
Jones, R. B. 1986. The tonic immobility reaction of the domestic fowl: a review. World Poult. Sci. J. 42:82–96.
Jones, R. B., and A. D. Mills. 1983. Estimation of fear in two lines of the domestic chick: Correlations between various methods. Behav. Processes 8:243–253.
Jones, R. B., and D. Waddington. 1992. Modification of fear in domestic chicks, Gallus gallus domesticus, via regular handling and early environmental enrichment. Anim. Behav. 43:1021–1033.
De Jong, I. C., H. Gunnink, T. Van Hattum, J. W. Van Riel, M. M. P. Raaijmakers, E. S. Zoet, and H. Van Den Brand. 2018. Comparison of performance, health and welfare aspects between commercially housed hatchery-hatched and on-farm hatched broiler flocks. Animal:1–9.

References
165
de Jong, B. G., A. Lammers, L. A. A. Oberendorf, M. G. B. Nieuwland, H. F. J. Savelkoul, and H. K. Parmentier. 2013. Genetic and phenotypic selection affect natural (auto-) antibody reactivity of chickens. PLoS One 8.
De Jong, I., J. Van Riel, S. Lourens, M. Bracke, and H. van den Brand. 2016. Effects of food and water deprivation in newly hatched chickens. Wageningen, The Netherlands.
de Jong, I. C., J. van Riel, M. B. M. Bracke, and H. van den Brand. 2017. A “meta-analysis” of effects of post-hatch food and water deprivation on development, performance and welfare of chickens (G Kunze, Ed.). PLoS One 12:e0189350.
Joosten, P., S. Sarrazin, L. Van Gompel, R. E. C. Luiken, D. J. Mevius, J. A. Wagenaar, D. J. J. Heederik, J. Dewulf, H. Graveland, H. Schmitt, D. Mevius, A. Van Essen, B. Gonzalez-Zorn, G. Moyano, P. Sanders, C. Chauvin, J. David, A. Battisti, A. Caprioli, T. Blaha, K. Wadepohl, M. Brandt, F. Aarestrup, T. Hald, S. Duarte, D. Wasyl, D. Krasucka, B. Biernacki, J. Szumilo, H. Daskalov, H. Saatkamp, and K. Stärk. 2019. Quantitative and qualitative analysis of antimicrobial usage at farm and flock level on 181 broiler farms in nine European countries. J. Antimicrob. Chemother. 74:798–806.
Juul-Madsen, H. R., G. Su, and P. Sørensen. 2004. Influence of early or late start of first feeding on growth and immune phenotype of broilers. Br. Poult. Sci. 45:210–222.
Karcher, D. M., and T. Applegate. 2008. Survey of enterocyte morphology and tight junction formation in the small intestine of avian embryos. Poult. Sci. 87:339–350.
Karpinska, E., B. Blaszczak, G. Kosowska, A. Degorski, M. Binek, and W. B. Borzemska. 2001. Growth of the intestinal anaerobes in the newly hatched chicks according to the feeding and providing with normal gut flora. Bull. Vet. Inst. Pulawy 45:105–109.
Kelly, J. R., P. J. Kennedy, J. F. Cryan, T. G. Dinan, G. Clarke, and N. P. Hyland. 2015. Breaking down the barriers: the gut microbiome, intestinal permeability and stress-related psychiatric disorders. Front. Cell. Neurosci. 9.
Kisielinski, K., S. Willis, A. Prescher, B. Klosterhalfen, and V. Schumpelick. 2002. A simple new method to calculate small intestine absorptive surface in the rat. Clin. Exp. Med. 2:131–135.
Klipper, E., D. Sklan, and A. Friedman. 2000. Immune responses of chickens to dietary protein antigens. Vet. Immunol. Immunopathol. 74:209–223.
Klipper, E., D. Sklan, and A. Friedman. 2001. Response, tolerance and ignorance following oral exposure to a single dietary protein antigen in Gallus domesticus. Vaccine 19:2890–2897.
Klipper, E., D. Sklan, and A. Friedman. 2004. Maternal antibodies block induction of oral tolerance in newly hatched chicks. Vaccine 22:493–502.
Koenen, M. E., A. G. Boonstra-Blom, and S. H. M. Jeurissen. 2002. Immunological differences between layer-and broiler-type chickens. Vet. Immunol. Immunopathol. 89:47–56.
Kotula, A. W., and N. V. Helbacka. 1966. Blood volume of live chickens and influence of slaughter technique on blood loss. Poult. Sci. 45:684–688.
Kreuk, L. S., M. A. Koch, L. C. Slayden, N. A. Lind, S. Chu, H. P. Savage, A. B. Kantor, N. Baumgarth, and G. M. Barton. 2019. B cell receptor and Toll-like receptor signaling coordinate to control distinct B-1 responses to both self and the microbiota. Elife 8:1–25.
Kuttappan, V. a., L. R. Berghman, E. a. Vicuna, J. D. Latorre, A. Menconi, J. D. Wolchok, a. D. Wolfenden, O. B. Faulkner, G. I. Tellez, B. M. Hargis, L. R. Bielke, E. A. Vicuña, J. D. Latorre, A. Menconi, J. D. Wolchok, a. D. Wolfenden, O. B. Faulkner, G. I. Tellez, B. M. Hargis, and L. R. Bielke. 2015a. Poultry enteric inflammation model with dextran sodium sulfate mediated chemical induction and feed restriction in broilers. Poult. Sci. 94:1220–6.
Kuttappan, V. A., E. . A. Vicuña, J. D. Latorre, A. Wolfenden, G. I. Téllez, B. M. Hargis, and L. R. Bielke. 2015b. Evaluation of Gastrointestinal Leakage in Multiple Enteric Inflammation Models in

References
166
Chickens. Front. Vet. Sci. 2:1–6.
KWIN. 2019. 2019th–2020th ed. Wageningen Livestock Research, Wageningen, The Netherlands.
Lammers, A., M. E. V. Klomp, M. G. B. Nieuwland, H. F. J. Savelkoul, and H. K. Parmentier. 2004. Adoptive transfer of natural antibodies to non-immunized chickens affects subsequent antigen-specific humoral and cellular immune responses. Dev. Comp. Immunol. 28:51–60.
Lammers, A., W. H. Wieland, L. Kruijt, A. Jansma, T. Straetemans, A. Schots, G. den Hartog, and H. K. Parmentier. 2010. Successive immunoglobulin and cytokine expression in the small intestine of juvenile chicken. Dev. Comp. Immunol. 34:1254–1262.
Lamot, D. M., S. A. S. van der Klein, I. B. van de Linde, P. J. A. Wijtten, B. Kemp, H. van den Brand, and A. Lammers. 2016. Effects of feed access after hatch and inclusion of fish oil and medium chain fatty acids in a pre-starter diet on broiler chicken growth performance and humoral immunity. animal 10:1409–1416.
Lamot, D. M., I. B. van de Linde, R. Molenaar, C. W. van der Pol, P. J. A. Wijtten, B. Kemp, and H. van den Brand. 2014. Effects of moment of hatch and feed access on chicken development. Poult. Sci. 93:PS4123.
Lan, Y., M. W. A. Verstegen, S. Tamminga, and B. A. Williams. 2005. The role of the commensal gut microbial community in broiler chickens. Worlds. Poult. Sci. J. 61:95–104.
Lawrence, E. C., F. Arnaud-Battandier, J. Grayson, I. R. Koski, N. J. Dooley, A. V Muchmore, and R. M. Blaese. 1981. Ontogeny of humoral immune function in normal chickens: a comparison of immunoglobulin-secreting cells in bone marrow, spleen, lungs and intestine. Clin. Exp. Immunol. 43:450–7.
Lee, S. H. 2015. Intestinal Permeability Regulation by Tight Junction: Implication on Inflammatory Bowel Diseases. Intest. Res. 13:11.
Lee, K. W., H. S. Lillehoj, S. I. Jang, S. H. Lee, D. A. Bautista, and G. R. Siragusa. 2013. Effect of Bacillus Subtilis-based direct-fed microbials on immune status in broiler chickens raised on fresh or used litter. Asian-Australasian J. Anim. Sci. 26:1592–1597.
Lee, A. K. W., H. S. Lillehoj, S. H. Lee, S. I. Jang, G. D. Ritter, D. A. Bautista, and E. P. Lillehoj. 2011. Impact of Fresh or Used Litter on the Posthatch Immune System of Commercial Broilers. Avian Dis. 55:539–544.
Leeson, S., and A. K. Zubair. 1997. Nutrition of the Broiler Chicken Around the Period of Compensatory Growth. Poult. Sci. 76:992–999.
Leshchinsky, T. V., and K. C. Klasing. 2001. Divergence of the inflammatory response in two types of chickens. Dev. Comp. Immunol. 25:629–638.
Lilburn, M. S., and S. Loeffler. 2015. Early intestinal growth and development in poultry. Poult. Sci. 94:1569–1576.
Lippens, M., G. Huyghebaert, and G. De Groote. 2002. The efficiency of nitrogen retention during compensatory growth of food-restricted broilers. Br. Poult. Sci. 43:669–676.
Lourens, A., H. van den Brand, R. Meijerhof, and B. Kemp. 2005. Effect of eggshell temperature during incubation on embryo development, hatchability, and posthatch development. Poult. Sci. 84:914–920.
Lu, Z., L. Ding, Q. Lu, and Y.-H. Chen. 2013. Claudins in intestines. Tissue Barriers 1:e24978.
Lutz, H. U. 2007. Homeostatic roles of naturally occurring antibodies: An overview. J. Autoimmun. 29:287–294.
Lutz, H. U., C. J. Binder, and S. Kaveri. 2009. Naturally occurring auto-antibodies in homeostasis and disease. Trends Immunol. 30:43–51.

References
167
Maatjens, C. M., I. A. M. van Roovert-Reijrink, I. van den Anker, B. Engel, C. W. van der Pol, B. Kemp, and H. van den Brand. 2016a. Temperature during the last week of incubation. II. Effects on first week broiler development and performance. Poult. Sci. 00:1–9.
Maatjens, C. M., I. A. M. van Roovert-Reijrink, B. Engel, C. W. van der Pol, B. Kemp, and H. van den Brand. 2016b. Temperature during the last week of incubation. I. Effects on hatching pattern and broiler chicken embryonic organ development. Poult. Sci. 95:956–65.
Macpherson, A. J., K. D. McCoy, F.-E. Johansen, and P. Brandtzaeg. 2008. The immune geography of IgA induction and function. Mucosal Immunol. 1:11–22.
Maiorka, A., E. Santin, F. Dahlke, I. C. Boleli, R. L. Furlan, and M. Macari. 2003. Posthatching Water and Feed Deprivation Affect the Gastrointestinal Tract and Intestinal Mucosa Development of Broiler Chicks. J. Appl. Poult. Res. 12:483–492.
Matson, K. D., R. E. Ricklefs, and K. C. Klasing. 2005. A hemolysis-hemagglutination assay for characterizing constitutive innate humoral immunity in wild and domestic birds. Dev. Comp. Immunol. 29:275–286.
Maynard, C. L., C. O. Elson, R. D. Hatton, and C. T. Weaver. 2012. Reciprocal interactions of the intestinal microbiota and immune system. Nature 489:231–241.
Medway, W., and M. R. Kare. 1959. Blood and Plasma Volume, Hematocrit, Blood Specific Gravity and Serum Protein Electrophoresis of the Chicken. Poult. Sci. 38:624–631.
Van der Meer, Y. 2017. Nutrition of pigs kept under low and high sanitary conditions (Doctoral dissertation, Wageningen University & Research, Wageningen, the Netherlands).
van der Meer, Y., W. J. J. Gerrits, A. J. M. Jansman, B. Kemp, and J. E. Bolhuis. 2017. A link between damaging behaviour in pigs, sanitary conditions, and dietary protein and amino acid supply (A Gonzalez-Bulnes, Ed.). PLoS One 12:e0174688.
van der Meer, Y., A. Lammers, A. J. M. Jansman, M. M. J. A. Rijnen, W. H. Hendriks, and W. J. J. Gerrits. 2016. Performance of pigs kept under different sanitary conditions affected by protein intake and amino acid supplementation. J. Anim. Sci. 94:4704–4719.
Miller, C. C., and M. E. Cook. 1993. Evidence against the induction of immunological tolerance by feeding antigens to chickens. Poult. Sci. 73:106–112.
Mitchell, M. A. 2009. Chick transport and welfare. Avian Biol. Res. 2:99–105.
Moolenbeek, C., and E. J. Ruitenberg. 1981. The “Swiss roll”: a simple technique for histological studies of the rodent intestine. Lab. Anim. 15:57–59.
Nagele, E. P., M. Han, N. K. Acharya, C. DeMarshall, M. C. Kosciuk, and R. G. Nagele. 2013. Natural IgG Autoantibodies Are Abundant and Ubiquitous in Human Sera, and Their Number Is Influenced By Age, Gender, and Disease. PLoS One 8.
Noy, Y., and D. Sklan. 1998. Yolk utilisation in the newly hatched poult. Br. Poult. Sci. 39:446–451.
Noy, Y., and D. Sklan. 2001. Yolk and exogenous feed utilization in the posthatch chick. Poult. Sci. 80:1490–1495.
Noy, Y., Z. Uni, and D. Sklan. 1996. Routes of yolk utilisation in the newly‐hatched chick. Br. Poult. Sci. 37:987–996.
O’Reilly, E. L., R. J. Burchmore, N. H. Sparks, and P. D. Eckersall. 2017. The effect of microbial challenge on the intestinal proteome of broiler chickens. Proteome Sci. 15:1–17.
Ochsenbein, A. F. 1999. Control of Early Viral and Bacterial Distribution and Disease by Natural Antibodies. Science (80-. ). 286:2156–2159.
Ochsenbein, A. F., and R. M. Zinkernagel. 2000. Natural antibodies and complement link innate and acquired immunity. Immunol. Today 21:624–630.

References
168
Olsson, C., and S. Holmgren. 2001. The control of gut motility. Comp. Biochem. Physiol. Part A Mol. Integr. Physiol. 128:479–501.
Ozden, O., B. L. Black, C. M. Ashwell, C. K. Tipsmark, R. J. Borski, and B. J. Grubb. 2010. Developmental profile of claudin-3, -5, and -16 proteins in the epithelium of chick intestine. Anat. Rec. 293:1175–1183.
Panda, a. K., S. K. Bhanja, and G. Shyam Sunder. 2014. Early post hatch nutrition on immune system development and function in broiler chickens. Worlds. Poult. Sci. J. 71:285–296.
Parmentier, H. K., S. Bronkhorst, M. G. B. Nieuwland, G. De Vries Reilingh, J. M. Van Der Linden, M. J. W. Heetkamp, B. Kemp, J. W. Schrama, M. W. A. Verstegen, and H. Van Den Brand. 2002. Increased fat deposition after repeated immunization in growing chickens. Poult. Sci. 81:1308–1316.
Parmentier, H. K., A. Lammers, J. J. Hoekman, G. De Vries Reilingh, I. T. A. Zaanen, and H. F. J. Savelkoul. 2004. Different levels of natural antibodies in chickens divergently selected for specific antibody responses. Dev. Comp. Immunol. 28:39–49.
Parmentier, H. K., P. S. van der Vaart, M. G. B. Nieuwland, and H. F. J. Savelkoul. 2017. Genetic aspects of auto-immune profiles of healthy chickens. Dev. Comp. Immunol. 74:90–100.
St. Paul, M., S. Paolucci, L. R. Read, and S. Sharif. 2012. Characterization of responses elicited by Toll-like receptor agonists in cells of the bursa of Fabricius in chickens. Vet. Immunol. Immunopathol. 149:237–244.
Pinchasov, Y., and Y. Noy. 1993. Comparison of post‐hatch holding time and subsequent early performance of broiler chicks and Turkey poults. Br. Poult. Sci. 34:111–120.
Pinheiro, J. C., and D. M. C. N.-J. or A. B. R. R. Q. 73. S. P. 2000 J. or A. B. R. R.-S. O. Q. 73. S. P. 2000 Bates. 2000. Mixed-Effects Models in S and S-PLUS. Springer-Verlag, New York.
Pinheiro, J., D. Bates, S. DebRoy, D. Sarkar, and R Core Team. 2018. nlme: Lineair and Nonlinear Mixed Effects Models.
Ploegaert, T. C. W., G. De Vries Reilingh, M. G. B. Nieuwland, A. Lammers, H. F. J. Savelkoul, and H. K. Parmentier. 2007. Intratracheally administered pathogen-associated molecular patterns affect antibody responses of poultry. Poult. Sci. 86:1667–1676.
Potturi, P. V. L., J. a Patterson, and T. J. Applegate. 2005. Effects of delayed placement on intestinal characteristics in turkey poults. Poult. Sci. 84:816–824.
Proszkowiec-Weglarz, M., L. L. Schreier, K. B. Miska, R. Angel, S. Kahl, and B. Russell. 2018. Effect of early neonatal development and delayed feeding post-hatch on jejunal and ileal calcium and phosphorus transporter genes expression in broiler chickens1. Poult. Sci. 1.
De Punder, K., and L. Pruimboom. 2015. Stress induces endotoxemia and low-grade inflammation by increasing barrier permeability. Front. Immunol. 6:1–12.
R Development Core Team. 2018. R: A language and environment for statistical computing.
Raetz, C. R. H., and C. Whitfield. 2002. Lipopolysaccharide Endotoxins. Annu. Rev. Biochem. 71:635–700.
Ratcliffe, M. J. H. 2006. Antibodies, immunoglobulin genes and the bursa of Fabricius in chicken B cell development. Dev. Comp. Immunol. 30:101–118.
Ratner, S. C., and R. W. Thompson. 1960. Immobility reactions (fear) of domestic fowl as a function of age and prior experience. Anim. Behav. 8:186–191.
Rudrappa, S. G., and B. D. Humphrey. 2007. Energy Metabolism in Developing Chicken Lymphocytes Is Altered during the Embryonic to Posthatch Transition. J. Nutr. 137:427–432.
Ruprecht, C. R., and A. Lanzavecchia. 2006. Toll-like receptor stimulation as a third signal required for

References
169
activation of human naive B cells. Eur. J. Immunol. 36:810–816.
Salzen, E. A. 1963. Imprinting and the immobility reactions of domestic fowl. Anim. Behav. 11:66–71.
SAS. 2011. SAS Inst. Inc., Cary, NC, U.S.A.
Schneeberger, E. E., and R. D. Lynch. 2004. The tight junction: a multifunctional complex. AJP Cell Physiol. 286:C1213–C1228.
Selvaraj, R. K., and R. Shanmugasundaram. 2013. Regulatory T Cells in Avian Species. Adv. Anim. Vet. Sci. 1:129–133.
Shanmugasundaram, R., M. S. Lilburn, and R. K. Selvaraj. 2012. Effect of recycled litter on immune cells in the cecal tonsils of chickens 1,2. Poult. Sci. 91:95–100 Available at http://dx.doi.org/10.3382/ps.2011-01800.
Shapiro, S. K., and W. K. Sarles. 1949. Microorganisms in the intestinal tract of normal chickens. J. Bacteriol. 58:531–544.
Shen, L., C. R. Weber, and J. R. Turner. 2008. The tight junction protein complex undergoes rapid and continuous molecular remodeling at steady state. J. Cell Biol. 181:683–695.
Shinde, A. S., S. K. Bhanja, A. Goel, M. Mehra, J. Rokade, P. Bhadauria, and A. B. Mandal. 2015. Delayed Post Hatch Feeding Affects Performance, Intestinal Morphology and Expression Pattern of Nutrient Transporter Genes in Egg Type Chickens. J Nutr Food Sci 5.
Shojadoost, B., A. R. Vince, and J. F. Prescott. 2012. The successful experimental induction of necrotic enteritis in chickens by Clostridium perfringens: A critical review. Vet. Res. 43:1 Available at Veterinary Research.
da Silva Menezes, J. 2003. Stimulation by food proteins plays a critical role in the maturation of the immune system. Int. Immunol. 15:447–455.
Simon, K. 2016. Effects of early life conditions on immunity in broilers and layers (Doctoral dissertation, Wageningen University & Research, Wageningen, the Netherlands).
Simon, K., M. B. Verwoolde, J. Zhang, H. Smidt, G. de Vries Reilingh, B. Kemp, and A. Lammers. 2016. Long-term effects of early life microbiota disturbance on adaptive immunity in laying hens. Poult. Sci. 95:1543–1554.
Simon, K., G. de Vries Reilingh, J. E. Bolhuis, B. Kemp, and A. Lammers. 2015. Early feeding and early life housing conditions influence the response towards a noninfectious lung challenge in broilers. Poult. Sci. 94:2041–2048.
Simon, K., G. de Vries Reilingh, B. Kemp, and A. Lammers. 2014. Development of ileal cytokine and immunoglobulin expression levels in response to early feeding in broilers and layers. Poult. Sci. 93:3017–3027.
Sinyakov, M. S., M. Dror, H. M. Zhevelev, S. Margel, and R. R. Avtalion. 2002. Natural antibodies and their significance in active immunization and protection against a defined pathogen in fish. Vaccine 20:3668–3674.
Sklan, D., and Y. Noy. 2000. Hydrolysis and absorption in the small intestines of posthatch chicks. Poult. Sci. 79:1306–1310.
Sklan, D., Y. Noy, A. Hoyzman, and I. Rozenboim. 2000. Decreasing weight loss in the hatchery by feeding chicks and poults in hatching trays. J. Appl. Poult. Res. 9:142–148.
Smirnov, A., R. Perez, E. Amit-Romach, D. Sklan, and Z. Uni. 2005. Mucin dynamics and microbial populations in chicken small intestine are changed by dietary probiotic and antibiotic growth promoter supplementation. J. Nutr. 135:187–192.
Snoeck, V., I. R. Peters, and E. Cox. 2006. The IgA system: a comparison of structure and function in different species. Vet. Res. 37:455–467.

References
170
Sonoda, K., K. Noguchi, and S. Ekino. 2013. Immune complexes of E. coli antigens and maternal IgG in the bursa of Fabricius. Cell Tissue Res. 354:813–821.
Stadig, L. 2019. Vleeskuikenconcepten in Nederland. Den Haag, The Netherlands.
Stäger, S., J. Alexander, A. C. Kirby, M. Botto, N. Van Rooijen, D. F. Smith, F. Brombacher, and P. M. Kaye. 2003. Natural antibodies and complement are endogenous adjuvants for vaccine-induced CD8+ T-cell responses. Nat. Med. 9:1287–1292.
Stanley, D., M. S. Geier, R. J. Hughes, S. E. Denman, and R. J. Moore. 2013. Highly variable microbiota development in the chicken gastrointestinal tract. PLoS One 8:6–12.
Star, L., K. Frankena, B. Kemp, M. G. B. Nieuwland, and H. K. Parmentier. 2007. Natural humoral immune competence and survival in layers. Poult. Sci. 86:1090–1099.
Sun, Y., H. K. Parmentier, K. Frankena, and J. J. van der Poel. 2011. Natural antibody isotypes as predictors of survival in laying hens. Poult. Sci. 90:2263–2274.
Taha-Abdelaziz, K., D. C. Hodgins, A. Lammers, T. N. Alkie, and S. Sharif. 2018. Effects of early feeding and dietary interventions on development of lymphoid organs and immune competence in neonatal chickens: A review. Vet. Immunol. Immunopathol. 201:1–11.
Teicher, M. H., S. L. Andersen, A. Polcari, C. M. Anderson, C. P. Navalta, and D. M. Kim. 2003. The neurobiological consequences of early stress and childhood maltreatment. Neurosci. Biobehav. Rev. 27:33–44.
Teirlynck, E., M. D. E. Gussem, J. Dewulf, F. Haesebrouck, R. Ducatelle, and F. Van Immerseel. 2011. Morphometric evaluation of “dysbacteriosis” in broilers. Avian Pathol. 40:139–144.
Tellez, G., J. D. Latorre, V. A. Kuttappan, B. M. Hargis, and X. Hernandez-Velasco. 2015. Rye affects bacterial translocation, intestinal viscosity, microbiota composition and bone mineralization in turkey poults. PLoS One 10:1–9.
Tellez, G., J. D. Latorre, V. A. Kuttappan, M. H. Kogut, A. Wolfenden, X. Hernandez-Velasco, B. M. Hargis, W. G. Bottje, L. R. Bielke, and O. B. Faulkner. 2014. Utilization of rye as energy source affects bacterial translocation, intestinal viscosity, microbiota composition, and bone mineralization in broiler chickens. Front. Genet. 5:1–7.
Tizard, I. 2018. Veterinary Immunology. Tenth Edit. Elsevier, St. Louis , Missouri.
Tona, K., O. Onagbesan, B. De Ketelaere, E. Decuypere, and V. Bruggeman. 2004. Effects of age of broiler breeders and egg storage on egg quality, hatchability, chick quality, chick weight, and chick posthatch growth to forty-two days. J. Appl. Poult. Res. 13:10–18.
Turner, J. R. 2009. Intestinal mucosal barrier function in health and disease. Nat. Rev. Immunol. 9:799–809 Available at http://dx.doi.org/10.1038/nri2653.
Ulluwishewa, D., R. C. Anderson, W. C. McNabb, P. J. Moughan, J. M. Wells, and N. C. Roy. 2011. Regulation of Tight Junction Permeability by Intestinal Bacteria and Dietary Components. J. Nutr. 141:769–776.
Uni, Z., and R. P. Ferket. 2004. Methods for early nutrition and their potential. Worlds. Poult. Sci. J. 60:101–111.
Uni, Z., A. Smirnov, and D. Sklan. 2003a. Pre-and posthatch development of goblet cells in the broiler small intestine: effect of delayed access to feed. Poult. Sci. 82:320–327.
Uni, Z., E. Tako, O. Gal-Garber, and D. Sklan. 2003b. Morphological, molecular, and functional changes in the chicken small intestine of the late-term embryo. Poult. Sci. 82:1747–1754.
Vahjen, W., K. Gläser, K. Schäfer, and O. Simon. 1998. Influence of xylanase-supplemented feed on the development of selected bacterial groups in the intestinal tract of broiler chicks. J. Agric. Sci. 130:489–500.

References
171
Valros, A., R. Vuorenmaa, and A. M. Janczak. 2008. Effect of simulated long transport on behavioural characteristics in two strains of laying hen chicks. Appl. Anim. Behav. Sci. 109:58–67.
Vaz, N. M. 2000. Natural immunoglobulins (contribution to a debate on biomedical education). Mem. Inst. Oswaldo Cruz 95:59–62.
Van De Ven, L. J. F., A. V Van Wagenberg, M. Debonne, E. Decuypere, B. Kemp, and H. Van Den Brand. 2011. Hatching system and time effects on broiler physiology and posthatch growth. Poult. Sci. 90:1267–1275.
van de Ven, L. J. F., A. V. van Wagenberg, E. Decuypere, B. Kemp, and H. van den Brand. 2013. Perinatal broiler physiology between hatching and chick collection in 2 hatching systems. Poult. Sci. 92:1050–1061.
Van De Ven, L. J. F., A. V Van Wagenberg, P. W. G. Groot Koerkamp, B. Kemp, H. Van den Brand, P. W. G. G. Koerkamp, B. Kemp, and H. Van den Brand. 2009. Effects of a combined hatching and brooding system on hatchability, chick weight, and mortality in broilers. Poult. Sci. 88:2273–2279.
Vicuña, E. A., V. A. Kuttappan, R. Galarza-Seeber, J. D. Latorre, O. B. Faulkner, B. M. Hargis, G. Tellez, and L. R. Bielke. 2015a. Effect of dexamethasone in feed on intestinal permeability, differential white blood cell counts, and immune organs in broiler chicks. :2075–2080.
Vicuña, E. A., V. A. Kuttappan, G. Tellez, X. Hernandoz-Velasco, R. Seeber-Galarza, J. D. Latorre, O. B. Faulkner, A. D. Wolfenden, B. M. Hargis, and L. R. Bielke. 2015b. Dose titration of FITC-D for optimal measurement of enteric inflammation in broiler chicks. Poult. Sci. 94:1353–1359.
Vollmers, H. P., and S. Brändlein. 2005. The “early birds”: Natural IgM antibodies and immune surveillance. Histol. Histopathol. 20:927–937.
Volynets, V., A. Rings, G. Bárdos, M. J. Ostaff, J. Wehkamp, and S. C. Bischoff. 2016. Intestinal barrier analysis by assessment of mucins, tight junctions, and α-defensins in healthy C57BL/6J and BALB/cJ mice. Tissue Barriers 4:1–15.
van der Wagt, I., I. C. de Jong, M. A. Mitchell, R. Molenaar, and H. van den Brand. 2020. A review on yolk sac utilization in poultry. Poult. Sci. 99:2162–2175.
Wakker Dier. 2013. Eendagskuikens op hongerdieet.
Walstra, I. 2011. Adaptive capacity of rearing hens (Doctoral dissertation, Wageningen University & Research, Wageningen, the Netherlands).
Wang, Z., and L. A. Goonewardene. 2004. The use of MIXED models in the analysis of animal experiments with repeated measures data. Can. J. Anim. Sci. 84:1–11.
Wang, Y., Y. Li, E. Willems, H. Willemsen, L. Franssens, A. Koppenol, X. Guo, K. Tona, E. Decuypere, J. Buyse, and N. Everaert. 2014. Spread of hatch and delayed feed access affect post hatch performance of female broiler chicks up to day 5. Animal 8:610–7.
Wang, L., M. Lilburn, and Z. Yu. 2016. Intestinal microbiota of broiler chickens as affected by litter management regimens. Front. Microbiol. 7:1–12.
Weiner, H. L., A. Pires, F. Quintana, and H. Wu. 2005. Oral Tolerance. Immunol Rev.:232–259.
Wells, J. M., R. J. Brummer, M. Derrien, T. T. MacDonald, F. Troost, P. D. Cani, V. Theodorou, J. Dekker, A. Méheust, W. M. De Vos, A. Mercenier, A. Nauta, and C. L. Garcia-Rodenas. 2017. Homeostasis of the gut barrier and potential biomarkers. Am. J. Physiol. - Gastrointest. Liver Physiol. 312:G171–G193.
Wideman, R. F., K. R. Hamal, J. M. Stark, J. Blankenship, H. Lester, K. N. Mitchell, G. Lorenzoni, and I. Pevzner. 2012. A wire-flooring model 1 for inducing lameness in broilers: Evaluation of probiotics as a prophylactic treatment. Poult. Sci. 91:870–883.
Willemsen, H., M. Debonne, Q. Swennen, N. Everaert, C. Careghi, H. Han, V. Bruggeman, K. Tona, and E. Decuypere. 2010. Delay in feed access and spread of hatch: importance of early nutrition.

References
172
Worlds. Poult. Sci. J. 66:177–188.
Wise, M. G., and G. R. Siragusa. 2007. Quantitative analysis of the intestinal bacterial community in one- to three-week-old commercially reared broiler chickens fed conventional or antibiotic-free vegetable-based diets. J. Appl. Microbiol. 102:1138–1149.
Wu, G. J., F. Yuan, M. H. Du, H. T. Han, L. Q. Lu, L. Yan, W. X. Zhang, X. P. Wang, P. Sun, and Z. D. Li. 2010. Early embryonic blood cells collect antigens and induce immunotolerance in the hatched chicken. Poult. Sci. 89:457–463.
Wyatt, C. L., W. D. Weaver, W. L. Beane, and D. M. Denbow. 1986. Influence of hatcher holding times on several physiological parameters associated with the immune system of chickens. Poult. Sci. 65:2156–2164.
Xu, X., S. M. Ng, E. Hassouna, A. Warrington, S.-H. Oh, and M. Rodriguez. 2015. Human-derived natural antibodies: biomarkers and potential therapeutics. Future Neurol. 10:25–39.
Yadgary, L., a Cahaner, O. Kedar, and Z. Uni. 2010. Yolk sac nutrient composition and fat uptake in late-term embryos in eggs from young and old broiler breeder hens. Poult. Sci. 89:2441–2452.
Yuan, F., and Z. Li. 2012. Induction of immunological tolerance in chickens inoculated with xenogeneic antigens at a late stage of embryonic development. Int. Immunol. 24:267–272.
Zhang, Y. G., S. Wu, Y. Xia, and J. Sun. 2014. Salmonella-infected crypt-derived intestinal organoid culture system for host–bacterial interactions. Physiol. Rep. 2:1–11.
Zubair, A. K., and S. Leeson. 1996. Compensatory growth in the broiler chicken: a review. Worlds. Poult. Sci. J. 52:189–201.

173

174

About the author
175
About the author
I, Maarten Sebastiaan Hollemans, was born at 28 December 1990 in Haarlem, the Netherlands. Since my childhood, I was interested in agriculture, and I decided to study Animal Husbandry at the “Christelijke Agrarische Hogeschool” (CAH) in Dronten. During my studies, I became a board member of the “Coöperatief Veredelings en Demonstratie Bedrijf ”, where I was responsible together with 2 other students for the daily caretaking of pigs and laying hens for one year. This made me become very enthusiastic about intensive livestock farming. After obtaining my BSc in 2012, I continued my studies with the Master of Animal Sciences at Wageningen UR. During my Master, I became intrigued by the combination of (intestinal) immunology and nutrition and finished my major theses in Adaptation Physiology and Animal Nutrition, and graduated in 2014. My major thesis in Adaptation Physiology was awarded with the thesis price of the “Nederlandse Zootechnische Vereniging” in 2015. From 2014 onwards, I am a member of the Innovation Team at Coppens Diervoeding (Helmond, the Netherlands). From 2015 until 2020, I was a part-time PhD candidate at the Adaptation Physiology and Animal Nutrition groups, of which the results are presented in this thesis. This was a collaboration between Wageningen UR and Coppens Diervoeding. I will continue to work as Innovation manager at Coppens Diervoeding. Ultimately, my goal is to contribute to the development and application of evidence based practice in broiler and pig husbandry, thereby improving animal health, welfare, and farm economics.

The research in this thesis was financially supported by Coppens Diervoeding, the Netherlands.
Coppens Diervoeding and Wageningen UR are acknowledged for financial support for printing this thesis.
Layout and cover by: Bregje Jaspers | ProefschriftOntwerp.nlPrinted by: ProefschriftMaken | www.proefschriftmaken.nl


SH
OR
T AN
D LO
NG
TERM
EFFECTS
OF EA
RLY
NU
TRITIO
N IN
BR
OILER
CH
ICK
ENS
MA
AR
TEN S
. HO
LLEMA
NS
SHORT AND LONG TERM EFFECTS OF EARLY NUTRITION IN BROILER CHICKENS
MAARTEN S. HOLLEMANS