Embed Size (px)
Citation preview
SHEAR STRENGTH OF LIGHTLY
REINFORCED CONCRETE BEAMS
by
Michael N. Palaskas
David Darwin
A Report on a Research Project Sponsored by
ARMCO INC.
University of Kansas
Lawrence, Kansas
September 1980

iii
ACKNOWLEDGEMENTS
This report is based on a thesis submitted by Michael N. Palaskas
in partial fulfillment of the requirements for the Ph.D. degree. The
support of ~lr. Palaskas' graduate study by University of Kansas
General Research allocation #3215-X038 and the Department of Civil
Engineering is gratefully acknowledged.
ARMCO INC. donated the reinforcing steel and funded the repro
duction of this report.
iv
Copies of the original load-displacement and load-strain data
may be obtained for the price of reproduction from the second author
by requesting "Data File SM3."

CHAPTER
l
2
3
4
5
v
TABLE OF CONTENTS
INTRODUCTION 1.1 General l .2 Previous Work 1.3 Object and Scope
EXPERH1ENTAL WORK 2.1 General 2.2 Test Specimens 2.3 Material Properties and Sizes 2.4 Specimen Preparation 2.5 Test Equipment 2.6 Test Procedure 2.7 Results and Observations
EVALUATION OF EXPERI~1ENTAL RESULTS 3.1 General 3.2 Evaluation of Results 3.3 Comparison with Design Equations 3.4 Design Implications and Recommendations
ULTH1ATE STRENGTH t10DEL FOR BEAMS WITH STIRRUPS 4.1 General 4.2 Analytical Model 4.3 Concrete Capacity 4.4 Capacity of Shear Reinforcement 4.5 Effectiveness of Shear Reinforcement 4.6 Comparison of Predicted and Experimental
Shear Capacities 4.7 Critique of the Model
SUI~I~ARY AND CONCLUSIONS 5.1 Summary 5.2 Conclusions 5.3 Recommendations for Further Study
REFERENCES
A B
i~OMENCLATURE STRAlN GAGE INFORMATION
Page
l 1 1
12
13 13 13 14 15 17 18 19
22 22 22 26 28
30 30 30 34 46 48
49 50
53 53 53 55
56
193 197
TABLE
2.1
2.2
2.3
3. 1
3.2
3.3
4. 1
4.2
4.3
B. 1
vi
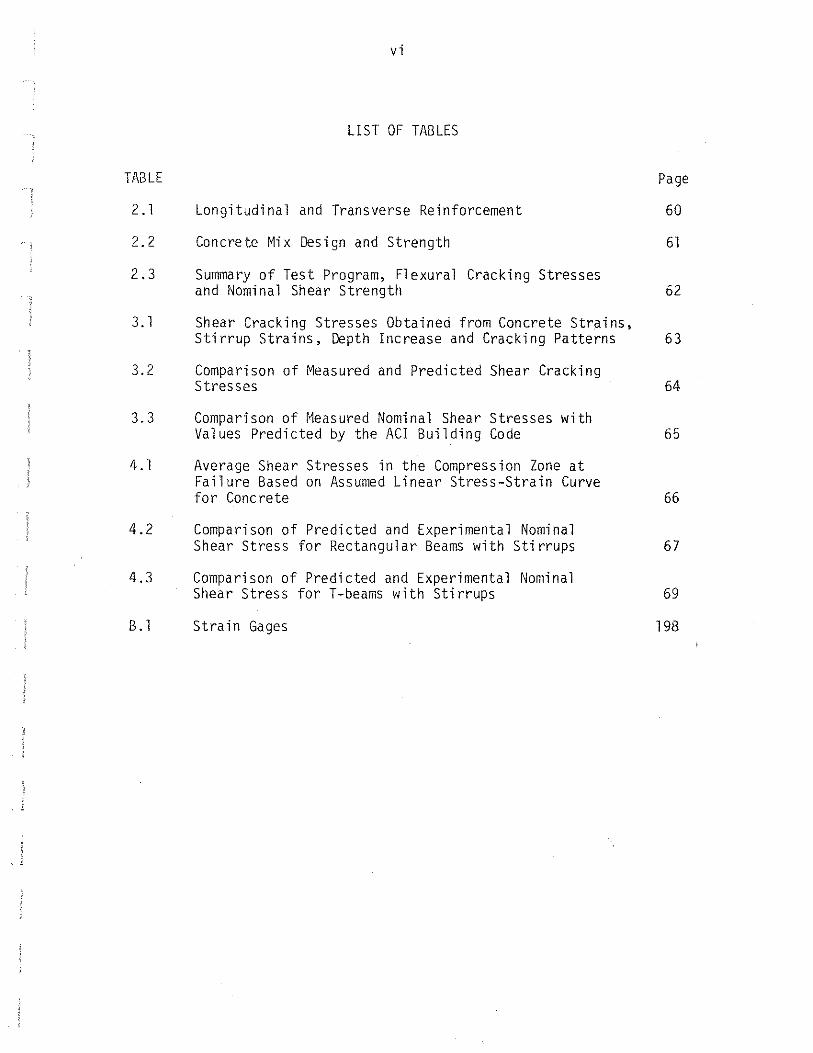
LIST OF TABLES
Longitudinal and Transverse Reinforcement
Concrete Mix Design and Strength
Summary of Test Program, Flexural Cracking Stresses and Nominal Shear Strength
Shear Cracking Stresses Obtai ned from Concrete Strains, Stirrup Strains, Depth Increase and Cracking Patterns
Comparison of Measured and Predicted Shear Cracking Stresses
Comparison of r,1easured Nomina 1 Shear Stresses with Values Predicted by the ACI Building Code
Average Shear Stresses in the Compression Zone at Failure Based on Assumed Linear Stress-Strain Curve for Concrete
Comparison of Predicted and Experimental Nominal Shear Stress for Rectangular Beams with Stirrups
Comparison of Predicted and Experimental Nominal Shear Stress for T -beams with Stirrups
Strain Gages
Page
60
61
62
63
64
65
66
67
69
198

Figure
l.l
l . 2
1.3
1.4
2. l
2.2
2.3
2.4
2.5
2.6
2.7
2.8
2.9 2. 13
2.14 2.28
<:.29 2.76
2. 77 2.84
to
to
to
to
vii
Ll ST OF FIGURES
Distribution of Internal Shears on Beams with Stirrups (3)
Shear Compression Model
Internal Arches in a Reinforced Concrete Beam (22)
Diagonal Compression Field Model (16)
Beam Details
Typical Stress-Strain Curve for Concrete
Load-Strain Curve, 7/16 inch Diameter Strand
Load-Strain Curve, 1/2 inch Diameter Strand
Load-Strain Curve, 0.6 inch Diameter Strand
Stress-Strain Curves for Smooth Wire
Strain Gage Locations
Loading System
Crack Patterns
Load-Deflection Curves
Load-Strain Curves
Load-Depth Increase Curves
3.1 Method of Determining Shear Cracking Load from Stirrup Strain and Depth Increase Data (6)
3.2(a) Stress at Diagonal Tension Cracking, vc, from Crack Patterns (6)
3.2(b) Stress at Diagonal Tension Cracking, vc' from Concrete Strain (6)
Page
7l
7l
72
72
73
74
75
76
77
78
79
8D
81-85
86-100
101-148
149-159
160
161
162

vii i
3.2(c) Stress at Diagonal Tension Cracking, vc, from Stirrup Strain (6) 163
3.2(d) Stress at Diagonal Tension Cracking, vc, from Depth Increase (6) 164
3.3(a) Stress at Diagonal Tension Cracking, vc, from Crack Patterns (6) 165
3.3(b) Stress at Diagonal Tension Cracking, vc, from Concrete Strain (6) 166
3.3(c) Stress at Diagonal Tension Cracking, vc, from Stirrup Strain (6) 167
3.3(d) Stress at Diagonal Tension Cracking, vc, from Depth Increase ( 6) 168
3.4(a) Effectiveness of Web Reinforcement, vn-vc, from Crack Patterns ( 6) 169
3.4(b) Effectiveness of Web Reinforcement, vn-vc, from Concrete Strain (6) 170
3.4(c) Effectiveness of Web Reinforcement, vn-vc, from Stirrup Strain (6) 171
3.4(d) Effectiveness of Web Reinforcement, vn-vc, from Depth Increase ( 6) 172
3.5 Comparison of ACI and Experimental Nominal (Ultimate) Shear Stresses 173
4. 1 Truss f~ode 1 174
4.2 Configuration of ~1odel 175
4.3 Forces and Strains in the Compression Zone 176
4.4 Compression Zone Shear Stress Profiles 177
4.5 Analytical Biaxial Strength Envelope 178
4.6 Biaxial o-1 Stress Failure Criterion 179
4.7 Shear Force Distribution Factor versus Shear-Span to Depth Ratios and Percentage of Longitudinal Reinforcement 180

4.8
4.9
4.10
4.11
4.12
4.13
4.14
ix
Softening Factor versus Concrete Strength, ShearSpan to Depth Ratio, and Percentage of Longitudinal Reinforcement 181
Neutral Axis Depth, k, versus Concrete Strength, Shear-Span to Depth Ratio, and Percentage of Longitudinal Reinforcement 182
Nominal Concrete Compression Zone Shear Strength, vc , versus Concrete Strength, Shear-Span to Depth Ratio, and Percentage of Longitudinal Reinforcement 183
Concrete Capacity, v , versus Concrete Strength, Shear-Span to Depth ~atio, and Percentage of Longitudinal Reinforcement 184
Compression of Predicted Equations for Shear Capacity 185
Comparison of Predicted with Experimental Shear Strengths for Rectangular Beams without Stirrups Used to Develop the Proposed Model 186
Nominal Shear Stress versus Amount of Shear Reinforcing 187
4.15 Effectiveness Factor of Shear Reinforcement, r, versus Concrete Strength, Shear-Span to Depth Ratio, and
4.16
4. 17
4.18
4. 19
Amounts of Flexural and Shear Reinforcement 188
Effect of Shear-Span to Depth Ratio on Shear Capacity
Effect of Percentage of Longitudinal Reinforcement on Shear Capacity
Comparison of Predicted and Experimental Nominal Shear Stress for Rectangular Beams with Stirrups
Comparison of Predicted and Experimental Nominal Shear Stress for T-Beams with Stirrups
189
190
191
192
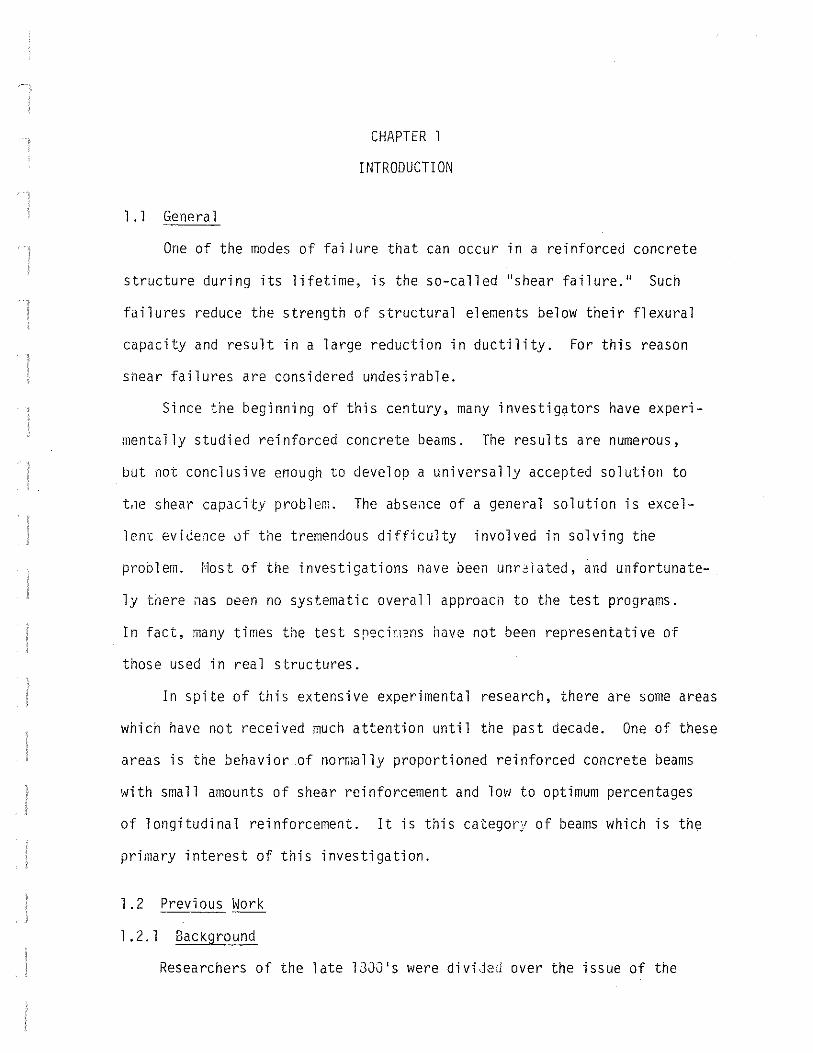
1 . 1 Genera 1
CHAPTER 1
INTRODUCTION
One of the modes of failure that can occur in a reinforced concrete
structure during its lifetime, is the so-called "shear failure." Such
failures reduce the strength of structural elements below their flexural
capacity and result in a large reduction in ductility. For this reason
snear failures are considered undesirable.
Since the beginning of this century, many investigators have experi
mentally studied reinforced concrete beams. The results are numerous,
but not conclusive enough to develop a universally accepted solutio11 to
t~e shear capacity problem. The abse~ce of a general solution is excel
lcn-c evi<ience uf the tremendous difficulty involved in solving the
problem. Most of the investigations nave been unr2lated, and unfortunate
ly tnere nas oeen no systematic overall approacn to the test programs.
In fact, many times the test srecin::ns have not been representative of
those used in real structures.
In spite of this extensive experimental research, there are some areas
which have not received much attention until the past decade. One of these
areas is the behavior of nomally proportioned reinforced concrete beams
with small amounts of shear reinforcement and low to optimum percentages
of longitudinal reinforcement. It is this category of beams which is the
primary interest of this investigation.
l .2 Previous Work
1. 2. 1 Background
Researchers of the late lJJJ's were divi.ied over the issue of the
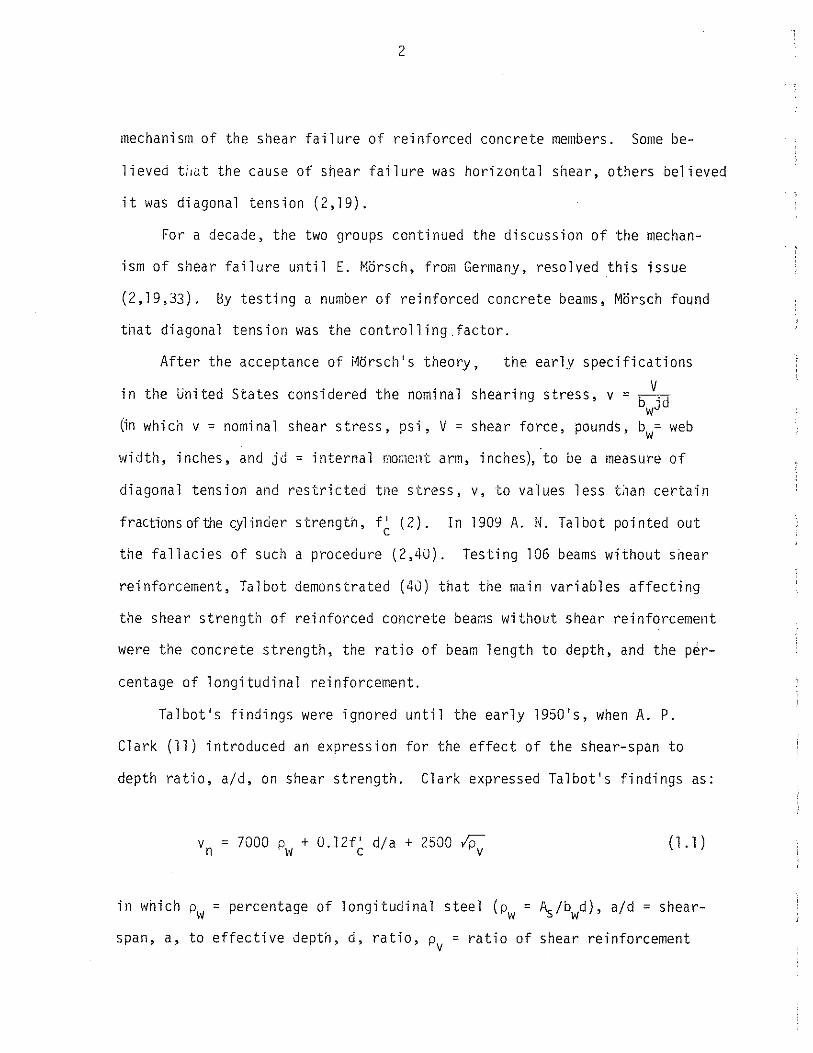
2
mechanism of the shear failure of reinforced concrete members. Some be-
lieved t:,dt the cause of shear failure was horizontal shear, others believed
it was diagonal tension (2, 19).
For a decade, the two groups continued the discussion of the mechan-
ism of shear failure until E. MHrsch, from Germany, resolved this issue
(2, 19,33). 8y testing a number of reinforced concrete beams, Morsch found
that diagonal tension was the controlling.factor.
After the acceptance of Horsch's theory, the early specifications
in the United States considered the nominal shearing stress, v =
0n which v =nominal shear stress, psi, V =shear force, pounds,
width, inches, and jJ = internal r:lO!ile:lt arm, inches), to be a measure of
diagonal tension and restricted tne stress, v, to values less t~an certain
fractions of the cylinder strength, f~ (2). In l90Y A. N. Talbot pointed out
the fallacies of such a procedure (2,40). Testing 106 beams without shear
reinforcement, Talbot demonstrated (40) that the main variables affecting
the shear strength of reinforced concrete bear,ls without shear reinforcement
were the concrete strength, the ratio of beam length to depth, and the per-
centage of longitudinal reinforcement.
Talbot's findings were ignored until the early 1950's, when A. P.
Clark (ll) introduced an expression for the effect of the shear-span to
depth ratio, a/d, on shear strength. Clark expressed Talbot's findings as:
vn = 7000 p + O.l2f' d/a + 2500 ;p-lv c v (l.l)
in \vhich pw = percentage of longitudinal steel (pw = As/bwd), a/d =shear
span, a, to effective depth, d, ratio, pv = ratio of shear reinforcement

( •Jv =
ment,
3
~ 2 bS), Av =area of a stirrup, in , As= area of longitudinal reinforce-w2
in , and S = stirrup spacing along the axis of the beam, inches.
The a/d ratio provided a way to account for the effect of horizontal
flexural tension on shear strength. Unfortunately, the shear-span could not
be defined for generalized cases of loading. This handicap was overcome
in the early 1950's when researchers at the University of Illinois expressed
the shear-span to depth ratio in the modified form of 1'1/Vd, involving bend
ing moment, ~1, shear force, V, and effective depth, d (2,3). For the case
of simple beams with concentrated loads, it is obvious that the term 11/Vd
is synoli;mous with the a/d ratio.
From the early 1950's to tile present, researchers have made numerous
shear tests and found that some other variables influence ti1e snear strengtn
of concrete iJeams (2,3). Among tile variables are the type of loading and
the type of cross section. The ACI-ASCE Committee on Snear and Diagonal
Tension chose to express the shear capacity of reinforced concrete ~eams
without stirrups as a function of the square root of the cylinder strengtn,
the shear-span to depth ratio, and the percentage of l ongitudi na·l reinforce
ment (3,5). For beams with web reinforcement, the committee concluded that
both the web reinforcement and the concrete contribute to the shear capac-
i ty of a member. They found that tne nominal shear stress in tne concrete
at diagonal tension cracking correlated well the concrete contribution at
ti1e failure loacl. Tne following equation was selected to express the
ultimat2 capacity of reinforced concrete beams in shear.
v n = v c + rpv f vy ( 1 . 2)

4
in which
vn = nominal (ultimate) strength, psi, r = (sina + cosa),
a = inclination of web reinforcement to longitudinal axis,
=yield point of web reinforcement, psi, and
= si1ear stress carried by the concrete equal to shear at
diagonal tension cracking, psi.
In the united States design practice, two expressions are given for
the shear stress at diagonal tension cracking (5):
p v d vc = l .9/fc' + 2500 ~
t~u
or, more conservatively,
in which
v = z,ff' c c
Vu = factored shear at the section, and
Mu = factored moment at the section.
( l . 3)
( l . 4)
The expression r pvfvy was derived using the truss analogy for beams
at failure, assuming that the web reinforcement yields and that diagonal
cracks have a horizontal projection equal to the effective depth of the
beam.
To insure ductility, the committee set a minimum value of shear t·ein-
forcement, p f , equal to 50 psi. v vy
The key shortcoming of ti1is procedure is that it does not accurately
represent the effects of the various parameters on shear strength and thus
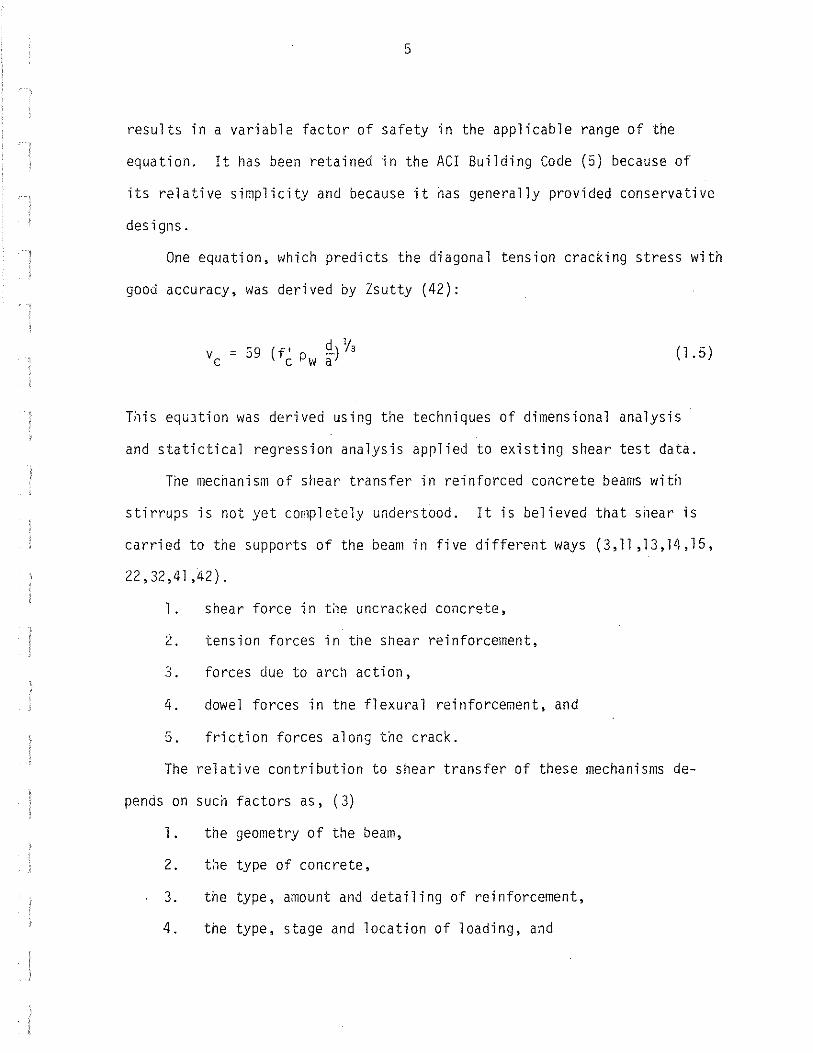
5
results in a variable factor of safety in the applicable range of the
equation. It has been retained in the ACI Building Code (5) because of
its relative simplicity and because it i1as generally provided conservative
designs.
One equation, which predicts the diagonal tension cracking stress with
good accuracy, \vas derived by Zsutty ( 42):
vc = 59 ( f' !!..) ';, c Pw a ( l . 5)
This equJtion was derived using the techniques of dimensional analysis
and statictical regression analysis aprlied to existing shear test data.
The meci1anism of shear transfer in reinforced concrete beams with
stirrups is not yet completely understood. It is believed that snear is
carried to the supports of the beam in five different \>lays (3,11 ,13,14,15,
22,32,41,42).
l. shear force in t;1e uncracked concrete,
2. tension forces in the s11ea r rei nforcernent,
3. forces due to arch action,
4. dowel forces in tne flexural reinforcement, and
5. friction forces along the crack.
The relative contribution to shear transfer of these mechanisms de-
pends on such factors as, (3)
l. the geometry of the beam,
2. the type of concrete,
3. the type, amount and detailing of reinforcement,
4. the type, stage and location of loading, and

6
5. the type of supports.
Fig. l.l illustrates qualitatively the relative contributions of the
various mechanisms to shear resistance as a function of load.
l. 2. 2 Ra tiona l Approaches
i~any researchers have attempted to develop rational solutions to the
shear capacity problem (7 ,8,9, 12,16,20,21 ,22,23,27 ,30,31 ,33,34,37 ,33,39,
43). For beams with stirrups, the major concern of this study, most of
the theories can be classified under a few categories.
Modified Truss Analogy
This theory is attributed to Ritter and Horsch (2,19,33,38). They
assume that beams resemble a truss after shear cracking. The top a;1u bot
tom chords of the truss are the concrete compression zone and longitudinal
reinforcement, respectively. The diagonal and vertical struts consist of
the beam web and shear reinforcement. The assumption that all shear is
carried by the shear reinforcement does not agree well with test data.
Norti1 Ar.1erican design methods, as represented by Eqs. (1.2)-(1.4),
recognize the contribution of the concrete (5). It is assumed that part
of the applied shear is carried by the concrete, and the rest is carried
by the shear reinforcement. The concrete contribution has been determined
experimentally and thus has an empirical, rather than a rational basis.
Failure is assumed to take place after yielding of the shear reinforcement
and along a plane oriented at about 45° to the axis of the beam.
The main weaknesses of this method are its inability to accurately
express the effects of the percentage of the longitudinal reinforcement
and shear-span to depth ratio on the shear capacity of reinforced concrete
beams, and the assumption of a constant horizontal crack projection

7
equal to the effective depth of the beam. For these reasons, the margin
of safety provided by this expression is variable.
Plane of Minimum Resistance
The developer of this theory, r1.S. Borishansky (7), rationalized
tnat failure can occur along any inclined plane of the beam, 1if the total
shear resistance along that plane is a minimum. It is assumed that after
shear cracking, shear is carried by both the stirrups and the concrete.
At failure all stirrups along the crack yield. The concrete capacity is
not constant, but is a function of the beam depth to crack projection ratio.
The capacity versus crack projection relation for the concrete was obtained
experinentally.
( l . 6)
in which,
b = web widtil, em, w d = effective depth, em,
Rb = design cube strength, kgf/cm2, and
z = horizontal crack projection, em.
The stirrup capacity is, also, a function of the crack projection and is
expressed as:
in which,
Av V
5=-f z . s vy
fvy = yield stress of shear reinforcement, kgf/cm 2 ,
( l. 7)
8
Av =area of the vertical stirrups, cm2, and
s = spacing of stirrups along the axis of beam, em.
For the case of a beam loaded witn concentrated loads, the ultimate shear
capacity is:
( l . 8)
The size of the crack, z, for \vhich the expression of the ultimate shear,
Vn' is a minimum can be found after differentiation of Eq. (1.8) with
respect io crack projection, z. Using this mathematical technique,
Borishansky, obtained the following equation:
( l. 9)
The introduction of the variable crack inclination in this method is
compatible with the test results reported by a number of investigators
(17,22,24,35,37). In contrast, the concrete capacity term is entirely
empirical and i~oependent of the percentage of longitudinal reinforcement,
Pw· This is a weakness in the theory, since pw has been proven experiment
ally to have an appreciable effect on the shear capacity of reinforced
concrete beams ( ll).
Shear-Compression Theory
The development of this t:1eory is credited to many different investi-
gators (27,30,37,43). One of the most complete approaches is the one
developed by Regan (37). In his approach, Regan states that failure is
caused by the normal stresses in the cor.1pression zone of the beam. He

9
obtained these stresses using equilibrium equations and an approximate
compatibility equation. The compatibility equation relates the total de
formations of the concrete and the tension steel, betv1een two planes at
the ends of the shear crack, with an average neutral axis depth, as shown
in Fig. 1.2. The final equation of ultimate shear capacity is too com
plex to be practical for design. This is recognized and Regan recommends
a graphical or another sir.1plified approach.
The main handicap of the shear-compression failure theories is that
they always predict failures caused by crushing of the concrete. Many
rectangular beams, and most T-beams, fail in a mode different than compres
sion. These types of failures have been defined as "shearing" failures
( 35). However, for reinforced concrete oeams that fail in tne shear
compression mode, this theory satisfactorily predicts the ultimate shear
capacity.
Arch Theory
In ti1e "remaining arcn" theory (20,21 ,22,23), it is assur;Jed that
cracks generate and propagate perpendicular to the principal tensile stress
trajectories and parallel to the principal compressive trajectories in a
beam, as shown in Fig. l.3a. After cracking, the beam is transformed into
a number of tied arches, and the applied shear is carried to the beam
support by arch action. Only the outside arch is supported directly by
the beam supports. The remaining arches are hanging arches. Kani (20,21,
22,23) states that the cause of premature shear failure is not the shear
force, but the compression arch forces. Failure is caused by the reduction
of the compression arch capacity due to the loss of the supports of the
internal hanging arches, as shown in Figs. 1.3 b,c,d. The primary

10
function of stirrups is to act as the hanging supports of the internal,
arches, thus retaining the flexural capacity of the beam. The arch theory
provides quantitative results for beams without stirrups. However, it
is a qualitative theory for beams with stirrups, and remains impractical
for design.
Diagonal Compression Field Theory
Diagonal compression field theory (8,12,16,34) uses a truss model
with a variable inclination of the concrete diagonals, as shown in Fig.
1.4. The truss model is approximated with compression and tension chords
consisting of the concrete compression zone and the longitudinal rein- 1 !
forcement, respectively. The stirrups represent the posts of the truss,!
and the continuous diagonal compression field represents the diagonals.
One mode of failure is due to crushing of the concrete in the
continuous diagonal compression field, while the shear reinforcement
yields, or is still elastic. The other mode of failure is due to yielding
of the shear or flexural reinforcement, or both, while the concrete in
the continuous diagonal compression field is still intact. In all cases,
it is assumed that the top chord of the truss (the compression zone of the
beam) has adequate strength to carry the applied loads. This strength is
determined from the equations of pure bending.
This represents a weakness in the diagonal compression field theory,
since it nas been found that combined flexural and shear stresses nave
an appreciable effect on the capacity of concrete. In addition, it has
been observed that in regions of high bending and shear stresses, cracks
propagate higher in the compression zone of the beam than they do in
regions subject to pure flexure. For these reasons, the capacity of the

ll
compression zone in reinforced concrete beams is significantly reduced
when shear forces are present. A rational theory should incorporate this
strengtn reduction.
1.2.3 Experimental Hark Ihat Ir.1pacts on This Study
In 1963 Rajagopalan and Ferguson (36) showed, after testing ten
rectangular beams witnout stirrups and with low percentages of longitudi-
nal reinforcement, that the present code provisions (Eqs. (1.3) and (1.4)
are unconservative for low percentages of longitudinal reinforcement.
They found that the expression
v = (0.8 + lOOp ) If' c w c ( l . 9)
conservatively represents the shear s tre;1gtn of reinforced concrete beams
without stirrups and witi1 a reinforcing ratio, pw, less than 1.2 percent.
In the recent ''Suggested Revisions to Shear Provisions of ACI Code, 3ld-
-71" (4) by ACI-ASCE cor.1mittee 426, a similar expression
(1.10)
\vas recommended.
According to the findings of Bresler and Scordelis (10) in 1963 and
Haddadin, Hong, and r1attock (17) in 1971, the effect of the first shear
reinforcement on the shear strength of beams is about 75 percent higner
than the strength calculated using the ACI Code provisions (5). Beams in
these two studies had flexural reinforcing ratios, pw' in excess of 1.3
percent.

12
In spite of the extensive use of concrete beams with small amounts
of shear and longitudinal reinforcement, no experimental work has been
performed to determine the shear strength of these beams. Tests on beams
of this type are needed and will yield valuable information about the be-
havior· and shear capacity of these commonly used reinforced concrete mem-
bers.
1. 3 Object and Scope
The objectives of this study are to experimentally investigate the
behavior of reinforced concrete beams with 1 0\~ amounts of both fl exura 1
and shear reinforcement and to develop a useful representation of the
shear strength of reinforced concrete beams.
The tests consist of fifteen sir,J'Jly supported T-beams loaded to
failure. The r.1ajor variables in the study are the flexural reinforcing
ratio, p11
, and amount of shear reinforcement,pvfvy The test results are
analyzed and compared with the provisions of the ACI Building Code (5).
A failure model is developed that incorporates the observed shear
behavior of reinforced concrete beams and helps explain how shear strength
is effected by flexural reinforcing ratio, concrete strength, shear-span
to depth ratio, and shear reinforcement.

2.1 General
13
CHAPTER 2
EXPERIMENTAL WORK
The main purpose of this work is to determine the ultimate shear
capacity of slender reinforced concrete beams with small amounts of shear
and longitudinal reinforcement. This can be achieved only with a clear shear
mode failure of the selected specimens. Therefore, care was taken in the de
sign of the specimens to eliminate all other possible modes of failure. A
description of the materials and the procedures used during this experimental
work is pres en ted.
2.2 Test Specimens
The test specimens (Fig. 2. l) consisted of fifteen concrete T-beams,
eleven with stirrups and four without. The geometry of these specimens was
selected to closely resemble members in actual structures. In this manner,
the size effect was eliminated. All beams had the same cross section: web
width = 7~ inches; total depth = 18 inches; flange width = 24 inches; and
flange thickness = 4 inches. The span of the beams was 13'-2", and the length
was 20'-0". The 3'-5" overhangs at the ends of the beams increased the embed
ment and prevented slippage of the reinforcing steel. Non-prestressed, pre
stressing strands were selected for the longitudinal reinforcement to prevent
flexural failures in the test specimens. The use of the high strength steel
also allowed high strains to be obtained in the flexural steel, as would
occur in continuous reinforced concrete beams undergoing moment redistribu
tion following the formation of one or more plastic hinges.
The beams were divided in three series, as a function of the quantity of
the longitudinal reinforcement. Five strands were used for each beam to

14
eliminate the effect of the arrangement of the longitudinal reinforcement on
the shear capacity of the beams. The smooth wire stirrups were spaced at a
distance of about half the effective depth of the beam. The amount of longi
tudinal steel was controlled using different diameter strands, l/2 inch, 7/16
inch and 0.6 inch for series A, B, and C, respectively. The amount of shear
reinforcement, pvfvy' varied from 0 to about 110 psi, using different sizes of
smooth wire (0.132, 0.186, 0.229 or 0.244 inches in diameter). The flange rein-
forcement in all beams consisted of two #4 longitudinal bars and #3 transverse
bars, spaced as shown in Fig. 2. l. Information on the shear and longitudinal
reinforcing steels is summarized in Table 2.1.
2.3 Material Properties and Sizes
2. 3. l Concrete
Concrete was supplied by a local ready mix plant. The concrete was air
entrained. Type I cement was used. The nominal size of coarse aggregate
was 3/4 inch (locally described as "l/2 inch aggregate").
t~i x proportions, compressive strengths and moduli of rupture are pre
sented in Table 2.2. A typical stress-strain curve is shown in Fig. 2.2.
2.3.2 Steel
Three different types of reinforcement were used in the test specimens:
prestressing strands, deformed bars and smooth wire.
The flexural steel in all beams was non-prestressed, ASTM A416, Grade
270 Seven-Wire Stress-Relieved Strand. Typical force-strain diagrams for
these strands are shown in Figs. 2.3, 2.4 and 2.5.
The flange reinforcement was ASTM A615, Grade 60 deformed billet steel bars.
The stirrups were low carbon smooth wires with a diameter of 0. 132,
0. 186, 0.229 or 0.244 inches. All wires were annealed in order to obtain

15
a yield stress close to the design yield stress obtained v1ith deformed
reinforcing bars. The wires were supplied in coils because of the manu
facturing process. The wire was straightened with a roller. During
rolling, residual stresses were introduced. For tnis reason, the stress
strain curve of these wires was not linear up to t;le yield point. To
obtain a well defined yield point on the stress-strain diagram, all wires
were loaded to t~e yield stress (preyielded). In this manner, a well
defined yield plateau was obtained, as shown in Fig. 2.6. Due to work
i1ardening during preyielding, strain aging occurred in tile wires. To
obtain t:1e actual yield and ultimate loads of the wires on the day of
tile test, two wire specimens 11ere tested after the failure of each beam.
Tne preyielding loads, as well as the yield and ultimate loads on the day
of testing, are presented in Table 2.1.
2.4 Specimen Preparation
The beams were prepared in four stages: (l) fabrication of tile rein
forcing cage, (2) installation of gages on the reinforcing steel, (3)
casting and curing of the concrete, and (4) preparation for the test.
As soon as the stress relieved strand was received, it was flame cut
into the desired lengths and stored outside of the laboratory, exposed to
the weather. This treatment provided the strands with a uniform coat of
rust which improved the bond and prevented slippage of the strands during
the tests.
After preyielding, the stirrups were cut to length, bent to snape
using a one inc11 diameter pin, and welded to form a closed loop. The only
possible failure mode of tile stirrups was by yielding of the stirrups
themselves, since slippage of the anchorage was prevented. The strands,
16
reinforcing bars, and smooth wire stirrups were assembled to form a cage
using commercially available wire ties.
Following the fabrication of the reinforcing steel, strain gages
were installed on the stirrups and strands, as shown in Fig. 2.7. Infor
mation on the gage types and tile installation procedures is presented in
Appendix B.
Prior to casting tile concrete, the plywood form was oiled and sealed,
anu the reinforcing cage was secured in the form using commercially avail
able steel chairs and form ties. The concrete was placed in two layers
(web and flange) with the aid of a cubic yard concrete bucket and an
internal vibrator. Ten cylinders anci two flexure specimens were made for
each test. Tile forms \'/ere removed after three days (except for beams COO
and C50-one day) and covered with a polyethylene sheet. The oeam and the
control specimens were wet cured together until the compressive strengtn
was at least 3000 psi.
Wilen the concrete compressive strengtil reaciled 3000 psi, the oeam was
lifted to the test supports with a 3 ton capacity crane. For alignment of
the beam and uniform Dearing stresses at the supports, a quick set gypsum
cement grout, Hydrostone, was used. Hydrostone, also, was used to align
and secure the loading beam bearing plates on top of the beam. Next, a
coat of white wasn, made of Hydros tone, was app 1 i ed to one side of the
beam. After drying, the location of neutral axis and the locations of the
shear and tensile steel were marked. For comparison, stirrup ''locations''
were also marked on beams without shear reinforcement. The marking was
fo 11 owed oy the ins ta 11 a ti on of the paper gages on the top of the beam, as
shown in Fig. 2.7. Finally, the loading system (loading beams, load rods

17
and hydraulic jacks) were installed.
2.5 _Test Equipment
The load was applied to the beam with the aid of a Satec pumping
console assembly (an electrically powered, 3000 psi capacity hydraulic
loading system) and four 60-ton Enerpac hydraulic jacks. The jacks, lo
cated below the structural test floor, pulled on four one-inch diameter
steel rods attached to two wide flange beams attached to the test specimens
(Fig. 2.8). The one-inch steel rods served as load cells. Two l/4-inch
strain gages were installed on each rod, and then the rods were calibrated
within one percent of the total load. In this manner, monitoring of the
applied loads was possible with the aid of a strain indicator.
The beam supports were one 6 inch roller and one bolster (Fig. 2.8).
To reduce the friction in the bolster, 1/32 inch teflon sheets were in
serted between the bearing surfaces of the bolster.
A Yishay Model 220 Data Logging System was used to read the specimen
strain gages and one hand operated Budd Instrument P-350 strain indicator was
used to obtain the strains in the four loading rods. This combination of
strain recorders was used for all beams, except COO and C75. For these beams,
hand operated Budd Instrument P-350 strain indicators were used for all gages.
Three 0.001 inch scale dial gages and one LYDT were used to monitor
the deflections.
Four techniques were used to determine the shear cracking loads.
These techniques used data obtained from the cracking patterns, the stirrup
strain gages, the concrete strain gages, and four 0.0001 inch scale dial
gages installed on specially constructed ''shear cracking frames''(6) to

18
measure the increase in beam depth.
2.6 Test Procedure
One dial gage and tile LVDT were placed at the center of tne span.
Two other dial gages were placed at the load points, shown in Fig. 2.8.
The four shear cracking frames were secured at the locations of the third
and fourth stirrups from the center line of the span, on both sides of the
beam. Ti1e dial gages were adjusted and the strain gages and the LVDT were
connected and balanced.
To check the equipment, all beams were loaded to about one-third of
the calculated flexural cracking load and unloaded. The readings of all
strain and dial gages were tnen recorded for zero load. The load was then
applied incrementally until the beam failed. D1e size of the load incre
ments was reduced around the calculated flexural cracking, shear cracking
and failure loads. The smallest increments in total load were about 1250
pounds and the largest were about SOOO pounds. At each increment, all
strain and dial gage readings were recorded, \'nile the applied load was
Kept constant. Following the readings, the beam was inspected, and all
cracks were marked. The value of the total applied load was inscribed
at the end of each crack. In this way, a complete crack propagation
history was available from photographs taken during and after the test.
In addition, a time log of all actions and observations was kept.
Cracks were marked until very little additional cracking was observed.
After failure, all additional cracks were marked, and detailed photographs
were taken. The beam tests were followed by tests of the remaining con
crete cylinders, flexure specimens and stirrup tension specimens.

19
The average time for a test, from initial loading to failure, was
about one hour and forty-five minutes.
2.7 Results and Observations
Geometric and material information (dimensions, concrete strength,
shear-span to depth ratio, percentage of longitudinal reinforcement, and
amount of shear reinforcement), the flexural cracking stress and the ulti-
mate shear capacity, V t t' are presented for each beam in Table 2.3. n es. Using the photographs which were taken during and after the tests,
tne complete crack pattern for each beam has been reproduced, except for
beams #l and #2*, in Figs. 2.9-2.13. The heavy crack line represents the
failure crack. Tne numbers represent tile total load, to tne nearest kip,
at whici1 the crack formed.
The deflection dial gage readings are plotted versus the applied
load in Figs. 2.14-2.2il. The recorded readings of the steel and concrete
strain gages are plotted versus the total applied load in Figs. 2.29-2.76.
Ti1e shear frame dial gage readings are plotted versus the applied load in
Figs. 2.77-2.87.
A description of the behavior of a typical beam from the beginning
of a test to the time of failure follows:
In the first stages of loading, the beams were free of cracks. Since
the stresses were very small and the full section participated in carrying
the load, the deflection was small and proportional to the applied load.
At a load close to the calculated flexural cracking load (obtained using
the ACI (5) modulus of rupture), the first cracks were observed and a
* Beams #1 and #2 served as preliminary tests, and complete crack patterns were not ootained.

20
considerable increase in deflection occurred. These cracks always
initiated in the region of pure flexure and extended vertically up to
the neutral axis of the uncracked section of the beam. With increasing
load, more flexural cracks developed in both the center and the shear
span regions of the beam. Cracks in the two regions propagated different
ly. Cracks in the pure moment section were always vertical, wnile craci<s
in the shear span curved toward the point of the applied load, as soon as
they entered the area between the level of the tension reinforcement anu
the neutral axis.
The trend of cracking was almost the same in all beams, except that
the number and the size of the cracks seemed to depend on the amount of
the flexural reinforcement. Compared to tile otr1er series, the beams in
Series B (pw = 0.5 percent) exhibited fewer and wider cracks. In contrast,
the other series (pw = 0.66 and 0.94 percent) exhibited a greater number
of cracks of smaller width. Tne cracks in the Series C beams (pw = 0.94
percent) were so narrow that additional lig~t was required in order to
locate t:1em.
This trend of flexural cracking continued until "shear cracking"
began. Shear cracking was accompanied by an increase in stirrup strain
and beam depth and a decrease in the compressive strain in the concrete
witnin the snear span. The shear cracks were extensions of the flexural
cracks and ini·tiated close to the midi1eight of the beam. They propa
gated at an ·inc·i ination flatter than 45° in t1v0 directions, toward the
flange and towarci the flexural reinforcement. When the bottom end of
the crack reacned the flexural reinforcement, it continued to propagate
with increasing load along the reinforcement for a distance at least equal

21
to one stirrup spacing. The other end of the crack propagated until it
reacned the bottom of the flange. From tilere on, two possible crack paths
were observed. For most beams, the crack extended horizontally along
the junction of the flange and the web. In a few cases, the crack re
mained fairly stable after it reached the bottom of the flange, until
failure occurred. For beams with the first type of crack path, the crack
entered the flange at failure or at a load stage prior to failure. In both
cases, failure occurred with a sudden extension of the crack toward the
point of loading. The only exception to this failure mode was beam C75.
In this beam, the failure crack in the flange was a horizontal crack ex
tending along t~e total length of the shear span of the beam.
In all cases, the mode of failure 11as a tensile failure of the flange
with no signs of crushing of the concrete. The location of the failure
shear crack, (i.e., tile horizontal projection of the crack within the shear
span) was erratic: sometimes closer to the support, sometimes closer to
the applied load, and at other times in the center of the shear span. For
the beams without stirrups, the failure crack was always the crack closest
to the support. In beams with stirrups, the failure crack was either the
crack closest to the support (beams A50a, 850), or an interior crack
(beams A25, A25a, ASO, C25, C75). In three beams with stirrups (beams
A75, B25, C50), failure occurred along a double inclined shear crack.
22
CHAPTER 3
EVALUATION OF EXPERIMENTAL RESULTS
3.1 General
It is of primary interest in this report to examine how the amount
of flexural steel, Pw' and web reinforcement, pvfvy' affect the behavior
of reinforced concrete beams, with special emphasis on shear cracking and
ultimate shear capacity.
A description of the findings and a comparison with the current pro
visions of the ACI Building Code (5) follow.
3.2 Evaluation of Results
3.2.1 Flexural Crac~ing
The parameter which has the greatest effect on the deflection of
these reinforced concrete beams, after flexural cracking, is the amount
of longitudinal reinforcement. For the same load, much more deflection
was recorded for the beams in Series i3 (pw aoout 0.5';) than for the beams
in Series C (pw about .94:;). This difference is apparent in Figs. 2.14-
2.28.
The flexural cracking loads were obtained using the load-deflection
curves (Figs. 2.14-2.28) and the load-strain curves for strain gages #1
and »2 (Figs. 2.29-2.70). These loads are in good agreement with the
flexural cracking loads calculated using the transformed cross section
and 7.5/t;;" for the modulus of rupture, fr, as recommended in the ACI
Building Code (5). The calculated stress at flexural cracking varied
between 6. 18/f' and 7. S7 /f'. c c

23
3.2.2 Shear Cracking
Four methods were used to determine the shear cracking load. These
approaches were based on the stirrup strains, the concrete strains, the
increase in beam depth following cracK formation, and the cracking patterns.
The four methods were used to provide detailed information on beam behavior
and to compare procedures for defining "shear cracking." The details of
this portion of the study are presented in Reference 6.
The shear cracking load is considered to be the load at which sig
nificant changes in the load carrying mechanisms occur, resulting in the
redistribution of stresses within the beam. Using this criterion, the
objective is to determine the load at which this change occurs. The
techniques for analyzing the data are summarized below:
The concrete strain data (Figs. 2.29-2.76) indicates that an appre
ciable change (reduction) in the compressive strain occurs in the extreme
compression fiber within the shear span at a load coinciding with the
formation of diagonal cracks. This load is defined as the shear cracking
load.
The shear cracking loads are obtained from stir~ strain and depth
increase data using Figs. 2.29-2.87. These load-strain and load-depth
increase curves show essentially no reading up to a load of 1.5 to 2 times
the flexural cracking load. However, in most of the beams, small readings were
recorded before the formation of the first shear cracks due to inclined
flexural cracks within the shear-span. To obtain the shear cracking load
from these figures, the portion of the graph which shows a marked increase
in strain or depth is extended back until it intersects the load axis,
as illustrated in Fig. 3.1. The point of intersection is defined as the
24
shear cracking load.
The shear cracking load obtained from the era~ patterns (Figs. 2.9-
2.13), is assumed to be the load at which a crack forms at the level of
the neutral axis (the centroid of the uncracked transformed cross section)
at an angle of 45° or less to the longitudinal axis of the beam.
The shear cracking stresses obtained using the four methods are pre
sented in Table 3.1. Results are not available for beams #1 and #2, since
these beams were not fully i~strumented.
To help reduce the effect of the variable concrete strength, the
results are normalized with respect to (f~) V2 and (f~) 'h in Figs. 3.2 and
3.3 (6). The results are, also, compared with the predictive equations,
Eqs (1.3) (1.5) and (1.9), presented by the ACI Building Code (5), Zsutty
(42) and Rajagopalan and Ferguson (36), respectively. Presented in this
form, the results obtained using the stirrup and concrete strains exhibit
much less scatter than the cracking loads obtained using the depth in-
crease and the cracking patterns. Both the stirrup and the concrete
strains appear to be more sensitive to the change in the load carrying
mecnanisms at shear cracking than do the other two procedures.
The shear cracking loads obtained using the concrete and stirrup
strains match each other quite well. The values obtained from the depth
increase data are equal to or greater than the values obtained from the
stirrup and concrete strains. The shear cracking loads obtained from the
crack patterns do not show a consistent relationship to the loads obtained
from the stirrup and concrete strains.
Overall, the comparison indicates that the loads obtained using the
concrete and stirrup strains provide a good indication of the true shear

25
cracking load of the beam, while the other two methods are not as accu-
rate.
3.2.3 Stirrup Effectiveness
According to tile ACI Building Code (5), the contribution of stirrups
to the ultimate shear capacity of reinforced concrete beams is expressed
as the product of a coefficient, r, and the amount of shear reinforcement,
P/vy (vs = r ~/vy). For beams with vertical stirrups, r is equal to
one. The contribution of concrete to the ultimate shear capacity is
assumed to be equal to the shear cracking stress of the beam, vc. In
this investigation, the shear cracking loads were measured for thirteen of
the T-beams tested, and therefore, ti1e stirrup contribution to shear
capacity is known for each of these beams.
The stirrup effectiveness factor is defined as the ratio of the
stirrup contribution from the tests (vn - vc) divided by the predicted
stirrup capacity according to the ACI Building Code (p/vy). The test
stirrup contributions are plotted versus the ACI code stirrup contribution,
p f , in Figs. 3.4a to 3.4d, for the different methods used to obtain v . v vy c
Using linear regression analysis, it was found (6) that the stirrup
contribution can be expressed reasonably well by the expression:
( 3. l )
in which
c = 2-8 psi .
In Figs. 3.4b and 3.4c, it is shown that the correlation coefficient in

26
this analysis is 0.96 and 0.97 for the cases in which the shear cracking
stress is determined from the concrete and stirrup strains, the two methods
which appear to be the most reliable methods for the determination of the
shear cracking loads.
The stirrup effectiveness factor (neglecting the small value of c) of
1.5 is smaller than the factors 1.30 and 1.75 which were reported by tlresler
and Scordelis (10) and Haddadin, Hong and t·1attock (17). The reason for
this difference probably lies in the different type and amount of longi
tudinal reinforcement that was used in this study. Only strands were used
in t11is ;nvestigation as longitudinal reinforcement, in amounts which
never exceeded one percent. Flexural reinforcement in excess of 1.8
percent were used by the other investigators. Both the lower percentage
of flexural reinforcing steel and the lower bond strength obtained with
the strands, as compared vlith the reinforcing bars, could have contributed
to the lower stirrup effectiveness exhibited in these tests.
3.3 Comparison with Design Equations
3.3.1 Shear Cracking Stress
The shear cracking stresses obtained using the concrete and stirrup
strains are compared with loads predicted by Eqs. (1.3) and (1.4) from
the ACI Building Code (5), Eq. (1.5) proposed by Zsutty (42) and Eq.
(1.9) recommended by Rajagopalan and Ferguson (36), in Table 3.2 and Figs.
3.2b, c and 3.3b, c. The ACI equations provide an unconservative estimate
of the shear cracking load for the T-beams tested in this study. Much
better predictions are obtained using Eq. (1.5) by Zsutty (42) and Eq.
(1 .9) by Rajagopalan and Ferguson (36).

27
3.3.2 Ultimate Shear Stress
A summary of the nominal (ultimate) shear stress obtained from the
tests and the values predicted by the current ACI code procedures (Eqs.
(1.2), (1.3) and (1.4)) are presented in Table 3.3. These results are
compared in Fig. 3.5.
A comparison of Figs. 3.2b, c, 3.3b, c and 3.5 indicates that there is
a better agreement between the test results and the calculated values for
nominal shear strength than there is for the shear carcking stress. The
reason for the improved agreement in the case of shear strength is that,
while the ACI equations (Eqs. (1.3) and (1.4)) overestimate the contribution
of the concrete to the shear strength for beams with longitudinal reinforce
ment ratios less than about one percent, they underestimate the contribu-
tion of the stirrups (Eq. (1.2)). The two errors appear to counterbalance
each other. The net result is a good agreement between the calculated
nominal shear capacity and the experimental shear capacity obtained in this
study.
ages of
applies.
This coincidence will not be true for the whole range of percent
longitudinal reinforcement, p , to which the ACI equation, Eq. (1. 3), w
The application of Eq. (1.2) gives a different margin of safety in
beams with different amounts of longitudinal and shear reinforcement. The
result is that in the case of beams with very low amounts of longitudinal
and shear reinforcement , the ACI (5) procedure could predict shear
capacity values a little on the unsafe side, while in beams with large
percentages of longitudinal reinforcement the procedure is overconserva
tive. It should be noted that in the case ofT-beams with small amounts
of shear and longitudinal reinforcement, it appears that the ACI pro
cedure is safe and in good agreement with the shear strength obtained
during these tests. Of the beams with stirrups, only one beam, 825,

28
failed at a load less than that predicted by the ACI {5) procedure.
3. 4 Des iSJ!l.. Imp 1 i cations and Recommendations
3.4.1 Beams with Stirrups
The test results indicate that beams with stirrups containing amounts
of longitudinal reinforcement close to minimum, exhibit a reduction in
shear strength, relative to the ACI Code equations, when they are compared
to beams with larger amounts of longitudinal reinforcement. It appears
that the application of the current ACI Code procedure for the ultimate
shear capacity for this type of beams loses the typical conservatism
which is present for beams with flexural steel greater than about 1.2
percent. In fact, for beams with percentages of longitudinal reinforce
ment c 1 ose to mini mum permitted by the ACI Code ( 5), the current ACI
procedure may be slightly unconservative.
The tests performed during this investigation do not point to any
alarming deficiency in the shear strength of this type of beam, compared
to tne shear strength predicted by the current ACI procedure. In addition,
the number of tests is too few to warrant a recommendation to change the
present ACI procedures. However, it appears that the use of a shear
cracking equation similar to that proposed by Zsutty, Eq. (1.5), \vould
result in a consistently conservative shear strength prediction along the
whole range of percentages of longitudinal reinforcement to which the ACI
code, Eq. (1.2), applies.
In spite of the beneficial effect that the change would produce on
the margin of safety, it seems reasonable to suggest that in the case of
beams with stirrups, a reduction in the ACI code {5) concrete capacity
term, Vc, without any increase in the stirrup capacity term, Vs, is
29
neither necessary nor desirable at the present time.
3.4.2 Beams without Stirruns ~--- ------- ____ x __
For beams without stirrups, the ACI Code (5), Eqs. (1.3) and (1.4),
seems to be unconservative for beams with amounts of longitudinal rein-
forcement less than about l. 2 percent. However, the deficiency in shear
strength does not really present a problem. The allowable shear capacity
for beams without stirrups in the ACI Code is not limited by Eqs. (1.3)
and (1.4), but by the quantity~- The ACI Code requires that the minimum
amount of shear reinforcement must be provided whenever the applied shear,
vu, exceeds ~~· This additional Code requirement is an adequate safe
guard (6), since beams without shear reinforcement exhibit a shear strength
greater than If'. In addition, shear capacity should be well in excess of c
~in locations of low moment (11here longitudinal reinforcement may be
reduced) due to the strengthening effect of low sl1ear-span to depth ratios
(low~ or M/Vd) on vc.
30
CHAPTER 4
UL Tir1ATE STRENGTH MODEL FOR BEAt~S WITH STIRRUPS
4. l General
A universally accepted explanation of the manner in which loads are
carried to the supports of shear-critical reinforced concrete beams, with
or without stirrups, has not been developed; and in spite of the large
amount of work acCOI;Jplished to Jate, the manner in which stirrups influence
the snear transfer mechanisms is not yet completely understood.
In this study, a relatively simple semianalytical model is used to
explain the relative contribution of the various shear transfer mechanisms
in reinforced concrete beams on both a qualitative and a quantitative
basis.
4.2 Analytical Model
4.2.1 The model
A complete analytical approach to tne ultimate shear capacity problem
of reinforced concrete beams with shear cracks is a task of tremendous
complexity. Considering this complexity (composite material, nonlinear
properties and geometric discontinuities), it is concluded that a realistic
approach to the ultimate shear capacity problem is an approach which is
based on both the basic principles of mechanics and test results and
observations.
The model utilizes the truss analogy, as shown in Fig. 4.1. It is
assumed that in beams with stirrups, the shear forces are carried to the
supports by four distinct shear transfer mechanisms: shear forces in the
concrete compression zone, Vcz' dowel forces, Vd, interface or friction

31
forces along the cracks, Vay' and tension forces in the silear reinforce
ment, Vs.
At failure, the shear capacity of a reinforced concrete beam is
expressed as
(4.la)
wftich can be written as,
(4.l.b)
in which Vc (Vcz + Vay + V0) is the total shear carried by the concrete.
It has been found from tests (3,14,41) that the four main parameters
whi en affect the shear capacity of reinforced concrete beams are: the
concrete strength, the percentage of longitudinal reinforcement, the shear··
span to depth ratio and the amount of shear reinforcement.
For simplicity, this model is developed for rectangular beams with
vertical stirrups and shear-span to depth ratios greater that 2.5. In
this type of beam, the effect of the shear-span to depth ratio is not as
large as in the case of short beams, but is still significant. The ulti-
mate shear capacity, then, is expressed as a function of a 11 four par am-
eters.
4. 2. 2 Overview of i·lethod
The purpose of this section is to give an overview of the method
which is presented in the following sections. Expressions are derived
for the shear capacity of the compression zone, Vcz· Vcz depends on the
32
size of the compression zone, the shear stress distribution in the com-
pression zone, and the shear strength of the concrete. The size of the
compression zone can be determined if the location of the tip of the
failure shear crack is known. As a first step, the location of the tip
of the failure crack is determined. Following this derivation, expressions
are obtained for the average shear stress in the compression zone at fail-
ure. Then the compression zone capacity, Vcz' is presented as a function
of the concrete strength, f ~, shear-span to depth ratio, a/ d, percentage
of longitudinal reinforcement, pw' and amount of shear reinforcement,
P/vy
Using ex peri menta 1 data for reinforced concrete beams without stirrups
(10,24,32,33), the total contribution of the dowel force, Vd' plus the
interface shear , Vay' is expressed approximately as a function of shear
span to depth ratio and percentage of longitudinal reinforcement.
In this manner, the ultimate concrete capacity, V , for beams withe
out stirrups is expressed as a function of three independent variables:
concrete strength, shear-span to depth ratio, and percentage of longitud
inal reinforcement. The pred·i cted concrete capacity is compared with
predictive expressions presented by other investigators.
For beams with stirrups, it is assumed that the relative contribution
of the compression zone, dowel shear, and interface shear are the same
as in the case of similar beams without stirrups. The contribution of
the stirrups is obtained with the simplifying assumption that the failure
shear crack is inclined at 30° to the axis of the beam, as shown in Fig.
4.2. The model is used to help determine the effect of the shear rein-
forcement on the concrete shear capacity, V , and on the total nominal c

33
shear capacity, Vn, of rectangular beams. Comparisons are made with
experimental results for both rectangular beams and T -beams.
In the process of developing the model, a number of approaches were
tried, which did not work. One model was based on the assumption that
the inclined crack does not have any effect on the size of the compression
zone. This model determined the depth of the compression zone as if the
beam were in pure bending. The compression zone was very large, and the
. predicted compression zone shear capacity was greater than the total
shear strength measured experimentally in reinforced concrete beams.
Following another approach, the effect of the inclined crack on the size
of the compression zone was incorporated, but the dowel and interface
shears were ignored. The ultimate shear capacities predicted with th.is
model were always smaller than the shears obtained from tests of rectan
gular reinforced concrete beams. An improved version of the last approach,
in which the effects of the dowel and interface shears are included, is
the model presented in the following sections. A key aspect of the model,
as compared to others, is that it isolates the effect of the inclined
crack on the size of the compression zone. In the development of this
model, the main parameters found to influence the ultimate shear capacity
of beams (concrete strength, shear-span to depth ratio, percentage of
longitudinal reinforcement, amount of shear reinforcement) are included.
i-Jhile quantitative results are obtained, the model should be consid
ered primarily as a qualitative model, because of a number of limitations.
For simplicity, crack depth is based on zero tensile strength. In addi
tion, the nonlinear material behavior of concrete and the effect of shear
stresses on the nominal stress-strain curve are, also, ignored. These

34
limitations affect the accuracy of the quantitative results. However,
the model explains some important aspects of shear behavior and illustrates
how the controlling parameters work.
4.3 Concrete Capacity
4.3.1 Compression Zone Capaci~, ~z
The shear force carried by the intact concrete compression zone
depends on the area of the zone and the average shear stress in the zone
at failure. The first task, then, is to determine the depth of the com-·
pression zone.
Depth of Compression Zone: It has been found experimentally (l)
that the neutral axis in beams subject to combined bending and shear is
located much higher than in beams subject to pure bending. The depth of
the compression zone in the case of combined bending and shear may be as
low as 0.357 the compression zone depth in beams under pure bending.
In the case of pure bending, the planarity assumption (planes before
bending remain plane after bending) holds reasonably well. An expression
can be derived relating the effective depth, the depth of the neutral axis
and strainsin the extreme compression fiber and flexural steel. This
expression, together with the equilibrium equations, defines the location
of the neutral axis of the beam. For beams subject to bending and shear, a
compatibility equation cannot be accurately formulated at an isolated
cross section within the bea1" due to the geometric discontinuity. caused by the
inclined cracks. In this case, the region of the beam traversed by the
diagonal cracks must be investigated.
To investigate this region and determine the effect of the diagonal
cracks on the location of the neutral axis, a procedure is developed to

35
convert a beam with a single diagonal crack into an equivalent beam with
a vertical crack in order to use conventional expressions for determining
the depth of the neutral axis.
In Fig. 4.2, two beams are shown; one beam is subject to bending and
shear, the other to pure bending. For an elastic material, if the strains
at the extreme compression fiber (plane 1-l in Fig. 4.2) and the location
of the neutral axis are the same for both beams, then the normal stresses
in the concrete, tile resultant compressive force and its point of appl i-
cation are, also, the same. Thus, in terms of the concrete, tile beams
are equi ,alent. However, due to the geometry of the crack, the strain in
the flexural steel for the beam in bending and shear is smaller than tne
strain for the beam in pure bending. Since the tension forces, T2, must
be the same in the beams, the amount of flexural steel in the equivalent
oeam must be smaller.
The ratio of the flexural steel in the equivalent beam to the steel )
in the beam with the diagonal crack is defined as the "geometric and shear
softening effect factor", Fs. This softening factor is determined from
the analysis of the deformations of the concrete region bounded by the
top of the beam, the diagonal crack and the two planes, 1-l and 2-2,
through the ends of the shear crack, as shown in Fig. 4.2a.
The follo>ting notation is illustrated in the figure:
z = horizontal projection of shear crack,
c = concrete compressive force,
Ti = tensile force in flexural steel , = l, 2,
H = X
depth of concrete zone at location X,
\ = flexural steel in beam under bending and shear,
36
Asb = flexural steel in equivalent beam under pure bending
that produces neutral axis location equivalent to neutral
axis in beam under bending and shear,
Yx = location of neutral axis at plane x, equal to kd at plane 1-1,
Vex = point of application of compression force, C, from the ex
treme compressive fiber of beam at section x,
Yx =distance from point of application of resultant, C, to the
level of flexural steel at section x,
M1 =applied moment at section 1,
r~2 = applied moment at section 2,
Mx = applied moment at section x,
Mb = moment for the pure bending case,
ssx = strain at level of flexural steel at location x, and
sex = strain in extreme compressive fiber of concrete at location x.
Reasonable simplicity is preserved in the derivation of the expression
for the soft~ning factor with the following assumptions:
1. Stresses and strains are linearly related in the concrete.
2. Planes 1-1 and 2-2 of the beam in Fig. 4.2a, remain plane after
loading.
3. The neutral axis passes through the tip of the shear crack.
4. The compression force, C, is the same for both beams.
5. Dowel and interface shears are present and act at the inter
section of the shear crack with the flexural steel, as shown
in Fig. 4.2a.
6. The inclined force shown in Fig. 4.2a acts parallel to the
diagonal crack.

37
7. No dowel forces exist in the shear reinforcement.
8. For the concrete region only, planes before loading remain
9.
10.
plane after loading.
The angle of the crack, e, is constant and equal to 30°.
" The shear crack is a parabola: Hx = d- d(l-k) (l-x/z) 2•
As a first step, the point of application of the resultant, C, is
found for a section, x, betv1een planes 1-1 and 2-2, as shown in Fig. 4.2c.
Then the stresses in the concrete at the top of the beam and at the crack
level are obtained at x. Since the stresses, and therefore the strains,
are known, the location of the neutral axis and the strains at the
boundaries of the concrete (top of beam and crack level) are determined.
Then the deformation at the level of the flexural steel is obtained be-
tween planes 1-l and 2-2. The softening factor (Fs = Asb/As) is equal
to the ratio of the steel strain at plane 2-2 to the steel strain in the
equivalent beam. Fs is found as follows.
The applied moment at xis
(4.2)
The internal moment at x is
(4.3)
From the equilibrium of the external and internal moments,
(4.4)
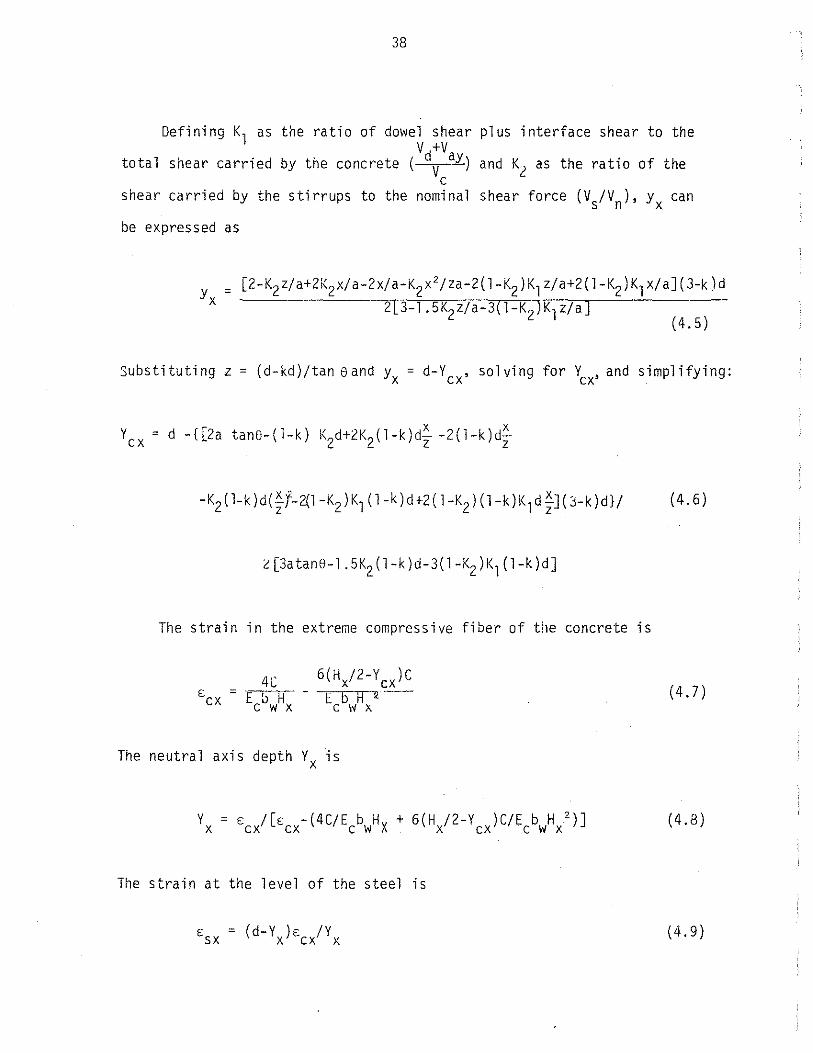
38
Defining K1 as the ratio of dowel shear plus interface shear to the V +V
total shear carried by the concrete ( dv ay) and K2 as the ratio of the c
shear carried by the stirrups to the nominal shear force (Vs/Vn), yx can
be expressed as
y = X
[2-K2z;a+2i<2x; a-2x/a-K2x2 1 za-2( l-K2) K1 z/a+2 ( l-K2) K1 x/ a] ( 3-k )d 2[3-l.5K2z;a-3(l-K2)K1z;a]
(4.5)
Substituting z = (d-kd)/tan eand yx = d-Ycx' solving for Vex' and simplifying:
Y = d -{[2a tane-(1-k) K d+2K (1-k)d~ -2(1-k)d~ ex 2 2 z z
;o [3a tan e-1 . 5 K2 ( 1 -k) d -3 ( 1 -K2) 1<1 ( 1-k) d]
The strain in the extreme compressive fiber of the concrete is
4C E b H
C W X
6(H /2-Y )C x ex E b H 2 -c 11 X
The neutral axis depth Yx is
v = c /[c -(4C/E b Hx + 6(H 12-v )C/E b H 2 )] x ex ex c 11 x ex c w x
The strain at the level of the steel is
( 4. 7)
(4.8)
(4.9)

39
The total elongation of the steel is
(4.10)
and the average strain in the steel is
(4.11)
The strain in the steel is not constant between planes 1-l and 2-2.
At plane 2-2 the steel strain is approximated as
[(Va/Vd)+Vs]z 2d(l-k)ASES (4.12)
The variation of Esz from Esav is based on the assumption that the strains
in the steel vary linearly between planes 1-l and 2-2, due to the inclined
force shown in Fig. 4.2a.
The strain in the steel in the equivalent beam is
(4.13)
From equilibrium (T2 = C = T2b)
(4.14)
Substituting the expressions for Eso' Es 2 and Ec (57000~ psi) and the
value for Es(29,000,000 psi) into Eq. (4.14), and solving for Asb gives
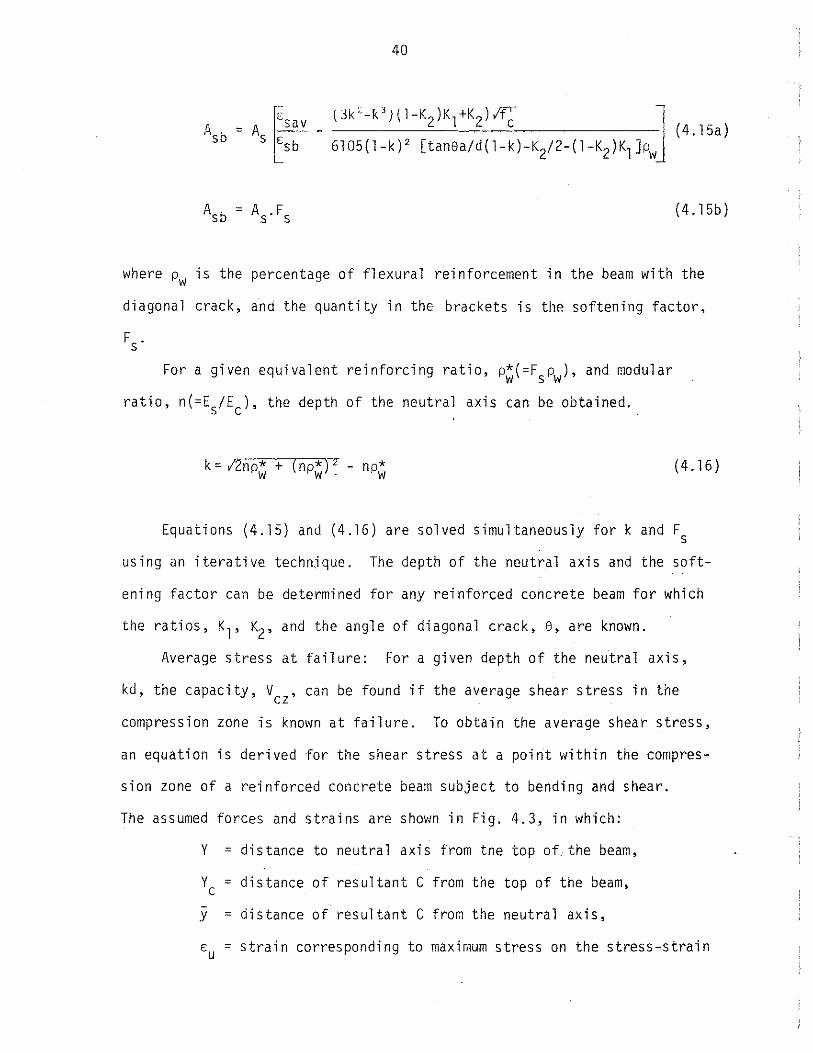
40
= A ~- c (4.15a)
E (Jk"-k 3 J(l-K2)K1+K2)!f' J
s sb 6105(1-k) 2 [tanea/d(l-k)-K2/2-(l-K2)K1]Pw
( 4. 15b)
where Pw is the percentage of flexural reinforcement in the beam with the
diagonal crack, and the quantity in the brackets is the softening factor,
For a given equivalent reinforcing ratio, p~(=Fspw), and modular
ratio, n(=Es/Ec)' the depth of the neutral axis can be obtained.
k = 12np* + (np*F - np* w w . w (4.16)
Equations (4.15) and (4.16) are solved simultaneously fork and Fs
using an iterative technjque. The depth of the neutral axis and the soft-
ening factor can be determined for any reinforced concrete beam for which
the ratios, K1, K2, and the angle of diagonal crack, e, are known.
Average stress at failure: For a given depth of the neutral axis,
kd, the capacity, Vcz' can be found if the average shear stress in the
compression zone is known at failure. To obtain the average shear stress,
an equation is derived for the shear stress at a point within the compres
sion zone of a reinforced concrete beam subject to bending and shear.
The assumed forces and strains are shown in Fig. 4.3, in which:
Y = distance to neutral axis from tne top of the beam,
Yc = distance of resultant C from the top of the beam, -y = distance of resultant C from the neutral axis,
Eu = strain corresponding to maximum stress on the stress-strain

43
developed by Kupfer and Gerstle (25) for combined tension and compression
is used (Fig. 4.5). Using tnis criterion, the principal tensile stress
at failure, a1, is expressed as
(4.25)
in which ft is tne tensile strength of the concrete 0ssumed equal to 5~).
For a normal stress, a, and a shear stress, T, acting as shown in Fig.
4.6, the failure criterion is expressed as
f'a t ~]
Eq. (4.26) is plotted in Fig. 4.6 for 4000 psi concrete.
(4.26)
The variation of shear strength with y is shown in Fig. 4.4 for a
strain ratio, w = 0.6. Fig. 4.4 suggests that failure initiates at an
interior point, close to the center of the compression zone.
Using this procedure, the average shear stress within the compression
zone at failure, 'av' can be accurately approximated (within 3 percent)
as
( 4. 27)
The constant , K3, depends on the strain ratio, w. The values of 'av
obtained from this analysis are shown in Table 4.1 for different concrete
strengths and strain ratios. The representative constant, K3, for each

44
strain ratio, w, is also shown.
After the examination of the results and comparison with test data
(26), a constant value for K3 = 0.75 was selected as reasonably repre
sentative. The value of average shear stress within the compression zone
at failure is therefore:
'av = 0.75(f~).75 (4.28)
The shear capacity of the compression zone is:
= 0. 75k(f') · 75 b d c w (4.29a)
or in terms of nominal stress,
0.75k(f~)· 75 (4.29b)
4.3.2 Dowel and Interface Shear Capacity
Based on the simplified model described above, the "contribution"
of the dowel and interface shear to the nominal shear capacity of rectang
ular reinforced concrete beams without stirrups is obtained using an analy
sis of the experimental data obtained from a number of investigators (10,
24,35,36). Using Eqs. (4.15), (4.16) and (4.29), the factor, K1, is deter
mined for each beam with an iterative procedure.
The procedure consists of selecting a value for K1( =(Vd+V )/V) ay c
and obtaining the values fork (Eqs. (4.15 and 4.16)), Vcz (Eq. (4.29)),
and finally
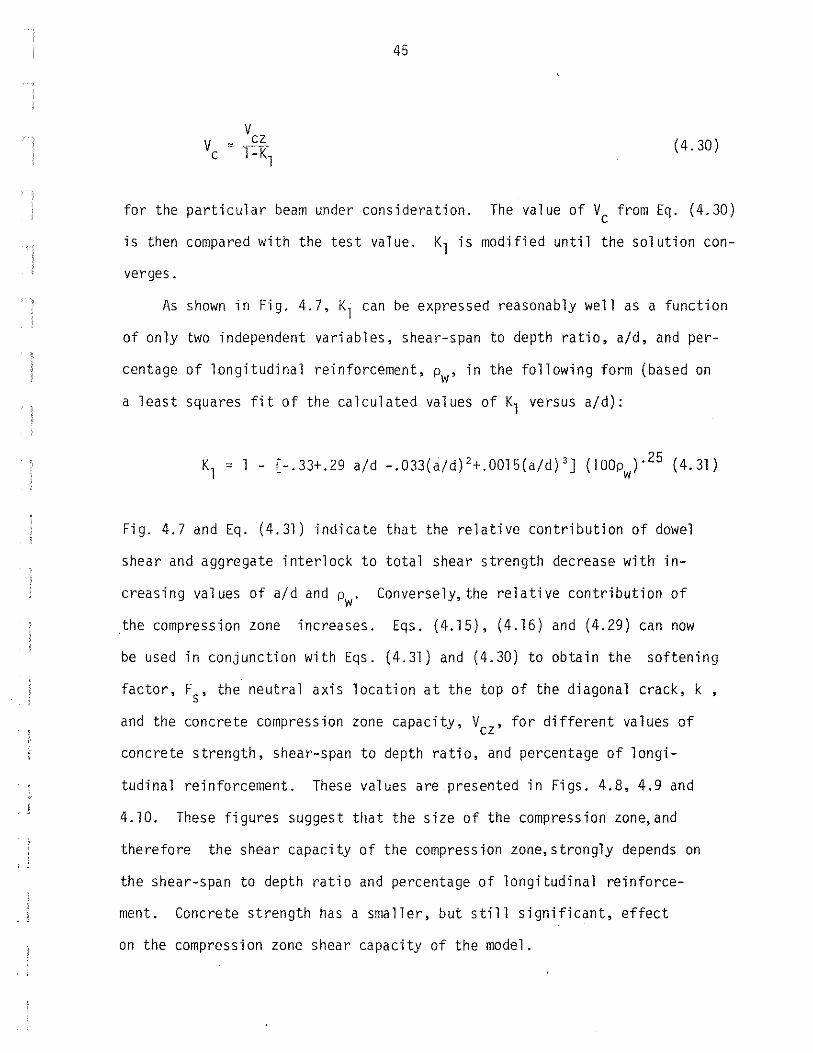
45
v v = _g (4. 30) c 1- K1
for the particular beam under consideration. The value of Vc from Eq. (4.30)
is then compared with the test value. K1 is modified until the solution con-
verges.
As shown in Fig. 4.7, K1 can be expressed reasonably well as a function
of only two independent variables, shear-span to depth ratio, a/d, and per-
centage of longitudinal reinforcement, Pw• in the following form (based on
a least squares fit of the calculated values of K1 versus a/d):
K1 = l - [-.33+.29 a/d -.033(a/d) 2+.0015(a/d) 3] (l00pw)· 25 (4.31)
Fig. 4.7 and Eq. (4.31) indicate that the relative contribution of dowel
shear and aggregate interlock to total shear strength decrease with in-
creasing values of a/d and Pw· Conversely, the relative contribution of
.the compression zone increases. Eqs. (4.15), (4.16) and (4.29) can now
be used in conjunction with Eqs. (4.31) and (4.30) to obtain the softening
factor, Fs, the neutral axis location at the top of the diagonal crack, k ,
and the concrete compression zone capacity, Vcz' for different values of
concrete strength, shear-span to depth ratio, and percentage of longi-
tudinal reinforcement. These values are presented in Figs. 4.8, 4.9 and
4.10. These figures suggest that the size of the compression zone,and
therefore the shear capacity of the compression zone,strongly depends on
the shear-span to depth ratio and percentage of longitudinal reinforce
ment. Concrete strength has a smaller, but still significant, effect
on the compression zone shear capacity of the model.

46
4.3.3 Concrete Capacity~
For beams without stirrups, the nominal shear capacity, Vc' is expressed
as
V = V I ( 1-K ) c cz l ( 4. 30)
Eq. (4.30) is a function of concrete strength, shear-span to depth ratio
and percentage of longitudinal reinforcement and can be used to predict the nom
inal (ultimate) shear capacity for rectangular beams without stirrups. The
predicted shear capacities are shown in Fig. 4.11 in terms of shear stress·,
vc. The curves are similar to the curves obtained using Eq. (1.5), proposed
by Zsutty. For comparison, vc is plotted versus the percentage of longitud
inal reinforcement (Fig. 4.12), for f~ = 4000 psi and a/d = 4, and compared
with shear capacities from other predictive relations (5,36,42).
Figs. 4.11 and 4.12 suggest that the concrete shear capacity is an in-
creasing function of both concrete strength and percentage of longitudinal
reinforcement, and a decreasing function of shear-span to depth ratio. The
proposed model, therefore, matches observed behavior on at least a qualita-
tive basis. Unfortunately, the model seems to show a much stronger effect
of pw on vc than obtained by Zsutty based on a statistical analysis. This
over-sensitivity of the model is likely due to the fact that it ignores the
nonlinear, softening behavior of the concrete within the compression zone.
It is, also, important to note that even the qualitative match requires the
use of Eq. (4.31) based on test results.
The predicted shear capacities are compared with the test results used
to develop the model in Fig. 4. 13.
4. 4 Capacity of Shear Reinforcement, y_s
The contribution of stirrups to the shear capacity of the model can be
evaluated only if both the stress in the stirrups and the number of stirrups
47
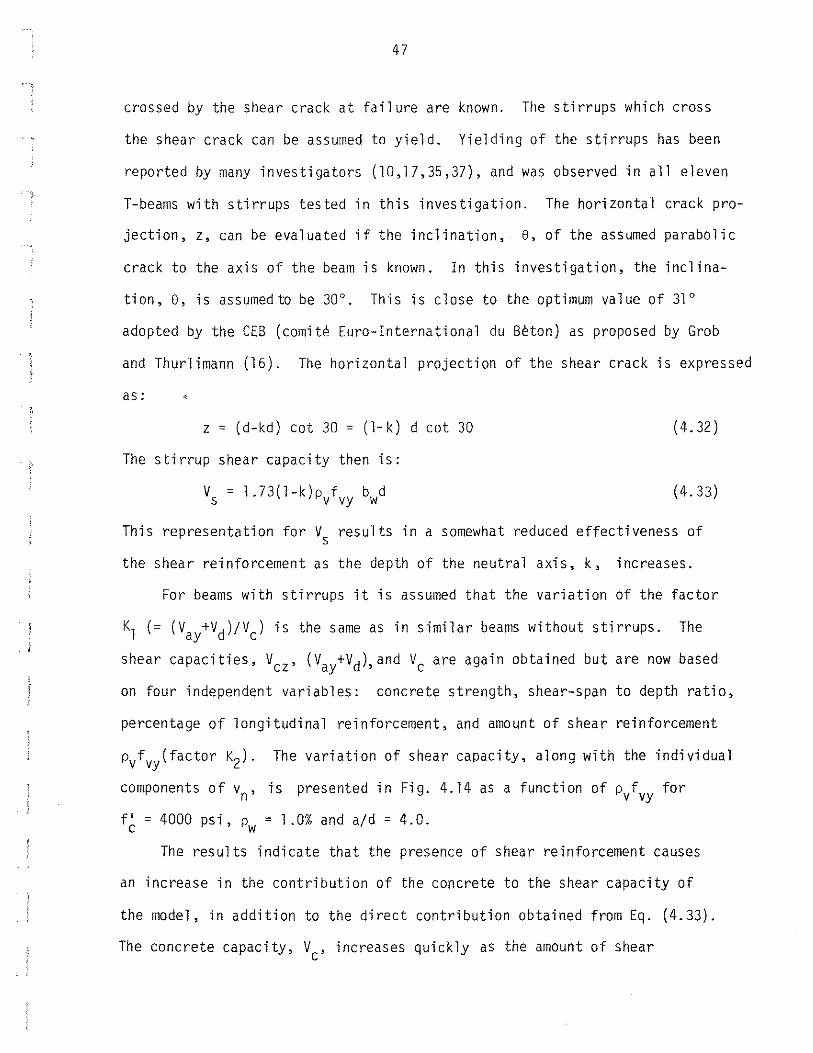
crossed by the shear crack at failure are known. The stirrups which cross
the shear crack can be assumed to yield. Yielding of the stirrups has been
reported by many investigators (10,17,35,37), and was observed in all eleven
T-beams with stirrups tested in this investigation. The horizontal crack pro
jection, z, can be evaluated if the inclination, e, of the assumed parabolic
crack to the axis of the beam is known. In this investigation, the inclina-
tion, e, is assumedto be 30°. This is close to the optimum value of 3JO
adopted by the CEB (comite Euro-International du Beton) as proposed by Grab
and Thurlimann (16). The horizontal projection of the shear crack is expressed
as: 4
z = (d-kd) cot 30 = (1-k) d cot 30 (4.32)
The stirrup shear capacity then is:
( 4. 33)
This representation for Vs results in a somewhat reduced effectiveness of
the shear reinforcement as the depth of the neutral axis, k, increases.
For beams with stirrups it is assumed that the variation of the factor
K1 (= (Va/Vd)/Vc) is the same as in similar beams without stirrups. The
shear capacities, Vcz' (Vay+Vd),and Vc are again obtained but are now based
on four independent variables: concrete strength, shear-span to depth ratio,
percentage of longitudinal reinforcement, and amount of shear reinforcement
pvfvy(factor K2). The variation of shear capacity, along with the individual
components of v n, is presented in Fig. 4. 14 as a function of P/ vy for
f~ = 4000 psi, Pw = 1.0% and a/d = 4.0.
The results indicate that the presence of shear reinforcement causes
an increase in the contribution of the concrete to the shear capacity of
the model, in addition to the direct contribution obtained from Eq. (4.33).
The concrete capacity, V , increases quickly as the amount of shear c

48
reinforcement, p f , increases from 0 to about 150 psi, and then remains approxiv vy mately constant with the further increase in the amount of shear reinforcement.
4.5 Effectiveness of Shear Reinforcement
The nominal (ultimate) shear capacity of reinforced concrete beams with
stirrups is
V =V + V n c s {4.lb)
or in terms of stresses,
= vc + rp f v vy (4. 34a)
in which r is defined as the effectiveness factor of the shear reinforce-
ment.
When the nominal shear, vn, is expressed in the form
( 4. 34b)
in which v~ is the ultimate shear capacity for a similar beam without
stirrups, the effectiveness factor, r, varies considerably as a function
of the amount of the shear reinforcement. As it is shown in Fig. 4.15,
the effectiveness factor is larger in beams with small shear-span to depth
ratios, small amounts of flexural and shear reinforcement and higher con-
crete strengths.
Fig. 4.15 shows that the effectiveness factor for a beam with a/d = 4,
p =.02, f' = 4000 and p f close to the minimum is about 1.65. This w c v vy

49
value is reasonably compatible with the effectiveness factors (1.8, 1.75)
reported by other investigators (10,17). It is of interest to note that
the effectiveness factors obtained for the model are based on a constant
crack inclination, e = 30 °, which is not necessarily justified.
In Fig. 4. 16, the nominal shear stress is plotted for a constant per-
centage of flexural reinforcement and two shear-span to depth ratios. In
the same figure, experimental results forT-beams (17) are also shown.
Examination of Fig. 4.16 suggests that there is a reasonable agreement
between the test results and the values of v predicted by the model. The n
model ap~2ars to be unconservative for beams with small shear-span to
depth ratios and larger amounts of shear reinforcement. This weakness in
the model is in all likelihood due to the use of an average failure shear
(Tavl within the compression zone of the model, which is independent of
the actual loading on the beam.
In Fig. 4.17, the nominal shear stress is plotted for a shear-span
to depth ratio of 4 and different amounts of longitudinal reinforcement.
This figure suggests that the effect of the percentage of longitudinal
reinforcement on the ultimate shear capacity is more pronounced in beams
with small amounts of shear reinforcement and tends to diminish with in-
creasing amounts of shear reinforcement. The severity of this behaivor
in the model seems to be somewhat unrealistic, and experimental evidence
does not exist showing the convergence in vn illustrated in Fig. 4.17.
4.6 Comparison of Predicted and Experimental Shear Capacities
The shears predicted by the proposed procedure are compared with test
results {10,17,24,35) for beams with stirrups in Figs. 4.18 and 4.19 and
Tables 4.2 and 4.3, for rectangular beams and T-beams, respectively.

50
It appears that the proposed procedure is somewhat better for rectang
ular beams than for T-beams. The predicted ultimate shear capacities are
more conservative in the case of T-beams. For rectangular beams, the means
of the ratios of the test results to the predicted values of shear strength
are .75, 1.01 and 1.04, with coefficientofvariationof6.87%,l0.08%and5.86%
for beams from references 24, 35 and 10, respectively. The ratio of .75
is obtained from the tests by Krefeld and Thurston (24). In their tests,
Krefeld and Thurston did not use compression reinforcement; therefore,
there is a possibility that these beams failed at smaller loads compared
to the btcams tested by the other investigators (10,35) due to insufficient
anchorage of the stirrups.
For the T-beams, the mean values of the ratios of test to predicted
shear strengths are 0.89, l .14 and 1.26, with coefficien~ of variation of
5.36't, 9.l7:s and 13.41;; for the results reported in Chapter 2 of this report,
Reference 17, and Reference 35, respectively. The value 0.89 obtained
for the test results from this investigation may be the result of the
different types of flexural reinforcement used in these T-beams. Since
the flexural reinforcement consisted of strands, instead of reinforcing
bars, it is possible that the dowel shear, which is normally carried by
the flexural reinforement, was reduced, as was the bond strength between
the strands and the concrete.
Overall, the mean values of the ratios of experimental shear strength
to predicted shear strength are 0.95 for the rectangular beams and 1.15
for the T-beams, with coefficients of variation ofl4. 7o;; and 19.74%, respectively.
4.7 Critique of the Model
For the benefit of simplicity, some of the assumptions used in
51
developing the model are not truly representative of the actual materials
being modeled: Concrete stress-strain curves are nonlinea~ not linear.
The average shear stress at failure is not only a function of the concrete
strength, but is also a function of the applied moment. Interface shear
is present along the total length of the shear crack. The inclination of
the critical shear crack is not constant for all beams.
One of the most apparent inconsistencies in the model is the assump
tion of zero tensile strength in the concrete, used to determine the depth
of the compression zone, while at the same time assuming a tensile strength
(Eq. (4.Z5)) to obtain the shear capacity of the same compression zone.
The overall effect of the simplifying assumptions is to ignore the
true stress-strain behavior of the concrete and, therefore, ignore the
material softening in combined compression and shear and the accompanying
reduction in the depth of the compression zone. This results in too great
an increase in the depth of the compression zone, as a function of a/d
and Ow• and a subsequent overestimation of the concrete capacity. The
use of an average failure shear stress within the compression zone, Tav'
also prevents the model from exhibiting compression-type failure (and re
duced "stirrup effectiveness") for high values of pvfvy· Finally, no
attempt is made to model the aggregate interlock and dowel shear except
through the use of test data.
In spite of these shortcomings, the model provides a qualitative repre
sentation of the effects of concrete strength, shear-span to depth ratio,
percentage of longitudinal reinforcement and amount of shear reinforcement
on the shear capacity of reinforced concrete beams. The qualitative success
of the model suggests that the general approach is correct and that a more
52
accurate model can be obtained by following a similar approach and improv
ing the realism of the stress-strain representation of the concrete.

5.1 Summary
53
CHAPTER 5
SUMt1ARY AilD CONCLUSIONS
Fifteen lightly reinforced concrete T-beams, eleven with stirrups
and four without stirrups were tested to failure. The major variables
in the study were the amounts of flexural and shear reinforcement. The
flexural steel varied from one-half to one percent, and the shear reinforce
ment varied from zero to about 110 psi. The test results are analyzed and
compared with the ACI Building Code (5) shear design procedures. Design
recommendations are presented.
An analytical model is developed which examines the effects of con
crete strength, shear-span to depth ratio, percentage of flexural steel
and amount of shear reinforcement on the shear capacity of normal (a/d ~ 2.5)
rectangular reinforced concrete beams. The effects of these parameters on
the relative contributions of compression zone capacity, aggregate inter
lock, dowel shear and stirrup capacity to shear strength are examined.
5.2 Conclusions
l. The test results obtained in this study indicate that
reinforced concrete T-beams with small percentages of longitudinal
reinforcement and small amounts of shear reinforcement exhibit a
reduction in shear capacity relative to the design expressions in
the ACI Building Code (5), when compared to similar beams with
normal to large percentages of longitudinal reinforcement.
2. The shear capacity of these lightly reinforced T-beams is, in most
cases, equal to or greater than the shear capacity predicted by the

54
current Pn Code ( 5), and the present ACI procedure appears to be
safe for T-beams.
3. For the lightly reinforced concrete T-beams, in this investigation
it was found that the stirrups are l .5 times as effective as pre
dicted by the ACI Code {5).
4. The current procedures for shear design (5) should be retained for
reinforced concrete beams both with or without stirrups, until
additional tests are performed.
5. The semianalytical model developed in this study is a reasonable
qua~itative tool for the examination of the effect of concrete
strength, shear-span to depth ratio, percentage of flexural steel
and amount of sheor reinforcement on the ultimate shear capacity
of reinforced concrete oeams.
6. The model can be used to examine the relative contribution of the
different shear transfer mechanisms on shear capacity.
7. The model explains the observed high effectiveness of the first
small amounts of shear reinforcement in terms of a greater shear
crack projection and an increased compression zone capacity.
8. Due to the simplifying assumptions used, the model overestimates
the effect of shear-span to depth ratio and flexural reinforcing
ratio on shear strength and cannot account for shear-compression
failure.
9. Diagonal cracks must be modeled to properly represent both the
concrete and steel contributions to the shear strength of reinforced
concrete beams.
55
5.3 Recommendations for Further Study
The experimental investigation in this study is only a small part
of a test program needed to examine the ultimate shear capacity of rein
forced concrete beams with small amounts of flexural and shear reinforce
ment. Additional tests should be carried out on both T-beams and rectang
ular beams. The effect of concrete strength and shear-span to depth ratio
should be examined. In addition, the effect of continuity and type of
loading should be investigated. The type of flexural reinforcement used
in the future should be high strength deformed reinforcing bars, in order
to more accurately represent the flexural steel which is used in practice.
The relatively simple model presented in this study may be improved,
but with some loss in simplicity. A better representation of interface
shear along the total length of the shear crack should be incorporated
in the basic model. The actual nonlinear stress-strain curve for the con
crete should be used, and the effect of a variable shear crack inclination
on ultimate strength should be studied.

56
REFERENCES
l. Acharya, D. N. and Kemp, K. 0., "Significance of Dowel Forces on the Shear Failure of Rectangular Reinforced Concrete Beams without Web Reinforcement," Journal of the American Concrete Institute, Proc. Vol. 62, No. 10, Oct.,l965, pp. 1265-1279.
2. ACI-ASCE Committee 326, "Shear and Di agona 1 Tension," Journa 1 of the American Concrete Institute, Proc. Vol. 59, No. 1, Jan. 1962, pp. 1-30, No. 2, Feb., 1962, pp. 277-333, No. 3, March, 1962, pp. 353-395.
3. ACI-ASCE Committee 426, "The Shear Strength of Reinforced Concrete Members," Journal of the Structural Division, ASCE, Vol. 99, No. ST6, Proc. Paper 979.,--;-June, 1973, pp. 1091-1187.
4. ACI-ASCE Committee 426, "Suggested Revisions to Shear Provisions of :.ci Code 318-71," Journal of the American Concrete Institute, Proc. Vol. 74, No. 9, Sept., T97~pp. 458-469.
5. American Concrete Institute, Building Code Requirements for Reinforced Concrete (ACI 318-77), Detroit, Michigan, 1977.
6. Attiogbe, E. K., Palaskas, M. N., and Darwin, D., "Shear Cracking and Stirrup Effectiveness of Lightly Reinforced Concrete Beams," Structural Engineering and Engineering Materials, SM Report No. l• University of Kansas Center for Research, Inc., Lawrence, Kansas, July 1980.
7. Borishansky, M.S., "Shear Strength of Reinforced C.I.B. Congress,Rotterdam, 1959, UDC 624.075.3: 85-95.
Concrete Elements," 624.012.45, pp.
8. Braestrup, ~1. W. "Plastic Analysis of Shear in Reinforced Concrete," Magazine of Concrete Research, Vol. 26, No. 89, Dec., 1974, pp. 221-228.
9. Bresler, Boris and MacGregor, J. G., "Review of Concrete Beams Failing in Shear," Journal of the Structural Division, ASCE, Vol. 93, No. STl, Proc. Paper ~l06,~b., 1967, pp. 343-372.
10. Bresler, Boris and Scordelis, A. C., "Shear Strength of Reinforced Concrete Beams," Journal of the American Concrete Institute, Proc. Vol. 60, No. 4, Jan. , 1963, pp. 51 -7 4.
11. Clark, A. P., "Diagonal Tension in Reinforced Concrete Beams," Journal of the American Concrete Institute, Proc. Vol. 48, No. 11, Oct., 1951 ,pp. 145-156.
12. Collins, M.P., "Towards a Rational Theory for Reinforced Concrete
57
!~embers in Shear," Journal of the Structural Division, ASCE, Vol. 104, No. ST4, Proc. Paper l369~Apr., 1978, pp. 649-666.
13. Elstner, R. C., Moody, K. G., Viest, I. M., and Hognestad, E., "Shear Strength of Reinforced Concrete Beams, Part 3-Tests of Restrained Beams with Web Reinforcement," Journal of the American Concrete Institute, Proc. Vol. 51, No.6, Feb., T95s;-pp. 525-539.
14. Fenwick, R. C. and Paulay, T., ''Mechanism of Shear Resistance of Concrete Beams," Journal of the Structural Division, ASCE, Vol. 94, No. STlO, Proc. Paper:Z325, Oct., 1968, pp. 2325-2350.
15. Gergely, P., ''Splitting Cracks Along the Main Reinforcement in Concrete Member," Report to Bureau of Public Roads, U. S. Department of Transportation, Cornell University, Ithaca, N. Y., Apr., 1969.
16. Grab, Josef and Thurlimann, Bruno, ''Ultimate Strength and Design of ~einforced Concrete Beams under Bending and Shear," IABSE, Vol. 36-II, 1976, pp. 105-119.
17. Haddadin, r~. J., Sheu-Tien Hong, Mattock, A. H., "Stirrup Effectiveness in Reinforced Concrete Beams with Axial Force," Journal of the Structural Division, ASCE, Vol. 97, No. ST9, Proc. Paper 8394-, Sept., 1971, pp. 2277-2297.
18. Hognestad, E., "A Study of Combined Bending and Axial Load in Reinforced Concrete t1embers," Engineering Experiment Station Bulletin Series, No. 399, University of Illinois, Urbana, Illinois, 1951, pp. 128.
19. Hognes tad, E. , "What Do We Know About Diagonal Tension and Heb Reinforcement in Concrete?," Engineering Experiment Station, Circular Series, No. 64, University of Illinois, Urbana, Illinois, Mar., 1952, pp. 47.
20. Kani, G. N. J., "The Riddle of Shear Failure and Its Solution," Journal of the American Concrete Institute, Proc. Vol. 61, No. 4, Apr., 1962f";pp. 441-407.
21. Kani, G. N. J.,"Basic Facts Concerning Shear Failure," Journal of the American Concrete Institute, Proc. Vol. 63, No. 6, June, 1966, pp. 675-790.
22. Kani, G. N. J., "A Rational Theory for the Function of Web Reinforcement," Journal of the American Concrete Institute, Proc. Vol. 66, No. 3, March, 1969-;-pp. 185-197.
23. Kani, M. W., Huggins, M. W., and Wittkopp, R. R., Kani, on Shear i!:!_ Reinforced Concrete, University of Toronto Pres$,197g:- --

58
24. Krefeld, W. J. and Thurston, C. W., "Studies of the Shear and Diagonal Tension Strength of Simply Supported Reinforced Concrete Beams," Journal of the American Concrete Institute, Proc. Vol. 63, No. 4, Apr.,--1966, pp. 451-475.
25. Kupfer, H. B. and Gerstle, K. H., ''Behavior of Concrete Under Biaxial Stresses," Journal of Engineering Mechanics Division, ASCE, Vol. 99, No. EM4, Aug. 1973, pp. 852-866.
26. Kupfer, H. Hilsdorf, H. K. and Rusch, H., "Behavior of Concrete Under Biaxial Stresses," Journal of the American Concrete Institute, Proc. Vol. 66, No. 8, Aug. 1969, pp.l656-666.
27. Laupa, A., Siess, C. P. and Newmark, N., "Strength in Shear of Reinforced Concrete Beams," Engineering Experimental Station Bulletin 428, University of Illinois, Urbana, Illinois, Mar. 1955.
28. Micro-Measurements, "Strain Gage Installations with M-Bond 200 Adhesive," Instruction Bulletin, B-127-5, Measurements Group, Raleigh, North Carolina, May 1976.
29. Micro-Measurements, "Application of r~-Coat G and GL Protective Coatings," Instruction Bulletin, B-141, Measurements Group, Raleigh, North Carolina, May 1978. --
30. Moody, K., Vi est, I. M., Elstner, R. C. Strength of Reinforced Concrete Beams," Concrete Institute, Proc. Vol. 51, No. No. 3, Mar., 1955, pp. 697-732.
and Hognestad, E., "Shear Journal of the American 2, Feb. ,1955, pp. 525-539,
31. Moore, W. P., Jr., "An Analytical Study of the Effect of Web Reinforcement on the Strength of Reinforced Concrete Beams Subjected to Combined Flexure and Shear," Structural Research Series, No. 282, University of Illinois, Urbana, Illinois, May 1964. -- --
32. Moretto, 0., "An Investigation of the Strength of Welded Stirrups in Reinforced Concrete Beams," Journa 1 of the American Concrete Institute, Proc. Vol. 42, No. 2, Nov., T94s-;--pp. 141-162.
33. W:irsch E., "Vers uche Uber Schubspannugen in Betonei sentragern," Beton u~Eisen Berlin, Vol. 2, No. 4, Oct. 1903, pp. 269-274.
34. Nielsen, M. P., Braestrup, rt W.,dl'ld Bach, F., "Rational Analysis of Shear in Reinforced Concrete Beams," IABSE Proc. P. -15/78, May 1978, pp. 1-16.
35. Placas, Alexander, and Regan, P. E., ''Shear Failure of Reinforced Concrete Beams," Journal of the American Concrete Institute, Proc. Vol. 68, No. 10, Oct. 1971, pp. 763-773.

5~
36. Rajagopalan, K. S., and Ferguson, P. M., "Exploratory Shear Tests Emphasizing Percentage of Longitudinal Steel," Journal of the American Concrete Institute, Proc. Vol. 65, i~o. 4o, Aug. 1968, pjl:"" 634-638.
37. Regan, P. E., ''Combined Shear and Bending of Reinforced Concrete Members," Thesis presented to the University of London, England, 1967 in partial fulfillment of the requirements for the degree of Doctor of Philosophy.
38. Ritter, W., "Die Bauweise Hennebique," Schweizerische Bauzeitung, Zurich, Vol, 33, No. 7, Feb. 1899, pp. 59-61.
39. Rusch, H., "Uber die Grenzen der Anwendbarkeit der Fachwekanalogie bei der Berechnung der Schulfestigkeit von Stalbetonbalken," Ehrenbuch Prof. lng. F. Campus, Amici et Alumni, Belgium, 1964.
40. Talbot, A. N. "Tests of Reinforced Concrete Beams Resistance to Web Stresses," Engineering Experiment Station Bulletin No. 29, University of :llinois, Urbana, Illinois, Jan. 1909, pp. 1-85.
41. Taylor, H. P. J., "Investigation of the Forces Carried Across Cracks in Reinforced Concrete Beams in Shear by Interlock of Aggregate," Cement and Concrete Association, Technical Report 42.477, London, Engl and--;-1970.
42. Zsutty, T. C., "Beam Shear Strength Prediction by Analysis of Existing Data," Journal of the American Concrete Institute, Proc. Vol. 65, No. 71, Nov., 1968;-pp. 943-951.
43. Zwoyer, E. M. and Siess, C., "Ultimate Strength in Shear of Simply Supported Beams Without Web Reinforcement," Journal of the American Concrete Institute, Proc. Vol. 51, No. 8, Oct. l954,1Jp~81-200.

TABLE2.1 LONGITUDINAL AND TRAIISVERSE RE!Nm,CEMENT
longitudinal Reinfor·cement Transverse Reinforcement
~
w Bottom Flange Flange Smooth Wire Stirrups ·r Beam Type Flexural Type Type Oiametf,r Spacing Shear Preyielding Yield Ul tirnate w
Ared,in1 reinforcing 1 in in reinforcing ++ 1oad, load, load, ~
ratio, 1'w•':'. p f , psi v vy pounds pounds pounds
12 5-l/2 in 0.693 ~ w
AOO ASTM A416 0.656 :0 ~-
0, A25 270 k;i 0.663 u-~ .ON 0.132 7 31.8 750 835 1018 A A25a st1·ess 0. 765 0.668
w~ 0.132 7 31.8 750 835 1115 E u A 50 r·elieved 0.661 c w w~ 0. 186 7 73.9 1650 1940 2125 0 w E·~
A50a strands 0.658 ~ ~ c~ 0.11!6 I 75.0 1700 1970 2200 w- 0
A75 0.655 u ~w 0. ?29 7 97. I 2350 2550 3240 ww II 0.699 o~ u~ 0.244 7}* 110.2** 1350 1550** ~" -0
<DO BOO S-7/16 in 0.4il8 ~-~ uo ~
B25 ASTM Ml6 0.575 0.494 ~0 w<> 0.132 7 32.4 750 850 1135 0"> c u 0 B 850 270 ksi 0.498 "'0 ~0 0.186 1 76.2 1700 2000 2200 ~ c~
s tr·ess ~ C?M ~"
re 1 ieved ~ ~~
'"' ~"' ~~
strands ~ >: '"'" >--~
coo 5-0.6 in 0.943 v>C
'"'~ >: >-- 4-
>,
C25 ASTM A416 0.948 .0 ~ 0.132 7 32.4 750 %0 1120 c l. 090 ~ ~ -o:~
C50 270 ksi 0.939 ·~~ c 0.186 7 76.2 1700 2000 2210 w M"' C75 stress 0.933 N-N 11. .a 0.229 7 103.0 2350 2705 3347
relieved strands
* double stirrups dt 7~1." were used ** estimated
+ A p =: • s w bwd
A f ++ fJ f "' ~XI
v vy bws

TABLE 2.2 CONCRETE MIX DESIGN AND STRENGTH
Series Beam Coarse Fine Type I W/C Slump Measured Age at Cylinder r~odul us of aggregate aggregate cement in air con- test, strength, rupture.
lb/cy* lb/cy* lb* tent 5~ days f ~,psi f , psi r
#2 1470 1460 Sti4 .473 1 1;, 5.5 21 4750 437 ADO 1510 1500 470 .568 1% 5.0 7 4740 667 A25 1510 1500 470 .568 l 5.5 16 4720 396
A A25a 1490 1480 517 .516 ';. 2.0 4 4790 664 A 50 1510 1500 470 . 568 1% 6.5 18 3810 380 A50a 1490 1480 517 .516 1% 4.5 b 4060 512 A75 1510 1500 470 .568 1 1;. 3.9 6 4670 550 "' ~ #1 1510 1500 470 .568 % 6.0 10 5520 717
BOO 1510 1500 470 .568 '!. 4.5 11 4640 567 B 825 1510 1500 470 .568 l v. 3.8 18 4470 525
850 1510 1500 470 .568 11h 6.0 13 4390 585
coo 1490 1480 517 .516 v2 4.4 3 4270 604
c C25 1490 1480 51 7 . 516 '!. 3.3 5 4100 462 C50 1450 1450 611 .450 1 v. 6.5 3 4300 650 C75 1490 1480 517 .516 1 3.2 9 4260 585
* Based on air content~ 5.0%.

TABLE 2.3 SUHr,IARY OF TEST PROGRAt,1, FLEXURAL CRACKING STRESSES AND NOt~INAL SHEAR STRENGTH
Series Beam A s
Pv f vy f' a/d b d *Test v 0w=bd c w fl exura 1 n test w /o psi psi in in cracking kips
stress psi
#2 0.693 - - 4750 4.14 14.72 7.48~ 16.244
AOO 0.656 - - 4740 3.92 15.54 6.54~ 14.560
A25 0.663 31.8 4720 3. 97 15.38 6.55~ 19.275
A25a 0.668 31.8 4790 4.00 15.26 6.77~ 20.772 A A 50 0.661 73.9 3810 3.96
7;, 15.42 7 22/f' 25.954 . c
A50a 0.658 75.0 4060 3.94 15.49 7.49~ 24.660 "' A75 0.655 97. 1 4670 3.92 15.56 6.83~ 31.966 N
#1 0.699 110.2 5520 4.18 14.60 6.24~ 31 . 275
BOO 0.488 - - 4640 3.88 15.70 6.18~ 16.027
B B25 0.494 32 ."4 4470 3.93 7;, 15.52 6.381~ 1 7. 6 70
850 0.498 76.2 4390 3.96 15. 39 7.57~ 24.050
coo 0.943 - - 4270 3.96 15.41 7.14~ 13.270
c C25 0.948 32.4 4100 3.98 7;, 15.33 7.23~ 18.650
cso 0.939 76.2 43ll0 3.94 15.47 7.82~ 30.150
C75 0.933 103.0 4260 3.92 15.57 7.53~ 31.020
* Based on the uncracked trans formed cross section.

63
*TABLE 3.1 SHEAR CRACKING STRESSES OBTAINED FROM CONCRETE STRAINS, STIRRUP STRAINS, DEPTH INCREASE AND CRACKING PATTERNS
Diagonal Cracking, psi
Series Beam Cone rete Stirrup Depth Cracking strains strains increase patterns
#2
AOO 111 89
A25 112 112 124 112
A A25a 114 114 114 114 A 50 116 112 122 122 A50a 114 114 114 114 A75 110 110 116 110 #1
BOO 89 100 B B25 93 93 114 104
B50 98 98 131 98
coo 96 73
c C25 114 115 115 114
C50 115 115 115 115
C75 116 116 116 94
* From Ref. (6)
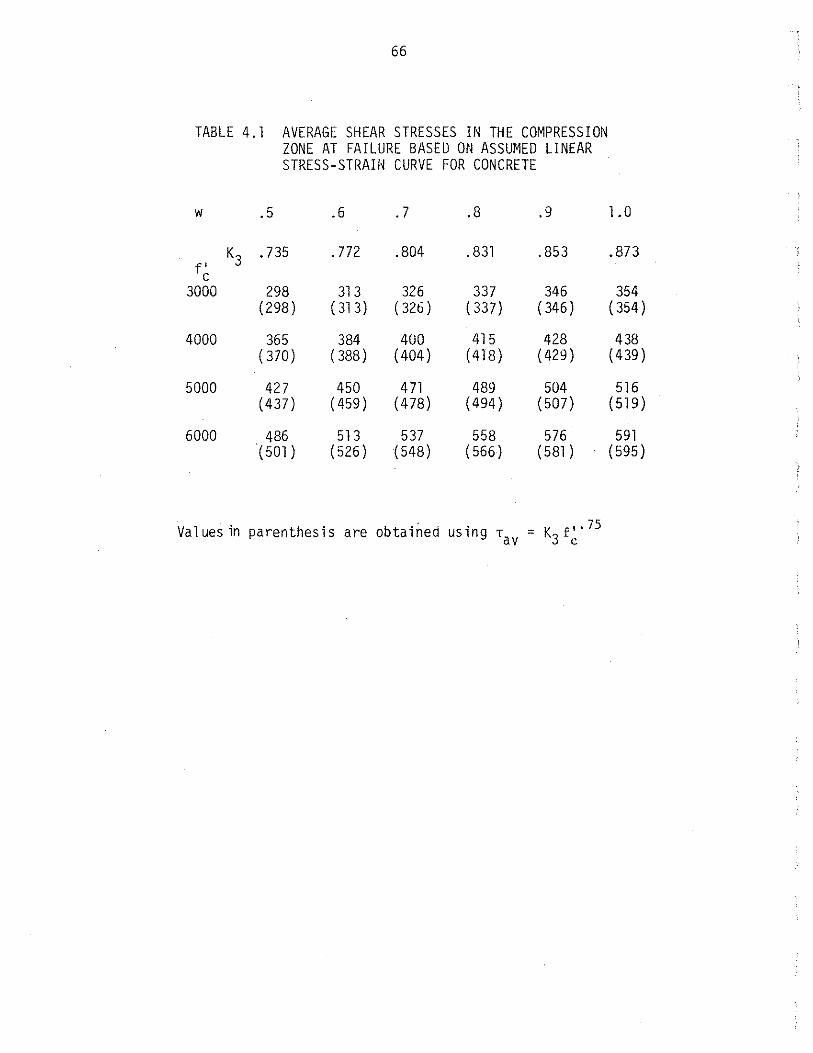
66
TABLE 4.1 AVERAGE SHEAR STRESSES IN THE COMPRESSION ZONE AT FAILURE BASED ON ASSUMED LINEAR STRESS-STRAIN CURVE FOR CONCRETE
w .5 .6 . 7 .8 .9 1.0
K3 . 735 .772 .804 . 831 .853 .873 f' c
3000 298 313 326 337 346 354 (298) ( 313) ( 326) ( 337) ( 346) ( 354)
4000 365 384 400 415 428 438 ( 370) (388) (404) (418) ( 429) ( 439)
5000 427 450 471 489 504 516 (437) (459) ( 478) (494) (507) (519)
6000 486 513 537 558 576 591 ( 501) (526) (548) (566) ( 581 ) (595)
Values in parenthesis are obtained using Tav = K3 f~ · 75
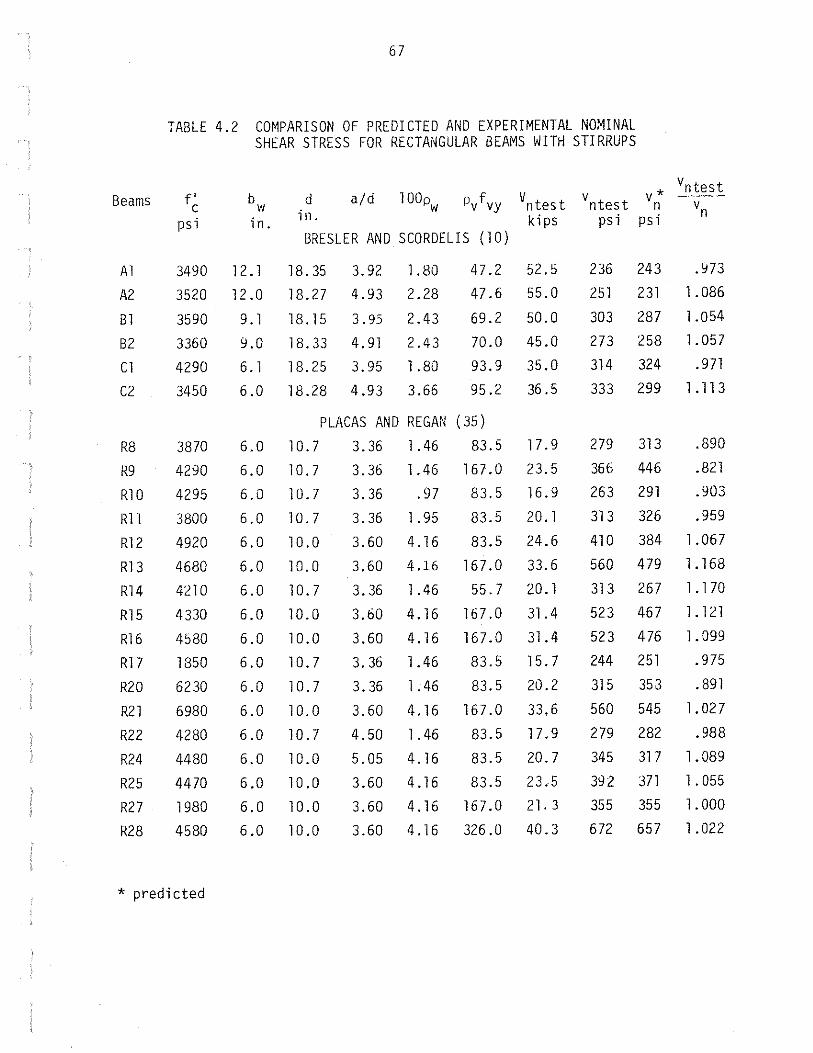
67
TABLE 4.2 CDr~PARISON OF PREDICTED AND EXPERIMENTAL NOMINAL SHEAR STRESS FOR RECTANGULAR BEAMS WITH STIRRUPS
Beams f' bw d a/d 100pw Pvf vy vntest v* vntest
v c ill .
ntest n vn psi in. kips psi psi
BRESLER AND SCORDELIS (10)
A1 3490 12.1 18.35 3.92 1.80 47.2 52.5 236 243 .':173
A2 3520 12.0 18.27 4.93 2.28 47.6 55.0 251 231 1. 086
81 3590 9. 1 18. 15 3. 95 2.43 69.2 50.0 303 287 1 .054
B2 3360 9.0 18.33 4. 91 2.43 70.0 45.0 273 258 1.057
C1 4290 6. 1 18.25 3.95 1.80 93.9 35.0 314 324 . 971
C2 3450 6.0 18.28 4.93 3.66 95.2 36.5 333 299 1.113
PLACAS AND REGAN ( 35)
R8 3870 6.0 10.7 3.36 1.46 83.5 17.9 279 313 .890
R9 4290 6.0 10.7 3.36 1.46 167.0 23.5 366 446 .821
R10 4295 6.0 10.7 3. 36 .97 83.5 16.9 263 291 .903
Rll 3800 6.0 10.7 3.36 l. 95 83.5 20.1 313 326 .959
R12 4920 6.0 10.0 3.60 4.16 83.5 24.6 410 384 1.067
R13 4680 6.0 10.0 3.60 4.16 167.0 33.6 560 479 1 . 168
R14 4210 6.0 10.7 3.36 1.46 55.7 20.1 313 267 1 . 170
R15 4330 6.0 10.0 3.60 4.16 167.0 31.4 523 467 1.121
R16 4580 6.0 10.0 3.60 4.16 16 7. 0 31.4 523 476 1. 099
R17 1850 6.0 10.7 3. 36 1.46 83.5 15.7 244 251 . 975
R20 6230 6.0 10.7 3. 36 1.46 83.5 20.2 315 353 . 891
R21 6980 6.0 10.0 3.60 4.16 167.0 33.6 560 545 l. 027
R22 4280 6.0 10.7 4.50 1.46 83.5 17.9 279 282 . 988
R24 4480 6.0 10.0 5.05 4.16 83.5 20.7 345 31 7 1. 089
R25 4470 6.0 10.0 3.60 4.16 83.5 23.5 392 371 1. 055
R27 1980 6.0 10.0 3.60 4.16 167.0 21. 3 355 355 1.000
R28 4580 6.0 10.0 3.60 4.16 326.0 40.3 672 657 1 .022
* predicted

68
TABLE 4.2 (continued)
KREFELD AND THURSTON (24)
26-1 5820 10.0 17.94 4. 01 2.22 79,0 46.5 259 343 . 756
29a-1 5630 10.0 17.94 4. 01 2.22 53.0 35.9 200 299 .670
29b-1 5460 10.0 17.94 4.01 2.22 53.0 36.0 201 298 .674
29a-2 5390 10.0 17.94 4. 01 2.22 62.0 48.7 271 311 .873
29b-2 6000 10.0 17.94 4.01 2.22 62.0 45.5 254 321 .789
29c-2 3500 10.0 17.94 4.01 2.22 62.0 36.3 202 268 . 755
29d-2 4410 10.0 17.94 4.01 2.22 62.0 37. 1 207 292 .708
29e-2 7030 10.0 17.94 4.01 2.22 62.0 46.4 259 340 . 761
29-3 4970 10.0 17.94 4. 01 2.22 40.0 43.3 223 266 .837

69
TABLE 4.3 COMPARISON OF PREDICTED AND EXPERIMENTAL NOMINAL SHEAR STRESS FOR T -i3EAf.1S WITH STIRRUPS
Beams f' bw d a/d 100pw Pv fvy V ntes t v* vntest
c v ntes t n v psi in. in. kips psi psi n
AUTHOR
A25 4720 7.5 15.38 3.96 .663 31.8 19.275 167 189 .885
A25a 4790 7.5 15.26 4.00 .668 31.8 20.772 181 183 . 991
A50 3810 7.5 15.42 3.96 .661 74.0 25.954 224 247 .907
A50a 4060 7.5 15.49 3.94 .658 75.0 24.660 212 248 .855
A75 4670 7.5 15.56 3. 92 .655 97.0 31.966 274 295 .928
#1 5520 7.5 14.60 4.18 .699 106.0 31 . 275 285 321 .888
B25 4470 7.5 15.52 3.93 .494 32.4 17.670 152 174 .872
850 4390 7.5 15.39 3.96 .498 76.2 24.05 208 247 .844
C25 4100 7.5 15.33 3. 98 .948 32.4 18.650 162 199 .813
C50 4300 7.5 15.47 3.94 . 939 76.2 30.150 260 270 .963
C75 4260 7.5 15.57 3.92 .933 103.0 31.020 266 313 .847
HADDADIN,HONG AND MATTOCK (17)
B3 4000 7.0 15.00 3.37 3.81 210.0 61.0 581 519 l. 118
C2 4027 7.0 15.00 4.25 3. 81 95.0 39.0 371 338 1.099
C3 3500 7.0 15.00 4.25 3.81 210.0 58.5 577 448 1.245
03 4244 7.0 15.00 6.00 3.81 210.0 54.2 516 424 1 . 218
C4 3730 7.0 15.0 4.25 3. 81 393.0 69.8 665 552 1.020
* predicted
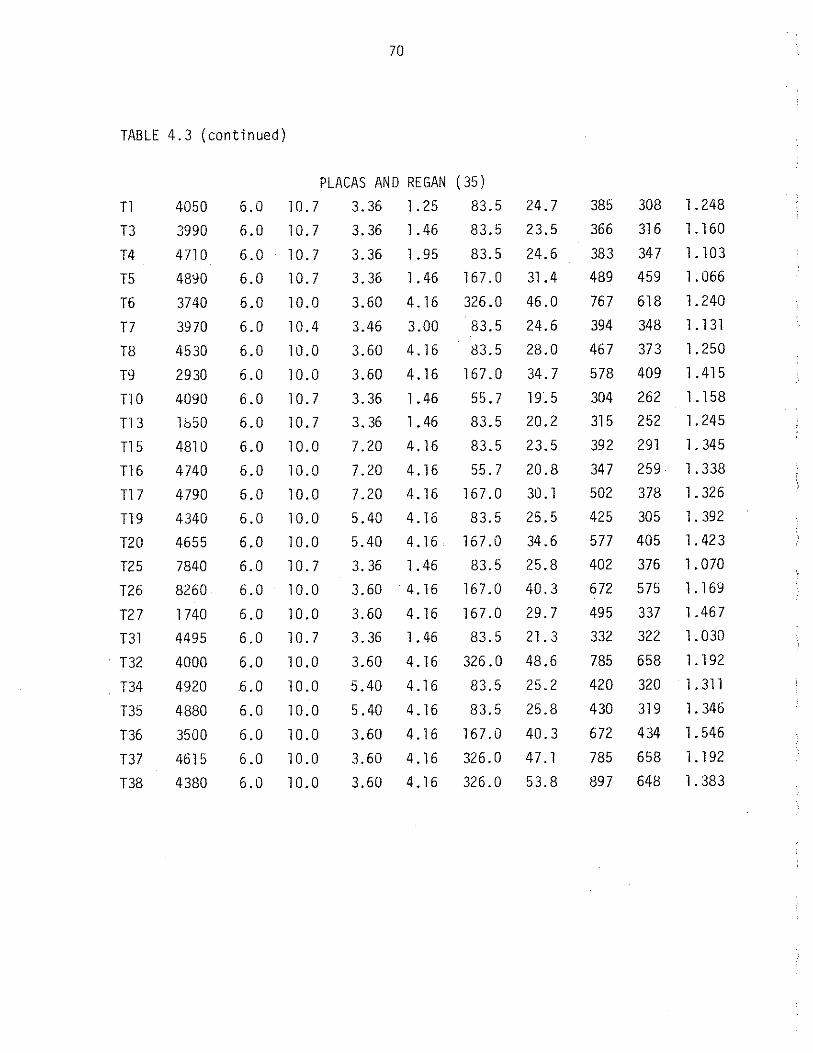
70
TABLE 4.3 (continued)
PLACAS AND REGAN ( 35)
T1 4050 6.0 10.7 3.36 l. 25 83.5 24.7 385 308 1.248
T3 3990 6.0 10.7 3. 36 1.46 83.5 23.5 366 316 1.160
T4 4710 6.0 10.7 3.36 l. 95 83.5 24.6 383 347 1. 103
T5 4890 6.0 10.7 3.36 l. 46 167.0 31.4 489 459 1.066
T6 3740 6.0 10.0 3.60 4. 16 326.0 46.0 767 618 1.240
T7 3970 6.0 10.4 3.46 3.00 83.5 24.6 394 348 l. 131
T8 4530 6.0 10.0 3.60 4.16 83.5 28.0 467 373 1. 250
T9 2930 6.0 10.0 3.60 4.16 167.0 34.7 578 409 1 .415
T10 4090 6.0 10.7 3.36 1.46 55.7 19.5 304 262 1 . 158
T13 1b50 6.0 10.7 3. 36 1.46 83.5 20.2 315 252 1. 245
T15 4810 6.0 10.0 7.20 4.16 83.5 23.5 392 291 1. 345
T16 4740 6.0 10.0 7.20 4.16 55.7 20.8 347 259 1. 338
T17 4790 6.0 10.0 7.20 4.16 167.0 30.1 502 378 1. 326
T19 4340 6.0 10.0 5.40 4.16 83.5 25.5 425 305 1. 392
T20 4655 6.0 10.0 5.40 4.16 167.0 34.6 577 405 l. 423
T25 7840 6.0 10.7 3. 36 l. 46 83.5 25.8 402 376 1.070
T26 8260 6.0 10.0 3.60 . 4.16 167.0 40.3 672 575 1. 169
T27 1740 6.0 10.0 3.60 4.16 167.0 29.7 495 337 1 . 46 7
T31 4495 6.0 10.7 3.36 1.46 83.5 21.3 332 322 1. 030
. T32 4000 6.0 10.0 3.60 4.16 326.0 48.6 785 658 1. 192
T34 4920 6.0 10.0 5.40 4.16 83.5 25.2 420 320 1.311
T35 4880 6.0 10.0 5.40 4.16 83.5 25.8 430 319 1. 346
T36 3500 6.0 10.0 3.60 4.16 167.0 40.3 672 434 1.546
T37 4615 6.0 10.0 3.60 4.16 326.0 47.1 785 658 1. 192
T38 4380 6.0 10.0 3.60 4. 16 326.0 53.8 897 648 1. 383

V1 OJ '-
"' c 1... OJ +-'
71
c:"'---f--f---:L--:-+---l applied
CJ'l-o 01 shear 4-- 1,/)
fOCQJC OCl. <l.J $.... .,.... c: •r- ~ $..... :J ..:::.::. .,.... ...!::.:::: "'0 s.... :::'i xu..-u .---5.--a.; ct1 u ro Q.l ·.-- ·.--
..-- $.... c $.... .,.... +..l fO 4-- u .,.... u ~ lll 4-
dowel splitting
loss of interface shear transfer
Figure 1.1 Distribution of Internal Shears on Beams with Stirrups (3).
crack
01 Figure 1 . 2
relative displacement of A-A from B-B
Shear Compression t~odel.

a. before cracking
b. supported arch before cracking
c. hanging arch before cracking
d. hanging after cracking
arch
Figure 1.3
72
Internal Arches in a Reinforced Concrete Beam (22).
heat a
Figure 1.4 Diagonal Compression Field l~odel (16).

31-511 6 l -71!
((_ sup port Ji4 bars 4 gage wire ;;3 bars
-~ l oad,--j 18 11
~ ,/ + 4 gage wire -: \• ! I
stirrups \ I I
strands ,, 11. !!
vlire stirrup~/'1] qaqe wire
v- spacers Y5~!! 2 @ 12" 1 Q~H 8 @ 7" 1 1 -9 1.t
Half Beam Elevation
Beams with Stirrups
31-511 6 I -711
tl support IL load 18" rr4 bars ~3 bars \. ¥"] l
4 gage wire I
st1rrups '
strands
jil:?'t 2 @ 12"
~~ll gage wire 1 ~II spacers
10"" v 6 1 -5!.:: 11 1
Half Beam Elevation
Beams without Stirrups
Figure 2.1 Beam Details
d*
I
d*
I
24" t 8'•" ," ?J2" ·r 8!~," l __ _.,. l .... :.. · ·. · •: I
;;4 bars wire
stirrups
. I>
* See Table 2.3
strands
Section at Shear Span
24"
8Ll! "4
7'7_11 81 !! '4
. 0. o·
U4
strands
* See Table 2.3 Section at Shear Span
""'"
""'"
' ""'"
' ""'" ~
.._. w
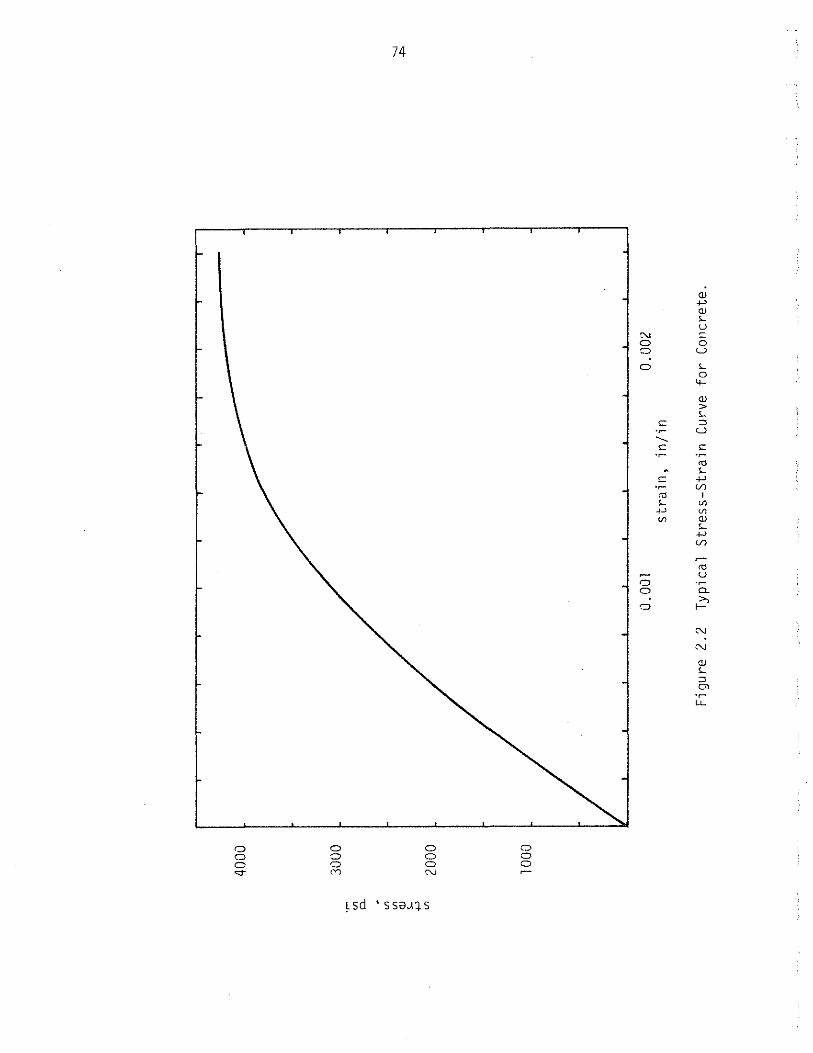
0 0 0
"'"
74
0 0 0 N
0 0 0
N 0 ::::>
0
0 0
Q
<:: ·~ --.... ;:: ·~
s::: ·~
"' '-·~ V1
<J) +-> <J)
'-u
0 u
'-0 4-
<J)
> '-::l
u ;:: ·~
"' '-+-> VJ
I V1 V1 <J)
'-+-> Vl
"' u ·~ Q_
>, I-
N
"" <J)
'-::l
"' ·~ LL

~~.,E :·;,;. :;•, '.!' .·~:·, ::~·-.:• • • .,; :. :.:~ "" '" ·-
fo';0067"fl f:O'Jffi:im:[ki?ffiTj.f I Iii ~, n ljl '!I 'II! 1' t II ·r·rrnml i 1fTflli'i 1'11TT!T mTT 1
, I !i, St'""•F H•v~u:s,t nnu, rL[' iii 1/ !JJi !if HII lq I I' ljl !ifllil till I!JU,,I!, Ill ::jl 1''11':1 i j , ; j 11 ' 1 Ree~- No
1, tJ:t' RMAA ' II, »>>t ~1,1; IT II[ f I 1 I '!' 1 i f If I fl 1 I 1 1 ~~ I I' j 11' I
,'' 1\ II I r.h~rdc'•1\ ~rr 1 r'.'~·' 1 [I I i IJ I : 1' i! l I i , W : II 111 i 1' I · 1 1 1 '1 :! +1 li ~rl ~4wi·T Ttltt~,r~ltwitt ,' m l~t ~h! I ~· ti I·~ 1,:~ t~tl'r": u I, 11 l t,l ui.JI .l rli'i tnrr',i 11 lT! [ rtl ! ! r n jl ! 'I j i I !I ~ i ~-,u:,,r~uMi !ren;'n>i s •r• 1tN r ,,:r, ' ' Qb•l +I I U!Ulll' 'i ' ['I I j '11. [' ' I ' I
. ,:: rl i Ul,tjtml.t ~lon1 ~;.~ lti.!r'~ii'l\'h," 1 I' 11 / J l11 1 , t•j lj'l I[' 'I l 1)111 r
1 ~1-0oo HOd J.ll .. ~ 1LE at~ '~llr4d.:,1111n • :r:s 1 • _ l' 1
1 tr l-4 11
+ 1
1 '--i
I I '1""'~'1'~ Ar,Jin n I •I 'c·l ~"·I 'I ilr, jll : i I i IlK .I~ '!rrM!:: II lrllftlft •i·ll 1f:.l 11 q!~ Lnngtho(l:a· ,•i6 SS I 1\• tl1che.s. Hili b' 1 1 ,11 1 I 1 11 ! 1 1 1 !, , !•
1' 1
0 <l<ID-4 1-l'~ilmc e.~op<c ' I" Jtf j·HH I'" I !-+• I ,- !i .. - "- + ~rr-HI !" .. -j 1
1
,' 1 ! Ka 1 ~a's: -r;tV1,
1 ~~s1so 1
t,r;, I I I 1 I I II '1111 Jl, '!\ 'I II 1 , 1 I'J! / 1 1' • 1 j II 1 I 'II ) 1 IiI' I• ! 1 1 i t r 1 (I I 1 1
J 1 : I 1 I II I : ' I I I ' 1 : 1 I i 1 ' I
g;_ gJI.1 1t~t~\~~~~m n,li ~t1 rill ru 11 r .fr [~lilli X!! HI: li~"~ r!1 j 1~~11r !l\!1l:~J :<. tliWtfl ~w1mtfll~~1ft 111 'i,h''j 1111 11 ljr~'1flr~1 tj1f' hj :1 it 1r 1 1ll~llt!TI liH1
f1r!l
-g b~~Ww v rill ! I I II r I ' !! +L j I ~ - ~~f UlJ.HlHH~~ ~!i ~ ill 1 II i I I . 1
1 II! I' I' 1'/ I I llrl '/rr 11:' 1' lfJ I ji
:rir 111f 1 J~ I 1~11· 11 -l 'I l ~n -~ 1~ r J - ~im !11 irl!trlriil w ~rl] rm~~'lllllr'il!~:ij11~t1_~j--1 ·-iJ 111 j'·,,dJI I _·t~WHVItjV~JI'H'l tf'Jifl 'Ill I . ·- IIIIi . ll - n _. Ill I] - - rId !lid ,ll I il I- II~ ~.hi· ' ·: 1~'-1_ 11--f li i•l- t I. 11-~JI_!:ril _j' i.J.r!,_r :_~I - J - - : ' f j t - - ' -liLt' . r f [( 'I\ .-- .. . -- -. - - _-_- ·l ~r- I- - ·r -- -- ~- -- -t'll ~~~~ -~--- ' j-:·· I I · - • - J -- - - ' '·1! ~-,-, ,1. -- z ,.. t I-tt-. 1- ··-t+ rr::f!l I 111 ·~ 1 1, _I_ - -__ _-
1 fjllllJfi .1J ~n1'r ;m 11 -- tt. r1, __ , ·j1 · -- L 1-· · 1 - 1• lll)j,!fr. Jrlj11 _ .. jl! '"' ' 'r-1 1 I i Ul 11 , I J: 1 ' 11 · .• ,II! . 11 · · , , ,
strain, in/in
Figure 2.3 Load-Strain Curve, 7/lo.inch Diameter Strand.
•
'-J tJ,
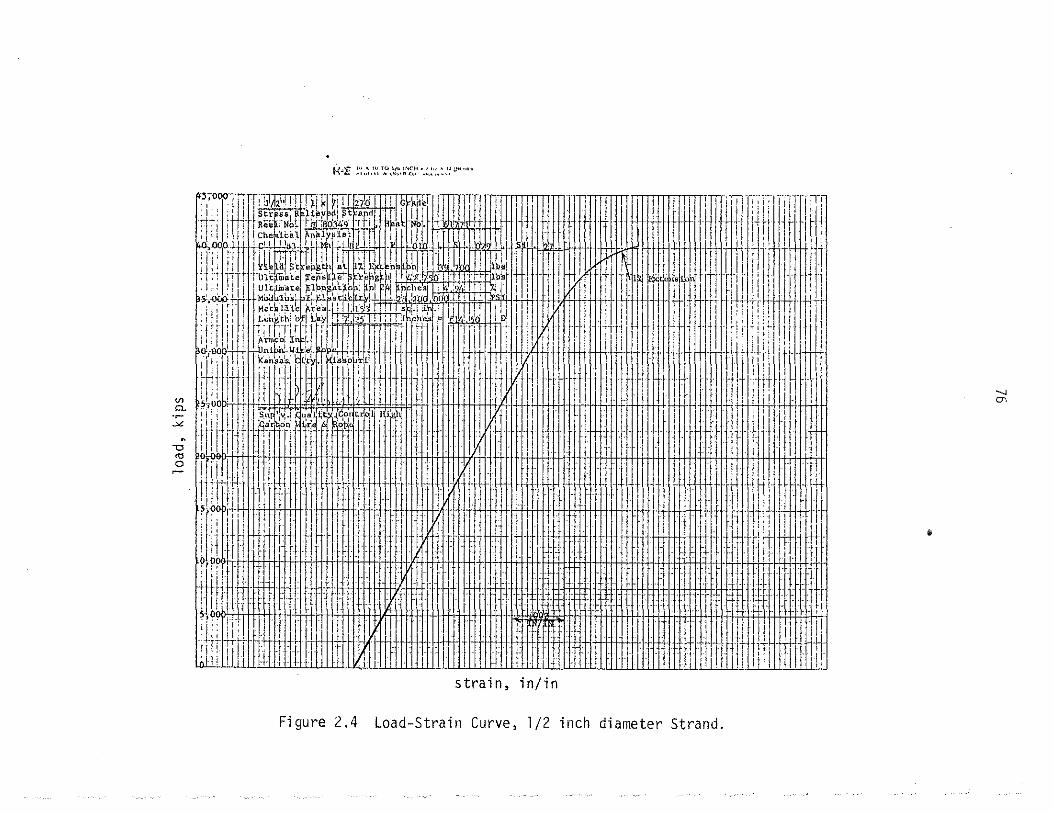
1-<~E !'; .~::·, t,? ,";;~.~"i~ ·.:":·:. ::~ ~~< .. •~
. j ,~0""Tfi I'
1VI21
' !! fill~ DO" I ! ! I Gr~~·~l~~ m II II I~ ' r: ' 'iT T:F TI1T 1-n-1 I I I • ~tr ss R li~v I ?t ·p. d' r ; Ill I j 'I I: I I I
w_ I :~~ f.ee ·uk Fhi' !:~ •• . , ~~ h"~Hiol~ l ' t t I j . -j . . . . I 4 _ii ·t 1 r l + ; r I I •ttt' II I Che 'ico1J ~pal '"i '1111 I mill It ~~-~ I I I II I H' II I 1
11 I _QOQ.IIiii11H-3I.U IL.lll!J' 011 I 4 1 rl-1·• .
~~ ;1 if,,~l~~~ 1frt [Tr niJ I mrJr R~~·· 11.1 11 ,,n·!f1 I! · _ · .t If 11- m1, I,TJ Tj fJ 1 1 1 , I lli ii St ep.B,t t Jtt f{tf nS n . , 1 §, I 1 II ,
1 1
-1 •... I '4
1 t ''\11 ,-· ··" ' + Ll" ,'e1 cr '' ' T " ' r ' l . I~ -~~ 'I' ,- '''" I ·I j' -~ IJ_.I r_ 1+-r. j. l 'I '~'fl •tt'mate"ep:;;re .~:er-S.1tt'i :x O• ... :s, l:ti! ,~·sfuY I q 1 ·~ 1 ; , 111 , "''""''" p~>·~·~~· : ~·~ tlm "''I , 1 ~ 1 , •1 1 'I 11 1 ~U _ 1 , 1 1 1 1 1 s~.-{100+ 1>t~h'lhs' L)!.l SF;ib ' ! I I 12 !:wd 00 'J_ • - -1- ~ I - II -~~ ~- +H+ . ~n , 1: • ~1 i ~··~,,;~b ~, • .r , , ~.~! _ ... 1 ''-~ ·I 1 1 • , • , , 1 1
1 x 1 1 1 1
1 , : : ' : : t 1.1 1
1 1 , , , ' 1 l.en th o 1 L~YI" , . •s , 1 1 ,che.s 1F1 .i•M 1 D! I I . 1 , I 1 , I i , : 1 I I ,_,,,,, 1
1,,rf,,:r ~ 1 1 -
111![" 1 . r 11 -~, ~~~~~ ~m 1 ·ir! 1
rj 'I ' __ :_'rl'_':~-_'. 1 ~1 1 ~~1 '"I' '"·r•l II 'llllll I 1'1111 I]Jljll' Ill' I llill,.,.,.,l , d~b~--rt+mf~::Lu;_: I I . I I f ' ' mfi' ' . it\.1 i HI llill !Iii;:: ' I.
~41 j~lli{1'f11i,Itl ff~r i~u~l'j ~~~~~~ lj r ~~·~~~~ f1
1 ttt~~~- , lj I -- 1 dl}_ 1~-~~--1!1~f 1 Hlf 11:1
' W Vl r!l!l ,II! Ill II r -lld,u I ' IIi' I II 11 1 I . :jjl,, m' 0... · ~J~Q ,- bf+ 1 • - ; I -·: I -~ I 1 , , [TfT , '" -,~. 1 . ·.~ , ::~~· t . ~ , v: 1 1 I' q 1 1
, r ~ ij11
1 'r'it_ +_q·l'o 1°11' 'r, "r rnl i - I 1 I H 1\1 .. _-- I, i f +_ j_f __ - -~rif !* ~ 'Jll, 1 tJi, ill I 1 llr1 I · - - , J I It Jill ll , :::. '['' 11!!1 I+ 1!1 II . ,' :111 . . . . I! I! 1!11 . !I_ . :I ' . I I ' I' I I . ' ' I. ., II l111wl \[' il-filj- . t'" H -r - ·\· . - .. . ..... I ' e• f·cH IH: t f it
'I r' Lhl: I I' 1 I ·I· I: . I_ . I It I' . . 11 111 __ ,_- II . ·r S"{)Oym'.t r t+ ·- , r- -~~I: ·r _
1·-rr·· :t" !f 11~-1 l !'' 'I I I t I LTI n_l: I I I : I ' j - I I • . . I 1--.' '!'. • j +-:~ ; ' H . . . . . ' ' . . I . . . - .. . . . u j-L! ' I I tL ! ll_f- . I . rl . [ .· 11 . . L t . I 1- . . . 1 [ . - . . . t . ·ffil'·j'. 11 rn t_rl O~f- Iii .... I. . .. 1-1 ....... ,1,11
~·:, rr _ I _ . I • _ _ _ _ _ _ • _ ,_ _I , ·r· _ ~~
+'I _I_- - __ 1 : __ · ._ -- t 1_ -- . _ :
. h f __ · _ __ · l _ -1- --_ - ft - -- --- -----, _ --- -- -_ -1 r I j If I : : ' • !·I . . - . - . ' . . . - ' .. . ,-r. _· . .. I
:?'!:/ - _- , ft 1: I r I " I I . , I -- I i 'j;~H~u n·rr :tltl Ht 1-j . -I - -I - -_ 't -IJ t-~- , ! -l+f r lj: I I II ., .. I :1-J IT w· 'V'_,I . :. . II . : . II M! il' 1 ! I Ttl t Ill f\11~ !Ill 1·· ·tl -lli - .1 ;t 1- J - ll L 1H. !d I '1 f I U.''
strain, in/in
Figure 2.4 Load-Strain Curve, l/2 inch diameter Strand.
•
"" "'

Vl a.
•r- k,;:.;~:,::.,::.;.:... -"' =--a r=...-~--25 -·-+ -
- ~ r;-~-::;;;:t:;: ~ [---t
=
77
Of -+
=-+I~
=r=----:-+- --+--+ -1
'-'::-/= 1---, . ·- -::±=::= ,..:::= -- t -== ff
1----1 ::::±=7:;
L
--~ --+-- ' . ~ l-----i
IN/ill __ r:::......___,_ ' i
::J- _J ........1.- '-t-· -----!--
·-t
strain, in/in
I i
·~
~----'
' • f- -~== --f-- : 1---,--
-"i+;---
' ~- L
·"---t- ---! ... '-..L....:.-
Figure 2.5 Load-strain curve, 0.6 inch Diameter Strand.

·~
0 II
-o
c
78
c ·~
N M
0 M
;s~ 'ssa .. q.s
0 N
t ·~
N 0 0
0
0
"' "-·~ ::< ..c: +' 0 0 E
(/)
"-0 4-
"' 0:: <J)
> ...._ "-c ::l '-' c
0:: ·~ "' "' "-"- +' <-' (/)
"' I
"' "' "' "-·>-' (/)
'.0
N
<J)
"-::l Ol ·~ lL.
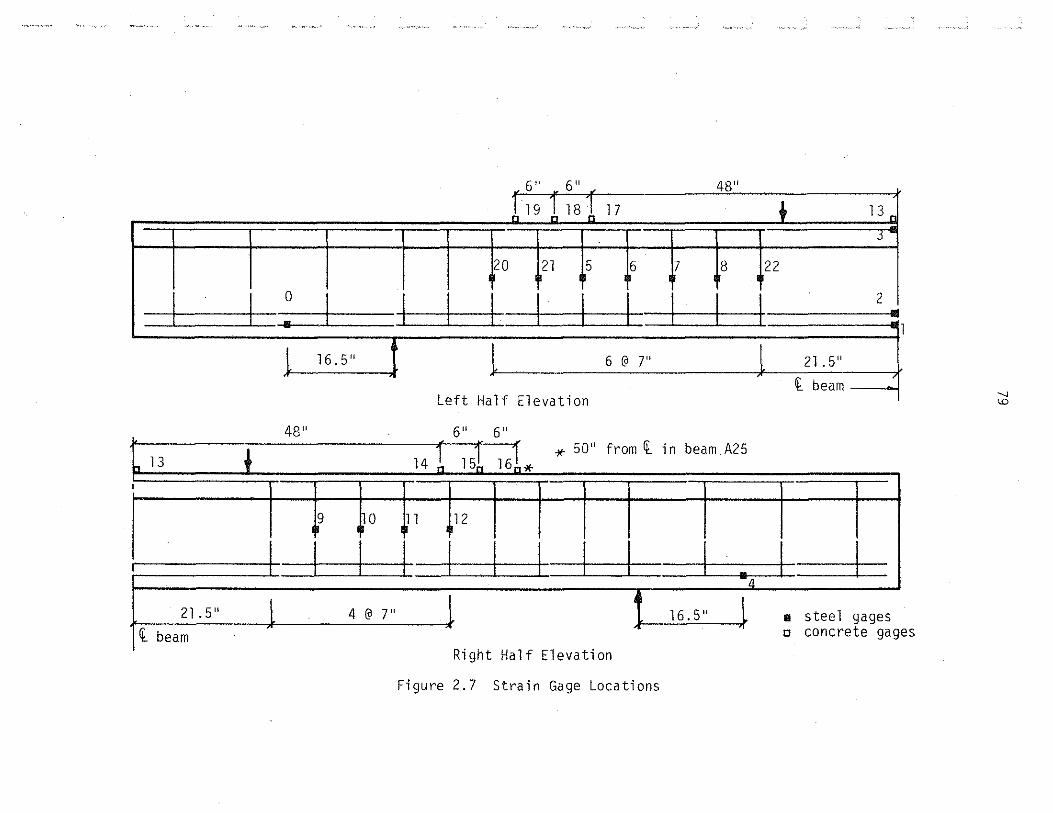
I I 0
I •
l 16.5"
48"
13 + I
9 0
l I I I
21 . 5" l 4 @ 7" ll beam
6 11 6 11
rl9!18,Il7 48" ~u
20 21 5 6 7 8
I I I I I I I I i 6 @ 7"
Left Half Elevat1on
611 6!1
14 1 151 l6L _,. 50" from 4c in beam. A25
11 12
I I I I I I I 114
16.5" l ,,
Right Half Elevat1on
Figure 2.7 Strain Gage Locations
22
I l >
~ 13 r
j
2
21 . 5"
ll beam '
I I 11 steel gages - ~ .... ~ ..... ~ .... •- ---es
'-J <D
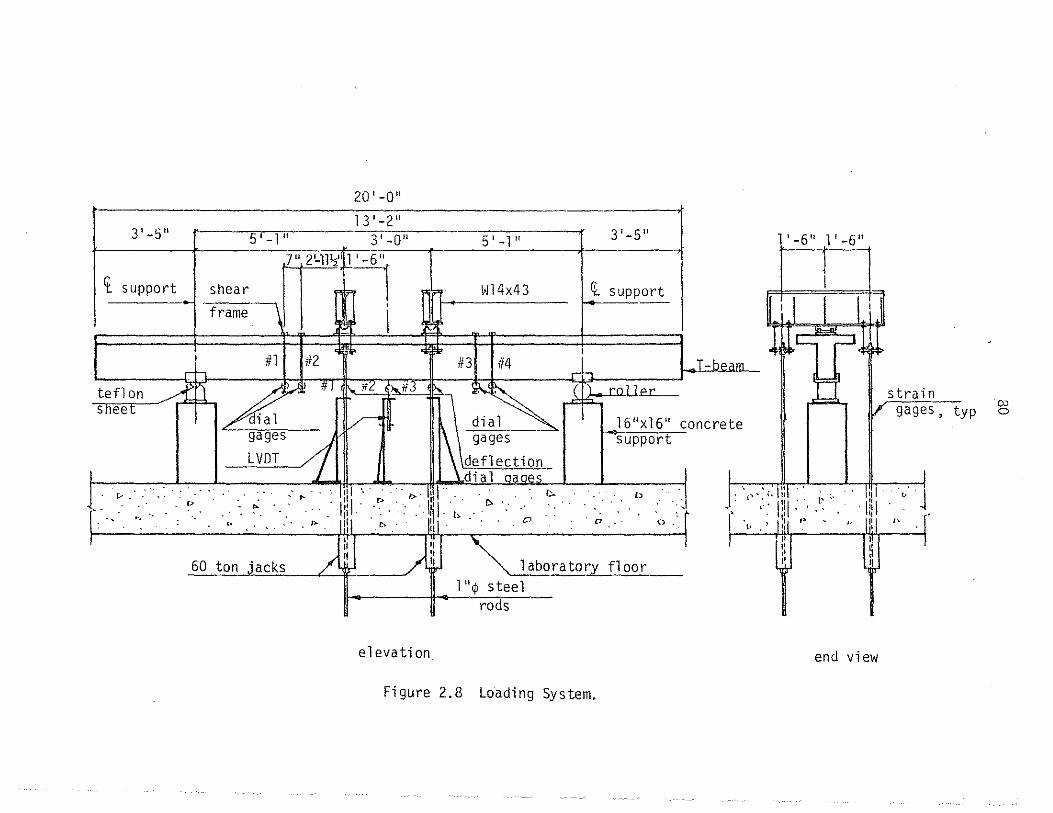
20'-0"
13' -2" 3'-:JII 5' -1" 3'-0" 5 I -111 3'-5"
t support shear IT'lW:-6·1 , Wl4x43 ~ support
frame ~
#2 ' I
I #1 #3 #4 _T -hPilm r• r ..,
teflon /"fj ~~::.< 111 ;;! ;.lf3 P>- \ ~~ ().roller._
sneet ial V: dial 16"xl6" concrete gages 1_ ~ gages support LVDT \deflection
1 '-6" 1 '-6" 1'----,r---
strain gages, typ
_ _ _ _ _ _ _ _ _ _ _ _ _ 10
__ o- , I _ di a 1 oaoes c. , [':-: r..- . . . _ . ~ "' . 1ll t:>- ( r> · · · · · · ' '1"1 1''1 '. ,: ;·r , :. 11-
l"j ,, 1"1 ,_ -J
p . 1>- • • II , • . II , , • . . '
--- ·- ·- - --- - - - -- - Ill . - Ill h - - - - - - - - ~ • . ; . t• • . . . . I> . - ll t~ :, . CJ CJ . 0 . tr
/t II~ II 11
60 ton j_acks _L_ / 1 1 aboratory floor 1 "cp s tee 1
rods
elevation
Figure 2. 8 Loading System.
,, • ' lt t' !j ,,:j f3 ,_. !!: I t>
]I I' ,, I'
,, :, II
end view
():) 0

l--~~-~--:-~c~~~~~=-~ .. J.~ ·u~r=~":z~':'c;;_~, ·.-.cc ·=-::c:· =·=--= =;:-:.:cc.::-=-:·:.;:-·.-_,---= ·1
I r !S tor .. ' 7 "' IC 10}- p\ '" •$• ?• . : I . . ) -~"~")l!),\-;,1·"1·-;,t,.,.--~~~--,,, . I l -~ 1 ' • . ' t:~ T 1 '·~ I rL _ \ ;o H!t-.- ~r. \ _ , . : ! .
it:.; J: l:i::-\ -1':1!1-"-= J, J::'.-,- L ul:= ~-=t 'tl :c\ -- ~- · -' ;.;:!..;;-:.= :.-=~--=--=--:f'O . I . <!!' tCI- ' 10 I ' ' ·-" 2~~ . ' ?'): \ ' • • - - - - - .,, r ~ ··- ·I - " - -~ · . -- -- --i - ~ · -'- -- -
Beam ADO (p = 0.656%, p f = 0 0 psi) w v vy ·
E--------- -----------~ ..=1~-- ·-·--------- ------------~ - • - - ~ "l -:!~ .1!_1 J.f> ~ 2'5 r ,l; ;;!l , ...1....: - ;or: i::$- r· -~ -- -- .
';;: .r-~ <'c \ ~o -~~~1'.11 - 2o~<J:-:-'E"'\- ::oc ;r"\:.,f."·~""'' ' '?7/""':;-~ 1 1! tJ,~~'5 ,• HI I:! riOt'~~ t'E ~! IS t 1!>\' _!!> 26 1
,,.) '.,' ' ,E~• '( t r!l. -o ,r ~1, ltiJ'l h h_ 'If(, I 1
--- f--t t.,.{,- '. I$_- tO I '7 ,- ml ~ ·~, '"'! "·--t,\. l • _ --~r·-- ..:Ll ~ ,ffi±rtfW I LU.:J t , u J _ \ ____ -vr---~ Beam A25 (p = 0.663%, p f = 31 8 psi) \v v vy ·
[~~~-~:~_:: ~J ~- : -. ~,:_:~
-~_j
£learn A25a (pw = 0.668%, Pvfvy = 31.8 psi)
Figure 2. 9 Crack Patterns for Beams AOO, A25, and A25a.
·' _j __
·.'-] --,-1 ' .l :. I
cc ~

Beam A50 (pw 61 ,, p f = = 0. 6 lo, v vy
_Beam A50a ( pw = 0. 658%, P/ vy =
Beam A75 (pw = 0.6S5%, P/vy =
73.9 psi)
75.0 psi)
97. 1 psi)
-r----;---,-; I T I I
1 I
-~-+-+----~ I T- - ,__ :
I I +-:
,--· l --~--- I-- -i~
I I I I I I -,I I I I I I
~ct--.._::l.->,J-~ = :L:::-. :1:_ ::.: L
Figure 2.10 Crack Patterns for Beams A50, A50a, ana A75.
00 N

- -- - -~------- - ,-J~---- ----------- --------- -- -
l ~:::- ~=::::-==: -=-~--=---=:.=-..=-...::-- -f!i:-"tJ:; /'i;~o!,i(;?;;~~ :o 1If;~~~-:(_~o-1~-, 2~\1~ ·~~0 ~ - -;- -- -- --:.--=._:__. I ' j" /, ! t' " . I ~ ' ' ~ -- -'-- _; __ ~ - -- ~._ --- _¢1 y- -\.--+ L- '- -..(::: :T -,- ---!_ = =::.:: = == ~ ------=--.::::::.::....,:_; -=- --:: ___ 1---::1:-- -_:±:. _L--:: _ _t-_--:t·-:±- i- _:-~"7 " 7"\. \ -l...,l.:z:r - - ------
Beam BOO ( p = 0. 488::;, p f = 0. 0 psi ) w v vy
~---~-=-~ -=~.-- ~i:-=~-~r;~m:· :~ ·-=±:· ;~; ,~L_rJ' ~ ~}--~~.~+--,-,~ ---J;c-L~c: ~~2-'"-z;,,1·' -=-• '" . - . -. 1· ; ___ J __ l ,,; '"·r II" , -=r" - - - - - .. ..r .- - - .~.:: ·c l':.J --="- __ 1'-----Jr;;· - --
Beam B25 (pw = 0.494%, Pvfvy = 32.4 psi)
[
______ =.l.,_ _______ ,,J, ------- !"- -, '?"1-~lf_fi 1 .!I', i1__.LCJ . I J:. 14 ,.;. .- 1'1 /'
• ~,_, ... ~ ;j< ! l4 9 q ' q 9 9 .. ,;-. I 1' ~j<!:!"e;:;- /I ~-, _ '40 Jl j < I
- :l· - - ·- ' ....... - .•• t --;; - ' 11' --·· -·. -~·-.:..L:,: I --
Beam BoO (p = 0.498%, 0 f = 76 2 psi) w v vy ·
Figure 2.11 Crack Pattern for Beams BOO, 825, and B50.
00 w

~ ,-, '" '=,--,~--- c -•- _ 'C c~"L~-:':_~c.:_ __ -- -- ----~0-_, =- = "'1'--=-=--_::--::,._ --;- fj-_ , ~6 '" 16{ n .,.2' 1 11 If> 16\l,~' !'~ 11 1 • , ' ~/f.:>--; PI !I> II q rt.\39! /1 \f> ''\ . I l
-- - ::-:: :--- -~- -- - /_'" :?7, 'L 'h_]~r '·I~ l_ l-1-+ .. _.., ~~- "=~ - -- -l - ~-- -- _,_ • -"-'lf\,16 1!1 ,r, ?1, "~ ?6 1 - - -T, _ : -- "'-'---/"'- r· J:J:::lEE _J-- J- ._, -. +- • -!, "'-T" y _ =- :-_ -o _- -
Beam COO (p = 0.943%, p f = 0.0 psi) w v vy
I - _--=---= -----;:-=:_~,;r~-~--=;;,~~r:~',rz ,-; :} ~,~t:·~;~- ~,,:,-~-=-~---:::=---] 2" I /<" ~ 11 1 ~~~~' ' ~: '¥0' ' !" ' q IO_;!J "r.:Z" 10 10 1'5 15~11 I '
: -- - . . -~· " 'Y['"' ,/.'J':- -\:1· _'L \J" ''J ''-- ... J::-. ' ~" I-- , -- : ----- ___ t___ _ J.LI _,L_ d ___ l J _ __ l \. _ _ _ _ _ ~-'I ir-"--
Beam C25 (p = 0.948%, p f = 32.4 psi) w v vy
E-.--- ,-----.--- -- -- ----==-==-- ~-;;· ~ ~--r,.-;-·,- ~~. - --£5 I;>;~/ /''~ !'~"IJJ - ·r ~~ 16 ,5 1$ -f~.; ffi _.;
'2$:? l'~1 '!1'5,,.15
- - .. - .. ...,_- ~ ~ M /() ;> 2§ "' -__ :1__ . --. - ;:?..-o-"?:ir/.11-lt" f:, '"' ;:. --~~--O,.,L.:/C£11A-1L ' - :1 ( \
Beam C50 (pw = 0.9 39%, P f = v vy 76.2 psi)
-- '... - - 1
-JJ-'-" l ~ i 1 - - - I - - --·· L __ --
'T
Figure 2.12 Crack Patterns for Beams COO, C25, and C50.
""' ""

-- - --~ -='= ~-- - --.=-r t=--, l : . ~>nTh 2"' ~o··:;:o! "'"111,.. ) 1 -r=r
, 1 ' ru ,fi~ ~ uu,~l' ;::(!li&f ,,I ,la•r ,. •. j .,;:1;f_ "'{ __ (I A,iJ;:<n,
! I I i I
=' =- ::t = ::!.=- = ±: :t-
Beam C75 (pw = 0.933;s, P/vy = 103.0 psi)
Figure 2.13 Crack Pattern for Beam C75.
00 U'

"' a.
"' . 0.. . "' "' 0 ...J
40
30
20
10
0.0
dial gage
0.5 0.0
;il
I .0 0.5 o.o
n'2
l .5 I .0 0.5
,;3
Deflect ion, in
2.0 1.5 I .0
2.0 I .5
Figure 2. ·14 Load-Deflection Curves, Beam ;;2 (pw = 0.693%, P/vy = 0.0 psi).
2.0
c.~
"'

60
50 "' a. ·-"' . o._
40 "0
"' 0 ....J
30+ I co .....,
dial gages #1/ #2/ rt3
I 20
10
0.0 o.s l .0 l .5 2.0 o.o 0.5 l .0 l .5 2.0
o.o 0.5 1.0 l .5 2.0
Deflect ion, in
Figure 2.15 Load-Deflection Curves, Beam AOO (pw = 0.656%, pvfvy = 0.0 psi).

6
50 "' 0. ·-"" . a.. 40 "0 dial gages~ / ~3 "' / 0 I co
..J co 30
20
10
0.0 o.s I .0 I . 5 2.0 0.0 0.5 I .0 I .5 2.0
0.0 0.5 I .0 1.5 2.0
Deflection, in
Figure 2.16 Load-Deflection Curves, Geam A2b (pw = 0.663%, pvfvy = 31.8% psi).

60
50 "' Q.
"' . "- 40 -o
"' 0
I ...J
30+
00
" dial gages #1 / i/2 / 7#3
I 20
10
0.0 o.s 1 .0 l .5 2.0 0.0 0.5 1.0 1.5 2.0
o.o o.s 1.0 1.5 2.0
Deflection, in
Figure 2. 15 Load-Deflection Curves, Beam AOO (pw = 0.656%, pvfvy = 0.0 psi).

60
50 "' 0. ·-"' . a_
40 . dial gages~ / ii3 " "' / 0 I co
....J
"" 30
20
10
0.0 o.s I .0 l .5 2.0 0.0 0.5 I .0 1.5 2.0
0.0 0.5 1.0 I .5 2.0
Deflection, in
Figure 2.16 Load-Deflection Curves, Beam A2S (pw; 0.663%, pvfvy; 31.8?; psi).

60
50 "' Q_
·-"" . .,z a_
40 . dial gages "0 ;il "' / / ;;3 0
/ ...J I c:o 30 "''
20
10
0.0 0.5 1.0 l .5 2.0 0.0 o.s 1 .0 1.5 2.0
o.o 0.5 1.0 I .5 2.0
De f 1 ec t ion , i n
Figure 2.17 Load-Deflection Curves, Beam A25a (p = 0.66s;;, p f = 31.8 psi) w v vy

'" "-
"" -n..
-o
"' 0 --'
60
50
40
30
20
10
0.0
c.'2
dial gages ;;l :r-r3
0.5 1 .0 1.5 2.0 o.o 0.5 I .0 l .5 2.0
0.0 0.5 l.O 1.5
De f I ec t ion , i n
Figure 2.18 Load-Deflection Curves, Beam A50 (pw = 0.6611;, P/vy = 73.9 psi)
2.0
<0 0
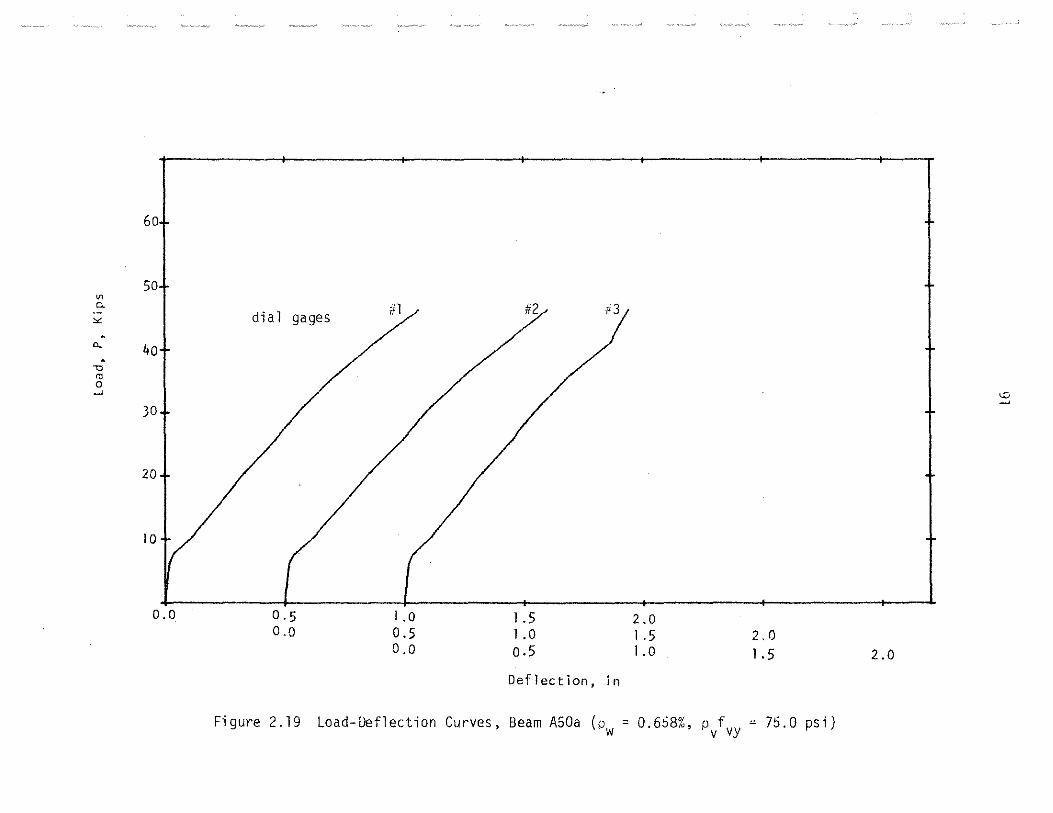
"' c.
"' . a_
-,
"' 0 ....
60
50
40
30
20
10
0.0
dial gages #l #2 id
"" ~
0.5 I .0 I .5 2.0 o.o 0.5 I .0 I .5 2.0
o.o o.5 1.0 1.5 2.0
Deflection, in
Figure 2. 19 Load-Oeflection Curves, Beam A50a (p = 0.6S8%, p f y = 75.0 psi) w v v

60 I
dial gages ill / c2 / k3 I
50 "' 0. ·-"' . 0.. 40 "0
"' 0 -'
30 I / / / I <.C
"'
20
10
0.0 0.5 1.0 I. 5 2.0 0.0 0.5 I .0 1 .5 2.0
o.o 0.5 1.0 1 .5 2.0
Deflection, in
Figure 2.20 Load-Deflection Curves, Beam A75 (pw = 0.655.;, P/vy = 97.1 psi).
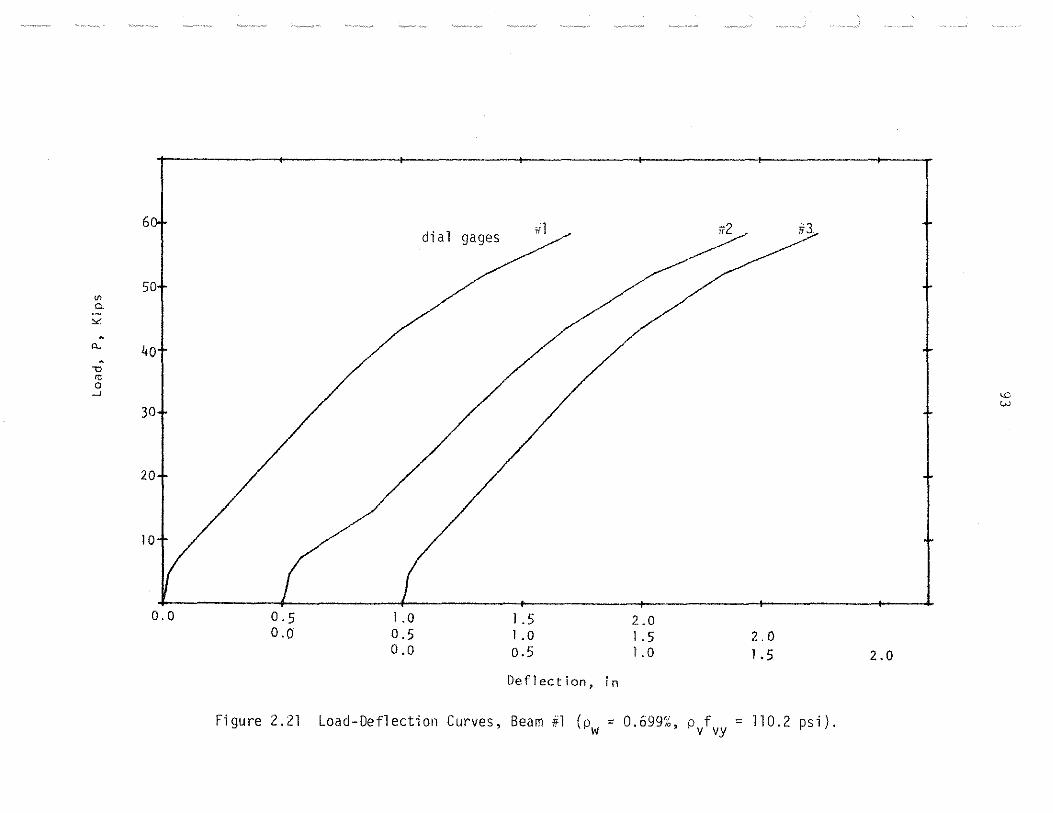
"' c.
"" . "-. " "' 0 ...J
6
50
40
30
20
10
0.0 0.5 o.o
Figure 2.21
di a 1 gages rr1 #2 #3
1 .0 J .5 2.0 0.5 1 .0 1 .5 2.0 0.0 0.5 1 .0 1.5
Def1 ect ion, in
Load-Def1 ecti on Curves, Beam #1 (p = 0.699%, p f = 110.2 psi). w v vy
2.0
<C w

"' ()_
"' . a.. .
-o
"' 0 -'
40
30
20
10
0.0
dial gages #1 '12 ;,'3
0.5 I .0 l .5 2.0 0.0 0.5 l .0 1.5 2,0
0.0 0.5 1.0 I .5
Deflection, in
Figure 2.22 Load-Deflection Curves, Beam BOO (pw = 0.488%, P/vy = 0.0 psi).
2.0
<D
"""

60
50 "' Q.
"" . n. 40
"' "' 0
301 dial gages/ / / -' I "' "'
I / / / 20
10
0.0 0.5 I .0 l .5 2.0 o.o 0.5 I .0 I . 5 2.0
0.0 o.s 1.0 I . 5 2.0
Deflect 'on, in
Figure 2.23 Load-Deflection Curves, Beam 82i (pw = 0.4941;, P/vy = 32.4 psi).

60
50 "' I ii2 CL ·-"' . "- 40 '0 dial gages ~1 ./ il3 "' ' 0
/ --' / / I "' C'· 30
20
10
0.0 0.5 I .0 l.5 2.0 0.0 0.5 I .0 1.5 2.0
0.0 o.s 1.0 I .5 2.0
Deflection, in
Figure 2.24 Load-Deflection Curves, Beam 850 (pw = 0.4Y8%, pvfvy = 76.2 psi).
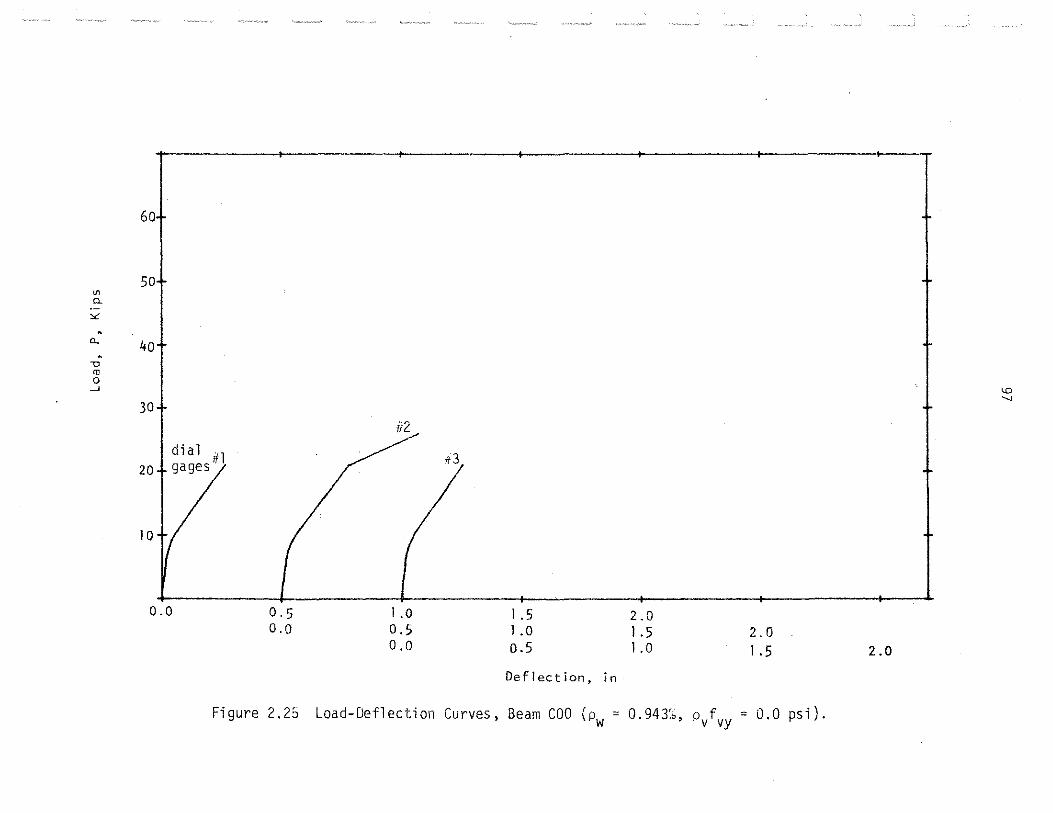
60
50 "' "-·-"' "- 40
" "' 0 --'
30+ I "' .....,
ii2
di a 1 . 20 +gages ill ~ rr3
10
0.0 o.s 1.0 1 .5 2.0 o.o 0.5 1 .0 1.5 2.0
0.0 0.5 1 .0 1 .s 2.0
Deflection, in
Figure 2.25 Load-Deflection Curves, Beam COO (pw = 0.943:;, pvfvy = 0.0 psi).

6
50 "' 0. ·-"' . 0.. 40 . " <U 0
30 I di a 1 gages #1 ~ ___..3-....J ----- I "" 00
20
10
0.0 0.5 1 .0 I .5 2.0 o.o 0.5 I .0 1.5 2.0
o.o 0.5 I .0 I .5 2.0
De f I ec t ion, in
Figure 2.26 Load-Deflection Curves, Beam C25 (o = 0.948%, p f = 32.4 psi). · w v vy

60 112
50 "' c.
I dial gages "1 / / #3 -""' . Cl. 40 ., "' 0
_J
30 I / / / I \0
"'
20
10
0.0 0.5 1 .0 1.5 2.0 o.o 0.5 1 .0 1 .5 2.0
o.o o.s 1.0 1 .5 2.0
Deflection, in
Figure 2.27 Load-Deflection Curves, Beam C50 (p = 0.948%, p f = 76.2 psi). vi v vy

"
6 •
dial gages fil I #2 1 #3
I 50
"' 0. ·-"" . 0,_
40 -o c; 0 I / / / I ~
-' 0 0
30
20
10
0.0 0.5 l .0 l . 5 2.0 0.0 0.5 l . 0 l .5 2.0
0.0 o.s l .0 l .5 2.0
Deflection, in
Figure 2.28 Load-Deflection Curves, Beam C75 (pw; 0.9337;, P/vy; 103.0 psi).
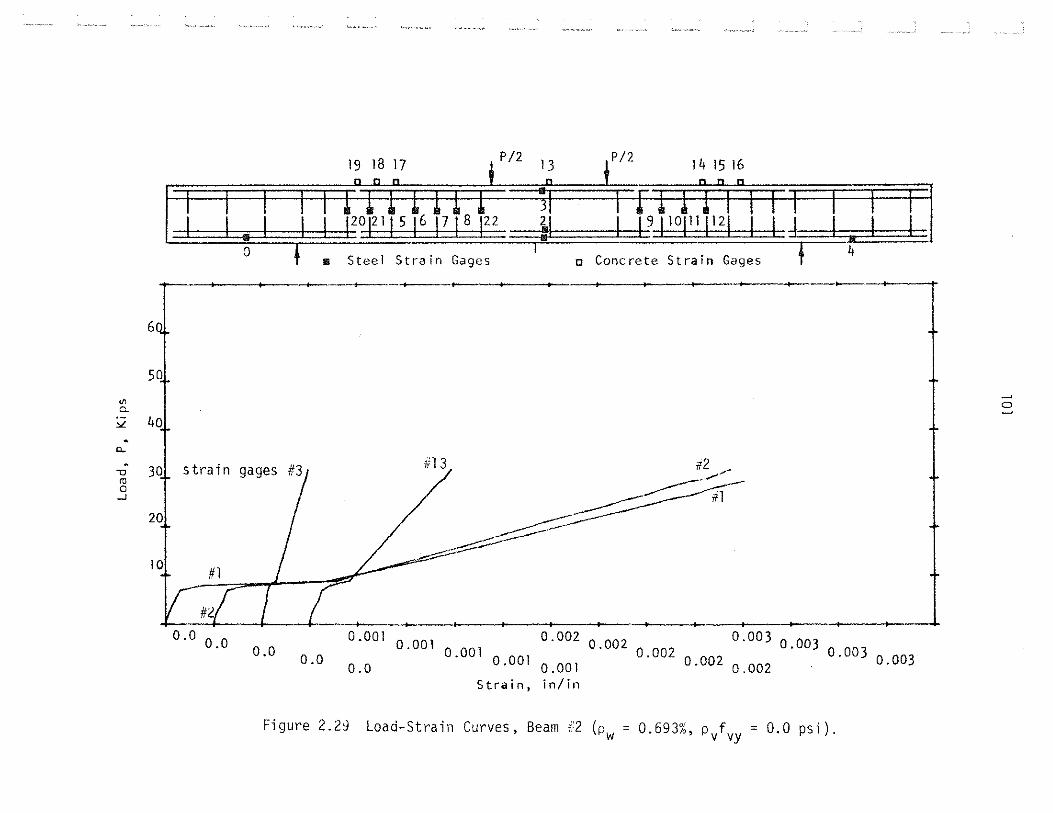
P/2 P/2 14 15 16
~I I i9flOiJliJ21 I I
0 ,. Steel Strain Gages o Concrete Strain Gages
4
,.._.._
6
so "' c. 0
~
"'- 40 .
c..
#2/ #13
::t ""'" '''" 7 .....-.
/ ~~ "0 ro 0
..J
~-----~ .--:;;:;: -~ 10'
0.003 0.003 0.003 l--::EI~--t--__...__ 1 ....._ o. oo2 0.0 0.0
0.001 0.001 0.001 0.001 0.001 0.003 0.002 0.002 0.002 0.002 0.0 0.0
0.0 Strain, in/in
Figure 2.29 Load-Strain Curves, Beam i:2 (pw = 0.693%, P/vy = 0.0 psi).

"' "'->£ . 0.. . " "' 0 -'
P/2 P/2 14 15 16
I L_J
I I 1 LJ J20f2115 t6 T7T8 122 dl Ill Ill Ill I I I r- I r-- -I j
!I 11 9 110111 1121 Il-l I" I I a .
Steel Strain Gages II c Concrete Strain Gages -- --I
-------~----·------------~--------~-----~--~
60.
50
40
30T strain gages
#l --- -----~ 20
]Q I #l
+----~----4---~----~--~----~--~----~---4----~--~~--~--~~--~---~----·
0.0 0 0 0.001 0 001 0.002 0 002 0.003 0 003 . 0.0 0.0 0.0 . 0.001 0.001 0.001 . 0.002 0.002 0.002 . 0.003 0.003
Strain, in/in
Figure 2.30 Load-Strain Curves, Beam AOO (o = 0.656%, p f = 0.0 psi). w v vy
a "-0·

"' c.
"" . "-. -o
"' 0 ...J
P/2 ,, .P/2
I l_l I II20 I21 I 5 16 PPf2 ~I 11 9 110111 1121 I I 0
a Steel Strain Gages c Concrete Strain Gages 4
.......,~ _ _,_ ____ -~---~--+-----~--~--
. ,...__ _____ _ I
60.
50
40
"t ""'' 14 13 16 14 19
gages }/
20
10
+--- _____ ,......._.._._ _ _,_ __ ...
0.003 0 003 . 0.003
0.002
0.0 0.0 0,0 0.001 0.001 0.001 0.001 0.001 0.0
0.0 0.002 0.002 0.002 0.002
0.003
Strain, in/in
Figure 2.31 Load-Strain Curves, Beam AOO (p ~ 0.656"', p f = 0.0 psi). w v vy
~
0 w

V>
"-
"" . c..
"0
"' 0 _j
60
so
40
3J
P/2 ,, ,P/2
I __ L .. I I L J2DE11 s 16 T7J8 J22 i.l ____ _ LI 9 poj11J12L I I
0 m Steel Strain Gages o Concrete Strain Gages
4
---------- ----~--+-- _....,._ __ ~__....,_- -
strain #3 u5 ------------· " -~---------.Jfi... .. . ~ ~1 -------- , _ ___........--- ------------
~ -----gages
-~~--------
--~ ~-------------...------------ --.----~
0.0 0.0 0.0
0.001 0 001 0.002 0 ooz 0.003 0 003 . 0.001 0 001 . 0.002 0 002 . 0.003 0 003 0.0 0.0 . 0.001 . 0.002 .
Strain, in/In
Figure 2.32 Load-Strain Curves, Beam A25 (p = 0.663~, p f = 31.8 psi). w v vy
0
"""
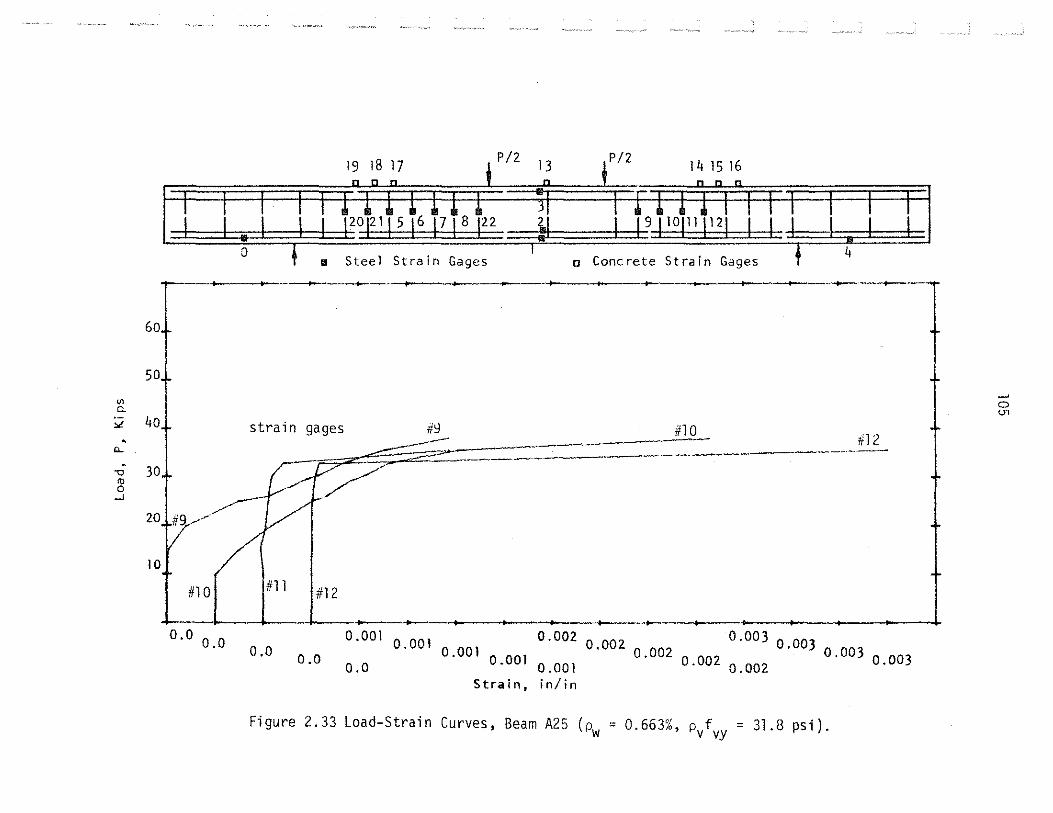
"' c:.
"'-. "-. -o 10 0
..J
l I - LmJ I F°F 115 16 PP 122
0 11 Steel Strain Gages
.,.....-- ----------+------. _.,.......__
60
so
40 strain gages #9 ---30
"? lO #1 0 #12 #11
0.0 0.0 0.001 0.001 0.001 0.001 0.0 0.0 0.0
~I I t91lOPlP21 I I ~- ~~I Ill
o Concrete Strain Gages 4
___,.._.. _____ .....,.._.._ ......
#1 0 --- 1i12 --------·- ----·----
0.002 0.002 0.002
0.001
0.003 0.003 0.003 0.002 0.002 0.003
Strain, in/in
Figure 2.33 Load-Strain Curves, Beam A25 (pw = r3'' p f 0. 5o lo, v vy = 31.8 psi).
0 o·,

"' c. :L
. Q.
. "0
"' 0 ...J
P/2 P/2 14 15 16 n n 11
L .I .I I I 120J2lls16FJ8122 II I 191Jollll121 U 0
11 Steel Strain Gages o Concrete Strain Gages 4
-r--- ----<--------------+--·--+----···~-..... ...___ ___ .....,.___. __ ..,.__ -+------+---
60.
50.1. strain gages
40 #16
30 I 7 20
10
0.0 0 0 0.001 0 001 0.002 0 002 0.003 0 003 . 0.0 0 0 . 0.001 0 001 . 0.002 0 002 . 0.003
. 0.0 . 0.001 . 0.002 0.003
Strain, in/in
Figure 2.34 Load-Strain Curves, Beam A25 (pw=0.663", P/vy = 31.8 psi).
~
0 C'.

"' C>.
60
50
;;;i 40 . "-. "0 m c
....J
P/2 P/2
1 l_l 1 1 12o 121lsi6PJ8!zz
strain gages
#3
0.0 0.0
0
o.o 0.0
11 Steel Strain G~ges o Concrete Strain Gages 4
~'13
0.001
0.001 0.001 0.001 0.001 0.0
0.002 0.002 0.002 0.002
Strain, in/in
0.003 0.003 0.003 0.003 0.002
Figure 2.35 Load-Strain Curves, Beam A25a (p = 0.668~, p f = 31.8 psi). w v vy
0
"

0
60.
so "' c.
4ol :L
30b(
Q_
"0
"' 0 ...J
20
IJ 6(
0.0 0.0
14 15 !6
~I -- I --- -, - =:r= I L _ ] _____ _) [
m Steel Strain Gages o Concrete Strain Gages 4
strain gages #8 #5
/_ -- :;> .
ii7
~
7 I 8
0,0 0.0
0.002 0.002 0.002 0.002 O.OOI 0.001 0.001 0.001 0.001
. · n/in 0.0 Strain, I
#6
0.003 0.003 0.003
0.002
Figure 2.3b Load-Strain Curves, Searn A25a (pw = 0.668, P/vy = 31.8 psi).
t
0.003
0 ();;

60
50
"' c.
"- 40 .
0.. . -o 30 "' 0
.-J
20
10
P/2 P/2
I I I I I 1201211 5 i6T7TB 122
10
0.0 0.0
0 01 Steel Strain Gages o Concrete Strain Gages
II
strain gages
11 12 --·--· -~---
0.0 0.0
i/9 #11
~-.......___·-------~------- ----- ~------- - ___.___ ___ ............___ ___ ....._____._ __ .
0.001 0.001 0.001 0.001 0.001 0.002
0.002 0.002 0.002 0.0
Strain, in/in
#10
0.003 0.003 0.003
0.002
Figure 2.37 Load-Strain Curves, Beam A25a (pw = 0.668~, pvfvy = 31.8 psi).
j I
•
• ill 2
.
.
.
0.003
0 '-"
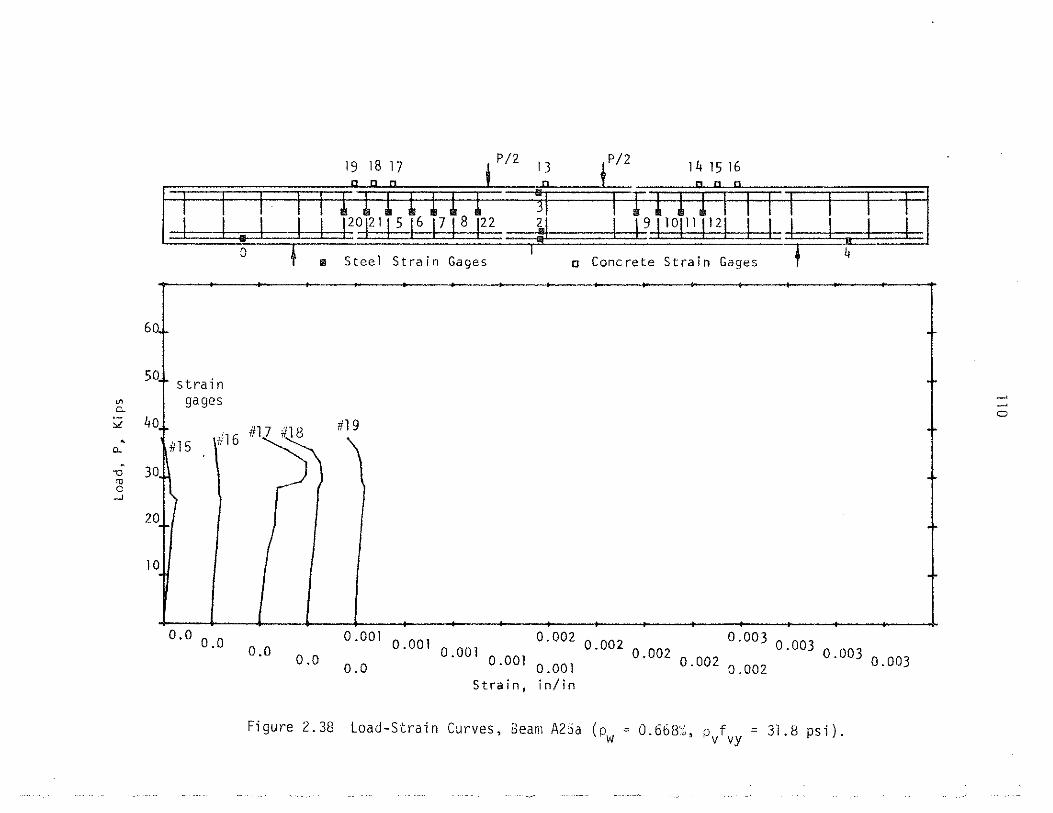
P/2 .• .P/2
I L_JH LLJ20l21 I 5 16 PPI22 II I 19 110111 1121 li 0
u Steel Strain Gages o Concrete Strain Gages 4
60.
so strain "' gages
#19 c.. I ;2 40 I o
. Cl.
-o" 30 "' 0 _,
2 )
)
#15 ;/16
0.0 0.0 0.001 0.001 0.001 0.001 0.001 0.002 0.002 0.002 0.002 0.002 0.003 0.003 0.003 0.003 0.0
0.0 0.0
Strain, in/in
Figure 2.38 Load-Strain Curves, 3eam A2Sa (p = 0.668~, p f = 31.8 psi). w v vy
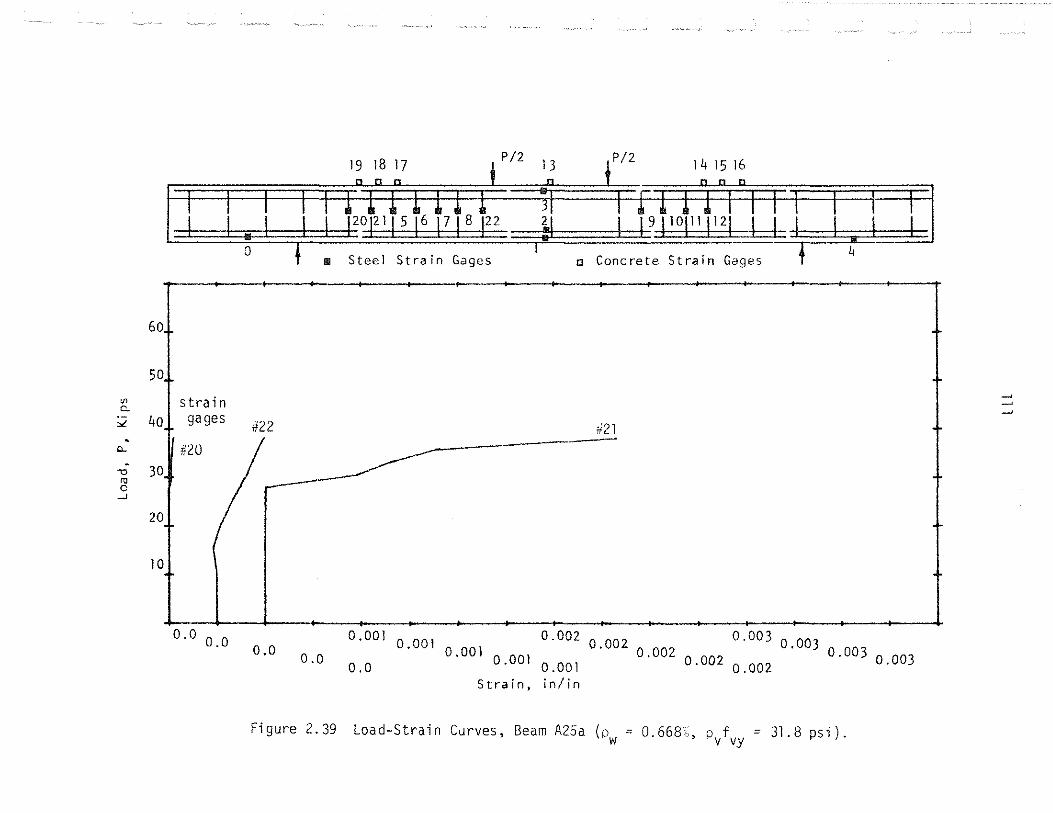
P/2 , 0 .P/2
I I _I I l F0I21 I5 16 FJ8F2 ~I I 19 110111 1121 U-0
111 Steel Strain Gages o Concrete Strain Gages ~
60
50.
"' t ""'" I -· c. >l 4o gages #22 7121 .
#20 "-. "0 30 "' 0
__J
20
10
0.0 0.0 0.0 0.001 0.001 0.001 0.001 0.001 0.003 0.003 0.003 0.003 0.00
2 0.002 0.002 0.002 0.002 0.0
0.0 Strain, in/in
Figure 2.39 Load-Strain Curves, Beam A25a (ow= 0.668:.;, pvfvy = 31.8 psi).
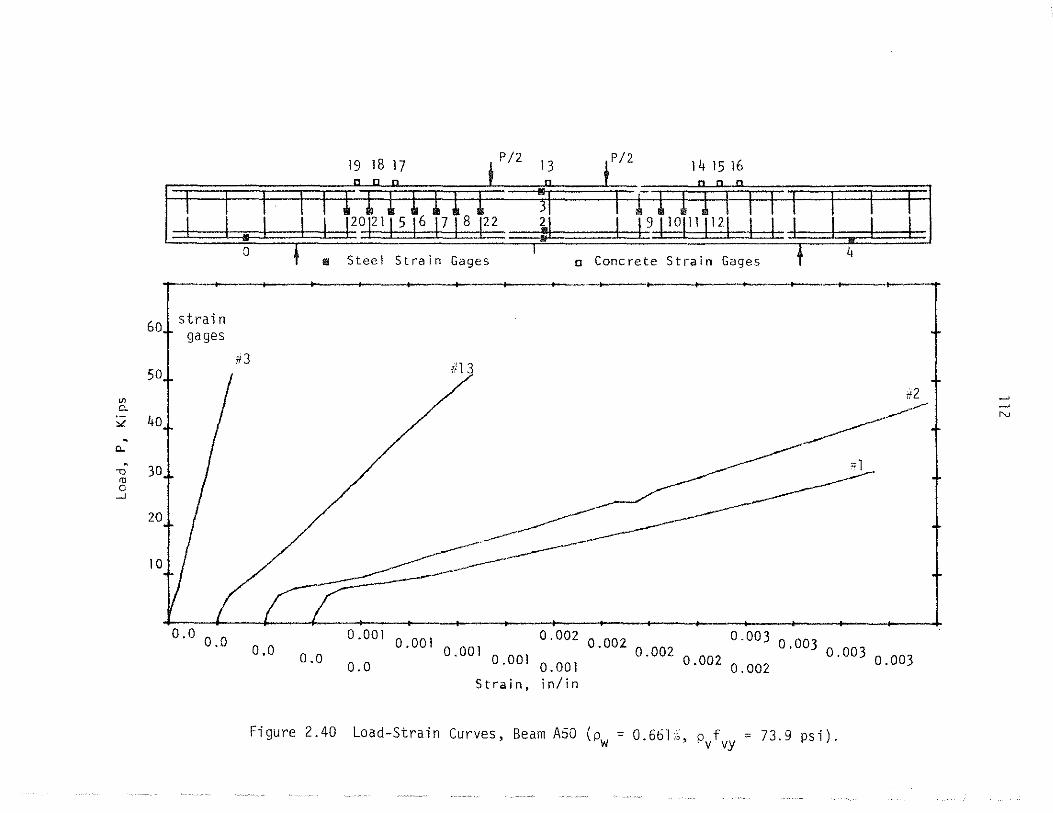
P/2 P/2
L I - I L I 12olzt p 16 p p F2 ~I I 19Jl8111[121 l I
"' "-
6ol strain gages
50
>:2 40 .
"-
-a· 30 "' 0
...J
20
10
0.0 0.0
a
#3
0.0
111 Steel Strain Gages o Concrete Strain Gages 4
;!13
...----------------
0.001 0.001 0.001 0.001 0.001 0.002 o.ooz 0.002 0.0
0.0 Strain, in/in
i12
~---------'il
0.003 0.003 0.003 0.002 0.002 0.003
Figure 2.40 Load-Strain Curves, Beam A50 (p = 0.661~, p f = 73.9 psi). w v vy
~
N
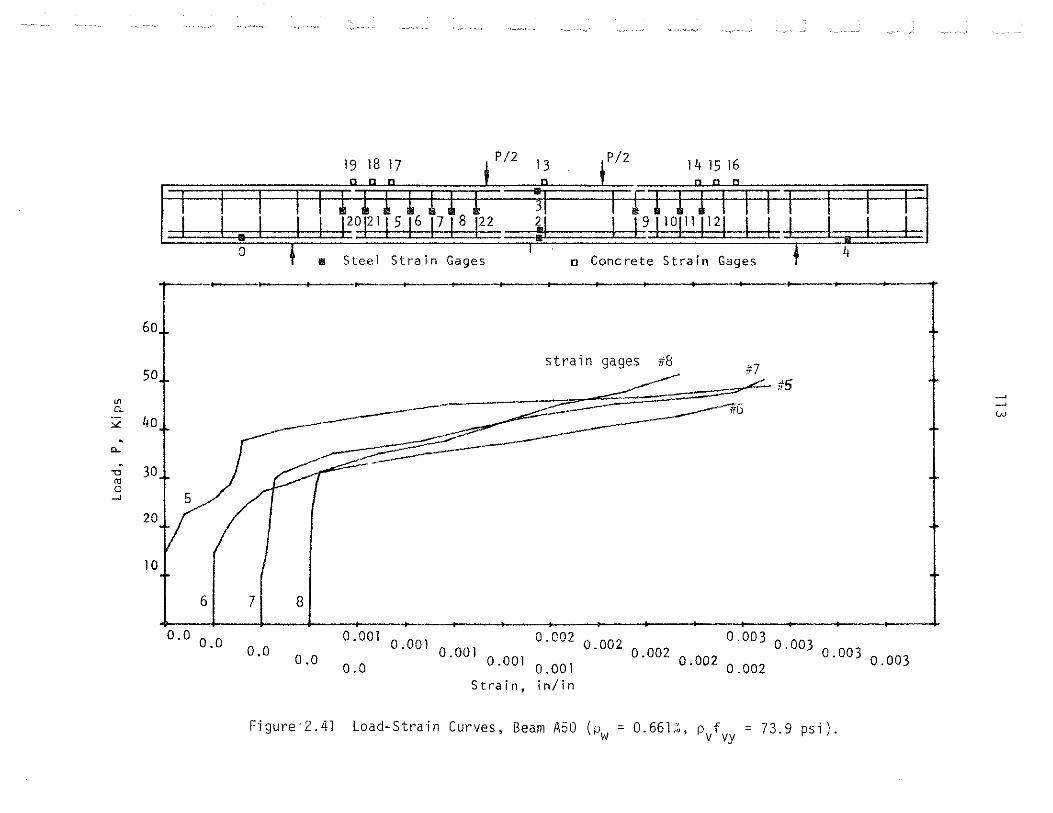
"' c.
"" . <>..
. -o
"' 0 ....J
P/2 ,, .P/2
L_l L Ll !20tzli5!6T7TB!22 i.l __ LJ9JlOjll!l21 1 1
0 m Steel Strain Gages o Concrete Strain Gages 4
----------+-------~----------------------~~-------------------~ 60
50
40
strain gages #8 #?
~ ~#5 ------=.:: ~G ~
30
I 5 20
lOr
6 I 7
'
8
0.0 0.0 0.0 0.002 0.002 0.002 0.002 O.OOl 0.001 0.001 0.001 0.001 0.003 0.003 0.003
0.002 0.0
· /in 0.0 Strain, In
0.003
Figure·2.41 Load-Strain Curves, Beam A50 (pw ~ 0.661,;, P/vy ~ 73.9 psi).
w
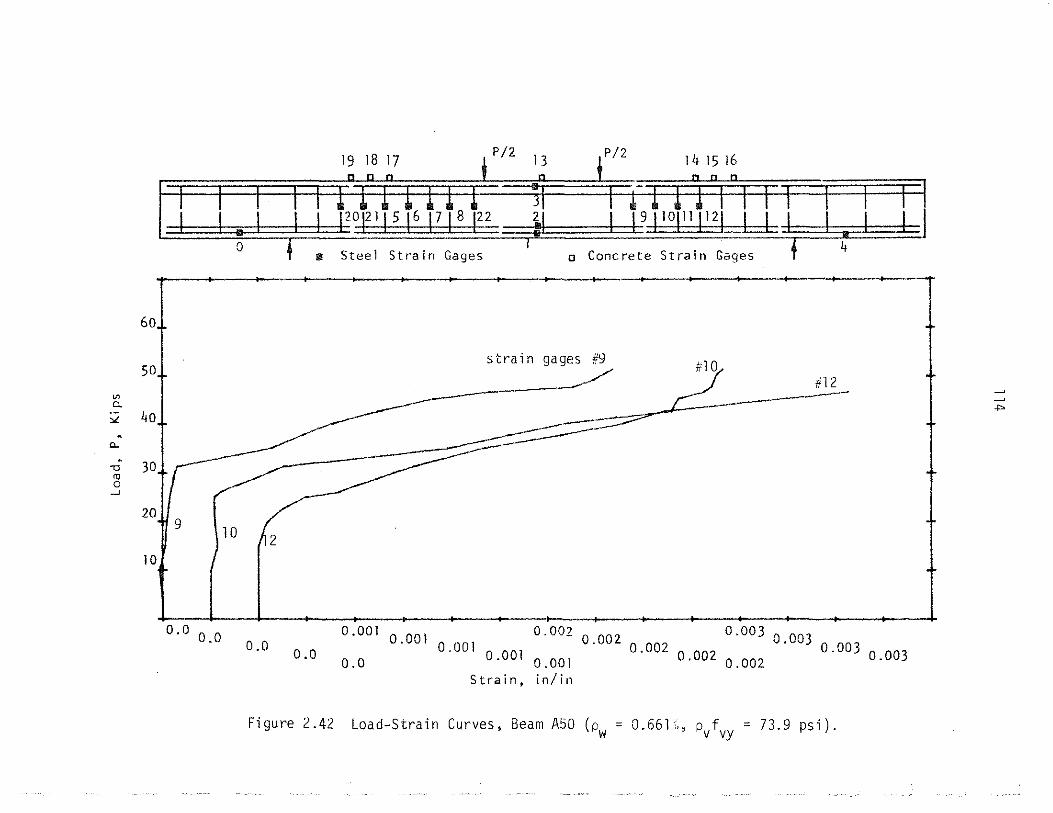
"' c:. ,.. .
Q.
-o
"' 0 _J
P/2 P/2 14 15 16 n n n
I I I I I !2D!21!516T7T8F2 ~I .LPI 10111 112111 I t .. L _r= -~::::: ::::I=::::J==r==r:=c:=:r
0 m Steel Strain Gages o Concrete Strain Gages
4
T--------------~----------~-------------------------------~---------~---r
60
50
40
30
20 9 • 10
• I
10
0.0 0.0
~2
0.0 0.0
strain gages #9
--~ #10
#12 -------------::::;~J---· ~-
O.OOl 0.001 0.001 0.001 0.001 0.002 0.002 0.002 0.002 0.0
0.003 0.003 0.003
0.002 Strain, in/in
Figure 2.42 Load-Strain Curves, Beam A50 (pw = 0.661 .. , pvfvy = 73.9 psi).
0.003
+>
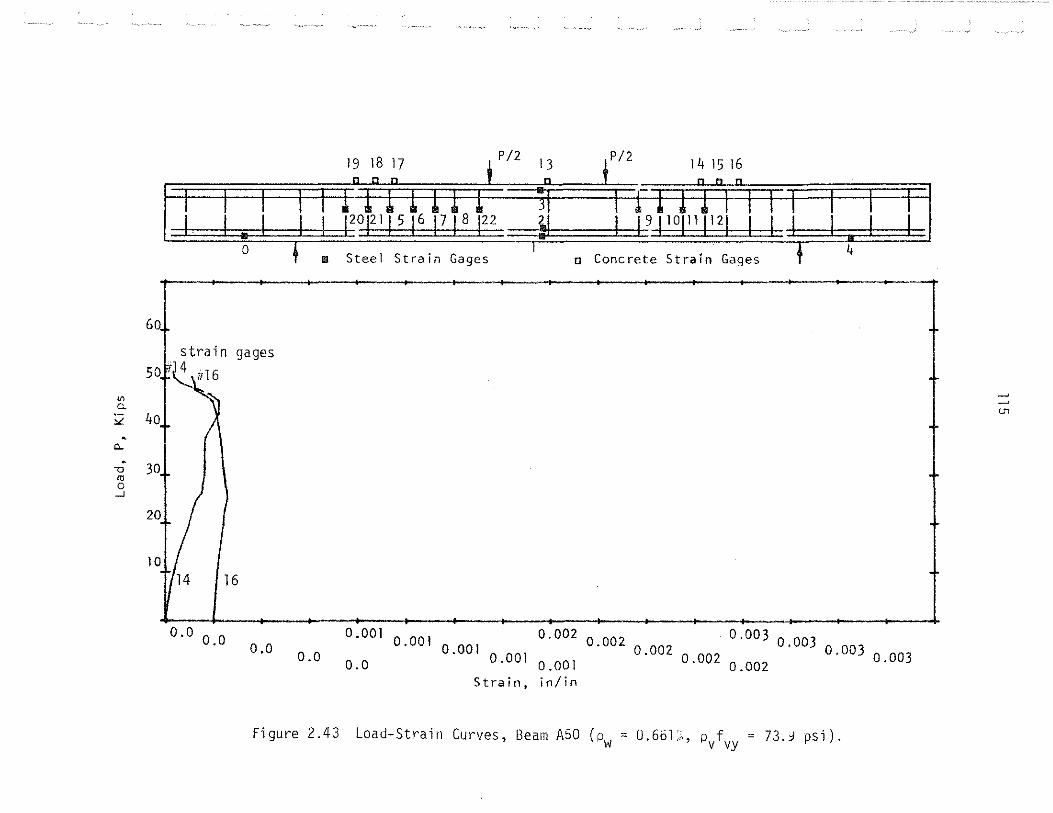
"' c. >(:
. c.. . "0 IU c
...J
I .1_1 I I I2°F 115 16 PPI22
0 • Steel Strain Gages o Concrete Strain Gages
4
T-------~----~---~------~~·----------------------------~---+----~~
60. I
strain gages
sof~m
40+ I 30
"I 10 • /16 14
0.0 0.0 0.0 0.0 0.001 0.001 0.001 0.001 0.001 O.OOZ 0.002 0.002 0.002
0.0 Strain, in/in
0.003 0.003 0.003
0.002
Figure 2.43 Load-Strai11 Curves, Beam ASO (p = 0.661 .• , p f = 73.3 psi). w v ~
0.003
0>

P/2 P/2 14 15 16 n n n
b J - I . Ll 12olzii516PP lzz 1.1 I 19!10111!121 I I
B Steel Strain Gages o Cone rete Strain Gages 4
#'!.
#1
------------------------·
0.0 0.0 0.0 0.0 0.001 0.001 0.001 0.001 0.001 0.00
2 0.002 0.002 0.002
0.0 Strain, in/in
0.003 0.003 0.003
0.002
Figure 2.44 Load-Strain Curves, Beam A50a (p = 0.658~, p f = 75.0 psi). w v vy
0.003
~
"'

P/2
L_J I I I 12oTzlTST6T7J8i22 ~I ll9ilollll121 u
0.0 0.0
Steel Strain Gages o Concrete Strain Gages l,
---+------~-----4-----·-+------~-----+--
0.0 0.0
strain gage. s ~- ~
~ ----------------------
O.OOI 0.001 0.001 0.001 0.001 0.0
0.002 0.002 0.002 0.002
Strain, in/in
0.003 0.003 0.003
0.002
Figure 2.45 Load-Strain Curves, Beam A50a (pw = 0.658;;, P/vy = 97.1 psi).
0.003
~
~ ....,
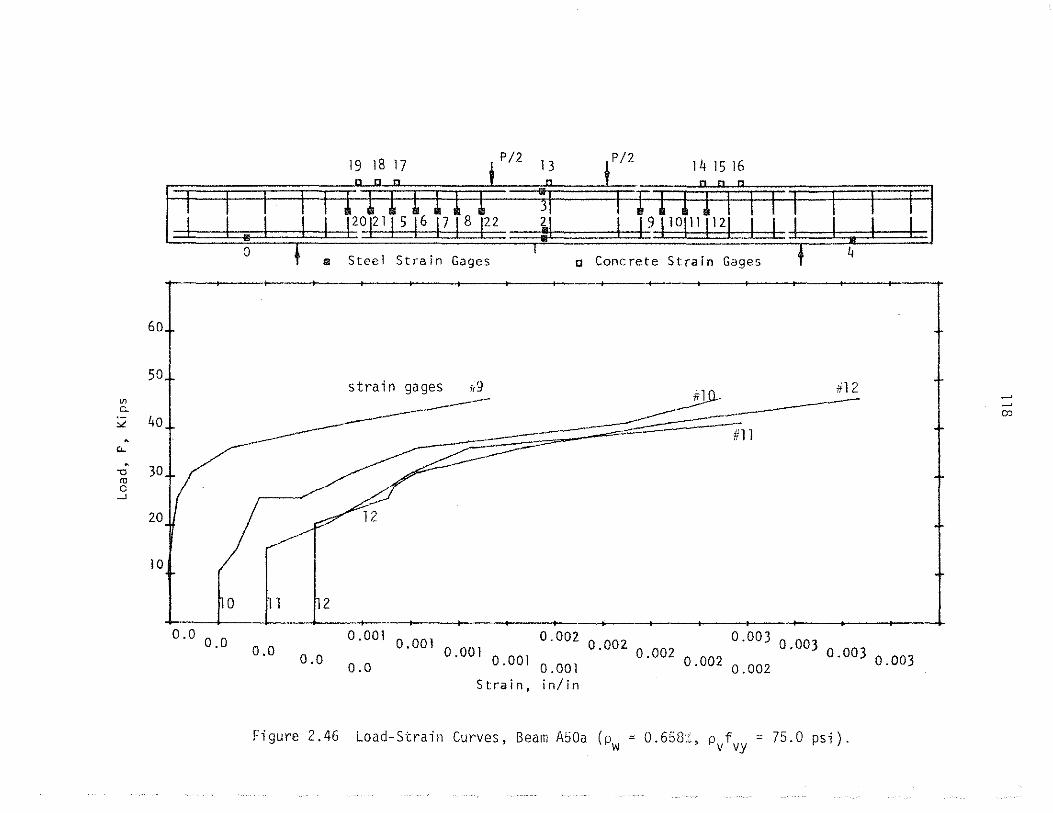
"' c.
60
50
:2 40 . "-
,; 30 "' 0
....l
20
10
P/2
l I - I I I 12of211sJ6J7jB 122 0
111 Steel Strain Gages o Cone rete StraIn Gages 4
~
CJJ
it9 ~!}.. #12
---~--~~-----~ :.....---:-------#11
0 '12
0.0 0.0 0.001 0.001 0.001 0.001 0.001 0,0
0.0 0.0 0.00
2 0.002 0.002 0.002 0.002 0.003 0.003 0.003 0.003
Strain, in/in
Figure 2.46 Load-Strain Curves, Beam A50a (p = 0.658~. p f = 75.0 psi). w v vy
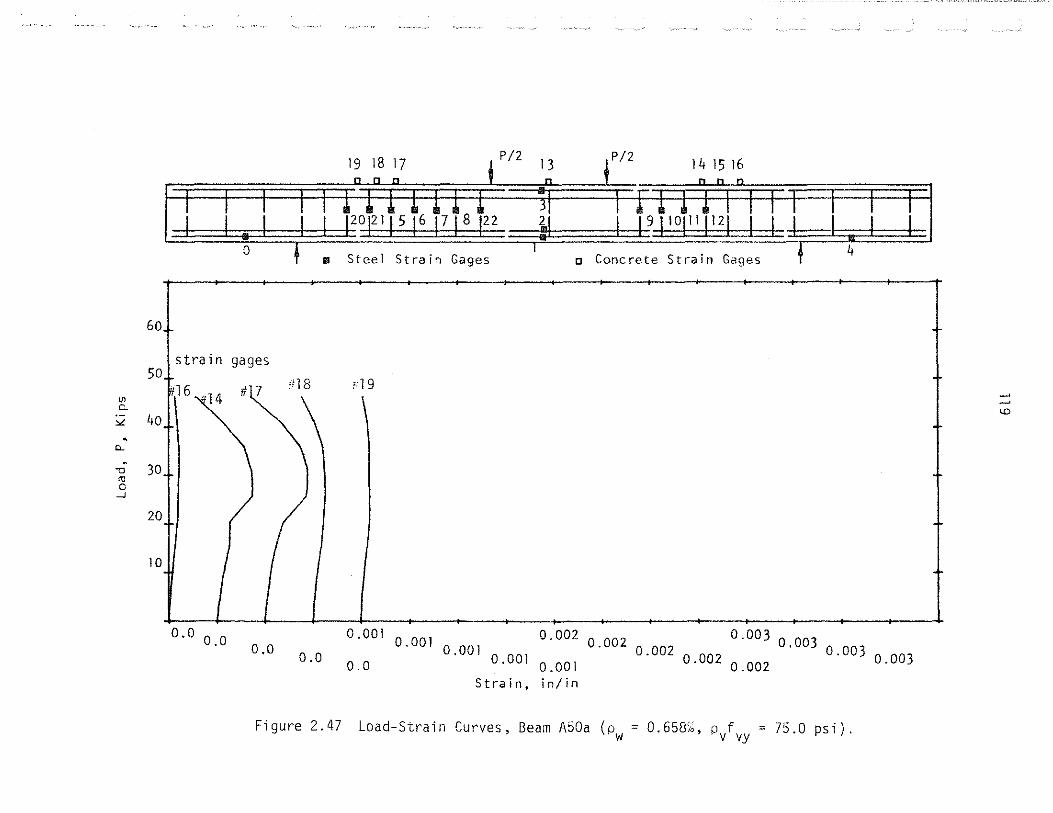
"' a.
"" . 0..
. -o
"' 0 __J
0
60
I strain gages
501 418
1116~4 #~ \ 40
30
II ) 20
10
0.0 0.0 0.0
0.0
P/2 P/2
~I.HH Ll 9 l10111 1121111 '•' I I I 4
e Steel Strain Gages o Concrete Strain Gages
~19
\
0.001 0.001 0.001 0.001 0.001 0.0
0.002 0.002 0.002 0.002
Strain, in/in
0.003 0.003 0.003
0.002 0.003
Figure 2.47 Load-Strain Curves, Beam ASOa (p = 0.658~, p f = 75.0 psi). w v vy
I <.0

0
0.0 0.0 0.0 0.0
P/2
a Steel Strain Gages
0.001 0.001 0.001 0.001 0.0
P/2
~I I I9J 10t 1L12LL L o Concrete Strain Gages
4
0.002 0.002 0.002
0.001 0.002 0.003 0.003 0.003
0.002 Strain, in/in
Figure 2.48 Load-Strain Curves, Beam A50a (pw = 0.658;0, P/vy = 75.0 psi).
0.003

V1 c.
60
50 •
;;;_ 40 . "-
.,; 30 "' 0
...J
20
10
P/2 P/2
L I _I I I I20J2115 16 PPI22
J
strain gages #16
16
0.0 0.0 0.0
0.0
11 Steel Strain Gages o Concrete Strain Gaqes 4
#13
'i2
~
O.OOl 0.001 0.001 0.001 0.001 0.002
0.002 0.002 0.002 0.002 0.003 0.003 0.003 0.003 0.0
Strain, in/in
Figure 2.49 Load-Strain Curves, Beam A75 (pw = 0.6555:, pvfvy = 97.1 psi).
N

60
50 V1 c.
>L 40 . Cl.
. -o 30 "' 0
....!
20
10
P/2
l .. I- I I I J20J21Js16PP 122
:J
strain gages
#3
I
0.0 0.0 o.o
0.0
111 Steel Strain Gages o Concrete Strain Gages 4
#13
/
0.001 0.001 0.001 0.001 0.001 0.002 0.002 0.002 0.002 0.0
Strain, in/in
#2 -------
0.003 0.003 0.003
0.002
Figure 2.54 Load-Strain Curves, Beam BOO (pw = 0.488;;, pvfvy = 0.0 psi).
I N c·,
#l
0.003

"' c. >L
. "-. ,
lU 0 ...J
P/2 14 15 16
•- L.- -.------:-1- -r:~~-y- ::=::::r=::::::=:-1 ~I I 19
110
111
112
1 I I 0
111 Steel Strain Gages o Concrete Strain Gages 4
60
50
40 I
!strain gages 30 #14 #16 #17 #19
20
10
0.0 0.0 0,0
0.0 0.001 0.001 0.001 0.001 0.001 0.002 0.002 0.002 0.002 0.0
Strain, in/in
0.003 0.003 0.003
0.002
Figure 2.55 Load-Strain Curves, Beam BOO (pw = 0.488:;, P/vy = 0.0 psi).
I N
"'
0.003

"' c. :,£
. "-. -o
'" 0 _J
P/2
I I I I I 120F1f516TJT8122 ~I .. LJ91 10111 112L I I J
60
50
'ttco;o '''" #3
30 I
20
10
0.0 0.0 o.o 0.0
01 Steel Strain Gages o Concrete Strain Gages 4
#13 /
0.002 0.002 0.002 0.002 0.001 0.001 0.001 0.001 0.001
, . in/in 0.0 Stra1n,
H2
0.003 0,003 0.003
0.002
Figure 2.56 Load-Strain Curves, Beam B25 (pw = 0.494,;, pvfvy = 32.4 psi).
I N 00
0.003

6
5Q
"' "->£ 40. .
0.. . 30. -o
"' 0 -'
20
10
J: 141516
:~=l=:=~: = .. =i:==l=:=~r=~ :j::-~D-~:~~.:"~-~:-=i:=.l=:_=i:~-~-==~~!===:rct]Qf 11 t 12ll I I I __ . I .II ~ l 11 Steel Strain Gages I o Concrete Strain Gages f 4
I strain gages #6
11 8 5
0.0 0.0 0.0
0.0
1!11 #8 rrS #7
- / -~
7
0.001 0.001 0.001 0.001 0.001 0.0
0.002 \ .002 0.002 0.002
Strain, in/in
0.003 0.003 0.003
0.002
Figure 2.57 Load-Strain Curves, Beam B25 (ow = 0.494~~. P/vy = 32.4 psi).
0.003
~
N \0

"' "-
""' . "-
-o
"' 0 -'
~~ 1 19JlOPl!121 1 1 0
11 Steel Strain Gages o Concrete Strain Gages l 4
60
so ....
40 strain gages
#18
30
20
10
0.0 0.0
#17
I
I 0.0 0.0
#14
0.001 0.001 0.001 0.001 0.0
0.002 0.002 0.002
0.001 Strain, in/in
0.003 0.003 0.003 0.003 0.002 0.002
Figure 2.58 Load-Strain Curves, lleam B25 (ow~ 0.494., P/vy ~ 32.4 psi).
I ~
w 0
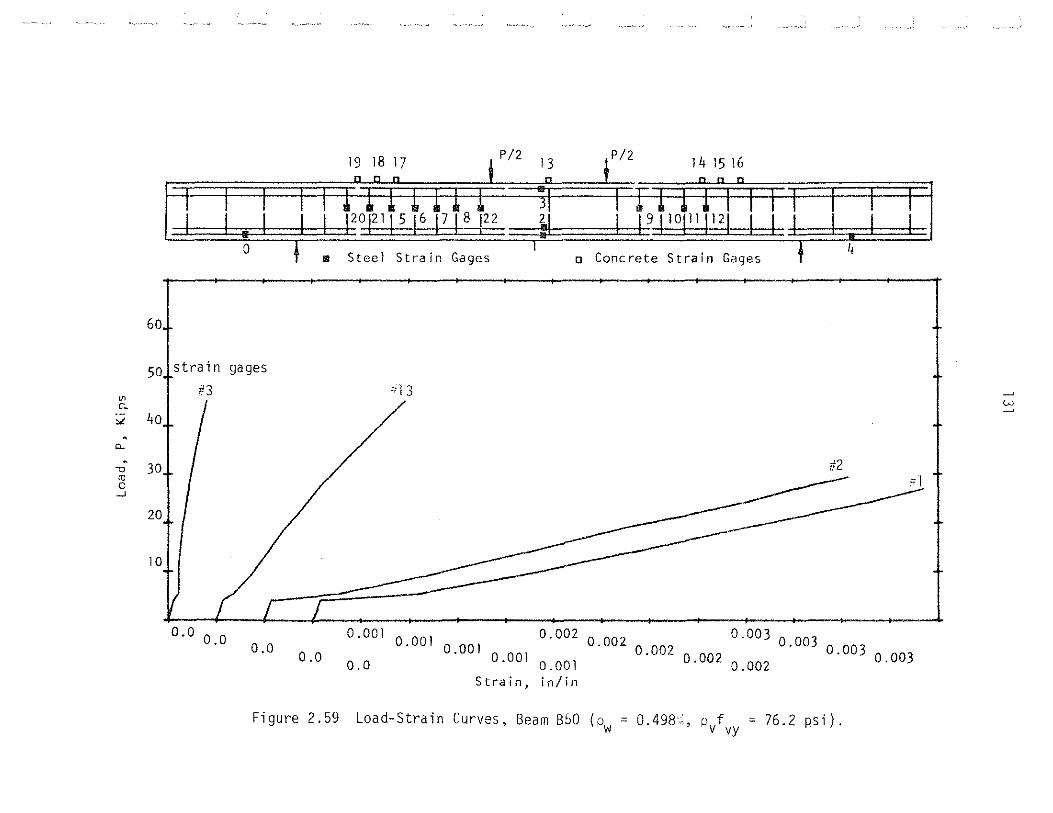
"' c..
"" "
"-"
"0
"' 0 ...J
P/2 P/2
r:-::.:::::::::==:.r= _ ... 1 l r u1 ~~ • LmJ9JlO[lljl21 I I 0
111 Steel Strain Gages o Cone rete Strain Gages 4
60
5+tcoi" 9'9"' #3 "13
I /
40
3o I I
20
10
0.0 0.0
/
0.001 0.001 0.001 0.001 0.001 o.ooz o.ooz 0.002 0.002 0.0 0.0 0.0
Strain, in/in
#2
0.003 0.003 0.003
0.002
Figure 2.59 Load-Strain Curves, Beam 850 (p = 0.498·;, p f = 76.2 psi). w v vy
I w
0.003
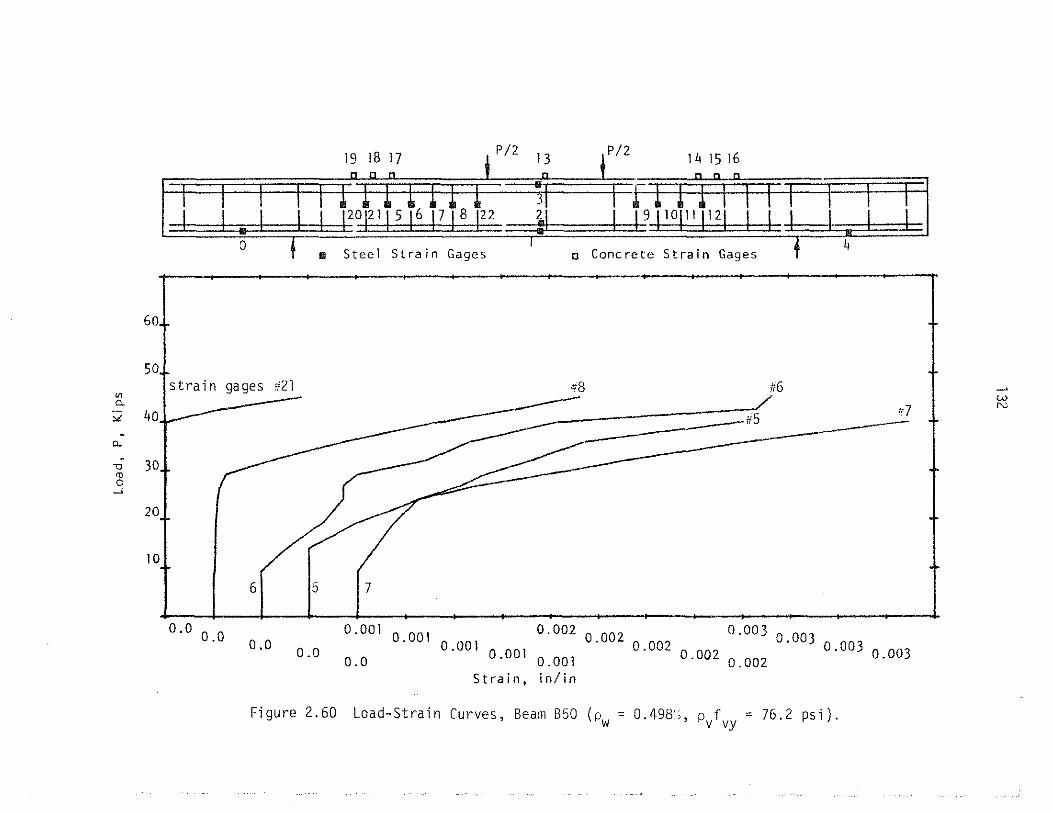
"' c_
><!
-Q.
. u
<U 0
..J
P/2 P/2 14 15 16 n n n
I I -I I I 12oJ211sJ~-EJBJ22 ~~ l 19JlOjll 1121 I I a
,. Steel Strain Gages o Concrete Strain Gages 4
60
50
40~ ~s #6
------1!5
30
20
10 i I
0.0 0.0
6( Is
0,0 0.0
I 7
0.001 0.001 0.001 0.001 0.001 0.002 0.002 0.002 0.002 0.0
Strain, in/in
0.003 0.003 0.003
0.002
Figure 2.60 Load-Strain Curves, Beam B50 (p = 0.498:,, p f = 76.2 psi). w v vy
I w c7 N
0.003

"' c:_
;,L
' ,_ -"0
<1l c __,
P/2 13 P/2 14 15 16
n o "
I I_ I I I I20 I21 I 5 16 PP 122 2
0 11 Steel Strain Gages o Concrete Strain Gages
4
60.
50
40
strain gages #22
7< ,.g H ll
;;10
30 ----20
10 i
22 12 Ill
0.0 0.0 o.o 0.002 0.002 0.002 0.002 0.001 0.001 0.001 0.001 0.001 0.003 0.003 0.003
0.002 0.0
0.0 0.003
Strain, in/in
Figure 2.61 Load-Strain Curves, Beam B50 (pw = 0.498;, pvfvy = 76.2 psi).
w w

"' "-"'-
"-.
-o ro c -'
P/2 '" ,P/2
L.l_l LII20 I21 I5 16 PlBI22 ~I 11 9 110!1 11121 U 0
" Steel Strain Gages o Concrete Strain Gages 4
60
sol strain gages rrl4 nl5 16 17
40 I v i! \ H \.
30
20
10 T/
/15 14 116 /17
0.0 0.0 0.0 0.0
~18 I
ns
0.001 0.001 0.001 0.001 0.001 0.002 0.002 0.002 0.002 0.0
Strain, in/in
0.003 0.003 0.003
0.002
Figure 2.62 Load-Strain Curves, Beam 850 (p = 0.498%, p f = 76.2 psi). w v vy
I w -""
0.003

"' c.
"" . 0..
. -o
"' 0 ...J
P/2 P/2
I .... L - I I L .12()J2_1Ls 16 ['j8J22 ~I _ J j9jlOj11!J21. L 1 kJ I I 0
a Steel Strain Gages c Concrete Strain Gages l 4
60.
50.
40 I
30+
strain gages
;;1 #3 "2 #13
0.0 0.0 0.0 0.002 0.002 0.002 0.002 0.00
1 0.001 0.001 0.001 0.001
0.003 0.003 0.003
0.002 0.0 0.0 0.003
Strain, in/in
Figure 2.63 Load-Strain Curves, Beam COO (p = 0.943~, p f = 0.0 psi) w v ry
I w
""

"' "->£ . "-.
-o
"' 0 -'
P/2 P/2
I I - I I I 12ol211sl6 pp 122
0 111 Steel Strain Gages o Concrete Strain Gages
4
60
50
4o I
t strain gages 30 ~14 #~5 #;6 #17 Ji18
20
10
0.0 0.0 0.0 0.0 0.001 0.001 0.001 0.001 0.001
0.0 0.002 0.002 0.002 0.002
Strain, in/in
0.003 0.003 0.003
0.002
Figure 2.64 Load-Strain Curves, Beam COO (p = 0.943 .. , p f = 0.0 psi). w v ~
I w
"'
0.003

P/2 P/2 14 15 16 n n n
L _I- I I I I2°F 115 16 FP 122 ~I 1 19t1op1pz1 L_l 0
111 Steel Strain Gages o Concrete Strain Gages 4
60
50
I w '-J
Vl 1 strain gages c.. ""- 40
1!3 #2 #I c.. .
"0 30 "' 0 --'
20
10
0.0 0.0 o.o
0.0 0.001
0.001 0.001 0.001 0.001 0.002 0.002 0.002 0.002 0.002 0.003 0.003 0.003 0.003 0.0
Strain, in/in
Figure 2.65 Load-Strain Curves, Beam C25 (p = 0.948~. p f = 32.4 psi). w v vy

60
50
"' c:. :,!. 40 .
0..
. -o 30
"' 0 _,
20
10
P/2 P/2 14 15 16
n n n
I I. I I llzolz11s16PJB 122 il I !91101111121 li 0
11 Steel Strain Gages o Cone rete Strain Gages 4
strain gages
ii20 #8 #21 #7
/_ #6
r /(/ 5 6 7 8
0.0 0.0 0.0 0.002 0.002 0.002 0.002 0.001 0.001 0.001 0.001 0.001 0.003 0.003 0.003
0.002 0.0
0.0 Strain, in/in
Figure 2.66 Load-Strain Curves, Beam C25 (p = 0.948'·, p f = 32.4 psi). w v vy
0.003
w 00

60
50
"' c. ;;;; 40 . Q_
. "0 30
<1)
0 ...J
20
10
14 15 16 n n n
I I_ I L I I20 I21 15 16 PP 122 ~I I I 91 1 o 111 11 2
1 I I 0
u Steel Strain Gages o Concrete Strain Gages 4
strain gages #22
9
0.0 0.0
ii9
#~ #1 0, ll
---: 10 11 12
0.0 0.0 0.001 0.001 0.001 0.001 0.001 0.002 0.002 0.002 0.002 0.0
0.003 0.003 0.003
0.002 Strain, in/in
Figure 2.67 Load-Strain Curves, Beam C25 (p = 0.948~. p f = 32.4 psi). w v ~
'
I " .
.
.
0.003
~
w <.C

60 I
50
"' c. >L 40 . Q.
. -o 30
<U 0
_J
20
10
P/2
I l_l lii2°F 115 16 PPI22
0
-strain gages
#3
0.0 0.0 0.0 0.0
111 Steel Strain Gages o Concrete Strain Gages 4
"13
0.001 0.001 0.001 0.001 0.001 0.002 0.002 0.002 0.002 0.0
Strain, in/in
#2
f.l
0.003 0.003 0.003
0.002
Figure 2.68 Load-Strain Curves, Beam CSO (p = 0.939~, p f = 76.2 psi). w v vy
0.003
+> 0
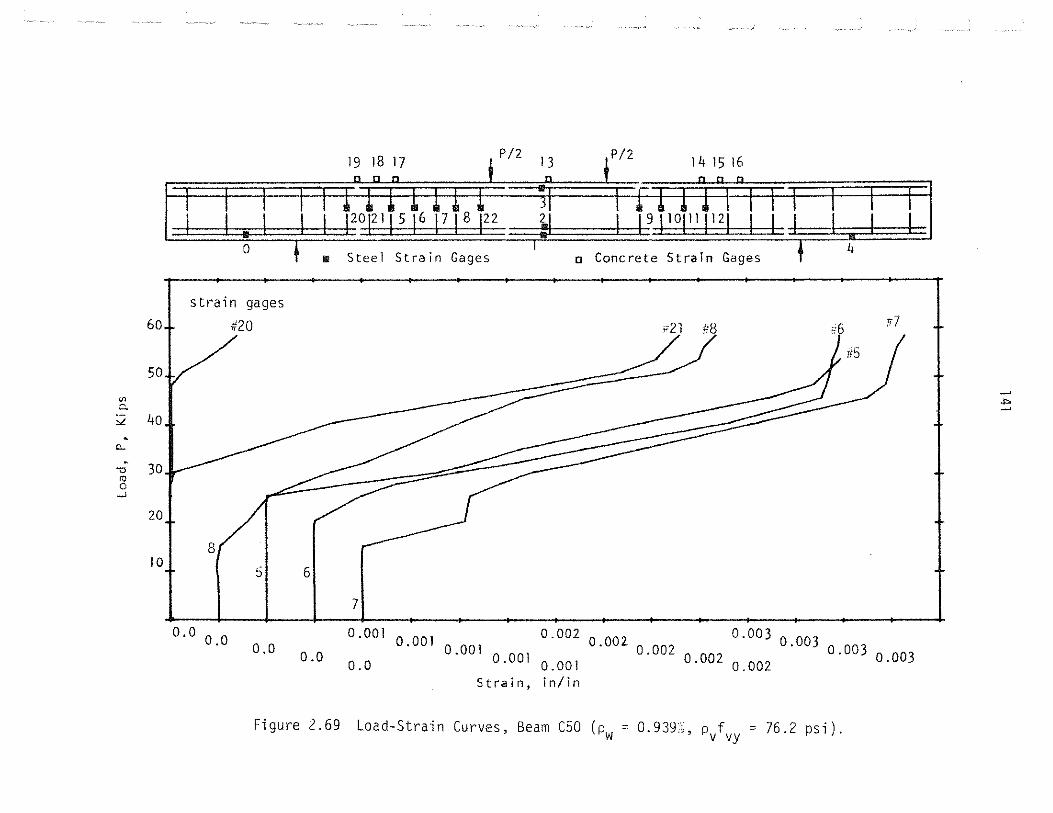
"' c. :.'.
. Cl..
. -o
"' 0 -'
I L_l .IJ 12oi211516PP122 ~I I 19 110111 1121 I I 0
111 Steel Strain Gages o Concrete Strain Gages 4
strain gages
60t #20
/ P2l #8 ~6
50
J,o
30
20 T
8 1 o I s 6
7
0.0 0.0 0.0 0.002 0.002 0.002 0.002 0.001 0.001 0.001 0.001 0.001 0.003 0.003 0.003
0.002 0.0 0.0
Strain, in/in
Figure 2.69 Load-Strain Curves, Beam C50 (pw = 0.939~, p f = 76.2 psi). v vy
!i7
..,. ~
0.003
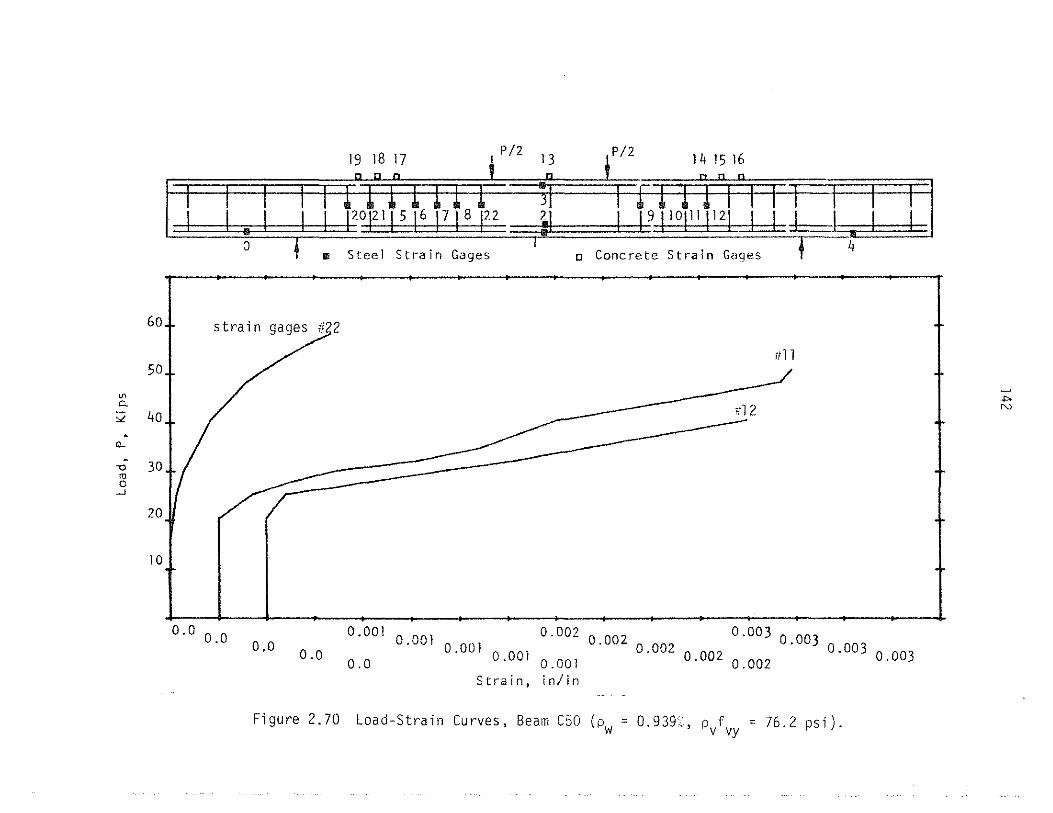
"' c.
60
50
,2 40
Q..
,; 30 "' 0 --'
20
10
P/2 P/2 14 15 16 n n n
~I LJ91' 0I''I' 21 IJ 8
" Steel Strain Gages o Concrete Strain Gages 4
strain gages #22
0.0 0.0 0.0 0.001 0.00! 0.001 0.001 0.001 0.002 0.002 0.002 0.002
0.0 0.0
Strain, in/in
illl
til2
0.003 0.003 0.003
0.002
Figure 2.70 Load-Strain Curves, Beam C50 (p = 0.939~. p f = 76.2 psi). w v vy
0.003
+> N

"' c.
"'-. 0..
" "0
<1) c -'
P/2 13 P/2
I I I 1 I 120j211516T7TBI22 ..--- - -,--------.--------r-:: -- -_T- ::Jr-:=r-r-:=-r::-:-r::-::cr ~I I J911opq121 1 I
0 u Steel Strain Gages o Concrete Strain Gages ~ 4
strain gages 6ol. H15 ~16
I \ 50
40 1#14
30 I }
20
10
0.0 0.0
'
0.0 0.0 O.OOl 0.001 0.001 0.001 0.001 0.002
0.002 0.002 0.002 0.0
Strain, in/in
0.003 0.003 0.003
0.002
Figure 2.71 Load-Strain Curves, Beam C50 (p = 0.939~. p f = 76.2 psi). w v ~
0.003
~
""' w

P/2 13
P/2
I I I I I 120j211516T7TB!22
0.0 0.0
... - =-.:r - _=r
0
0.0 0.0
111 Steel Str-ain Gages o Concrete Strain Gages 4
0.001 0.001 0.001 0.001 0.001 0.002 0.002 0.002 0.002 0.0
Strain, in/in
0.003 0.003 0.003
0.002
Figure 2.72 Load-Strain Curves, Beam C50 (pw = 0.939;,, P/vy = 76.2 psi).
0.003
_, _,
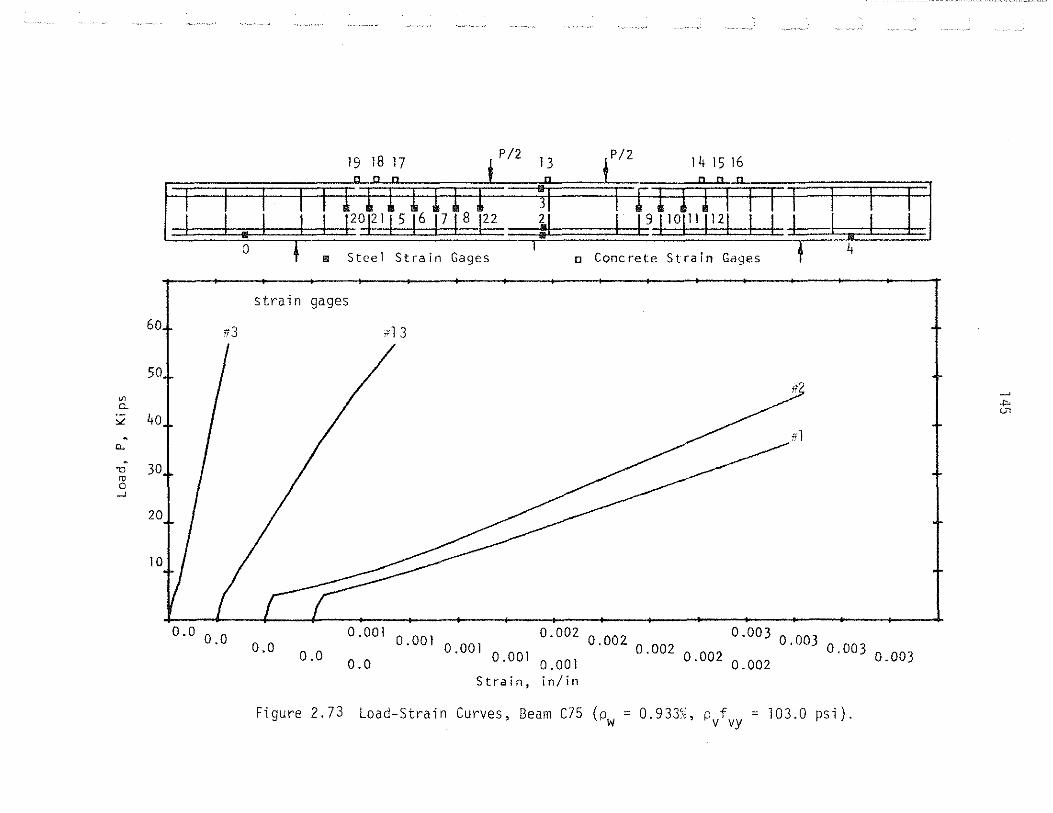
"' c:_
;,.!
. Q.
. -o
"' 0 _J
P/2 .• .P/2
I l_l I Jlzolzlls16PJ81zz ~I J 191lolllll21 I I 0
60r ii3
I 50
40+ I 30
0.0 0.0
111 Steel Strain Gages c Concrete Strain Gages 4
strain gages
o.o
"l 3
/
I ~ l
0.0 O.OOl 0.001 0.001 0.001 0.001 0.002 0.002 0.002 0.002 0.0
0.003 0.003 0.003
0.002 Strain, in/in
Figure 2.73 Load-Strain Curves, Beam C75 (p = 0.933%, p f = 103.0 psi). w v vy
I ""' "''
0.003

"' c..
"' . "-. " <1l c
....J
"1?-
P/2 P/2
L L_ L L L 120121
15 16 PP 1
22
0
60..L
I 50
40
30
20
101 8 1
0.0 0.0
61 7/
o.o 0.0
11 Steel Strain Gages o Concrete Strain Gages T--4
strain g~2~2 #6 #7 ~5
15
0.001 0.001 0.001 0.001 0.001 0.002 0.002 0.002 0.002 0.0
0.003 0.003 0.003
0.002 Strain, in/in
Figure 2.74 Load-Strain Curves, Beam C7S (pw = 0.933:;, pvfvy = 103.0 psi).
0.003
..,. a.

"' c. :L
. "-
60
50
40
.,; 30 "' 0 -'
20
10
P/2 P/2
L I I I I 120121f 5 161718 122
0
0.0 0.0
111 Steel Strain Gages o Concrete Strain Gages 4
strain gages
#22
ll
o.o 0.0
,g if 1 2
O.OOl 0.001 0.001 0.001 0.001 0.003 0.003 0.003 0.003 0.002 0.002 0.002 0.002 0.002 0.0
Strain, in/in
Figure 2.75 Load-Strain Curves, Beam C7S (pw = 0.933;;, P/vy = 103.0 psi).
_, '.J
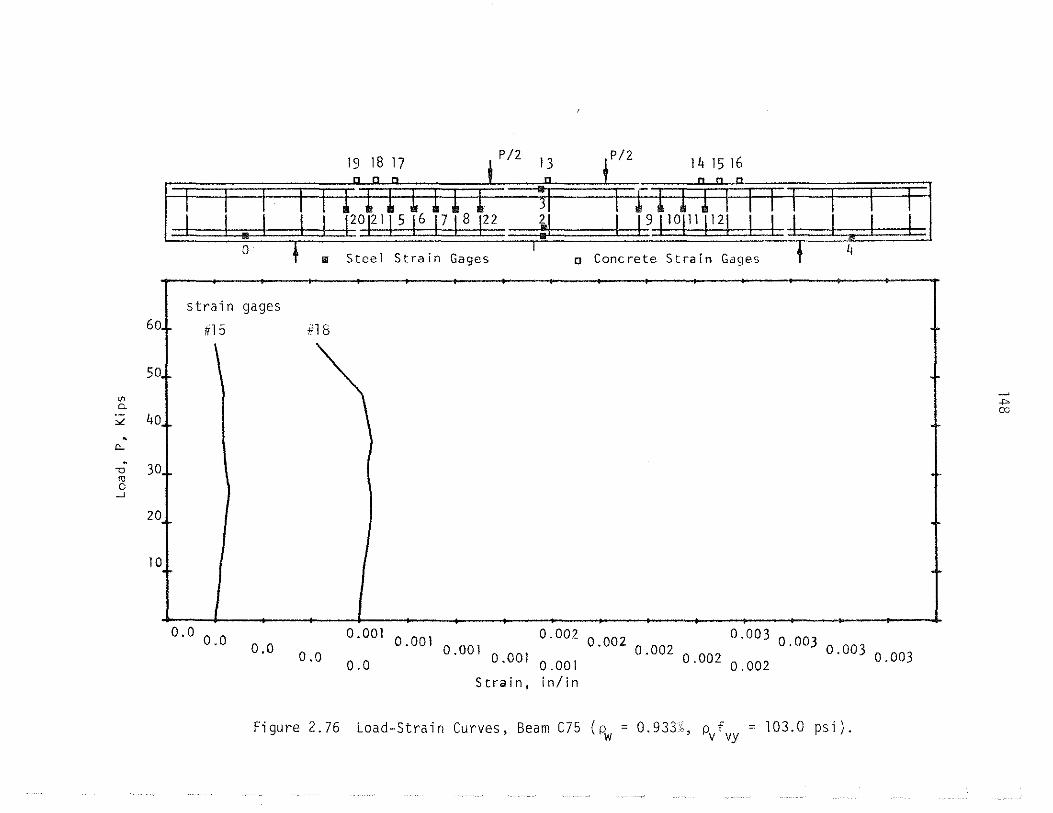
"' c_
"" . t:l..
. -o "' 0 _j
P/2
L L. Ld II20 I21 15 16 P P 122 ~I I l9ilop1 11zl u 0
m Steel Strain Gages o Concrete Strain Gages r-4 strain gages
6ol #15 #18
• \ 50.
40
30
20
10
0.0 0.0 o.o 0.002 0.002 0.002 0.002 0.001 0.001 0.001 0.001 0.001 0.003 0.003 0.003
0.002 0.0
0.0 Strain, in/in
Figure 2.76 Load-Strain Curves, Beam C75 (P. = 0.933,, p f = 103.0 psi). w v vy
0.003
+> 00
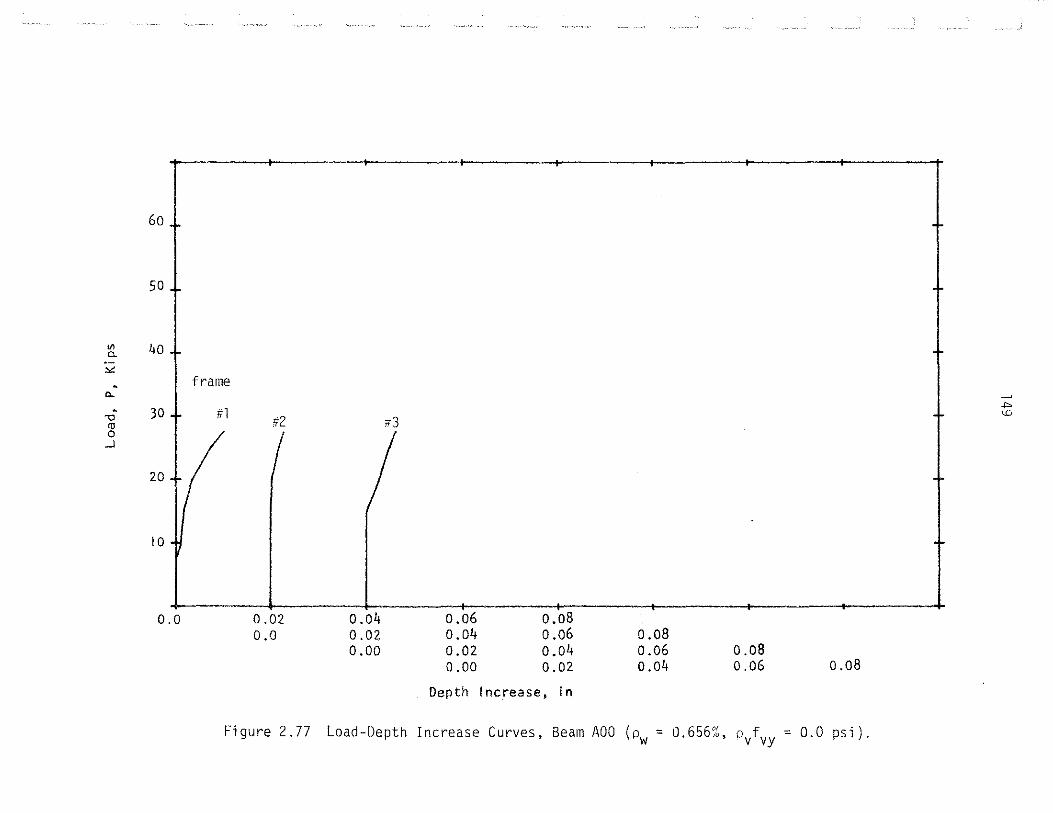
60 +
50
"' 40 0.
"" . t frame Q.
-o 30 ff 1 t2
1 _, co rr3
C0
0 ..J
20
10 +
0.0 0.02 0.04 0.06 0.08 0.0 0.02 0.04 0.06 0.08
0.00 0.02 0.04 0.06 0.08 0,00 0.02 0.04 0.06 0.08
Depth Increase, in
Figure 2.77 Load-Depth Increase Curves, Bearn ADO (pw = 0.656%, pvfvy = 0.0 psi).

6o
50
"' "I frame #l F2 a.
"" -"'~rr3 ___..... il4 . a.. r 1 u' . 30 0 '0
"' 0 ..J
20
10
0.0 0.02 0.04 0.06 0.08 0.0 0.02 0.04 0.06 0.08
0.00 0.02 0.04 0.06 0.08 o.oo 0.02 0.04 0.06 0.08
Depth lncre·ase, in
Figure 2.78 Load-Depth Increase Curves, Beam A25 (pw = 0.663%, pvfvy = 31.8 psi).

60
so
"' "r frame "-
"' #l ;,ry . ·~ ;3 1!4 a.. / / ~
--------I "' -o 30
ro 0
..J
20
10
T
0.0 0.02 0.04 0.06 0.08 0.0 0.02 0.04 0.06 0.08
0.00 0.02 0.04 0.06 0.08 0.00 0.02 0.04 0.06 0.08
Depth Increase, in
Figure 2. 79 Load-Depth Increase Curves, Beam A25a {pw = 0.668%, pvfvy = 31.8 psi).

"' 0.
"" . 0..
-a fD 0
....1
60
50
40
30
20
10
0.0
-+----- --
frame iil
~~----------------#2 ----- ~·it3 -----~~--"
0.02 0.04 0.06 0.08 0.0 0.02 0.04 0.06 0.08
0.00 0.02 0.04 0.06 0.08 0.00 0.02 0.04 0.06 0.08
Depth Increase, in
Figure 2.80 Load-Depth Increase Curves, Beam A50 (pw = 0.661'/., P/vy = 73.9 psi).
1
(J;
N
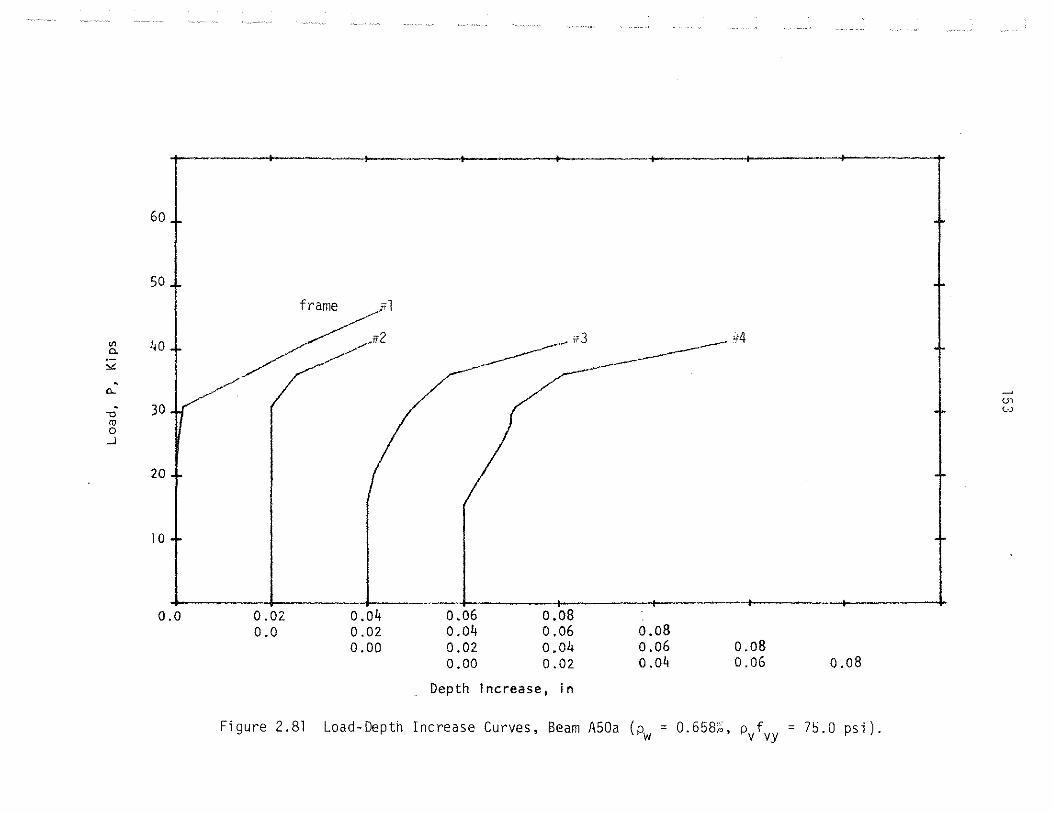
60
50 I
"' 0. 40 t
"" 0..
-o 30 ro 0
_.)
20
10
0.0
r---------4---------~---------+---·-------+--------~----------T
frame ~l
/~ -------_,/
----·--- ,..
.~ rr3 ------------ 44
o.oz 0.04 0.06 0.08 0.0 0.02 0.04 0.06 0.08
0.00 0.02 0.04 0.06 0.08 0.00 0.02 0.04 0.06 0.08
Depth Increase, in
Figure 2.81 Load-Depth Increase Curves, Beam A50a (pw = 0.658;;, pvfvy = n.o psi).
<.n
"'

60
50
Vl 40 0.
; ,~/r-_J
20
10
0.0 0.02 0.0
>---------------"----+-------t--------~---t-
frame ill , / it2 /--------- _,..r· __.-H3 /~ // ~/
// ~--~ ~ /,/"
' // --~
L ·- - ··------- ' 0.04 0.02 0.00
0.06 0.04 0.02 0.00
0.08 0.06 0.08 0.04 0.06 0.02 0.04
Depth Increase, in
0.08 0.06 0.08
Figure 2.82 Load-Depth Increase Curves, Beam A7S (pw = 0.655';, pvfvy = 97.1 psi).
~
01 +>
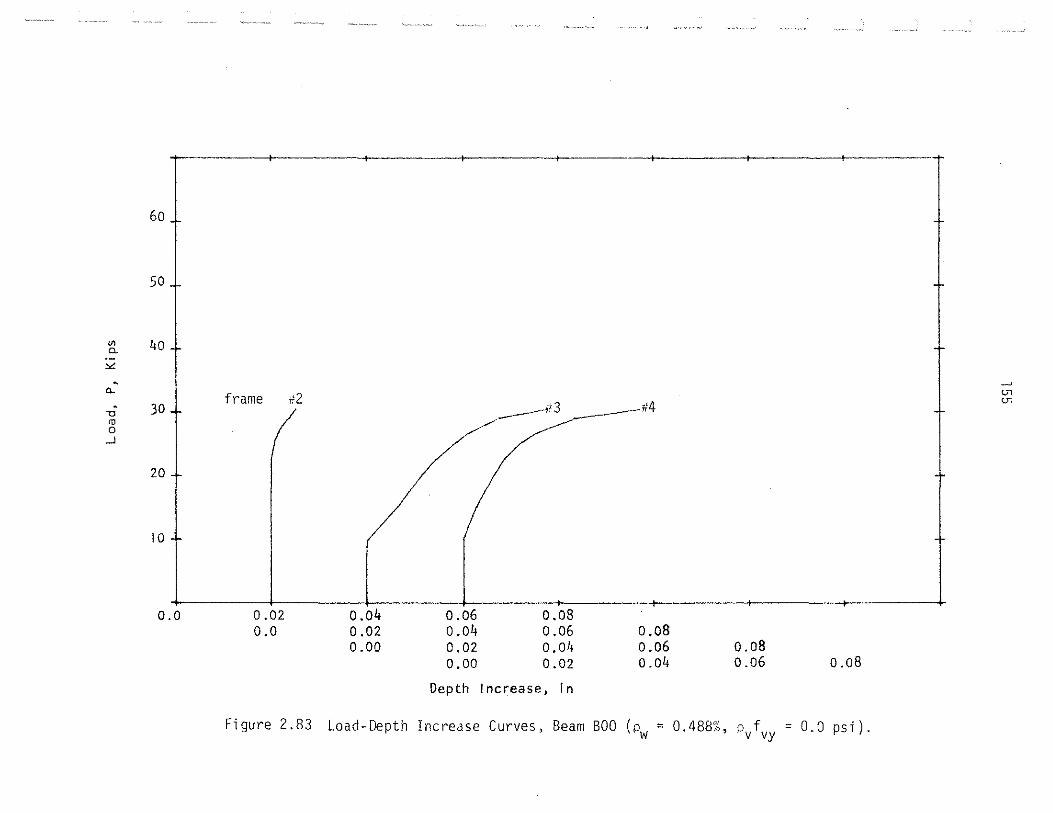
60
50
~ 40
"" 0..
-o <U 0
...J
30
20
10
0.0
frame i12
0.02 0.0
0.04 0.02 0.00
--.;!3 --#4 - --
0.06 0.04 0.02 0.00
0.08 0.06 0.04 0.02
Depth Increase, In
0.08 0.06 0.04
0.08 0.06 0.08
Figure 2.83 Load-Depth Increase Curves, Beam BOO (pw = 0.488);, pvfvy = 0.0 psi).
'-" "'
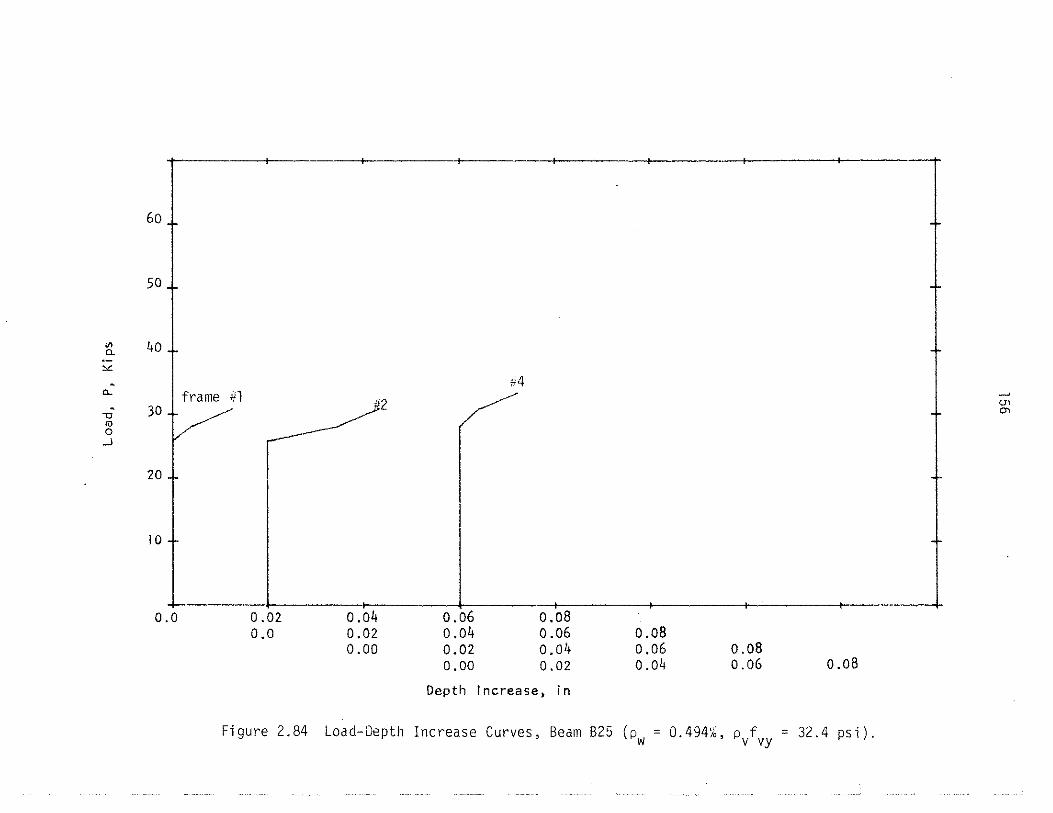
60
50
Vl 40 0.
"" ;;4 0.. vl 30 .)!2 /~ 1 <.n "0 "' '" 0 ....J
20-
10 +
0.0 0.02 0.04 0.06 0.08 0.0 0.02 0.04 0.06 0.08
0.00 0.02 0.04 0.06 0.08 0.00 0.02 0.04 0.06 0.08
Depth Increase, in
Figure 2.84 Load-Depth Increase Curves, Beam B25 (pw = 0.494?;, P/vy = 32.4 psi).

60
50
"' 40 0..
"" I
frame #l
. ---0..
-o 30 /U 0
...J
20
10
0.0 0.02 0.0
Figure 2.85
"2 / ~-- ..u3 /~/---------- ~4
0.04 0.06 0.08 0.02 0.04 0.06 0.08 0.00 0.02 0.04 0.06 0.08
0.00 0.02 0.04 0.06 0.08
Depth Increase, in
Load-Depth Increase Curves, Beam C25 (p = 0.948%, p f = 32.4 psi). w v vy
'-'' "
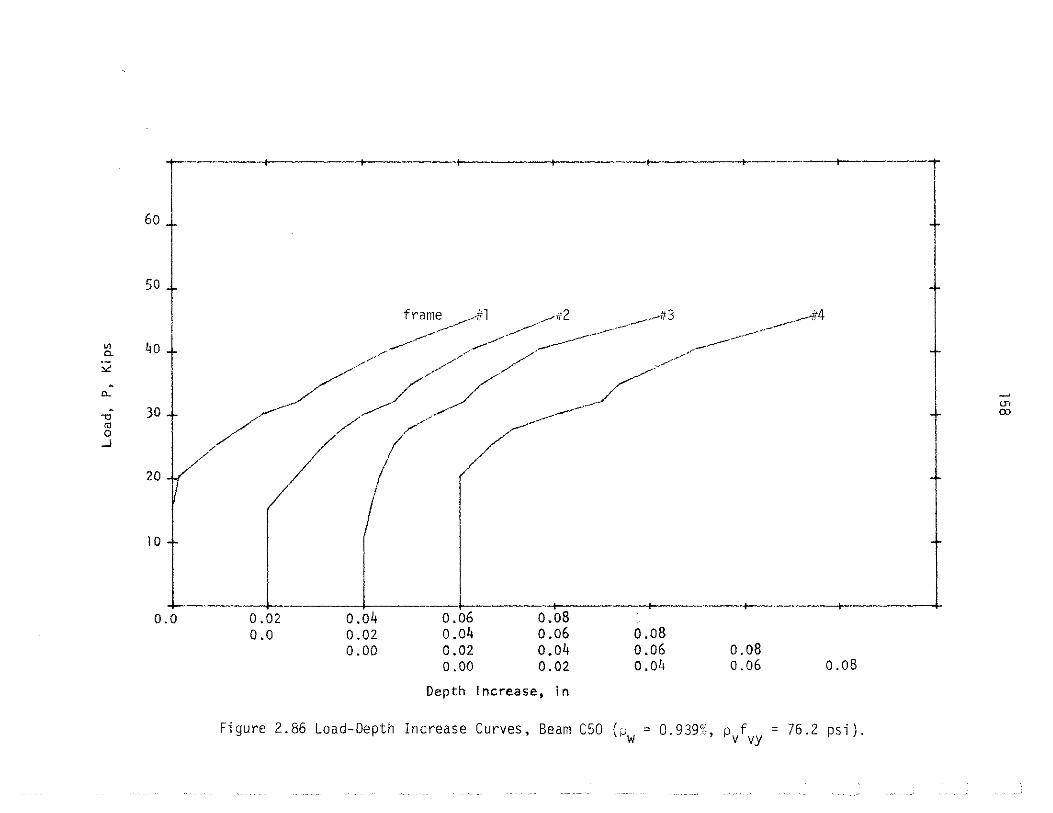
"' 0.
""' . "-
'0
"' 0 _)
~-----+----·
60
50
40
30
20
frame Ll --'" ~- ''2 ~-- ___ _-rr // --~--- -------~!13
// . // -~- _-#4 / // / /--------~ // (/ _______ /
f
10
0.0 0.02 0.04 0.06 0.08 0.0 0.02 0.04 0.06 0.08
0.00 0.02 0.04 0.06 0.08 o.oo 0.02 0.04 0.06 0.08
Depth Increase, in
Figure 2.86 Load-Depth Increase Curves, Beam C50 (p = 0.939';, p f = 76.2 psi). w · v vy
T
<n (X)

"' 0.
"" . a..
"0
"' 0 ..J
60
50
40
30
20
10
0.0
frame .-jn , ~ / /.rrc. ~// // ___ #3 ' /..-c // rr4
/' / / // ///' .. //.-·
/ / /
/ /,////// // _/
//
l o.06 -- - -,---·-------·--- --.---~--- ---0.02 0.04 0.08 0.0 0.02 0.04 0.06 0.08
0.00 0.02 0.04 0.06 0.08 0,00 0.02 0.04 0.06
Depth Increase, in
0.08
Figure 2.87 Load-Depth Increase Curves, Beam C7S (pw = 0.933~. pvfvy = 103.0 psi).
ln u:.

1 oad (kips)
2Vc
t
160
NOT TO SCALE
strain (in/in)
Figure 3.1. Method of Determining Shear Cracking Load from Stirrup Strain and Depth Increase Data (6).

2.5 Key
0 AOO
ACI C A25 & A25a
2.0 + A ~ ·- ~~~a..ll!J..q Ferquson . .6. ASO & A50a
A !V" X A75
~ ./· 4!11 BOO
1.5 .j.. I 1111 825
.... / + A B 50
vc / 9 coo
IF ./· 9 lSI C25 m
c 1.0 A C50
+ C75
0.5
0.0 0.0 0.5 1.0 1.5 2.0 2.5
100 Pw
Figure 3.2(a). Stress at Diagonal Tension Cracking, vc' from Crack Pdttern (6).

vc /f'fc
2.5
2.0
1.5
1.0
0.5
0.0
v·/
0.0
R . ACI
! ~·~ ·-· ~~'!1.2.!Lq Ferquson
~ /. t/• g
./·
0.5 1.0 1.5 2.0
100 Pw
2.5
KP.y
0 AOO
0 A25 & A25a
A A50 & A50a
')(. A75
41 BOO
II B25
A B50
g coo lSI C25
A C50
+ C75
Figure 3.2(b). Stress at Diagonal Tension Cracking, vc, from Concrete Strain (6).
"" N
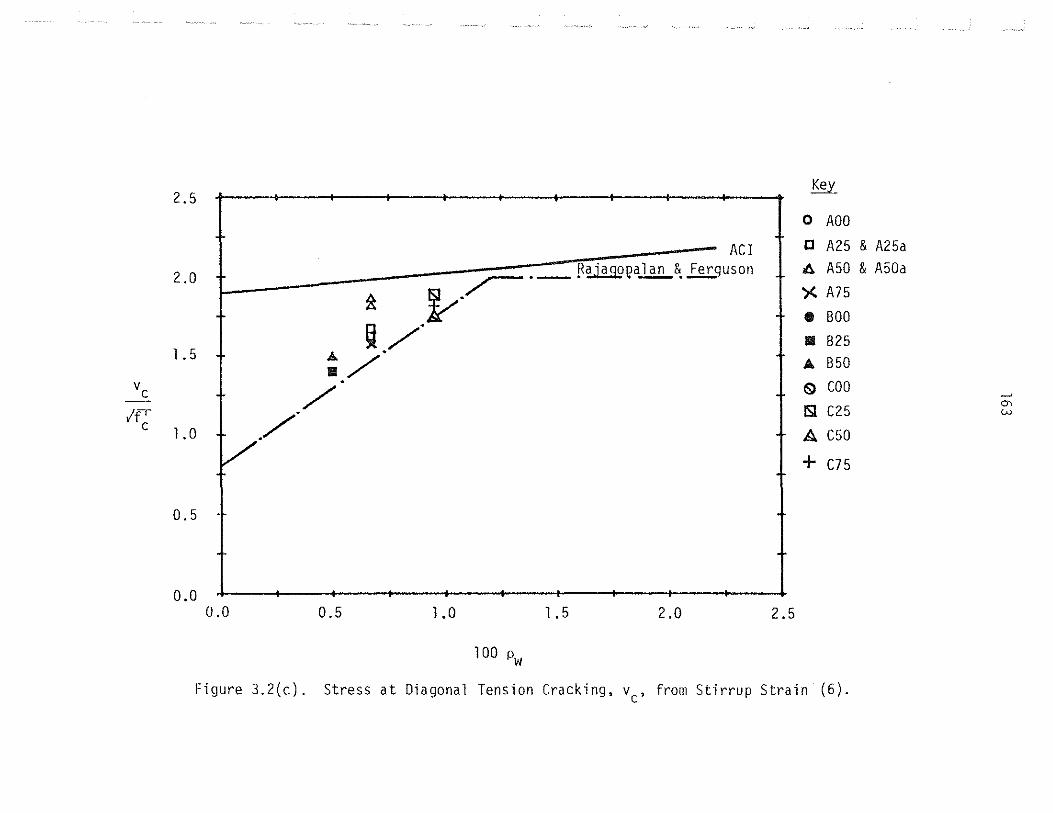
2.5 ~
0 AOO
2.0 + ~ 1--- _..r-•- ~ill.sg,•1'" & F ACJ
0 A25 & A25a
• -. erguson A A50 & A50a
)(. A75
CD BOO
1.5 + ~ /.
~ /. Jill 825
A 850 v c
IF /.
c 1.0 ./· 6) coo 1St C25 0'
A C50
w
+ C75
0.5
0.0 0.0 0.5 1.0 1 . 5 2.0 2.5
100 Pw
Figure 3.2(c). Stress at Diagonal Tension Cracking, vc' from Stirrup Strain (6).

2.5
2.0
1.5
vc
~ 1.0
0.5
0.0
A
IIIII
/ I ./' v
0.0 0.5
A . · ACI 2 .~ ·- F~l?a~&. Ferguson
r5 /.t" /.
1.0
100 Pw
1.5 2.0
.
2.5
~
0 AOO
0 A25 & A25a
A A50 & A50a
X A75
8 BOO
Ill B25 A B50
(i) coo ISl C2 5
A C50
+ C75
Figure 3.2(d). Stress at Diagonal Tension Cracking, vc, from Depth Increase (6).
m _,.
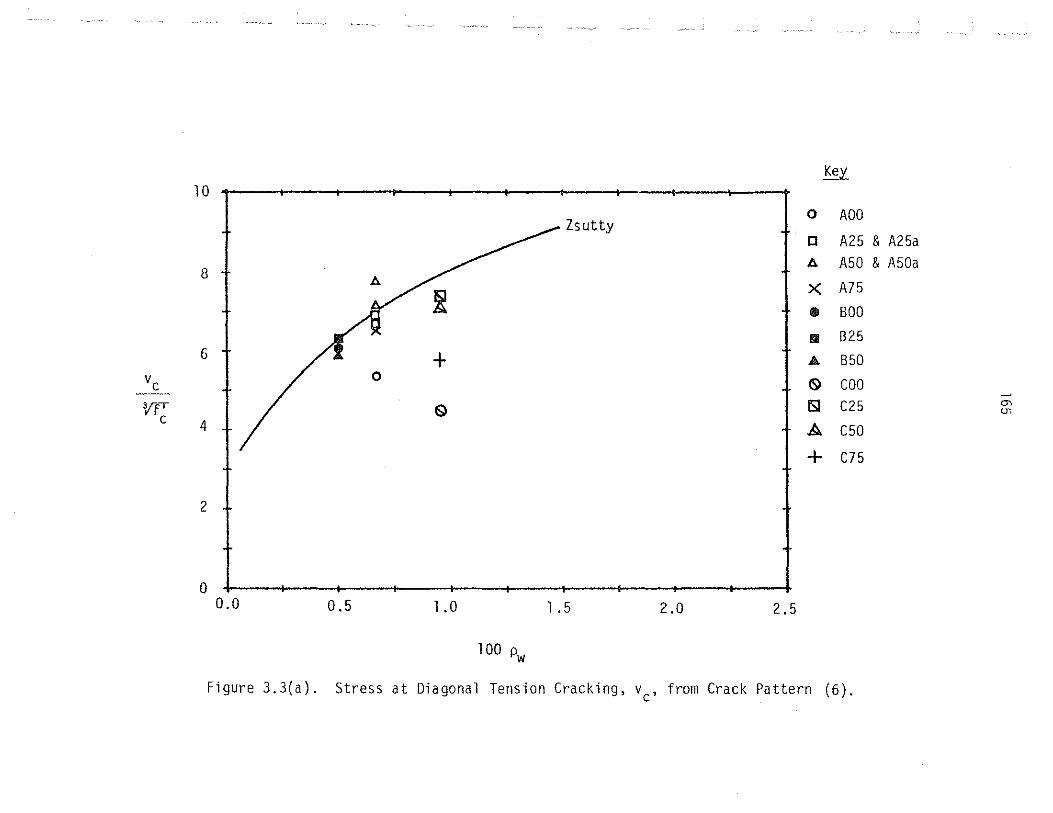
~ 10
I
Zsutty l 0 AOO
[] A25 & A25a
8 + . ~ A A50 & A50a
t X A75
• BOO
1111 B25 6 t /! + A. 850
vc
4 1 / 0
'If'
~ coo
c ~ ISl C25 ~
"' <.1'
A C50
+ C75
T T 2
0 0.0 0.5 1.0 1.5 2.0 2.5
100 Pw
Figure 3.3{a). Stress at Diagonal Tension Cracking, vc, from Crack Pattern (6).

~ 10
I
Zsutty 1 0 ADO 0 A25 & A25a
8 + ~ t A A50 & A50a
X A75
• BOO
Ill B25 6 t /i.
Ill E)) A B50
vc
t / • Vf'
E)) coo
c 4 ISl C25 ~
en
A "' C50
+ C75
T T 2
0 0.0 0.5 1 .0 1.5 2.0 2.5
100 Pw
Figure 3.3{b). Stress at Diagonal Tension Cracking, vc, from Concrete Strain {6).

~ 10
I
Zsutty 1 0 AOO
IJ A25 & A25a
8 + ~ t A A50 & A50a
X A75
• BOO
1111 B25 6
/~ vc
A 850
w 6> coo
c lSI C25
~
4
C> ..._,
A cso + C75
l r 2
0 0.0 0.5 1.0 1.5 2.0 2.5
100 Pw
Figure 3.3(c). Stress at Diagonal Tension Cracking, vc, from Stirrup Strain (6).
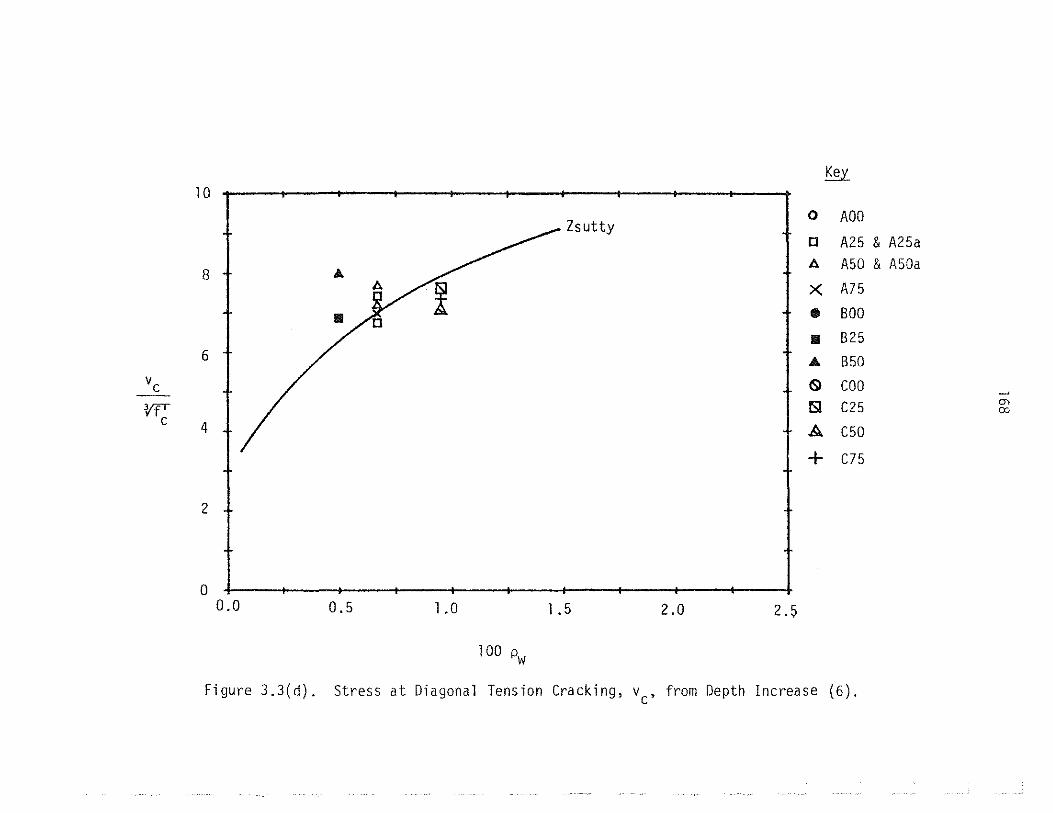
~ 10
I
Zsutty 1 0 ADO [] A25 & A25a
8 + A ./"' + A A50 & A50a
X: A75
IIIII /o - T • BOO
Ill B25 6 A B50
vc 6) coo --vrr lSI C25 "' co
c 4 A C50
+ C75
1 1 2
0 0.0 0.5 1.0 1.5 2.0 2.5
100 Pw
Figure 3.3(d). Stress at Diagonal Tension Cracking, vc, from Depth Increase (6).

160
140
120
100 ~
·~ tn 0.. ~
80 u
> I c
> 60
40
20
0 0
95% upper / confidence limit~
/ /
/ /
/ []
/ /
/ / /
/
,4
/ /
/
20
/
/ /
/
40 60
pvfvy (psi)
/
/
~/ /
A
~
/ /
/
/ /
/ /
/
/ /
/
95% lower confidence limit
vn-vc = 1.51 pvfvy + 5
/
Correlation Coefficient, r = 0.96
80 100
~ 0 AOO
[] A25 & A25a
A A50 & A50a
X A75
• BOO
1111 825
A 850
~ coo lSI C2 5
A C50
+ C75
Figure 3.4(a). Effectiveness of ~leb Reinforcement, vn-vc' from Crack Patterns (6).
~
"' "CO

~
·~ Vl D..
u > I c
>
160 + / l 0~00 / ><
/ + 0 A25 & A25a /A
140 + / A A50 & A50a
/ / X A75
/ /
120 t / / • BOO
95% upper / / 1111 825
confidence limit -y t / .A. 850 100 / A / ~ coo
/ / lSI C25
/ / 80 / / A C50
0 / / + C75 95% lower confidence
/ ~ 60 / /
1 imi t
/ / 40 v /
/
20 'f / / / vn-vc = l .50 p f + 7
· v vy
/ Correlation Coefficient, r =0.96
0 0 20 40 60 ,80 100
P/ vy (psi)
Figure 3.4(b). Effectiveness of Web Reinforcement, v -v, from Concrete Strain 16). n c
~
"' 0

160
140
120
100 ~
·~ Vl 0..
80 u
> I c
> 60
40
20
0 0
/ 95% upper /
/ /
/
/ /A
/ /
/
/ /
/
confidence 1 imi t 7 / / A
/ /
/
/ /
/0 /
20
/ /
/
/
/ /
/
4 /
40 60
P/vy (psi)
/
/ /
/
95% lower confidence limit
v - v = l . 50 p f + 8 n c v vy
Correlation Coefficient, r = 0.97
80 100
Key
0 AOO
0 A25 & A25a
A A50 & A50a
X A75
• BOO
1111 625
A 650
& coo lSI C25
A C50
+ C75
Figure 3.4(c) Effectiveness of ~Jeb Reinforcement, v -v from Stirrup Strair. (6). n c •
~
"

160
140
120
100 ~
·~ V> 0..
80 u
> ' "' >
60
40
20
0
/
0
/ /
/
/ A/
/
/ X.
/ /
95% upper / confidence limit --7
/ /
/ /
/ /o
/
/
/ /
/ /
/ /
.4-/
/.._ /
/
/ /
95% lower confidence limit
v0 -vc ~ l .48 pvfvy + 2
" /
/ Correlation Coefficient, r = 0.90
20 40 60 80 100
Pvfvy (psi}
~ 0 AOO
0 A25 & A25a
A A50 & A50a
X A75
• [300
Ill 625
A 650
6l coo lSI C25
1». C50
+ C75
Figure 3.4(d) Effectiveness of l~eb Reinforcement, vn~vc' from Depth Increase (6).
~
..... "'
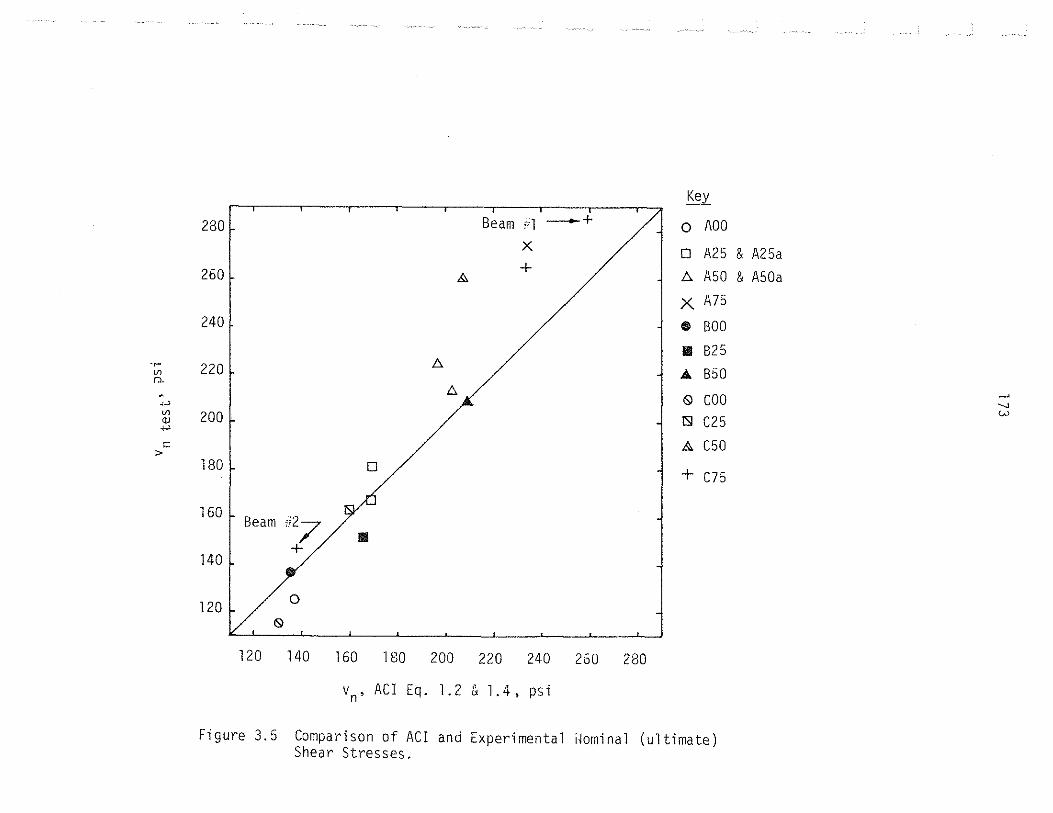
~
280 L Beam #1 --+-+ o ADO X 0 A25 & A25a
260 L + L::. A50 & A50a &
X A75 240 l / j 0 BOO
Ill B2 5 ·~ 220 !::,.
A. B50 "' r:l.
A . 0 coo .__, .;J
V.> "' 200 lSI C25 OJ +-'
= A C50 > 180
~ 1 + C75
160 Beam ;i2? /
Ill +
140 t 120 /o
& -'--
120 140 160 180 200 220 240 260 280
v n, AC I Eq. l. 2 & l. 4 , psi
Figure 3.5 Comparison of ACI and Experimental iJominal (ultimate) Shear Stresses.

l 74
t support
a 1
0
. I I I I I I I IJ-~---~1 '· ill rfy ST
C:..._,....,.,.....-,. - kd
z d
v n
w V +V ay d z
Figure 4.1 Truss t~odel.
tip of crack
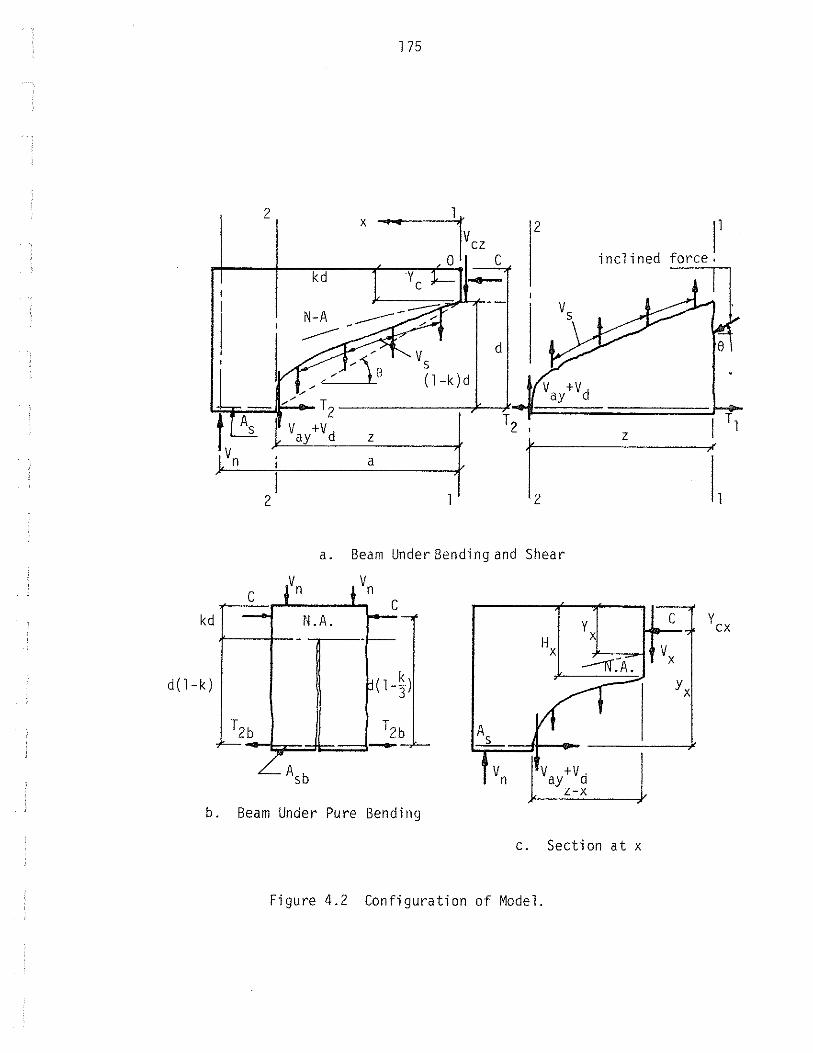
2
t As v ay vn '
I
I 2
kd
d(l-k)
1 75
x ---Jvcz c 2
kd y c -
d
T2 Tz , +Vd z
t a
a. Beam Under Bending and Shear
y
lv +V. ay a z-x
b. Beam Under Pure Bending
11 inclined force.
z I ,(
1
c
c. Section at x
Figure 4.2 Configuration of Model.
Tl

X
y +'Y c Ll c ~c
vcz
--
0
c '----,
vcz
!i X -
!'---..,
y
Yc
~
0 c c -
~t-LD1y
y
neutra 1 axis
E = ~'I<". c u
- ' llo_~
Figure 4.3 Forces and Strains in the Compression Zone.
y
...., c~
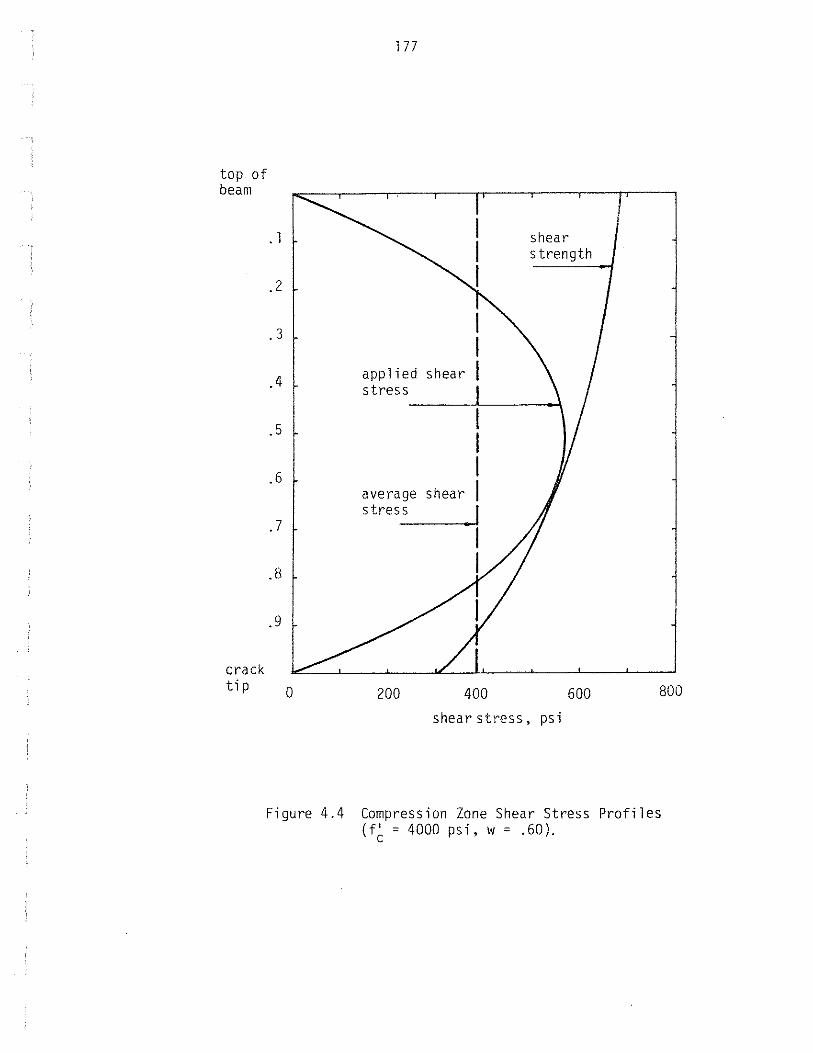
177
top of beam
crack tip
. l shear strength
.2
. 3
.4 applied shear stress
.5
.6 average shear stress
. 7
8
.9
0 200 400 600 800
shear stress, psi
Figure 4.4 Compression Zone Shear Stress Profiles (f~ = 4000 psi, w = .60).

"'I- u b 4-
_,_, 4-
N b 14-u
IM +
"
I cO ~
~ ~
b
-
l 78
I ! 0 L{)
~ 0
•
• ./
/ •
• •
••
--
--N
·--0 I
--
<O---
0 I
--
<.D .--0
I
--00
c)--I
--0 ·--~
I
(].)
0. 0
(].) > <=
WJ
s:: _,_, 0> <= (].) s.. _,_,
V)
"' ·~ X
"'

.lH + ~ ......._
\ .lHQ I
I .12 -
I - u 4-...._ '"' T . . l 0 - I U1 -o-U1
I "' <lJ
I <0 '-
+' .08 U1 -'- I "' <lJ .J::
.06 I U1
z f' 2 o2 f'o 2 2f' 2 o "I .04L I l I (f'' o t t c f' ) t + 4 + 9f'T - 3f' + ~ - t 0 2 c c c (j I T = I 2f' - 4
. 02 L I l t 2 I ( l + 3f' ) c
I -. l 0 . l .2 .. 3 .4 .5 . 6 . 7 .8 . 9 1.0
normal stress, o/f~ @
Figure 4.6 Biaxial o-T Stress Failure Criterion (f~ = 4000 psi).

U")
N
3: Q
0 a
.8
.7
.6
.5
.4
. 3
.2
. 7
.6
.5
I .4 ' 3
. 3
.2
130
¥---- pw =. 005
-....-~---Pw =. 01
'1&-"~---'""-<;:-IP W = . 0 2
K1
=1 -[-.33+.29a/d-.033(a/d) 2 +
.0015(a/d) 3 ](100pw)· 25
A ~l a cas & P.e~an ( 35)
m Bresler & Scorde1is (10) 0 Rajagopalan & Ferguson (36) • Krefeld & Thurston (24)
3 4
vcz vc·
5 6 7
a/d
8
Figure 4.7 Shear Force Distribution Factor versus ShearSpan to Depth Ratios and Percentage of Longitudinal Reinforcement.

Vl LL
<... 0 .,_,
. 30
;.; . 20 '+-
en <= ·~ <= QJ +' 4-0
Vl • 10
f' = 3000 psi c P/vy = 0.0
3 4 ~ 6
a/d
extrapolated values
7
f~ = 4000 psi
P/vy = 0.0
3 4 5 6 7
a/d
f~ = 5000 psi
P/vy = 0.0
3 4 5 6 7
a/d
Figure 4.8 Softening Factor Versus Concrete Strength, Shear-Span to Depth Ratio, ~nd Percentage of Longitudinal Reinforcement.
00 ~

-"' • "' ~ X
"' -"' '-+-' ::>
"' c 4-0
..c: +-' CL
"' 0
f~ = 3000 psi
P/vy=O.O
I
f~ = 4000 psi
p f = 0.0 v vy
f~ = 5000 psi
p f = 0.0 v vy
. 30
. l
I /
I ,. ...
3
p =.0
4 5 6 a/d
extrapolated values
7
;/
"'
.,. ,.,.
3
P. =. 01
Pw=.005 Pw=.005
4 5 6 7 3 4 5 6 7 a/d a/d
Figure 4.9 ~eutral Axis Depth, k , versus Concrete Strength, Shear-Span to Depth Ratio, and Percentage of Longitudinal Reinforcement.
00 N

183
3 4 5 a/d 6 7 8
Figure 4.10 Nominal Concrete Compression Zone Shear Strength, v , Versus Concrete Strength, Shear-Span to Depth Ratio, and Percentage of Longi tudi na 1 Reinforcement.
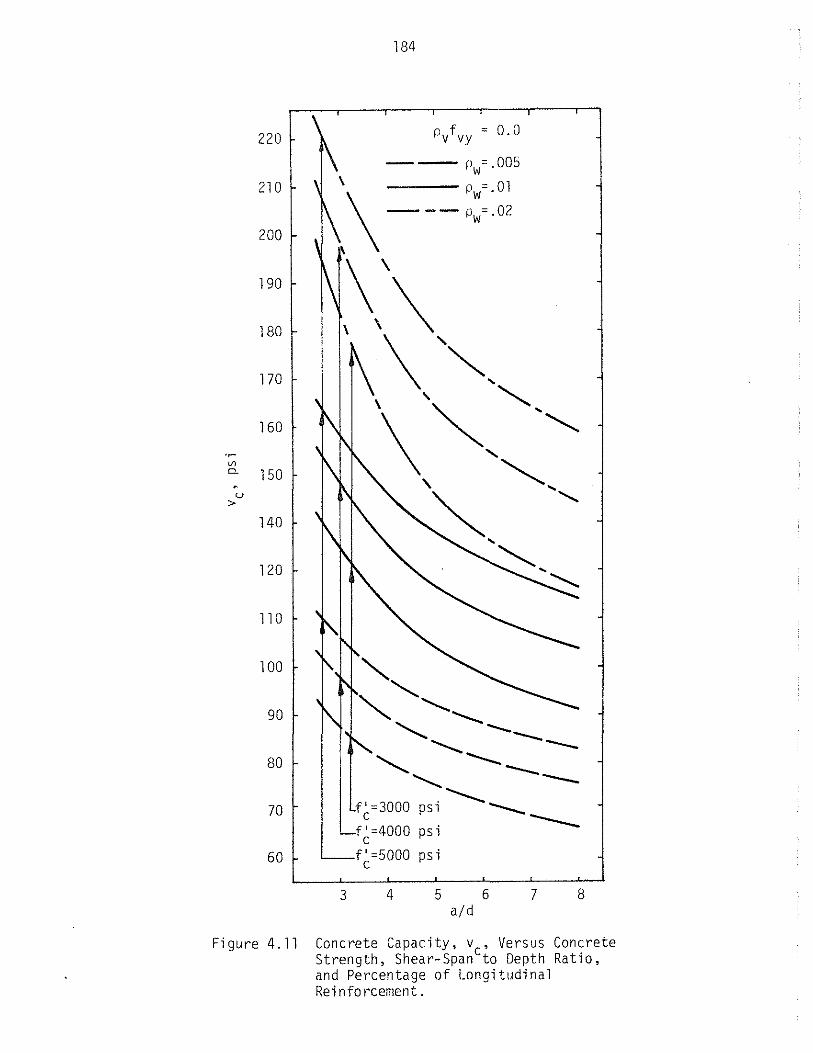
220
210
200
190
180
170
160
·~ Vl 0. 150 .
u >
140
120
110
100
90
80
70
60
3
184
""-, ""- '-.........._
"-.... ---....._ --"-.... --
'-..... ---f'~3000 psi-......_......_
c ---f~~4000 psi
f~~5ooo psi
4 5 6 7 8 a/d
Figure 4.11 Concrete Capacity, vc, Versus Concrete Strength, Shear-Span to Depth Ratio, and Percentage of Longitudinal Reinforcement.

185
120
100
80 . 5 1.0 1.5 2.0
Figure 4.12 Comparison of Predicted Equations for Shear Capacity.

186
" Krefe1t & Thurston (24)
e P1acas & Regan ( 35)
250 [±] Rajagopa1an & Ferguson ( 36)
& Bresler & Scorde1is ( 1 0) .. .. ..
.... .. V1 200 • ..... , .. 0.
. (!) +-' V1 (!) • • <lJ & • .. +-'
c •t. > • • • e.• • e 150 ..
• • .. [±]
• • " [±] [±]
[±]
[±] mean ~n~est = l.O
100 n [±] 1!1 coefficient of variation= 9.5~
150 200 250
predicted vn, psi
Figure 4.13 Comparison of Predicted with Experimental Shear Strengths for Rectangular Beams without Stirrups Used to Develop the Proposed Model.
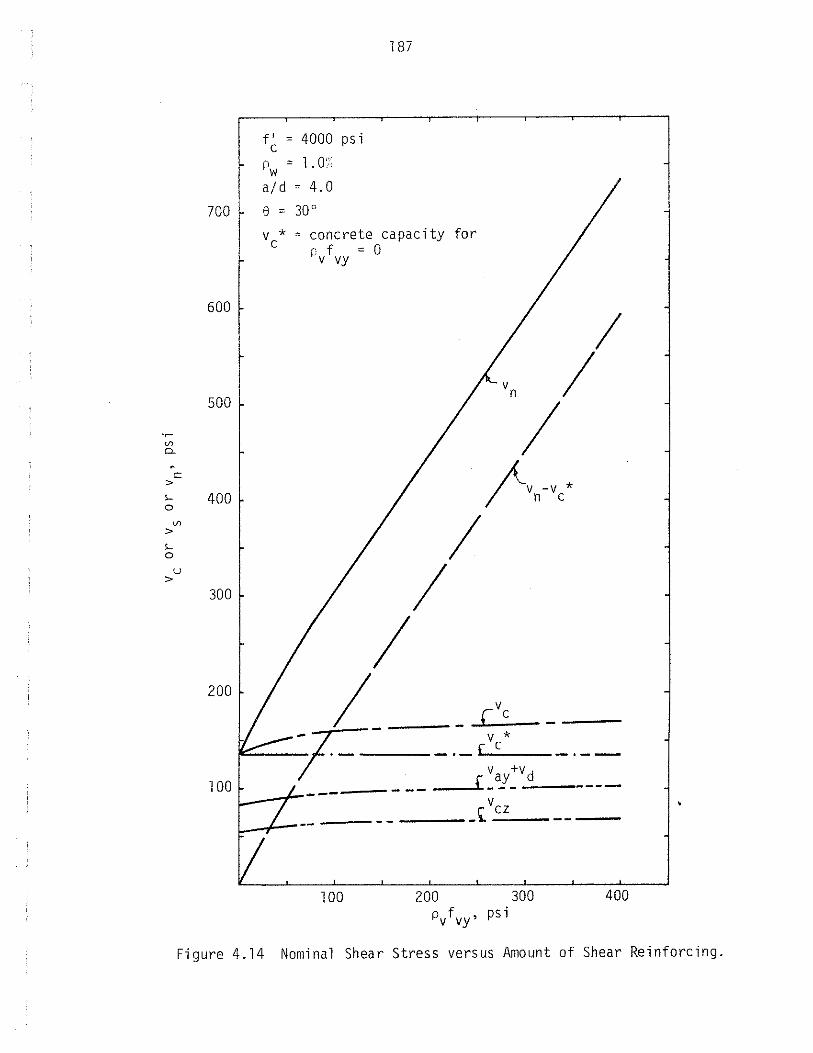
·~ U1 0..
. c
> '-0
U1 >
'-0
u >
187
f' c
4000 psi
Pw = 1 . 0~' a/d = 4.0
700 e = 30°
600
500
400
300
200
v * c = concrete capacity for
r. f = 0 •·v vy
100
I
I I
v * c L....:;. __ -.--
--.l.f ~ ':!' ~v..:d;__ __ ---
vcz ----~ ..:..:..__
200 300 P/vy' psi
400
Figure 4.14 Nominal Shear Stress versus Amount of Shear Reinforcing.
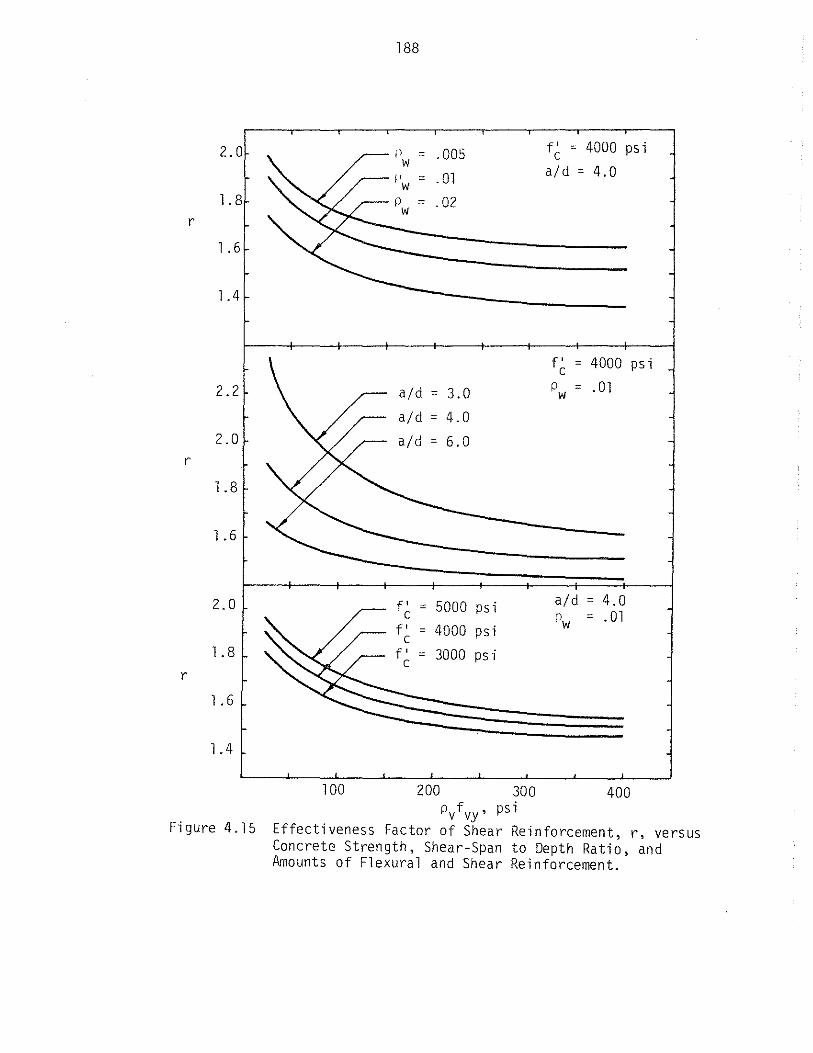
188
2.0 f' = 4000 psi = .005 c
= . 01 a/d = 4.0
1.8 = .02 r
1.6
1.4
f' c 4000 psi
2.2 ajd 3.0 Pw = . 01 =
a/d = 4.0 2.0 a/d = 6.0
r
1.8
1.6
f' 5000 psi a/d = 4.0 2.0 = .01 c Pw =
f' = 4000 psi c 1.8 f' = 3000 psi c
r
1.6
1.4
100 200 300 400 pvfvy' psi
Figure 4.15 Effectiveness Factor of Shear Reinforcement, r, versus Concrete Strength, Shear-Span to Depth Ratio, and Amounts of Flexural and Shear Reinforcement.

·~ V1 Q_
c >
900 QTests (17),
f:l. Tests (17),
800 Pw = 3.81.
700
f' = 4000 psi c
189
f' = 4000 psi, r = 3.81:., a/d = 2.5 c w f' = 4000 psi, p = 3.81 ., c w
a/d = 4.25
a/d = 2.5
600
a/d = 4.25
100 200 300 400
P/vy• psi Figure 4.16 Effect of Shear-Span to Depth Ratio on Shear Capacity.

V1 Q_
c >
700
600
500
400
300
200
100
a/d = 4
f' = 4000 psi c
100
190
Pw = 2":
Pw = L
Pw = o. s;,
200 300 400 P/vy' psi
Figure 4.17 Effect of Percentage of Longitudinal Reinforcement on Shear Capacity.
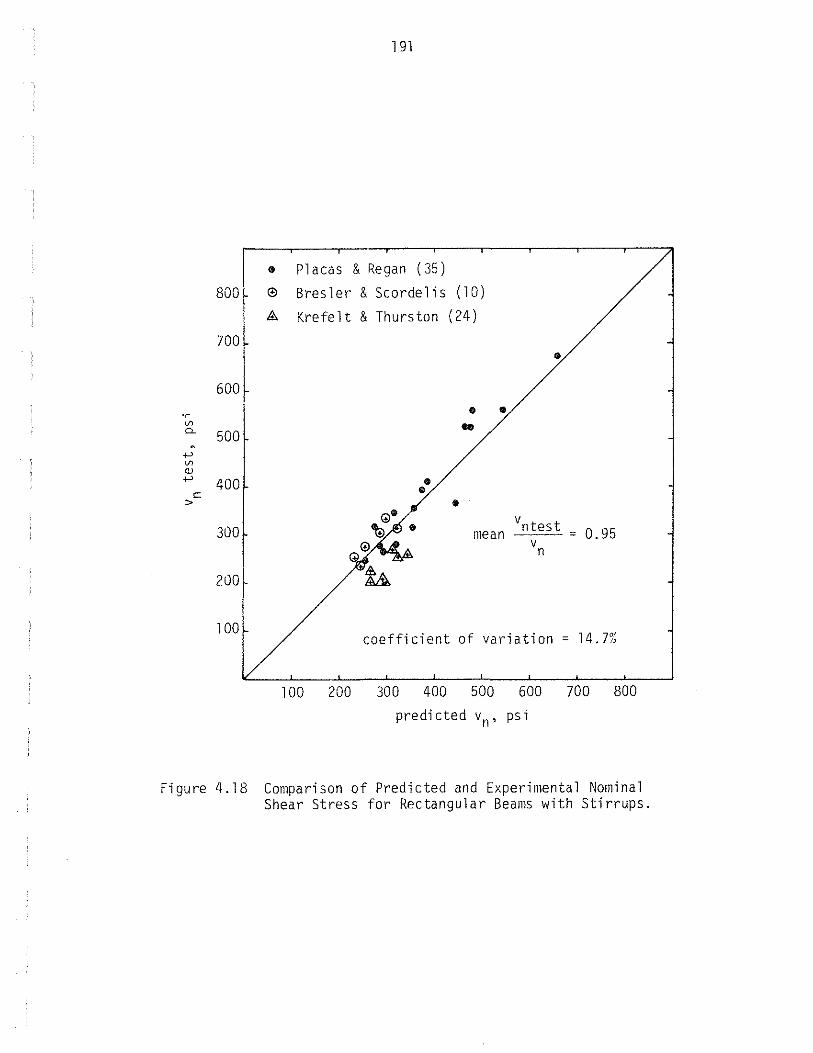
• 800 @
&
700
600
·r
"' CL 500 . +-'
"' "' +-' 400 c
>
300
200
100
191
Placas & Regan (35)
Bresler & Scordelis (10)
Krefelt & Thurston (24)
• • •
• • ...
•
vntest mean ---- 0.95 vn
coefficient of variation = 14.7%
100 200 300 400 500 600 700 800
predicted vn, psi
Figure 4.18 Comparison of Predicted and Experimental Nominal Shear Stress for Rectangular Beams with Stirrups.

800
700
600
U1 500 CL
. +' U1 Q)
400 +'
c >
300
200
100
192
+
• Author 0 P1acas & Regan ( 35)
0@ 0 Haddadin, Hong & Mattock ( 17)
G> 0
@ El 0
e 0 e
~e +
0 + vntest ~ mean = 1.15 •• vn • I coefficient of variation = 19. 74 ..
l"
100 200 300 400 500 600 700 800
predicted vn' psi
Figure 4.19 Comparison of Predicted and Experimental Nominal Shear Stress forT-Beams with Stirrups.

a
d
193
APPENDIX A
NOi4ENCLATURE
area of longitudinal reinforcement
area of longitudinal reinforcement in equivalent beam under pure bending that produces neutral axis location equivalent to neutral axis in beam under bending and shear
area of shear reinforcement
silea r-span
width of a rectangular beam or web width of aT-beam
compression force in the concrete
resultant of normal stresses for a depth y from the top of the beam
effective depth of beam
Ec modulus of elasticity of concrete (Ec = 57,000~)
f' c
fey
f' t
fvy
Hx
jd
k
kd
modulus of elasticity of steel
geometric and shear softening factor
concrete cylinder strength
concrete compression stress at a distance y from the top of the beam
modulus of rupture of the concrete
tensile strength of the concrete (ft = 5~ , assumed)
yield stress of shear reinforcement
depth of concrete compression zone at section x
internal moment arm
ratio of compression zone to effective depth
depth of conrrete compression zone at plane 1-l
ratio of dowel plus interface shear to total concrete she a r ( K1 = ( V n + V ay) /V c)
K2 ratio of shear carried by stirrups to nominal shear (K2 = V/Vc)

194
K3 variable coefficient
M applied moment
Mu applied moment
M0 moment for the pure bending case
1-1 applied moment at section x X
n modular ratio (n = Es/Ec)
Rb design cube strength
r
s
T ·-1 ? i'l- ''-
v
effectiveness factor of shear reinforcement (r =
stirrup spacing along the axis of beam
tension force in the longitu~n~ reinforcement at section
tension force in the longitudinal reinforcement in the pure bending case
applied shear
interface shear capacity ( verticcl component of aggregate inter] ock)
shear carried by the concrete (Vc = Vcz + Vay + Vd)
shear carried by the concrete compression zone
shear carried by the dowel action of longitudinal reinforcement
nominal (ultimate) shear capacity
V11
test experimental ultimate shear capacity
v
shear carried by the shear reinforcement
applied shear
nominal shear stress
interface shear stress
shear cracking stress (diagonal tension cracking stress) vcz
compression zone "stress" (vcz = bd) w
shear cracking stress for beams without stirrups

195
vc test experimental shear cracking stress
vd dowel shear stress
vn nominal ultimate snear stress
vn test experimental ultimate shear stress
w
X
y
y
-y
z
a
los
shear stress carried by the shear reinforcement "c compression strain ratio (w = --) "u
distance from plane 1-1 a 1 on g the 1 ong itud ina 1 axis of the beam
distance to the neutral axis from the top of the beam
distance of point of application of resultant, c. from the extreme compressive fiber of the beam at plane 1-1
distance of point of application of resultant, C, from the extreme compressive fiber of the beam at section x
distance of neutral axis from the extreme compressive fiber of the beam at section x
distance from the extreme compressive fiber of the beam
distance of point of application of resultant, C, from the neutral axis
distance of point of application of resultant, C, to the level of flexural reinforcement at section x
horizontal shear crack projection
inclination of web reinforcement to longitudinal axis
total elongation of longitudinal reinforcement between sections 1-1 and 2-2
strain in extreme compressive fiber of concrete
strain in the extreme compressive fiber of the concrete at section x
strain in concrete at a distance y from the top of the beam
strain in the longitudinal reinforcement at section 2-2.
average strain in the longitudinal reinforcement

8
196
strain at the level of the flexural reinforcement at location x
inclination of inclined crack A
ratio of shear reinforcement (pv = b ~) w
percentage of longitudinal reinforcement
o normal applied compressive stress in the concrete
o1 principal tensile stress
o2 principal compressive stress
T failure shear stress of the concrete
Tav average shear stress within compression zone at failure
TY shear stress at a distance y from the top of the beam
~ strength reduction factor (from ACI)

197
APPENDIX B
STRAIN GAGE INFORHATION
The type and size of the strain gage used in this investigation are
shown in Table B. 1.
2.4 inch paper backed gages supplied by the Precision Measurement
Co. were used to measure concrete strain in all beams except Beams #1 and
#2. 1.0 inch paper backed gages supplied by BLH Electronics were used
for Beams #1 and #2. The steps of the concrete gage installation were:
smoothing the concrete surface with a grinding wheel, bonding the gage
to the concrete with Duco cement, and protecting the gage with a layer
of Duco cement.
0.03 inch foil gages were used to measure steel strain. This small
size was selected in order to make installation possible on the smallest
diameter stirrup used (0.132 inches). The steps of foil gage installation
were: cleaning and preparing the specimen surface, bonding the gage to
the steel surface and waterproofing. All material used for the foil
gage ins ta 11 ati on was supplied by the Mi cro-~leasurements Co. The surface
preparation materials were M-Prep Conditioner A and 1'1-Prep Neutralizer 5.
The bonding media consisted of M-Bond 2JO catalyst and t1-Bond 200 adhesive.
The waterproofing coat was M-Coat G. For additional information on the
material used and detailed information on the procedure of installation
of the foil gages see References 28 and 29.
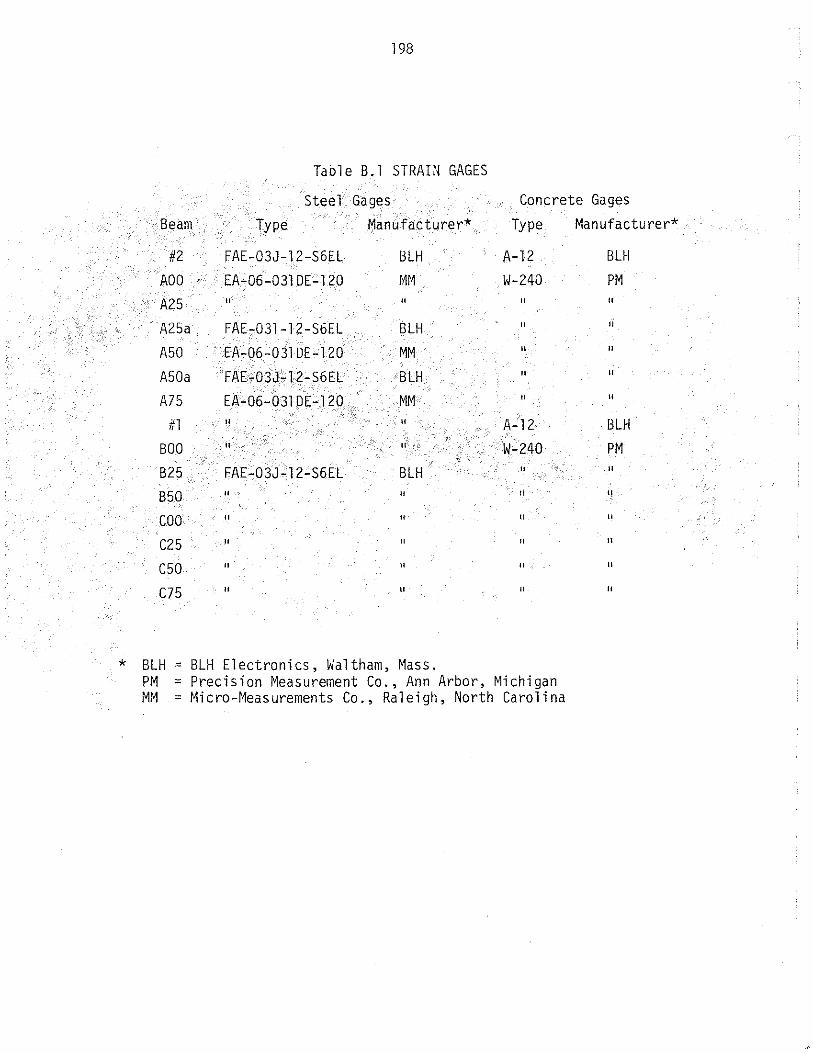
198
TaoleB.l STRAI ~~ GAGES
Steel Gages Concrete Gages
Beam Type Manufacturer* Type
#2 FAE-03J-l2-S6EL BLH A-12 ADO EA-06-031DE-l20 Mt~ W-240 A25 " " " A25a FAE-031-l2-S6EL BLH " A 50 EA-06-031DE-120 MM " A50a FAE"03J-12-S6El BLH " A75 EA~06-031 DE-J 20 M~1 II
#l II II A-12 BOO II II W-240 B25 FAE-03J-12-S6EL BLH II
B50 II II " coo II " " C25 II II " C50 " " " C75 " " "
* BLH = BLH Electronics, Waltham, Mass. PM =Precision Measurement Co., Ann Arbor, Michigan MM =Micro-Measurements Co., Raleigh, North Carolina
Manufacturer*
BLH PM II
II
II
" " BLH PM II
•!
" II
" II