Embed Size (px)
Citation preview


Final Report
TESTS OF THE PUNCHIN SHEAR STRENGTH
OF LIGHTLY REINFORCED OR OTROPIC BRIDGE DECKS
State Project No.: 9700-7375-119
OF Project No.: 910450420712
WPI No.: 510413
by
Clifford 0. Hays, Jr.
John M. Lybas
Jose 0. Guevara
Engineering and Industrial Experiment Station
College of Engineering
Department of Civil Engineering
University of Florida
Gainesville, Florida
Submitted to
Florida Department of Transportation
August 1988
DISCLAIMER
"The opinions, findings and conclusions expressed in this
publication are those of the authors and not necessarily
those of the Florida Department of Transportation or the
U.S. Department of Transportation.
Prepared in cooperation with t e State of Florida Department
of Transportation and the U.S. Department of Transportation."


INDEX
Chapter
1. Introduction
1.1 Previous Research-and Implementation
1.2 Scope of Florida Tests
1.3 Additional Studies
Chapter
2. Test Program and Procedures
2.1 Size and Scale Factors of Test Specimens
2.2 Material Properties of Test Specimens
2.3 Loading and Instrumentation
Chapter
3. Test Behavior
3.1 Interior Tests
3.2 Free Edge Within-span and Corner Tests
3.3 Parapet Within-span and Corn r Tests
3.4 Comparisons to Highway Loads
Chapter
4. Summary and Recommendations
Appendices
A. LVDT Locations For Tests
B. Complete Load Deflection Plots
C. Strain Gage Locations For Tests
D. Strain Gage Plots
E. Crack Patterns Observed
F. Material Properties
G. Measured Thicknesses of Deck

CHAPTER ONE
INTRODUCTION
It is well known that the AASHTO (1) provisions for concrete bridge
decks, based on design of the slab for flexure are very conservative. Ap-
parently the primary reason for the conservatism is that the horizontal ex-
pansion of the bottom surface of the slab caused by flexural strains are
restrained by the longitudinal girders and other parts of the bridge system.
This induces compression in the slab, increasing the failure load, and is
referred to as arching action.
1.1 Previous Research and Implementation
Research performed by the Ontario Ministry of Transportation (3,4,5,6),
on both small scale models and prototype bridges indicated strengths under a
two tire loading to be far in excess of that required by normal wheel loads
on Canadian or American highways. The Ontario research emphasized the
importance of lateral confinement and the associated arching action on the
strength of the deck.
Based on the punching shear research the Ontario Highway Bridge Design
Code, OHBDC (8), adopted a simple empirical design approach for bridge
decks, allowing 0.3% orthotropic reinforcement top and bottom in both
directions,
when certain requirements relative to slab thickness, transverse span-to-
thickness ratio, transverse span, diaphragms, overhangs, and other
parameters are met.
Considerable interest has been shown in developing a OHBDC-like design
approach for application in the United States. It has been estimated by the
FDOT engineers that the use of 0.3 % orthotropic reinforcement could save
from one fourth to one half the quantity of reinforcement in typical bridge
decks.

Also, reducing the quantity of deck steel has advantages in reducing conges-
tion in the deck during placement of the concrete and in reducing the
conduits for corrosion to enter. However, there are several differences
between Canadian and US practice in bridge construction, which led several
states to do research on punching shear.
As early as 1971, scale model tests were performed by the New York
Highway Department (2) that confirmed the general behavior of the bridge
decks observed in the Ontario research. Recently an extensive research
program has been carried on at the University of Texas on a full scale
laboratory model. The Texas tests (7,9,10) were made on a full scale model
of a 7-1/2" thick deck supported on three steel girders spaced at 7'-0"
center-to center. The overall deck dimensions in plan were 20' by 50'. Half
of the bridge was constructed using stay-in-place panels and the other half
was of conventional cast-in-place construction.
First the bridge was supported as a simply supported bridge with the
girders having a span of 49' - 0". Four wheel loads were applied simultane-
ously to represent a two axle truck straddling the center girder. The bridge
was statically loaded to wheel load of 60 kips and then subjected to cyclic
wheel loads of approximately 26 kips for 5,000,000 cycles. After the cyclic
loading the wheel loads were again applied statically, this time to a load
of 40 kips. The bridge performed well in all areas.
The same bridge used in the first series of tests was then subjected to a
loading to simulate the behavior of a continuous girder bridge in the
negative moment region. The bridge was loaded with four concentrated loads to
represent a tandem with two axles and four wheel loads. Static and cyclic
tests were performed. Again the bridge behaved well under the static and
cyclic loading.

Then, single point and double point concentrated load tests were made to failure
in both the cast-in-place and stay-in-place portions of the deck. The single
point failure loads exceeded 140 kips for the cast-in-place deck. Total load for
the two point failure test exceeded 200 kips for the cast-in place deck. The
corresponding failure loads for the stay-in-place portion of the deck were even
higher.
Finally, additional tests were made on a skewed slab specimen which per-
formed well under monotonic failure loading. The Texas researchers showed that
the beneficial effects of lateral confinement exist even prior to cracking of
the deck and the development of yield lines. This is important; because it
shows that stresses in the steel even at service load levels may be
substantially less than that given by AASHTO criteria.
The Texas tests are very encouraging. However, they only involved one
span-to-thickness ratio for the slab, 11.2. The OHBOC allows the simplified
orthotropic design for values up to 15. Also, the Texas research, like the
Ontario research, did not involve tests in the overhanging areas of the slab.
1.2 Scope of Florida Tests
A series of laboratory tests on approximately one-half scale models of
concrete bridge decks built with the 0.3% orthotropic reinforcement, consis-
tent with the Ontario empirical design approach, are underway at the Univer-
sity of Florida. These tests are meant to extend and enhance the prior re-
search, and provide data on the feasibility of using the empirical approach
for bridge deck design in Florida and other states.
The major differences between Canadian and American practice with regards
to bridge deck construction are as follow. First, it is common practice in many
states to use deck thicknesses less than the Ontario minimum of

8.85 inches. The test specimens reflect this, and additionally incorporate
transverse span-to-thickness ratios up to 22, greater than the Ontario maxinum
of 15. Using these higher span-to-thickness ratios would permit using fewer
longitudinal girders than would normally be required for a particular bridge
structure, with obvious cost savings.
Second, bulb-tee girders, currently finding application in Florida and
other states, will be incorporated into several specimens. As the flanges of
these girders are quite wide, and tapered in thickness, the definition of span-
to-thickness ratio is not so straightforward as for a deck, on steel girders,
and the tests will be designed to study this.
Third, the Ontario tests did not include loads applied to overhanging
edges of slabs, and the Florida tests will include this. While the capacity for
confinement in overhangs, and therefore arching, would be slight, some tests
are warranted, especially considering the edge stiffening affects of the
parapets normally used at slab edges. This report documents the first year of
the study involving the static application of simulated wheel loads to three
specimens.
1.3 Additional Studies
Based on the performance of the three specimens tested statically, a
fourth specimen will be constructed and tested in the second year of the proj-
ect:. This specimen will be subjected to a large number of cyclic loads and
them subjected to static loading to failure. The second year's testing will
include three specimens with slabs cast on standard size bulb-tee girders,
as recently adopted in Florida.
Additional work is planned to thoroughly analyze the results of all tests
comparing the observed behavior to finite element and other analytical models.

Chapter 2
TEST PROGRAM AND PROCEDURES
2.1 Size and Scale Facto s of Test Specimens
The general cross-section of the three specimens are shown in Figure 1.
The same three simple span steel girders were used to support all three decks.
Sacrificial steel plates were bolted to the girders to transfer the horizontal
shear forces between the slab and the girders and yet permit the easy removal
of the decks after each specimen was tested.
A parapet was located on one side of he specimens while the other side
had only a plain overhang. The model parapet dimensions were chosen to ap-
proximate the flexural and torsional stiffness properties of a standard FDOT
parapet at the appropriate scale.
The center-to-center spacing between he girders is S, the overhang dis-
tance on the side of the bridge with the parapet is A and the overhang dis-
tance on the other side of the bridge is B.
In any test program the range of variable that can be looked at is fi-
nite. When large specimens are involved this is even more true. After con-
siderable discussion with the FDOT and after the excellent performance of the
first specimen it was decided to hold all parameters for the prototype essen-
tially constant in the three tests except or the slab span-to-thickness
ratios. The scale factors were selected to be as close to 2.0 as possible and
give the desired span-to-thickness ratios, subject to the limitations on the
available width of the specimen between laboratory hold downs.
The three specimens were designed to have span-to-thickness ratios
(S/T), of 18, 20 and 22, with the overhang-to-thickness ratios, (A/T) and
(B/T), increasing proportionally. The nominal deck thicknesses were selected
on the


models to imply an eight (8) inch deck at full scale. After construction the
deck thickness was measured using a surveyors level and the results are shown
in Appendix 0. The table in Figure 1. shows the S/T, A/T, and B/T ratios com-
puted using the average thicknesses of the decks. The scale factors shown in
the table were computed using the average measured deck thicknesses to give a
prototype or full scale deck thickness of inches.
The first specimen was constructed entirely with University of Florida
personnel and was satisfactory in all respects except for the finishing of the
top of the concrete deck. Due to the large volume of concrete and large sur-
face area to be finished, the deck's top surface was not finished as well as
desired. For the second and third test specimens, Durastress Concrete provided
professional concrete finishers to assist in the placement and finishing of
the concrete in the deck. Both the second and third specimens had a uniform
high quality finish of the deck top.
Figure 2. shows a plan view of the specimens. The simple span length of
all specimens was 24'-11" and the length of the steel beams and deck was
25'8". Corresponding span length at full scale ranged from approximately 45
to 62 feet. The x-braces were welded to the top and bottom flanges of the
girders at the three longitudinal positions shown in Figure 2.
2.2 Material Properties of Specimens
For a scale factor of approximately 2, the maximum size aggregate should
be approximately 3/8". Thus, the coarse aggregate used was FDOT designation
#89. Because of the volume of concrete in the deck it was advisable to use a
ready mix concrete. The concrete mix was a FDOT type II with a a design
strength of 3,400 psi. Average compressive strengths at 28 days were 5590 psi,
5980 psi, and 5720 psi for specimens 1, 2, and 3, respectively.


Complete cylinder compressive and flexural modulus of rupture test re-
sults are shown in Appendix F. ,Also, Appendix F contains an aggregate grada-
tion curve and typical concrete mix proportions.
It is difficult to obtain deformed reinforcement for scale modeling of
tests even for one-half scale testing. For the .370 orthographic reinforcement
in an 8" deck a typical reinforcement pattern would be #4 @ 12". For a scale
factor of 2.0, this implies #2 0 6". Deformed wire of approximately the same
size as a #2 bar is available (0.05 si); however, the wire is usually cold
drawn and has higher strength and less ductility than conventional reinforce-
ment. Ivey Steel in Jacksonville Florida cooperated with the University of
Florida to provide a steel wire with good ductility and a yield stress close
to that for conventional reinforcement.
The Stress-strain curve for the reinforcing wire is shown in Appendix F.
The wire used in the specimens was nominal y a D5 (.05 si). However, the com-
puted area based on weight is only about 0 0477 si. Using the .0477 area
gives a yield stress of about 76 ksi. However, using the nominal area of 0.05
si gives a yield stress of only 72 ksi. T e stress-strain curve exhibits a
definite yield plateau and has quite good ductility.
Figure 3. shows the spacing of the reinforcing wire for the specimens.
The primary reinforcement was the D5 wires at 6" on centers both ways top and
bottom in the deck. The cover to the transverse top and bottom bars was 1".
On the side without the parapet, extra transverse top bars were used with the
same spacing as the primary reinforcement. In addition, for specimen No. 1
only, extra transverse reinforcement similar to that on the free edge was used
on the side with the parapet. Extra later 1 reinforcement was used in the end
section to provide additional support at the discontinuous end of the slab as
shown in Figure 3.


Figure 4. is a photograph of specimen number three showing the
general layout of the specimen.
2.3 Loading And Instrumentation
By loading the deck in a variety of locations, the relative effects of
the parapet, the free overhang, and the confinement of the interior spans
could be observed. The loading positions and patterns for the three specimens
are shown in Figures 5, 6, and 7, respectively. Loads were applied to the
deck through heavy steel plates, shaped an sized to model the imprint of one
dual wheel formation at half scale.
Loading on the first specimen represented either one set of dual tires or
two sets of dual tires belonging to separate trucks passing close to one an-
other. However, when the (S/T) ratio was et for the second and third tests
it became apparent that the effect of a full tandem of loads should be
investigated. Thus, for the second and third specimens, four loads
representing a full tandem wheel formation of one tuck were applied. In all
discussions of test loads, the entire load on the test is given, whether it
is distributed to one, two, or four wheel plates.
Figure 8. shows a view of the load assembly used to apply the tandem loads.
Two 6" deep steel W sections were supported on rollers that were placed on top
of the four wheel pads. A 6" deep steel W section spanned between the two lower
steel sections and was loaded by the vertical hydraulic ram. The ram jacked
against a longitudinal beam that spanned between two lateral frames that spanned
over the specimen. Rollers were not used under the lower steel W section for
specimen numb r two; thus, the loading might not have been exactly equally
distributed for those tests.


17
Loads were applied statically using an hydraulic ran and left in place
briefly prior to reading the instruments. Differential transformers (LVDT's)
were used to measure vertical deflections and electric resistance strain
gages were used to measure strains. LVDT and s rain gage readings were
obtained and recorded on a HP 9820 data acquisition system.
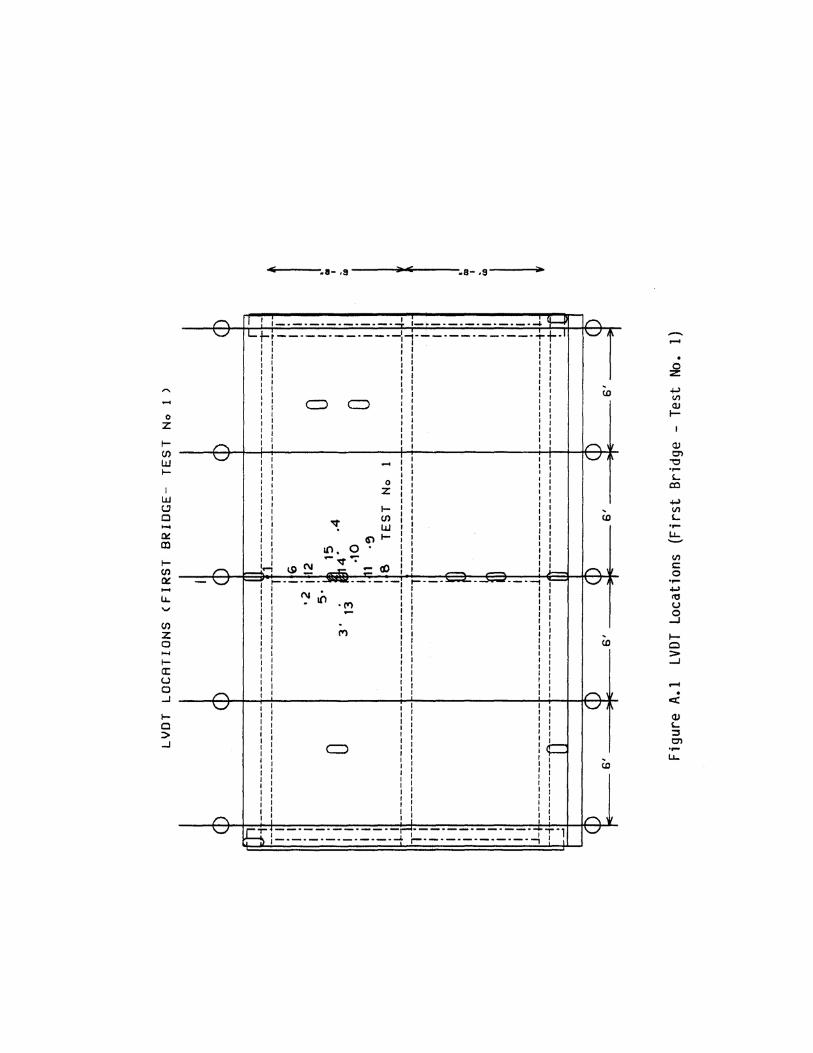
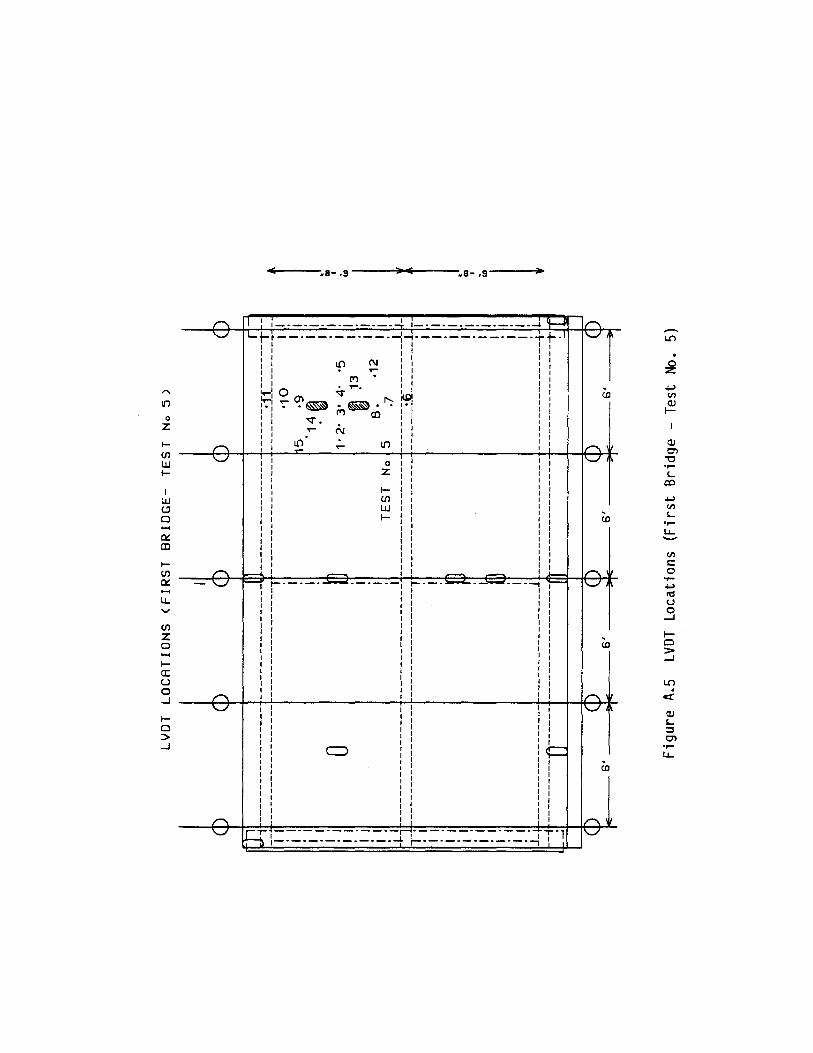
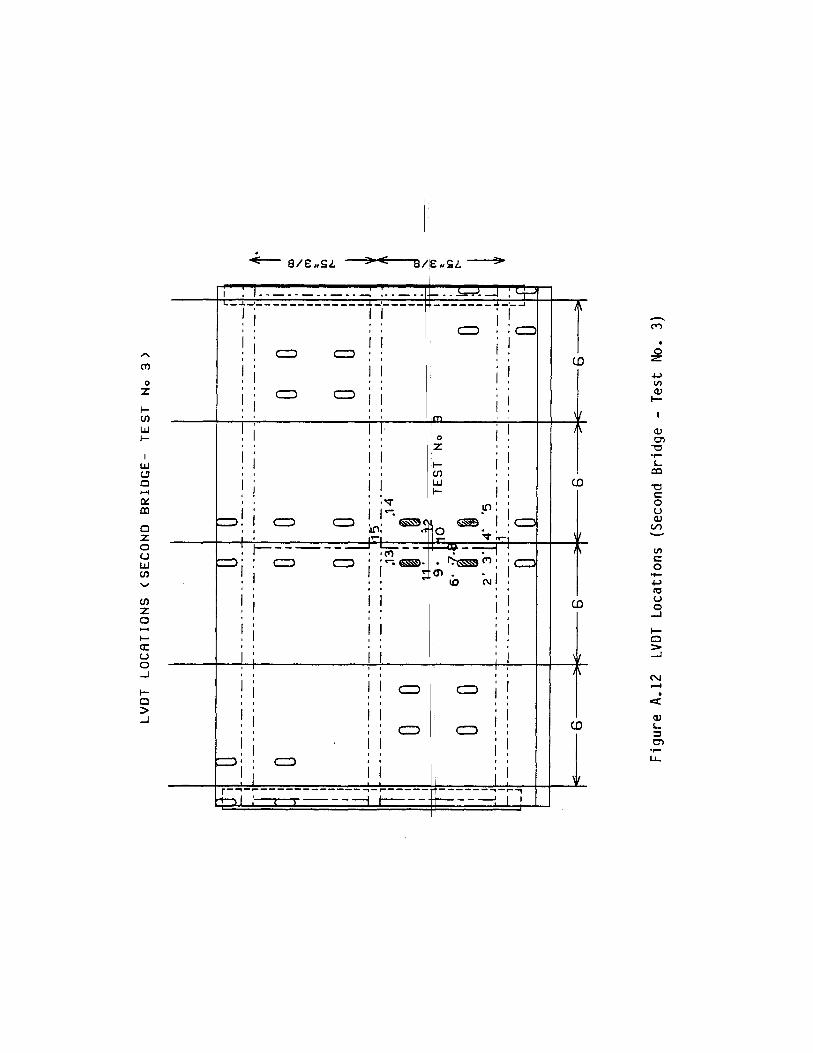
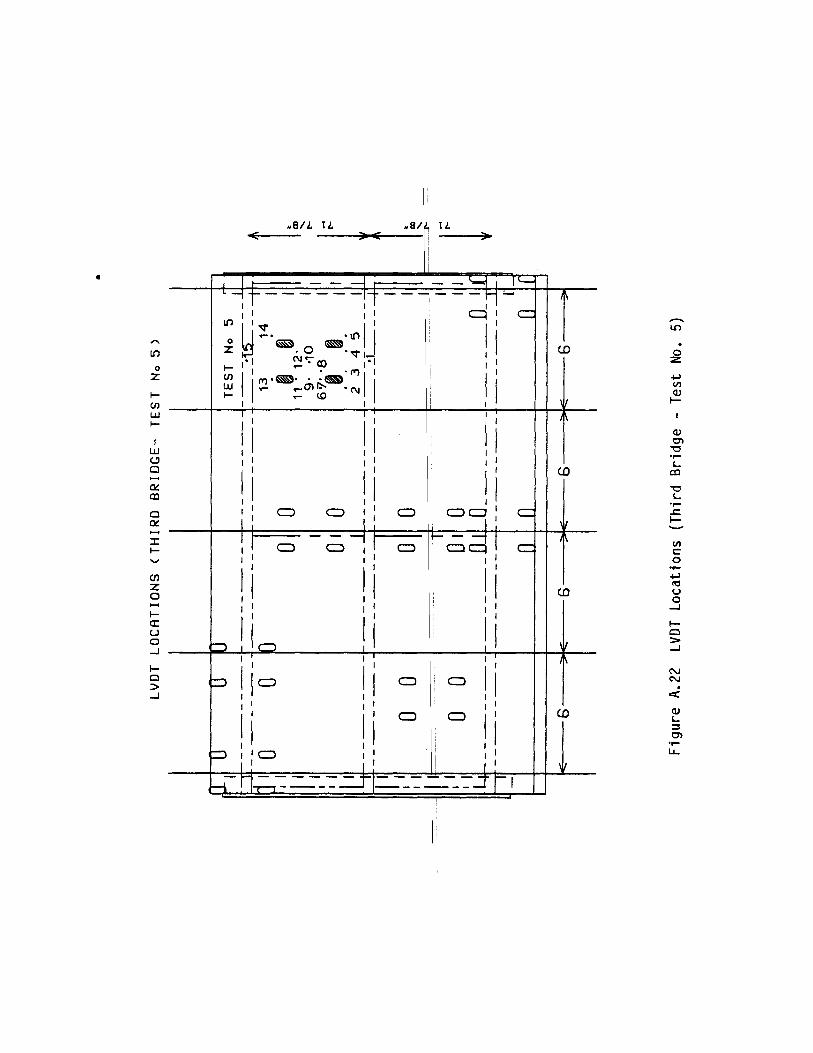
Vertical deflections were measured using 15 LVDT's, arranged in a
pattern so as to define a deflection basin. All VDTs, except for the one
measuring the deflection of the load plate, were supported on wooden support
beams for specimen #1 and aluminum support beams for specimens two and three.
The central LVDT used to measure the deflection f the load plate was
supported such that it included the vertical deflection f the test frame.
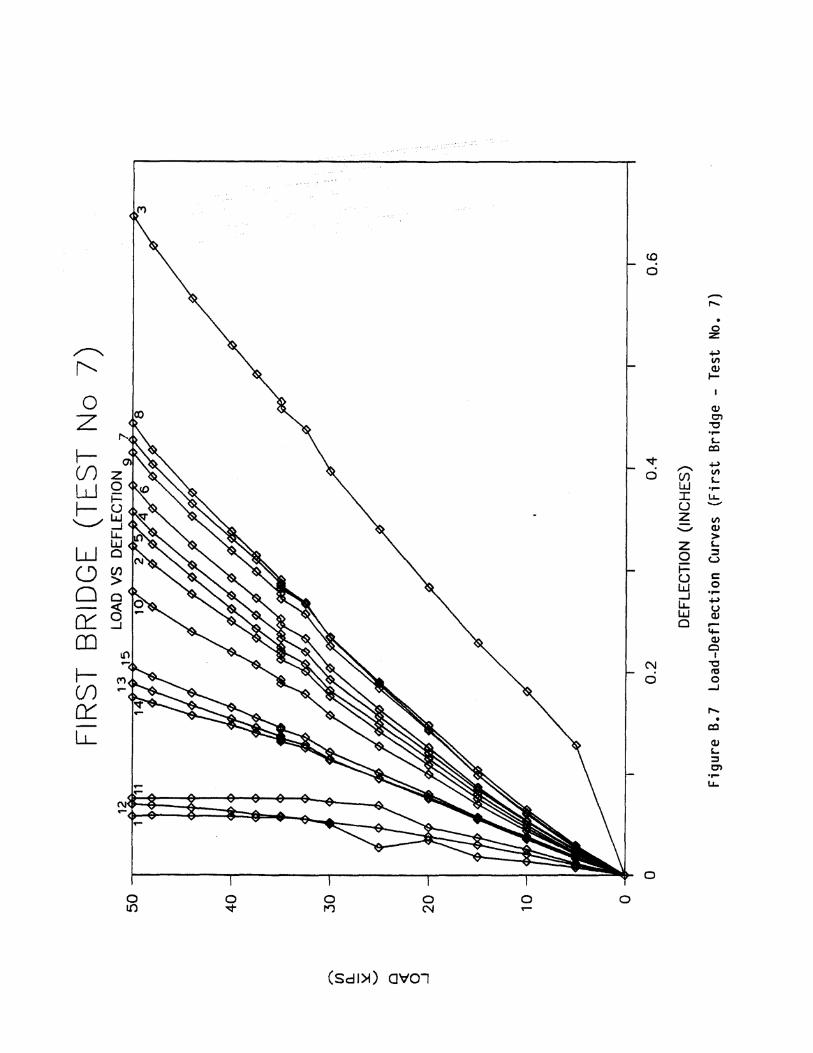
Appendix A shows. the locations of the LVDT's for all tests and Appendix B
gives complete load deflection plots for all tests.
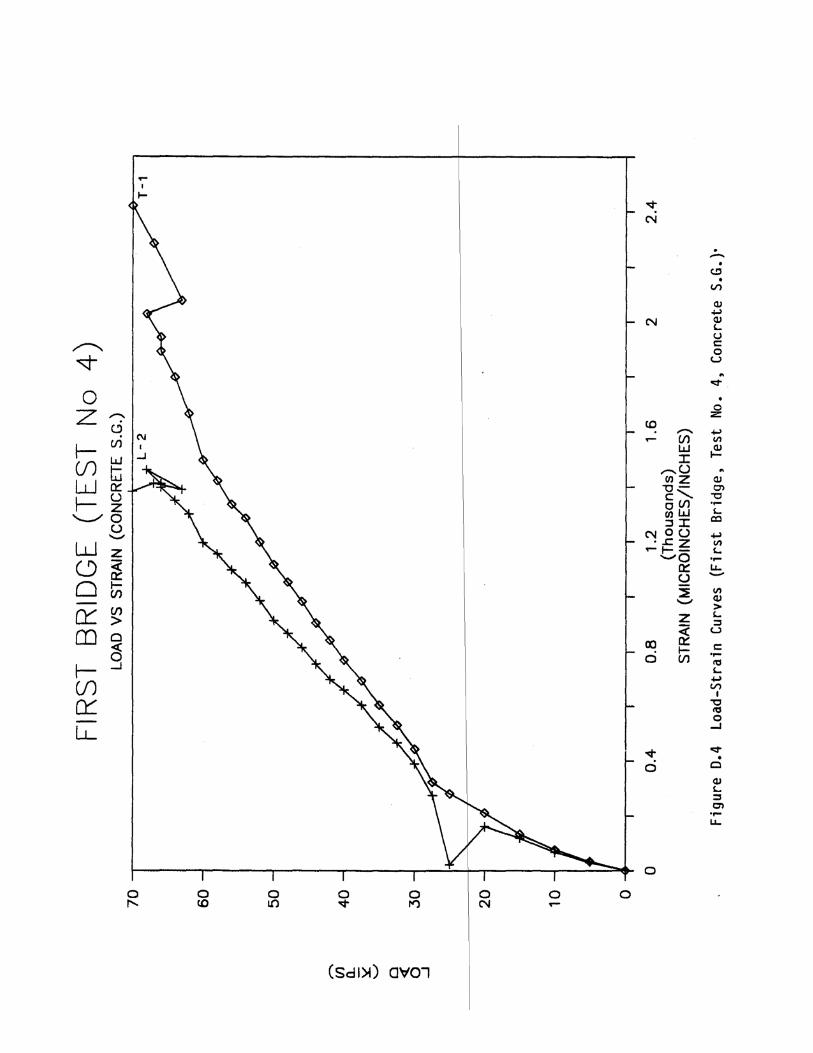
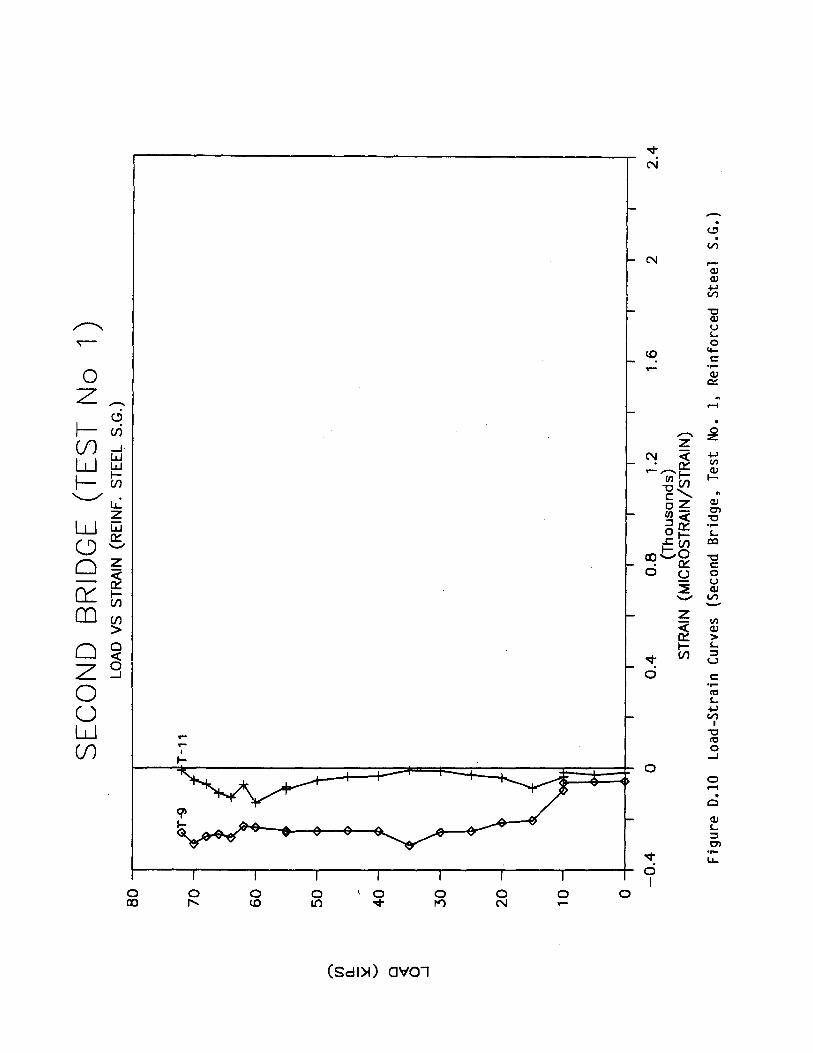
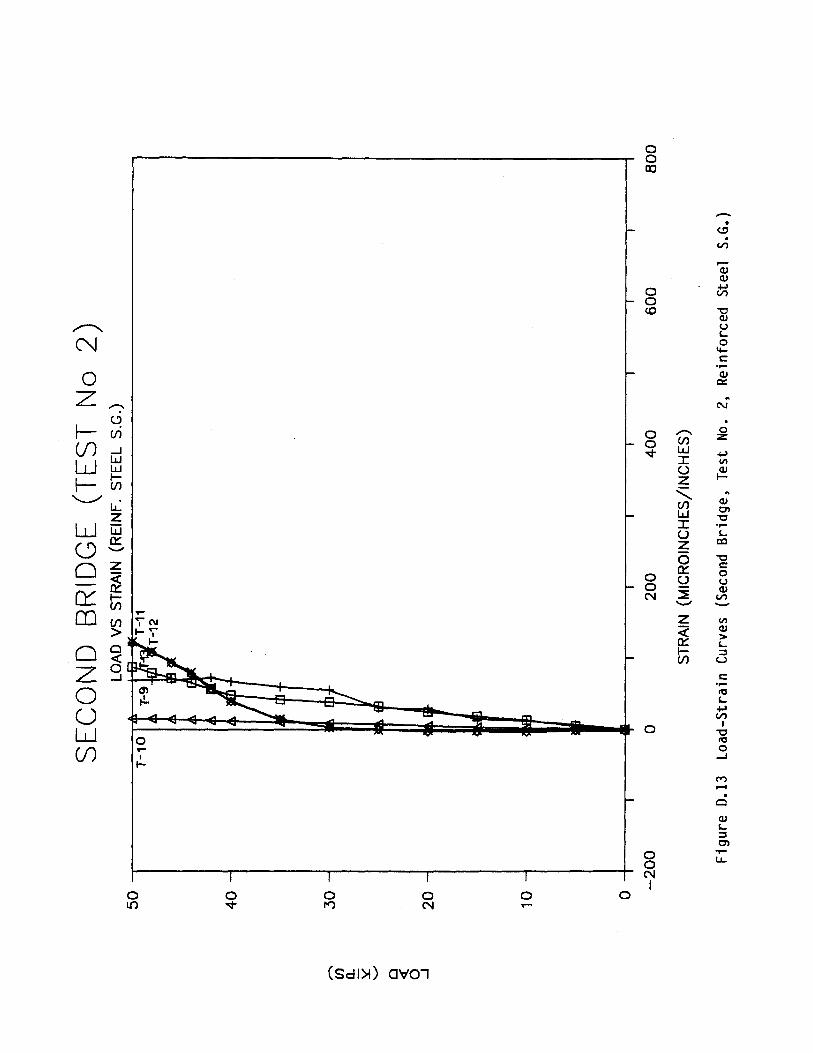
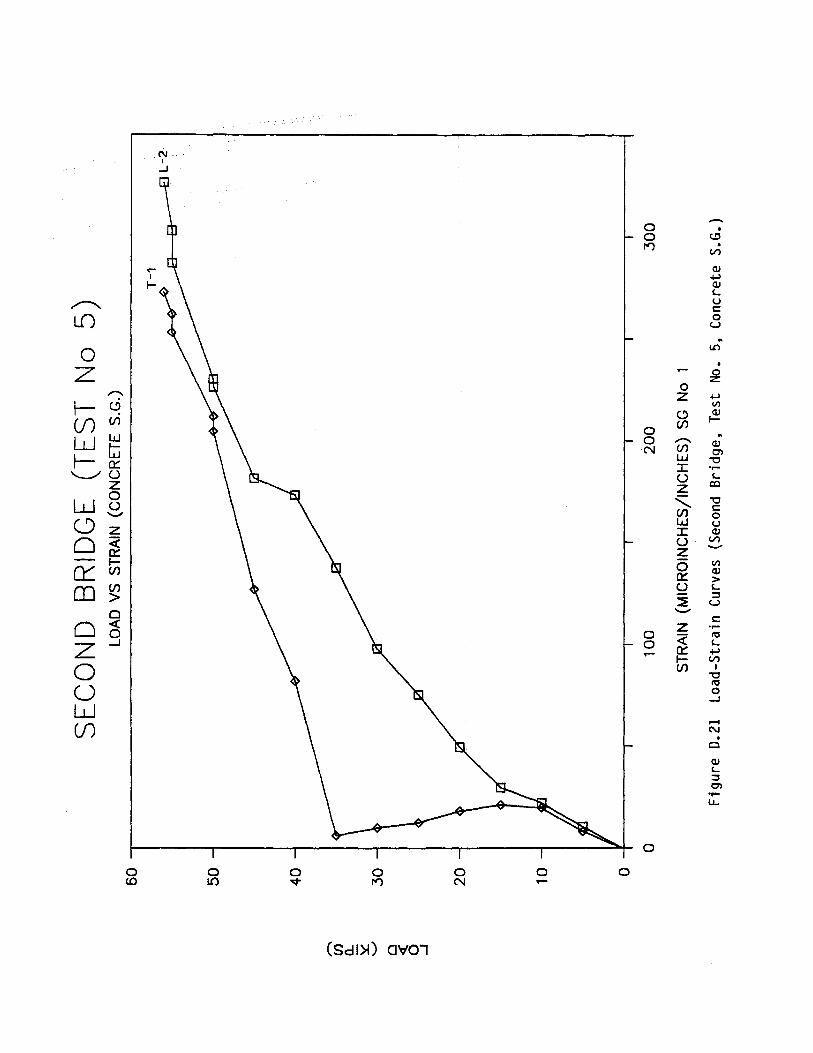
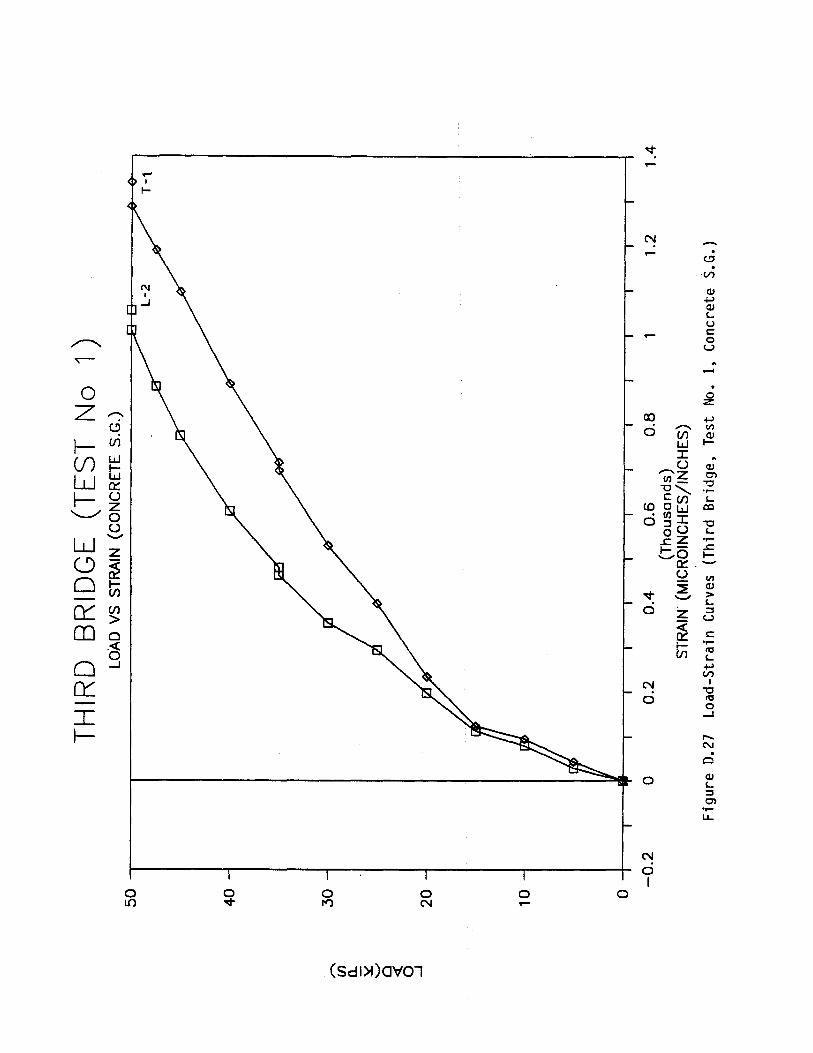
Electrical resistance strain gages w re used at various locations in
the tests, including the top and bottom surfaces of the deck, on the
reinforcement, on the longitudinal girders, and on the bracing. Two inch
long gages with high endurance lead wires were used on the concrete
surfaces, 0.031" gage length general purpose miniature gages were used on
the reinforcing steel and 0.23" universal general purpose strain gag s were
used on the steel angle braces. Appendix C gives the locations of the strain
gages for the various tests and Appendix D contains all of the 1 ad-strain
plots.

CHAPTER 3 TEST 13EH VIOR
The general load-deflection response and failure modes of the specimens
are described in this chapter. Detailed studies of the behavior and compari-
sons with analytical models will be done s a part of planned future studies.
The general load-deflection response for all three specimens are shown in
Figures 9, 10 and 11 as variations of tot 1 applied load with deflection at the
center of the tire imprint formation. As stated earlier, this deflection
includes the vertical deflection of the s eel framing. The maximum load at-
tained during each test, the load at which a flexural yield pattern was well
developed in the deck, and the maximum de lection attained beneath the load
during each test, along with the above results converted to full scale, are
given in Table 1. Each curve is labeled T-i where i represents the test number
whose locations are shown in Figures 5, 6 and 7. Full scale loads and
deflections were obtained by multiplying the test values by the scale factor
and the square of the scale factor for deflection and load values, respec-
tively. The scale factors used were those shown in Figure 1.
Most of the tests were continued to complete failure. However, seven of
the test, as shown in Table 1., were stopped prior to failure. All of these
except one were due to limitations of the test set-up rather than the deck and
these loads raised to full scale were well beyond any reasonable highway
loading. However, test T-2 on specimen 3 as stopped because of the development
of a negative moment yield line over he full length of the specimen. It was
felt that to continue this test would make further testing anywhere on that
side of the specimen completely unrepresentative of an actual undamaged deck.


23
3.1 Interior Tests
This section describes the behavior f the interior tests. Comparison of
the maximum loads and yield loads in Table 1 indicate the reserve strength of
the deck relative to the load associated with the flexural yield line mecha-
nism. For the first specimen, in-plane forces developed in the slab were suf-
ficient to cause welds in the bracing adjacent to the test position to fail
for several of the tests. In the second and third specimens, the welds were
strengthened, and weld failure occurred in only one case. It is difficult to
say how much of the increased strength for specimen 2 was due to the effect
of the bracing on the in-plane forces and ho much was due to the load
pattern, but the reserve strength beyond yielding w s certainly considerable,
even though the transverse span-to-thickness ratio for this specimen was 20,
as opposed to the maximum of 15 in the 0ntari code.
Also, it should be noted that for all tests in which weld failures oc-
curred, that while the load decreased when the weld failure occurred, contin-
ued loading was possible after the weld failure to an increased load.
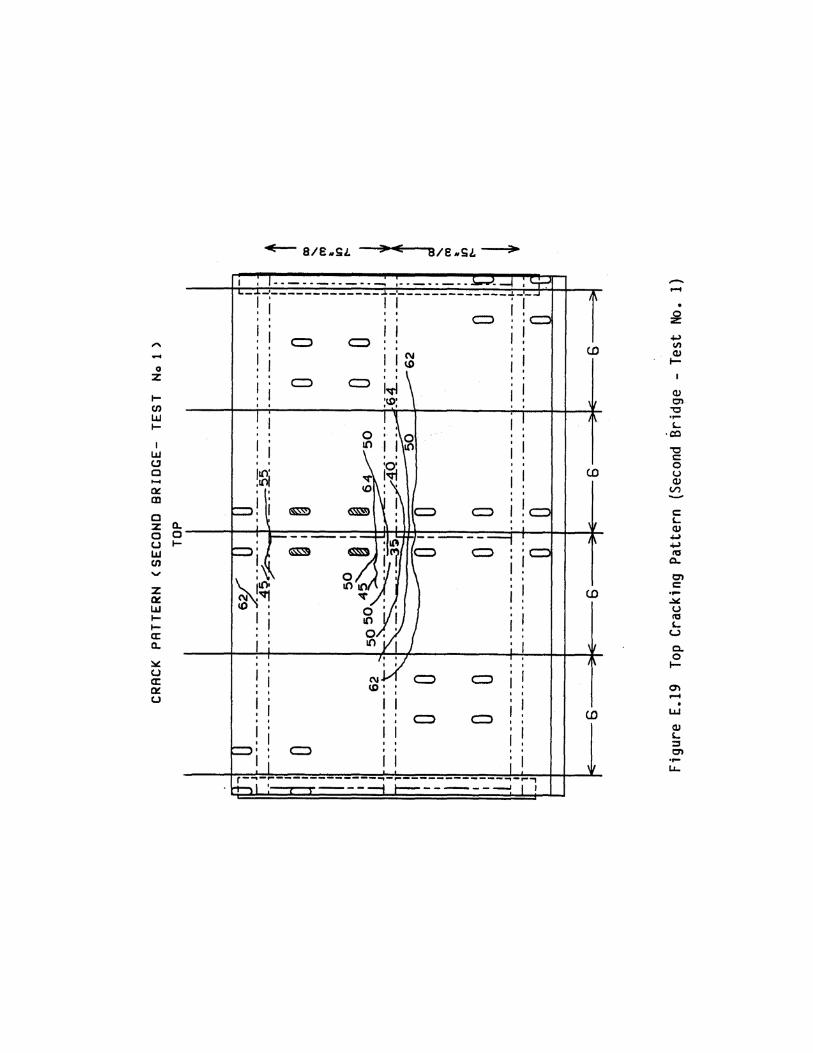
Appendix E. shows the observed crack patterns for the various tests. The
mode of failure for specimen 1 was clearly punching, involving the entire
width of the panel between girders and an approximately equal distance along
the length of the slab. For specimen 2, t ere was some tendency for the
pattern to not be as circular and to involve a longer length, perhaps re-
flecting the proximity of the load plates o the steel girders. The basic
ductility inherent in the failure mechanism for all interior tests was ap-
parent in the no linearity of the load deflection relations and the large
magnitude of the deflections, shown in Figures 9, 10 and 11.

24
3.2 Free Edge Within-San and Corner Tests
This section discusses the behavior f the tests on the side of the bridge
without the parapet, either within the span or at the corners. For all specimens,
as indicated in Table 1, even these tests, indicated considerable reserve
capacity beyond the load at which the yield line pattern formed. For specimen 1,
the failure load for the midspan edge was equal to the lowest failure load
recorded for the interior tests, while the midspan edge for specimen 2 had still
not failed at 50 kips. he reserve capacity of the free edge is evidently aided
by transfer of load directly to the longitudinal girder, as indicated by the
similarity of stiffness between the midspan edge test and the adjacent interior
test in specimen 1, by the linearity and high stiffness of the midspan edge test
in specimen 2, and the observation that the maximum deflection for both tests in
specimen 2 occurred immediately to the inside of the girder.
3.3 Parapet Within-spar and Corner Tests
This section discusses the behavior o the tests on the side of the bridge
with the parapet, either within the span or at the corners. Considering the
behavior of the free edge, the r serve capacity of the parapet edge is not
surprising. A major aspect of these test results was the strong interaction of
the parapet with the slab. This was illustrated by load-deflection stiffnesses,
which for both specimens were highest for the parapet edge tests, by the fact
that for specimen 1 all three parapet edge tests involved the formation of wide
inclined cracks over the en ire height of the parapet, that failure was not
attained for either specimen one or two at midspan, even though comparable
interior tests failed at loads lower or not much higher than

31
the maximum applied, and from the observation in specimen 2 that failure in
the corner test occurred only when the de k vertically separated from the
parapet.
However, the development of the full length yield line for test T-2 on
specimen three, which was described above, points out that some consideration
of yield line theory should be given for he overhang condition. This aspect of
the behavior will be investigated in future studies.
3.4 Comparisons-to Highway Loads
The AASHTO axle load for a single axle with dual wheels is 32 kips, im-
plying 16 kips on each dual tire pattern. Using an impact factor of 0.3, and a
load factor of (2.2*1.3) implies a required ultimate wheel load of 59 kips. This
is less than the maximum load (converted to full scale) for any of the single
imprint tests, less than one half t e load for any of the dual imprint tests,
and less than one fourth the load f r any of the four imprint (tandem) tests
with four exceptions. All four of tie exceptions occur for the tandem loadings.
And, as discussed subsequently, the assumption of two AASHTO axle loads in a
single tandem is very conservative. Also, none of the exceptions occur in the
interior tests; not even for he maximum S/T ratio of 22.
One of the exceptions occurred in the free edge test for specimen 2. and
for this test the maximum load recorded was not based on a slab failure. Also,
it should be noted that the corresponding test for specimen 3, with a larger
B/T ratio carried a full scale tandem load of 306 kips implying a wheel load of
76 kips well above 59 kips. The o her three exceptions were in the overhangs
for specimen #3 with the very hi h A/T and B/T ratios.
Evaluating the results in the above manner is very conservative, since
the AASHTO design axle loads are spaced fourteen feet apart and thus do not
32
realistically imply a tandem loading. The results could be evaluated in a
somewhat different manner based on the heaviest commercial axle, which is
rated at 23 kips. Applying a safety factor of 2.5 results in an ultimate axle
load of 57.5 kips, which translates into 2&75 kips on one dual tire forma-
tion,,57.5 kips on two dual tire formations, and 115 kips total on an entire
tandem assembly. All of the full scale maximum applied loads in Table 1 ex-
ceed these levels by a considerable margin, even those for the overhangs of
specimen number three. Clearly the orthotropically reinforced slabs have a
tremendous reserve load capacity compared to typical highway vehicle loads.
33
CHAPTER 4
SUMMARY AND RECOMMENDATIONS
Load tests on three bridge deck specimens with 0.3% orthotropic
reinforcement top and bottom, supported on steel beams, produced the
following general results
(1) Interior tests on all three specimens indicated large amounts of reserve
strength beyond that associated with the formation of the flexural yield
line pattern, even though they had transverse span-to-thickness ratios of
approximately 18, 20, and 22, significantly in excess of the maximum of
15 allowed by the Ontario code.
(2) All interior tests carried to slab failure exhibited marked
flexural yielding followed by a punching type failure, accompanied
by large amounts of deformation.
(3) For all specimens, even tests on a free edge of the slab (over-hang with-
out parapet) indicated considerable reserve strength beyond the load cor-
responding to the formation of the flexural yield pattern. The stiffness
levels and linearity of response for these tests suggested significant
transfer of load directly into the longitudinal girder.
(4) For specimens one and two, tests on the parapet over-hang were
characterized by the strong interaction of both the parapet and the
longitudinal girder with the slab. In several tests wide inclined cracks
appeared in the parapet, and in one corner test, failure occurred by
vertical separation of the slab from the parapet.
(5) Specimen three with the large A/T ratio of 32 developed a full length
yield line, the entire length of the specimen, for the edge test on
the parapet side. Thus, the possibility of a full length beam
mechanism

34
should be considered in establishing he maximum over-hang-to-thickness
ratio. However, the parapet still participated in strengthening the deck
in the corner tests; for this specimen.: Thus, it is likely that if the
edge test had been carried to completion, the specimen would have had
additional reserve strength beyond the pint at which the test was
stopped. (6) Static load capacities for all tests, when converted to a
full scale 8" deck thickness, gave more than an adequate factor-of-
safety for typical highway legal tandem loads.
4.1 Research Application
Based on the observed behavior of the static tests, cyclic fatigue tests
are now planned on a fourth specimen very similar to specimen two of the stat-
ic tests. It is felt that these tests along with additional analytical studies
can be used to establish guidelines on the limitations of the span-to-
thickness and over-hang-to-thickness ratio which can be used in American
practice with the Ontario orthotropic reinforcement procedure.
No direct application of this work is recommended in Florida, pending
completion of the planned work in this are

29

APPENDIX A LVDT
Locations For Tests


APPENDI B
Complete Load Deflection Plots


APPENDIX C
Strain Gage Locations For Tests


APPENDIX D
Strain Gage Plots


APPENDIX E
Crack Patterns Observed


APPENDIX F
Material Properties


APPENDIX G
Measured Thicknesses of Deck


G-