Embed Size (px)
Citation preview

Seven & i Holdings Co., Ltd.
Growth Strategy Presentation
March 9, 2016

Group Management
Strengthening Governance
Reform of Ito-Yokado
Reform of Sogo & Seibu
Content

Group Management
Copyright (C) Seven & i Holdings Co., Ltd. All Rights Reserved.
Holding companySeven & i Holdings
Operating CompaniesSeven-Eleven Japan (SEJ), Ito-Yokado (IY), and Sogo & Seibu (SS), etc.
Reflect shareholder concerns Reflect customer concerns
1) Control overall governance2) Maximize enterprise value as the
Group’s listed representative
1) Fulfill responsibilities in each operational domain
2) Realize autonomy, seek profit growth and enhance asset efficiency
The Goal is to maximize Group value
Basic policy “Shared strategies and independent brands”
Seven & i Group Management
1
Realizing Group synergies●

Copyright (C) Seven & i Holdings Co., Ltd. All Rights Reserved.
Pursuing Group Synergies
Drivers of Group synergy generation
(1) Group principle : “Responding to Change while Strengthening Fundamentals”
(2) Marketing capabilities: Perceiving changes in consumer behavior through abundant customer-contacts
Group management is crucial to grasp broad trends in consumer behavior and raise gross profit through purchasing power
2
Foundation ofSeven-Eleven Japan
Modernization and revitalization of small and medium sized stores
Reconstruction of 7-Eleven, Inc.
Reconstruction through relisting and becoming a wholly owned subsidiary
Foundation of Seven Bank Pursuing further convenience of SEJ
Seven Premium Synergies focused on products through team merchandising
The Omni-ChannelStrategy
Synergies focused on customer behavior and Internet infrastructure

Copyright (C) Seven & i Holdings Co., Ltd. All Rights Reserved.
Team merchandising
Development of Seven Premium
SEJ’s GrowthDifferentiation
through the Omni-Channel Strategy
Increase existing store
sales and expand store
openings
SevenBank’sgrowth
Contributionby SS
Reconstruction and growth of SEI
SEI absorbs SEJ’s management styles
“Responding to Change while Strengthening Fundamentals”
IY expertise YB and YMT* expertise
Merchandising and logistics project
Group Growth Strategy Matrix
* YB (York-Benimaru) and YMT (York Mart) are Group’s food supermarkets 3
Grow CVS operations making full use of Group’s resources
Copyright (C) Seven & i Holdings Co., Ltd. All Rights Reserved.
120
140
160
180
200
220
240
1,500
2,000
2,500
3,000
3,500
4,000
4,500
01 02 03 04 05 06 07 08 09 10 11 12 13 14 15 16
SevenPremiumlaunch
taspo effect
Lehman Brothers’ collapse
Special demand associated with earthquake
SEVEN CAFÉlaunch
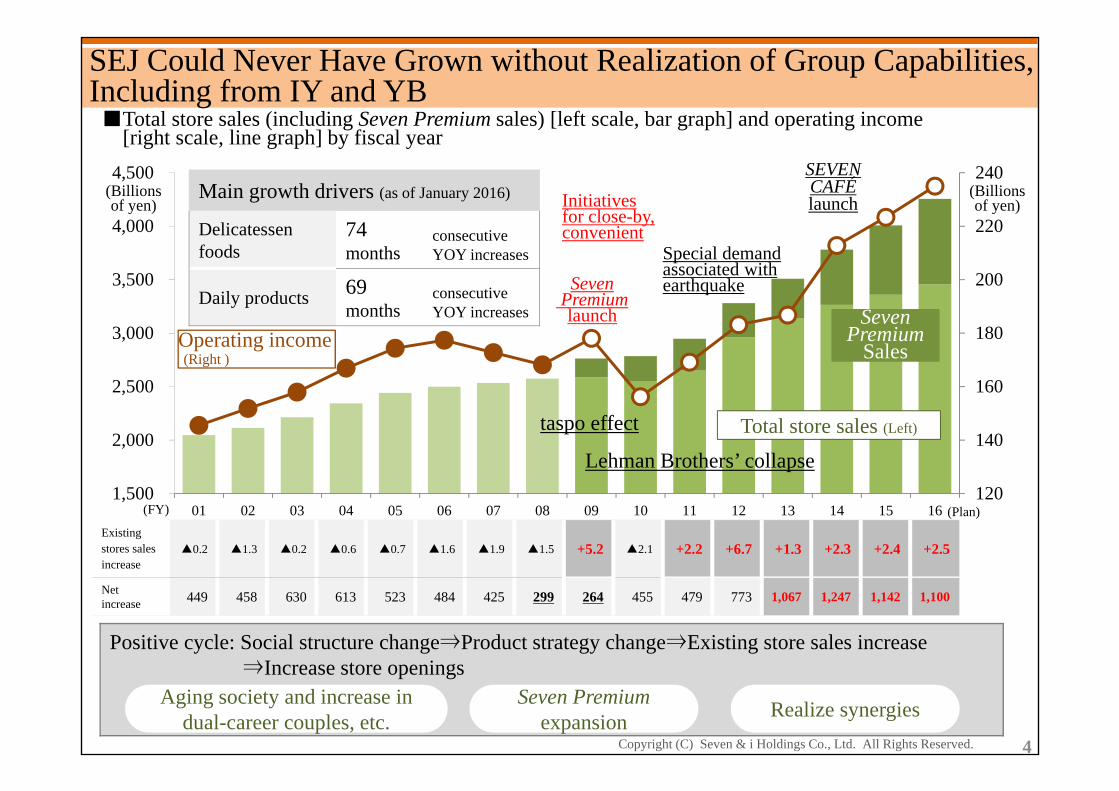
■Total store sales (including Seven Premium sales) [left scale, bar graph] and operating income[right scale, line graph] by fiscal year
(Billions of yen)
SEJ Could Never Have Grown without Realization of Group Capabilities, Including from IY and YB
4
Total store sales (Left)
Operating income(Right )
Main growth drivers (as of January 2016)
Delicatessen foods
74 months
consecutive YOY increases
Daily products 69 months
consecutive YOY increases
Positive cycle: Social structure change⇒Product strategy change⇒Existing store sales increase⇒Increase store openings
Existing stores sales increase
▲0.2 ▲1.3 ▲0.2 ▲0.6 ▲0.7 ▲1.6 ▲1.9 ▲1.5 +5.2 ▲2.1 +2.2 +6.7 +1.3 +2.3 +2.4 +2.5
Net increase 449 458 630 613 523 484 425 299 264 455 479 773 1,067 1,247 1,142 1,100
Aging society and increase in dual-career couples, etc.
(Plan)(FY)
Seven Premium
Sales
Seven Premiumexpansion Realize synergies
(Billions of yen) Initiatives
for close-by, convenient

Copyright (C) Seven & i Holdings Co., Ltd. All Rights Reserved.
Since Seven Premium proposals (2009 onward)Previous lineupConvenience
stores
Supermarkets
Meal needsReady-
to-serve
Supermarkets
Ready-to-serve
Seven Premium Helps SEJ to be “Close-by, Convenient Stores” by Incorporating the Strengths of Supermarkets
Convenience stores product lineups meet meal needs through product development using supermarket knowledge and marketing capabilities
5
Convenience stores
Meal needs

Copyright (C) Seven & i Holdings Co., Ltd. All Rights Reserved.
229 192
380
564
637
150
250
350
450
550
650
750
5,000
7,000
9,000
11,000
13,000
15,000
17,000
FY00 FY01 FY02 FY03 FY04 FY05 FY06 FY07 FY08 FY09 FY10 FY11 FY12 FY13 FY14 FY15
Number of total stores 5,756 5,829 5,823 5,784 5,799 5,829 6,050 6,088 6,196 6,389 6,610 7,149 8,118 8,292 8,297 8,550
Number of franchisedstores
3,118 3,173 3,276 3,338 3,422 3,508 3,828 4,041 4,220 4,649 5,064 5,437 5,870 6,219 6,390 6,678
Franchise ratio (%) 54.2 54.4 56.3 57.7 59.0 60.2 63.3 66.4 68.1 72.8 76.6 76.1 72.3 75.0 77.0 78.1
SEI absorbs SEJ’s management styles
Development of merchandising Logistics strategy
6
(plan)
SEI Could Never Have Grown without Becoming a Wholly Owned Subsidiary■Trends of merchandising sales [left scale, bar graph] and operating income [right scale, line graph] on a dollar basis
Became a wholly owned subsidiary
Operating income [right scale]
AggressiveM&A
Merchandising sales [left scale]
(Millions of dollars)
(Millions of dollars)
(plan)

Strengthening Governance
Copyright (C) Seven & i Holdings Co., Ltd. All Rights Reserved.
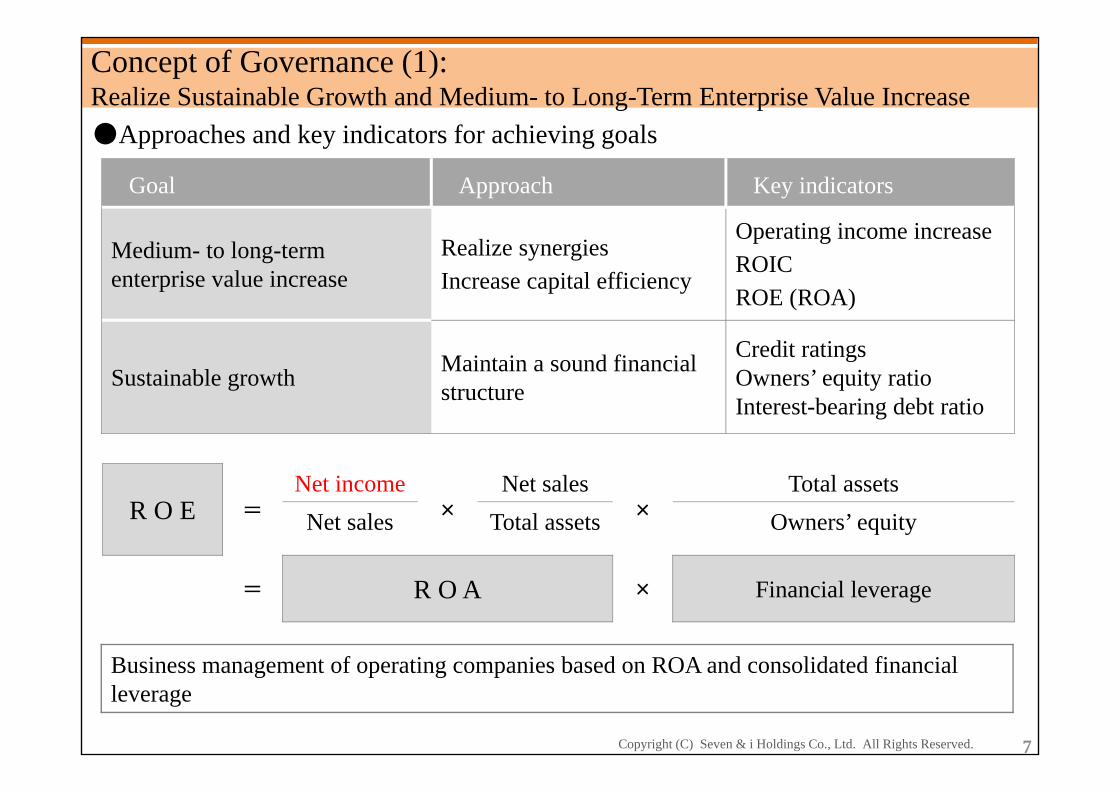
Concept of Governance (1): Realize Sustainable Growth and Medium- to Long-Term Enterprise Value Increase
Goal Approach Key indicators
Medium- to long-term enterprise value increase
Realize synergiesIncrease capital efficiency
Operating income increaseROICROE (ROA)
Sustainable growth Maintain a sound financial structure
Credit ratingsOwners’ equity ratioInterest-bearing debt ratio
●Approaches and key indicators for achieving goals
R O E =Net income
×Net sales
×Total assets
Net sales Total assets Owners’ equity
= R O A × Financial leverage
Business management of operating companies based on ROA and consolidated financial leverage
7

Copyright (C) Seven & i Holdings Co., Ltd. All Rights Reserved.
Increase ROE
●Current ROE (FY2015) and target
8
Concept of Governance (2): Realize Sustainable Growth and Medium- to Long-Term Enterprise Value Increase
TargetROE
10%Current
ROE
7.9%
■Governance for operating companies
Set increasing operating income as the most important indicator, since this is the result of our core business
1. Operation Support each company’s sales strategies and create synergies across the organization
2. Investment decisions Make investment decisions based on a standard of ROIC 6%*
1. Strengthen operation 2. Streamline investmentIncrease operating
profit marginIncrease operating income
Increase capital efficiency
*(Operating income + interest income) × 0.6 + dividend income / (non-current assets + investment and financing)
Copyright (C) Seven & i Holdings Co., Ltd. All Rights Reserved.
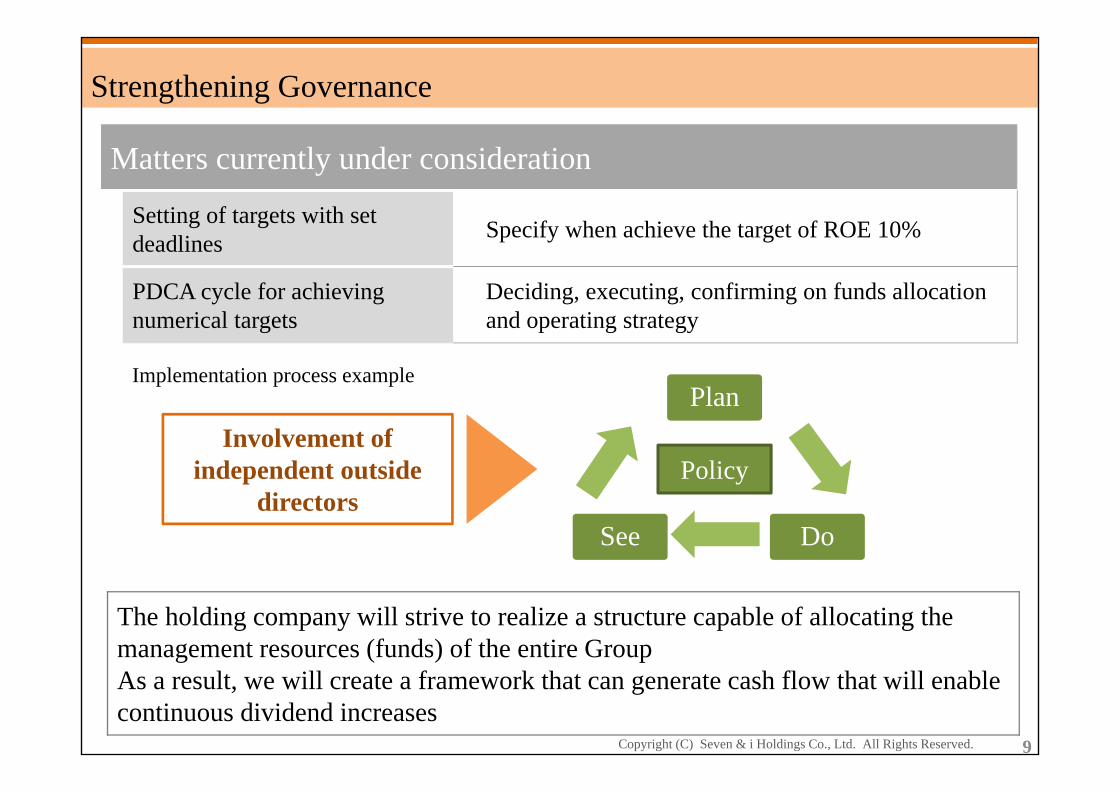
Strengthening Governance
Matters currently under consideration
Setting of targets with set deadlines Specify when achieve the target of ROE 10%
PDCA cycle for achieving numerical targets
Deciding, executing, confirming on funds allocation and operating strategy
9
The holding company will strive to realize a structure capable of allocating the management resources (funds) of the entire GroupAs a result, we will create a framework that can generate cash flow that will enable continuous dividend increases
Plan
DoSee
PolicyInvolvement of
independent outside directors
Implementation process example

Copyright (C) Seven & i Holdings Co., Ltd. All Rights Reserved.
Capital policies
Credit ratings Maintain current rating
Owners’ equity ratio Manage the owners’ equity ratio of around 45%
Interest-bearing debt ratio Manage within 0.5 times
*Conduct fund procurement through large-scale investments, etc. using optimal methods considering management trends, financial status, market environment, etc.
Maintain a Sound Financial Structure (Sustainable Growth)
Reference: Trends on owners’ equity ratio
45.6 45.4 44.4 43.6 43.9
54.6 55.7 55.0 53.5 54.0
0.43 0.40
0.45 0.45 0.41
0.3
0.4
0.5
0.6
30
40
50
60
2011 2012 2013 2014 2015
Owners’ equity ratio (left scale)
Estimated owners' equity ratio excluding financialservices (left scale)Interest-bearing debt ratio (right scale)
(%) *Financial servicesATM, credit card, electronic money (pursue settlement functions)insurance, and lease services
With financial stability as the core focus, aim to also increase capital efficiency
10
(times)
(FY)
*Maintain around 55 % in retail business

Copyright (C) Seven & i Holdings Co., Ltd. All Rights Reserved.
●GoalEnsure objectivity and transparency for important matters relating to personnel and compensation
Committee chair
Kunio Ito, Director (Independent Outside Director): Nominated by the Board of Directors
Committee members
Chairman and Chief Executive Officer (CEO) , President and Chief Operating Officer (COO), Independent Outside Directors (Two members)
Establishment of a Voluntary Nomination and Compensation Committee Establish the Nomination and Compensation Committee as a voluntary advisory committee to the Company’s Board of Directors
●DeliberationsDeliberate on the following and report to the Board of Directors
NominationsFormulation of basic policy and standardClarify reason for nomination
7&i HD : Representative Directors, Directors, Executive Officers, Audit & Supervisory Board Members
Subsidiaries : Representative Directors*
Compensation Formulate basic policy and standards relating to executive compensation, discuss and confirm compensation proposals
*Integrated committee
*Observer: One Internal Audit & Supervisory Board Member and one Outside Audit& Supervisory Board Member, without voting rights
11*SEJ, IY, SS, YB, YMT, Seven & i Food Systems

Reform of Ito-Yokado

Copyright (C) Seven & i Holdings Co., Ltd. All Rights Reserved.
Earnings and Direction of Ito-Yokado (IY)
IY earnings
Apparel and household goods
Decrease in floor-space efficiency and gross profit margins resulted in a sharp increase in loss
Food Breadwinner, mainly in the Tokyo metropolitan area
TenantsProfit growth through increase in Ario stores and shift from corporate to emphasizing tenanting existing stores
Regional characteristics
Continuing to make profit in Tokyo, Chiba, Saitama, and Kanagawa prefectures, loss in regional areas
Environmental changes
Consumption environment・Further shortening of product life
cycles・Emergence of Internet drivesdemand for increased specialization
Internal issues
Break Away from Conventional Chain Store Concept・Uniform companywide
merchandizing・Reliance on wholesaler
merchandizing・Increase in disposal loss and sales
promotion expenses12
Base on individual store management, move away from mainly corporate general merchandise stores and change the earnings structure
Thoroughly reinforce food
Downsize apparel and household goods in line with individual store characteristics
Strengthen Ario(shopping center) format
Leverage potential in the Tokyo metropolitan area
Utilize the Omni-Chanel Strategy

Copyright (C) Seven & i Holdings Co., Ltd. All Rights Reserved.
Thoroughly Strengthen Food
IY’s competitive advantages
Dominance in the Tokyo metropolitan area
High store density in Tokyo, Chiba, Saitama, and Kanagawa prefectures
Member of theSeven & i Group
Private brand strategy backed by unrivalled marketing powerOmni-Channel Strategy
Thoroughly strengthen food leveraging advantages
Develop thoroughly regional food products
Strengthen fresh foods and prepared meals
Demonstrate price superiority
Aim to create shopping centers that enhance customer attraction through food and leverage tenant mix aligned to individual store catchment areas
13
Copyright (C) Seven & i Holdings Co., Ltd. All Rights Reserved.
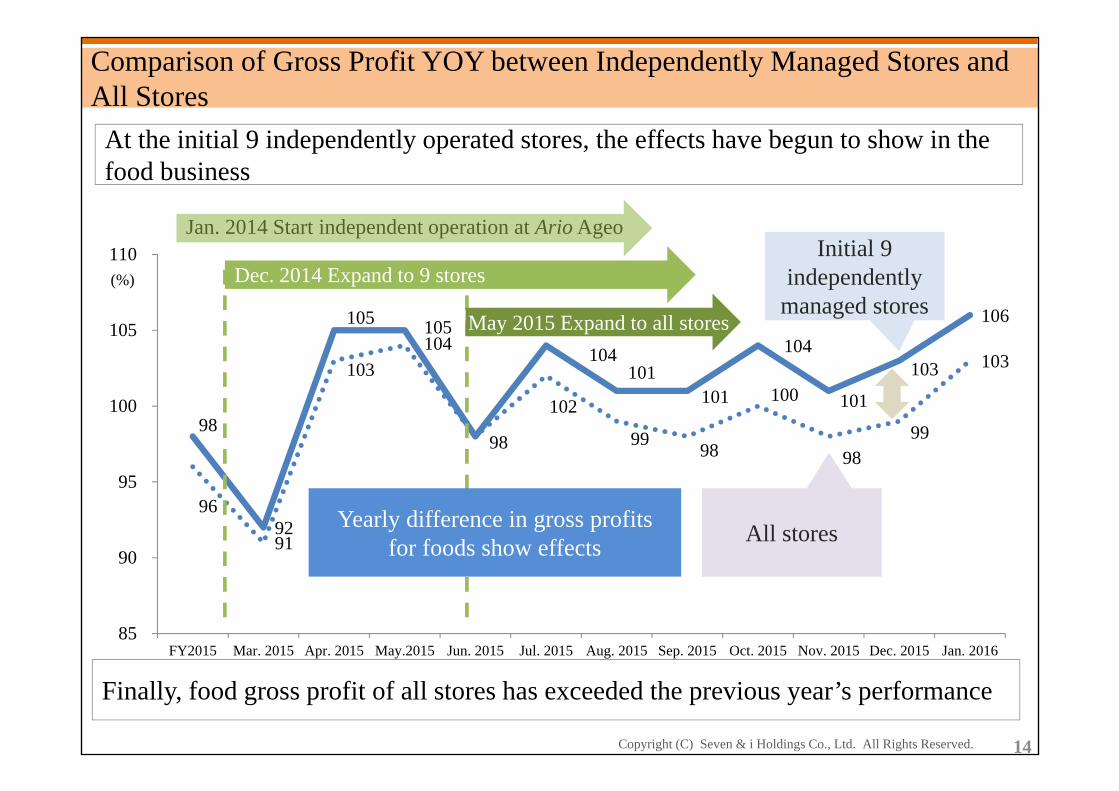
At the initial 9 independently operated stores, the effects have begun to show in the food business
Comparison of Gross Profit YOY between Independently Managed Stores and All Stores
98
92
105 105
98
104 101
101
104
101
103
106
96
91
103 104
102
99 98
100
98 99
103
85
90
95
100
105
110
FY2015 Mar. 2015 Apr. 2015 May.2015 Jun. 2015 Jul. 2015 Aug. 2015 Sep. 2015 Oct. 2015 Nov. 2015 Dec. 2015 Jan. 2016
Initial 9 independently
managed stores
All stores
Dec. 2014 Expand to 9 stores
May 2015 Expand to all stores
Jan. 2014 Start independent operation at Ario Ageo
Yearly difference in gross profitsfor foods show effects
(%)
14
Finally, food gross profit of all stores has exceeded the previous year’s performance

Copyright (C) Seven & i Holdings Co., Ltd. All Rights Reserved.
●Steadily close stores that are unable to earn profit through foodClose 20 stores for FY2017
FY February 2016 FY2017 – FY2021
No. of stores
182stores 20 store closures
40 cumulative store closures142 stores
IY’s Target Status
Start by conducting steady restructuring aimed at business structural reforms●
15
Impact on profit / loss after20 store closures for FY2017
Impact on profit / loss after 40 store closures
Special lossApprox. 11.0 billion yenWill record approx. 4.0 billion yen for FY2016
Special loss Approx. 20.0 billion yen
Revenue from operations
Approx. (77.0) billion yen
Revenue from operations
Approx. (160.0) billion yen
Operating income Approx. 1.9 billion yen
Operating income Approx. 4.0 billion yen

Copyright (C) Seven & i Holdings Co., Ltd. All Rights Reserved.
Status of 142 stores in 2020
1 Structural reform to Arioshopping center format
Approx. 45stores
Over 16,500 ㎡ , including existing17 stores
2 General merchandise stores + introduction of tenant mix
Approx. 60stores
Under 16,500 ㎡, attract tenants to suit catchment area
3 Food + tenants Approx. 15stores Food specialty store format
4 Shokuhinkan and THE PRICE 18stores
18 existing storesBusiness alliance with Group supermarkets
Of which, 15 stores Hokkaido, Tohoku
IY’s Target Status
Status after Business Structural Reforms●
Create profitable formats while carrying out new store openings
16

Reform of Sogo & Seibu

Copyright (C) Seven & i Holdings Co., Ltd. All Rights Reserved.
SS Reforms Pillar: Business Reform
Thorough business reform
Close unprofitable stores
September 30, 2016 (Plan)Sogo Kashiwa , SEIBU Asahikawa
*Will record a special loss of approx. 1.5 billion yen for FY2016
Promote reorganization
Reduce Head Office personnel (100 employees)Introduce merchandiser system to Merchandising Dept.Reduce the layers of management at Sales Dept. (from 3 layers to 2 layers)
Invigorate regional stores
・Promote reform toward shopping centers utilizing tenants・Strengthen regionally-retailer-managed merchandising:
Limited Edition areamode・Utilize Omni-Channel:
Establish centers where customers can “view, touch, and try” products not available in stores
Use the reform as an opportunity to promote awareness reforms among employees and change the approach to work
17

Copyright (C) Seven & i Holdings Co., Ltd. All Rights Reserved.
Promoting new growth strategies = Expanding market share
Initiatives to cultivate areas using the Omni-Channel and utilize SS’s location advantages
⇒Form a strategic area for nationwide deployment
SS Reforms Pillar: Growth Strategy
The meaning for Seven & i Holdings of positioning SS as the entire department store business ・Holds the highest location as a vital element in the market concentration strategy for the Tokyo metropolitan area
・Complements the holding company’s branding capabilities
・Utilizes customer management systems
Draw out the SS’s competitive advantage and latent capabilities through the Omni-Channel Strategy
18

Copyright (C) Seven & i Holdings Co., Ltd. All Rights Reserved.
Choice of Format by Customer Objective ●Customers choose formats within their area depending on distance and frequency of use
7&i HD Customer needs(Way of use/characteristics)
Catchment areaaverage distance
Average frequency of use
SSSpecial (fancy) shopping Relaxed and refined(Customer service, consultation shopping)
30 km radius 0.6 times / month
IYHigh quality daily shopping Daily needs and extras (Semi-self-service)
5 km radius 3.0 times / month
SEJClose-by, convenient/daily shopping Immediate needs (Quick self-service)
0.5 km radius 18.6 times / month[4.2 times / week]
Strengthen the Omni-Channel Strategy to nurture the entire Group’s market concentration strategy
19
*Profit for the Company ultimately derives from keeping individual customers for longer
Uniform management of customer information⇒Implement meticulous personalized sales
promotions
⇒Point promotion utilizing lifetime value*
Utilize SS expertise of customer management

Copyright (C) Seven & i Holdings Co., Ltd. All Rights Reserved.
Semi-self service – IY
Bi no Garden
Self-service – SEJ
Seven Premium
Seven Lifestyle
Close-by, convenient (quick-self-service)
High quality day-to-day (semi-self-service)
Consultant – SS
Kirei Station
Special needs(consultant sales)
20
Seven & i Group meets all manner of customers living needs other than beauty
Capture high-quality customersDatabasing customer information Customer data linkage
●Capture high-quality customers at SS. Use customer data to encourage them to use IY and SEJ
Collecting customer needs as a group – an example of Beauty

Copyright (C) Seven & i Holdings Co., Ltd. All Rights Reserved.
Trends on Operating Income and Dividend per Share Since the Foundation of 7&i HD
21
25 26 27 28 28 29 31 33 36.5 38.5
27 28 29 28 29 33 33 3536.5
38.5
150
200
250
300
350
400
0
20
40
60
80
100
2007 2008 2009 2010 2011 2012 2013 2014 2015 2016
Operating income(right scale)
Net Income(billion yen) 133.4 130.6 92.3 44.8 111.9 129.8 138.0 175.6 172.9 183.0
Dividendper share 52 54 56 56 57 62 64 68 73 85
Payout Ratio(%) 36.4 39.4 55.7 112.7 45.2 42.2 41.0 34.2 37.3 41.1
Aim to the continuous increase of dividend and free cash flow
■ Interim ■ Year-End ■ Commemorative
8.0
(yen) (Billions of yen)
(forecast)
38.5
(FY)

This document contains certain statements based on the Company’s current plans, estimates,strategies, and beliefs; all statements that are not historical fact are forward-lookingstatements. These statements represent the judgments and hypotheses of the Company’smanagement based on currently available information. It is possible that the Company’sfuture performance will differ from the contents of these forward-looking statements.Accordingly, there is no assurance that the forward-looking statements in this document willprove to be accurate.