Embed Size (px)
Citation preview
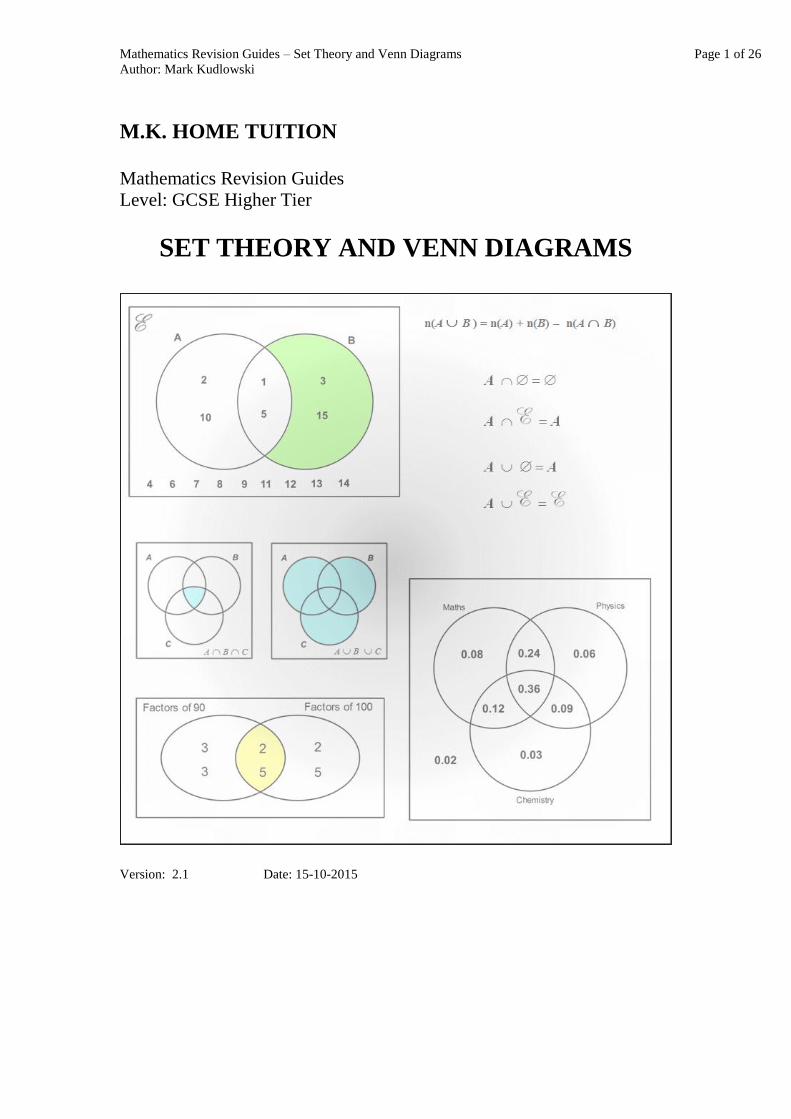
Mathematics Revision Guides – Set Theory and Venn Diagrams Page 1 of 26
Author: Mark Kudlowski
M.K. HOME TUITION
Mathematics Revision Guides
Level: GCSE Higher Tier
SET THEORY AND VENN DIAGRAMS
Version: 2.1 Date: 15-10-2015

Mathematics Revision Guides – Set Theory and Venn Diagrams Page 2 of 26
Author: Mark Kudlowski
SET THEORY (From 2017)
This is an introduction to the theory of sets, and the use of Venn diagrams.
Definitions.
A set is a collection of items which can be letters, numbers or any random objects. Each item in the set
is called a member or an element. Sets can be finite or infinite in size, but we are only interested in
finite ones for GCSE.
Sets can be defined by listing their members directly, or by a general description.
Thus we can have L = {colours of traffic lights} or L = {red, green, amber}.
Both definitions are equally valid, referring to the same set.
Another example would be S = {square numbers between 1 and 50} or S = {1, 4, 9, 16, 25, 36, 49}.
Since a set can be defined by listing its elements, we could decide on something like
D = {Frodo Baggins, Blackpool Tower, 26}. A bizarre set, but still a set !
Larger sets are best described by a definition, such as: P = {prime numbers less than 100}.
The elements of a set must be distinct. If we define set M to be the set of letters in the word
MISSISSIPPI, that set would only have four members in it, i.e. M = {I, M, P, S}.
Cardinality of a set
The cardinality of a (finite) set is simply the count of members in it – the cardinality of set A is given
as n(A).
Example (1): State the cardinalities of the following sets:
D = {possible results of a standard dice throw} ;
P = {cards in a standard pack without Jokers}.
There are six possible dice throw results, so n(D) = 6; there are 52 cards in a pack, so n(P) = 52.
The Universal set and the Null (empty) set.
The set of all elements under consideration is called the universal set, but there seems to be a lack of a
defined standard. Some authorities give U, others , others and still others
We shall use in this document to avoid confusion with the set membership symbol (see later)
and the set union symbol
Examples of finite universal sets are the 26 letters of the alphabet and the positive integers up to 20.
A set containing no members is termed the null set or the empty set, and is denoted by the symbol
The Complement of a Set.
The complement of a set comprises the elements of the universal set that are not in the stated set.
Thus, if we had a universal set containing the numbers {1, 2, 3, 4, 5} and set A = {2, 3}, then the
complement of A , written Awould contain the elements {1, 4, 5}.

Mathematics Revision Guides – Set Theory and Venn Diagrams Page 3 of 26
Author: Mark Kudlowski
The Venn Diagram.
Relationships between sets can be conveniently shown on Venn diagrams.
They consist of two or three overlapping circles enclosed in an outer rectangle.
We can also have the trivial case with one circle, of which an example is the universal set containing
the numbers {1, 2, 3, 4, 5} and set A = {2, 3} stated earlier.
Since 2 and 3 are members of set A, they are included inside the Venn circle.
The numbers 1, 4 and 5 are part of the universal set but are not in set A, so they are outside the circle.
In fact, they form the complement of A, or A’.

Mathematics Revision Guides – Set Theory and Venn Diagrams Page 4 of 26
Author: Mark Kudlowski
Intersection and Union of Sets.
Suppose we were to take two sets as follows:
A = {factors of 10} and B = {factors of 15}, we can list their elements as
A = {1, 2, 5, 10} and B = {1, 3, 5, 15}.
We can see that two elements, namely 1 and 5, are common to both sets.
The elements common to both sets form the intersection of the two sets, or A B.
Note that the order is irrelevant; A B = B A.
Suppose we were to combine the elements of sets A and B into a larger set.
The new set would have the elements {1, 2, 3, 5, 10, 15}, defined as the union of the two sets,
or A B. Again, the order does not matter: A B = B A.
The Venn diagram below illustrates the situation. (We shall take the universal set to be all the positive
integers from 1 to 15.)
The intersection A B is the area of overlap of the two circles, containing the elements 1 and 5.
The union of the two sets, A B, is the area enclosed by both circles combined, containing the
elements 1, 2, 3, 5, 10 and 15.
The other nine members of the universal set are placed in the outside rectangle.
Versions of the Venn diagram can also be found under probability (see “Probability”) and when finding
the H.C.F and L.C.M. of two numbers (see “Factors, Primes, H.C.F., L.C.M.”)

Mathematics Revision Guides – Set Theory and Venn Diagrams Page 5 of 26
Author: Mark Kudlowski
Example (2): Let set M = {letters in MONDAY} and set T = {letters in TUESDAY}.
(The universal set is that of the 26 letters of the alphabet).
i) Find a) the cardinality of M’ ; b) M T ; c) M T.
What do you notice about the cardinalities of M, T, M T and M T ?
ii) Illustrate the two sets M and T , and their elements, on a Venn diagram.
(Do not include the rest of the universal set.)
i) a) Since M has six members, M’ consists of all the other entries in the universal set, i.e. the other
twenty letters of the alphabet. Hence n(M’) = 20.
b) M T contains the letters common to both MONDAY and TUESDAY, i.e. {A, D, Y}.
c) M T contains the letters of both words combined, i.e. {A, D, E, M, N, O, S, T, U, Y}.
Note that n(M) = 6 and n(T) = 7, whilst n(M T) = 3. When we listed the 10 elements of M T we
had to exclude one occurrence of M T to avoid duplication.
Therefore n(M T ) = n(M ) + n( T ) – n(M T ).
So to find the cardinality of the union of two sets, we add the individual cardinalities and subtract the
cardinality of their intersection.
ii) The Venn diagram for the two sets is shown below.
For any two sets A and B, n(A B ) = n(A) + n(B) – n(A B).
Mathematics Revision Guides – Set Theory and Venn Diagrams Page 6 of 26
Author: Mark Kudlowski
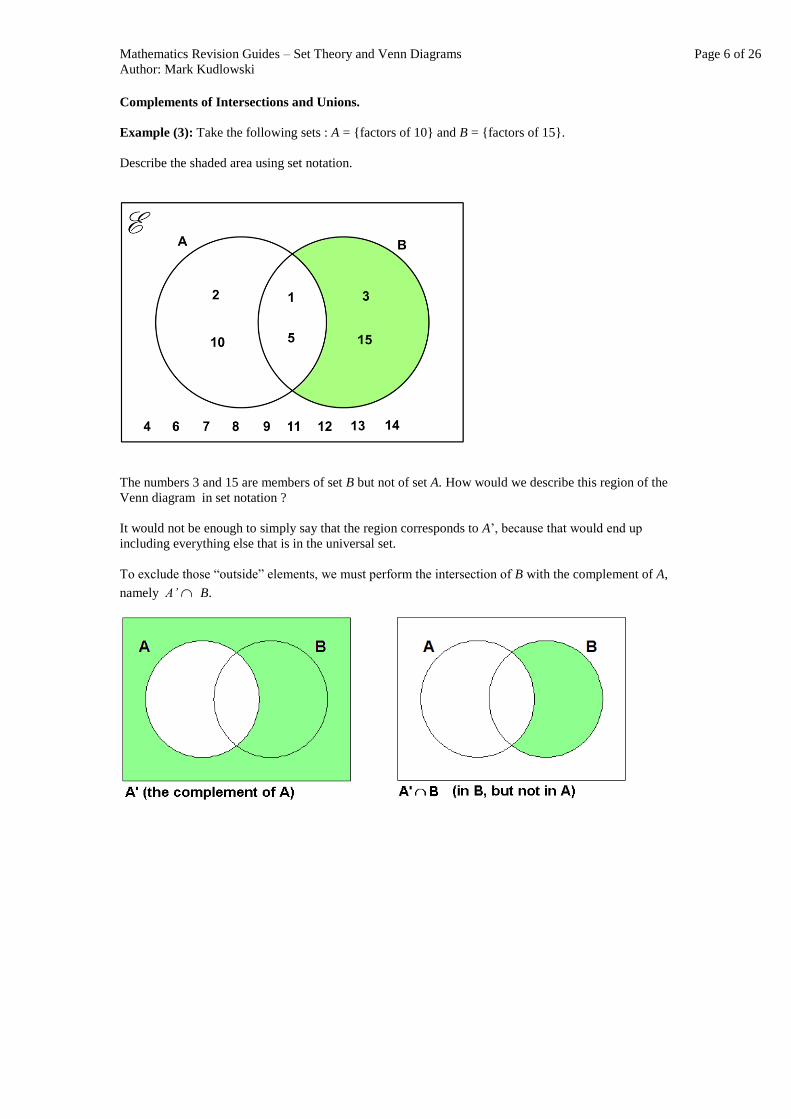
Complements of Intersections and Unions.
Example (3): Take the following sets : A = {factors of 10} and B = {factors of 15}.
Describe the shaded area using set notation.
The numbers 3 and 15 are members of set B but not of set A. How would we describe this region of the
Venn diagram in set notation ?
It would not be enough to simply say that the region corresponds to A’, because that would end up
including everything else that is in the universal set.
To exclude those “outside” elements, we must perform the intersection of B with the complement of A,
namely A’ B.
Mathematics Revision Guides – Set Theory and Venn Diagrams Page 7 of 26
Author: Mark Kudlowski
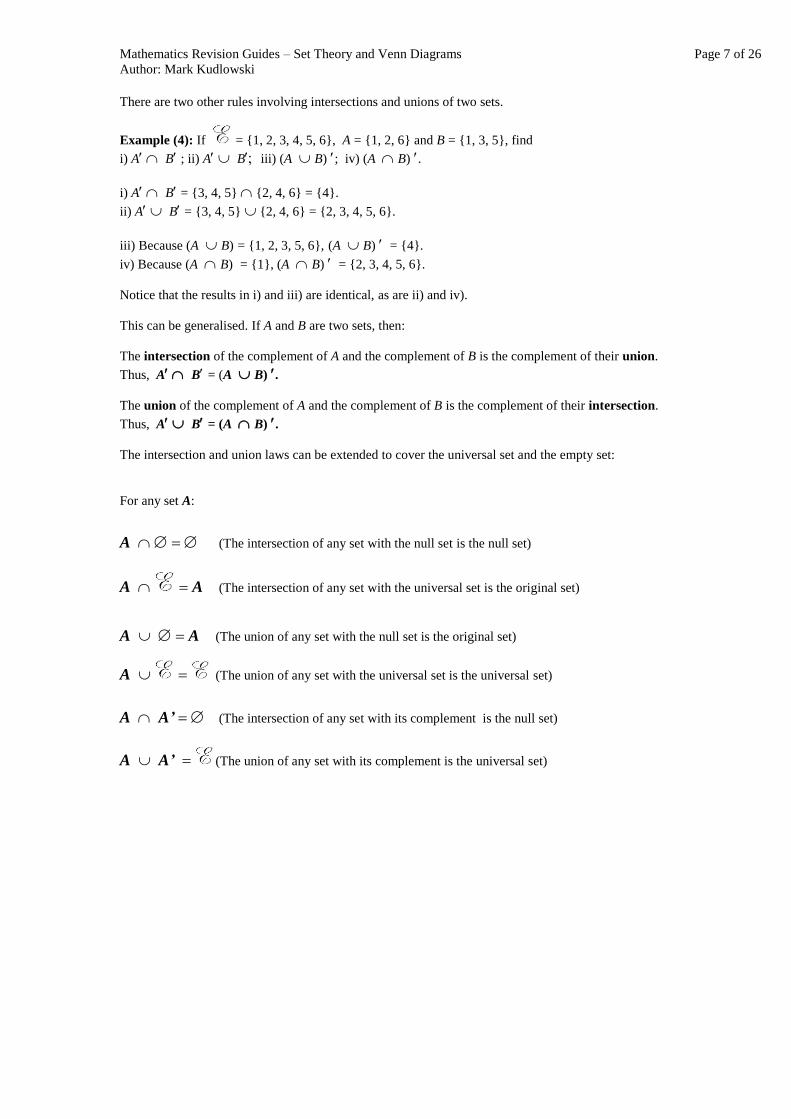
There are two other rules involving intersections and unions of two sets.
Example (4): If = {1, 2, 3, 4, 5, 6}, A = {1, 2, 6} and B = {1, 3, 5}, find
i) A B ; ii) A Biii) (A B); iv) (A B).
i) A B = {3, 4, 5} {2, 4, 6} = {4}.
ii) A B = {3, 4, 5} {2, 4, 6} = {2, 3, 4, 5, 6}.
iii) Because (A B) = {1, 2, 3, 5, 6}, (A B) = {4}.
iv) Because (A B) = {1}, (A B) = {2, 3, 4, 5, 6}.
Notice that the results in i) and iii) are identical, as are ii) and iv).
This can be generalised. If A and B are two sets, then:
The intersection of the complement of A and the complement of B is the complement of their union.
Thus, A B= (A B).
The union of the complement of A and the complement of B is the complement of their intersection.
Thus, A B= (A B).
The intersection and union laws can be extended to cover the universal set and the empty set:
For any set A:
A (The intersection of any set with the null set is the null set)
A A (The intersection of any set with the universal set is the original set)
A A (The union of any set with the null set is the original set)
A (The union of any set with the universal set is the universal set)
A A’(The intersection of any set with its complement is the null set)
A A’ (The union of any set with its complement is the universal set)

Mathematics Revision Guides – Set Theory and Venn Diagrams Page 8 of 26
Author: Mark Kudlowski
Special cases of the two-set Venn diagram.
Example (5):
i) Given = {numbers on a dice}, O = {odd numbers on a dice} and E = {even numbers on a dice},
complete the Venn diagram. What do you notice about O E ?
ii) Comment on the cardinalities of the sets’ intersection and union.
i) No number can be odd and even at the same time, and as a result, the area of overlap has no
members. We say that O E = hence the empty set symbol there.
ii) This time, n(O) = 3 and n(E) = 3. The intersection of the two sets is the empty set, and so its
cardinality, n(O E), = 0. Also, the cardinality of their union, n(O E) = n(O) + n(E) = 6.
If two sets are disjoint (i.e. have no members in common), then the cardinality of their union is the sum
of the individual cardinalities.
It is possible to adapt the Venn diagram to avoid the empty region, by showing separate Venn circles.

Mathematics Revision Guides – Set Theory and Venn Diagrams Page 9 of 26
Author: Mark Kudlowski
Example (6):
i) Given = {positive integers up to 12}, S = {factors of 6} and T = {factors of 12}, complete the
Venn diagram. What do you notice about S T ’ ?
ii) Comment on the cardinalities of the sets’ intersection and union.
i) Because 6 is a factor of 12, no number can be a factor of 6 without automatically being a factor of 12
at the same time. Because of this, S T ’ = hence the empty set symbol there. In fact, S is a
subset of T.
ii) The number 6 has 4 factors and the number 12 has 6, so n(S) = 4 and n(T) = 6.
Note how n(S T) = 4, coinciding with n(S). Also, n(S T) = 6, coinciding with n(T).
This is true in all cases where the smaller set is entirely contained in the larger set; their intersection has
exactly the same elements as the smaller, and their union has exactly the same elements as the larger
set.
Again, it is possible to adapt the diagram to avoid the impossible region, by placing one Venn circle
inside the other.
Mathematics Revision Guides – Set Theory and Venn Diagrams Page 10 of 26
Author: Mark Kudlowski
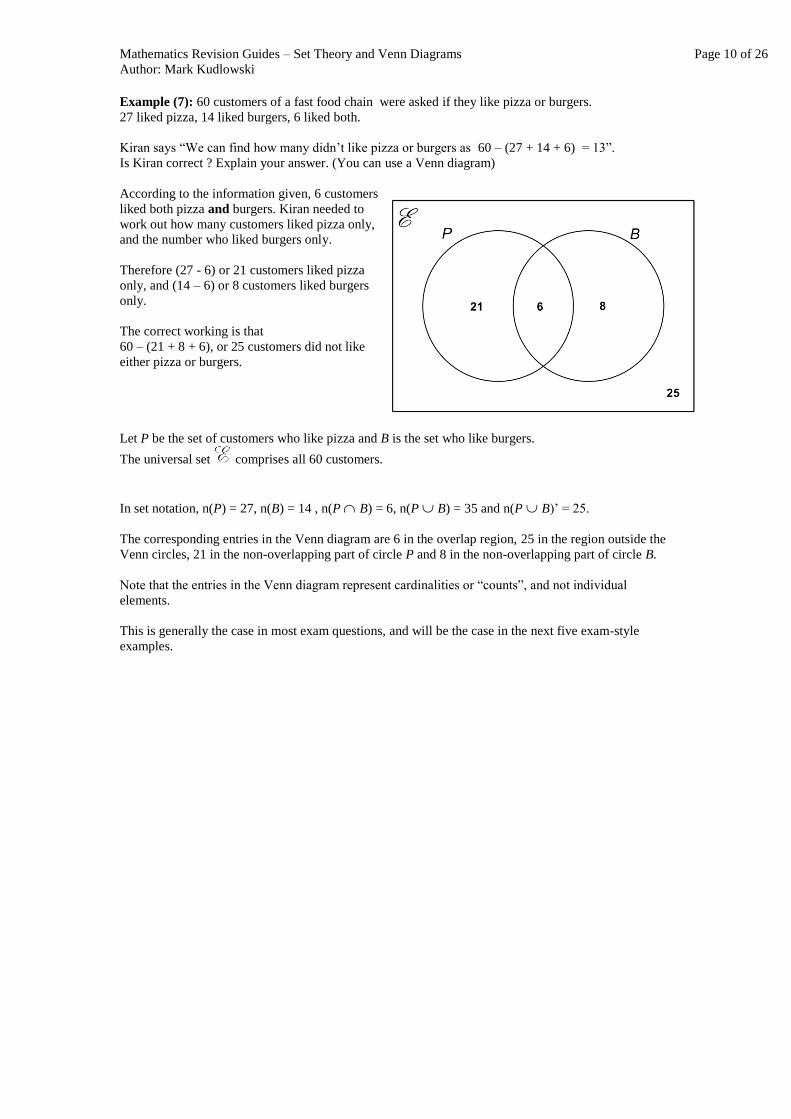
Example (7): 60 customers of a fast food chain were asked if they like pizza or burgers.
27 liked pizza, 14 liked burgers, 6 liked both.
Kiran says “We can find how many didn’t like pizza or burgers as 60 – (27 + 14 + 6) = 13”.
Is Kiran correct ? Explain your answer. (You can use a Venn diagram)
According to the information given, 6 customers
liked both pizza and burgers. Kiran needed to
work out how many customers liked pizza only,
and the number who liked burgers only.
Therefore (27 - 6) or 21 customers liked pizza
only, and (14 – 6) or 8 customers liked burgers
only.
The correct working is that
60 – (21 + 8 + 6), or 25 customers did not like
either pizza or burgers.
Let P be the set of customers who like pizza and B is the set who like burgers.
The universal set comprises all 60 customers.
In set notation, n(P) = 27, n(B) = 14 , n(P B) = 6, n(P B) = 35 and n(P B)’ = 25.
The corresponding entries in the Venn diagram are 6 in the overlap region, 25 in the region outside the
Venn circles, 21 in the non-overlapping part of circle P and 8 in the non-overlapping part of circle B.
Note that the entries in the Venn diagram represent cardinalities or “counts”, and not individual
elements.
This is generally the case in most exam questions, and will be the case in the next five exam-style
examples.
Mathematics Revision Guides – Set Theory and Venn Diagrams Page 11 of 26
Author: Mark Kudlowski
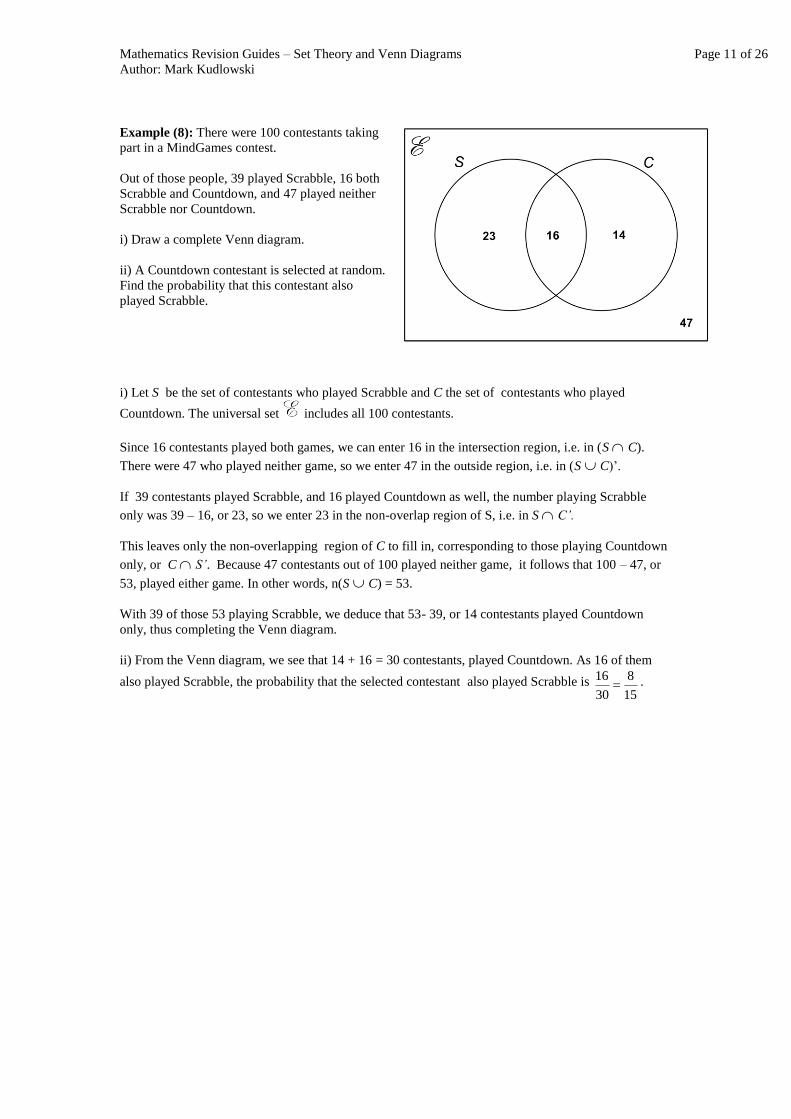
Example (8): There were 100 contestants taking
part in a MindGames contest.
Out of those people, 39 played Scrabble, 16 both
Scrabble and Countdown, and 47 played neither
Scrabble nor Countdown.
i) Draw a complete Venn diagram.
ii) A Countdown contestant is selected at random.
Find the probability that this contestant also
played Scrabble.
i) Let S be the set of contestants who played Scrabble and C the set of contestants who played
Countdown. The universal set includes all 100 contestants.
Since 16 contestants played both games, we can enter 16 in the intersection region, i.e. in (S C).
There were 47 who played neither game, so we enter 47 in the outside region, i.e. in (S C)’.
If 39 contestants played Scrabble, and 16 played Countdown as well, the number playing Scrabble
only was 39 – 16, or 23, so we enter 23 in the non-overlap region of S, i.e. in S C’.
This leaves only the non-overlapping region of C to fill in, corresponding to those playing Countdown
only, or C S’. Because 47 contestants out of 100 played neither game, it follows that 100 – 47, or
53, played either game. In other words, n(S C) = 53.
With 39 of those 53 playing Scrabble, we deduce that 53- 39, or 14 contestants played Countdown
only, thus completing the Venn diagram.
ii) From the Venn diagram, we see that 14 + 16 = 30 contestants, played Countdown. As 16 of them
also played Scrabble, the probability that the selected contestant also played Scrabble is 15
8
30
16 .

Mathematics Revision Guides – Set Theory and Venn Diagrams Page 12 of 26
Author: Mark Kudlowski
Example (9): A language class has 27 pupils, of which 18 are learning French, 12 are learning
Spanish, and 4 are not learning either French or Spanish.
i) How many pupils are learning both languages ?
ii) How many pupils are learning French, but not Spanish ?
iii) A pupil is randomly chosen out of the Spanish class. What is the probability that this pupil is not
also learning French ?
iv) Display the information on a Venn diagram.
i) Let the universal set be the class of 27 pupils.
Let F and S be the sets of pupils learning French and Spanish, respectively.
We also know that n(F) = 18 and n(S) = 12.
Also, because 4 of the 27 pupils are not learning either French or Spanish, it means that the remaining
23 are learning at least one of those languages.
Hence n(F S) = 23, i.e. there are 23 pupils in the union of the two sets.
The set of pupils learning both languages corresponds to the intersection of those sets.
We need to find n(F S), using the law of intersection and union of sets,
i.e. n(F S ) = n(F) + n(S) – n(F S).
We rearrange the formula as n(F S) = n(F) + n(S) - n(F S )
(Add the cardinalities of both sets and subtract that of their union.)
Substituting n(F) = 18, n(S) = 12 and n(F S ) = 23, we have n(F S) = 7.
Hence 7 out of the 27 pupils are learning both French and Spanish.
ii) Since 18 pupils are learning French, and 7 are learning both French and Spanish, it follows that 11
are learning French, but not Spanish.
iii) There are 12 pupils in the Spanish class, and 7 of them are also learning French, so there are 5
remaining who are not learning French.
The probability that a randomly-chosen student out of the Spanish class is not learning French is
therefore 125 .
iv) The Venn diagram is shown on the right.
Mathematics Revision Guides – Set Theory and Venn Diagrams Page 13 of 26
Author: Mark Kudlowski
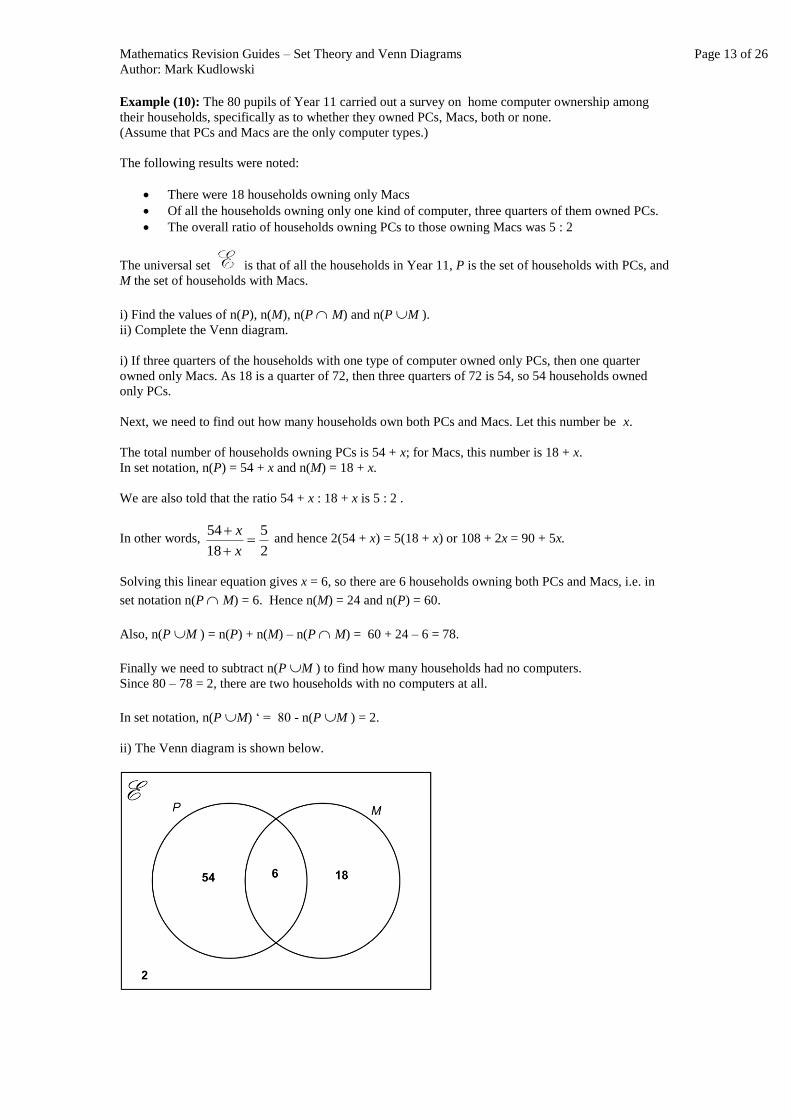
Example (10): The 80 pupils of Year 11 carried out a survey on home computer ownership among
their households, specifically as to whether they owned PCs, Macs, both or none.
(Assume that PCs and Macs are the only computer types.)
The following results were noted:
There were 18 households owning only Macs
Of all the households owning only one kind of computer, three quarters of them owned PCs.
The overall ratio of households owning PCs to those owning Macs was 5 : 2
The universal set is that of all the households in Year 11, P is the set of households with PCs, and
M the set of households with Macs.
i) Find the values of n(P), n(M), n(P M) and n(P M ).
ii) Complete the Venn diagram.
i) If three quarters of the households with one type of computer owned only PCs, then one quarter
owned only Macs. As 18 is a quarter of 72, then three quarters of 72 is 54, so 54 households owned
only PCs.
Next, we need to find out how many households own both PCs and Macs. Let this number be x.
The total number of households owning PCs is 54 + x; for Macs, this number is 18 + x.
In set notation, n(P) = 54 + x and n(M) = 18 + x.
We are also told that the ratio 54 + x : 18 + x is 5 : 2 .
In other words, 2
5
18
54
x
x and hence 2(54 + x) = 5(18 + x) or 108 + 2x = 90 + 5x.
Solving this linear equation gives x = 6, so there are 6 households owning both PCs and Macs, i.e. in
set notation n(P M) = 6. Hence n(M) = 24 and n(P) = 60.
Also, n(P M ) = n(P) + n(M) – n(P M) = 60 + 24 – 6 = 78.
Finally we need to subtract n(P M ) to find how many households had no computers.
Since 80 – 78 = 2, there are two households with no computers at all.
In set notation, n(P M) ‘ = 80 - n(P M ) = 2.
ii) The Venn diagram is shown below.

Mathematics Revision Guides – Set Theory and Venn Diagrams Page 14 of 26
Author: Mark Kudlowski
Example (11): This partially-completed Venn diagram
gives information about a fleet of buses in a depot.
The buses can either be single-deck or double-deck, and
can have either hybrid or diesel engines.
In the diagram, H is the set of hybrid buses and set D the
set of double-deck buses, with the universal set being
the set of all the buses in the fleet.
The following facts are also given:
There are 25 hybrid single-deck buses in the fleet, accounting for 20% of the total.
The number of diesel single-deck buses is the same as that of all hybrid buses.
Only a quarter of the double-deck buses have hybrid engines.
i) Complete the Venn diagram by placing algebraic expressions in each region.
ii) Find the value of x and hence copy the Venn diagram, replacing algebraic terms with numbers.
iii) Find the probability that if a bus from the fleet is chosen at random, it has a hybrid engine.
i) If 25 buses account for 20%, or one fifth, of the total, there are 25 5, or 125, buses in the fleet.
Since the number of all hybrid buses equals x + 25 from the
diagram, so does the number of the diesel single-deck buses.
The diesel single-deckers are represented by the area outside
the Venn circles, so we enter the expression x + 25 in that
outside area.
If a quarter of the double-deck buses have hybrid engines,
then three quarters have diesel engines. The ratio of diesels
to hybrids among the double-deck buses is therefore 3 : 1, so
if there are x hybrids, there are 3x diesels. We thus enter the
expression 3x in the non-overlapping region of set D.
ii) From the information in i) we can form an equation in x
and solve it.
The total number of buses in the fleet is 125, and adding
together all the expressions in the regions gives
3x + x + 25 + x + 25, simplifying to 5x + 50.
Hence 5x + 50 = 125 5x = 75 and finally x = 15.
Also, 3x = 45 and x + 25 = 40.
iii) There are 125 buses in the whole fleet, of which 40 have hybrid engines. The probability that a
randomly-chosen bus from the fleet has a hybrid engine is therefore 12540 or
258 .
Mathematics Revision Guides – Set Theory and Venn Diagrams Page 15 of 26
Author: Mark Kudlowski
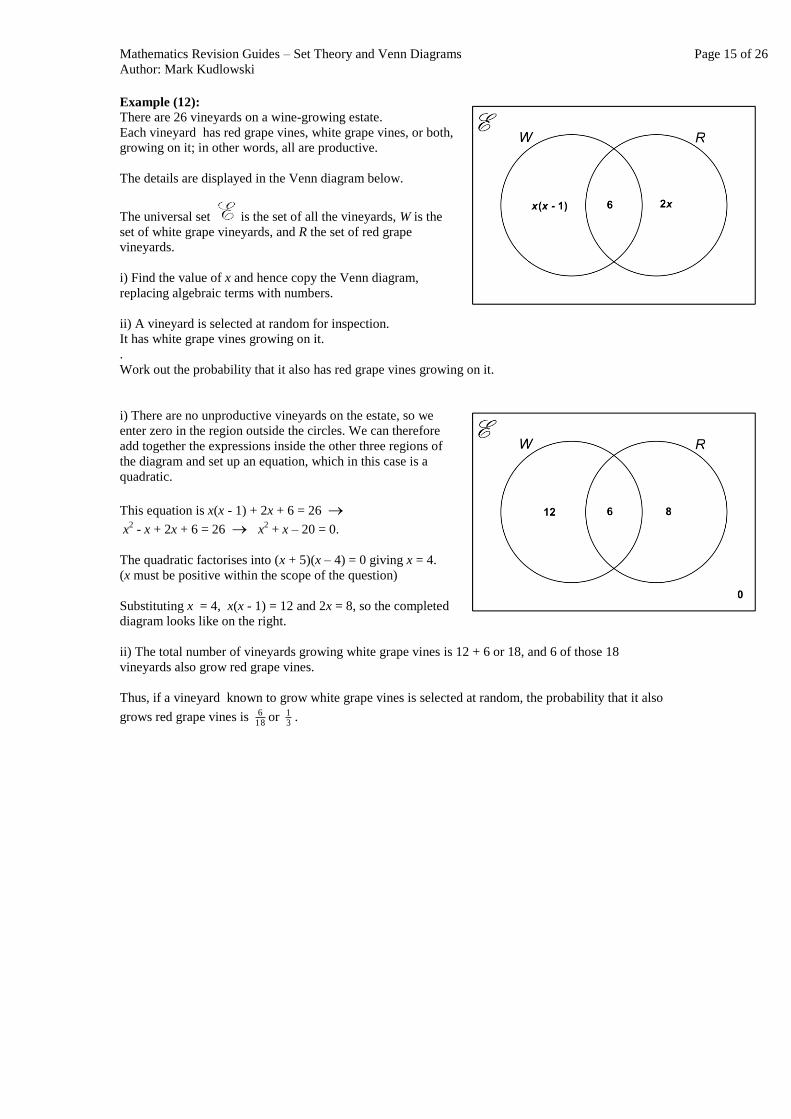
Example (12):
There are 26 vineyards on a wine-growing estate.
Each vineyard has red grape vines, white grape vines, or both,
growing on it; in other words, all are productive.
The details are displayed in the Venn diagram below.
The universal set is the set of all the vineyards, W is the
set of white grape vineyards, and R the set of red grape
vineyards.
i) Find the value of x and hence copy the Venn diagram,
replacing algebraic terms with numbers.
ii) A vineyard is selected at random for inspection.
It has white grape vines growing on it.
.
Work out the probability that it also has red grape vines growing on it.
i) There are no unproductive vineyards on the estate, so we
enter zero in the region outside the circles. We can therefore
add together the expressions inside the other three regions of
the diagram and set up an equation, which in this case is a
quadratic.
This equation is x(x - 1) + 2x + 6 = 26
x2 - x + 2x + 6 = 26 x2
+ x – 20 = 0.
The quadratic factorises into (x + 5)(x – 4) = 0 giving x = 4.
(x must be positive within the scope of the question)
Substituting x = 4, x(x - 1) = 12 and 2x = 8, so the completed
diagram looks like on the right.
ii) The total number of vineyards growing white grape vines is 12 + 6 or 18, and 6 of those 18
vineyards also grow red grape vines.
Thus, if a vineyard known to grow white grape vines is selected at random, the probability that it also
grows red grape vines is 186 or
31 .

Mathematics Revision Guides – Set Theory and Venn Diagrams Page 16 of 26
Author: Mark Kudlowski
Summary of Venn Diagrams with 2 circles.
The sets are shown as a pair of overlapping circles; their intersection is the area common to both, while
their union is the total area enclosed by both.
The diagram on the right is the ‘key’ for
the intersection of two sets A and B.

Mathematics Revision Guides – Set Theory and Venn Diagrams Page 17 of 26
Author: Mark Kudlowski
Extension to three sets.
The set algebra laws and Venn diagrams can also be extended to three sets, although the work can
rapidly become quite tedious.
Example (13): The Venn diagrams below relate to three sets A, B and C. Describe the shaded regions
in words and using set notation symbols.
i) The shaded region represents the intersection of the three sets, or, in set notation, A B C.
ii) We have the union of the three sets shaded here, namely A B C .
iii) This time we have members of A that are additionally not in B and not in C, in the shaded region.
In set notation, this is A B’ C’. (Recall complements of sets.)
iv) Here we have members of both sets A and B, but absent from set C.
The set notation is A B C’.
v) The shaded region comprises the members of A which are members of either B or C as well.
In effect, we are performing the intersection of A with the union of B and C.
In set notation, this is A B C).
Alternatively, we could reason that the shaded region represents the union of the two intersections
A B and A C, or, in set notation, (A B) (A C).
vi) In this example, we have the members present in either set A or B, but absent from C.
In other words, we have the union of A and B, but then apply an intersection of it with the complement
of C. In set notation : (A B) C’.
Alternatively, we could perform a union between A C’ and B C’ , or (A C’) (B C’).
(The last two results illustrate another law in set theory, beyond the scope of GCSE.)

Mathematics Revision Guides – Set Theory and Venn Diagrams Page 18 of 26
Author: Mark Kudlowski
Example (14): Three sets are defined as follows :
The universal set is = {positive integers from 1 to 50 inclusive}
N = {multiples of 9 within }
S = {square numbers within }
T = {triangular numbers within }
i) List the members of each set.
ii) Display the members of the three sets in a Venn diagram.
iii) Draw another Venn diagram to illustrate the cardinalities in each region, including the region
outside the Venn circles.
i) The sets are as follows:
N = {9, 18, 27, 36, 45}
S = {1, 4, 9, 16, 25, 36, 49},
T = {1, 3, 6, 10, 15, 21, 28, 36, 45}
We see that 36 is a multiple of 9, is a square
number, and is also a triangular number, so it
occurs in all three sets. We therefore place it in the
central region where all three Venn circles overlap.
N S T = {36}.
The number 1 is square and triangular, but not a
multiple of 9, so it goes in the region where S and
T overlap, but excluding the central region.
S T N’ = {1}.
The number 45 is a multiple of 9 and a triangular
number, but it is not a square number. so it goes in
the region where N and T overlap, excluding the
central region.
N T S’ = {45}.
The number 9 is square and a multiple of 9, but is not triangular, so it goes in the region where N and S
overlap, excluding the central region.
N S T’ = {9}.
This leaves us with the numbers only found in one Venn circle. Among the multiples of 9, we have 18
and 27; among the square numbers we have 4, 16, 25 and 49; among the triangular numbers we have 3,
6, 10, 15, 21 and 28.
In set notation,
N S’ T’ = {18, 27}
S N’ T’ = {4, 16, 25, 49}
T N’ S’ = {3, 6, 10, 15, 21, 28}

Mathematics Revision Guides – Set Theory and Venn Diagrams Page 19 of 26
Author: Mark Kudlowski
iii) The cardinalities are shown here :
The universal set includes all of the positive
integers from 1 to 50, but adding the
cardinalities of all the regions inside the Venn
circles gives us a total of 16. There are therefore
34 numbers in the universal set that are neither
square nor triangular, as well as being
indivisible by 9.

Mathematics Revision Guides – Set Theory and Venn Diagrams Page 20 of 26
Author: Mark Kudlowski
The ‘key’ to the three-circle Venn diagram is
shown on the right.

Mathematics Revision Guides – Set Theory and Venn Diagrams Page 21 of 26
Author: Mark Kudlowski
Example (15): A triathlon contest has 90 entrants, and they were all asked whether they had
preliminary training at the three events - running, cycling and swimming.
In total, 69 entrants had trained in running, 58 in swimming and 63 in cycling.
Several entrants had also trained in at least two events: running and swimming, 42; running and
cycling, 46; swimming and cycling, 40.
Also, 28 entrants had trained in all three events, and every entrant had trained in at least one event.
Complete the Venn diagram.
i) Label the regions in the Venn diagram as R, S and C to represent the three events, and begin by
entering 28 in the region representing the intersection of all three sets, corresponding to the number of
entrants who had trained in all three events. (Fig.i).
In set notation: n( R S C) = 28.
Next, we look at the numbers who had taken part in two of the events. Thus, 42 entrants had trained in
running and swimming (shaded regions, Fig.ii). We must deduct the 28 who had trained in all three
events, so we enter 42 – 28, or 14, in the region representing those who had trained in running and
swimming, but not in cycling. In set notation: n( R S C’) = 14.
By similar reckoning, 46 - 28, or 18 entrants, had trained in running and cycling but not in swimming,
and 40-28, or 12, had trained in swimming and cycling but not in running, so we enter the numbers in
the respective regions. (Fig. iii). In set notation: n( R S’ C) = 18 ; n( R’ S C) = 12.
Finally, we work out how many entrants had trained only in a single event. We know that 69 entrants
had trained in running, but we now know that 14 + 18 + 28, or 60, had trained in other events as well.
We must therefore subtract those 60 from the total, i.e. 9 entrants had trained only in running. (shaded
regions, Fig.iv) . In set notation: n( R S’ C’) = 9.
Similar calculations with respect to the other two events show that 58 – (14+28+12), or 4, entrants had
trained in swimming only, and that 63- (18+28+12) or 5 entrants had trained in cycling only (Fig.v) .
In set notation: n( R’ S C’) = 4 ; n( R’ S’ C) = 5.
Because every entrant had trained in at least one event, there are no further numbers to enter, so the
completed Venn diagram is shown in Fig. v.

Mathematics Revision Guides – Set Theory and Venn Diagrams Page 22 of 26
Author: Mark Kudlowski
Example (15a):
We shall use the completed Venn diagram from the previous question here.
The sets correspond to the numbers of triathlon entrants who had trained in the following events :
R = {running}, S = {swimming}, C = {cycling}.
i) Calculate the probability that an entrant chosen at random had only trained for one event.
ii) An entrant chosen at random stated that she had trained in swimming and cycling. Work out the
probability that she had not trained in running.
iii) Another entrant chosen at random stated that he had trained in exactly two events. What is the
probability that those two events were running and swimming ?
i) The number of entrants who had trained in only one event is 9 + 4 + 5, or 18, out of the 90, so the
probability of that happening is 9018 or
51 .
ii) As 40 entrants had trained in swimming and cycling, but only 12 of them had not trained in running,
the required probability is 4012 or 10
3 .
iii) The number of entrants who had trained in exactly two events is 18 +14 +12, or 44.
Of those 44 entrants, 14 had trained in running and swimming. The required probability is 4414 or .22
7

Mathematics Revision Guides – Set Theory and Venn Diagrams Page 23 of 26
Author: Mark Kudlowski
Some other terms and symbols. (Not examinable, but included for completeness.)
Membership of a set.
Membership of a set is denoted by the symbol non-membership by the symbol .
Example (16): Let S be the set of square numbers between 1 and 50.
We can say that 36, for example, is a member, but 30 is not.
In set notation, 36 S , but 30 S.
Example (17): Let P be the set of prime numbers between 1 and 20.
Write expressions, using set notation, to describe membership of the numbers 13 and 15 in set P.
In set notation, 13 P , but 15 P. (13 is a prime number, but 15 is not.)
Subsets.
If all of the elements of one set A are contained within another set B, then we say that A is a subset of B
and that B contains A. We can also say that B is a superset of A.
The corresponding notation is A B and B A.
The subsets above are referred to as proper subsets, where the subset has fewer members than the
‘parent’ one. If a subset can also coincide with the full set, then we use the symbols and Note
the similarity between these and the inequality symbols <,and >,.
If set A is not a subset of set B, i.e. there are elements in A missing from B, then we write A B.
Example (18): Let set P be the set of 52 playing cards in a pack, and H the set of hearts.
Write two statements, using suitable symbols, to represent the relationship.
Since the heart suit is a part of the whole card pack, the hearts form a subset of the whole, i.e. H P.
Conversely the set of all cards contains all the hearts, so we also say that P H.
Example (19): Let set C be the set of letters in the word LAMB, and D the set of letters in the word
ALABAMA. Which subset symbol can be used to relate the two sets ?
Since the elements of any set must be distinct, we must disregard the repeated ‘A’s in ALABAMA, and
hence both sets have the same four elements, namely A, B, L and M.
So we can say that C D .
Example (20): If set A contains the letters in SATURN and set B contains the letters in SATURDAY,
is set A a subset of set B ?
Inspection shows that the letter N is found in set A but not in set B, and so A B.
There are several other applications of Venn diagrams in GCSE mathematics, which are not quite as
‘dry’ and rigid as has been seen in this section.
Also, many of these applications can be understood without any formal knowledge of set algebra.
Mathematics Revision Guides – Set Theory and Venn Diagrams Page 24 of 26
Author: Mark Kudlowski
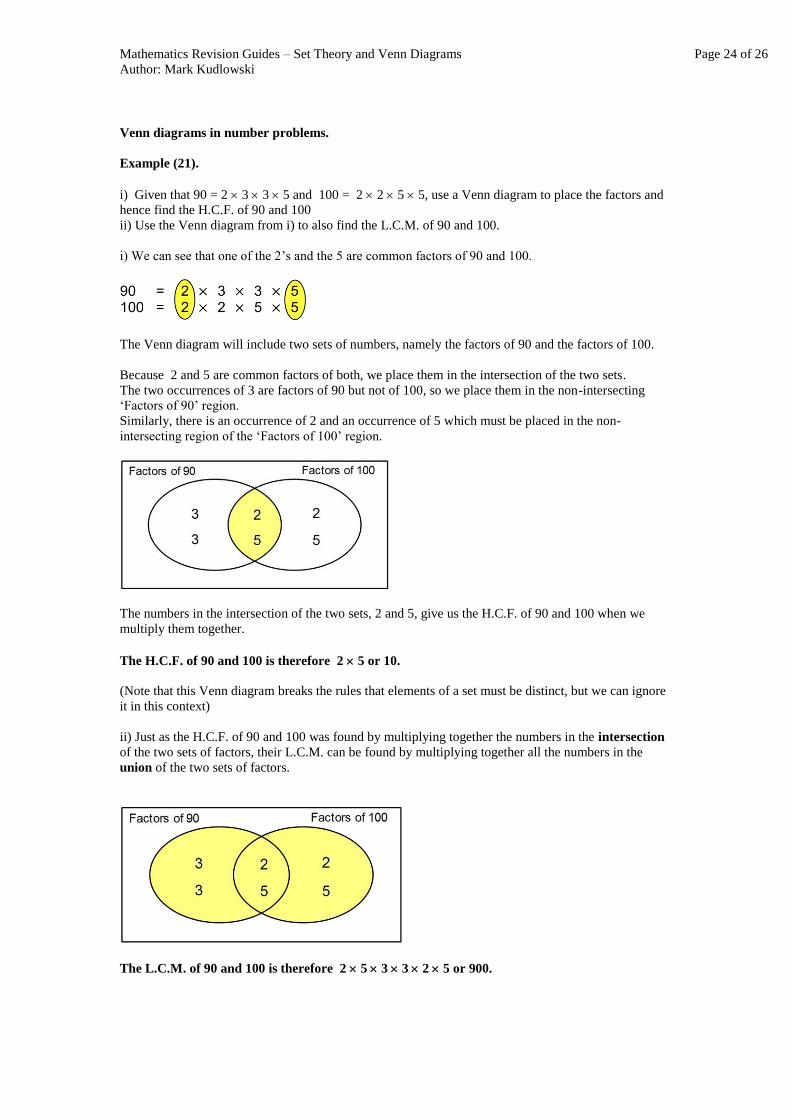
Venn diagrams in number problems.
Example (21).
i) Given that 90 = 2 3 3 5 and 100 = 2 2 5 5, use a Venn diagram to place the factors and
hence find the H.C.F. of 90 and 100
ii) Use the Venn diagram from i) to also find the L.C.M. of 90 and 100.
i) We can see that one of the 2’s and the 5 are common factors of 90 and 100.
The Venn diagram will include two sets of numbers, namely the factors of 90 and the factors of 100.
Because 2 and 5 are common factors of both, we place them in the intersection of the two sets.
The two occurrences of 3 are factors of 90 but not of 100, so we place them in the non-intersecting
‘Factors of 90’ region.
Similarly, there is an occurrence of 2 and an occurrence of 5 which must be placed in the non-
intersecting region of the ‘Factors of 100’ region.
The numbers in the intersection of the two sets, 2 and 5, give us the H.C.F. of 90 and 100 when we
multiply them together.
The H.C.F. of 90 and 100 is therefore 2 5 or 10.
(Note that this Venn diagram breaks the rules that elements of a set must be distinct, but we can ignore
it in this context)
ii) Just as the H.C.F. of 90 and 100 was found by multiplying together the numbers in the intersection
of the two sets of factors, their L.C.M. can be found by multiplying together all the numbers in the
union of the two sets of factors.
The L.C.M. of 90 and 100 is therefore 2 5 3 3 2 5 or 900.

Mathematics Revision Guides – Set Theory and Venn Diagrams Page 25 of 26
Author: Mark Kudlowski
Venn diagrams in probability problems.
(See Examples 8 to 11 for more probability tie-ins.)
Example (22): Keith is taking his driving test, and has a 70% chance of passing his theory test, and an
80% chance of passing his practical test.
Show all of the possible outcomes, and their percentage probabilities, in a Venn diagram.
The events are shown as circles, where the
inside of each circle represents a pass.
Since Keith can pass both tests, one test or none
at all, there are four possible outcomes:
The region where the two circles overlap
represents the case where Keith passes both
tests.
In set notation, this is {Theory} {Practical}
The region in the box outside both circles
represents the case of his failing both tests.
The set notation is ({Theory} {Practical})’.
By the multiplication law, the probability of
passing both the theory and practical tests is
0.7 0.8 = 0.56 (convert percentages to
decimals ! ) or 56%.
Since there are only two outcomes in each test,
the probability of failing the theory test is
1 – 0.7 or 0.3, and the probability of failing the
practical test is 1- 0.8 or 0.2
Hence the probability of failing both tests is
0.3 0.2 = 0.06 or 6%.
This leave the cases where Keith passes only one test out of the two. These correspond to the ‘outer’
regions in each circle.
He has a 70% probability of passing the theory test, but we must subtract the case where he passes
both, and so the probability of Keith passing the theory test alone is 70% - 56% = 14%.
He has a 80% probability of passing the practical test, so again we must subtract 56%. The probability
of Keith passing the practical test alone is 80% - 56% = 24%.
As a final check, all the probabilities add up to 56% + 6% + 14% + 24% = 100%., as they should !

Mathematics Revision Guides – Set Theory and Venn Diagrams Page 26 of 26
Author: Mark Kudlowski
Example (23): Lucy is taking her A-Level exams in Maths, Physics and Chemistry .
The probability of her receiving an ‘A’ grade is 0.8 for Maths, 0.75 for Physics and 0.6 for Chemistry.
Complete this Venn diagram of probabilities of ‘A’
grades. Do not forget to include the situation where
Lucy receives no ‘A’ grades.
The central region, where all three circles overlap,
corresponds to Lucy receiving an ‘A’ grade in all three
exams.
The probability of this event is
0.8 0.75 0.6 = 0.36 by the multiplication law.
After placing 0.36 in the central region, we can now
calculate the values in all the other missing regions.
‘A ‘ grade in Maths only (upper left) :
Since the total probability of an ‘A’ in Maths is 0.8,
we just add the probabilities of the other three regions
in the ‘Maths’ circle and subtract the result from 0.8.
We enter 0.8 – (0.24 + 0.12 + 0.36) = 0.08 there.
‘A ‘ grade in Physics and Chemistry, but not in Maths
(centre right) :
The total probability of an ‘A’ in Physics is 0.75, so
we just add the probabilities of the other three regions
in the ‘Physics’ circle and subtract that from 0.75.
(Enter 0.75 – (0.24 + 0.06 + 0.36) = 0.09 in there).
‘A ‘ grade in Chemistry only (lower part) :
The total probability of an ‘A’ in Chemistry is 0.6,
hence we just add the probabilities of the other regions
in the ‘Chemistry’ circle and subtract that from 0.6.
The result is 0.6 – (0.12 + 0.09 + 0.36) = 0.03, so enter that .
This leaves us with the outer region, in the rectangle but outside all of the circles, corresponding to the
case where Lucy gets no ‘A’ grades at all.
The probability of this event is (1-0.8) (1-0.75) (1-0.6) = 0.2 0.25 0.4 = 0.02.
A useful check is to add all the 8 probabilities together - they should all add up to 1 !