Embed Size (px)
Citation preview
COPYRIGHT@PÖYRY
July 2016
GIS Hydropower Resources Mapping for ECOWAS Region 1
Session 5:
Hydropower plants classification
GIS Hydropower Resources Mapping for ECOWAS Region
Training, Dakar, Senegal, July 2016
Trainer: Harald Kling
Pöyry, Hydro Consulting, Hydropower, Austria
Funded by

COPYRIGHT@PÖYRY
July 2016
GIS Hydropower Resources Mapping for ECOWAS Region
Hydropower plants classification
Overview
Plant layout
With or without diversion
With or without storage
Plant size
Installed capacity
Group work:
Longitudinal river profiles
COPYRIGHT@PÖYRY
July 2016
GIS Hydropower Resources Mapping for ECOWAS Region 3
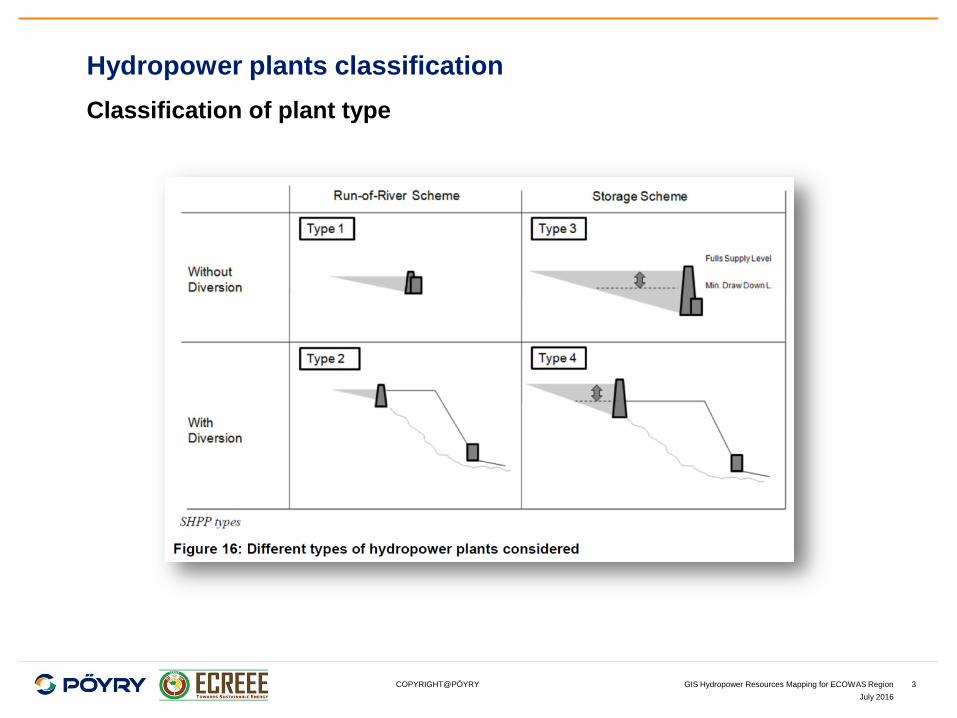
Hydropower plants classification
Classification of plant type

COPYRIGHT@PÖYRY
July 2016
GIS Hydropower Resources Mapping for ECOWAS Region
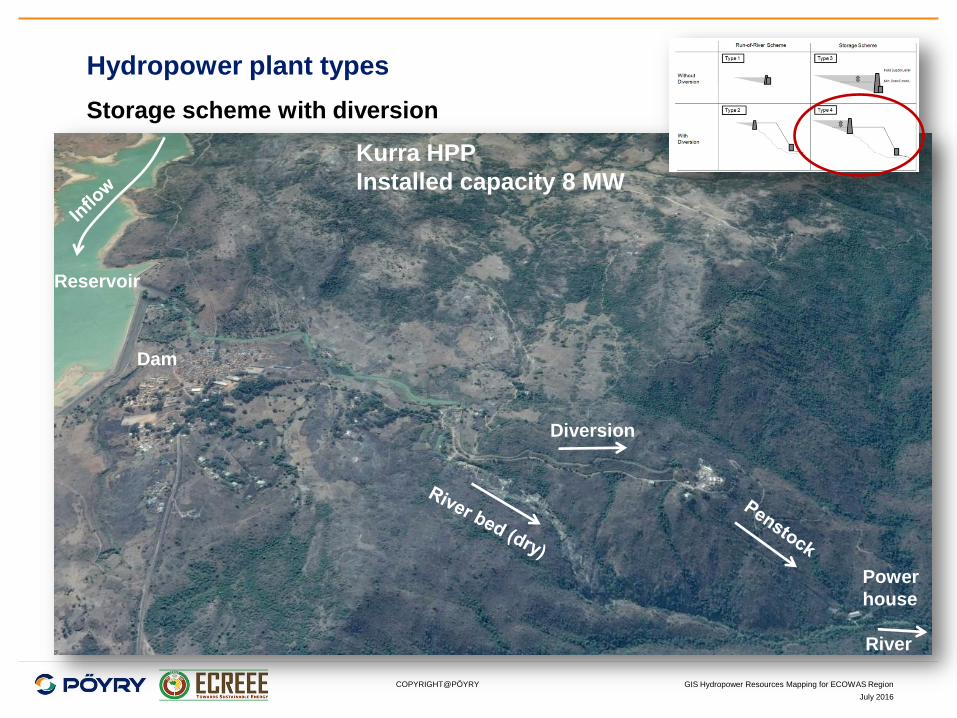
Dam
Tourni HPP
Installed capacity 0.6 MW
Power
house
Hydropower plant types
Run-of-River scheme without diversion

COPYRIGHT@PÖYRY
July 2016
GIS Hydropower Resources Mapping for ECOWAS Region
Dam
Jekko 1 HPP
Installed capacity 4 MW
Diversion
Power
house
Hydropower plant types
Run-of-River scheme with diversion
COPYRIGHT@PÖYRY
July 2016
GIS Hydropower Resources Mapping for ECOWAS Region
Dam
Kurra HPP
Installed capacity 8 MW
Diversion
Power
house
Hydropower plant types
Storage scheme with diversion
Reservoir
River

COPYRIGHT@PÖYRY
July 2016
GIS Hydropower Resources Mapping for ECOWAS Region
Hydropower plant types
Storage scheme without diversion
Kainji HPP
Installed capacity 760 MW
Dam Power
house
Reservoir
Ship lock
River
Spillway
COPYRIGHT@PÖYRY
July 2016
GIS Hydropower Resources Mapping for ECOWAS Region
Hydropower plant types
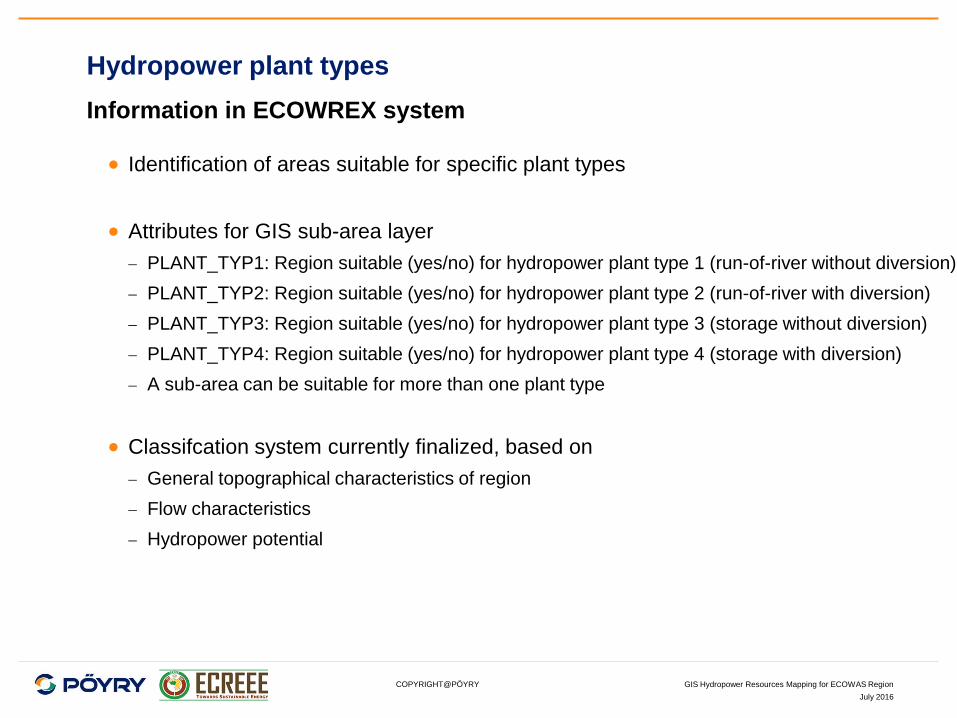
Information in ECOWREX system
Identification of areas suitable for specific plant types
Attributes for GIS sub-area layer
PLANT_TYP1: Region suitable (yes/no) for hydropower plant type 1 (run-of-river without diversion)
PLANT_TYP2: Region suitable (yes/no) for hydropower plant type 2 (run-of-river with diversion)
PLANT_TYP3: Region suitable (yes/no) for hydropower plant type 3 (storage without diversion)
PLANT_TYP4: Region suitable (yes/no) for hydropower plant type 4 (storage with diversion)
A sub-area can be suitable for more than one plant type
Classifcation system currently finalized, based on
General topographical characteristics of region
Flow characteristics
Hydropower potential
COPYRIGHT@PÖYRY
July 2016
GIS Hydropower Resources Mapping for ECOWAS Region
Hydropower plants classification
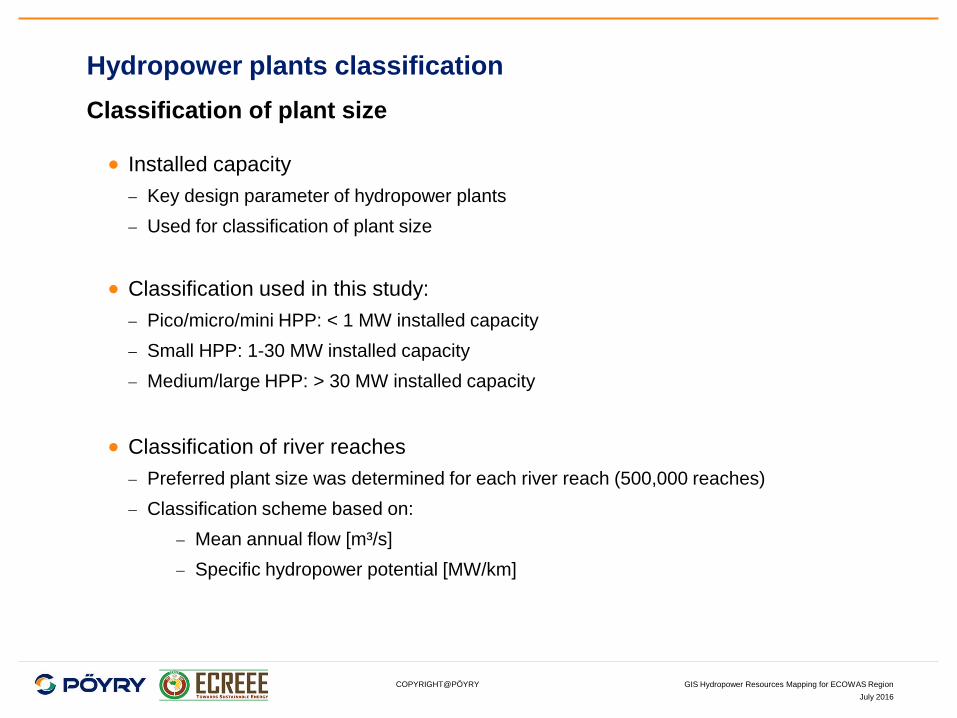
Classification of plant size
Installed capacity
Key design parameter of hydropower plants
Used for classification of plant size
Classification used in this study:
Pico/micro/mini HPP: < 1 MW installed capacity
Small HPP: 1-30 MW installed capacity
Medium/large HPP: > 30 MW installed capacity
Classification of river reaches
Preferred plant size was determined for each river reach (500,000 reaches)
Classification scheme based on:
Mean annual flow [m³/s]
Specific hydropower potential [MW/km]
COPYRIGHT@PÖYRY
July 2016
GIS Hydropower Resources Mapping for ECOWAS Region
0.001
0.01
0.1
1
10
100
1000
0.01 0.1 1 10 100 1000 10000
Spe
cifi
c p
ote
nti
al [
MW
/km
]
Mean annual flow [m³/s]
lower bound 1
lower bound 2
small bound
pico/micro/mini bound
10
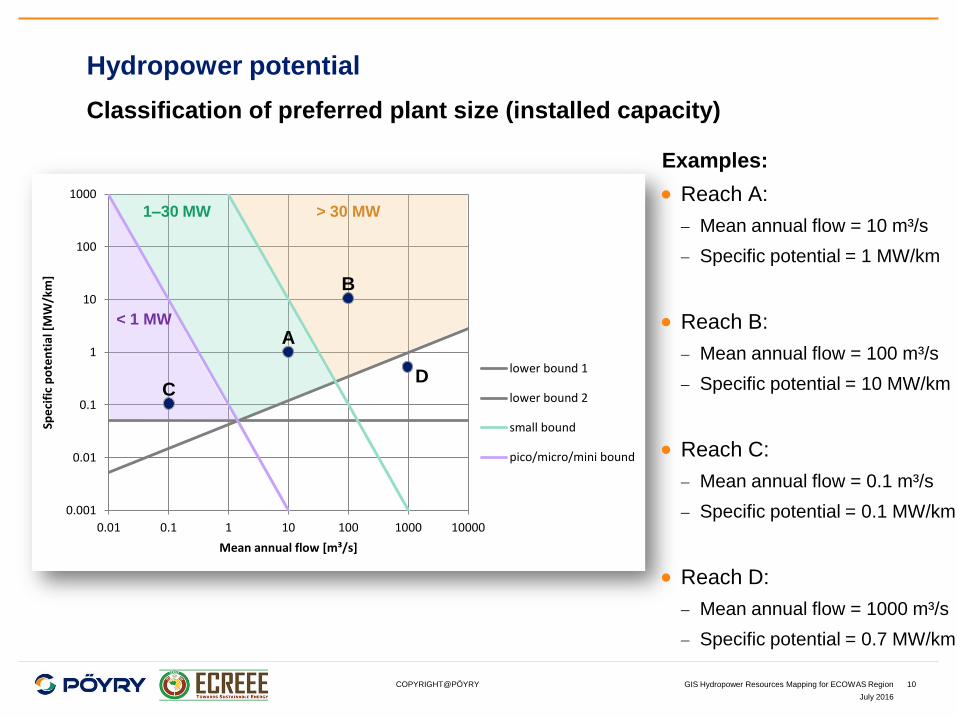
Hydropower potential
Classification of preferred plant size (installed capacity)
> 30 MW 1–30 MW
< 1 MW
Examples:
Reach A:
Mean annual flow = 10 m³/s
Specific potential = 1 MW/km
Reach B:
Mean annual flow = 100 m³/s
Specific potential = 10 MW/km
Reach C:
Mean annual flow = 0.1 m³/s
Specific potential = 0.1 MW/km
Reach D:
Mean annual flow = 1000 m³/s
Specific potential = 0.7 MW/km
A
B
C D

COPYRIGHT@PÖYRY
July 2016
GIS Hydropower Resources Mapping for ECOWAS Region 11
River network layer
Zoom in and query attributes of river reaches
Q [m³/s]

COPYRIGHT@PÖYRY
July 2016
GIS Hydropower Resources Mapping for ECOWAS Region
River network layer
Reaches classified for plant size

COPYRIGHT@PÖYRY
July 2016
GIS Hydropower Resources Mapping for ECOWAS Region
Hydropower potential
Longitudinal river profiles: Preferred plant size shown as background
COPYRIGHT@PÖYRY
July 2016
GIS Hydropower Resources Mapping for ECOWAS Region
Hydropower potential
Longitudinal river profiles: Preferred plant size
14
switch to GIS presentation...
Zoom in to reach
Switch between Q_YEAR and PLANT_SIZE view
Click on reach and show attributes
Note ARCID
Create longitudinal profile
In GIS pan along river and compare to long. plot
Explain tributaries

COPYRIGHT@PÖYRY
July 2016
GIS Hydropower Resources Mapping for ECOWAS Region
Groups of 3-4 people
Pick-up printed maps for your region of interest
Study maps and discuss in group which river you would like to analyze in detail
We will create the longitudinal plot together
Group work
Longitudinal river profiles
15
Funded by


![Workshop Hydropower and Fish.pptx [Schreibgeschützt] - Workshop Hydropower and Fish... · Workshop Hydropower and Fish Existing hydropower facilities: ... spawning grounds and shelter](https://img.dokumen.tips/doc/110x75/5a8733247f8b9afc5d8da3c5/workshop-hydropower-and-fishpptx-schreibgeschtzt-workshop-hydropower-and-fishworkshop.jpg)