Embed Size (px)
Citation preview
Research ArticleStability Analysis of a Run-of-River Diversion Hydropower Plantwith Surge Tank and Spillway in the Head Pond
Joseacute Ignacio Sarasuacutea Paz Eliacuteas Guillermo Martiacutenez-Lucas Juan Ignacio Peacuterez-DiacuteazJoseacute Romaacuten Wilhelmi and Joseacute Aacutengel Saacutenchez
Department of Hydraulic Energy and Environmental Engineering Technical University of Madrid 28040 Madrid Spain
Correspondence should be addressed to Jose Ignacio Sarasua joseignaciosarasuaupmes
Received 27 June 2014 Accepted 9 September 2014 Published 14 October 2014
Academic Editor Linni Jian
Copyright copy 2014 Jose Ignacio Sarasua et al This is an open access article distributed under the Creative Commons AttributionLicense which permits unrestricted use distribution and reproduction in any medium provided the original work is properlycited
Run-of-river hydropower plants usually lack significant storage capacity therefore the more adequate control strategy wouldconsist of keeping a constant water level at the intake pond in order to harness the maximum amount of energy from the riverflow or to reduce the surface flooded in the head pond In this paper a standard PI control system of a run-of-river diversionhydropower plant with surge tank and a spillway in the head pond that evacuates part of the river flow plant is studied A stabilityanalysis based on the Routh-Hurwitz criterion is carried out and a practical criterion for tuning the gains of the PI controlleris proposed Conclusions about the head pond and surge tank areas are drawn from the stability analysis Finally this criterion isapplied to a real hydropower plant in design state the importance of considering the spillway dimensions and turbine characteristiccurves for adequate tuning of the controller gains is highlighted
1 Introduction
Nowadays the interest in run-of-river hydropower plants isincreasing Climate change shortage of appropriate places tobuild conventional hydropower plants or generating electric-ity as near as possible to the consumption site (distributedgeneration) are some reasons for considering this type ofplants
There is an increasing need to develop clean energytechnologies to cope with the problems relating to cli-mate change sustainable development and energy securityAlthough hydropower is currently the principal renewableelectricity generation source its development would requireovercoming some barriers concerning environment publicacceptance and economic aspects [1]
In some regions such as Asia Pacific and Central andSouth America hydropower capacity is expected to increasesignificantly along next years For instance in Ecuadorhydropower produced more than one half of the generatedelectrical energy in 2012 [2] and one of the objectivesof the ldquoPlan Maestro de Electrificacionrdquo (ElectrificationMaster Plan) 2012ndash2021 is that 90 of electric energy is
to be generated from renewable sources hydro and windHowever in other countries expected hydropower capacityincrease would be lower than planned for other renewablestechnologies in Spain planned hydropower developmentis mainly based on run-of-river hydro plants small hydrounits for harnessing the energy associated with minimumenvironmental flows and refurbishment of existing plants [3]
Run-of-river hydro plants have become more importantin recent years Such plants are characterized by the smallor zero storage capacity of the head pond and therefore thegenerated energy depends to a great extent on the availableflow in the river The interest in this type of plants is due tothe effect of several factors
(i) Run-of-river hydro plants allow harnessing theenergy associated with water flows for other usessuch as water supply or irrigation or the environmen-tal minimum flows
(ii) In most cases conventional hydro plants with reser-voir give rise to significant environmental effectssuch as physical barriers for fish movements or
Hindawi Publishing Corporatione Scientific World JournalVolume 2014 Article ID 874060 13 pageshttpdxdoiorg1011552014874060
2 The Scientific World Journal
sediments transport along the river [4] visual impactflooded areas and land use issues
(iii) Size of run-of-river hydro plants is usually limitedtherefore these plants are connected to distributionnetworks and contribute to the development of dis-tributed generation In addition initial and operatingcosts are lower than those associated with otherrenewables sources such as wind parks [5]
Run-of-river plants have limited regulation capacity and ingeneral do not participate in power-frequency regulationHowever some ways of participation of run-of-river hydroplants in this task have been proposedThe joint operation ofseveral small hydro plants for providing primary secondaryand tertiary regulation services is analyzed in [4]The isolatedoperation of small hydro plants in remote areas is consideredin [5] the power-frequency regulation would be providedby changing the turbine speed when the discharged flowthrough the turbine is lower than the available river flowthus variable-speed generation equipment is required
The most frequently used control scheme in run-of-riverplants is based on controlling the water level in the head pond[6ndash13]Water level control has the advantages of its simplicityand robustness [8] allows minimizing the flooded area [13]and is compatible with other uses of spillway requiringconstant water level In small head schemes as considered in[6] it is important to maintain the water level within strictlimits Different algorithms for controlling the water levels inthree or more cascade hydro plants are presented in [7 12]In [10] the use of a dead band for minimizing the regulatormovements is analyzed The control system proposed in [14]is aimed at maintaining a minimum environmental flowin the intermediate river reach between the intake and thetailrace
PID regulator has been extensively used in turbine gover-nors of conventional hydro plantsThe adjustment of the PIDgains has been studied by several authors aiming to obtaina good dynamic response among the first contributions itis noteworthy to mention the works by Hovey and Paynter[15 16] in [17] the Routh-Hurwitz criterion is applied todefine the stability region A state variable model is usedin [18 19] for analyzing the influence of PI gains on theeigenvalues of the dynamic matrix The root-locus techniquehas also been applied to the adjustment of PID gains [20 21]Although in more recent works advanced control techniqueshave been applied [22] the interest for robust PID controllersis still active [23] In [24] the PID gains are analytically deter-mined by pole placement good performance was obtainedin simulations and field tests conducted in a real plant In[25 26] the stability study and the tuning of the PID werecarried out by eigenvalues analysis oscillation modes wereidentified and associated with the different elements of thepower plant
In the case of water level control in [8] it is foundthat with a PI controller a good response may be obtainedthe derivative component could be affected by the noisetransmitted with the sensor signal The root-locus techniqueis used to tune the controller in [12] In [9] the stabilityregions are determined in terms of some design parameters
the tuning of the PI controller is based on a heuristiccriterion derived from the root-locus plot The influence ofthe operating point in the dynamics response is studiedconcluding that for better performance the controller gainsshould be adapted to the operation conditions
The aim of this paper is the study of the stability ofthe water level control system of a run-of-river hydropowerplant under normal operating conditions Then a smallperturbation analysis will be used Two different operationmodes are studied In normal hydrologic conditions thewater level control system operates in a conventional waythe wicket gates position is changed adapting the dischargedflow to the inflow in order to maintain the water levelclose to the reference value In flooding operating conditionsthe excess flow is discharged through a spillway in thiscase the water level reference is changed in order to allowcontrolling the spilled flow as in [14] The dynamics of thisoperationmode has substantial differenceswith respect to thenormal operation mode [8] and requires a specific analysisAdditionally a diversion plant with surge tank is consideredin order to extend the applicability of the results in thisconfiguration the stability of level control should be studiedwith more detail due to the higher order of the involveddynamics Following the methodology described in [9 13]the stability regions are determined and the PI gains adjusted
The results obtained in this study have been applied toOcana II hydro plant (Cuenca Ecuador) which is currentlyin design phase
The paper is organized as follows In Section 2 the plantdynamic model used in the study is described In Section 3a small perturbation stability analysis is discussed and inSection 4 the PI controller is tuned by using a heuristiccriterion The theoretical results are applied to the case studyin Section 5 verifying the adequacy of the proposed tuningcriterion Finally in Section 6 the conclusions derived fromthis study are presented
2 Modeling
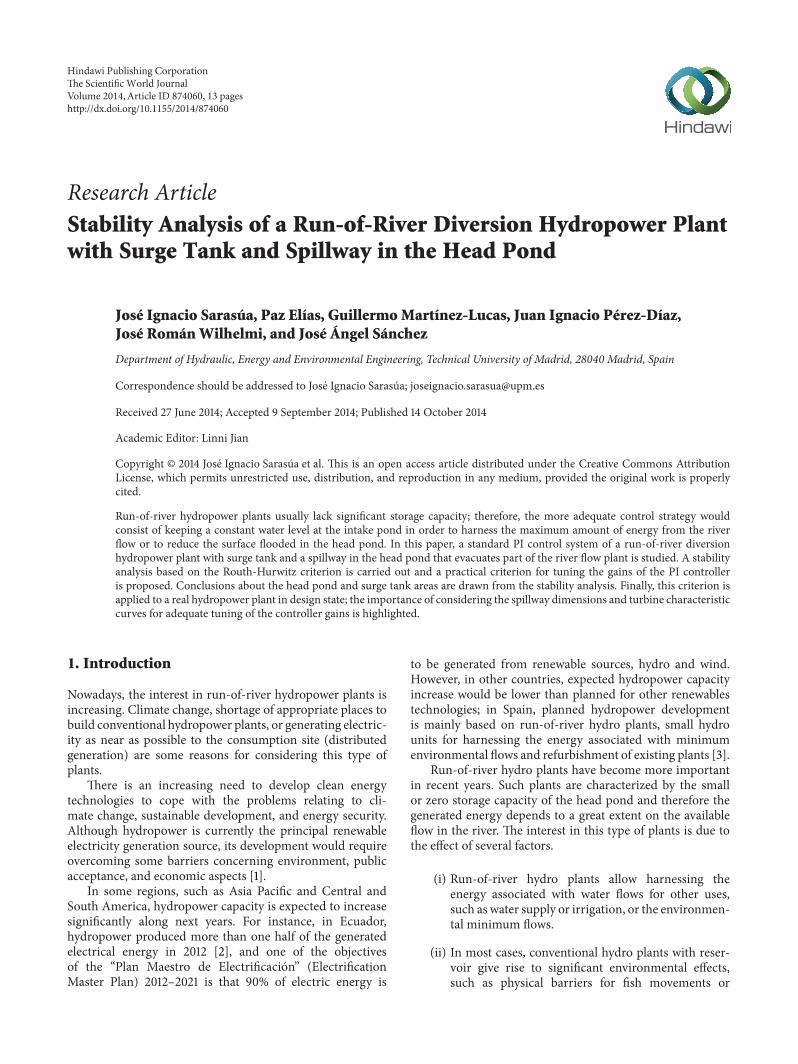
In this section the dynamicmodel of a run-of-river diversionhydropower station with pressurized conduits and surge tankis described The head pond where the intake is located iscreated by a small dam with a spillway that allows evacuatingthe excess flow when the plant operates under flood condi-tionsThewater surface in the head pond in normal operationis below the spillway level A sensor level is placed near theintake and its signal is sent to the governor which adjusts thewicket gates position in order to keep the water level constantin both situations normal or flood The plant layout can beseen in Figure 1
The block diagram of the power plant dynamic modelcomprising the hydraulic system and the PI regulator canbe seen in Figure 2 Main components of the model aredescribed below
The power plant modeled is supposed to operate con-nected to a large networkTherefore the unit speed variationsare not relevant and are damped in a very short time intervalcompared to the time scale of interest in this study [9
The Scientific World Journal 3
Q
Headrace tunnel
Penstock
Regulator
Turbine
SensorSurge tank
Head pond
Spillway
Water level in the head pond in normal conditions
Water level in the head pond in flood conditions
+minusHf
Qw
Qt
Qr
Href
Figure 1 Run-of-river diversion hydropower plant with surge tank and spillway in the head pond
Headracetunnel
Surge tank
Penstock
Q H
Turbine
X
HQ
PI regulator
XHead pondRiverflow
Qw
Qt
Qr QwQr
Qt
HfHs
Hs
Hs
Hf
Hf
Qp
Qp
Qt
Figure 2 Block diagram of the control system
27] thus speed may be supposed to remain constant at itssynchronous value
21 Hydraulic System The elements that define the hydraulicsystem are the head pond the headrace tunnel the surgetank the penstock and the turbine The dynamics of eachcomponent is expressed by different equations as presentedbelow The notation used throughout the paper is defined inAppendix B
Head Pond Consider
119860119891
119889119867119891
119889119905= 119876119903 minus 119876119908 minus 119876119905
(1)
where 119876119908 is the flow through the spillway It is equal to zeroin normal operation When the plant is working under floodconditions the flow is calculated with the expression
119876119908 = 119862119889119871alivradic(119885ref minus 119885aliv)3 (2)
Headrace Conduit The equations that describe transient-state flows in close conduits are mass and momentumconservation expressions [28] A lumped parameters modelhas been used to represent the headrace conduit behavior[27 29 30]
The system of ordinary equations obtained can be rep-resented as a series of Γ-shaped consecutive elements Theldquoorientationrdquo of the Γ-shaped elements may vary accordingto the upstream and downstream boundary conditions of thepipe A scheme of the model can be seen in Figure 3 In thiscase these boundary conditions are given by the head at bothends of the conduit
4 The Scientific World Journal
Hf H1
Hc
H2
Q1 Q2
1
neKrt
1
neKrt
1
neKrt
L
ne middot gAt
L
ne middot gAt
L
ne middot gAt
Lt middot g middot At
ne middot a2Lt middot g middot At
ne middot a2 Hgeminus1
Qngemiddot middot middot
Figure 3 Scheme of the headrace tunnel model
0650675 0675
067507
0707
0
072072
072
0
074074
074
0
076
076076
0
078
078078
07
08
0808
0
082
082
082
082
0
084
084
084
084
0
086086
086
086
086
086
086
088088
088
088
088
088
09
09
09
09
09
091091
091091
091
092
092
092
0925
0925
55 56 57 58 59 60 61 62 63 64 65 66 67 68 69 70 71 72 73 74 7501
015
02
025
03
035
04
045
05
055
02
03
04
05
06
07
09
08
10
q11
(m3
s)
n11 (rpm)
Figure 4 Hill curves
The set of expressions applied to each element are
119871
ne sdot 119892119860 119905119889119876119894
119889119905+1
ne119870119903119905
10038161003816100381610038161198761199051003816100381610038161003816 119876119905 = 119867119894minus1 minus 119867119894
ne sdot 1198862
119871 119905 sdot 119892 sdot 119860 119905
119889119867119894
119889119905= 119876119894 minus 119876119894+1
(3)
where ne is the number of Γ-shaped elements the pipe isdivided in
Surge Tank Consider
119860 119904
119889119867119904
119889119905= 119876119905 minus 119876 (4)
Penstock The conduit that joins the surge tank and theturbine is modeled as the headrace tunnel using the lumpedparameters approach
Turbine The aim of the model is to study transients slowerthan the turbine response In these cases [9 31] a staticmodelis used to include the turbine dynamics (5) The power plantmodeled has two identical units which are supposed to workat the same operating point thus a single equivalent turbinehas been considered
119876 = 119891119876 (119867119883) (5)
Equation (5) should be obtained from the turbine hill curvesin Figure 4 the efficiency hill of the turbine considered in thecase study is shown
The Scientific World Journal 5
22 PI Regulator A PI regulator modifies the wicket gateopening in order to maintain a constant water level in thehead pond The dynamics of this regulator can be expressedby
119883 = 119870119901 (119867119891 (119905) minus 119867ref) + 119870119894 int119905
0(119867119891 (119905) minus 119867ref) 119889119905int (6)
where119870119901 is the proportional gain and119870119894 is the integral gain
3 Stability Analysis
31 Linearized Model In order to study the system stabilityfollowing the Routh-Hurwitz criterion a linearmodel shouldbe used Some assumptions have been done in order tolinearize the above presented equations
(i) Penstock dynamics is not considered because theassociated time constant is in most cases very smallcompared to the relatively slow dynamics of the othercomponents [32] In the considered plant configura-tion friction losses are mainly due to the headraceconduit [9] and therefore friction losses in penstockcan also be neglected
(ii) The oscillations of water level in the head pond aremuch slower than pressure waves in the conduitsThen the headrace tunnel dynamics is approximatedby a rigid water column model (7) The completemodel described in Section 21 will be used only in thesimulations
119871 119905
119892119860 119905
119889119876119905
119889119905+ 119870119903119905
10038161003816100381610038161198761199051003816100381610038161003816 119876119905 = 119867119891 minus 119867119904 (7)
In order to obtain the state equations the controller equationis expressed in the form
119889119883
119889119905= 119870119894 (119867119891 minus 119867ref) + 119870119901
119889 (119867119891 minus 119867ref)
119889119905 (8)
Previous equations have been expressed in per unit values andlinearized around an initial equilibrium point the obtainedequations are included in Appendix A The resulting linearmodel in state space form is
119889X119889119905
= A sdot X + B sdot U (9)
X =[[[
[
119902119905
ℎ119891
ℎ119904
120591
]]]
]
U = [
[
119902119903
ℎrefnt]
]
(10)
B =
[[[[[[[[[[
[
0 0 0
1
119879119891
0 0
0 0 minus11988712
119879119904119896119901
119879119891
minus119896119894 0
]]]]]]]]]]
]
(11)
A =
[[[[[[[[[[[[
[
minus21199011199020119905
119879119908
1
119879119908
minus1
119879119908
0
minus1
119879119891
minus3
2119872 0 0
1
119879119904
0 minus11988711
119879119904
minus11988713
119879119904
minus
119896119901
119879119891
119896119894 minus 119896119901
3
2119872 0 0
]]]]]]]]]]]]
]
(12)
where the parameter119872 (13) has been introduced to considerthe effect of spillway dimensions
119872 =119862119889119871aliv119860119891
radic119885ref minus 119885aliv (13)
32 Stability Analysis The characteristic polynomial of thematrix Amay be expressed as
119875 (119860) = 1205824+ 11988611205823+ 11988621205822+ 1198863120582 + 1198864 (14)
where the coefficients are
1198861 =21199011199020119905
119879119908
+11988711
119879119904
+3
2119872
1198862 =1 + 2119901119902
0119905 11988711
119879119904119879119908
+3
2
21199011199020119905119879119904 + 11988711119879119908
119879119904119879119908
119872+1
119879119891119879119908
1198863 =3
2
1 + 21199011199020119905 11988711
119879119904119879119908
119872+
11988713119896119901 + 11988711
119879119904119879119908119879119891
1198864 = 119896119894
11988713
119879119904119879119908119879119891
(15)
According to Routh-Hurwitz criterion the system (9) isasymptotically stable if the following conditions are satisfied(a) All coefficients of the characteristic polynomial (14) mustbe different from zero and of the same sign (b) the elementsof the first column of the Routh array must be positive Inpractice the first condition is always fulfilled and the secondcondition may be shown to reduce to
119886111988621198863 minus 11988632minus 119886121198864 gt 0 (16)
In order to study the influence of the surge tank and headpond dimensions in the stability of the power plant thefollowing parameters 119899 and 119898 are defined as described in[9 13]
119899 =119860 119904
119860 th 119898 =
119860119891
119860 119904
(17)
6 The Scientific World Journal
where 119860 th is the surge tank cross-sectional area that guar-antees stability according to the Thoma criterion [13 33]Although this widely known criterion was formulated forload-frequency control it provides an interesting referencevalue for the present study The following expression (18)gives its value as a function of the plant design parameters
119860 119904 gt 119860 th =119871 1199051198762119887
21198921198672119887119860 119905119901
=119876119887
2119867119887119901119879119908 (18)
Introducing 119899 119898 and 119872 parameters stability conditionresults in
119896119894 lt (1199020119905 119899 + 11988711 +
3
2119872119899119879119908
2119901)
times [(1 + 21199011199020119905 11988711)119898 + (119902
0119905 119899 + 11988711)119898
2
3119872119879119908 + 1]
minus (1 + 21199011199020119905 11988711)
119898119899
2119901119879119908
3
2119872 + (11988713119896119901 + 11988711)
sdot
(1 + 21199011199020119905 11988711) (1198981198992119901) 119879119908 (32)119872 + 11988713119896119901 + 11988711
(1199020119905 119899 + 11988711 + (1198992119901) 119879119908 (32)119872)
211988713119898119879119908
(19)
where 119896119894 and 119896119901 are the controller gains in puFigures 5 6 and 7 include the effects of the surge tank
cross-section area (119899) the head pond surface area (119898) andthe spillway parameter (119872) respectively in the stabilityregion The coefficients 11988711 and 11988713 acquired from the hillcurves and the initial per unit headrace conduit flow variable1199020119905 used to obtain these figures correspond to the initialoperating point the per unit initial flow and head losses in theconduit 119901 have been assumed to be equal to 1 and 008 purespectively for the water inertia time constant119879119908 the value1209 s has been used as in the case study
As it can be seen in these figures the magnitude of thecontroller gains is large This is due to the very small value ofthe error signal (pu level variation in head pond) Thus fora practical implementation of this control scheme a signalconditioner could be required
In the three figures the area under the curves determinesthe stable region that is the combination of 119896119901 and 119896119894 thatguarantees a stable operation of the level control system As itseems intuitively logical it can be observed that in the threecases the system stability region is extended when parameters119899119898 and119872 increase
In Figure 5 the effect of varying the 119899 parameter isrepresented In the figure it can be seen that for 119899 valuesbelow 10 there exists a stability region This fact indicatesthat in the case of level control the fulfillment of the Thomacondition is not necessary for system stability [9]
In Figure 6 the effects of varying 119898 are consideredThe figure shows that this parameter influences notably thesystem stability
The characteristics of the spillway (length spillway dis-charge coefficient etc) reflected in the parameter 119872 (13)affect the stability of the plant as can be seen in Figure 7
0 50 100 150 200 250 300 350 400 450 5000
1
2
3
4
5
6
kp
ki
n = 1
n = 2
n = 3
n = 05
n variation (M = 001 m = 50)
Figure 5 Stability regions effect of the surface area of the surge tank(119899)
Therefore the design of the spillway should be taken intoaccount if water level control is considered
In order to compare the stability regions in both operationmodes (normal andflood) (19) is simplified using119872 = 0Theresulting expression (20) was developed in [9]
119896119894 lt (1199020119905 119899 + 11988711) [(1 + 2119901119902
0119905 11988711)119898 + 1]
minus (11988713119896119901 + 11988711)
times
(11988713119896119901 + 11988711)
(1199020119905 119899 + 11988711)
211988713119898
(20)
As it is shown in Figure 8 the stability region when a partof the riverrsquos flow is evacuated by the spillway is bigger thanthe region obtained in normal operation 119872 = 0010 isequivalent to a spillway with a length of 75m in a headpond of 900m2 and considering 05m for the height of waterlevel above the spillway Therefore it can be stated that thechange in the head pond dynamics produced by the spillwaycontributes positively to the stability of thewater level controlAdmittedly in flood operation mode head pond surface area(119860119891) may be affected for the change in the reference waterlevel However the influence in the stability regions due tothis change is quite small so it will be neglected
In (19) and (20) it can be seen that turbine operatingconditions are another important factor for stability Theinitial per unit headrace conduit flow 1199020119905 and the turbinecoefficients 119887119894119895 change when the plant is operating withpartial load different from rated conditions This fact affectsthe stability boundaries as well as the results of applying thetuning criterion of the PI gains proposed in the next sectionThis issue is studied in detail in [9] so in this paper the workfocuses on the influence of the spillway on the stability andcontrol of a run-of-river power plant
The Scientific World Journal 7
0 50 100 150 200 250 300 350 400 450 5000
1
2
3
4
5
6
kp
ki
m variation (M = 001 n = 2)
m = 25
m = 50
m = 75
m = 100
Figure 6 Stability regions effect of the surface area of the head pond(119898)
0 50 100 150 200 250 300 350 400 450 5000
1
2
3
4
5
6
kp
ki
M variation (n = 2 m = 50)
M = 001
M = 0005
M = 0015
M = 002
Figure 7 Stability regions effect of the spillway dimension (119872)
4 PI Gains Tuning
The characteristic polynomial (13) of the linearized systemhas in general four conjugate complex roots
11990112 = 119886 plusmn 119895119887 11990134 = 119888 plusmn 119895119889 (21)
Other authors have worked using the pole placement fortuning the governor gains For example in [34] some strate-gies for obtaining an appropriate response were proposedbut in the context of load-frequency control In [35] waterlevel of three coupled tanks is controlled by a structure of PIcontrollers PI controllers were tuned using pole placementmethod by reducing the overshoot and the settling time Inthis paper one of the main priorities is to minimize the effortmade by the servo which acts on the turbine wicket gatesfollowing the philosophy expressed in [10] and reducing thesettling time For these purposes the criteria proposed in [9]are used in this paper and summarized below
(1) The real part of each pair of conjugated poles shouldhave approximately the same value so that the settlingtimes are similar and the appearance of a slow pole isavoided
0 20 40 60 80 100 120 140 1600
02040608
112141618
2
Normal operationFlood operation
(m = 2 n = 50M = 0001)
kp
ki
Figure 8 Stability regions comparison of normal and floodoperation
2
2
2
5
5
5
10
10
10
15
15
15
20
20
20
30
30
30
40
40
40
40
60
60
60
60
80
80
80
80
100
100
100
125
125
125
150150
150
175
175
175
200200
200
250250
250
M
0 2 4 6 8 10 12 14 160
0005
001
0015
002
0025
Tw
Figure 9 Relation between119872 119879119908 and 119896119901
(2) One of these pairs should have its imaginary part closeto zero thus avoiding the appearance of oscillations asfar as possible
Analytical expressions (22) for the proportional gain in pu119896119901 and the integral term in pu 119896119894 are obtained from the rulesformulated As stated in [9] it is worthy tomention that theseexpressions are independent of each other
Figures 9 and 10 include the relation between 119879119908 and119872(spillway dimension) with the 119896119901 and 119896119894 parameters obtainedusing (22) It has been supposed that the surge tank surfaceis equal to the surface proposed by [33] for the surge tankdimensioned in Ocana II power plant A head pond surfacearea of 900m2 will be assumed This value corresponds tohead pond surface area in Ocana II power plant
119896119901 =1
11988713
[
119879119904119879119908119879119891
2(21199011199020119905
119879119908
+11988711
119879119904
+3
2119872)
times 1 + 2119901119902
0119905 11988711
119879119908119879119904
+3
2
21199011199020119905119879119904 + 11988711119879119908
119879119908119879119904
119872
+1
119879119908119879119891
minus1
4(21199011199020119905
119879119908
+11988711
119879119904
+3
2119872)
2
8 The Scientific World Journal
minus3
2(1 + 2119901119902
0119905 11988711) 119879119891119872]
minus 11988711
119896119894 =
119879119904119879119908119879119891
1611988713
times 1 + 2119901119902
0119905 11988711
119879119908119879119904
+3
2
21199011199020119905119879119904 + 11988711119879119908
119879119908119879119904
119872
+1
119879119908119879119891
minus5
16(21199011199020119905
119879119908
+11988711
119879119904
+3
2119872)
2
times (21199011199020119905
119879119908
+11988711
119879119904
+3
2119872)
2
(22)
5 Study Case
Ocana II hydropower plant located in Canar (Ecuador) is arun-of-river diversion plant just downstream Ocana I powerplant which is operating nowadays in Canar River The plantconsists of a head pond with a spillway for excess of flowduring flood periods long headrace conduit of more than 5kilometers surge tank penstock and two Francis turbinesThe main features of the plant are reflected in Table 1
The results of the previous stability analysis as well asthe followed PI tuning criterion have been applied to ahydropower plant that is currently in design stage The plantresponse has been obtained by means of simulations Theresults obtained were useful in the design process and will beused for the implementation of the control system
Although the model used for both the stability analysisand obtaining the mathematical expressions of the controllergains is a linear model with certain simplifications themodel used for simulations is the nonlinear one describedin Section 2 and includes penstock dynamics as well asnonlinearities associated with losses in the conduits so as toobtain results closer to the real plant response The headraceconduit has been divided into six equal elements and thenumber of elements for the penstock is four
51 Application of the Results of the Stability Analysis Thestability regions obtained from (19) and (20) correspondingto the power plant under study for both operating modes areshown in Figure 11 Table 1 contains the parameters neededto make the power plant characteristics adequate for themathematical expressions
Two cases are considered to evaluate the plant responsein this situation The first one is the case evaluated in [9] inwhich the reference water level in the head pond is below thespillway (normal condition) In the second case the referencewater level in the head pond is over the spillway (floodconditions) In both operating modes scenarios the initial
025
05
05
075
075
075
1
1
1
1
125
125
125
125
15
15
15
2
2
2
25
35
25
25
3
3
3
35
35
4
4
4
55
5
0 2 4 6 8 10 12 14 160
0005
001
0015
002
0025
M
Tw
Figure 10 Relation between119872 119879119908 and 119896119894
0 50 100 150 200 250 3000
1
2
3
4
5
6
Normal operationFlood operation
BF
C
D E
AG
H
kp
ki
Figure 11 Stability regions in normal and flood operation condi-tions
flow released through the turbines is 20m3s In normalconditions initial turbine(s) flow coincides with the riverflow under flood conditions the river flow is 254m3s thespillway evacuating 54m3s
In both cases the system response to a sudden reductionin river flow of 3m3s has been simulated for each pair ofgains included in Table 2 Pairs of gains are highlighted in thestability regions (AndashF) (Figure 11) In Table 2 it is indicatedwhether or not each pair of gains is located inside or outsidethe corresponding stability region
Figure 12 shows the plant response with the PI tunedwith the gains corresponding to A B and C in the casewithout spillway in normal conditions As can be seen inFigure 12 only in case B (119896119901 = 100 119896119894 = 2) the plantresponse is stableThis result is in agreement with the stabilityregion depicted in Figure 11 In turn Figure 13 shows the plantresponse under flood conditions with spillway in points AB and C As it can be deduced from Figure 11 the plantresponse is stable with all pairs of gains (A B and C) Thedifferences between the responses of the power plant are theconsequence of the variation in the gains of the PI regulatorThe damping of oscillations decreases for higher values of119896119901 but the amplitude of the oscillations is reduced in thesecases The minimum value of the controlled variable (waterlevel in the head pond) is not as important as in the case ofload frequency control where frequency must be maintainedwithin a severe interval Therefore low values for 119896119901 could
The Scientific World Journal 9
Table 1 Plant dimensions parameters and base values
Element Parameter Value
Base values Base head 119867119887 16519mBase flow 119876119887 20m3s
Head pond
Horizontal section 119860119891 900m2
Spillway length 119871aliv 900mSpillway level 119885aliv 45090maslWater level reference under normal conditions 119885ref 45010maslWater level reference under flood conditions 119885ref 45140masl
119872 0012
Head race conduit
Length 119871 119905 5201mSection 119860 119905 531m2
Losses Δ119867119905 1321mLosses (pu) 119901 0080 puTime constant 119879119908 1209 sInitial head-race conduit flow 119902119905
0 100 pu
Surge tank
Section 119860 119904 962m2
Thoma section 119860 th 915m2
119898 1052119899 9354
PenstockLength 119871119901 80115mSection 119860119901 531m2
Losses Δ119867119901 345m
Turbine 11988711 059611988713 0978
Table 2 Pairs of gains selected for carrying out simulations
Point 119896119901 119896119894Stability
Normal operation Flood operationA 20 2 NO YESB 100 2 YES YESC 180 2 NO YESD 50 3 NO YESE 150 3 NO YESF 250 3 NO NO
be appropriate for reducing the wear and tear of the servomechanism that moves the wicket gates position
Figure 14 shows the response in D E and F points inorder to verify the validity of the stability region presentedin Figure 11 for flood conditions As expected the responsefor adjustment at point F results unstable The simulationshave been carried out only with the plant in flood conditionsbecause all the responses for points D E and F are unstablewhen the water level is below the spillway in the head pond
52 Application of the PI Tuning Criterion The expressions(22) are applied for tuning PI gains of Ocana II powerplant both in normal (119872 = 0) and in flood operatingconditions Table 3 contains the numerical values of the gainsin both situations and in Figure 11 the two pairs of gains arepositioned in the corresponding stability regions
Table 3 Pairs of gains from the tuning criterion
Point 119896119901 119896119894
G-flood operation 1196 0724H-normal operation 7844 0200
From Figure 11 it can be deduced that the pair of gainsfor flood operation (G) can cause instabilities if used duringnormal operation In order to support this idea the samesudden reduction of 3m3s in the river flow has beensimulated in normal conditions with pairs of gains G and HThe response of the power plant is shown in Figure 15
The instability observed for the pair of gains G confirmsthe results obtained from the linear model Moreover asit can be seen in Figure 15 when the controller is tunedaccording to the criterion (gains H) the oscillation of thewicket gates position is almost eliminated thus contributingto both increasing the equipment service life and reducing thesettling time of the response
FromFigure 11 it can be deduced that unlike the previouscase using the pair of gains obtained for normal operation(H) should not give rise to instabilities in flood conditionsNevertheless as it is shown in Figure 16 the quality of thepower plant response is considerably worse than the oneobtained with the pair of gains specific to flood conditions(G)
The results obtained in the case study highlight theimportance of carrying out a stability analysis similar to the
10 The Scientific World Journal
161820
448450452
Wat
er le
vel i
n he
ad
pond
(ma
sl)
005
1
Wic
ket g
ate
posit
ion
(pu
)
024
Spill
way
flow
ABC
(m3s)
Rive
r flow
(m3s)
Time (s)0 100 200 300 400 500 600 700 800 900 1000
Time (s)0 100 200 300 400 500 600 700 800 900 1000
Time (s)0 100 200 300 400 500 600 700 800 900 1000
Time (s)0 100 200 300 400 500 600 700 800 900 1000
Figure 12 River flow wicket gates position water level in the headpond and spillway flow in normal operation (points A B and C)
one presented here in the design phase of a run-of-riverdiversion power plantThe results of the stability analysis canbe of much help for making decisions about certain designparameters of the power plant as well as about the gains ofthe water level controller
6 Conclusions
In this paper the stability of a run-of-river diversionhydropower plant with a spillway in the head pond thatevacuates a portion of the river flow is analyzed A PIcontroller is used formaintaining a constant water level in thehead pond the effects of a surge tank have been consideredFor this purpose a small perturbation stability analysis basedon the Routh-Hurwitz criterion has been carried out Fromthe stability analysis it has been demonstrated that theexistence of a spillway in the analysis improves the stabilityof the plant water level control when the dynamics of thespillway is included (flood operation mode) the stabilityregion covers a broader area than in normal operation mode(without spillage) On the other hand it has been found thatthe fulfillment of the well-known Thoma stability conditionis not necessary in this case
In addition analytical expressions based on a heuristiccriterion have been obtained for both the proportional andintegral gains in flood operation conditions It is worth notingthat the said expressions depend on the dimensions andflow evacuated by the spillway the initial per unit headraceconduit flow and the turbine parameters Additionally itis interesting to emphasize that these analytical expressionshave been found to be independent of one another
222426
Rive
r flow
451245144516
Wat
er le
vel
in h
ead
pond
(ma
sl)
040608
Wic
ket g
ate
posit
ion
(pu
)
05
10
Spill
way
flow
ACB
(m3s)
(m3s)
Time (s)0 100 200 300 400 500 600 700 800 900 1000
Time (s)0 100 200 300 400 500 600 700 800 900 1000
Time (s)0 100 200 300 400 500 600 700 800 900 1000
Time (s)0 100 200 300 400 500 600 700 800 900 1000
Figure 13 River flow wicket gates position water level in the headpond and spillway flow in flood operation (points A B and C)
222426
Rive
r flow
451245144516
Wat
er le
vel
in h
ead
pond
(ma
sl)
005
1
Wic
ket g
ate
posit
ion
(pu
)
05
10
Spill
way
flow
DEF
Time (s)0 100 200 300 400 500 600 700 800 900 1000
Time (s)0 100 200 300 400 500 600 700 800 900 1000
Time (s)0 100 200 300 400 500 600 700 800 900 1000
0 100 200 300 400 500 600 700 800 900 1000Time (s)
(m3s)
(m3s)
Figure 14 River flow wicket gates position water level in the headpond and spillway flow in flood operation (points D E and F)
The stability analysis as well as the PI tuning criterionhas been applied to a real hydropower plant currently inthe design stage the plant response has been obtained bymeans of simulations with a more detailed modelThe resultsobtained have been found to be useful for the design processandmay be used in the implementation of the control system
The Scientific World Journal 11
161820
449450451
Wat
er le
vel
in h
ead
pond
(ma
sl)
005
1
Wic
ket g
ate
posit
ion
(pu
)
01
Spill
way
flow
HG
(m3s)
Rive
r flow
(m3s)
minus1
Time (s)0 100 200 300 400 500 600 700 800 900 1000
Time (s)0 100 200 300 400 500 600 700 800 900 1000
Time (s)0 100 200 300 400 500 600 700 800 900 1000
Time (s)0 100 200 300 400 500 600 700 800 900 1000
Figure 15 River flow wicket gates position water level in the headpond and spillway flow points G and H in normal operation
222426
451245144516
Wat
er le
vel
in h
ead
pond
(ma
sl)
0708
Wic
ket g
ate
posit
ion
(pu
)
246
HG
Rive
r flow
(m3s)
Spill
way
flow
(m3s)
Time (s)0 100 200 300 400 500 600 700 800 900 1000
Time (s)0 100 200 300 400 500 600 700 800 900 1000
Time (s)0 100 200 300 400 500 600 700 800 900 1000
Time (s)0 100 200 300 400 500 600 700 800 900 1000
Figure 16 River flow wicket gates position water level in the headpond and spillway flow points G and H in flood operation
The results of the stability analysis and the simulationshave demonstrated that the operation with a reference waterlevel above the spillway crest level (ie with a constant flowrate released through the spillway) is more stable than theone with a reference water level below the spillway crestlevel Also it has been found that the level controller gainsshould be updated in real-time operation not only as afunction of the actual operating point (full or partial load)
but also as a function of the actual operating mode (normalor flood conditions) in order to guarantee a stable and qualityresponse of the water level control system Should the real-time gains updating not be possible a similar analysis to theone carried out in this paper should be done to select a pairof gains that guarantees a stable response in as many foreseenoperating points and modes as possible with a reasonableresponse quality
Appendices
A Linearization
The equations that describe the behavior of the componentsof the power station have been linearized around an operatingpoint as shown below Per unit values have been extensivelyused The following linearized expressions are obtained
Head pond is
119889ℎ119891
119889119905= minus
1
119879119891
119902119905 minus3
2119872ℎ119891 +
1
119879119891
119902119903 (A1)
Headrace conduit is
119889119902
119889119905= minus
21199011199020119905
119879119908
119902119905 minus1
119879119908
ℎ119891 minus1
119879119908
ℎ119904 (A2)
Surge tank-penstock-turbine is
119889ℎ119904
119889119905=1
119879119904
119902119905 minus11988711
119879119904
ℎ119904 minus11988713
119879119904
120591 minus11988712
119879119904
nt (A3)
PI regulator is
119889120591
119889119905= minus
119896119901
119879119891
119902119905 + (119896119894 minus 119896119894
3
2119872)ℎ119891 minus 119896119894ℎref minus
119896119901
119879119891
119902119903 (A4)
Turbine is
119902 = 11988711ℎ + 11988712nt + 11988713120591 (A5)
where
119879119908 =119871 119905119876119887
119892119860 119905119867119887
119879119904 =119860 119904119867119887
119876119887
119879119891 =
119860119891119867119887
119876119887
119901 =1198701199031199051198762119887
119867119887
(A6)
B Used Symbols
119886 Wave celerity in the conduit (ms)119860119891 Head pond cross-sectional area (m2)
12 The Scientific World Journal
119860 119904 Surge tank cross-sectional area (m2)
119860 119905 Headrace conduit cross-sectional area (m2)
119860 th Minimum surge tank cross-sectional area accordingtoThoma criterion (m2)
119860119901 Penstock cross-sectional area (m2)
119887119894119895 Parameters of the linearized turbine equations119862119889 Spillway coefficient119892 Gravity acceleration (ms2)119867 Net head (m)119867119887 Base head (m)119867119891 Gross head in the head pond with respect to tailwater
level (m)ℎ119891 Variation of the gross head in the head pond (pu)119867119894 Head at the end of the 119894th Γ element of the conduit
(m)119867ref Reference height in the head pond with respect to
tailwater level (m)ℎref Variation of the reference height in the head pond
(pu)119867119904 Surge tank level with respect to tailwater level (m)ℎ119904 Surge tank water level variation (pu)119870119901 Proportional gain of PI controller119896119901 Proportional gain of PI controller (pu)119870119894 Integral gain of PI controller119896119894 Integral gain of PI controller (pu)119870119903119905 Headrace loss coefficient119871 119905 Headrace conduit length (m)
119871aliv Crest spillway length (m)119871119901 Penstock length (m)nt Turbine rotational speed (pu)119901 Headrace conduit losses (pu)119902 Turbine flow (pu)119876 Turbine flow (m3s)119876119887 Base flow (m3s)119876119894 Flow in the 119894th Γ element of the conduit (m3s)119876119903 River flow (m3s)119902119903 River flow variation (pu)119876119905 Headrace conduit flow (m3s)119902119905 Variation in headrace conduit flow (pu)1199020119905 Initial headrace conduit flow (pu)119879119891 Head pond time constant (s)119879119904 Surge tank time constant (s)119879119908 Headrace conduit time constant (s)119883 Wicket gates opening (mm)119883119887 Base value of the wicket gates opening (mm)
120591 Wicket gates opening variation (pu)119885ref Reference height in the head pond (masl)119885aliv Crest spillway level (masl)Δ119867119901 Friction losses in the penstock (m)Δ119867119905 Friction losses in the headrace tunnel (m)
Conflict of Interests
The authors declare that there is no conflict of interestsregarding the publication of this paper
Acknowledgments
Theauthors wish to thank theworking group fromElecaustroandGasNatural Fenosa Engineering for their valuable help inthe development of the study presented in this paper
References
[1] International Energy Agency Technology RoadmapHydropower OECDIEA 2012 httpwwwieaorg
[2] M R Pelaez-Samaniego G Riveros-Godoy S Torres-Contreras T Garcia-Perez and E Albornoz-VintimillaldquoProduction and use of electrolytic hydrogen in Ecuadortowards a low carbon economyrdquo Energy vol 64 pp 626ndash6312014
[3] Spanish Renewable Energy Plan IDAE Plan de Energıas Ren-ovables 2011ndash2020 httpwwwmineturgobes
[4] L Spitalny D Unger and J M A Myrzik ldquoPotential of smallhydro power plants for delivering control energy in Germanyrdquoin Proceedings of the IEEE Energytech pp 1ndash6 May 2012
[5] J L Marquez M G Molina and J M Pacas ldquoDynamicmodeling simulation and control design of an advancedmicro-hydro power plant for distributed generation applicationsrdquoInternational Journal of Hydrogen Energy vol 35 no 11 pp5772ndash5777 2010
[6] P A Frick ldquoAutomatic control of small hydroelectric plantsrdquoIEEE Transactions on Power Apparatus and Systems vol 100 no5 pp 2476ndash2485 1981
[7] K Kurotani and K Takeda ldquoWater level regulating systemrdquo edGoogle Patents 1995
[8] A H Glattfelder and L Huser ldquoHydropower reservoir levelcontrol a case studyrdquo Automatica vol 29 no 5 pp 1203ndash12141993
[9] J I Sarasua J Fraile-Ardanuy J I Perez J R Wilhelmi andJ A Sanchez ldquoControl of a run of river small hydro powerplantrdquo in Proceedings of the International Conference on PowerEngineering Energy and Electrical Drives (POWERENG 07) pp672ndash677 Setubal Portugal April 2007
[10] S Endo M Konishi and H Imabayasi ldquoWater level controlof small-scale hydroelectric power plant by deadbeat controlmethodrdquo in Proceedings of the 26th Annual Conference of theIEEE Industrial Electronics Society (IECON rsquo00) pp 1123ndash1128October 2000
[11] O Yadav N Kishor J Fraile-Ardanuy S R Mohanty J I Perezand J I Sarasua ldquoPond head level control in a run-of-riverhydro power plant using fuzzy controllerrdquo in Proceedings of the16th International Conference on Intelligent System Applications
The Scientific World Journal 13
to Power Systems (ISAP rsquo11) pp 1ndash5 Chersonisos GreeceSeptember 2011
[12] D Dumur A Libaux and P Boucher ldquoobust control for Basse-Isere run-of-river cascaded hydroelectric plantsrdquo in Proceedingsof the IEEE International Conference on Control Applications(CCA rsquo01) pp 1083ndash1088 September 2001
[13] O F Jimenez and M H Chaundhry ldquoWater-level control inhydropower plantsrdquo Journal of Energy Engineering vol 118 no3 pp 180ndash193 1992
[14] R Jidin and B Othman ldquoOutput improvement of Sg Piahrun-off river hydro-electric station with a new computed riverflow-based control systemrdquo IOP Conference Series Earth andEnvironmental Science vol 16 Article ID 012076 2013
[15] L Hovey ldquoOptimum adjustment of hydro governors on Man-itoba hydro systemrdquo Power Apparatus and Systems Part IIITransactions of theAmerican Institute of Electrical Engineers vol81 no 3 pp 581ndash586 1962
[16] M Paynter ldquoThe analog in governor design I A restrictedproblemrdquo in Palimpsest on the Electronic Analog Art G APhilbrick Researches Boston Mass USA 1960
[17] M Chaudhry ldquoGoverning stability of a hydroelectric powerplantrdquoWater Power vol 22 no 4 pp 131ndash136 1970
[18] D H Thorne and E F Hill ldquoExtensions of stability boundariesof a hydraulic turbine generating unitrdquo IEEE Transactions onPower Apparatus and Systems vol 94 no 4 pp 1401ndash1409 1975
[19] D T Phi E J Bourque D H Thorne and E F Hill ldquoAnalysisand application of the stability limits of a hydro-generatingunitrdquo IEEE Transactions on Power Apparatus and Systems vol100 no 7 pp 3203ndash3212 1981
[20] S Hagihara H Yokota K Goda and K Isobe ldquoStability of ahydraulic turbine generating unit controlled by PID governorrdquoIEEE Transactions on Power Apparatus and Systems vol 98 no6 pp 2294ndash2298 1979
[21] T Brezina J Kovar and T Hejc ldquoModeling and control ofsystem with pump and pipeline by pole placement methodrdquo inProceedings of the 14th International Conference onMechatronics(MECHATRONIKA rsquo11) pp 6ndash9 June 2011
[22] M Mahmoud K Dutton and M Denman ldquoDesign andsimulation of a nonlinear fuzzy controller for a hydropowerplantrdquo Electric Power Systems Research vol 73 no 2 pp 87ndash992005
[23] K Natarajan ldquoRobust PID controller design for hydroturbinesrdquoIEEE Transactions on Energy Conversion vol 20 no 3 pp 661ndash667 2005
[24] B Strah O Kuljaca and Z Vukic ldquoSpeed and active powercontrol of hydro turbine unitrdquo IEEE Transactions on EnergyConversion vol 20 no 2 pp 424ndash434 2005
[25] M Han B Kawkabani and J-J Simond ldquoEigenvalues analysisapplied to the stability study of a variable speed pump turbineunitrdquo in Proceedings of the 20th International Conference onElectrical Machines (ICEM rsquo12) pp 907ndash913 September 2012
[26] P C O Silva B Kawkabani S Alligne C Nicolet J-J Simondand F Avellan ldquoStability study of a complete hydroelectricproduction site by eigenvalues analysis method based on phasevariablesrdquo in Proceedings of the 19th International Conference onElectrical Machines (ICEM rsquo10) pp 1ndash6 Rome Italy September2010
[27] X Liu and C Liu ldquoEigenanalysis of oscillatory instability ofa hydropower plant including water conduit dynamicsrdquo IEEETransactions on Power Systems vol 22 no 2 pp 675ndash681 2007
[28] M H Chaudhry Applied Hydraulic Transients Van NostrandNew York NY USA 1987
[29] C Nicolet Y Pannatier B Kawkabani A Schwery F Avellanand J Simond ldquoBenefits of variable speed pumped storage unitsin mixed islanded power network during transient operationrdquoin Proceedings of the 16th Annual HYDRO Conference LyonFrance 2009
[30] J I Perez-Dıaz J I Sarasua and J R Wilhelmi ldquoContributionof a hydraulic short-circuit pumped-storage power plant tothe load-frequency regulation of an isolated power systemrdquoInternational Journal of Electrical Power andEnergy Systems vol62 pp 199ndash211 2014
[31] IEEE Working-Group on Prime Mover and Energy SupplyModels for System Dynamic Studies ldquoHydraulic turbine andcontrol models for system dynamic studiesrdquo IEEE Transactionson Power Systems vol 7 no 1 pp 167ndash179 1992
[32] L Fu J Yang H Bao and J Li ldquoEffect of turbine characteristicon the response of hydroturbine governing system with surgetankrdquo in Proceedings of the Asia-Pacific Power and EnergyEngineering Conference (APPEEC rsquo09) Chengdu China March2009
[33] D Thoma Beitrage zur Theorie des Wasserschlosses bei Selb-sttatig Geregelten Turbinenanlagen Oldenburg Munchen Ger-many 1910
[34] F Collier and L Wozniak ldquoControl synthesis for an impulseturbine the Bradley Lake projectrdquo IEEE Transactions on EnergyConversion vol 6 no 4 pp 639ndash648 1991
[35] M Vinatoru CMaican and C Vinatoru ldquoLevel control using afeed-forward structurerdquo in Proceedings of the 19th InternationalConference onControl Systems andComputer Science (CSCS 13)pp 24ndash29 Bucharest Romania May 2013
TribologyAdvances in
Hindawi Publishing Corporationhttpwwwhindawicom Volume 2014
International Journal of
AerospaceEngineeringHindawi Publishing Corporationhttpwwwhindawicom Volume 2014
FuelsJournal of
Hindawi Publishing Corporationhttpwwwhindawicom Volume 2014
Journal ofPetroleum Engineering
Hindawi Publishing Corporationhttpwwwhindawicom Volume 2014
Industrial EngineeringJournal of
Hindawi Publishing Corporationhttpwwwhindawicom Volume 2014
Power ElectronicsHindawi Publishing Corporationhttpwwwhindawicom Volume 2014
Advances in
CombustionJournal of
Hindawi Publishing Corporationhttpwwwhindawicom Volume 2014
Journal of
Hindawi Publishing Corporationhttpwwwhindawicom Volume 2014
Renewable Energy
Submit your manuscripts athttpwwwhindawicom
Hindawi Publishing Corporationhttpwwwhindawicom Volume 2014
StructuresJournal of
International Journal of
RotatingMachinery
Hindawi Publishing Corporationhttpwwwhindawicom Volume 2014
EnergyJournal of
Hindawi Publishing Corporationhttpwwwhindawicom Volume 2014
Hindawi Publishing Corporation httpwwwhindawicom
Journal ofEngineeringVolume 2014
Hindawi Publishing Corporation httpwwwhindawicom Volume 2014
International Journal ofPhotoenergy
Hindawi Publishing Corporationhttpwwwhindawicom Volume 2014
Nuclear InstallationsScience and Technology of
Hindawi Publishing Corporationhttpwwwhindawicom Volume 2014
Solar EnergyJournal of
Hindawi Publishing Corporationhttpwwwhindawicom Volume 2014
Wind EnergyJournal of
Hindawi Publishing Corporationhttpwwwhindawicom Volume 2014
Nuclear EnergyInternational Journal of
Hindawi Publishing Corporationhttpwwwhindawicom Volume 2014
High Energy PhysicsAdvances in
The Scientific World JournalHindawi Publishing Corporation httpwwwhindawicom Volume 2014

2 The Scientific World Journal
sediments transport along the river [4] visual impactflooded areas and land use issues
(iii) Size of run-of-river hydro plants is usually limitedtherefore these plants are connected to distributionnetworks and contribute to the development of dis-tributed generation In addition initial and operatingcosts are lower than those associated with otherrenewables sources such as wind parks [5]
Run-of-river plants have limited regulation capacity and ingeneral do not participate in power-frequency regulationHowever some ways of participation of run-of-river hydroplants in this task have been proposedThe joint operation ofseveral small hydro plants for providing primary secondaryand tertiary regulation services is analyzed in [4]The isolatedoperation of small hydro plants in remote areas is consideredin [5] the power-frequency regulation would be providedby changing the turbine speed when the discharged flowthrough the turbine is lower than the available river flowthus variable-speed generation equipment is required
The most frequently used control scheme in run-of-riverplants is based on controlling the water level in the head pond[6ndash13]Water level control has the advantages of its simplicityand robustness [8] allows minimizing the flooded area [13]and is compatible with other uses of spillway requiringconstant water level In small head schemes as considered in[6] it is important to maintain the water level within strictlimits Different algorithms for controlling the water levels inthree or more cascade hydro plants are presented in [7 12]In [10] the use of a dead band for minimizing the regulatormovements is analyzed The control system proposed in [14]is aimed at maintaining a minimum environmental flowin the intermediate river reach between the intake and thetailrace
PID regulator has been extensively used in turbine gover-nors of conventional hydro plantsThe adjustment of the PIDgains has been studied by several authors aiming to obtaina good dynamic response among the first contributions itis noteworthy to mention the works by Hovey and Paynter[15 16] in [17] the Routh-Hurwitz criterion is applied todefine the stability region A state variable model is usedin [18 19] for analyzing the influence of PI gains on theeigenvalues of the dynamic matrix The root-locus techniquehas also been applied to the adjustment of PID gains [20 21]Although in more recent works advanced control techniqueshave been applied [22] the interest for robust PID controllersis still active [23] In [24] the PID gains are analytically deter-mined by pole placement good performance was obtainedin simulations and field tests conducted in a real plant In[25 26] the stability study and the tuning of the PID werecarried out by eigenvalues analysis oscillation modes wereidentified and associated with the different elements of thepower plant
In the case of water level control in [8] it is foundthat with a PI controller a good response may be obtainedthe derivative component could be affected by the noisetransmitted with the sensor signal The root-locus techniqueis used to tune the controller in [12] In [9] the stabilityregions are determined in terms of some design parameters
the tuning of the PI controller is based on a heuristiccriterion derived from the root-locus plot The influence ofthe operating point in the dynamics response is studiedconcluding that for better performance the controller gainsshould be adapted to the operation conditions
The aim of this paper is the study of the stability ofthe water level control system of a run-of-river hydropowerplant under normal operating conditions Then a smallperturbation analysis will be used Two different operationmodes are studied In normal hydrologic conditions thewater level control system operates in a conventional waythe wicket gates position is changed adapting the dischargedflow to the inflow in order to maintain the water levelclose to the reference value In flooding operating conditionsthe excess flow is discharged through a spillway in thiscase the water level reference is changed in order to allowcontrolling the spilled flow as in [14] The dynamics of thisoperationmode has substantial differenceswith respect to thenormal operation mode [8] and requires a specific analysisAdditionally a diversion plant with surge tank is consideredin order to extend the applicability of the results in thisconfiguration the stability of level control should be studiedwith more detail due to the higher order of the involveddynamics Following the methodology described in [9 13]the stability regions are determined and the PI gains adjusted
The results obtained in this study have been applied toOcana II hydro plant (Cuenca Ecuador) which is currentlyin design phase
The paper is organized as follows In Section 2 the plantdynamic model used in the study is described In Section 3a small perturbation stability analysis is discussed and inSection 4 the PI controller is tuned by using a heuristiccriterion The theoretical results are applied to the case studyin Section 5 verifying the adequacy of the proposed tuningcriterion Finally in Section 6 the conclusions derived fromthis study are presented
2 Modeling
In this section the dynamicmodel of a run-of-river diversionhydropower station with pressurized conduits and surge tankis described The head pond where the intake is located iscreated by a small dam with a spillway that allows evacuatingthe excess flow when the plant operates under flood condi-tionsThewater surface in the head pond in normal operationis below the spillway level A sensor level is placed near theintake and its signal is sent to the governor which adjusts thewicket gates position in order to keep the water level constantin both situations normal or flood The plant layout can beseen in Figure 1
The block diagram of the power plant dynamic modelcomprising the hydraulic system and the PI regulator canbe seen in Figure 2 Main components of the model aredescribed below
The power plant modeled is supposed to operate con-nected to a large networkTherefore the unit speed variationsare not relevant and are damped in a very short time intervalcompared to the time scale of interest in this study [9
The Scientific World Journal 3
Q
Headrace tunnel
Penstock
Regulator
Turbine
SensorSurge tank
Head pond
Spillway
Water level in the head pond in normal conditions
Water level in the head pond in flood conditions
+minusHf
Qw
Qt
Qr
Href
Figure 1 Run-of-river diversion hydropower plant with surge tank and spillway in the head pond
Headracetunnel
Surge tank
Penstock
Q H
Turbine
X
HQ
PI regulator
XHead pondRiverflow
Qw
Qt
Qr QwQr
Qt
HfHs
Hs
Hs
Hf
Hf
Qp
Qp
Qt
Figure 2 Block diagram of the control system
27] thus speed may be supposed to remain constant at itssynchronous value
21 Hydraulic System The elements that define the hydraulicsystem are the head pond the headrace tunnel the surgetank the penstock and the turbine The dynamics of eachcomponent is expressed by different equations as presentedbelow The notation used throughout the paper is defined inAppendix B
Head Pond Consider
119860119891
119889119867119891
119889119905= 119876119903 minus 119876119908 minus 119876119905
(1)
where 119876119908 is the flow through the spillway It is equal to zeroin normal operation When the plant is working under floodconditions the flow is calculated with the expression
119876119908 = 119862119889119871alivradic(119885ref minus 119885aliv)3 (2)
Headrace Conduit The equations that describe transient-state flows in close conduits are mass and momentumconservation expressions [28] A lumped parameters modelhas been used to represent the headrace conduit behavior[27 29 30]
The system of ordinary equations obtained can be rep-resented as a series of Γ-shaped consecutive elements Theldquoorientationrdquo of the Γ-shaped elements may vary accordingto the upstream and downstream boundary conditions of thepipe A scheme of the model can be seen in Figure 3 In thiscase these boundary conditions are given by the head at bothends of the conduit
4 The Scientific World Journal
Hf H1
Hc
H2
Q1 Q2
1
neKrt
1
neKrt
1
neKrt
L
ne middot gAt
L
ne middot gAt
L
ne middot gAt
Lt middot g middot At
ne middot a2Lt middot g middot At
ne middot a2 Hgeminus1
Qngemiddot middot middot
Figure 3 Scheme of the headrace tunnel model
0650675 0675
067507
0707
0
072072
072
0
074074
074
0
076
076076
0
078
078078
07
08
0808
0
082
082
082
082
0
084
084
084
084
0
086086
086
086
086
086
086
088088
088
088
088
088
09
09
09
09
09
091091
091091
091
092
092
092
0925
0925
55 56 57 58 59 60 61 62 63 64 65 66 67 68 69 70 71 72 73 74 7501
015
02
025
03
035
04
045
05
055
02
03
04
05
06
07
09
08
10
q11
(m3
s)
n11 (rpm)
Figure 4 Hill curves
The set of expressions applied to each element are
119871
ne sdot 119892119860 119905119889119876119894
119889119905+1
ne119870119903119905
10038161003816100381610038161198761199051003816100381610038161003816 119876119905 = 119867119894minus1 minus 119867119894
ne sdot 1198862
119871 119905 sdot 119892 sdot 119860 119905
119889119867119894
119889119905= 119876119894 minus 119876119894+1
(3)
where ne is the number of Γ-shaped elements the pipe isdivided in
Surge Tank Consider
119860 119904
119889119867119904
119889119905= 119876119905 minus 119876 (4)
Penstock The conduit that joins the surge tank and theturbine is modeled as the headrace tunnel using the lumpedparameters approach
Turbine The aim of the model is to study transients slowerthan the turbine response In these cases [9 31] a staticmodelis used to include the turbine dynamics (5) The power plantmodeled has two identical units which are supposed to workat the same operating point thus a single equivalent turbinehas been considered
119876 = 119891119876 (119867119883) (5)
Equation (5) should be obtained from the turbine hill curvesin Figure 4 the efficiency hill of the turbine considered in thecase study is shown
The Scientific World Journal 5
22 PI Regulator A PI regulator modifies the wicket gateopening in order to maintain a constant water level in thehead pond The dynamics of this regulator can be expressedby
119883 = 119870119901 (119867119891 (119905) minus 119867ref) + 119870119894 int119905
0(119867119891 (119905) minus 119867ref) 119889119905int (6)
where119870119901 is the proportional gain and119870119894 is the integral gain
3 Stability Analysis
31 Linearized Model In order to study the system stabilityfollowing the Routh-Hurwitz criterion a linearmodel shouldbe used Some assumptions have been done in order tolinearize the above presented equations
(i) Penstock dynamics is not considered because theassociated time constant is in most cases very smallcompared to the relatively slow dynamics of the othercomponents [32] In the considered plant configura-tion friction losses are mainly due to the headraceconduit [9] and therefore friction losses in penstockcan also be neglected
(ii) The oscillations of water level in the head pond aremuch slower than pressure waves in the conduitsThen the headrace tunnel dynamics is approximatedby a rigid water column model (7) The completemodel described in Section 21 will be used only in thesimulations
119871 119905
119892119860 119905
119889119876119905
119889119905+ 119870119903119905
10038161003816100381610038161198761199051003816100381610038161003816 119876119905 = 119867119891 minus 119867119904 (7)
In order to obtain the state equations the controller equationis expressed in the form
119889119883
119889119905= 119870119894 (119867119891 minus 119867ref) + 119870119901
119889 (119867119891 minus 119867ref)
119889119905 (8)
Previous equations have been expressed in per unit values andlinearized around an initial equilibrium point the obtainedequations are included in Appendix A The resulting linearmodel in state space form is
119889X119889119905
= A sdot X + B sdot U (9)
X =[[[
[
119902119905
ℎ119891
ℎ119904
120591
]]]
]
U = [
[
119902119903
ℎrefnt]
]
(10)
B =
[[[[[[[[[[
[
0 0 0
1
119879119891
0 0
0 0 minus11988712
119879119904119896119901
119879119891
minus119896119894 0
]]]]]]]]]]
]
(11)
A =
[[[[[[[[[[[[
[
minus21199011199020119905
119879119908
1
119879119908
minus1
119879119908
0
minus1
119879119891
minus3
2119872 0 0
1
119879119904
0 minus11988711
119879119904
minus11988713
119879119904
minus
119896119901
119879119891
119896119894 minus 119896119901
3
2119872 0 0
]]]]]]]]]]]]
]
(12)
where the parameter119872 (13) has been introduced to considerthe effect of spillway dimensions
119872 =119862119889119871aliv119860119891
radic119885ref minus 119885aliv (13)
32 Stability Analysis The characteristic polynomial of thematrix Amay be expressed as
119875 (119860) = 1205824+ 11988611205823+ 11988621205822+ 1198863120582 + 1198864 (14)
where the coefficients are
1198861 =21199011199020119905
119879119908
+11988711
119879119904
+3
2119872
1198862 =1 + 2119901119902
0119905 11988711
119879119904119879119908
+3
2
21199011199020119905119879119904 + 11988711119879119908
119879119904119879119908
119872+1
119879119891119879119908
1198863 =3
2
1 + 21199011199020119905 11988711
119879119904119879119908
119872+
11988713119896119901 + 11988711
119879119904119879119908119879119891
1198864 = 119896119894
11988713
119879119904119879119908119879119891
(15)
According to Routh-Hurwitz criterion the system (9) isasymptotically stable if the following conditions are satisfied(a) All coefficients of the characteristic polynomial (14) mustbe different from zero and of the same sign (b) the elementsof the first column of the Routh array must be positive Inpractice the first condition is always fulfilled and the secondcondition may be shown to reduce to
119886111988621198863 minus 11988632minus 119886121198864 gt 0 (16)
In order to study the influence of the surge tank and headpond dimensions in the stability of the power plant thefollowing parameters 119899 and 119898 are defined as described in[9 13]
119899 =119860 119904
119860 th 119898 =
119860119891
119860 119904
(17)
6 The Scientific World Journal
where 119860 th is the surge tank cross-sectional area that guar-antees stability according to the Thoma criterion [13 33]Although this widely known criterion was formulated forload-frequency control it provides an interesting referencevalue for the present study The following expression (18)gives its value as a function of the plant design parameters
119860 119904 gt 119860 th =119871 1199051198762119887
21198921198672119887119860 119905119901
=119876119887
2119867119887119901119879119908 (18)
Introducing 119899 119898 and 119872 parameters stability conditionresults in
119896119894 lt (1199020119905 119899 + 11988711 +
3
2119872119899119879119908
2119901)
times [(1 + 21199011199020119905 11988711)119898 + (119902
0119905 119899 + 11988711)119898
2
3119872119879119908 + 1]
minus (1 + 21199011199020119905 11988711)
119898119899
2119901119879119908
3
2119872 + (11988713119896119901 + 11988711)
sdot
(1 + 21199011199020119905 11988711) (1198981198992119901) 119879119908 (32)119872 + 11988713119896119901 + 11988711
(1199020119905 119899 + 11988711 + (1198992119901) 119879119908 (32)119872)
211988713119898119879119908
(19)
where 119896119894 and 119896119901 are the controller gains in puFigures 5 6 and 7 include the effects of the surge tank
cross-section area (119899) the head pond surface area (119898) andthe spillway parameter (119872) respectively in the stabilityregion The coefficients 11988711 and 11988713 acquired from the hillcurves and the initial per unit headrace conduit flow variable1199020119905 used to obtain these figures correspond to the initialoperating point the per unit initial flow and head losses in theconduit 119901 have been assumed to be equal to 1 and 008 purespectively for the water inertia time constant119879119908 the value1209 s has been used as in the case study
As it can be seen in these figures the magnitude of thecontroller gains is large This is due to the very small value ofthe error signal (pu level variation in head pond) Thus fora practical implementation of this control scheme a signalconditioner could be required
In the three figures the area under the curves determinesthe stable region that is the combination of 119896119901 and 119896119894 thatguarantees a stable operation of the level control system As itseems intuitively logical it can be observed that in the threecases the system stability region is extended when parameters119899119898 and119872 increase
In Figure 5 the effect of varying the 119899 parameter isrepresented In the figure it can be seen that for 119899 valuesbelow 10 there exists a stability region This fact indicatesthat in the case of level control the fulfillment of the Thomacondition is not necessary for system stability [9]
In Figure 6 the effects of varying 119898 are consideredThe figure shows that this parameter influences notably thesystem stability
The characteristics of the spillway (length spillway dis-charge coefficient etc) reflected in the parameter 119872 (13)affect the stability of the plant as can be seen in Figure 7
0 50 100 150 200 250 300 350 400 450 5000
1
2
3
4
5
6
kp
ki
n = 1
n = 2
n = 3
n = 05
n variation (M = 001 m = 50)
Figure 5 Stability regions effect of the surface area of the surge tank(119899)
Therefore the design of the spillway should be taken intoaccount if water level control is considered
In order to compare the stability regions in both operationmodes (normal andflood) (19) is simplified using119872 = 0Theresulting expression (20) was developed in [9]
119896119894 lt (1199020119905 119899 + 11988711) [(1 + 2119901119902
0119905 11988711)119898 + 1]
minus (11988713119896119901 + 11988711)
times
(11988713119896119901 + 11988711)
(1199020119905 119899 + 11988711)
211988713119898
(20)
As it is shown in Figure 8 the stability region when a partof the riverrsquos flow is evacuated by the spillway is bigger thanthe region obtained in normal operation 119872 = 0010 isequivalent to a spillway with a length of 75m in a headpond of 900m2 and considering 05m for the height of waterlevel above the spillway Therefore it can be stated that thechange in the head pond dynamics produced by the spillwaycontributes positively to the stability of thewater level controlAdmittedly in flood operation mode head pond surface area(119860119891) may be affected for the change in the reference waterlevel However the influence in the stability regions due tothis change is quite small so it will be neglected
In (19) and (20) it can be seen that turbine operatingconditions are another important factor for stability Theinitial per unit headrace conduit flow 1199020119905 and the turbinecoefficients 119887119894119895 change when the plant is operating withpartial load different from rated conditions This fact affectsthe stability boundaries as well as the results of applying thetuning criterion of the PI gains proposed in the next sectionThis issue is studied in detail in [9] so in this paper the workfocuses on the influence of the spillway on the stability andcontrol of a run-of-river power plant
The Scientific World Journal 7
0 50 100 150 200 250 300 350 400 450 5000
1
2
3
4
5
6
kp
ki
m variation (M = 001 n = 2)
m = 25
m = 50
m = 75
m = 100
Figure 6 Stability regions effect of the surface area of the head pond(119898)
0 50 100 150 200 250 300 350 400 450 5000
1
2
3
4
5
6
kp
ki
M variation (n = 2 m = 50)
M = 001
M = 0005
M = 0015
M = 002
Figure 7 Stability regions effect of the spillway dimension (119872)
4 PI Gains Tuning
The characteristic polynomial (13) of the linearized systemhas in general four conjugate complex roots
11990112 = 119886 plusmn 119895119887 11990134 = 119888 plusmn 119895119889 (21)
Other authors have worked using the pole placement fortuning the governor gains For example in [34] some strate-gies for obtaining an appropriate response were proposedbut in the context of load-frequency control In [35] waterlevel of three coupled tanks is controlled by a structure of PIcontrollers PI controllers were tuned using pole placementmethod by reducing the overshoot and the settling time Inthis paper one of the main priorities is to minimize the effortmade by the servo which acts on the turbine wicket gatesfollowing the philosophy expressed in [10] and reducing thesettling time For these purposes the criteria proposed in [9]are used in this paper and summarized below
(1) The real part of each pair of conjugated poles shouldhave approximately the same value so that the settlingtimes are similar and the appearance of a slow pole isavoided
0 20 40 60 80 100 120 140 1600
02040608
112141618
2
Normal operationFlood operation
(m = 2 n = 50M = 0001)
kp
ki
Figure 8 Stability regions comparison of normal and floodoperation
2
2
2
5
5
5
10
10
10
15
15
15
20
20
20
30
30
30
40
40
40
40
60
60
60
60
80
80
80
80
100
100
100
125
125
125
150150
150
175
175
175
200200
200
250250
250
M
0 2 4 6 8 10 12 14 160
0005
001
0015
002
0025
Tw
Figure 9 Relation between119872 119879119908 and 119896119901
(2) One of these pairs should have its imaginary part closeto zero thus avoiding the appearance of oscillations asfar as possible
Analytical expressions (22) for the proportional gain in pu119896119901 and the integral term in pu 119896119894 are obtained from the rulesformulated As stated in [9] it is worthy tomention that theseexpressions are independent of each other
Figures 9 and 10 include the relation between 119879119908 and119872(spillway dimension) with the 119896119901 and 119896119894 parameters obtainedusing (22) It has been supposed that the surge tank surfaceis equal to the surface proposed by [33] for the surge tankdimensioned in Ocana II power plant A head pond surfacearea of 900m2 will be assumed This value corresponds tohead pond surface area in Ocana II power plant
119896119901 =1
11988713
[
119879119904119879119908119879119891
2(21199011199020119905
119879119908
+11988711
119879119904
+3
2119872)
times 1 + 2119901119902
0119905 11988711
119879119908119879119904
+3
2
21199011199020119905119879119904 + 11988711119879119908
119879119908119879119904
119872
+1
119879119908119879119891
minus1
4(21199011199020119905
119879119908
+11988711
119879119904
+3
2119872)
2
8 The Scientific World Journal
minus3
2(1 + 2119901119902
0119905 11988711) 119879119891119872]
minus 11988711
119896119894 =
119879119904119879119908119879119891
1611988713
times 1 + 2119901119902
0119905 11988711
119879119908119879119904
+3
2
21199011199020119905119879119904 + 11988711119879119908
119879119908119879119904
119872
+1
119879119908119879119891
minus5
16(21199011199020119905
119879119908
+11988711
119879119904
+3
2119872)
2
times (21199011199020119905
119879119908
+11988711
119879119904
+3
2119872)
2
(22)
5 Study Case
Ocana II hydropower plant located in Canar (Ecuador) is arun-of-river diversion plant just downstream Ocana I powerplant which is operating nowadays in Canar River The plantconsists of a head pond with a spillway for excess of flowduring flood periods long headrace conduit of more than 5kilometers surge tank penstock and two Francis turbinesThe main features of the plant are reflected in Table 1
The results of the previous stability analysis as well asthe followed PI tuning criterion have been applied to ahydropower plant that is currently in design stage The plantresponse has been obtained by means of simulations Theresults obtained were useful in the design process and will beused for the implementation of the control system
Although the model used for both the stability analysisand obtaining the mathematical expressions of the controllergains is a linear model with certain simplifications themodel used for simulations is the nonlinear one describedin Section 2 and includes penstock dynamics as well asnonlinearities associated with losses in the conduits so as toobtain results closer to the real plant response The headraceconduit has been divided into six equal elements and thenumber of elements for the penstock is four
51 Application of the Results of the Stability Analysis Thestability regions obtained from (19) and (20) correspondingto the power plant under study for both operating modes areshown in Figure 11 Table 1 contains the parameters neededto make the power plant characteristics adequate for themathematical expressions
Two cases are considered to evaluate the plant responsein this situation The first one is the case evaluated in [9] inwhich the reference water level in the head pond is below thespillway (normal condition) In the second case the referencewater level in the head pond is over the spillway (floodconditions) In both operating modes scenarios the initial
025
05
05
075
075
075
1
1
1
1
125
125
125
125
15
15
15
2
2
2
25
35
25
25
3
3
3
35
35
4
4
4
55
5
0 2 4 6 8 10 12 14 160
0005
001
0015
002
0025
M
Tw
Figure 10 Relation between119872 119879119908 and 119896119894
0 50 100 150 200 250 3000
1
2
3
4
5
6
Normal operationFlood operation
BF
C
D E
AG
H
kp
ki
Figure 11 Stability regions in normal and flood operation condi-tions
flow released through the turbines is 20m3s In normalconditions initial turbine(s) flow coincides with the riverflow under flood conditions the river flow is 254m3s thespillway evacuating 54m3s
In both cases the system response to a sudden reductionin river flow of 3m3s has been simulated for each pair ofgains included in Table 2 Pairs of gains are highlighted in thestability regions (AndashF) (Figure 11) In Table 2 it is indicatedwhether or not each pair of gains is located inside or outsidethe corresponding stability region
Figure 12 shows the plant response with the PI tunedwith the gains corresponding to A B and C in the casewithout spillway in normal conditions As can be seen inFigure 12 only in case B (119896119901 = 100 119896119894 = 2) the plantresponse is stableThis result is in agreement with the stabilityregion depicted in Figure 11 In turn Figure 13 shows the plantresponse under flood conditions with spillway in points AB and C As it can be deduced from Figure 11 the plantresponse is stable with all pairs of gains (A B and C) Thedifferences between the responses of the power plant are theconsequence of the variation in the gains of the PI regulatorThe damping of oscillations decreases for higher values of119896119901 but the amplitude of the oscillations is reduced in thesecases The minimum value of the controlled variable (waterlevel in the head pond) is not as important as in the case ofload frequency control where frequency must be maintainedwithin a severe interval Therefore low values for 119896119901 could
The Scientific World Journal 9
Table 1 Plant dimensions parameters and base values
Element Parameter Value
Base values Base head 119867119887 16519mBase flow 119876119887 20m3s
Head pond
Horizontal section 119860119891 900m2
Spillway length 119871aliv 900mSpillway level 119885aliv 45090maslWater level reference under normal conditions 119885ref 45010maslWater level reference under flood conditions 119885ref 45140masl
119872 0012
Head race conduit
Length 119871 119905 5201mSection 119860 119905 531m2
Losses Δ119867119905 1321mLosses (pu) 119901 0080 puTime constant 119879119908 1209 sInitial head-race conduit flow 119902119905
0 100 pu
Surge tank
Section 119860 119904 962m2
Thoma section 119860 th 915m2
119898 1052119899 9354
PenstockLength 119871119901 80115mSection 119860119901 531m2
Losses Δ119867119901 345m
Turbine 11988711 059611988713 0978
Table 2 Pairs of gains selected for carrying out simulations
Point 119896119901 119896119894Stability
Normal operation Flood operationA 20 2 NO YESB 100 2 YES YESC 180 2 NO YESD 50 3 NO YESE 150 3 NO YESF 250 3 NO NO
be appropriate for reducing the wear and tear of the servomechanism that moves the wicket gates position
Figure 14 shows the response in D E and F points inorder to verify the validity of the stability region presentedin Figure 11 for flood conditions As expected the responsefor adjustment at point F results unstable The simulationshave been carried out only with the plant in flood conditionsbecause all the responses for points D E and F are unstablewhen the water level is below the spillway in the head pond
52 Application of the PI Tuning Criterion The expressions(22) are applied for tuning PI gains of Ocana II powerplant both in normal (119872 = 0) and in flood operatingconditions Table 3 contains the numerical values of the gainsin both situations and in Figure 11 the two pairs of gains arepositioned in the corresponding stability regions
Table 3 Pairs of gains from the tuning criterion
Point 119896119901 119896119894
G-flood operation 1196 0724H-normal operation 7844 0200
From Figure 11 it can be deduced that the pair of gainsfor flood operation (G) can cause instabilities if used duringnormal operation In order to support this idea the samesudden reduction of 3m3s in the river flow has beensimulated in normal conditions with pairs of gains G and HThe response of the power plant is shown in Figure 15
The instability observed for the pair of gains G confirmsthe results obtained from the linear model Moreover asit can be seen in Figure 15 when the controller is tunedaccording to the criterion (gains H) the oscillation of thewicket gates position is almost eliminated thus contributingto both increasing the equipment service life and reducing thesettling time of the response
FromFigure 11 it can be deduced that unlike the previouscase using the pair of gains obtained for normal operation(H) should not give rise to instabilities in flood conditionsNevertheless as it is shown in Figure 16 the quality of thepower plant response is considerably worse than the oneobtained with the pair of gains specific to flood conditions(G)
The results obtained in the case study highlight theimportance of carrying out a stability analysis similar to the
10 The Scientific World Journal
161820
448450452
Wat
er le
vel i
n he
ad
pond
(ma
sl)
005
1
Wic
ket g
ate
posit
ion
(pu
)
024
Spill
way
flow
ABC
(m3s)
Rive
r flow
(m3s)
Time (s)0 100 200 300 400 500 600 700 800 900 1000
Time (s)0 100 200 300 400 500 600 700 800 900 1000
Time (s)0 100 200 300 400 500 600 700 800 900 1000
Time (s)0 100 200 300 400 500 600 700 800 900 1000
Figure 12 River flow wicket gates position water level in the headpond and spillway flow in normal operation (points A B and C)
one presented here in the design phase of a run-of-riverdiversion power plantThe results of the stability analysis canbe of much help for making decisions about certain designparameters of the power plant as well as about the gains ofthe water level controller
6 Conclusions
In this paper the stability of a run-of-river diversionhydropower plant with a spillway in the head pond thatevacuates a portion of the river flow is analyzed A PIcontroller is used formaintaining a constant water level in thehead pond the effects of a surge tank have been consideredFor this purpose a small perturbation stability analysis basedon the Routh-Hurwitz criterion has been carried out Fromthe stability analysis it has been demonstrated that theexistence of a spillway in the analysis improves the stabilityof the plant water level control when the dynamics of thespillway is included (flood operation mode) the stabilityregion covers a broader area than in normal operation mode(without spillage) On the other hand it has been found thatthe fulfillment of the well-known Thoma stability conditionis not necessary in this case
In addition analytical expressions based on a heuristiccriterion have been obtained for both the proportional andintegral gains in flood operation conditions It is worth notingthat the said expressions depend on the dimensions andflow evacuated by the spillway the initial per unit headraceconduit flow and the turbine parameters Additionally itis interesting to emphasize that these analytical expressionshave been found to be independent of one another
222426
Rive
r flow
451245144516
Wat
er le
vel
in h
ead
pond
(ma
sl)
040608
Wic
ket g
ate
posit
ion
(pu
)
05
10
Spill
way
flow
ACB
(m3s)
(m3s)
Time (s)0 100 200 300 400 500 600 700 800 900 1000
Time (s)0 100 200 300 400 500 600 700 800 900 1000
Time (s)0 100 200 300 400 500 600 700 800 900 1000
Time (s)0 100 200 300 400 500 600 700 800 900 1000
Figure 13 River flow wicket gates position water level in the headpond and spillway flow in flood operation (points A B and C)
222426
Rive
r flow
451245144516
Wat
er le
vel
in h
ead
pond
(ma
sl)
005
1
Wic
ket g
ate
posit
ion
(pu
)
05
10
Spill
way
flow
DEF
Time (s)0 100 200 300 400 500 600 700 800 900 1000
Time (s)0 100 200 300 400 500 600 700 800 900 1000
Time (s)0 100 200 300 400 500 600 700 800 900 1000
0 100 200 300 400 500 600 700 800 900 1000Time (s)
(m3s)
(m3s)
Figure 14 River flow wicket gates position water level in the headpond and spillway flow in flood operation (points D E and F)
The stability analysis as well as the PI tuning criterionhas been applied to a real hydropower plant currently inthe design stage the plant response has been obtained bymeans of simulations with a more detailed modelThe resultsobtained have been found to be useful for the design processandmay be used in the implementation of the control system
The Scientific World Journal 11
161820
449450451
Wat
er le
vel
in h
ead
pond
(ma
sl)
005
1
Wic
ket g
ate
posit
ion
(pu
)
01
Spill
way
flow
HG
(m3s)
Rive
r flow
(m3s)
minus1
Time (s)0 100 200 300 400 500 600 700 800 900 1000
Time (s)0 100 200 300 400 500 600 700 800 900 1000
Time (s)0 100 200 300 400 500 600 700 800 900 1000
Time (s)0 100 200 300 400 500 600 700 800 900 1000
Figure 15 River flow wicket gates position water level in the headpond and spillway flow points G and H in normal operation
222426
451245144516
Wat
er le
vel
in h
ead
pond
(ma
sl)
0708
Wic
ket g
ate
posit
ion
(pu
)
246
HG
Rive
r flow
(m3s)
Spill
way
flow
(m3s)
Time (s)0 100 200 300 400 500 600 700 800 900 1000
Time (s)0 100 200 300 400 500 600 700 800 900 1000
Time (s)0 100 200 300 400 500 600 700 800 900 1000
Time (s)0 100 200 300 400 500 600 700 800 900 1000
Figure 16 River flow wicket gates position water level in the headpond and spillway flow points G and H in flood operation
The results of the stability analysis and the simulationshave demonstrated that the operation with a reference waterlevel above the spillway crest level (ie with a constant flowrate released through the spillway) is more stable than theone with a reference water level below the spillway crestlevel Also it has been found that the level controller gainsshould be updated in real-time operation not only as afunction of the actual operating point (full or partial load)
but also as a function of the actual operating mode (normalor flood conditions) in order to guarantee a stable and qualityresponse of the water level control system Should the real-time gains updating not be possible a similar analysis to theone carried out in this paper should be done to select a pairof gains that guarantees a stable response in as many foreseenoperating points and modes as possible with a reasonableresponse quality
Appendices
A Linearization
The equations that describe the behavior of the componentsof the power station have been linearized around an operatingpoint as shown below Per unit values have been extensivelyused The following linearized expressions are obtained
Head pond is
119889ℎ119891
119889119905= minus
1
119879119891
119902119905 minus3
2119872ℎ119891 +
1
119879119891
119902119903 (A1)
Headrace conduit is
119889119902
119889119905= minus
21199011199020119905
119879119908
119902119905 minus1
119879119908
ℎ119891 minus1
119879119908
ℎ119904 (A2)
Surge tank-penstock-turbine is
119889ℎ119904
119889119905=1
119879119904
119902119905 minus11988711
119879119904
ℎ119904 minus11988713
119879119904
120591 minus11988712
119879119904
nt (A3)
PI regulator is
119889120591
119889119905= minus
119896119901
119879119891
119902119905 + (119896119894 minus 119896119894
3
2119872)ℎ119891 minus 119896119894ℎref minus
119896119901
119879119891
119902119903 (A4)
Turbine is
119902 = 11988711ℎ + 11988712nt + 11988713120591 (A5)
where
119879119908 =119871 119905119876119887
119892119860 119905119867119887
119879119904 =119860 119904119867119887
119876119887
119879119891 =
119860119891119867119887
119876119887
119901 =1198701199031199051198762119887
119867119887
(A6)
B Used Symbols
119886 Wave celerity in the conduit (ms)119860119891 Head pond cross-sectional area (m2)
12 The Scientific World Journal
119860 119904 Surge tank cross-sectional area (m2)
119860 119905 Headrace conduit cross-sectional area (m2)
119860 th Minimum surge tank cross-sectional area accordingtoThoma criterion (m2)
119860119901 Penstock cross-sectional area (m2)
119887119894119895 Parameters of the linearized turbine equations119862119889 Spillway coefficient119892 Gravity acceleration (ms2)119867 Net head (m)119867119887 Base head (m)119867119891 Gross head in the head pond with respect to tailwater
level (m)ℎ119891 Variation of the gross head in the head pond (pu)119867119894 Head at the end of the 119894th Γ element of the conduit
(m)119867ref Reference height in the head pond with respect to
tailwater level (m)ℎref Variation of the reference height in the head pond
(pu)119867119904 Surge tank level with respect to tailwater level (m)ℎ119904 Surge tank water level variation (pu)119870119901 Proportional gain of PI controller119896119901 Proportional gain of PI controller (pu)119870119894 Integral gain of PI controller119896119894 Integral gain of PI controller (pu)119870119903119905 Headrace loss coefficient119871 119905 Headrace conduit length (m)
119871aliv Crest spillway length (m)119871119901 Penstock length (m)nt Turbine rotational speed (pu)119901 Headrace conduit losses (pu)119902 Turbine flow (pu)119876 Turbine flow (m3s)119876119887 Base flow (m3s)119876119894 Flow in the 119894th Γ element of the conduit (m3s)119876119903 River flow (m3s)119902119903 River flow variation (pu)119876119905 Headrace conduit flow (m3s)119902119905 Variation in headrace conduit flow (pu)1199020119905 Initial headrace conduit flow (pu)119879119891 Head pond time constant (s)119879119904 Surge tank time constant (s)119879119908 Headrace conduit time constant (s)119883 Wicket gates opening (mm)119883119887 Base value of the wicket gates opening (mm)
120591 Wicket gates opening variation (pu)119885ref Reference height in the head pond (masl)119885aliv Crest spillway level (masl)Δ119867119901 Friction losses in the penstock (m)Δ119867119905 Friction losses in the headrace tunnel (m)
Conflict of Interests
The authors declare that there is no conflict of interestsregarding the publication of this paper
Acknowledgments
Theauthors wish to thank theworking group fromElecaustroandGasNatural Fenosa Engineering for their valuable help inthe development of the study presented in this paper
References
[1] International Energy Agency Technology RoadmapHydropower OECDIEA 2012 httpwwwieaorg
[2] M R Pelaez-Samaniego G Riveros-Godoy S Torres-Contreras T Garcia-Perez and E Albornoz-VintimillaldquoProduction and use of electrolytic hydrogen in Ecuadortowards a low carbon economyrdquo Energy vol 64 pp 626ndash6312014
[3] Spanish Renewable Energy Plan IDAE Plan de Energıas Ren-ovables 2011ndash2020 httpwwwmineturgobes
[4] L Spitalny D Unger and J M A Myrzik ldquoPotential of smallhydro power plants for delivering control energy in Germanyrdquoin Proceedings of the IEEE Energytech pp 1ndash6 May 2012
[5] J L Marquez M G Molina and J M Pacas ldquoDynamicmodeling simulation and control design of an advancedmicro-hydro power plant for distributed generation applicationsrdquoInternational Journal of Hydrogen Energy vol 35 no 11 pp5772ndash5777 2010
[6] P A Frick ldquoAutomatic control of small hydroelectric plantsrdquoIEEE Transactions on Power Apparatus and Systems vol 100 no5 pp 2476ndash2485 1981
[7] K Kurotani and K Takeda ldquoWater level regulating systemrdquo edGoogle Patents 1995
[8] A H Glattfelder and L Huser ldquoHydropower reservoir levelcontrol a case studyrdquo Automatica vol 29 no 5 pp 1203ndash12141993
[9] J I Sarasua J Fraile-Ardanuy J I Perez J R Wilhelmi andJ A Sanchez ldquoControl of a run of river small hydro powerplantrdquo in Proceedings of the International Conference on PowerEngineering Energy and Electrical Drives (POWERENG 07) pp672ndash677 Setubal Portugal April 2007
[10] S Endo M Konishi and H Imabayasi ldquoWater level controlof small-scale hydroelectric power plant by deadbeat controlmethodrdquo in Proceedings of the 26th Annual Conference of theIEEE Industrial Electronics Society (IECON rsquo00) pp 1123ndash1128October 2000
[11] O Yadav N Kishor J Fraile-Ardanuy S R Mohanty J I Perezand J I Sarasua ldquoPond head level control in a run-of-riverhydro power plant using fuzzy controllerrdquo in Proceedings of the16th International Conference on Intelligent System Applications
The Scientific World Journal 13
to Power Systems (ISAP rsquo11) pp 1ndash5 Chersonisos GreeceSeptember 2011
[12] D Dumur A Libaux and P Boucher ldquoobust control for Basse-Isere run-of-river cascaded hydroelectric plantsrdquo in Proceedingsof the IEEE International Conference on Control Applications(CCA rsquo01) pp 1083ndash1088 September 2001
[13] O F Jimenez and M H Chaundhry ldquoWater-level control inhydropower plantsrdquo Journal of Energy Engineering vol 118 no3 pp 180ndash193 1992
[14] R Jidin and B Othman ldquoOutput improvement of Sg Piahrun-off river hydro-electric station with a new computed riverflow-based control systemrdquo IOP Conference Series Earth andEnvironmental Science vol 16 Article ID 012076 2013
[15] L Hovey ldquoOptimum adjustment of hydro governors on Man-itoba hydro systemrdquo Power Apparatus and Systems Part IIITransactions of theAmerican Institute of Electrical Engineers vol81 no 3 pp 581ndash586 1962
[16] M Paynter ldquoThe analog in governor design I A restrictedproblemrdquo in Palimpsest on the Electronic Analog Art G APhilbrick Researches Boston Mass USA 1960
[17] M Chaudhry ldquoGoverning stability of a hydroelectric powerplantrdquoWater Power vol 22 no 4 pp 131ndash136 1970
[18] D H Thorne and E F Hill ldquoExtensions of stability boundariesof a hydraulic turbine generating unitrdquo IEEE Transactions onPower Apparatus and Systems vol 94 no 4 pp 1401ndash1409 1975
[19] D T Phi E J Bourque D H Thorne and E F Hill ldquoAnalysisand application of the stability limits of a hydro-generatingunitrdquo IEEE Transactions on Power Apparatus and Systems vol100 no 7 pp 3203ndash3212 1981
[20] S Hagihara H Yokota K Goda and K Isobe ldquoStability of ahydraulic turbine generating unit controlled by PID governorrdquoIEEE Transactions on Power Apparatus and Systems vol 98 no6 pp 2294ndash2298 1979
[21] T Brezina J Kovar and T Hejc ldquoModeling and control ofsystem with pump and pipeline by pole placement methodrdquo inProceedings of the 14th International Conference onMechatronics(MECHATRONIKA rsquo11) pp 6ndash9 June 2011
[22] M Mahmoud K Dutton and M Denman ldquoDesign andsimulation of a nonlinear fuzzy controller for a hydropowerplantrdquo Electric Power Systems Research vol 73 no 2 pp 87ndash992005
[23] K Natarajan ldquoRobust PID controller design for hydroturbinesrdquoIEEE Transactions on Energy Conversion vol 20 no 3 pp 661ndash667 2005
[24] B Strah O Kuljaca and Z Vukic ldquoSpeed and active powercontrol of hydro turbine unitrdquo IEEE Transactions on EnergyConversion vol 20 no 2 pp 424ndash434 2005
[25] M Han B Kawkabani and J-J Simond ldquoEigenvalues analysisapplied to the stability study of a variable speed pump turbineunitrdquo in Proceedings of the 20th International Conference onElectrical Machines (ICEM rsquo12) pp 907ndash913 September 2012
[26] P C O Silva B Kawkabani S Alligne C Nicolet J-J Simondand F Avellan ldquoStability study of a complete hydroelectricproduction site by eigenvalues analysis method based on phasevariablesrdquo in Proceedings of the 19th International Conference onElectrical Machines (ICEM rsquo10) pp 1ndash6 Rome Italy September2010
[27] X Liu and C Liu ldquoEigenanalysis of oscillatory instability ofa hydropower plant including water conduit dynamicsrdquo IEEETransactions on Power Systems vol 22 no 2 pp 675ndash681 2007
[28] M H Chaudhry Applied Hydraulic Transients Van NostrandNew York NY USA 1987
[29] C Nicolet Y Pannatier B Kawkabani A Schwery F Avellanand J Simond ldquoBenefits of variable speed pumped storage unitsin mixed islanded power network during transient operationrdquoin Proceedings of the 16th Annual HYDRO Conference LyonFrance 2009
[30] J I Perez-Dıaz J I Sarasua and J R Wilhelmi ldquoContributionof a hydraulic short-circuit pumped-storage power plant tothe load-frequency regulation of an isolated power systemrdquoInternational Journal of Electrical Power andEnergy Systems vol62 pp 199ndash211 2014
[31] IEEE Working-Group on Prime Mover and Energy SupplyModels for System Dynamic Studies ldquoHydraulic turbine andcontrol models for system dynamic studiesrdquo IEEE Transactionson Power Systems vol 7 no 1 pp 167ndash179 1992
[32] L Fu J Yang H Bao and J Li ldquoEffect of turbine characteristicon the response of hydroturbine governing system with surgetankrdquo in Proceedings of the Asia-Pacific Power and EnergyEngineering Conference (APPEEC rsquo09) Chengdu China March2009
[33] D Thoma Beitrage zur Theorie des Wasserschlosses bei Selb-sttatig Geregelten Turbinenanlagen Oldenburg Munchen Ger-many 1910
[34] F Collier and L Wozniak ldquoControl synthesis for an impulseturbine the Bradley Lake projectrdquo IEEE Transactions on EnergyConversion vol 6 no 4 pp 639ndash648 1991
[35] M Vinatoru CMaican and C Vinatoru ldquoLevel control using afeed-forward structurerdquo in Proceedings of the 19th InternationalConference onControl Systems andComputer Science (CSCS 13)pp 24ndash29 Bucharest Romania May 2013
TribologyAdvances in
Hindawi Publishing Corporationhttpwwwhindawicom Volume 2014
International Journal of
AerospaceEngineeringHindawi Publishing Corporationhttpwwwhindawicom Volume 2014
FuelsJournal of
Hindawi Publishing Corporationhttpwwwhindawicom Volume 2014
Journal ofPetroleum Engineering
Hindawi Publishing Corporationhttpwwwhindawicom Volume 2014
Industrial EngineeringJournal of
Hindawi Publishing Corporationhttpwwwhindawicom Volume 2014
Power ElectronicsHindawi Publishing Corporationhttpwwwhindawicom Volume 2014
Advances in
CombustionJournal of
Hindawi Publishing Corporationhttpwwwhindawicom Volume 2014
Journal of
Hindawi Publishing Corporationhttpwwwhindawicom Volume 2014
Renewable Energy
Submit your manuscripts athttpwwwhindawicom
Hindawi Publishing Corporationhttpwwwhindawicom Volume 2014
StructuresJournal of
International Journal of
RotatingMachinery
Hindawi Publishing Corporationhttpwwwhindawicom Volume 2014
EnergyJournal of
Hindawi Publishing Corporationhttpwwwhindawicom Volume 2014
Hindawi Publishing Corporation httpwwwhindawicom
Journal ofEngineeringVolume 2014
Hindawi Publishing Corporation httpwwwhindawicom Volume 2014
International Journal ofPhotoenergy
Hindawi Publishing Corporationhttpwwwhindawicom Volume 2014
Nuclear InstallationsScience and Technology of
Hindawi Publishing Corporationhttpwwwhindawicom Volume 2014
Solar EnergyJournal of
Hindawi Publishing Corporationhttpwwwhindawicom Volume 2014
Wind EnergyJournal of
Hindawi Publishing Corporationhttpwwwhindawicom Volume 2014
Nuclear EnergyInternational Journal of
Hindawi Publishing Corporationhttpwwwhindawicom Volume 2014
High Energy PhysicsAdvances in
The Scientific World JournalHindawi Publishing Corporation httpwwwhindawicom Volume 2014
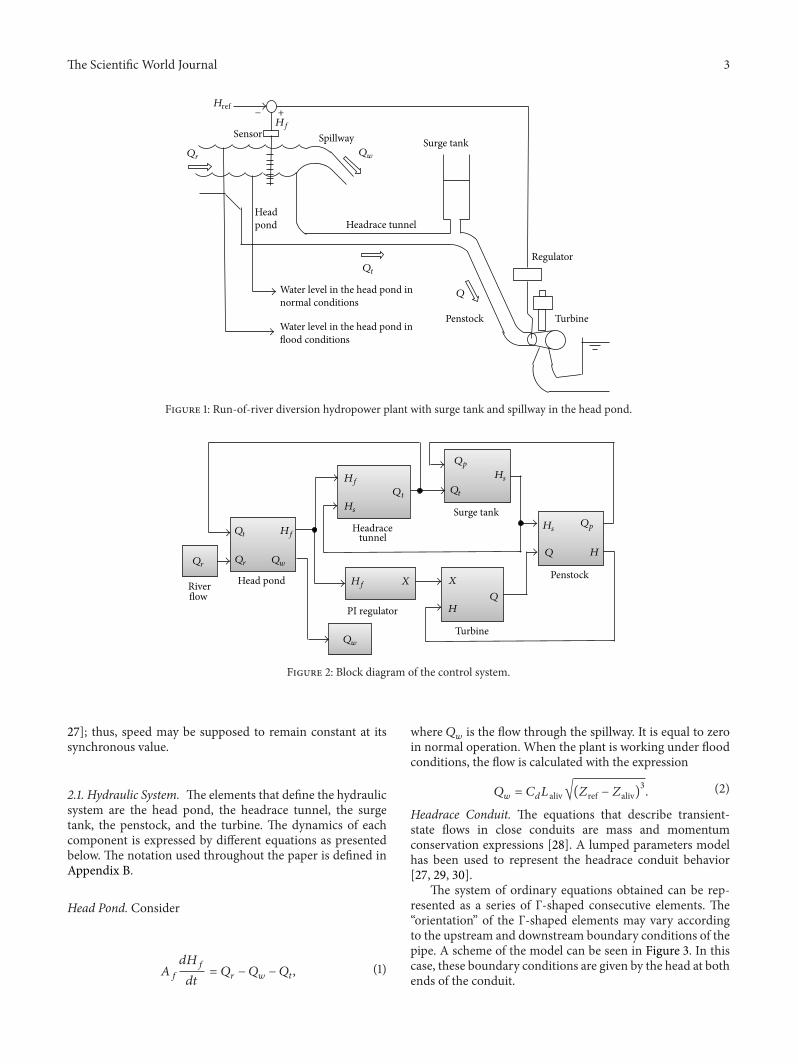
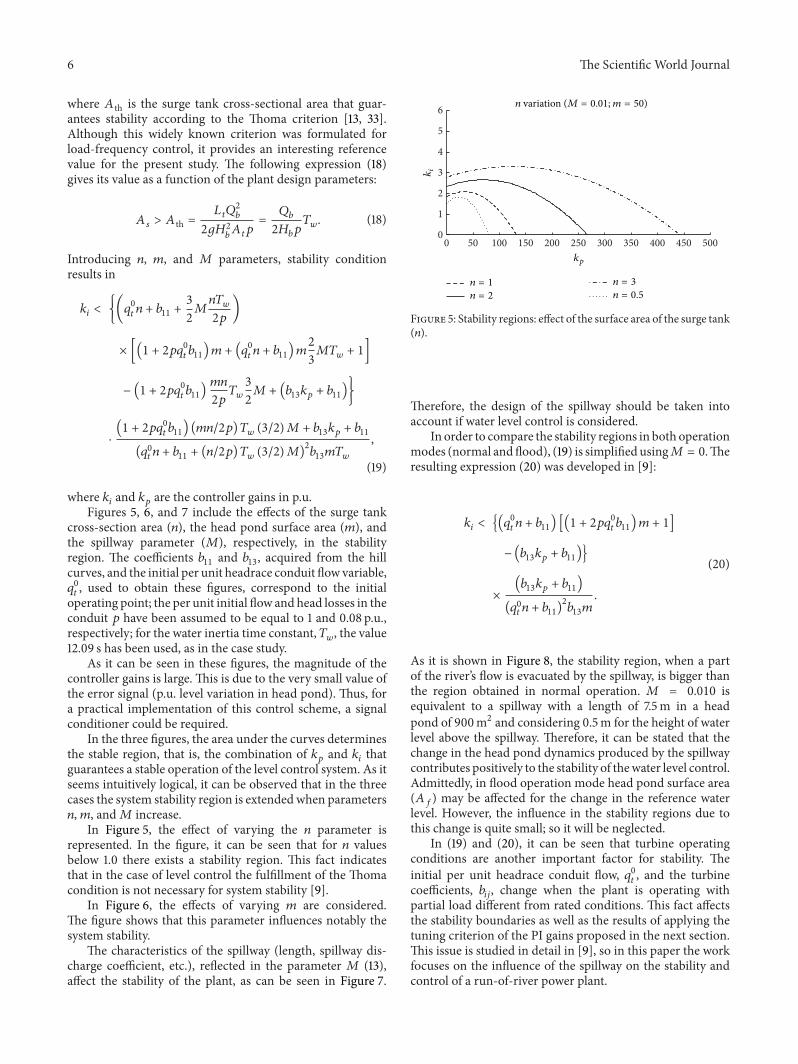
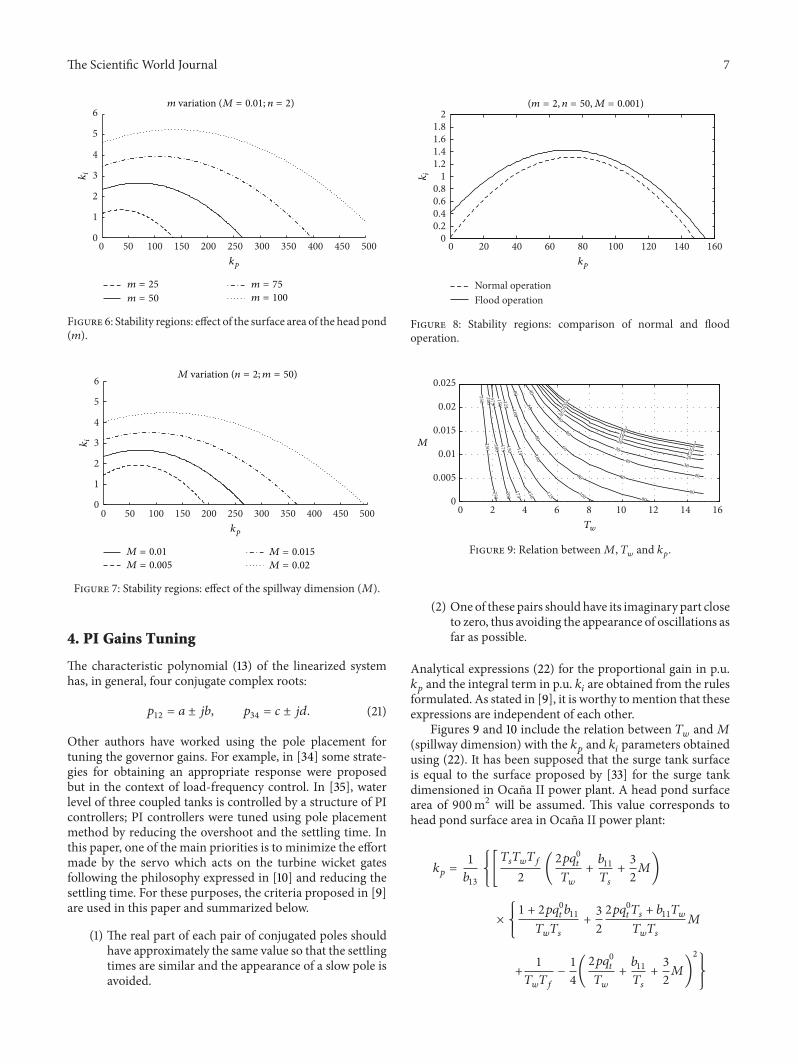
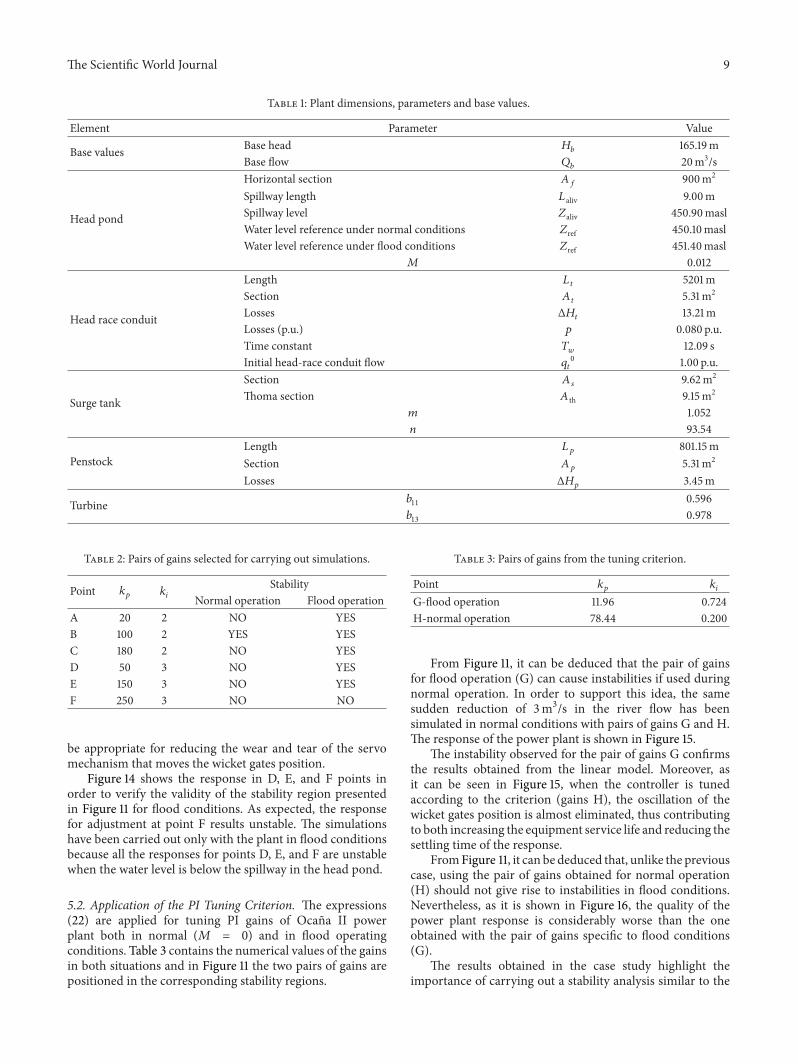
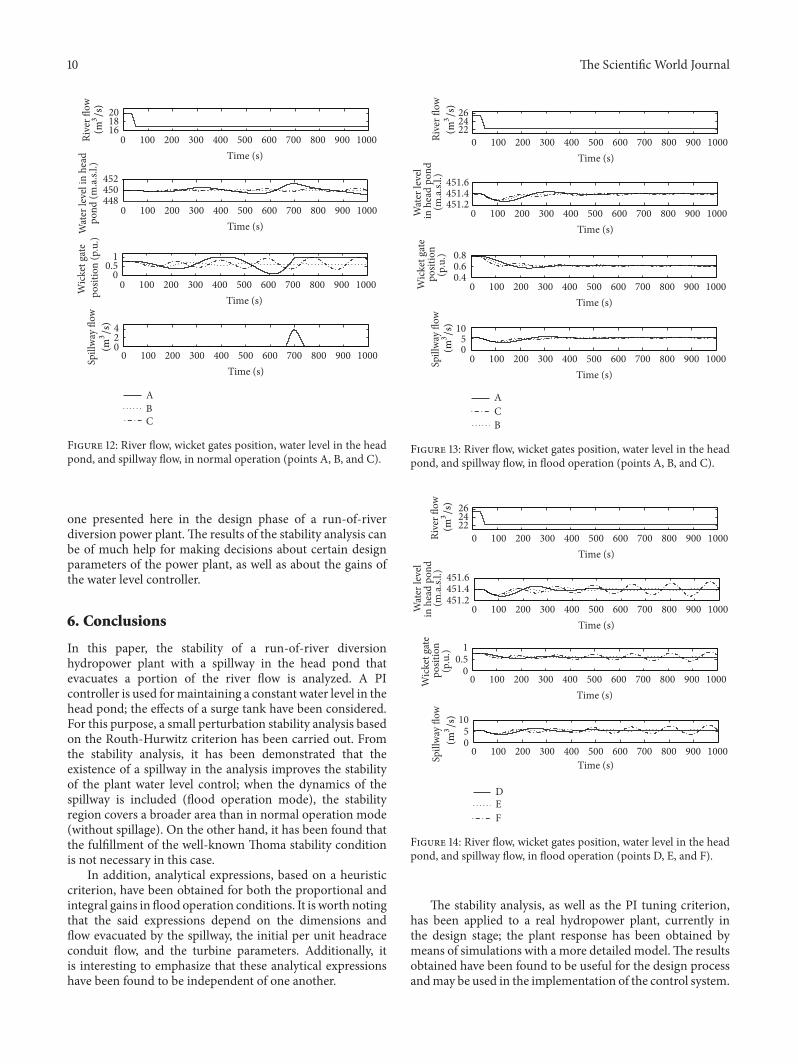
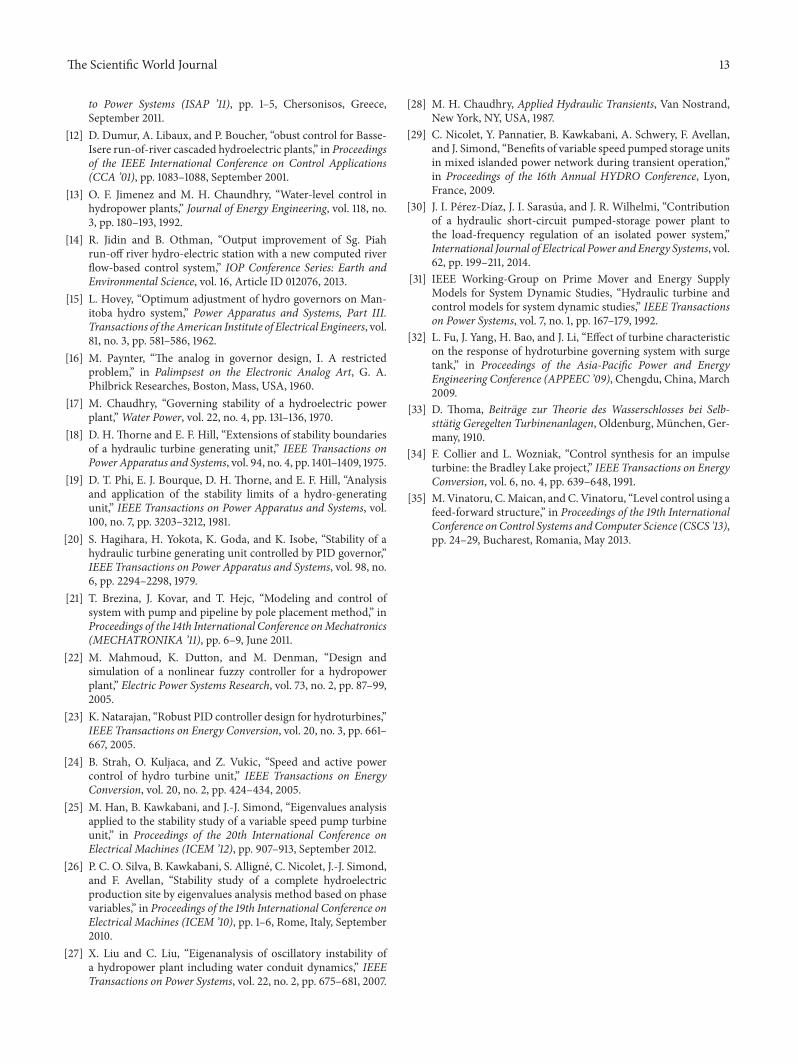