Embed Size (px)
Citation preview

Serum PEDF Levels Are Decreased in a Spontaneous Animal Model
for Human Autoimmune Uveitis
Johanna K. Zipplies,† Stefanie M. Hauck,‡ Stephanie Schoeffmann,‡ Barbara Amann,†
Manfred Stangassinger,† Marius Ueffing,‡,§,# and Cornelia A. Deeg*,†,#
Institute of Animal Physiology, Department of Veterinary Sciences, LMU Munich, Veterinarstr. 13, D-80539Munich, Germany, Department of Protein Sciences, Helmholtz Zentrum Munchen, German Research Center for
Environmental Health (GmbH), Ingolstaedter Landstr. 1, D-85764 Neuherberg, Germany, and Institute ofHuman Genetics, Technical University of Munich, Trogerstr. 32, D-81675 Munich, Germany
Received September 1, 2008
Identification of biomarkers is of critical relevance toward improving diagnosis and therapy ofautoimmune disorders. Serum markers are a desirable choice as sera are easily accessible and thedevelopment of assays for routine clinical detection prompts feasible. Autoimmune uveitis, a recurrentdisease affecting the eye, is characterized by returning inflammatory attacks of the inner eye followedby variable periods of quiescent stages. Spontaneous equine recurrent uveitis (ERU) is the equineequivalent and serves as a model for the human disease. To identify potential biomarker candidates,we first systematically compared the proteomes of individual ERU cases with healthy controls byproteomic profiling using 2-D difference-gel-electrophoresis (2-D DIGE) followed by tandem massspectrometry. A total of seven differentially expressed proteins were identified. Besides the upregulationof IgG and the significant lower expression of albumin, Antithrombin III, and Vitamin D binding protein,we found complement components C1q and C4, to be downregulated in uveitic state. Interestingly,Pigment epithelium-derived factor (PEDF), a marker already detected by 2DE differential proteomeanalysis in ERU target tissues, vitreous and retina, was found to be also significantly downregulated insera. The lower expression of PEDF in sera of horses with uveitis could be verified in a cohort of 116ERU cases and 115 healthy controls. Our findings of a significant lower PEDF expression in ERU casesalso in the periphery of the eye proves PEDF as a promising uveitis biomarker.
Keywords: Pigment epithelium derived factor (PEDF) • serum • biomarker • Fluorescence two-dimensional difference gel electrophoresis • uveitis
1. Introduction
Equine recurrent uveitis (ERU) is a highly prevalent spon-taneous autoimmune disease in horses with a characteristicremitting-relapsing nature.1 ERU serves as a valuable modelfor human autoimmune uveitis2-5 and other intermittentautoimmune diseases. Autoreactive T cells enter the inner eyein alternating intervals and cause intraocular inflammation withdestruction of retinal architecture resulting in blindness.1,6,7
Molecular targets of these attacks are retina- and brain-specificproteins such as S-antigen (S-Ag), interphotoreceptor retinoidbinding protein (IRBP) or cellular retinoid binding protein(CRALBP).1,8-10 Interestingly, only activated T cells are able topass the blood-retinal barrier11 but the triggers of this activa-tion are yet a puzzle in organ-specific autoimmune diseases.This is especially the case as the target organs of the inflam-
matory attack are separated from the immune system by theblood-retinal or the blood-brain barrier. Injection of uveitisautoantigens (emulsified in complete Freunds Adjuvans (CFA)to ensure a T helper 1 response) in the neck of experimentalhorses leads to a considerable immune reaction to theseautoantigens that is measurable in peripheral blood severaldays after injection. T cells then overcome the physiologicalbarrier for immune cells, the retinal pigment epithelium, andenter the inner eye leading to uveitis.8,12 Experiments revealedthat autoreactive T cells are activated in the spleen13 andtherefore home from spleen to the inner eye directly beforethe inflammatory attack. As a result, these cells can be detectedin the peripheral blood straight before disease outbreak inexperimental uveitis with known kinetics12,14 and by chancein patients sampled immediately before recurrence of spondy-loarthritis.15 This phenomenon presents a rationale towardsearching for biomarkers as well as specific biomarker signa-tures in the peripheral blood, which could indicate an ap-proaching relapse and allow monitoring of autoaggressiveactivity. Such prediction of individual risks would probablyallow earlier and personalized therapeutic intervention duringonset and progression of disease. Our preceding studies
* To whom correspondence should be addressed. Institute of AnimalPhysiology, Veterinarstr. 13, D-80539 Munich. E-mail: [email protected]. Telephone: 00498921801630. Fax: 00498921802554.
† Institute of Animal Physiology, LMU Munich.‡ German Research Center for Environmental Health (GmbH).§ Technical University of Munich.# Both authors share equal senior authorship.
992 Journal of Proteome Research 2009, 8, 992–998 10.1021/pr800694y CCC: $40.75 2009 American Chemical SocietyPublished on Web 12/29/2008

comparing the uveitis target tissue proteomes already provedthe value of proteomics in unraveling differentially expressedproteins associated with uveitis pathogenesis.2,4 As the com-position of the serum proteome has been shown to mirror mostbiological processes, as most proteins and their fragments arecarried into the peripheral blood, protein profiles reflectingdiscrete physiological as well as pathological processes are tobe expected in serum, though at a much diluted level. Serumor plasma proteomes, though rather complex in composition,are promising specimens for biomarker analysis because oftheir accessibility and easy storage for up to several years,allowing also retrospective validation of novel detected diseasepredictive markers.
The goal of our study has been the discovery of biomarkercandidates for uveitis. After thorough validation, such markerscan add to and improve existing paraclinical tools, mostimportantly surrogate markers such as autoantibody tests inpatient sera. Given an eventual prognostic value, they can aswell be suited to indicate an approaching attack. In addition,they bear the chance to point toward discrete pathwaysinvolved in uveitis pathogenesis. Hence, we chose systematicexploration and comparison of the serum proteomes of healthyand uveitic cases using the advantage of multiplex analysis.Differential-in-gel-analysis (DIGE) overcomes some majordrawbacks of conventional 2-D gel electrophoresis, such as thegel-to-gel variation observed with the separation profile evenbetween the same samples.16 Inclusion of an internal stan-dard17 and running different samples on the same gel usingquantitative staining with CyDyes is particularly useful toidentify true differentially regulated candidates.18
2. Experimental Procedures
2.1. Serum Samples. For the initial DIGE screening experi-ment comparing the serum proteomes of healthy horses andERU cases, we processed sera of five healthy horses and fiveERU cases. For validation of PEDF as a biomarker, we used116 additional ERU cases and 115 controls. ERU was diagnosedaccording to clinical criteria as described.19
2.2. Two-Dimensional Gel Electrophoresis (2DE). Serumsamples were stabilized with protease inhibitors (Roche) andstored at -80 °C. Protein content was quantified with theBradford assay (BioRad).
For the DIGE experiment, proteins were labeled with esterderivatives of Cy3 and Cy5 after adjusting pH to 8.5 accordingto the supplier’s instructions (GE Healthcare) in 2DE DIGEbuffer pH 8.5 (30 mM Tris-HCl, 7 M urea, 2 M thiourea, 4%CHAPS). Additionally, an internal standard (a pool of all thesamples within an experiment) was included in all experiments.This standard was labeled with ester derivative of Cy2 (GEHealthcare). Proteins were labeled at a ratio of 400 pmol Cy2,Cy3 or Cy5 per 50 µg of protein (minimal labeling) in dimeth-ylformamide (Sigma) for 30 min on ice. The reaction wasquenched by addition of 1 µL of 10 mM lysine per sample, andafter additional 10 min incubation, samples were combinedto sample sets each containing ERU, healthy and internalstandard proteins. The total volume of each pool was adjustedto 460 µL with DIGE buffer and dithiothreitole was added at afinal concentration of 35 mM. Immobiline dry strips pH 3-11NL, 24 cm (GE-Healthcare) were rehydrated overnight with therespective sample pools and additional 1% Pharmalyte pH3-10 (GE-Healthcare) and 0.5% bromphenole blue. Isoelectricfocusing was performed on a Multiphor (GE-Healthcare) for45 kVh at 20 °C, followed by separation on SDS-PAGE gels (12%)
at constant 45 V per gel. Gels were then scanned with theTyphoon Trio Scanner (GE-Healthcare) with 8 bit/600 dpiresolution using different wavelengths for the respective Cy-Dyes. Afterward, gels were silver stained20 or blue silverstained21 and differentially expressed spots were cut andprocessed for mass spectrometry.
2.3. Image Analysis and Detection of Differentially ExpressedProteins. Images of DIGE gels were imported to 2DE analysissoftware (DeCyder; release 6.5; GE Healthcare) after scanning.Gel analysis started with differential in-gel analysis (DIA) forintragel analysis.22 The DIA module starts with a spot detectionalgorithm for each gel (estimated number of spots: 5000). Thenthe dye tag is assigned to the images (Cy2-internal standard,Cy3 or Cy5-ERU or control, since reverse labeling was per-formed). After spot detection, a normalization of Cy3 and Cy5volumes in relation to the Cy2 labeled internal standard (Cy3/Cy2 and Cy5/Cy2) was performed. The following inclusion andexclusion criteria for spot detection were defined in order toexclude false positive spots: spot slope 2, minimum spotvolume 30 000 and threshold of 2.5. Spots were then detectedby the software, but detection was manually checked andcorrected if necessary. For each gel, the number and distribu-tion of spots according to their volume ratio are displayed ina histogram. The histogram indicates the type of the detectedspot: decreased/unchanged/increased. Next, gels were analyzedwith the biological variation analysis (BVA) allowing intergelanalysis.22 Standardized abundances of all matched proteinspots were compared across the five analytical gels per experi-ment, and Student’s t test was performed with the DeCyderBVA (biological variation analysis) module to validate thesignificance of the detected differences between spot volumesfrom uveitic sera and those of negative control sera (t testP-values set at e0.05). Respective spots were displayed on agraphical map which was then printed on a transparency inorder to redetect these spots on the blue silver or silver stainedgels to excise for mass spectrometry.
2.4. Mass Spectrometry for Protein Identification. Selectedspots from 2DE were excised, destained and processed byproteolysis with trypsin as described before23,24 and analyzed byMALDI-TOF peptide mass fingerprinting and MS/MS on aMALDI-TOF/TOF tandem mass spectrometer (ABI 4700 Proteom-ics Analyzer, Applied Biosystems). For positive-ion reflector modespectra, 2500 laser shots were averaged and processed withexternal calibration. PMF spectra were not smoothed and back-ground was not subtracted. Monoisotopic peak masses wereautomatically determined within the mass range 800-4000 kDawith a signal-to-noise ratio minimum set to 5 and the local noisewindow width m/z 200. Up to seven of the most intense ionsignals with signal-to-noise ratio above 30 were selected asprecursors for MS/MS acquisition excluding common trypsinautolysis peaks and matrix ion signals. In MS/MS positive ionmode, 4000 spectra were averaged with 1 kV collision energy,collision gas air at a pressure of 1.6 × 10⁻⁶ Torr and defaultcalibration. Monoisotopic peak masses were automatically de-termined with a signal-to-noise ratio minimum set to 10 and thelocal noise window width m/z 200. Combined PMF and MS/MSqueries were performed using the MASCOT Database searchengine v1.925 (Matrix Science Ltd.) embedded into GPS-ExplorerSoftware (Applied Biosystems) on the Swiss-Prot database (version20070531; 270 778 sequences; 99 412 397 residues), the MSDBmetadatabase (version 20061115; 3 239 079 sequences; 1 079 594 700residues) or the horse genome database (retrieved from UCSC,version 20070101; 39 612 sequences; 252 365 residues) with the
Serum Biomarkers in Uveitis research articles
Journal of Proteome Research • Vol. 8, No. 2, 2009 993

following parameter settings (if applicable): entries restricted tomammalian, 65 ppm mass accuracy for the precursor mass, 0.3Da fragment mass tolerance, trypsin cleavage, one missed cleav-age allowed, carbamidomethylation was set as fixed modificationand oxidation of methionines was allowed as variable modifica-tion. A protein was regarded as identified (Table 1), if theprobability based MOWSE score26 was significant for the respec-tive database (protein scores greater than 58 were significant, p< 0.05 for Swiss-Prot, scores greater 67 for MSDB and scoresgreater 54 for the horse genome database), if the matched peptidemasses were abundant in the spectrum and if the theoreticalmasses of the significant hit fit the experimentally observed values.
2.5. Quantification of PEDF Downregulation with ELISA. Forvalidation of PEDF downregulation in uveitic state, we used asandwich ELISA. PolySorb plates (Nunc) were first coated with25 µL/mL Steptavidin (Roche) in carbonate buffer (pH 9.6). Thecapture antibody, a monoclonal mouse-anti-PEDF antibody (5µg/mL, Chemicon) was preincubated.with anti-mouse IgGBiotin (1:1000, Linaris) for 1 h and then applied to the ELISAplate for 1 h. After blocking with 4% BSA (Applichem), sera wereadded in a 1:10 dilution in PBS-T. A polyclonal goat anti-PEDFantibody (1:5000, Santa Cruz) was used as detection antibody,followed by an anti-goat IgG POD labeled antibody (1:20 000,Linaris). The reaction was visualized with tetramethylbenzidine,stopped with 1 M sulfuric acid and the absorbance wasmeasured at 450 nm using a microplate reader. As a positivecontrol, a dilution series of recombinant human PEDF (Acris)was performed on every plate. PEDF abundances between ERUcases and controls were statistically analyzed using theMann-Whitney test and the free software package Past (http://folk.uio.no/ohammer/past/).
3. Results
3.1. Proteomic Map of Normal Equine Serum. We firstobtained a map of normal equine serum proteins (Figure 1; bluesilver stain) by 2 DE separation. Serum 2DE patterns were highly
reproducible between experiments and among sampled cases.Major landmark proteins could be subsequently and conclusivelyidentified by mass spectrometry (see supplemental table inSupporting Information). A total of 128 spots were successfullyidentified by mass spectrometry resulting in the identification of33 different proteins (supplemental table).
3.2. Seven Differentially Expressed Proteins Identified inSera of ERU Cases. The DIGE experiment comparing controls(n ) 5) (Figure 2a, blue spots) and uveitic sera (n ) 5; Figure2a, green spots) revealed several differentially regulated spotsbetween both states (Figure 2c, differentially expressed spotslabeled and Figure 3, displaying individual expression patterns).
Table 1. Differentially Expressed Proteins in Sera of ERU Casesa
theoretical
spot ID protein name speciesaccessionnumber MW (Da) pI protein score
regulationfactors
expressionpattern In ERU
129 ImmunoglobulinGamma 7 hc
Equus caballus AAS18414 35721 7.69 59 1.28 v
130 ImmunoglobulinGamma 4 hc
Equus caballus AAS18415 36211 7.71 70 1.52 v
131 ImmunoglobulinGamma 4 hc
Equus caballus AAS18415 36211 7.71 66 1.64 v
132 Vitamin Dbinding Protein
Equus caballus XP_001489400 54327 5.46 278 1.36 V
133 Antithrombin III Pongo pygmaeus ANT3_PONPY 53061 6.32 335 1.46 V
134 Antithrombin III Bos taurus A61435 49437 6.02 168 1.45 V
135 Pigmentepithelium-derived factor
Homo sapiens PEDF_HUMAN 46342 5.97 142 1.22 V
136 Albumin Equus caballus ALBU_HORSE 70550 5.95 103 1.25 V
137 Albumin Equus caballus ALBU_HORSE 70550 5.95 198 1.29 V
138 ImmunoglobulinGamma 7 hc
Equus caballus AAS18415 36211 7.71 91 1.45 v
139 Albumin Equus caballus ALBU_HORSE 70550 5.95 67 1.22 V
140 Albumin Equus caballus ALBU_HORSE 70550 5.95 151 1.32 V
141 Complementfactor I
Equus caballus XP_001502956 66104 7.33 137 1.37 V
142 Complement C4gamma chain
Equus caballus XP_001492943 32856 6.68 95 1.54 V
143 IGLV3-25 Equus caballus XP_001492872 29005 8.54 287 1.28 v
a Mass spectrometric identifications of differentially regulated proteins in ERU sera. Proteins listed have been identified with a probability score that issignificant with p < 0.05. The expression pattern of the proteins in recurrent uveitis is indicated by arrows (v upregulated in ERU, V downregulated inERU).
Figure 1. Representative blue silver-stained 2DE of healthy equineserum comprising pH gradient from 3 to 11. The proteome wasresolved by 2-dimensional gel electrophoresis. Protein spotnumbers refer to mass spectrometric identifications, as given insupplemental table.
research articles Zipplies et al.
994 Journal of Proteome Research • Vol. 8, No. 2, 2009
Seven proteins (Figure 3) with different abundance wereunambiguously identified by mass spectrometry (Table 1,identifications with MALDI-TOF/TOF of spots referring toFigure 2c). One protein, Immunoglobulin G (IgG heavy chains4 and 7 and IG light chain V3-25; corresponding to spots 129,130, 131, 138 and 143 of Figure 2c and Table 1) was upregulatedin serum of ERU cases compared to healthy state. In contrast,six proteins were downregulated in ERU sera. These wereseveral albumin fragments (corresponding to spots 136, 137,139 and 140), Vitamin D binding protein (corresponding to spot132), Antithrombin III (corresponding to spots 133 and 134),Pigment epithelium-derived factor (PEDF, corresponding tospot 135), Complement factor 1q (corresponding to spot 141)and Complement C4 heavy chain (corresponding to spot 142).Additional proteins differed significantly in their abundance,but could not be identified by mass spectrometry (Red en-circled spots in Figure 2c).
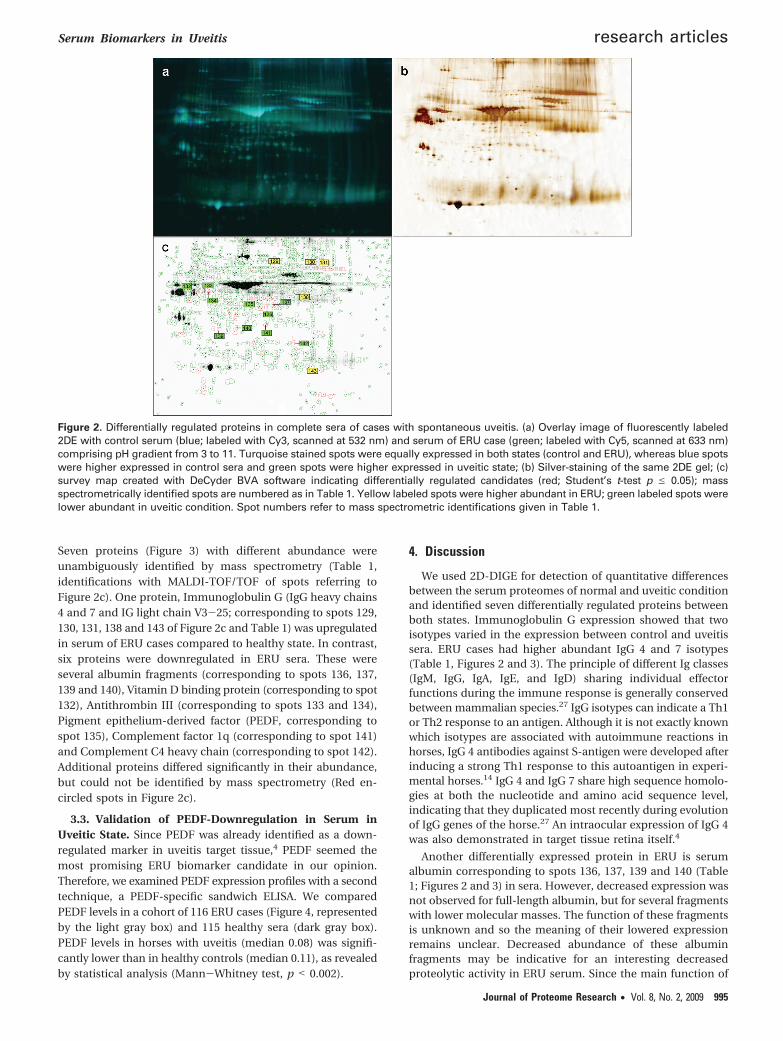
3.3. Validation of PEDF-Downregulation in Serum inUveitic State. Since PEDF was already identified as a down-regulated marker in uveitis target tissue,4 PEDF seemed themost promising ERU biomarker candidate in our opinion.Therefore, we examined PEDF expression profiles with a secondtechnique, a PEDF-specific sandwich ELISA. We comparedPEDF levels in a cohort of 116 ERU cases (Figure 4, representedby the light gray box) and 115 healthy sera (dark gray box).PEDF levels in horses with uveitis (median 0.08) was signifi-cantly lower than in healthy controls (median 0.11), as revealedby statistical analysis (Mann-Whitney test, p < 0.002).
4. Discussion
We used 2D-DIGE for detection of quantitative differencesbetween the serum proteomes of normal and uveitic conditionand identified seven differentially regulated proteins betweenboth states. Immunoglobulin G expression showed that twoisotypes varied in the expression between control and uveitissera. ERU cases had higher abundant IgG 4 and 7 isotypes(Table 1, Figures 2 and 3). The principle of different Ig classes(IgM, IgG, IgA, IgE, and IgD) sharing individual effectorfunctions during the immune response is generally conservedbetween mammalian species.27 IgG isotypes can indicate a Th1or Th2 response to an antigen. Although it is not exactly knownwhich isotypes are associated with autoimmune reactions inhorses, IgG 4 antibodies against S-antigen were developed afterinducing a strong Th1 response to this autoantigen in experi-mental horses.14 IgG 4 and IgG 7 share high sequence homolo-gies at both the nucleotide and amino acid sequence level,indicating that they duplicated most recently during evolutionof IgG genes of the horse.27 An intraocular expression of IgG 4was also demonstrated in target tissue retina itself.4
Another differentially expressed protein in ERU is serumalbumin corresponding to spots 136, 137, 139 and 140 (Table1; Figures 2 and 3) in sera. However, decreased expression wasnot observed for full-length albumin, but for several fragmentswith lower molecular masses. The function of these fragmentsis unknown and so the meaning of their lowered expressionremains unclear. Decreased abundance of these albuminfragments may be indicative for an interesting decreasedproteolytic activity in ERU serum. Since the main function of
Figure 2. Differentially regulated proteins in complete sera of cases with spontaneous uveitis. (a) Overlay image of fluorescently labeled2DE with control serum (blue; labeled with Cy3, scanned at 532 nm) and serum of ERU case (green; labeled with Cy5, scanned at 633 nm)comprising pH gradient from 3 to 11. Turquoise stained spots were equally expressed in both states (control and ERU), whereas blue spotswere higher expressed in control sera and green spots were higher expressed in uveitic state; (b) Silver-staining of the same 2DE gel; (c)survey map created with DeCyder BVA software indicating differentially regulated candidates (red; Student’s t-test p e 0.05); massspectrometrically identified spots are numbered as in Table 1. Yellow labeled spots were higher abundant in ERU; green labeled spots werelower abundant in uveitic condition. Spot numbers refer to mass spectrometric identifications given in Table 1.
Serum Biomarkers in Uveitis research articles
Journal of Proteome Research • Vol. 8, No. 2, 2009 995

albumin is transportation of molecules, it would be interestingto study the binding specifity of the downregulated fragments.
A lower expressed candidate in uveitic state compared tonegative controls is antithrombin III (Table 1, Figures 2 and3). Antithrombin III is the most important serine proteaseinhibitor in plasma that regulates the blood coagulationcascade. It inhibits thrombin as well as factors IXa, Xa and Xia.28
The meaning of the changed antithrombin III expression insera of uveitis cases is unclear. A difference in serum generationbetween both groups cannot be excluded, but sera weresampled using the same procedure and processing specimenof both states at the same time. Further experiments are neededto detect the role of antithrombin III in this context, since thisis a protein with many functions involved in several differentcascades.29
Vitamin D binding protein (DBP), an extracellular multi-functional protein with vitamin D transporter activity, wasfound to be downregulated in ERU (Table 1, Figures 2 and 3).Only 5% of circulating DBP is actually complexed with vitamin
D metabolites, leaving a considerable amount of the proteinavailable for functions in macrophage activation,30,31 T cellmodulation,31 chemotaxis32 or its role as part of the actin-scavenger system.32 Further, Vitamin D shifts the immuneresponse to a more anti-inflammatory response and enhancesregulatory T cell functionality.31 There is increasing evidencefor a role of the vitamin D endocrine system in the pathogenesisof autoimmune diseases.31,33 The exact mechanism is unclearat present and could be due to the strong immune modulatingpotential of vitamin D or the role of DBP in clearing tissue-leaking proteins from the blood-stream. Therefore, the signifi-cant lowered expression of DBP in ERU is an interesting findingthat needs further analysis in disease pathogenesis.
Complement factor I was lower expressed in all ERU seratested (Table 1, Figures 2 and 3). This factor inactivatescomplement subcomponents C3b, iC3b and C4b by proteolyticcleavage.34 Additionally, Complement C4 gamma chain wasalso lower expressed in uveitic state (Table 1, Figures 2 and 3).Deficiencies of C1q and C4 in humans34 and guinea pigs35 were
Figure 3. Differentially regulated candidates in sera of spontaneous uveitis cases according to DeCyder analysis. Each panel includes(a) enlarged two-dimensional picture of respective spots corresponding to the survey map in Figure 2c in ERU, spot number correspondsto the mass spectrometry Table 1, (b) corresponding spots in healthy control serum, (c) 3D graph of spot volume in ERU, (d) 3D graphof spot volume in healthy control serum. Graphs on the right side of each panel show the difference in abundance for spot pairs fromall gels. The red dots correspond to the spot pair shown in a-d. The yellow diamonds represent the internal standard.
research articles Zipplies et al.
996 Journal of Proteome Research • Vol. 8, No. 2, 2009

found to predispose for autoimmune conditions, indicating thatthe complement system may moreover be involved in theinduction and/or maintenance of tolerance at the humorallevel. Notably, individuals, who are deficient in C3 have a lowlevel of susceptibility to systemic lupus erythematosus SLEcompared with individuals who are deficient in C1 or C4, whichare major susceptibility factors.34 A correlation exists betweendeficiency in C1q or C4 and impaired clearance of apoptoticdebris that could result in accumulation of self-antigens in sitessuch as the lymphoid compartment, where they could becomeimmunogenic.34 A further known role of C4 in the humoralimmune response is the binding of environmental antigensand, through its interaction with CR1, the retention of theseantigens on follicular dendritic cells.34
Most interesting, we observed a significant downregulationof pigment epithelium-derived protein (PEDF) in this experi-ment, consistent with our earlier observations in ERU vitreous2
and retina.4 Therefore, we chose to validate PEDF as the mostpromising biomarker candidate in our opinion, suggesting thatthe downregulation of PEDF under inflammatory conditionsis not only limited to the eye. With a large-scale validationapproach using a second technique with a quantitative PEDF-Elisa, we could here confirm the significant lower PEDFexpression in peripheral blood of ERU cases (Figure 4). PEDFis a neurotrophic factor and a potent inhibitor of angiogen-esis.36 It was shown that the PEDF concentration found inblood is sufficient to have functional significance.37 In rats withendotoxin-induced uveitis, drastically decreased PEDF levelsare detectable in retina and plasma, which suggests that PEDFis a negative acute-phase protein.38 PEDF operates as aregulator of inflammatory factors and suppresses endothelialpermeability by protecting tight junction proteins.38 Our find-ings of a significant lower PEDF expression in ERU cases notonly in the target organ, the eye,2,4 but also in the serum provesPEDF as a promising uveitis biomarker. Further, we demon-strated that the identification of disease specific serum biom-
arkers shows more potential if a combined approach is used,evaluating differentially regulated candidates in diseased tissueand serum. Only PEDF overlapped also in experiments usingtarget tissues retina and vitreous2,4 as a biomarker. The possiblepredictive value of PEDF downregulation for ERU for clinicalroutine now merits closer examination.
Abbreviations: Apo, apolipoprotein; AMD, age-related mac-ular degeneration; CFA, complete Freund’s adjuvans; CRALBP,cellular retinoid binding protein; DIGE, difference-gel-electro-phoresis; DBP, Vitamin D-binding protein; ELISA, EnzymeLinked Immunosorbent Assay; ERU, equine recurrent uveitis;IgG, Immunoglobulin G; IGLV3-25, Immunoglobulin lambdavariable 3-25; IRBP, interphotoreceptor retinoid binding pro-tein; PEDF, pigment epithelium derived factor; RA, rheumatoidarthritis; S-Ag, S-antigen.
Acknowledgment. This work was supported by theDeutsche Forschungsgemeinschaft (DFG) SFB 571 A5 and DE719/2-1, by EU grant EVI-GENORET LSHG-CT-2005-512036and by funding from the German Federal Ministry of Edu-cation and Research: BMBF-QuantPro 0316865A. The authorsthank Kay Junghanns, Erich Grosskopf and Sven Reese forcritical and helpful discussions.
Supporting Information Available: Table of identifiedproteins in normal equine serum. This material is available freeof charge via the Internet at http://pubs.acs.org.
References(1) Deeg, C. A.; Amann, B.; Raith, A. J.; Kaspers, B. Inter- and
intramolecular epitope spreading in equine recurrent uveitis.Invest. Ophthalmol. Visual Sci. 2006, 47 (2), 652–6.
(2) Deeg, C. A.; Altmann, F.; Hauck, S. M.; Schoeffmann, S.; Amann,B.; Stangassinger, M.; Ueffing, M. Downregulation of PEDF inuveitic lesions associates with focal VEGF expression and break-down of the blood retinal barrier. Proteomics 2007, 7, 1540–1548.
(3) Deeg, C. A.; Hauck, S. M.; Amann, B.; Kremmer, E.; Stangassinger,M.; Ueffing, M. Major retinal autoantigens remain stably expressedduring all stages of spontaneous uveitis. Mol. Immunol. 2007, 44,3291–3296.
(4) Hauck, S. M.; Schoeffmann, S.; Amann, B.; Stangassinger, M.;Gerhards, H.; Ueffing, M.; Deeg, C. A. Retinal Mueller Glial CellsTrigger the Hallmark Inflammatory Process in Autoimmune Uvei-tis. J. Proteome Res. 2007, 6, 2121–2131.
(5) Deeg, C. A.; Raith, A. J.; Amann, B.; Crabb, J. W.; Thurau, S. R.;Hauck, S. M.; Ueffing, M.; Wildner, G.; Stangassinger, M. CRALBPis a highly prevalent autoantigen for human autoimmune uveitis.Clin. Dev. Immunol. 2007, 39245.
(6) Singh, V. K.; Rai, G.; Agarwal, S. S. Role of cytokines in experimentaland clinical uveitis. Indian J. Ophthalmol. 2001, 49 (2), 81–90.
(7) Nussenblatt, R. B. Bench to bedside: new approaches to theimmunotherapy of uveitic disease. Int. Rev. Immunol. 2002, 21(2-3), 273–289.
(8) Deeg, C. A.; Pompetzki, D.; Raith, A. J.; Hauck, S. M.; Amann, B.;Suppmann, S.; Goebel, T. W.; Olazabal, U.; Gerhards, H.; Reese,S.; Stangassinger, M.; Kaspers, B.; Ueffing, M. Identification andfunctional validation of novel autoantigens in equine uveitis. Mol.Cell. Proteomics 2006, 5 (8), 1462–1470.
(9) Caspi, R. R.; Roberge, F. G.; Chan, C. C.; Wiggert, B.; Chader, G. J.;Rozenszajn, L. A.; Lando, Z.; Nussenblatt, R. B. A new model ofautoimmune disease. Experimental autoimmune uveoretinitisinduced in mice with two different retinal antigens. J. Immunol.1988, 140 (5), 1490–1495.
(10) de Smet, M. D.; Bitar, G.; Mainigi, S.; Nussenblatt, R. B. HumanS-antigen determinant recognition in uveitis. Invest. Ophthalmol.Visual Sci. 2001, 42 (13), 3233–3238.
(11) Caspi, R. R. Immune mechanisms in uveitis. Springer Semin.Immunopathol. 1999, 21 (2), 113–124.
(12) Deeg, C. A.; Thurau, S. R.; Gerhards, H.; Ehrenhofer, M.; Wildner,G.; Kaspers, B. Uveitis in horses induced by interphotoreceptorretinoid-binding protein is similar to the spontaneous disease. Eur.J. Immunol. 2002, 32 (9), 2598–2606.
(13) Streilein, J. W.; Okamoto, S.; Hara, Y.; Kosiewicz, M.; Ksander, B.Blood-borne signals that induce anterior chamber-associated
Figure 4. Difference of PEDF levels in sera of 116 horses withuveitis and 115 healty controls was validated with a sandwichELISA. PEDF levels in sera of horses with uveitis (light gray box)was significantly (**p < 0.002) lower compared to the healthycontrols (dark gray box). For statistical analysis, Mann-Whitneytest was used (free software package Past). The light gray boxrepresents ERU cases, while the dark gray box represents healthycontrols; results are given as adsorbance units at 450 nm (OD450 nm). The spacing between the boxes indicates the degreeof spread in the data. The black line in the boxes represents themedian (ERU 0.11; controls 0.08).
Serum Biomarkers in Uveitis research articles
Journal of Proteome Research • Vol. 8, No. 2, 2009 997

immune deviation after intracameral injection of antigen. Invest.Ophthalmol. Visual Sci. 1997, 38 (11), 2245–2254.
(14) Deeg, C. A.; Reese, S.; Gerhards, H.; Wildner, G.; Kaspers, B. Theuveitogenic potential of retinal S-antigen in horses. Invest. Oph-thalmol. Visual Sci. 2004, 45 (7), 2286–2292.
(15) Marker-Hermann, E.; Meyer zum Buschenfelde, K. H.; Wildner,G. HLA-B27-derived peptides as autoantigens for T lymphocytesin ankylosing spondylitis. Arthritis Rheum. 1997, 40 (11), 2047–2054.
(16) Unlu, M.; Morgan, M. E.; Minden, J. S. Difference gel electro-phoresis: a single gel method for detecting changes in proteinextracts. Electrophoresis 1997, 18 (11), 2071–2077.
(17) Alban, A.; David, S. O.; Bjorkesten, L.; Andersson, C.; Sloge, E.;Lewis, S.; Currie, I. A novel experimental design for comparativetwo-dimensional gel analysis: two-dimensional difference gelelectrophoresis incorporating a pooled internal standard. Pro-teomics 2003, 3 (1), 36–44.
(18) Marouga, R.; David, S.; Hawkins, E. The development of the DIGEsystem: 2D fluorescence difference gel analysis technology. Anal.Bioanal. Chem. 2005, 382 (3), 669–678.
(19) Deeg, C. A.; Kaspers, B.; Gerhards, H.; Thurau, S. R.; Wollanke, B.;Wildner, G. Immune responses to retinal autoantigens and pep-tides in equine recurrent uveitis. Invest. Ophthalmol. Visual Sci.2001, 42 (2), 393–398.
(20) Blum, H.; Beier, H.; Gross, H. J. Improved silver staining of plantproteins, RNA and DNA in polyacrylamide gels. Electrophoresis1987, 8, 93–99.
(21) Braun, R. J.; Kinkl, N.; Zischka, H.; Ueffing, M. 16-BAC/SDS-PAGEanalysis of membrane proteins of yeast mitochondria purified byfree flow electrophoresis. Methods Mol. Biol. 2008, in press.
(22) Tannu, N. S.; Hemby, S. E. Two-dimensional fluorescence differ-ence gel electrophoresis for comparative proteomics profiling. Nat.Protoc. 2006, 1 (4), 1732–1742.
(23) Hauck, S. M.; Ekstrom, P. A. R.; Ahuja-Jensen, P.; Suppmann, S.;Paquet-Durand, F.; van Veen, T.; Ueffing, M. Differential modifica-tion of phosducin protein in degenerating rd1 retina is associatedwith constitutively active Ca2+/calmodulin kinase II in rod outersegments. Mol. Cell. Proteomics 2006, 5 (2), 324–336.
(24) Hauck, S. M.; Schoeffmann, S.; Deeg, C. A.; Gloeckner, C. J.;Swiatek-de Lange, M.; Ueffing, M. Proteomic analysis of theporcine interphotoreceptor matrix. Proteomics 2005, 5 (14), 3623–3636.
(25) Perkins, D. N.; Pappin, D. J.; Creasy, D. M.; Cottrell, J. S. Probability-based protein identification by searching sequence databases usingmass spectrometry data. Electrophoresis 1999, 20 (18), 3551–3567.
(26) Pappin, D. J. Peptide mass fingerprinting using MALDI-TOF massspectrometry. Methods Mol. Biol. 1997, 64, 165–173.
(27) Wagner, B.; Miller, D. C.; Lear, T. L.; Antczak, D. F. The completemap of the Ig heavy chain constant gene region reveals evidencefor seven IgG isotypes and for IgD in the horse. J. Immunol. 2004,173 (5), 3230–3242.
(28) Bode, W. The structure of thrombin: a janus-headed proteinase.Semin. Thromb. Hemost. 2006, 32 (1), 16–31.
(29) Taylor, K. R.; Gallo, R. L. Glycosaminoglycans and their proteogly-cans: host-associated molecular patterns for initiation and modu-lation of inflammation. FASEB J. 2006, 20 (1), 9–22.
(30) Pani, M. A.; Regulla, K.; Segni, M.; Hofmann, S.; Hufner, M.;Pasquino, A. M.; Usadel, K.-H.; Badenhoop, K. A polymorphismwithin the vitamin D-binding protein gene is associated withGraves’ disease but not with Hashimoto’s thyroiditis. J. Clin.Endocrinol. Metab. 2002, 87 (6), 2564–2567.
(31) Smolders, J.; Damoiseaux, J.; Menheere, P.; Hupperts, R. VitaminD as an immune modulator in multiple sclerosis, a review.J. Neuroimmunol. 2008, 194 (1-2), 7–17.
(32) Otterbein, L. R.; Cosio, C.; Graceffa, P.; Dominguez, R. Crystalstructures of the vitamin D-binding protein and its complex withactin: structural basis of the actin-scavenger system. Proc. Natl.Acad. Sci. U.S.A. 2002, 99 (12), 8003–8008.
(33) Ongagna, J. C.; Pinget, M.; Belcourt, A. Vitamin D-binding proteingene polymorphism association with IA-2 autoantibodies in type1 diabetes. Clin. Biochem. 2005, 38 (5), 415–419.
(34) Carroll, M. C. A protective role for innate immunity in systemiclupus erythematosus. Nat. Rev. Immunol. 2004, 4 (10), 825–831.
(35) Bottger, E. C.; Hoffmann, T.; Hadding, U.; Bitter-Suermann, D.Guinea pigs with inherited deficiencies of complement compo-nents C2 or C4 have characteristics of immune complex disease.J. Clin. Invest. 1986, 78 (3), 689–695.
(36) Steele, F. R.; Chader, G. J.; Johnson, L. V.; Tombran-Tink, J. Pigmentepithelium-derived factor: neurotrophic activity and identificationas a member of the serine protease inhibitor gene family. Proc.Natl. Acad. Sci. U.S.A. 1993, 90 (4), 1526–1530.
(37) Petersen, S. V.; Valnickova, Z.; Enghild, J. J. Pigment-epithelium-derived factor (PEDF) occurs at a physiologically relevant con-centration in human blood: purification and characterization.Biochem. J. 2003, 374 (Pt 1), 199–206.
(38) Zhang, S. X.; Wang, J. J.; Gao, G.; Shao, C.; Mott, R.; Ma, J.-x.Pigment epithelium-derived factor (PEDF) is an endogenousantiinflammatory factor. FASEB J. 2006, 20 (2), 323–325.
PR800694Y
research articles Zipplies et al.
998 Journal of Proteome Research • Vol. 8, No. 2, 2009