Embed Size (px)
Citation preview

R e s u l t s - b a s e d P e r f o r m a nc e M a n a g e m e n t S y s t e m
Manual for Teachers and School Heads
Philippine National
RESEARCH CENTER FOR TEACHER QUALITY
The Results-based Performance Management System (RPMS) Manual for Teachers and School Heads was developed through the Philippine National Research Center for Teacher Quality (RCTQ) with support from the Australian Government through the Basic Education Sector Transformation (BEST) Program.
© Department of Education - Bureau of Human Resource and Organizational Development
ELECTRONIC SELF-ASSESSMENT TOOL (E-SAT)
MANUAL FOR ICT PERSONNEL, TEACHERS AND SCHOOL HEADS

T H E R P M S M A N UA L
2
> This page is intentionally left blank <

CONTENTST A B L E O F
Introduction 4 1.1 Self-Assessment Tools in the RPMS Cycle 4 1.2 What is the electronic Self-Assessment Tool (e-SAT)? 5 1.2 What are the parts of the e-SAT? 6
Guide for ICT Personnel 9 2.1 Howdoyouopenthee-SATfile? 10 2.2 How do you export the e-SAT data? 16 2.3 Howdoyoucollectthee-SATdatafrommultiplecomputers? 20 2.4 How do you import the e-SAT data? 23
Guide for Teachers 25
3.1 Why should you take the e-SAT? 26 3.2 How do you take the e-SAT? 26
Guide for School Heads 37 4.1 Why do you need the summary results of teachers’ data? 38 4.2 How do you generate summary results of teachers’ data? 39
1
2
3
4
TOOLS WITHIN THE RPMS CYCLE
3

T H E R P M S M A N UA L
4
The Self-Assessment Tool is a common tool for assessing teacher performance. It can be used as a starting point for informal purposes of self-reflection to clarify performance expectations and determine which competencies to focus on. It can also be used to monitor the progression or improvement of teacher competencies and validate if the interventions provided are effective. It can guide discussions about goal-setting and professional development needs.
1. Introduction
Figure 1.1. Self-assessment as a crucial step towards development planning
Performance Monitoring and Coaching
Self-Reflection
ActualPerformance
DevelopmentPlanning
Teachers should assess their own performance prior to the beginning of the year (Performance Planning and Commitment) and reflect on their performance throughout the RPMS Cycle. The results of the self-assessment will guide the Principal and the teacher on which RPMS indicators teachers must improve and on what areas they need coaching and mentoring.
1.1. Self-Assessment Tools in the RPMS Cycle
The Self-Assessment Tools-RPMS (SAT-RPMS) comprise two different self-assessment questionnaires within the RPMS designed for Teacher I-III and Master Teacher I-IV to reflect on the different performance indicators that relate to their professional work. It is meant to support teacher performance and professional development.
There are two SAT-RPMS: 1) SAT-RPMS for Teacher I-III; and 2) SAT-RPMS for Master Teacher I-IV.

TOOLS WITHIN THE RPMS CYCLE
5
The electronic Self-Assessment Tool (e-SAT) is an electronic version of the Self-Assessment Tool for RPMS. This e-SAT Guide is a supplemental material to the RPMS Manual that will guide:
1. ICT Personnel in a) preparing the e-SAT file; b) exporting data for collection; and c) importing data to generate summary results of teachers’ e-SAT data;
2. Teachers in accomplishing the e-SAT and printing their results for use in the preparation of their IPCRF-Development Plan; and
3. School Heads in extracting and analyzing the school-wide SAT data of teachers.
1.2. What is the electronic Self-Assessment Tool (e-SAT)?
Note that School Heads have access to the school-wide SAT data. The individual SAT data of a teacher can only be accessed by the concerned teacher.
The printout shall be given at once to the teacher andshallnotbefiledbytheICTCoordinatornorshallit be submitted to the Principal.
Teacher I, Teacher II and Teacher III shall use the SAT-RPMS for Teacher I-III while Master Teacher I, Master Teacher II, Master Teacher III and Master Teacher IV shall use the SAT-RPMS for Master I-IV.
There are 13 objectives in the SAT-RPMS, including the Plus Factor. These objectives are aligned with the objectives listed in the RPMS Tools.
T H E R P M S M A N UA L
6
Figure 1.2. Introduction page of the e-SAT survey
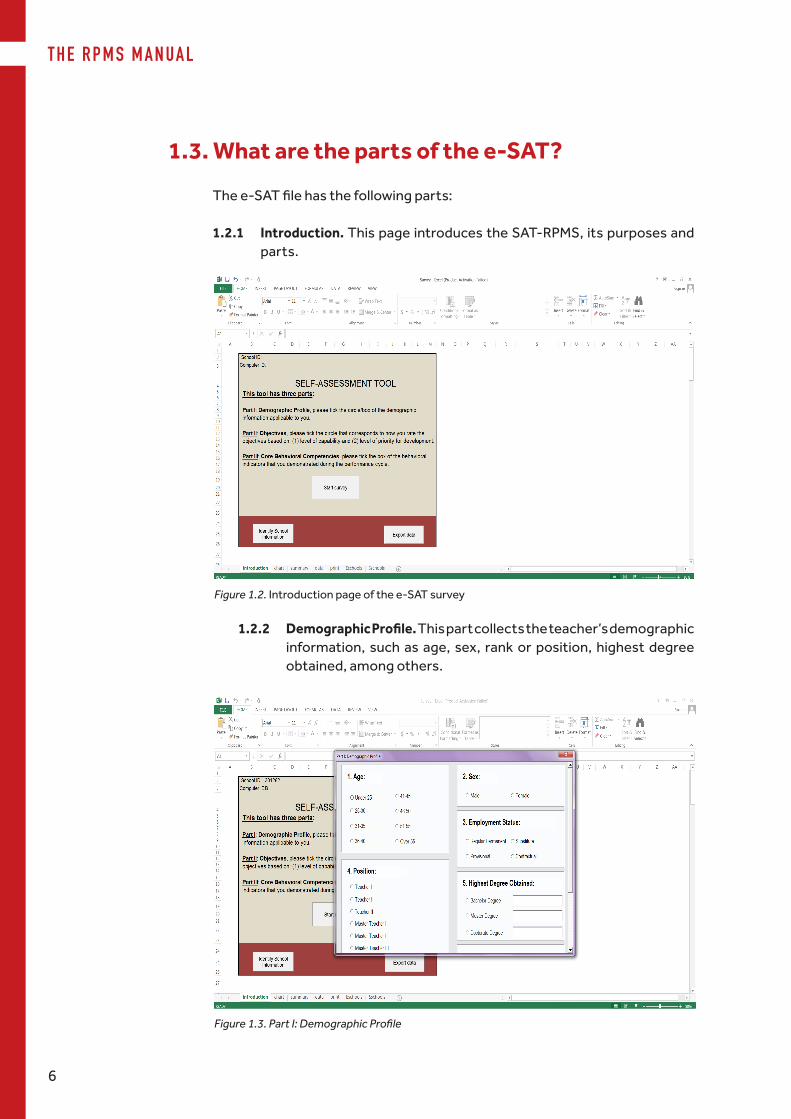
1.2.2 DemographicProfile.This part collects the teacher’s demographic information, such as age, sex, rank or position, highest degree obtained, among others.
Figure 1.3. Part I: Demographic Profile
1.3. What are the parts of the e-SAT?
Thee-SATfilehasthefollowingparts:
1.2.1 Introduction. This page introduces the SAT-RPMS, its purposes and parts.
TOOLS WITHIN THE RPMS CYCLE
7
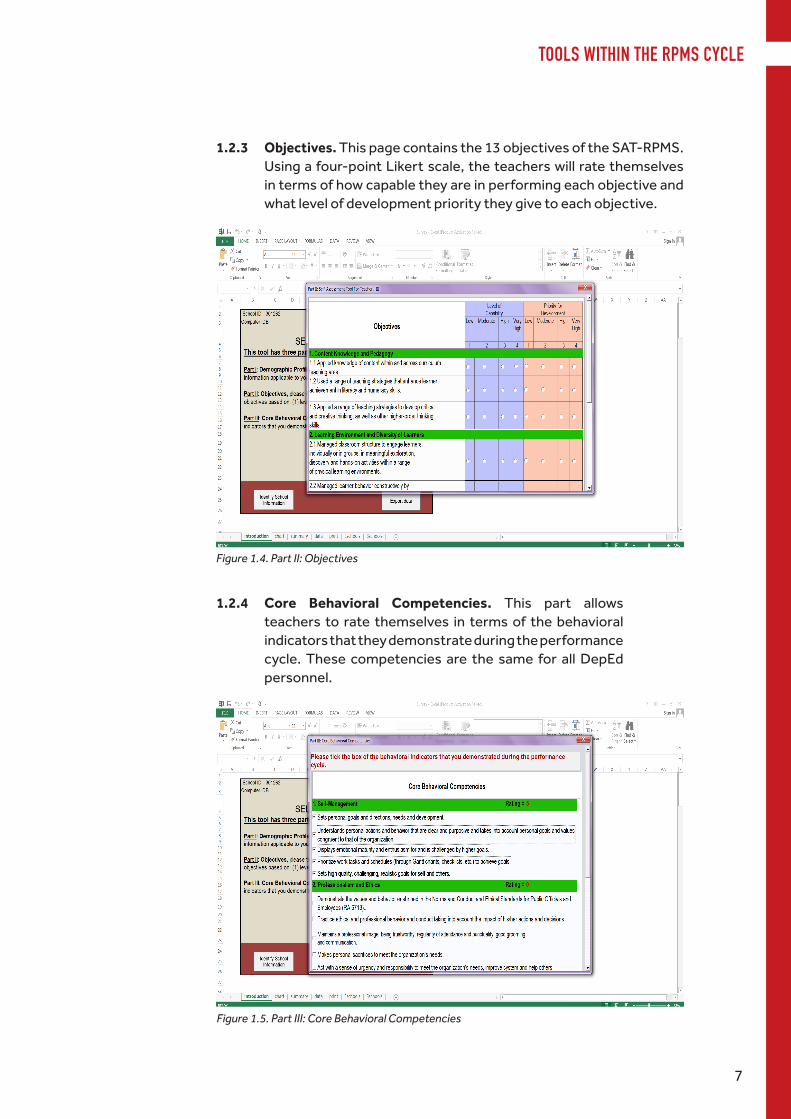
1.2.3 Objectives. This page contains the 13 objectives of the SAT-RPMS. Using a four-point Likert scale, the teachers will rate themselves in terms of how capable they are in performing each objective and what level of development priority they give to each objective.
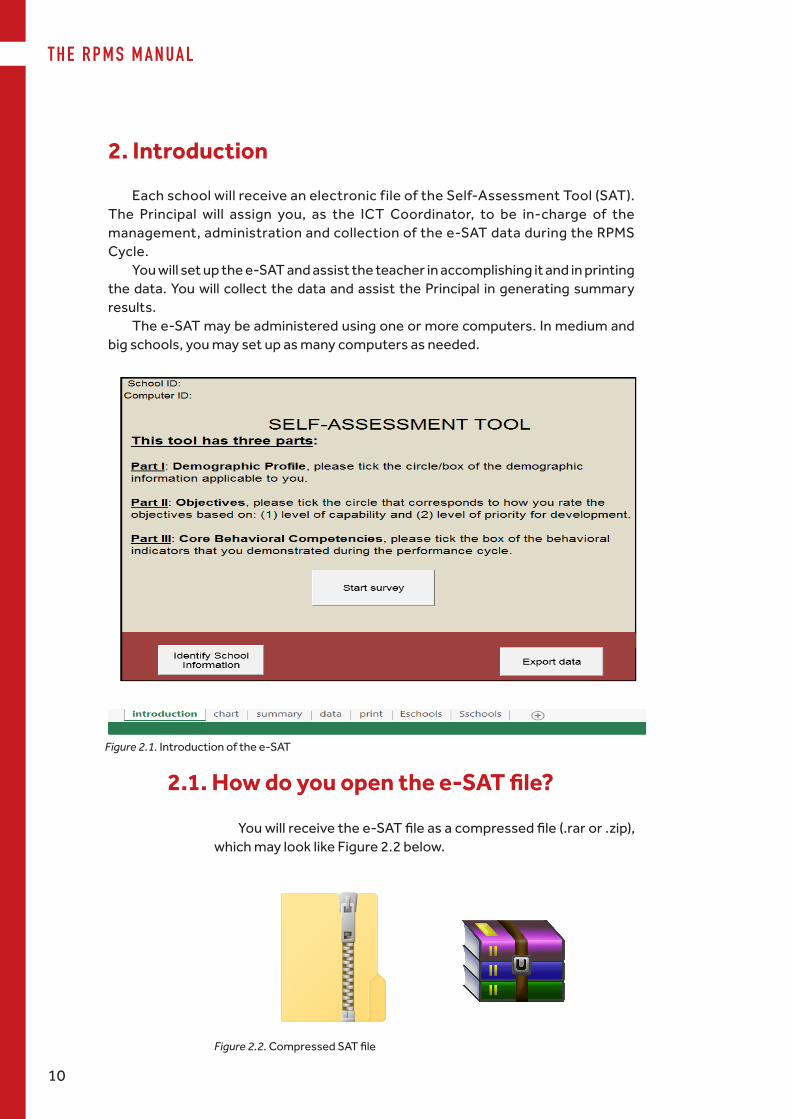
1.2.4 Core Behavioral Competencies. This part allows teachers to rate themselves in terms of the behavioral indicators that they demonstrate during the performance cycle. These competencies are the same for all DepEd personnel.
Figure 1.4. Part II: Objectives
Figure 1.5. Part III: Core Behavioral Competencies

T H E R P M S M A N UA L
8
> This page is intentionally left blank <

R e s u l t s - b a s e d P e r f o r m a nc e M a n a g e m e n t S y s t e m
Manual for Teachers and School Heads
Philippine National
RESEARCH CENTER FOR TEACHER QUALITY
The Results-based Performance Management System (RPMS) Manual for Teachers and School Heads was developed through the Philippine National Research Center for Teacher Quality (RCTQ) with support from the Australian Government through the Basic Education Sector Transformation (BEST) Program.
© Department of Education - Bureau of Human Resource and Organizational Development
GUIDE FOR ICT PERSONNEL
T H E R P M S M A N UA L
10
Figure 2.1. Introduction of the e-SAT
Each school will receive an electronic file of the Self-Assessment Tool (SAT). The Principal will assign you, as the ICT Coordinator, to be in-charge of the management, administration and collection of the e-SAT data during the RPMS Cycle.
You will set up the e-SAT and assist the teacher in accomplishing it and in printing the data. You will collect the data and assist the Principal in generating summary results.
The e-SAT may be administered using one or more computers. In medium and big schools, you may set up as many computers as needed.
Youwillreceivethee-SATfileasacompressedfile(.raror.zip),which may look like Figure 2.2 below.
2.1.Howdoyouopenthee-SATfile?
Figure 2.2.CompressedSATfile
2. Introduction
TOOLS WITHIN THE RPMS CYCLE
11
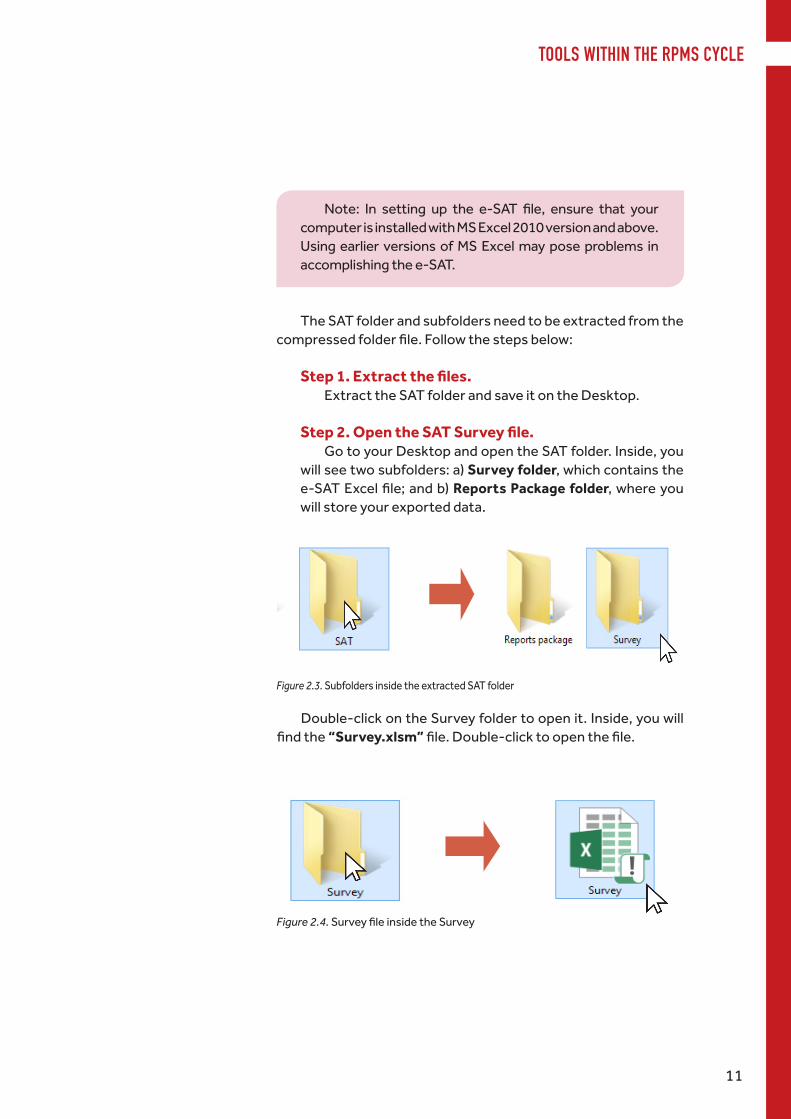
Note: In setting up the e-SAT file, ensure that yourcomputerisinstalledwithMSExcel2010versionandabove.Using earlier versions of MS Excel may pose problems in accomplishing the e-SAT.
The SAT folder and subfolders need to be extracted from the compressedfolderfile.Followthestepsbelow:
Step1.Extractthefiles. Extract the SAT folder and save it on the Desktop.
Step2.OpentheSATSurveyfile.Go to your Desktop and open the SAT folder. Inside, you
will see two subfolders: a) Survey folder, which contains the e-SATExcelfile;andb)Reports Package folder, where you will store your exported data.
Figure 2.3. Subfolders inside the extracted SAT folder
Double-click on the Survey folder to open it. Inside, you will findthe“Survey.xlsm”file.Double-clicktoopenthefile.
Figure 2.4.SurveyfileinsidetheSurvey
T H E R P M S M A N UA L
12
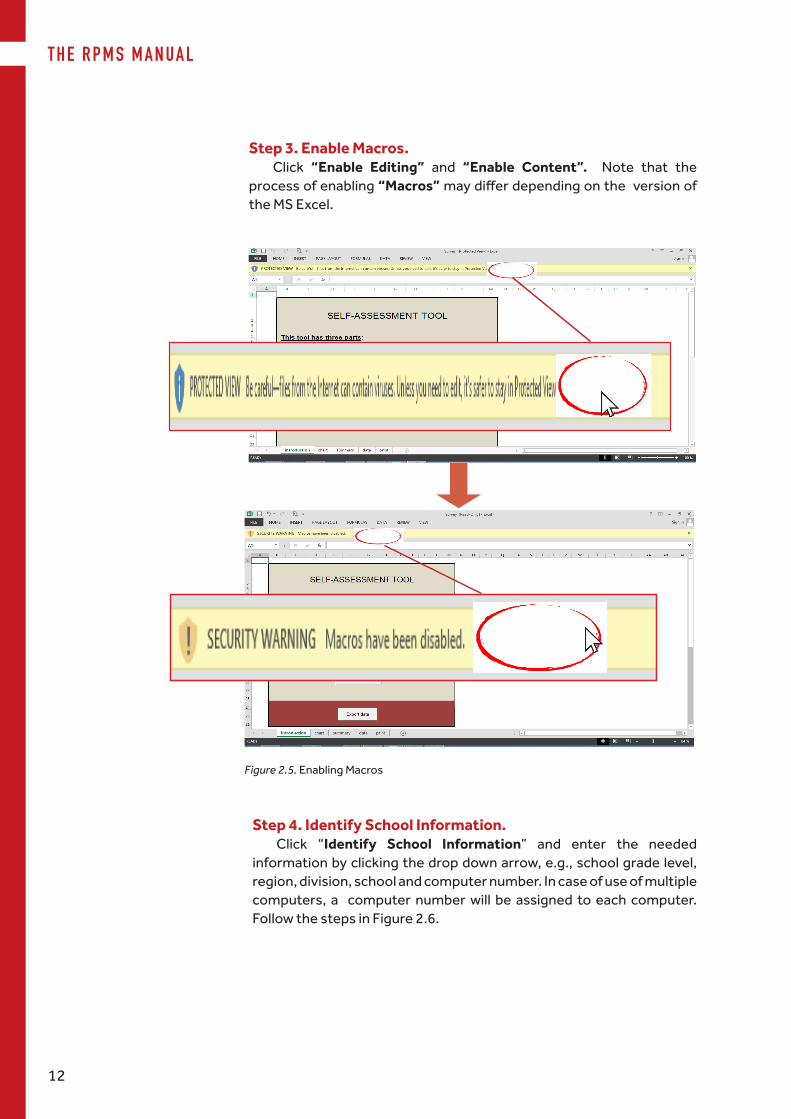
Step 3. Enable Macros. Click “Enable Editing” and “Enable Content”. Note that the
process of enabling “Macros”maydifferdependingontheversionofthe MS Excel.
Figure 2.5. Enabling Macros
Step 4. Identify School Information.Click “Identify School Information” and enter the needed
information by clicking the drop down arrow, e.g., school grade level, region, division, school and computer number. In case of use of multiple computers, a computer number will be assigned to each computer. Follow the steps in Figure 2.6.
i
iii
iv
TOOLS WITHIN THE RPMS CYCLE
13
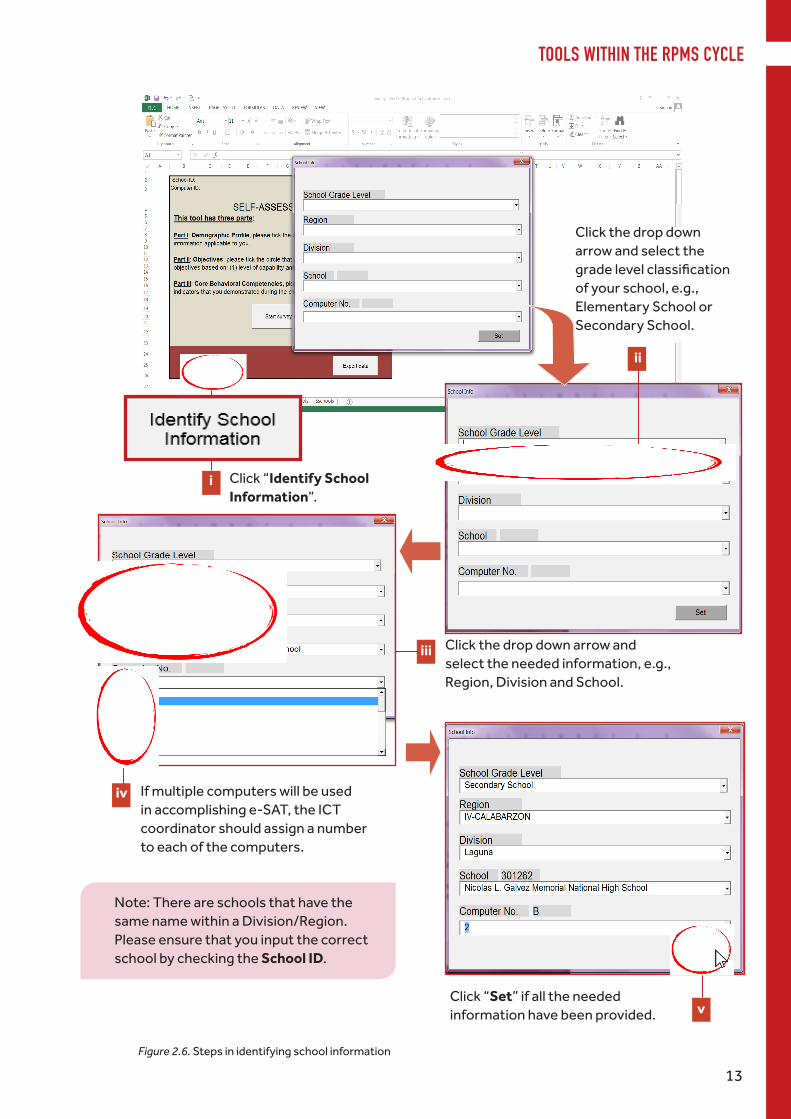
Figure 2.6. Steps in identifying school information
Click “Identify School Information”.
Click the drop down arrow and select the gradelevelclassificationof your school, e.g., Elementary School or Secondary School.
ii
Click the drop down arrow and select the needed information, e.g., Region, Division and School.
If multiple computers will be used in accomplishing e-SAT, the ICT coordinator should assign a number to each of the computers.
Click “Set” if all the needed information have been provided. v
Note: There are schools that have the same name within a Division/Region. Please ensure that you input the correct school by checking the School ID.

T H E R P M S M A N UA L
14
Figure 2.7.e-SAT’sintroductionpagewithidentifiedschoolIDandcomputerID
Note: At the end of the survey, the teacher will be provided with a unique code containing the school ID number and the letter corresponding to the number of the computer used.

TOOLS WITHIN THE RPMS CYCLE
15
Step 5. Set up the printer and connect to the Survey Excelfile.
Make sure that the computer is connected to a printer in your Excel. To do this:
1. Click “File”.2. Click “Print”.3. Set up “Printer” and manage “Printer Properties”. 4. Click to go back to the results window.
4
Figure 2.8. FileandPrintoptionsofthee-SATfile
3
1
2

T H E R P M S M A N UA L
16
Step 7. Assist the teachers in printing their SAT results.
Figure 2.9. Exporting teachers’ e-SAT data
When all teachers have completed the e-SAT survey, you can now export and collect the e-SAT data.
2.2. How do you export the e-SAT data?
Step 1. Click “Export Data”.
Step 2. Enter “2018IT” as your password.
Step 3. Click “Export”.
1
Step 6. Let the teachers take the e-SAT survey.Teachers can now answer the e-SAT survey.
3
2

TOOLS WITHIN THE RPMS CYCLE
17
Step4.Save(databaseXXXX)fileinyourexternalstorage.Click “OK” on the dialog box and follow the destination path
shown below and illustrated in Figure 2.11:
Figure 2.10.AdialogboxSaving(database4444)file

T H E R P M S M A N UA L
18
Figure 2.11.DestinationpathoftheSATdatabasefile
12
5
1) Desktop > 2) SAT > 3) Reports Package > 4) databases > 5) Click “Save”
3
4

TOOLS WITHIN THE RPMS CYCLE
19
Figure 2.12. A dialog box indicating that the data has been exported
A prompt will pop up to notify you that the data has been exported into the destination path.

T H E R P M S M A N UA L
20
The e-SAT may be administered using one or more computers, depending on the number of teachers in a school. In the case of medium and big schools, you may set up several computers so teachers can accomplish their e-SAT simultaneously. Hence, thereisaneedtocollectdatabasefilesfromdifferentcomputersand store or save them in a “mother” computer.
2.3. How do you collect the e-SAT data from multiple computers?
Step 1. SavetheSATfolderfileontheDesktopofthecomputer(s) that you will use during the administration of the e-SAT.
Step 2. Let the teachers take the e-SAT survey.
Step 3. Export the e-SAT data once all teachers have completed the survey.
Step4.Collectthedatabasefilesfromthecomputers.On the Desktop of the computer, do the following:
1. Open the SAT folder.2. Open the “Reports Package“ subfolder.3. Open the “databases” folder.4. Copy the “databaseXXXX”fileandpasteitinan
external location, e.g., USB drive.

TOOLS WITHIN THE RPMS CYCLE
21
1 2
3
Figure 2.13.CopyingthedatabaseXXXXfilefromthecomputers(1)
Figure 2.14.CopyingthedatabaseXXXXfilefromthecomputers(2)
4

T H E R P M S M A N UA L
22
Step 5. Go to your designated “mother” computer and do the following:
1. Open the SAT folder, the “Reports Package” folder and the “databases” folder.
2. Paste the“databaseXXXX”filesthatyoucollected from the computers on the “databases” folder.
1
2
Figure 2.15. Saving/pasting collected teachers’ databases in the mother computer

TOOLS WITHIN THE RPMS CYCLE
23
2.4. How do you import the e-SAT data?
Figure 2.17. Enabling Macros
Step1.OpentheSummaryReportsExcelfile.Toopenthefile:
1. Open the SAT folder, then the “Reports Package” folder.
2. Open the the “Summary Reports.xlsm” file.
1
2
Step 2. Enable Macros.
Figure 2.16. OpeningtheSummaryReportsExcelfile
Import the data that you collected and assist the Principal in generating the summary results of the school-wide SAT data. You may do the following:
You are now ready to import the databases and generate the summary results of teachers’ e-SAT data.

T H E R P M S M A N UA L
24
Figure 2.18. Importing data
Step 3. Import data. Click “Import data”. A dialogue window will prompt you to
overwrite the old data. Click “Yes” to continue.
Note that it may take several minutes for the system to import the databases. Another prompt will pop up to indicate that the data has been uploaded. Click “OK” to continue.
Figure 2.19. A prompt indicating that the data has been uploaded
You can now assist the Principal in the generation of summaryresultsondemographicprofile,corebehavioralcompetencies and assessment results of teachers and Master Teachers.

R e s u l t s - b a s e d P e r f o r m a nc e M a n a g e m e n t S y s t e m
Manual for Teachers and School Heads
Philippine National
RESEARCH CENTER FOR TEACHER QUALITY
The Results-based Performance Management System (RPMS) Manual for Teachers and School Heads was developed through the Philippine National Research Center for Teacher Quality (RCTQ) with support from the Australian Government through the Basic Education Sector Transformation (BEST) Program.
© Department of Education - Bureau of Human Resource and Organizational Development
GUIDE FOR TEACHERS

T H E R P M S M A N UA L
26
Figure 3.1. Participant Consent Form
3.1 Why should you take the e-SAT?
Step 1. Accomplish the Participant Consent Form. 1. Click “Start Survey” to begin. 2. Accomplish the Participant Consent Form by clicking
“I Consent” or “I Do Not Consent”.
The e-SAT Manual guides you, teachers, in accomplishing the e-SAT and printing your results for use in the preparation of your IPCRF-Development Plan.
3. Introduction
The e-SAT is a self-assessment tool that helps you toreflectonthedifferentobjectivesrelatedtoyourprofessionalwork. The results of the self-assessment will guide you on which RPMS indicators you must improve and on what areas where you need coaching and mentoring.
3.2 How do you take the e-SAT?
The following steps should be done to accomplish the e-SAT:
1

TOOLS WITHIN THE RPMS CYCLE
27
Step2.AccomplishPartI:DemographicProfile.1. Tick the circle of the demographic information applicable
to you. 2. Scroll down to see and answer the rest of the items on
the page. 3. Click “Next” to proceed to the next page.
Note that in some items, you can tick more than one boxes. Do not forget to tick the circle beside the “Highest Degree Obtained” and type your degree.
You can also go back to the previous page by clicking “Previous”.
Figure 3.2.PartI:DemographicProfile
If you click “I Do Not Consent,” you will be brought back to the Introduction page and will not be able to complete the e-SAT. If you click “I Consent,” you will be redirected to the next page.
1
2
3

T H E R P M S M A N UA L
28
Figure 3.4.Page2ofDemographicProfile
Note that in some items, e.g., Area of Specialization, Subject(s) Taught, Grade Level Taught, you can tick more than one box.
You can also go back to the previous page by clicking “Previous”.
Figure 3.3. Page2ofDemographicProfile

TOOLS WITHIN THE RPMS CYCLE
29
Figure 3.5. e-SAT Objectives for Teacher I-III
Step 3. Answer the e-SAT Objectives appropriate to your position.
Tick the circle that corresponds to how you rate the objectives based on a) level of capability and b) level of priority for development.
Please answer the e-SAT objectives honestly.
T H E R P M S M A N UA L
30
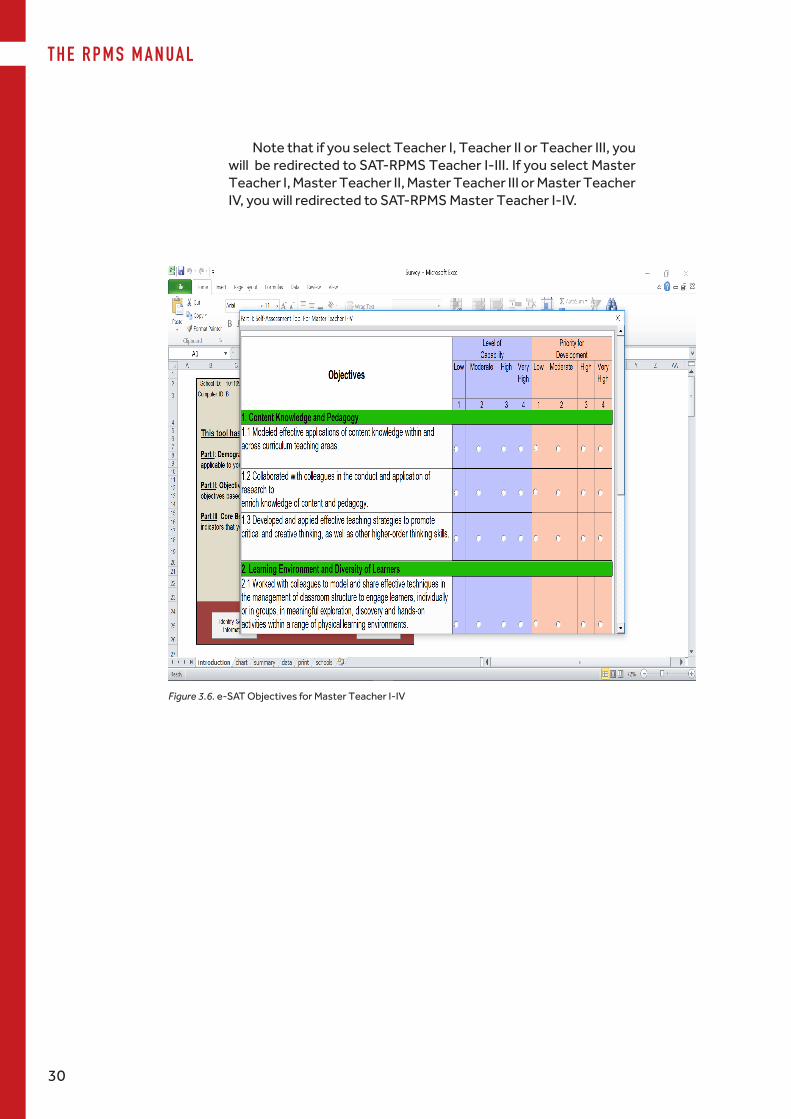
Figure 3.6. e-SAT Objectives for Master Teacher I-IV
Note that if you select Teacher I, Teacher II or Teacher III, you will be redirected to SAT-RPMS Teacher I-III. If you select Master Teacher I, Master Teacher II, Master Teacher III or Master Teacher IV, you will redirected to SAT-RPMS Master Teacher I-IV.

TOOLS WITHIN THE RPMS CYCLE
31
Note: Once you click the “Submit” button, youcan no longer go back to previous pages to change youranswers. Please review your responses by clicking the“Previous” button.
Step 4. Answer the Core Behavioral Competencies. Tick the box of the behavioral indicators that you demonstrated
during the performance cycle.
Click “Submit” when you are done.
Figure 3.7. Core Behavioral Competencies

T H E R P M S M A N UA L
32
Step 5. View your assessment. A dialog box will pop up, informing you that your assessment
has been stored. Click “OK”.
You can now view the assessment charts of your level of capability (blue bar) and level of priority (red bar), as well as your rating for your core behavioral competencies. See Figure 3.9.
Figure 3.8. A dialog box indicating that the assessment has been stored

TOOLS WITHIN THE RPMS CYCLE
33
Figure 3.9. Summary charts of teachers’ individual e-SAT data
T H E R P M S M A N UA L
34
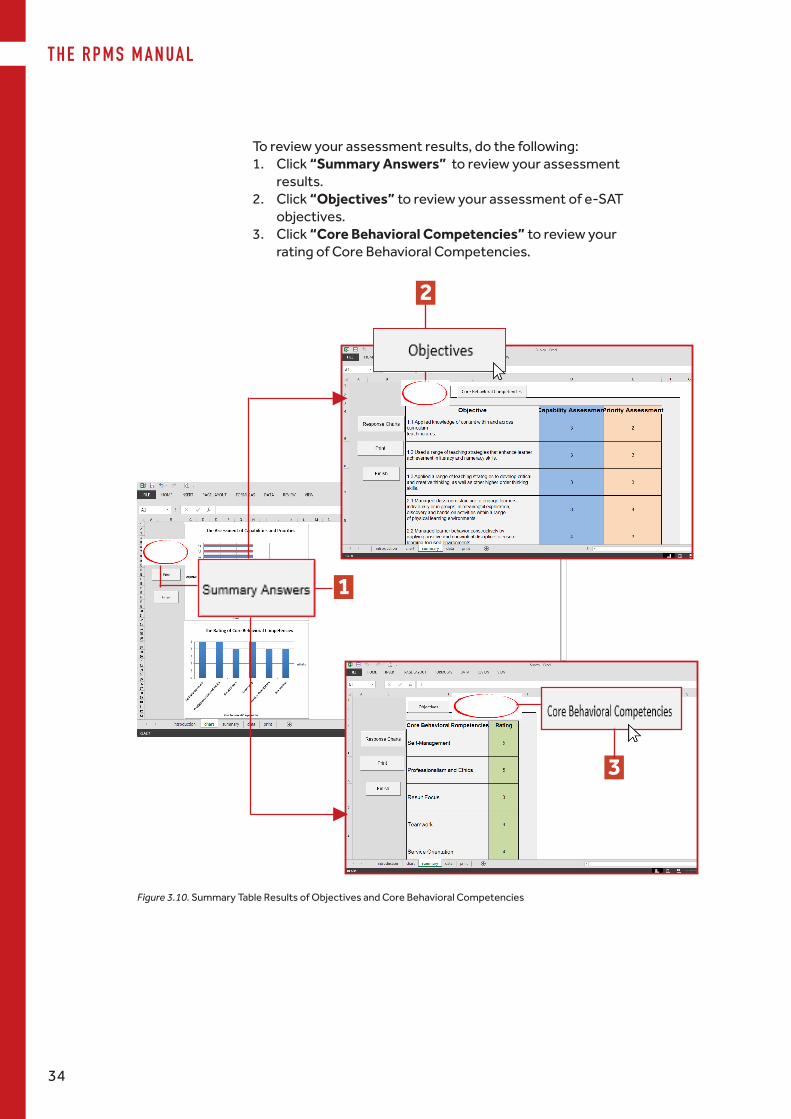
To review your assessment results, do the following: 1. Click “Summary Answers” to review your assessment
results.2. Click “Objectives” to review your assessment of e-SAT
objectives. 3. Click “Core Behavioral Competencies” to review your
rating of Core Behavioral Competencies.
3
1
2
Figure 3.10. Summary Table Results of Objectives and Core Behavioral Competencies

TOOLS WITHIN THE RPMS CYCLE
35
Step 6. Print your data. Print your SAT data by clicking the “Print” button.
Note: The ICT personnel should ensure that the computer is connected to the printer using the File and Print Options in Ms Excel. See Figure 2.8 on page 15 of this Manual.
Figure 3.11. Printoptionofthee-SATfile
Step 7. Click “Finish” to protect your data. Once you have printed your SAT data, click “Finish” to protect
your data.
The printouts contain a unique code that you need to sign in to the survey in the future. You must keep record of the code.
Figure 3.12. Storing/protecting e-SAT data

T H E R P M S M A N UA L
36
You will be brought back to the Introduction page. This means that your data has automatically been stored.
The next teacher-respondent may now accomplish the e-SAT survey, following Steps 1-7.
Figure 3.13. Storing/protecting e-SAT data

R e s u l t s - b a s e d P e r f o r m a nc e M a n a g e m e n t S y s t e m
Manual for Teachers and School Heads
Philippine National
RESEARCH CENTER FOR TEACHER QUALITY
The Results-based Performance Management System (RPMS) Manual for Teachers and School Heads was developed through the Philippine National Research Center for Teacher Quality (RCTQ) with support from the Australian Government through the Basic Education Sector Transformation (BEST) Program.
© Department of Education - Bureau of Human Resource and Organizational Development
GUIDE FOR SCHOOL HEADS

T H E R P M S M A N UA L
38
The e-SAT Manual guides you, the Principal, in extracting and analyzing the school-wide SAT data of teachers.
4. Introduction
4.1. Why do you need the summary results of teachers’ data?
The summary results of teachers’ data can provide you an overall picture of your teachers’ strengths and needs. This can help you prepare the school development plans (e.g., Annual Improvement Plan, School Improvement Plan) and other various development interventions, such as In-Service Training (INSET) Orientation/Teacher Induction Program (TIP), in preparation for the next school year.
The following data can be generated from the e-SAT: • Summaryofteachers’demographicprofile• Summary of teachers’ rating of core behavioral
competencies• Summary of Teachers’ and Master Teachers’ self-
assessment rating
Figure 4.1. Introduction page of the Summary Reports File

TOOLS WITHIN THE RPMS CYCLE
39
Step1.OpentheSummaryReportsExcelfile.Toopenthefile:
1. Open the SAT folder, then the “Reports Package” folder.
2. Open the “Summary Reports.xlsm” file.3. Enable Macros.
1
3
Figure 4.2. Importing data
2
Step 2. Import data. Follow the steps on “2.4 How do you import the e-SAT data?” found in pages 23-24.
To generate the school-wide SAT data, ask the assistance of the ICT coordinator and do the following:
4.2. How do you generate summary results of teachers’ data?

T H E R P M S M A N UA L
40
Figure 4.3.SummaryTableandChartsofDemographicProfile
Step 3. Generate summary results of teachers’ e-SAT data.
Click on the appropriate button to generate summary table or charts of results that you need to plan for teachers’ professional development.
1. Demographic Summary Results. Tables of summary results of teachers’ demographic information can be generated by clicking “Demographic Summary”. Demographic charts can also be generated if you click “Demographic Charts”.
Click “Back to Introduction” to go back to the Introduction page.

TOOLS WITHIN THE RPMS CYCLE
41
Figure 4.4. Summary Charts of Core Behavioral Competencies
2. Summary of Core Behavioral Competencies. Click “Summary of Core Behavioral Competencies” to generate summary tables of teachers’ rating of core behavioral competencies. Charts may also be generated if you click “Charts of Core Behavioral Competencies”.

T H E R P M S M A N UA L
42
3. Teachers I-III and Master Teachers Summary. The tables and charts of summary results of Teacher I-III’s and Master Teachers’ assessment can also be generated through the e-SAT.
Click “Teachers I-III Summary” or “Master Teachers Summary” to see summary table of frequency distribution of responses per objective of teachers and Master Teachers.
In the summary table, you can see the: 1. Total number of responses;2. Total number of responses per scale per
indicator; and3. Chart per objective
Figure 4.5. Introduction page highlighting Teachers I-III Summary and Master Teachers Summary buttons

TOOLS WITHIN THE RPMS CYCLE
43
3
Figure 4.6. Sample Summary Table of Teachers’ I-III e-SAT results
Figure 4.7. Chart of Objective 2.3
2
1

T H E R P M S M A N UA L
44
Click “Summary Charts” to see charts showing teachers’ responses for each objective in terms of a) level of capability; and b) level of priority for development.
Figure 4.8. Sample Summary Charts of school-wide Teachers’ I-III assessment data
TOOLS WITHIN THE RPMS CYCLE
45
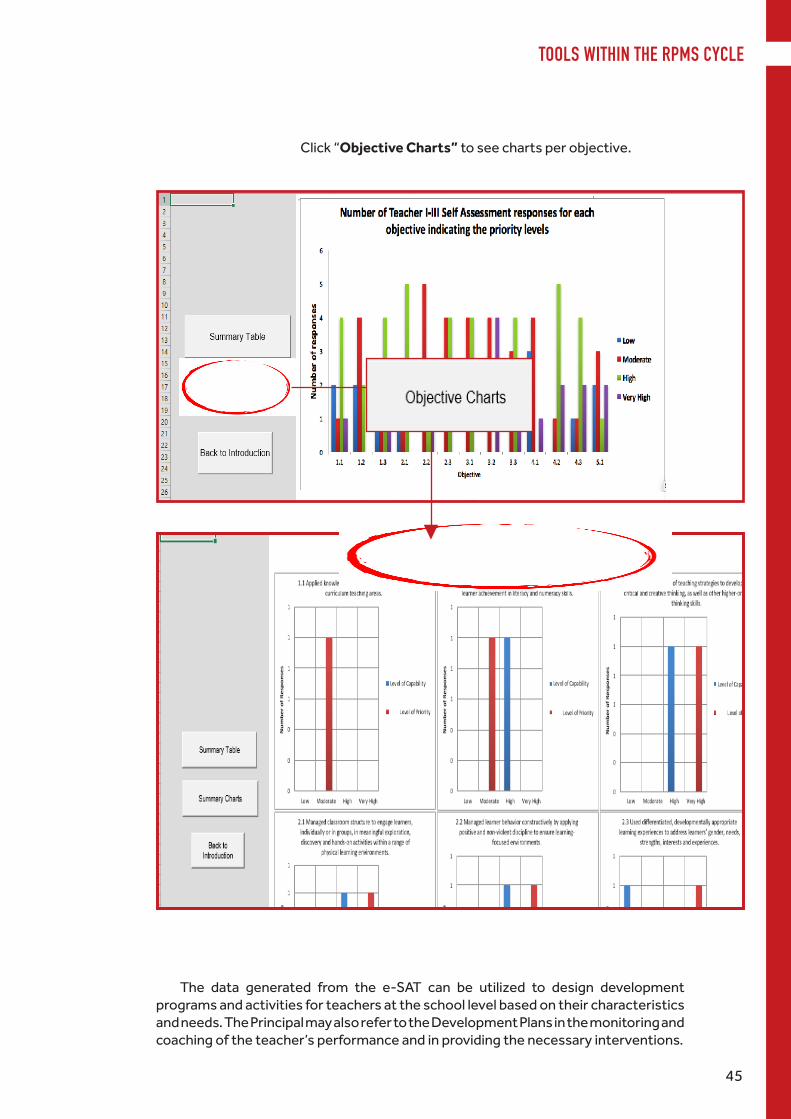
The data generated from the e-SAT can be utilized to design development programs and activities for teachers at the school level based on their characteristics and needs. The Principal may also refer to the Development Plans in the monitoring and coaching of the teacher’s performance and in providing the necessary interventions.
Figure 4.8. Charts of school-wide Teachers I-III and Master Teachers’ assessment data per objective
Click “Objective Charts” to see charts per objective.

T H E R P M S M A N UA L
46