Embed Size (px)
Citation preview
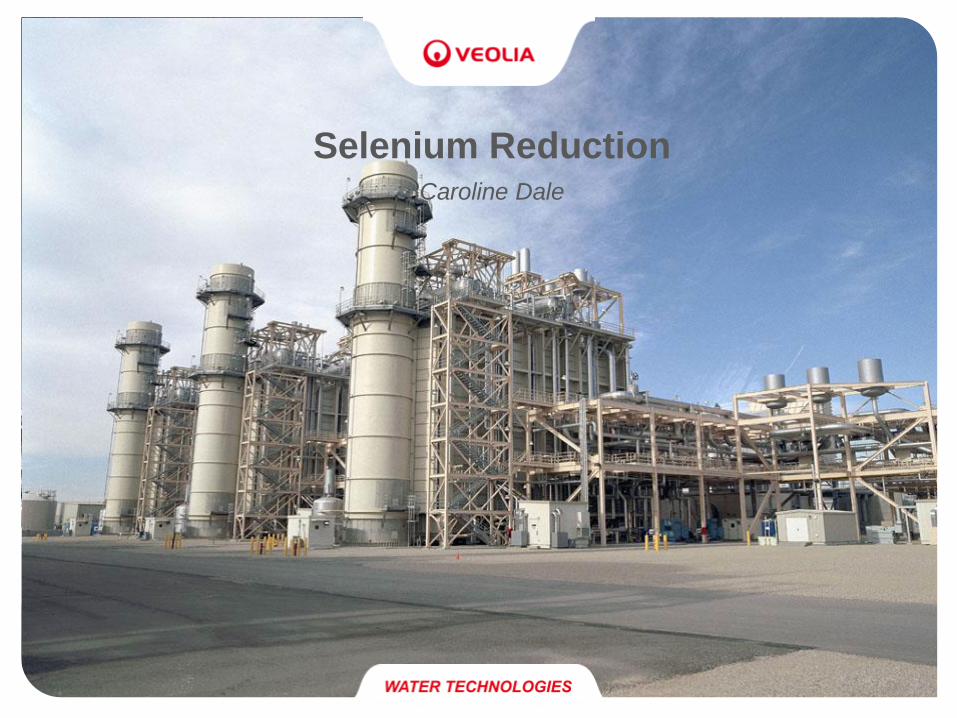
Selenium ReductionCaroline Dale
>
Contents
2
Biological Selenium Reduction
The MBBR technology
Operating Experience
SeleniumZero
Conclusions
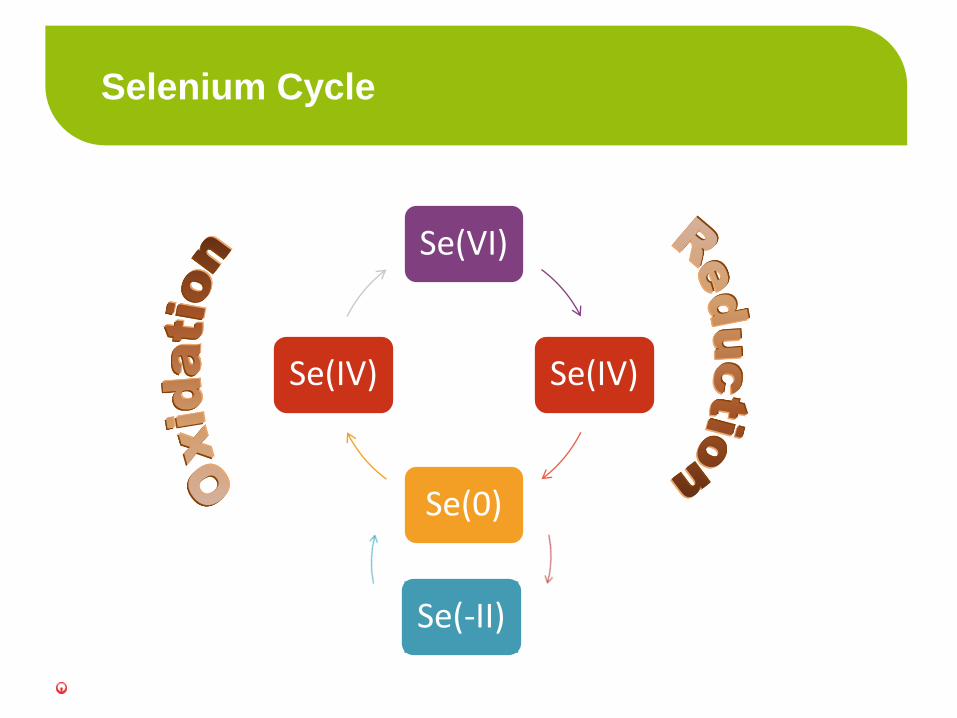
Selenium Cycle
Se(VI)
Se(IV)
Se(0)
Se(IV)
Se(-II)

o Selenium mainly present as :
o Selenate (SeO42-) can be as high as 10 mg/l
o Selenite (SeO32-)
o but also SeCN
o Organic complex?
4
Selenium is present in coal , hence FGD effluent

Biological Reduction of Selenium :Quick Review
Se
Selenate and selenite reduction
under anoxic conditionsSeO4
2- SeO32-
N2NO2
-
Denitrification
under anoxic conditions
NO3-
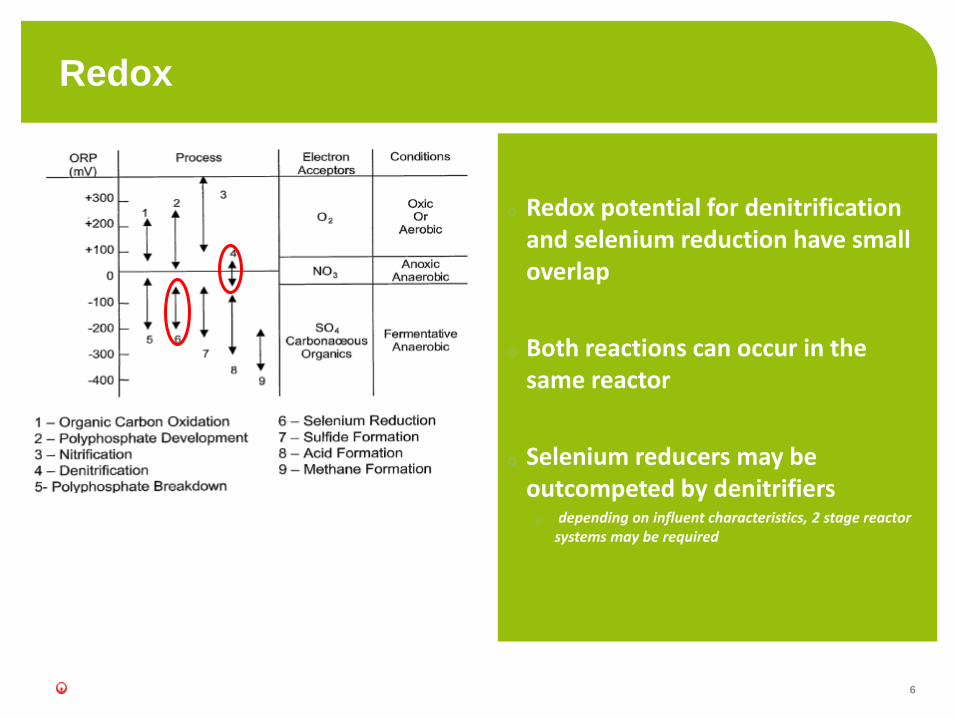
o Redox potential for denitrificationand selenium reduction have small overlap
o Both reactions can occur in the same reactor
o Selenium reducers may be outcompeted by denitrifierso depending on influent characteristics, 2 stage reactor
systems may be required
Redox
6
Providing the right environment….
o Energy gained from respiration of Se compounds is approx ½ of what can be gained from using dissolved oxygen
o Selenium reducers have lower growth rates than other heterotrophs
o Fixed film processes for Se reduction have been the most successful
7
The MBBR process
8
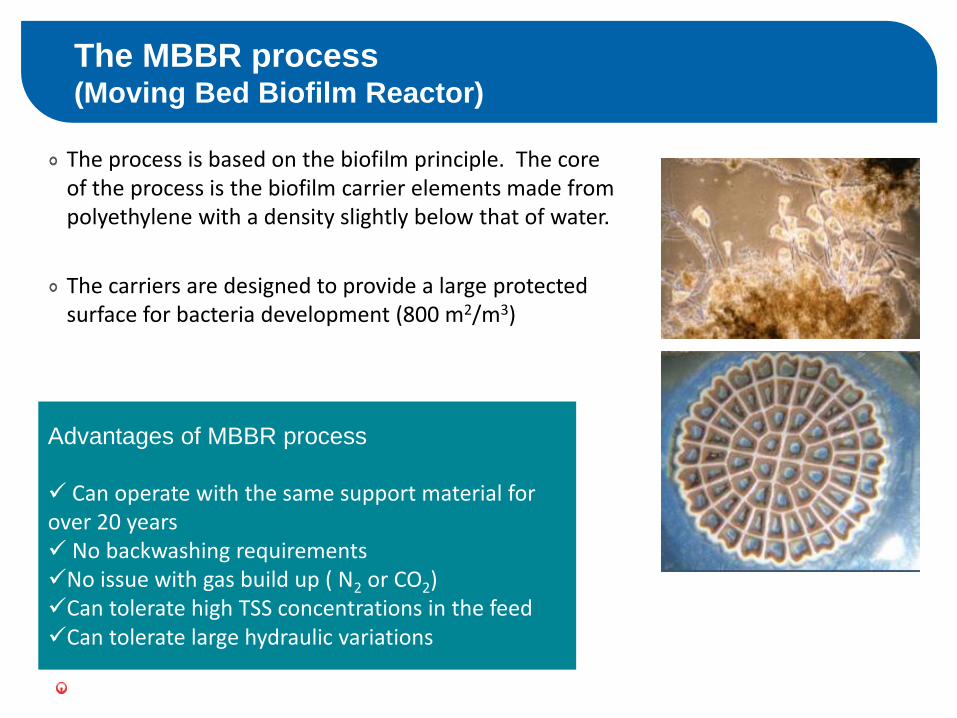
The process is based on the biofilm principle. The core of the process is the biofilm carrier elements made frompolyethylene with a density slightly below that of water.
The carriers are designed to provide a large protected surface for bacteria development (800 m2/m3)
The MBBR process(Moving Bed Biofilm Reactor)
Advantages of MBBR process
Can operate with the same support material for over 20 years No backwashing requirements No issue with gas build up ( N2 or CO2)Can tolerate high TSS concentrations in the feed Can tolerate large hydraulic variations
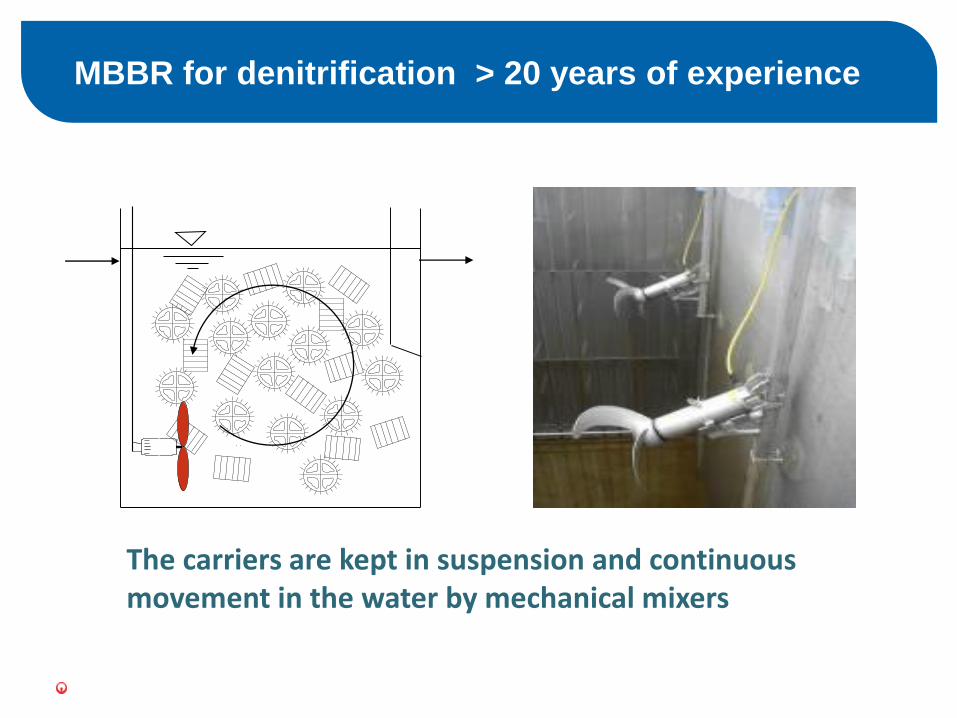
MBBR for denitrification > 20 years of experience
The carriers are kept in suspension and continuous movement in the water by mechanical mixers
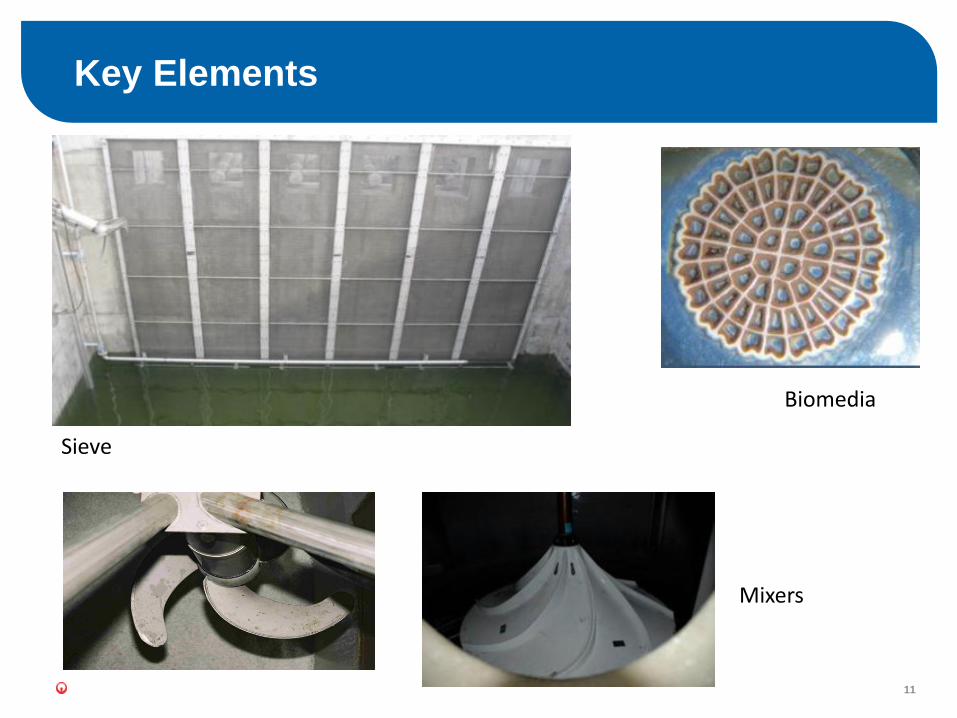
Key Elements
11
Biomedia
Sieve
Mixers
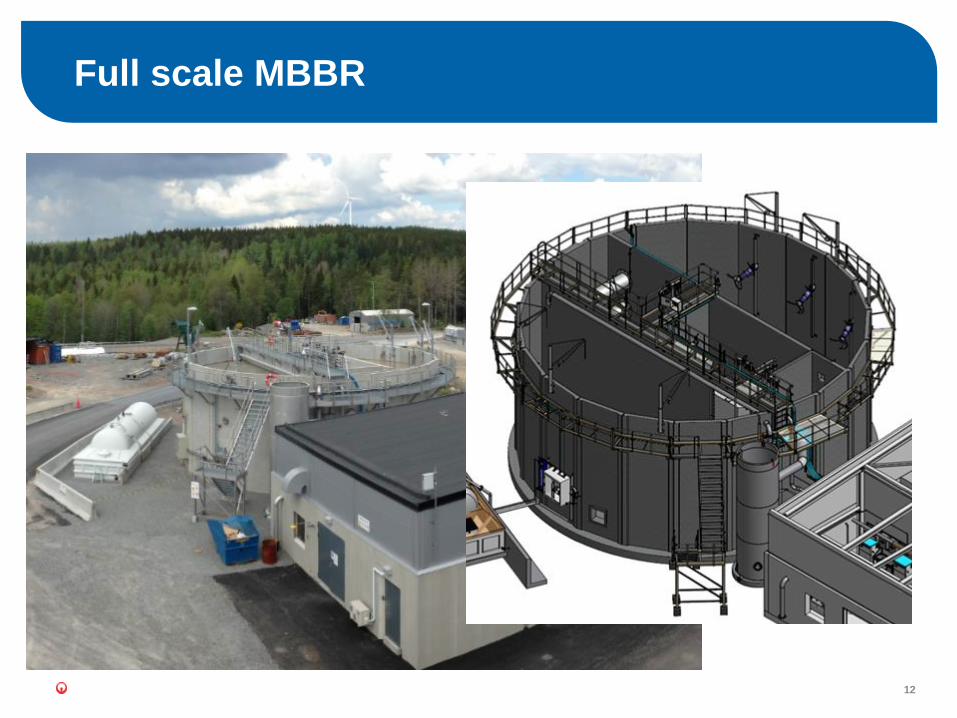
Full scale MBBR
12
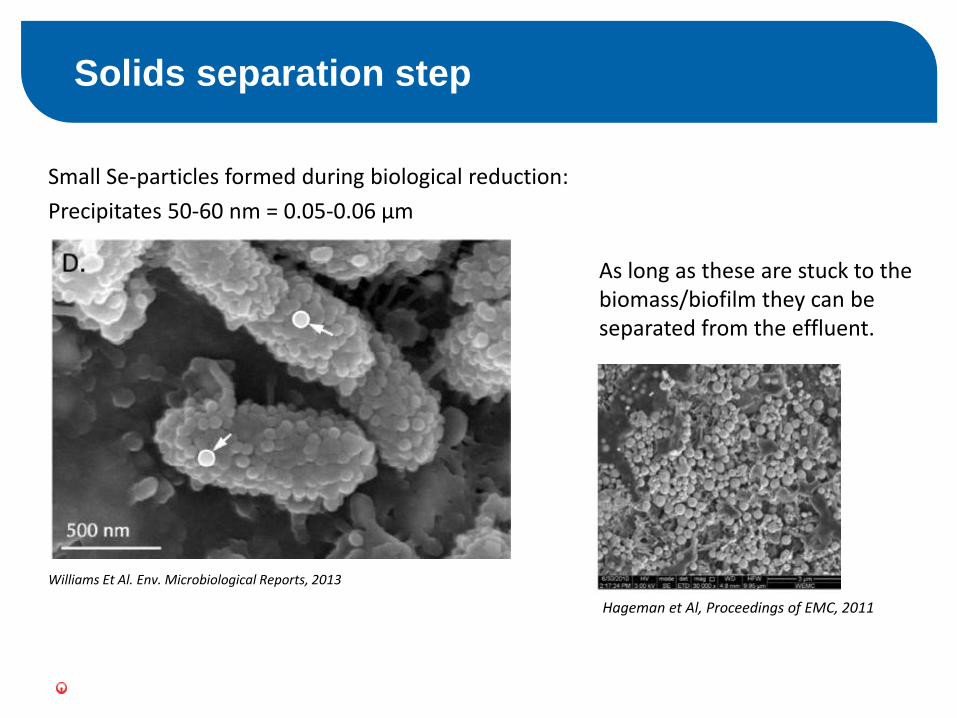
Small Se-particles formed during biological reduction:
Precipitates 50-60 nm = 0.05-0.06 µm
Solids separation step
Williams Et Al. Env. Microbiological Reports, 2013
As long as these are stuck to the biomass/biofilm they can be separated from the effluent.
Hageman et Al, Proceedings of EMC, 2011
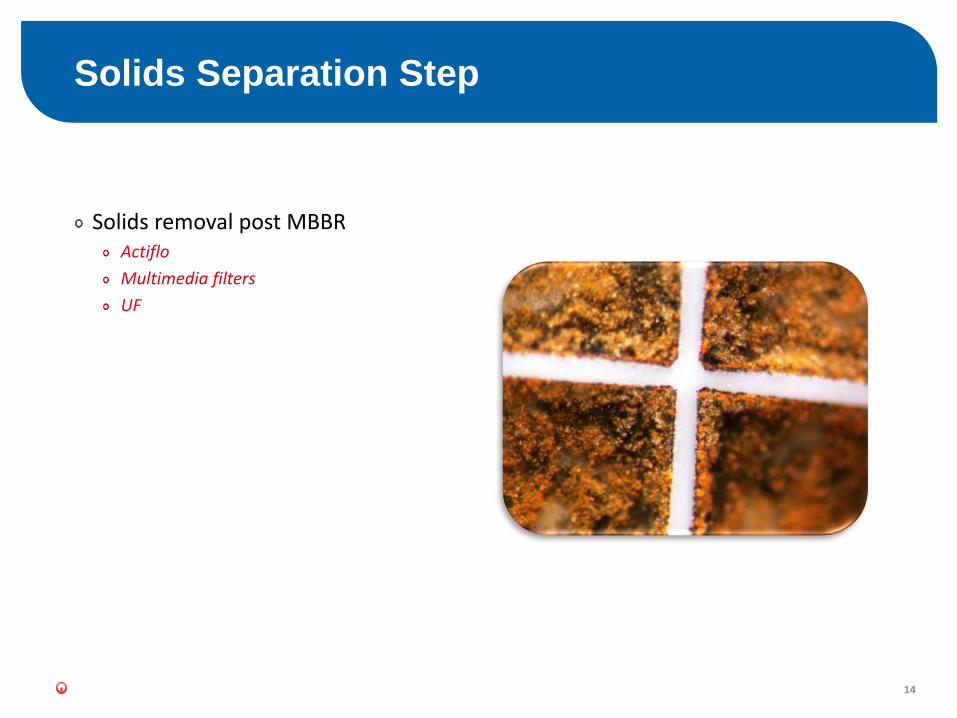
Solids removal post MBBRActiflo
Multimedia filters
UF
Solids Separation Step
14

Process configuration
15
First StageDenitrification
Partial Se reduction
Second StageSe reduction
Solids separation step
Operating experience treating
FGD effluent
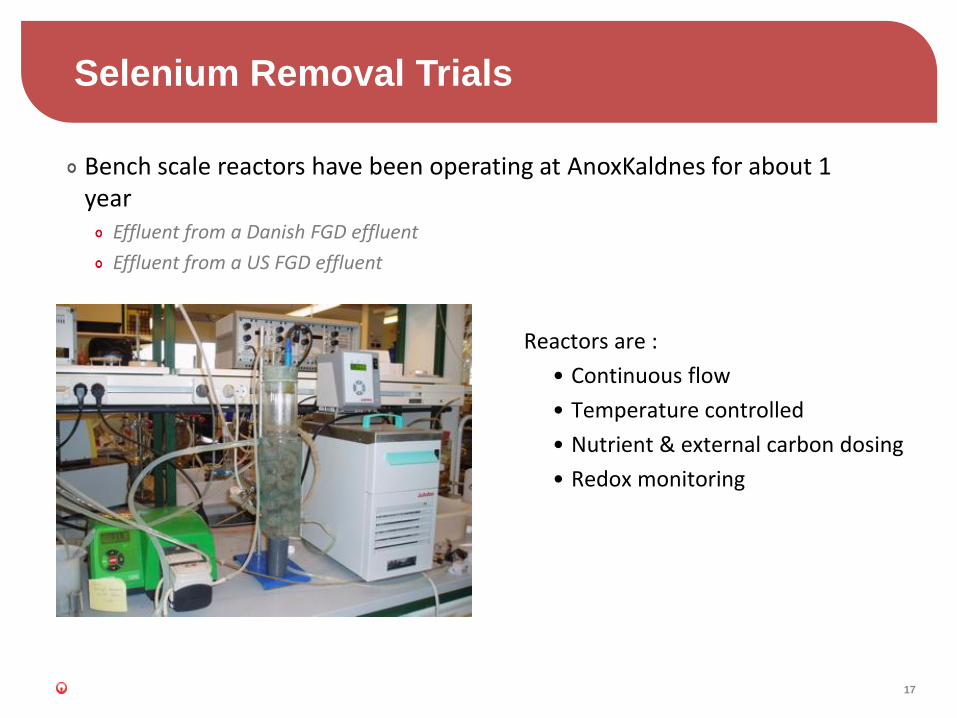
Bench scale reactors have been operating at AnoxKaldnes for about 1 year
Effluent from a Danish FGD effluent
Effluent from a US FGD effluent
Selenium Removal Trials
17
Reactors are :
• Continuous flow
• Temperature controlled
• Nutrient & external carbon dosing
• Redox monitoring
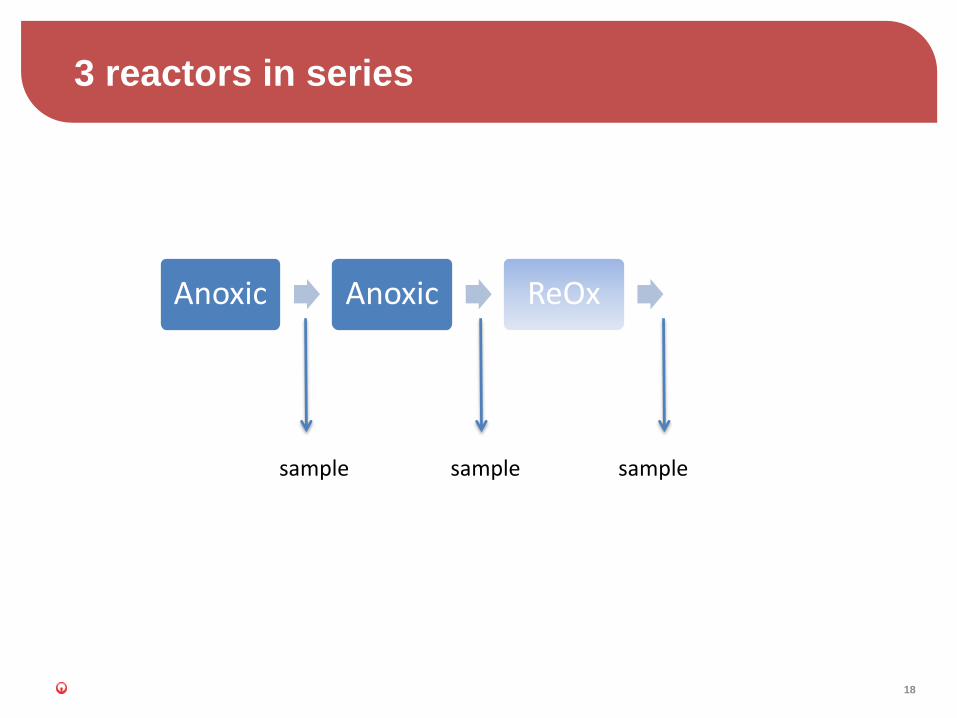
3 reactors in series
18
Anoxic Anoxic ReOx
sample samplesample
Selenium Analyses
19
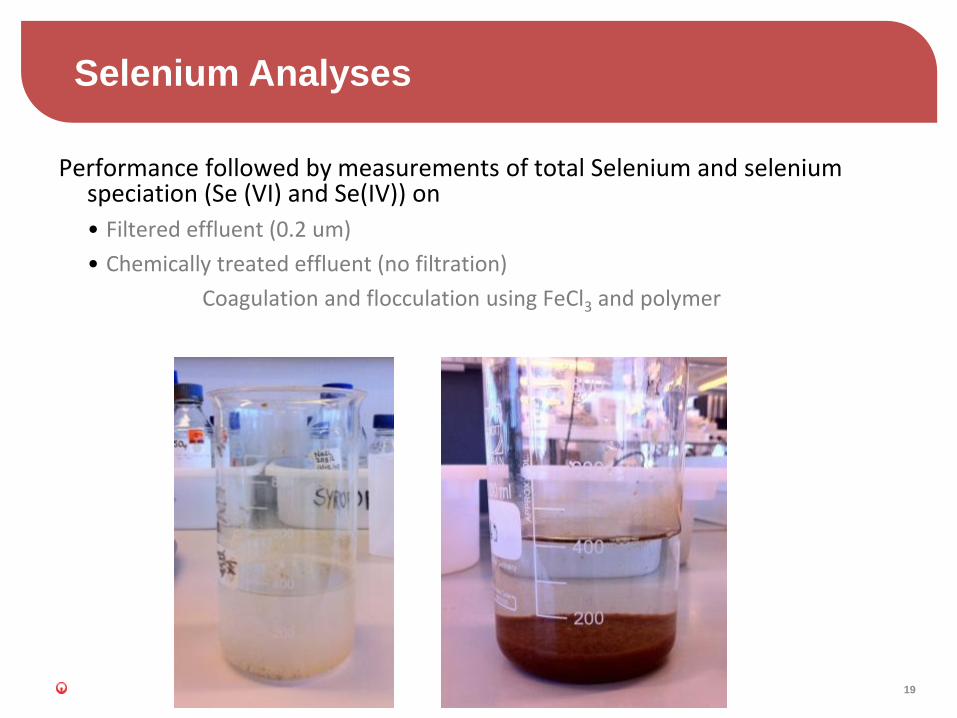
Performance followed by measurements of total Selenium and selenium speciation (Se (VI) and Se(IV)) on
• Filtered effluent (0.2 um)
• Chemically treated effluent (no filtration)
Coagulation and flocculation using FeCl3 and polymer

Total selenium using ICP-MS/AES
Selenium speciation of selenite (Se4+) and selenate (Se6+) done occasionally using HPLC-ICP/MS
Characteristics of studied wastewaters:
Methods
Parameter FGDEffluent 1
FGDEffluent 2
Selenate (µg/l)Selenite (µg/l)
311*<10
12957
Total Selenium (µg/l) 340 197SCOD (mg/l) 142 80NO3-N (mg/l) 80 35NO2-N (mg/l) 0.7 2.4Sulphate (mg/l) 4000 8500Chloride (mg/l) 4000 1600PO4-P (mg/l) 0.1 0.03NH4-N (mg/l) 3.3 0.8
NH4 and PO4
added
*Batch 3 of this effluent contained 4100 µg/l
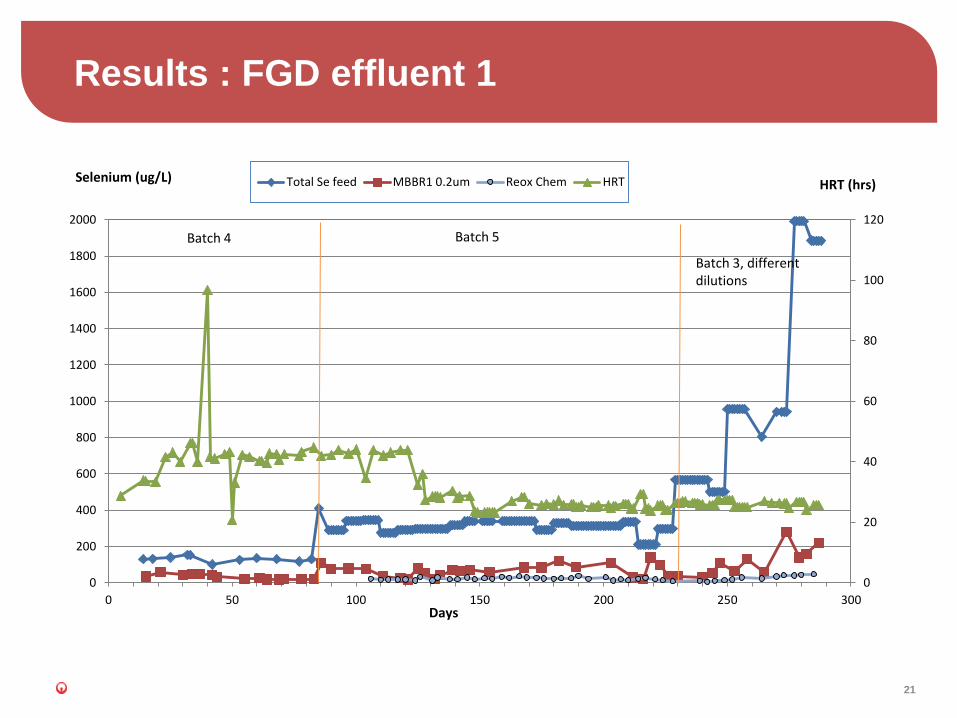
Results : FGD effluent 1
21
0
20
40
60
80
100
120
0
200
400
600
800
1000
1200
1400
1600
1800
2000
0 50 100 150 200 250 300
Total Se feed MBBR1 0.2um Reox Chem HRT
Days
Selenium (ug/L)
Batch 4 Batch 5
Batch 3, different dilutions
HRT (hrs)

Results : FGD effluent 1
22
0
10
20
30
40
50
60
70
80
90
100
0 50 100 150 200 250 300
Se(IV) Se(VI) Total Se after 0,2um filtration
Total Se after chem treatment Total Se after Re-Ox Se(IV) after ReOx
Se(VI) after ReOx
Days
Selenium (ug/L)
Batch 4 Batch 5 Batch 3, different dilutions
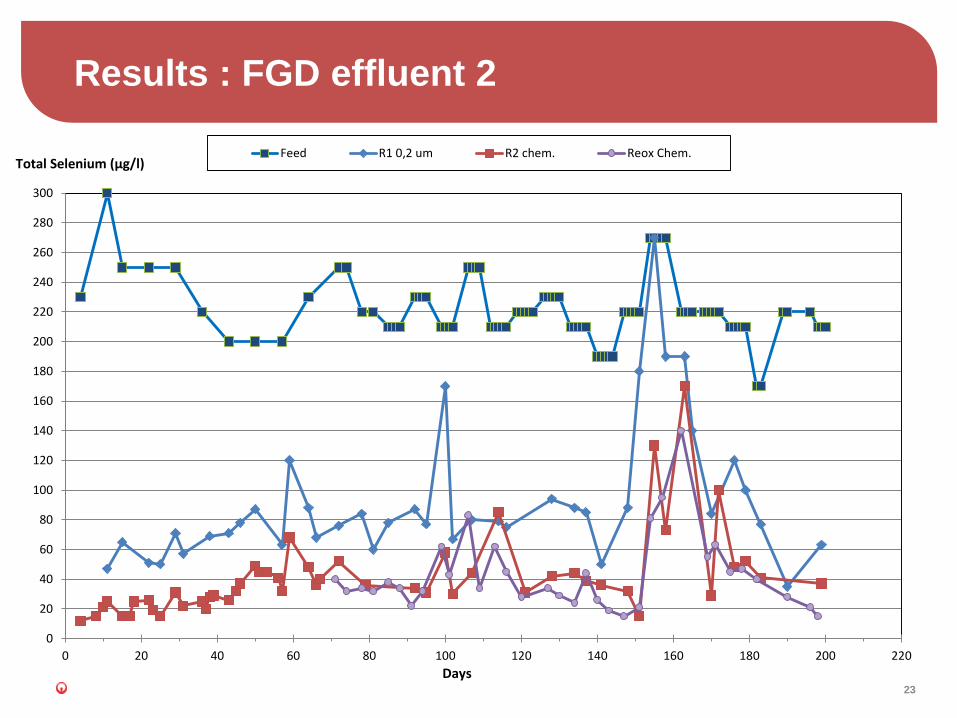
Results : FGD effluent 2
23
0
20
40
60
80
100
120
140
160
180
200
220
240
260
280
300
0 20 40 60 80 100 120 140 160 180 200 220
Feed R1 0,2 um R2 chem. Reox Chem.Total Selenium (µg/l)
Days
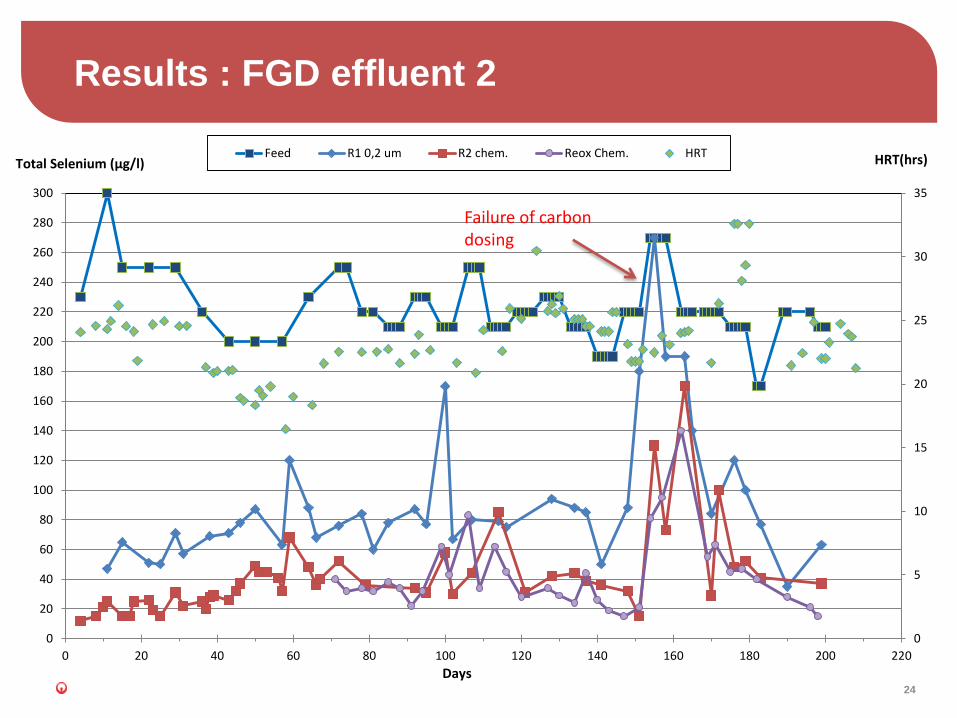
Results : FGD effluent 2
24
0
5
10
15
20
25
30
35
0
20
40
60
80
100
120
140
160
180
200
220
240
260
280
300
0 20 40 60 80 100 120 140 160 180 200 220
Feed R1 0,2 um R2 chem. Reox Chem. HRTTotal Selenium (µg/l)
Days
HRT(hrs)
Failure of carbon dosing

Selenium Removal and
SeleniumZero®
TITRE PRÉSENTATION / SOUS TITRE / DATE 25
Easy to remove Selenite, Se(IV)
Se (IV) removal to ppb level
Iron co-precipitation and adsorption followed by solid/liquid separation
(ACTIFLO®/MULTIFLO™)
Fixed-bed adsorption onto iron oxide media
MetCleanTM Technology
Activated alumina
Membrane (RO)
Selenite Treatment Technologies
26
Selenium (VI) removal to ppb level
Much more difficult than Se (IV)
Adsorption onto iron oxide: not efficient
Severe impact of pH and sulfate
Ion Exchange: reliable process
[High Selectivity for Se (VI)]
αSe(VI)= 17; αSO4 = 9.1; αSe(IV) = 1.3
Regenerant handling is the key issue
High sulfate concentrations are a concern with IX
SeleniumZero®
Selenate Treatment Technologies
27
Reduction of Se(VI) to Se(IV)
Reaction:
Se (VI) reduced to Se (IV); Fe(II) is oxidized to Fe (III) and forms
Hydrous Ferric Oxide (HFO)
Se (IV) is adsorbed onto HFO at pH 6.5 - 7.5
Reducing Agents:
ZVI (Fe0), Fe2+, metabisulfite etc
Kinetics is very slow without catalyst
Kinetics is pH dependent
ZVI best at lower pH +/- 4.5
Selenate Removal
28
Se(VI) removal with chemically treated iron based
adsorption media
Conducted 6 months of lab studies with actual
wastewater from a coal plant
Sample contained about 20 ppb of Se (VI) with sulfate,
some TSS, and other cations and anions
Sample was filtered prior to adsorption column
SeleniumZero® - New Technology for Selenate
Removal
29
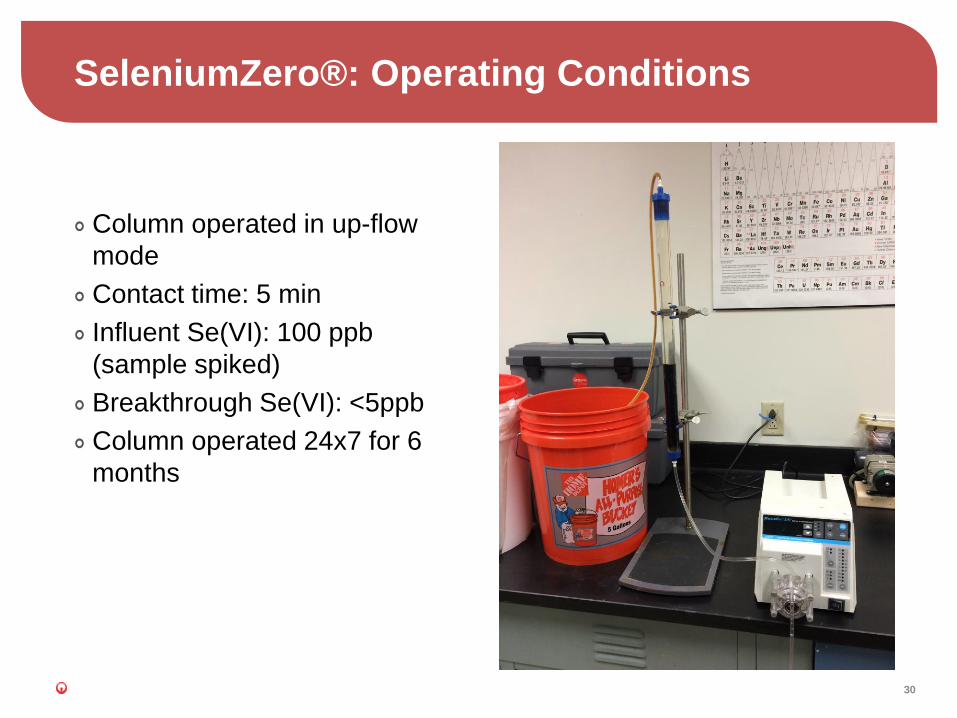
Column operated in up-flow
mode
Contact time: 5 min
Influent Se(VI): 100 ppb
(sample spiked)
Breakthrough Se(VI): <5ppb
Column operated 24x7 for 6
months
SeleniumZero®: Operating Conditions
30

No significant ΔP across the column
No impact of Ca2+ and SO42- on Se (VI) removal
capacity
pH increased only 0.5 unit
Spent media passed TCLP test (Se in TCLP extract:
<0.1 mg/L which is below the TCLP limit of 1 mg/L)
Some iron leaching was observed from the column
SeleniumZero: Results & Observations
31
Final effluent Se concentration (economically) achievable using MBBR
is highly dependent on the influent Se concentration
FGD effluents have complex / variable matrices – adaptation of the
biomass does take time however biological treatment using MBBR is a
viable treatment solution – potential for combining with SeleniumZero
Carbon dosing control required to minimize sulfate reduction
Solids separation step is critical for capture of small Se particles
On-going testing of MBBR for different operating conditions and
effluents
Conclusions
Thank you


![[320] Web 3: Selenium · for Selenium Java module for Selenium Ruby module for Selenium JavaScript mod for Selenium Chrome Driver Firefox Driver Edge Driver. Examples. Starter Code](https://img.dokumen.tips/doc/110x75/5eadce82cc4f0d7405687f01/320-web-3-selenium-for-selenium-java-module-for-selenium-ruby-module-for-selenium.jpg)