Embed Size (px)
Citation preview

Retrospective Theses and Dissertations Iowa State University Capstones, Theses andDissertations
1997
Selective spectroscopic methods for water analysisBikas VaidyaIowa State University
Follow this and additional works at: https://lib.dr.iastate.edu/rtd
Part of the Analytical Chemistry Commons
This Dissertation is brought to you for free and open access by the Iowa State University Capstones, Theses and Dissertations at Iowa State UniversityDigital Repository. It has been accepted for inclusion in Retrospective Theses and Dissertations by an authorized administrator of Iowa State UniversityDigital Repository. For more information, please contact [email protected].
Recommended CitationVaidya, Bikas, "Selective spectroscopic methods for water analysis " (1997). Retrospective Theses and Dissertations. 11751.https://lib.dr.iastate.edu/rtd/11751

INFORMATION TO USERS
This manuscript has been reproduced from the microfihn master. UMI
films the text directly from the ori^nal or copy submitted. Thus, some
thesis and dissertation copies are in typewriter face, while others may be
from any type of computer printer.
The quality of this reproduction is dependent upon the quality of the
copy submitted. Broken or indistinct print, colored or poor quality
illustrations and photographs, print bleedthrough, substandard margins,
and improper alignment can adversely affect reproduction.
In the unlikely event that the author did not send UMI a complete
manuscript and there are missing pages, these will be noted. Also, if
unauthorized copyright material had to be removed, a note will indicate
the deletion.
Oversize materials (e.g., maps, drawings, charts) are reproduced by
sectioning the original, beginning at the upper left-hand comer and
continuing from left to right in equal sections with small overlaps. Each
original is also photographed in one exposure and is included in reduced
form at the back of the book.
Photographs included in the original manuscript have been reproduced
xerographically in this copy. I£gher quality 6" x 9" black and white
photographic prints are available for any photographs or illustrations
appearing in this copy for an additional charge. Contact UMI directly to
order.
UMI A Bell & Howell Information Company
300 Noith Zeeb Road, Ann Arbor NO 48I06-I346 USA 313/761-4700 800/521-0600


Selective spectroscopic methods for water analysis
by
Bikas Vaidya
A dissertation submitted to the graduate faculty
in partial fulfilhnent of the requirements for the degree of
DOCTOR OF PHILOSOPHY
Major; Analytical Chemistry
Major Professor: Marc D. Porter
Iowa State University
Ames, Iowa
1997

UMI NuiDber: 9725464
UMI Microform 9725464 Copyright 1997, by UMI Company. All rights reserved.
This microform edition is protected against miauthorized copying under Title 17, United States Code.
UMI 300 North Zeeb Road Ann Arbor, MI 48103
ii
Graduate College
Iowa State University
This is to certify that the Doctoral dissertation of
Bikas Vaidya
has met the dissertation requirements of Iowa State University
Major Professor
For the Major Program
aduate College
Signature was redacted for privacy.
Signature was redacted for privacy.
Signature was redacted for privacy.

iii
TABLE OF CONTENTS
ACKNOWLEDGMENTS
ABSTRACT
CHAPTER 1. GENERAL INTRODUCTION 1
Dissertatioa Organization 5
References 6
CHAPTER 2. CHROMOGENIC AND FLUOROGENIC CROWN ETHER COMPOUNDS FOR THE SELECTIVE EXTRACTION AND DETERMINATION OF Hg(II) ^ 3
ABSTRACT 13
INTRODUCTION 14
EXPERIMENTAL SECTION 18
RESULTS AND DISCUSSION 24
CONCLUSIONS 52
ACKNOWLEDGMENT 52
REFERENCES AND NOTES 53
CHAPTER 3. SELECTIVE DETERMINATION OF CADMIUM IN WATER USING A CHROMOGENIC CROWN ETHER IN A MIXED iVHCELLAR SOLUTION 57
ABSTRACT 57
INTRODUCTION 58
EXPERIMENTAL SECTION 59
RESULTS AND DISCUSSION 60
CONCLUSIONS 77
ACKNOWLEDGMENTS 77
REFERENCES AND NOTES 78
iv
CHAPTER 4. REDUCTION OF CHLORIDE INTERFERENCE IN CHEMICAL OXYGEN DEMAND (COD) DETERMINATION WITHOUT USING MERCURY SALTS 80
ABSTRACT 80
INTRODUCTION 80
EXPERIMENTAL SECTION 83
RESULTS AND DISCUSSION 87
CONCLUSIONS 99
ACKNOWLEDGMENTS 102
REFERENCES AND NOTES 102
CHAPTER 5. STRUCTURAL ORIENTATION PATTERNS FOR A SERIES OF ANTHRAQUINONE SULFONATES ADSORBED AT AN AMINOPHENOL THIOLATE MONOLAYER CHEMISORBED AT GOLD 104
ABSTRACT 104
INTRODUCTION 104
EXPERIMENTAL SECTION 106
RESULTS AND DISCUSSION 108
CONCLUSIONS 124
ACKNOWLEDGMENTS 125
REFERENCES 125
CHAPTER 6. GENERAL CONCLUSIONS 128
APPENDIX. THE ROLE OF CHEMICALLY MODIFIED SURFACES IN THE CONSTRUCTION OF MINIATURIZED ANALYTICAL INSTRUMENTATION 131

V
ACKNOWLEDGMENTS
The author gratefully acknowledges his major Professor Marc D. Porter for his
guidance, encouragement, and patience during the past six years of study. Discussions with
the other members of the Porter group have been invaluable throughout each of these
research projects, and their contributions are greatly appreciated. Professor Richard Bartsch
and his group from Texas Tech University are acknowledged for the synthesis of the
chromogenic and fluorogenic crown ethers. Dr. Jer2y Zak for his help in solving the
complex equilibria of the crown ethers and Dr. Monzir S. Abdel-Latif for his advice on the
use of micelles with crown ethers are acknowledged. Dr. Shelley Coldiron, Dr. C. J. Zhong,
Steve Watson and Jian-hong Wang from our group, and Joe Parrish, Roy Strausburg, Scott
Brayman and Sharon Sloat from Hach Company are acknowledged for their contribution in
the successful completion of the chloride removal project. Contributions of Dr. Shelley
Coldiron, Jian-hong Wang and Steve Watson in the thin film pH sensor project are gratefully
acknowledged. This research was fimded by Hach Company, Microanalytical
Instrumentation Center, Iowa State University, and Ames Laboratory. The Ames Laboratory
is operated for the U. S. Department of Energy by Iowa State University under contract No.
W-7405-eng-82.

vi
ABSTRACT
This dissertation explores in large part the development of a few types of
spectroscopic methods in analysis of water. Methods for the determination of some of the
most important properties of water like pH, metal ion content, and chemical oxygen demand
are investigated in detail. The first of the five papers included in this dissertation describes
the synthesis, acid-base reactivity and metal ion binding selectivity of two novel crown ether
compounds, N,N'-bis(2-hydroxy-5-nitrobenzyl)-4,13-diazadibenzo-18-crown-6 (CCE) and
N,N'-bis(7-hydroxy-4-methylcoumarin-8-methylene)-4,13-diazadiben20-l8-crown-6 (FCE).
Extraction constants for Ba(II), Ca(ir), Cd(II), Cu(II), Hg(II), Pb(II), and Sr(II) have been
determined for both reagents. Both CCE and FCE exhibit an unprecedented selectivity of
>10^ in the binding of Hg(ll) over the other divalent metal cations.
The characterization of optical properties, acid-base equilibria, and metal binding
capabilities of CCE in a mixed micellar solution are reported in the second paper. The
formation constants for Hg(I[), Cd(n), Ca(II) and Sr(II) have been determined. The potential
application to a spectrophotometric chemical analysis based on the selectivity of CCE for
Cd(I[) is examined.
The third paper describes an efficient method for minimization of chloride
interference for COD determinations in aqueous samples without using a mercury salt to
mask chloride ion. Chloride is removed as HCl gas from an acidified sample solution at
150 °C in a closed vial by adsorption onto a bismuth-based adsorbent held in a specially
designed Teflon-basket. The effects of adsorbent composition, basket design, acid

vii
concentration, temperature, reflux time, and silver(I) tn the removal of chloride ion and the
COD determination are also discussed.
The formation of an ordered monolayer of 4-aniinothiophenoI (ATP) on gold,
electrostatic attachment of anthraquinone mono- and disulfonates to the protonated ATP
monolayer, and the determination of the orientation of each of the adsorbed anthraquinone
sulfonates from their respective infrared spectra are described in the fourth paper. The
orientation of the adsorbed anthraquinone mono- or disuLfonate is largely directed by the
anionic sulfonate group that binds to the surface bound ammonium group. Finally, the
development of a thin-film optical sensor for measuring pH is described in the appendix.

1
CHAPTER 1. GENERAL INTRODUCTION
The importance of water to our civilization can not be over emphasized. No matter
what the purpose, the suitability of water for human consimiption and many other uses is
strongly affected by dissolved and/or suspended substances.' Metals, pH, chemical oxygen
demand(COD), biological oxygen demand (BOD), total organic carbon (TOG), dissolved
oxygen, turbidity, and conductivity are just a few of the important parameters that define the
2 critical characteristics of water.
The presence of metal ions also affects the suitability of water. The effects of metals
in water and waste water range from beneficial through troublesome to dangerously toxic.
Some metals are essential nutrients, whereas others may adversely affect water consumers,
waste water treatment systems, and receiving waters. Some metals may be beneficial or toxic
2 depending on concentration. Metals are commonly determined in water by various forms
(flame, cold vapor, electrothermal and hydride generation) of atomic absorption spectrometry
(AAS), inductively coupled plasma-atomic emission spectrometry (ICP-AES), anodic
stripping voltammetry (ASV) and colorimetric methods.
In general, AAS and ICP-AES methods give superior results compared to the
colorimetric methods. ASV can be a very sensitive method for the determination of some
metals, but generally requires a much longer analysis time and can be used only for metals
2 that form an amalgam. Colorimetric methods, on the other hand, can be performed more

2
rapidly and are more cost effective; however, the suitability of the method greatly depends on
the purpose of the determination, and the nature of the metal and the sample matrix.
Colorimetric methods for determination of metals include a wide variety of reagents
and techniques. Absorbance and fluorescence are the most conmion modes of
determination. A chromogenic or fluorogenic indicator is used which directly or indirectly
interacts with the metal ion, generally forming a metal complex and producing a change in
either in intensity, color or both. Some methods require extraction of the metal complex into
4 5 an orgamc phase or micellar phase, while others can be applied directly in the aqueous
phase. However, few of the indicators used in such metal ion determinations are ideally
selective. Most indicators require a masking agent to enhance selectivity. To this end,
4,6-11 crown ethers are being used by taking advantage of the size selectivity of their cavities.
One of the most important and frequently used parameter in water analysis is pH, a
42 + term defined by Sorenson as -log [H ]. pH measurement is most commonly performed
2 potentiometrically with a glass indicator electrode and a reference electrode. However, a
43-73 very large number of optical pH sensors have been developed. The main advantage of
optical pH sensors over the glass electrode is lack of necessity of reference electrode and
48 electncal safety. A theoretical comparison of the optical and electrochemical methods of
48 pH measurements is found hi the paper by Janata. Most of the optical sensors developed
43,44,46,51-53,5548.59,61.68.71 for pH measurement are based on absorbance or
45,47,49,50.57,60,63,64,69 fluorescence measurements in the UV-visible region via an indicator

3
immobilized on a support material. However, measurements based on changes in
„ . '^3 . 70 56,67,72 reflection , fluorescence hfetmie , evanescent wave absorption and iiu&ared
54 spectroscopy have also appeared. A major portion of work done in this field in our
laboratory has been based on the measurement of the absorbance of an indicator immobilized
, . „ . , . 43^2,53,61 54 on a thin cellulosic membrane m the UV-visible and mfirared regions.
Chemical oxygen demand (COD) determination is one of the most commonly used
test in analysis for organic matter in water and wastewater. COD is an important delimiter
for the effect of organic pollutants in water systems which can be empirically related to
2 biological oxygen demand (BOD) or total organic carbon (TOC).' As organic pollutants are
consumed by microorganisms, the oxygen content of water is depleted. This loss can have
adverse effects on the balance of natural ecosystems if the oxygen content falls below the
level necessary to support aquatic life. Acidic dichromate is commonly used for the oxidation
2,74-94 of the organic material for a COD determination. While not an organic pollutant,
chloride ion can be oxidized by acidic dichromate which can result in a positive deviation in
a COD determination. In addition, ammonia also gets oxidized in presence of chloride,
95 which is otherwise not oxidized by the acidic dichromate. Thus, the chloride interference in
a sample containing ammonia is even more pronounced.
The present methods of COD determination mask the effect of chloride ion by
2,74,75,79,81,82,88,92-94 addition of a mercury salt which reacts with chloride ion to form an
unreactive complex. Other attempted approaches to manage the problem of chloride ion
84-81 mterference include the addition of silver salts to mask chlonde ion, the addition of

4
89 chromium(I]I) to reduce the oxidation potential, the determination of the amount of
chloride oxidized by iodometric titration with a subsequent a correction for the oxidized
80 chlonde, and the removal of chloride as hydrochloric acid from an acidified sample
95.96 solution. However, the effectiveness of these approaches for compensation vary
depending on sample matrix. Furthermore, as environmental regulations are tightening, it
has become increasingly important to develop a more environmentally friendly approaches
for COD and other chemical analysis. Hence, an efficient and environmentally friendly
method of chloride removal in COD determination is clearly needed.
Like many other sulfur containing organic compounds, 4-aminothiophenol (ATP) has
drawn attention of many surface scientists, mainly because of its ability to form an ordered
97-103 99 monolayer on metal surfaces like gold and silver, and have an amine which can be
protonated or deprotonated by changing simply the pH of a solution in contact with the
lOI surface. Anionic species like anthraquinone mono- and di-sulfonates can be
electrostatically attached to the protonated ATP monolayer on gold. The anthraquinone
moiety attached to the gold surface with the ATP is still electroactive and can be
101 electrochemically reduced and oxidized. In addition, the onentation of the anthraquinone
moieties adsorbed on the surface can be manipulated by choosing an anthraquinone mono- or
di-sulfonate isomer that adsorbs the desired way. The orientation of the anthraquinone
moieties adsorbed on the surface can also be controlled by letting the anthraquinone
derivative adsorb directly on the gold or over protonated ATP monolayer on gold. Such an
electrochemically tunable surface has a great potential for use as a stationary phase in

5
104-106 electrochenucally modulated liqmd chromatography (EMLC) for separation of organic
or inorganic molecules and ions in future.
Dissertation Organization
This dissertation is divided into six chapters and an appendix. The general
introduction is followed by four papers and a general-conclusion and prospecms. Chapter 2
consists of a paper which describes synthesis, optical, acid-base and metal ion binding
properties of two novel chromogenic and fluorogetiic crown ethers, and their application in
selective extraction and determination of Hg(II) and other divalent metal cations. Chapter 3
is another paper on the application of the chromogenic crown ether. The use of the
chromogenic crown ether in a mixed micellar solution for selective spectroscopic
determination of Cd(]I) in water is described. Chapter 4 describes a method for minimization
of chloride interference in COD determination without using mercury salts. The chloride is
removed as hydrogen chloride gas from an acidified water sample, which is then trapped by a
bismuth adsorbent. Chapter 5 consists of a paper dealing with surface functionality and
orientation manipulation of adsorbed molecules on a gold electrode. Following these papers
is a general summary and discussion which highlights the results of this work, and provides
an overview of the future directions. Finally, the appendix is comprised of a paper on thin
film optical sensor for measurement of pH.
6
References
1) Hunt, D. T. E.; Wilson, A. L. The Chemical Analysis of Water: General Principles and
Techniques', 2nd ed.; The Royal Society of Chemistry: London, 1986.
2) APHA Standard methods for the Examination of Water and Wastewater, 19th ed.;
American Public Health Association: Washington, DC, 1995.
3) Sandell, E. B. Colorimetric Determination of Traces of Metals', 3rd ed.; Interscience
Publishers: New York, 1959.
4) Vaidya, B.; Zak, J.; Bastiaans, G. J.; Porter, M. D.; Hallman, J. L.; Nabulsi, N. A. R.;
Utterback, M. D.; Strzelbicka, B.; Basrtsch, R. A. Anal. Chem. 1995, 67, 4101-4111.
5) Abdel-Latif, M. S. Anal. Lett. 1994,27, 2341-2353.
6) Abrodo, P. A.; Gomis, D. B.; Sanz-Medel, A. Microchem. J. 1984, 30, 58-70.
7) Bartsch, R. A.; Czech, B. P.; Kang, S. I.; Stewart, L. E.; Walkowiak, W.; Charwicz, W.
A.; Heo, G. S.; Son, B. J. Am. Chem. Soc. 1985, 107, 4997-4998.
8) Blair, T. L.; Desai, J.; Bachas, L. G. Anal. Lett. 1992, 25, 1823-1834.
9) Bradshaw, J. S. In Synthetic Multidentate Macrocyclic Compounds', Izatt, R. M. and
Christensen, J. J., Eds.; Academic Press: New York, 1978; pp 53-109.
10) Brown, P. R.; Bartsch, R. A. In Topics in Inclusion Science', Osa, T. and Atwood, J. L.,
Eds.; Kluwer Academic Publishers: Dordrecht, 1991; Vol. 2, pp 1-57.
11) Czech, B. P.; Babb, D. A.; Czech, A; Bartsch, R. A. J. Heterocyclic Chem. 1989, 26,
199-203.

7
12) Danesi, P. R.; Meider-Gorican, H.; Chiarizia, R.; Scibona, G. J. Inorg. Mud. Chem.
1975, 37, 1479-1483.
13) Danesi, P. R.; Chiarizia, R.; Saltelli, A. J. Inorg. Nucl. Chem. 1978, 40, 1119-1123.
14) Frensdorff, H. K. J. Am. Chem. Soc. 1971, 92, 4684-4688.
15) Gokel, G. W.; Korzeniowski, S. H. Reactivity and Structure Concepts in Organic
Chemistry, Springer-Verlag: New York, 1982; Vol. 13.
16) Hiroka, M. Crown Compounds: Their Characteristics and Applications', Elsevier:
Amsterdam, 1982; Vol. 12.
17) Jawaid, M.; Ingman, F. Talanta 1978,25, 91-95.
18) Katalnikov, S. G.; Mysheltsov, I. A. Tr. Inst.-Mosk. Khim.-Tekhnol. Inst. im. D. I
Mendeleeva 1989,156, 3-24.
19) Katayama, Y.; Nita, K.; Ueda, M.; Nakamura, H.; Takagi, M. Anal. Chim. Acta 1985,
172, 193-209.
20) Katayama, Y.; Fukuda, R.; Takagi, M. Anal. Chim. Acta 1986,185, 295-306.
21) Katayama, Y.; Fukuda, R.; Iwasaki, T.; Nita, K.; Takagi, M. Anal. Chim. Acta 1988,
204, 113-125.
22) Kimura, K.; Tanaka, M.; Kitazawa, S.; Shono, T. Chem. Lett. 1985, 1239-1240.
23) Kimura, K.; Tanaka, M.; Shono, T. Bull. Chem. Soc. Jpn. 1987, 60,3068-3070.
24) Nakamura, H.; Nishida, H.; Takagi, M.; Ueno, K. Anal. Chim. Acta 1982,129, 219-227.
25) Nazarenko, A. Y.; Pyatnitskii, 1. V.; Stolyarchuk, T. A. Zhur. Anal. Khim. 1981, 26,
1719-1721.

8
26) Nishida, H.; Tazaki, M.; Takagi, M.; Ueno, K. Mikrochim. Acta 1981,1, 281-287.
27) Nishida, H.; Katayama, Y.; Katsuki, H.; Nakamura, H.; Takagi, M.; Ueno, K. Chem.
Lett. 1982,1853-1854.
28) Pannell, K. H.; Hambrick, D. C.; Lewandos, G. S. J. Organometal. Chem. 1975, 99,
C21-C23.
29) Pedersen, C. J. J. Am. Chem. Soc. 1967, 89, 7017-7036.
30) Pyatnitskii, I. V.; Nazarenko, A. Y. Russian J. Inorg. Chem. 1980, 25, 592-594.
31) Sadakane, A.; Iwachido, T.; Toei, K. Bull. Chem. Soc. Jpn. 1975, 48, 60-63.
32) Sakai, Y.; Kawano, N.; Nakamura, H.; Takagi, M. Talanta 1986, 33,407-410.
33) Sanz-Medel, A.; Gomis, D. B.; Alvarez, J. R. G. Talanta 1981, 28, 425-430.
34) Sanz-Medel, A.; Gomis, D. B.; Fuente, E.; Jimeno, S. A. Talanta 1984, 31, 515-519.
35) Sasaki, K.; Pacey, G. Anal. Chim. Acta 1985,174, 141-149.
36) Shiga, M.; Nishida, H.; Nakamura, H.; Takagi, M.; Ueno, K. Bunseki Kagaku 1983, 32,
E293-E300.
37) Sumiyoshi, H.; Nakahara, K.; Ueno, K. Talanta 1977, 24, 763-765.
38) Takagi, M.; Ueno, K. Top. Curr. Chem. 1984,121, 39-65.
39) Takagi, M.; Nakamura, H. J. Coord. Chem. 1986,15, 53-82.
40) Takagi, M. In Cation Binding by Macrocycles\ Inoue, Y. and Gokel, G. W., Ed.; Dekker:
New York, 1990, pp 465-495.
41) Wilcox, K.; Pacey, G. E. Talanta 1991, 38, 1315-1324.
42) Sorenson, S. Biochem. Z. 1909,21,131.

43) Porter, M. D.; Coldiron, S. J.; Vaidya, B. SAE Technical Paper Series 1993, 932207, 1-
44) Harper, G. B. Anal. Chem. 1975, 47, 348-351.
45) Saari, L. A.; Seitz, W. R. Anal. Chem. 1982, 54, 821-823.
46) Kirkbright, G. F.; Narayanaswamy, R.; Welti, N. A. Analyst 1984,109, 1025-1028.
47) Munkholm, C.; Walt, D. R.; Milanovich, F. P.; Klainer, S. M. Anal. Chem. 1986, 58,
1427-1430.
48) Janata, J. Anal. Chem. 1987, 59,1351-1356.
49) Fuh, M. S.; Burgess, L. W.; Hirschfeld, T.; Christian, G. D. Analyst 1987,112, 1159-
1163.
50) Jordan, D. M.; Walt, D. R.; Milanovich, F. P. Anal. Chem. 1987, 59, 437-439.
51) Edmonds, T. E.; Flatters, N. J.; Jones, C. F.; Miller, J. N. Talanta 1988, 35, 103-107.
52) Jones, T. P.; Porter, M. D. Anal. Chem. 1988, 60, 404-406.
53) Stole, S. M.; Jones, T. P.; Chau, L.; Porter, M. D. In Chemical Sensors and
Microinstrumentation-, Murray, R. W., Dessy, R. E., Heineman, W. R., Janata, J. and
Seitz, W. R., Eds., 1989; ACS Symposium Series No. 403, pp 283-302.
54) Jones, T. P.; Porter, M. D. Appl. Spectrosc. 1989, 43, 908-911.
55) Boisde, G.; Biatry, B.; Magny, B.; Dureault, B.; Blanc, F.; Sebille, B. SPIE1989,1172
Chemical, Biochemical, and Environmental Sensors, 239-250.
56) Carey, W. P.; DeGandpre, M. D.; Jorgensen, B. S. Anal. Chem. 1989, 61, 1674-1678.
57) Zhujun, Z.; Zhang, Y.; Wangbai, M.; Russel, R.; Shakhsher, Z. M.; Grant, C. L.; Seitz,
W. R.; Sundberg, D. C. Anal. Chem. 1989, 61, 202-205.

58) Collison, M. E.; MeyerhofF, M. E. Anal. Chem. 1990, 62, 425A-437A.
59) Baldini, F.; Bacci, M.; Bracci, S. SPIE1990,1368 Chemical, Biochemical, and
Environmental Fiber Sensors 11, 210-217.
60) Zen, J.; Patonay, G. Anal. Chem. 1991, 63, 2934-2938.
61) Jones, T. P.; Coldiron, S. J.; Deninger, W. J.; Porter, M. D. Appl. Spectrosc. 1991, 45,
1271-1277.
62) Janata, J. Anal. Chem. 1992, 64, 196R-219R.
63) Tan, W.; Shi, Z.; Kopelman, R. Anal. Chem. 1992, 64, 2958-2990.
64) Brenci, M.; Baldini, F. Fiber Optic Optrodes For Chemical Sensing] 8th Optical Fiber
Sensors Conference; Monterey, CA, 1992; TH4.1, pp 313-319.
65) Arnold, M. A. Anal. Chem. 1992, 64, 1015A-1025A.
66) Ding, J. Y.; Shahriari, M. R.; G. H. Sigel, J. Porous Fiber Optical Sensors For pH
Measurement, 8th Optical Fiber Sensors Conference; Monterey, CA, 1992; TH4.3, pp
321-324.
67) Ge, Z.; Brown, C. W.; Sun, L.; Yang, S. C. Anal. Chem. 1993, 65, 2335-2338.
68) Cardwell, T. J.; Cattrall, R. W.; Deady, L. W.; Dorkos, M.; O'Connel, G. R. Talanta
1993, 40, 765-768.
69) Parker, J. W.; Laksin, 0.; Yu, C.; Lau, M.; Klima, S.; Fisher, R.; Scott, L; Atwater, B.
W. Anal. Chem. 1993, 65, 2329-2334.
70) Thompson, R. B.; Lakowicz, J. R. Anal. Chem. 1993, 65, 853-856.
71) Werner, T.; Wolfbeis, 0. S. Presenilis J. Anal. Chem. 1993, 346, 564-568.

11
72) Lee, J. E.; Saavedra, S. S. Anal. Chim. Acta 1994, 285, 265-269.
73) Shakhsher, Z.; Seitz, W. R.; Legg, K. D. Anal. Chem. 1994, 66, 1731-1735.
74) Himebaugh, R. H.; Smith, M. J. Anal. Chem. 1979,51, 1085-1087.
75) Gibbs, C. R. Introduction to Chemical Oxygen Demand', Hach Company: Loveland,
1993; Booklet No. 8.
76) Moore, W. A.; Kroner, R. C.; Ruchhoft, C. C. Anal. Chem. 1949, 21, 953-957.
77) Moore, W. A.; Ludzack, F. J.; Ruchhoft, C. C. Anal. Chem. 1951, 23, 1297-1300.
78) Moore, W. A.; Walker, W. W. ^«a/. C/iem. 1956,28, 164-167.
79) Dobbs, R. A.; Williams, R. T. Chem. 1963, iJ, 1064-1067.
80) Baumann, F. J. Anal. Chem. 1974, 46, 1336-1338.
81) Jirka, A. M.; Carter, M. J. Anal. Chem. 1975, 47,1397-1402.
82) Canelli, E.; Mitchell, D. G.; Pause, R. W. Wat. Res. 1976,10, 351-355.
83) Ryding, S.-O.; Forsberg, A. Wat. Res. 1977,11, 801-805.
84) Lloyd, A. Analyst 1982,107, 1316-1319.
85) Ballinger, D.; Lloyd, A.; Morrish, A. Analyst 1982, 107, 1047-1053.
86) Pitrebois, L.; Schepper, H. D. Trib. Cebedeau 1984,484, 83-86.
87) deCasseres, K. E.; Best, D. G.; May, B. D. Wat. Pollut. Control 1984, 416-419.
88) Jones, B. M.; Sakaji, R. H.; Daughton, C. G. Anal. Chem. 1985, 57, 2334-2337.
89) Thompson, K. C.; Mendham, D.; Best, D.; Casseres, K. E. D. Analyst 1986, 111, 483-
485.
90) Gonzalez, J. F. Envirom. Tech. Lett. 1986, 7, 269-272.

91) Soto, M.; Veiga, M. C.; Mendez, R.; Lema, J. M. Envirom. Tech. Lett. 1989,10, 541-
548.
92) Dasgupta, P. K.; Petersen, K. Anal. Chem. 1990, 62, 395-402.
93) Belkin, S.; Brenner, A.; Abeliovich, A. Wat.Res. 1992, 26, 1577-1581.
94) Belkin, S.; Brermer, A.; Abeliovich, A. Wat. Res. 1992,26, 1583-1588.
95) Wagner, V. R.; Ruck, W. Z. Wasser Abwasser Forsch. 1981,14, 145-151.
96) Wagner, V. R.; Ruck, W. Z Wasser Abwasser Forsch 1982, 15, 287-290.
97) Rubinstein, I.; Rishpon, J.; Sabatini, E.; Redondo, A.; Gottesfeld, S. J. Am. Chem. Soc.
1990, 6135-6136.
98) Kim, Y.-T.; McCarley, R. L.; Bard, A. J. J. Phys. Chem. 1992, 96, 7416-7421.
99) Hill, W.; Wehling, B.J. Phys. Chem. 1993, 97, 9451-9455.
100) Bryant, M. A.; Crooks, R. M. Langmuir 1993, 9, 385-387.
101) Sun, L.; Johnson, B.; Wade, T.; Crooks, R. M. J. Phys. Chem. 1990, 94, 8869-8871.
102) Sun, L.; Thomas, R. C.; Crooks, R. M. J. Am. Chem. Soc. 1991,113, 8550-8552.
103) Kajiya, Y.; Okamoto, T.; Yoneyama, H. Chem. Lett. 1993, 2107-2110.
104) Deinhammer, R. S.; Ting, E.; Porter, M. D. Anal. Chem. 1995, 67, 237-246.
105) Deinhammer, R. S.; Porter, M. D.; Shimazu, K. J. Electroanal. Chem. 1995, 387, 35-
46.
106) Deinhammer, R. S.; Shimazu, K.; Porter, M. D.AnaL Chem. 1991, 63, 1890-1894.

13
CHAPTER 2. CHROMOGENIC AND FLUOROGENIC CROWN ETHER
COMPOUNDS FOR THE SELECTIVE EXTRACTION AND
DETERMINATION OF Hg(II)
A paper published in Analytical Chemistry+
Bikas Vaidya', Jerzy Zak*^, Glenn J. Bastiaans*, and Marc D. Porter*
Johnny L. Hallman^, Nabeel A. R. Nabulsi'^, Marty D. Utterback'^, Bozena Strzelbicka', and
Richard A. Bartsch'*
ABSTRACT
Two novel crown ether compounds, N,N'-bis(2-hydroxy-5-nitrobenzyl)-4,13-
dia2adibenzo-18-crown-6 (CCE) and N,N'-bis(7-hydroxy-4-methylcouniarin-8-methylene)-
4,13-diazadiben2o-18-crown-6 (FCE) have been synthesized as potential reagents for the
selective extraction and determination of heavy metal ions. Characterizations of the acid-
base reactivity and the heavy metal ion extraction capabilities are reported. Both CCE and
FCE undergo four-step ionization processes with associated tautomeric transformations and
form stable complexes with divalent metal cations that can be extracted into 1,2-
dichloroethane. Extraction constants for Ba(II), Ca(II), Cd(II), Cu(II), Hg(II), Pb(I[), and
+ Reprinted with the permission of Analytical Chemistry, 1995, 67, 4101-4111. Copyright © 1995 the American Chemical Society.
* Microanalytical Instrumentation Center, Ames Laboratory USDOE, and Department of Chemistry, Iowa StateUoiversity, Ames, lA 50011
^ Permanent address: Department of Chemistry, The Silesian Technical University, 44-100 Gliwice, Poland.
^ Department of Chemistry and Biochemistry, Texas Tech University, Lubbock, TX 79409

14
Sr(II) have been determined for both reagents. For CCE, the extraction order is Hg(n)»
Pb(II) > Cu(II) > Cd(II) > Ca(II) > Sr(n) > Ba(II); whereas the order for FCE is Hg(II)»
Cu(II) > Pb(II) > Cd(II) > Ca(II) > Sr(II) > Ba(II). The selectivity of CCE for Hg(n) over the
next best extracted cation, Pb(II), is ~2 x 10^ and that of FCE for Hg(II) over next best
extracted cation, Cu(II), is ~5 x 10^. Potential applications to chemical analysis, based on the
unprecedented selectivity of both reagents for Hg(n), are briefly examined.
INTRODUCTION
Since their discovery,' a wide variety of crown ethers have been created^'^ for
applications in solvent extraction"^^ and isotope separation, as components in ion-selective
electrodes,and for many other purposes.Lipophilic crown ethers constitute an
interesting subgroup of these compounds, largely because of their ability to extract
selectively metal ions from an aqueous solution into an organic medium. One particularly
attractive strategy couples the selective binding of metal ions by such compounds and the
ability of the resulting complex to form an ion pair with a chromogenic or fluorogenic dye.'^'
The resulting neutrally charged, ion paired complex is then partitioned into an organic
phase and detected optically.
The success of these efforts has led to the construction of crown ethers with pendant
proton-ionizable chromophoric or fluorophoric groups, i.e., side arms. The incorporation of
such side arms eliminates the ion pairing step, which facilitates applications in chemical
analysis processes (see Scheme 1). Several forms of this type of crown ether have been
synthesized and evaluated for the selective determination of alkali, alkaline earth, and heavy

15
metal The diprotonic chromogenic and fluorogenic crown ethers and
respectively, developed by Takagi and co-workers, have proven particularly effective
as selective extraction agents for divalent metal cations. However, both 1 and 2 exhibit only
marginal selectivity for Hg(II), a species of critical environmental importance."^"'*
CH3
OH
HO-
CH3
OH
HO-
N02
1 2
As part of our collective interests in this area, we initiated a joint effort to design,
construct, and characterize crown ether compounds with improved selectivity for binding
heavy metal cations. To this end, we have synthesized dibenzo analogs of 1 and 2, denoted

Schcnic 1
H2L
2 ©
A(|iie<)ii,s phase
Organic phase
ML

17
as CCE and FCE, respectively. In comparison to 1 and 2, the presence of the benzo groups in
both CCE and FCE should increase the rigidity of the crown ether ring, reduce the basicity of
the ring oxygens, and increase overall lipophilicity. We have found that the introduction of
the benzo groups produces ligands with an unprecedented selectivity for Hg(II). The
following sections describe these findings along with the synthesis, ionization behavior, and
divalent metal ion binding capabilities of these novel chromogenic and fluorogenic
ionophores.
CH3
CCE FCE

18
EXPERIMENTAL SECTION
Reagents and Instrumentation. Reagent-grade inorganic and organic chemicals
were obtained from commercial suppliers and used without purification. THF was distilled
from benzophenone ketyl and DMF was stored over 4 A molecular sieves for at least one
week. All aqueous solutions were prepared with distilled water that was subsequently
deionized using a Millipore Milli-Q Water System. Buffer solutions were prepared from
solutions of chloroacetic acid (for pH 2-4), 4-morpholinoethane sulfonic acid (for pH 4-8), or
boric acid (for pH >8) by adding tetramethylarmnonium hydroxide, lithium hydroxide or
sodium hydroxide solution until the desired pH was obtained.
Infixed (IR) spectra were acquired with a Perkin Elmer Model 1600 FTIR. NMR
spectra were recorded with a Bruker AF-200 spectrophotometer with chemical shifts reported
down field from TJ/IS. Determinations of pH were performed with an Orion Research
Digital lonalyzer (Model 501) and an Orion combination glass pH electrode (Model 91-04).
The pH electrode was calibrated with a set of standard aqueous buffer solutions (Fisher); all
values of pH independent of solution composition are reported with respect to this
calibration. Absorbance measurements were conducted with a computer-controlled Hewlett
Packard diode array spectrophotometer (HP8452A) at a spectral resolution of 2 nm and
integration time of 2 sec. Fluorescence measiurements were performed with a 1 cm quartz
cell and a SPEX double monochromator spectrofluorimeter (FluoroIog2-Fl 12AI) equipped
with a 450 W Xenon lamp; a spectral band pass of 1 nm and a scan rate of 1 nm/sec were
used. All the mathematical and graphical simulations were performed using a spread sheet
program (Kaleidagraph).
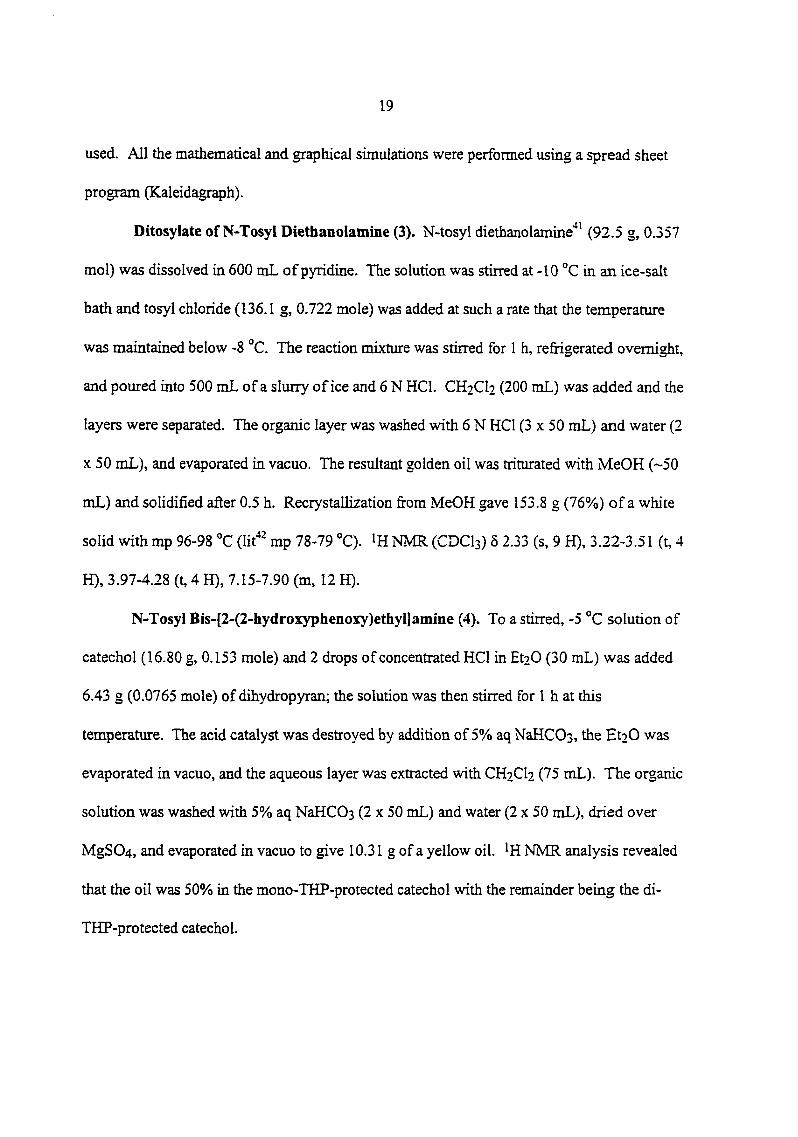
Ditosylate of N-Tosyl Diethanolamine (3). N-tosyl diethanolamine*^' (92.5 g, 0.357
mol) was dissolved in 600 mL of pyridine. The solution was stirred at -10 °C in an ice-salt
bath and tosyl chloride (136.1 g, 0.722 mole) was added at such a rate that the temperature
was maintained below -8 °C. The reaction mixture was stirred for 1 h, refrigerated overnight,
and poured into 500 mL of a slurry of ice and 6 N HCl. CH2CI2 (200 mL) was added and the
layers were separated. The organic layer was washed with 6 N HCl (3 x 50 mL) and water (2
X 50 mL), and evaporated in vacuo. The resultant golden oil was triturated with MeOH (-50
mL) and solidified after 0.5 h. Recrystallization from MeOH gave 153.8 g (76%) of a white
solid with mp 96-98 "C (lit'*^ mp 78-79 °C). ^H NMR (CDCI3) 5 2.33 (s, 9 H), 3.22-3.51 (t, 4
H), 3.97-4.28 (t, 4 H), 7.15-7.90 (m, 12 H).
N-Tosyl Bis-[2-(2-hydroxyphenoxy)ethyIlamine (4). To a stirred, -5 °C solution of
catechol (16.80 g, 0.153 mole) and 2 drops of concentrated HCl in Et20 (30 mL) was added
6.43 g (0.0765 mole) of dihydropyran; the solution was then stirred for 1 h at this
temperature. The acid catalyst was destroyed by addition of 5% aq NaHCOs, the Et20 was
evaporated in vacuo, and the aqueous layer was extracted with CH2CI2 (75 mL). The organic
solution was washed with 5% aq NaHCOs (2 x 50 mL) and water (2 x 50 mL), dried over
MgS04, and evaporated in vacuo to give 10.31 g of a yellow oil. NMR analysis revealed
that the oil was 50% in the mono-THP-protected catechol with the remainder being the di-
THP-protected catechol.
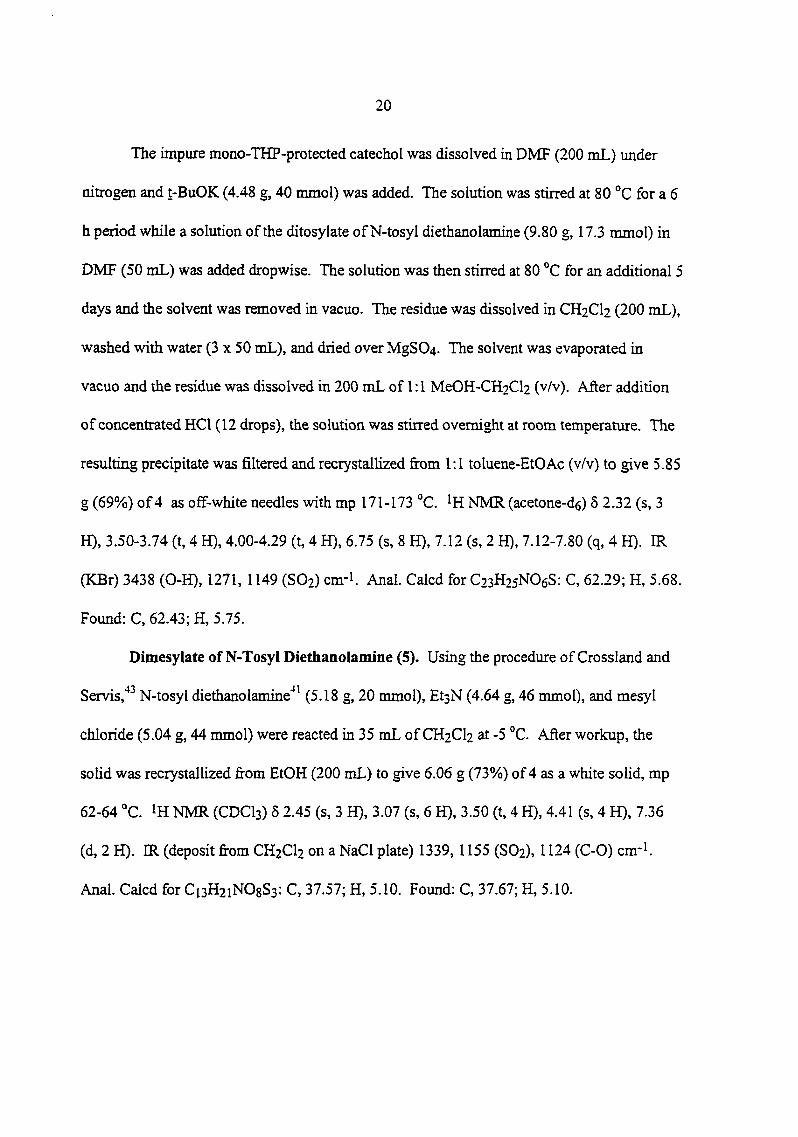
The impure mono-THP-protected catechol was dissolved in DMF (200 mL) under
nitrogen and t-BuOK (4.48 g, 40 mmol) was added. The solution was stirred at 80 °C for a 6
h period while a solution of the ditosylate of N-tosyl diethanolamine (9.80 g, 17.3 mmol) in
DMF (50 mL) was added dropwise. The solution was then stirred at 80 °C for an additional 5
days and the solvent was removed in vacuo. The residue was dissolved in CH2CI2 (200 mL),
washed with water (3 x 50 mL), and dried over MgS04. The solvent was evaporated in
vacuo and the residue was dissolved in 200 mL of 1:1 MeOH-CH2Cl2 (v/v). After addition
of concentrated HCl (12 drops), the solution was stirred overnight at room temperature. The
resulting precipitate was filtered and recrystallized from 1:1 toluene-EtOAc (v/v) to give 5.85
g (69%) of 4 as off-white needles with mp 171-173 °C, NMR (acetone-de) 5 2.32 (s, 3
H), 3.50-3.74 (t, 4 H), 4.00-4.29 (t, 4 H), 6.75 (s, 8 H), 7.12 (s, 2 H), 7.12-7.80 (q, 4 H). IR
(KBr) 3438 (0-H), 1271, 1149 (SO2) cm-l. Anal. Calcd for C23H25NO6S: C, 62.29; H, 5.68.
Found: C, 62.43; H, 5.75.
Dimesylate of N-Tosyl Diethanolamine (5). Using the procedure of Crossland and
Servis,"^^ N-tosyl diethanolamine"" (5.18 g, 20 mmol), EtsN (4.64 g, 46 mmol), and mesyl
chloride (5.04 g, 44 mmol) were reacted in 35 mL of CH2CI2 at -5 °C. After workup, the
solid was recrystallized from EtOH (200 mL) to give 6.06 g (73%) of 4 as a white soUd, mp
62-64 °C. IH NMR (CDCI3) 5 2.45 (s, 3 H), 3.07 (s, 6 H), 3.50 (t, 4 H), 4.41 (s, 4 H), 7.36
(d, 2 H). IR (deposit from CH2CI2 on a NaCl plate) 1339, 1155 (SO2), 1124 (C-0) cm*^
Anal. Calcd for C13H21NO8S3: C, 37.57; H, 5.10. Found: C, 37.67; H, 5.10.

21
N, N'-Ditosyl 4,13-Diazadibenzo-18-crown-6 (6). Bisphenol 4 (4.00 g, 9.0 mmol)
was dissolved in 500 mL of MeCN and powdered CS2CO3 (9.00 g, 23 mmol) was added.
The mixture was stirred at reflux for 5 h followed by the addition of a solution of dimesylate
5 (3.38 g, 8.14 mmol) in 45 mL of MeCN during a 2.2 h period. The mixture was refluxed
for 3 days and filtered. The filter cake was rinsed with CH2CI2. The filtrate and rinsing were
combined and evaporated in vacuo. The residue was chromatographed on silica gel with
CH2CI2 as eluent to provide 3.01 g (55%) of 6 as a white solid with mp 225-227 °C (lif"
215-216 °C). IH NMR (CDCI3-DMSO-D6 ca 10:1) 5 2.41 (s, 6 H), 3.73 (t, 8 H), 4.12 (t, 8
H), 4.12 (t, 2 H), 6.70-7.00 (m, 8 H), 7.28 (d, 2 H).
4,13-Diazadiben20-18-crowii-6 (7). To a mixture of cyclic ditosylamide 6 (4.10 g,
6.13 mmol) and Na2HP04 (1.85 g) in 410 mL of 5:1 dioxane-methanol (v/v) was added 60 g
of freshly prepared, pulverized 6% Na(Hg) amalgam."*^ The mixture was stirred at 80 °C for
2 days and filtered. The solvent was removed in vacuo and the residue was dissolved in
CH2CI2. The solution was washed with water until the aqueous layer was neutral, dried over
MgS04, and evaporated in vacuo to give 2.10 g (95%) of 7 as white needles with mp 181-
183°C (lit"" 175-177°C). N^IR (CDCI3) 5 2.42 (br s, 2 H), 3.13 (t, 8 H), 4.12 (t, 8 H),
6.85 (s, 8 H).
N,N'-Di(2-hydroxy-5-nitrobenzyl) 4,13-Diazadibenzo-18-crown-6 (CCE). A
solution of 7 (1.00 g, 2.79 mmol) and EtsN (1.20 g, 11.9 mmol) in 40 mL of THF was cooled
to 0°C and a solution of 2-hydroxy-5-nitrobenzyl bromide (1.28 g, 6.13 mmol) in 20 mL of
THF was added over a 20-min period. The mixture was stirred at 0 for 8 h, refluxed for 4

h, and filtered. The filter cake was washed with cold THF and cold deionized water (3 x 20
mL) and dried with a CgHe azeotrope in a Dean Stark trap. The CgHg was evaporated in
vacuo to provide 1.67 g (93%) of CCE as a light yellow sohd with mp 225-227 °C (dec).
NMR (DMS0-d6) 5 3.17 (t, 8 H), 3.91 (s, 4 H), 4.12 (t, 8 H), 6.70-7.00 (m, 10 H), 8.00 (d, 2
H, Jo = 8.96 Hz, Jm = 2.90 Hz), 8.18 (d, 2 H, J = 2.88 Hz). IR (KBr) 3498 (OH), 1336
(NO2), 1253, 1218, 1124(C-0)cm-l. Anal. Calcd for C34H36N4O10: C, 61.81; H, 5.49.
Found: C, 61.87; H, 5.46.
N,N'-(7 -Hydroxy-4-methylcoumarin-8-methyIene) 4,13-Diazadibenzo-18-crown-
6 (FCE). To 0.60 g (1.67 mmol) of 7 dissolved in 53 mL of 15:1 THF-DMF (v/v) with
gentle warming, 7-hydroxy-4-methylcoumarin (0.66 g, 3.74 mmol) dissolved in 3 mL of
THF was added followed by 0.41 g (5.0 mmol) of formalin. The mixture was stirred for 8
days at room temperature and the solvent was removed in vacuo with heating up to 70 °C.
The residue was suspended in 150 mL of CeHfi and refiuxed in a Dean Stark trap for 2 days.
The dried mixture was filtered and the filter cake was rinsed with CgHg. The filter cake was
place in a small extraction thimble and extracted with CHCI3 in a hot vapor extraction
apparatus for 5 days. The CHCI3 solution was filtered and the filter cake was rinsed with 3
mL of cold CHCI3 to afford 0.66 g (54%) of FCE as a white solid which had very poor
solubility in common organic solvents. IR (deposit from a CDCI3 solution on a NaCl plate)
1706 (C=0), 1208,1128 (C-0) cm'l. Anal. Calcd for C42H42N2O10: C, 68.65; H, 5.76.
Found: C, 68.49; H, 5.50. Based on its poor solubility, the white solid was suspended in 20
mL of CHCI3 and 2.0 g of freshly ground K2CO3 was added. The mixture was stirred
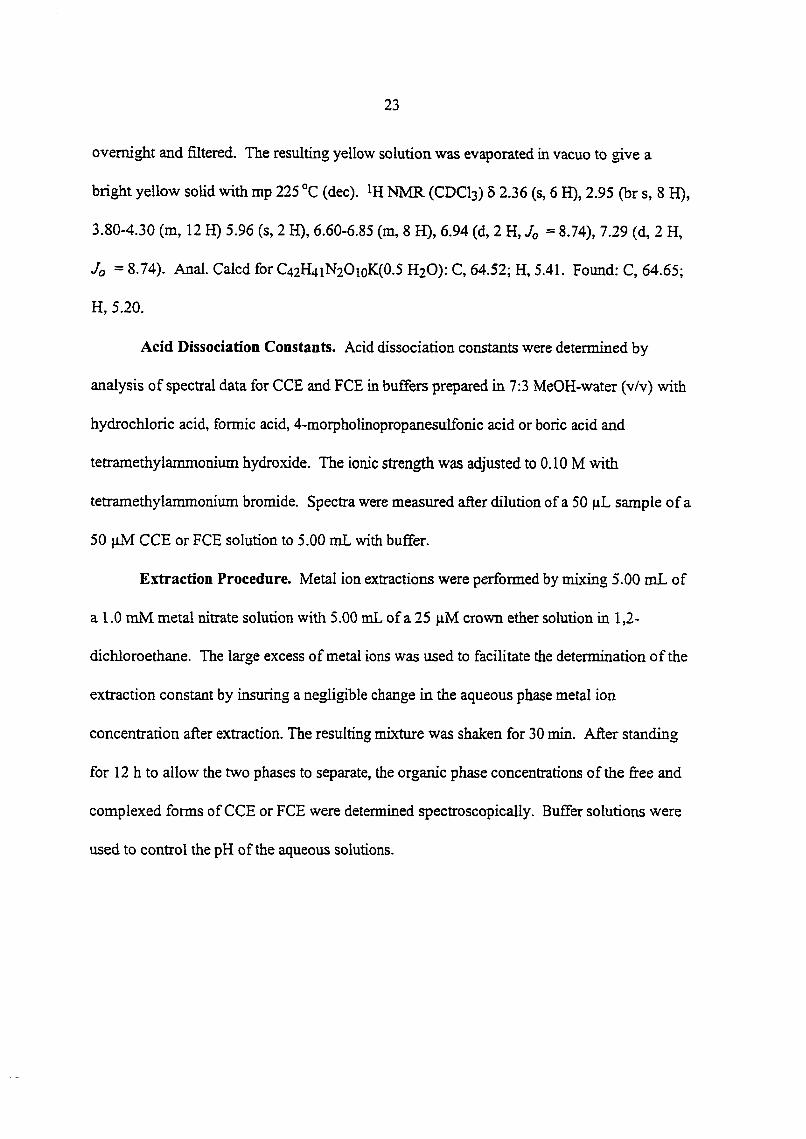
overnight and filtered. The resulting yellow solution was evaporated in vacuo to give a
bright yellow solid with mp 225 °C (dec). iR NMR (CDCI3) 5 2.36 (s, 6 H), 2.95 (br s, 8 H),
3.80-4.30 (m, 12 H) 5.96 (s, 2 H), 6.60-6.85 (m, 8 H), 6.94 (d, 2 H, = 8.74), 7.29 (d, 2 H,
Jo = 8.74). Anal. Calcd for C42H4iN20ioK(0.5 H2O): C, 64.52; H, 5.41. Found: C, 64.65;
H, 5.20.
Acid Dissociation Constants. Acid dissociation constants were determined by
analysis of spectral data for CCE and FCE in buffers prepared in 7:3 MeOH-water (v/v) with
hydrochloric acid, formic acid, 4-morpholinopropanesulfonic acid or boric acid and
tetramethylammonium hydroxide. The ionic strength was adjusted to 0.10 M with
tetramethylammonium bromide. Spectra were measured after dilution of a 50 sample of a
50 |iM CCE or FCE solution to 5.00 mL with buffer.
Extraction Procedure. Metal ion extractions were performed by mining 5.00 mL of
a I.O mM metal nitrate solution with 5.00 mL of a 25 |iM crown ether solution in 1,2-
dichloroethane. The large excess of metal ions was used to facilitate the determination of the
extraction constant by insuring a negligible change in the aqueous phase metal ion
concentration after extraction. The resulting mixture was shaken for 30 min. After standing
for 12 h to allow the two phases to separate, the organic phase concentrations of the firee and
complexed forms of CCE or FCE were determined spectroscopically. Buffer solutions were
used to control the pH of the aqueous solutions.

RESULTS AND DISCUSSION
Synthesis of CCE and FCE. The routes for the synthesis of CCE and FCE are
shown in Scheme 2. Although the preparation of the key intermediate 4,13-diazadibenzo-l 8-
crown-6 (7) was first communicated by Hogberg and Cram"" in 1974, only a very low yield
was reported. Using Scheme 2, 7 was obtained in a much higher yield in only three steps.
Intermediate 7 was then converted to CCE and FCE by one-step adaptations of reactions
utilized by Takagi and co-workers for the preparation of 1^^ and l}'^ The final coupling of
the fluorophore unit in FCE was more difficult to achieve than the chromophore coupling to
give CCE. FCE had very poor solubility in common organic solvents and was transformed
into a more soluble potassium monophenoxide form by reaction with K2CO3.
General Reactivity Considerations and Formulation for the Determination of
Acid Dissociation Constants for CCE and FCE. Diazacrown ethers with two proton-
ionizable chromogenic and fluorogenic side arms behave as polybasic acids."^"^'^^ As such,
the stepwise acid-base equilibrium for CCE and FCE can be written as:
H4L2- = H3L- + (1)
= H2L + (2)
H2L = HL- + (3)
HL- = L2- + (4)

Scheme 2^
^ (a) t-BuOK, DMF. (b) Cs^COj, MeCN. (c) Na(Hg), Na2HP04, MeOH. (d) 2-Hydroxy-4-mtrobenzyI bromide, EtsN, THF. (e) 7-Hydroxy-4-methyIcoumariii, formalin, THF-DMF.
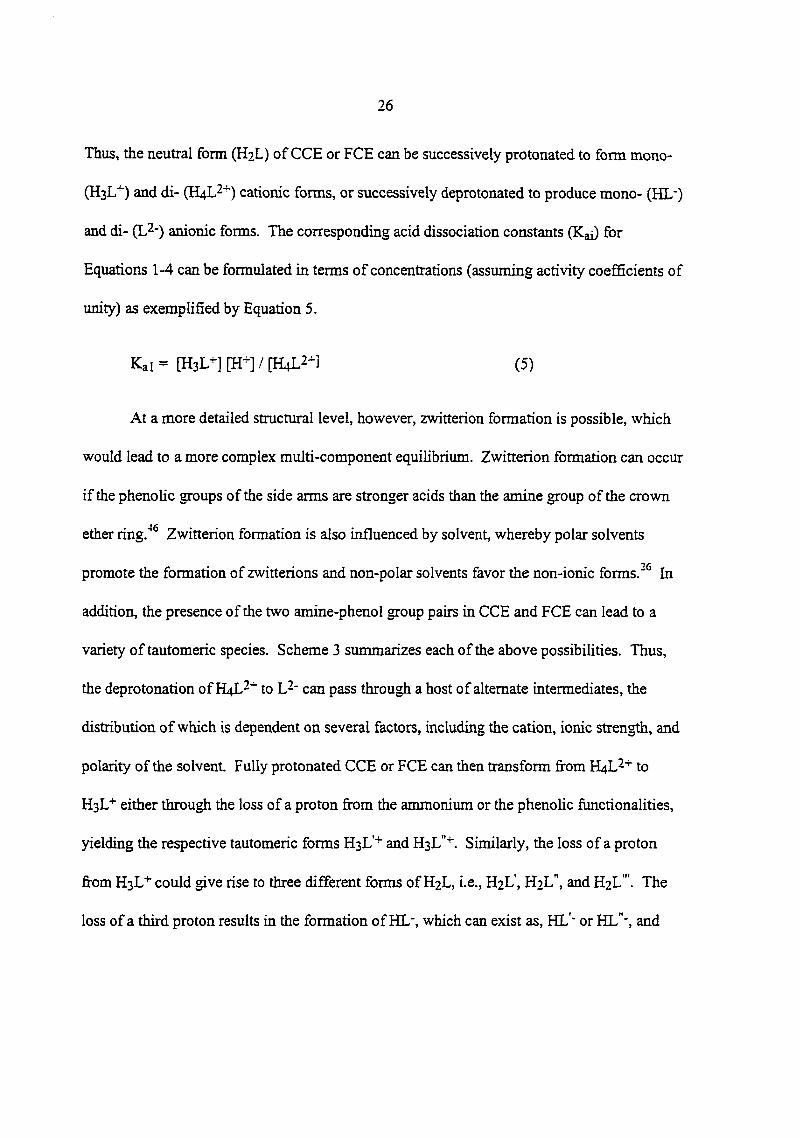
Thus, the neutral form (H2L) of CCE or FCE can be successively protonated to form mono-
(HsL"^) and di- cationic forms, or successively deprotonated to produce mono- (HL")
and di- (L^-) anionic forms. The corresponding acid dissociation constants (Kai) for
Equations 1-4 can be formulated in terms of concentrations (assuming activity coefBcients of
unity) as exemplified by Equation 5.
Kai = [HjLT [HT / [H4L2^ (5)
At a more detailed structural level, however, zwitterion formation is possible, which
would lead to a more complex multi-component equilibrium. Zwitterion formation can occur
if the phenolic groups of the side arms are stronger acids than the amine group of the crown
ether ring."*^ Zwitterion formation is also influenced by solvent, whereby polar solvents
promote the format ion of zwi t te r ions and non-polar so lvents favor the non- ionic forms. In
addition, the presence of the two amine-phenol group pairs in CCE and FCE can lead to a
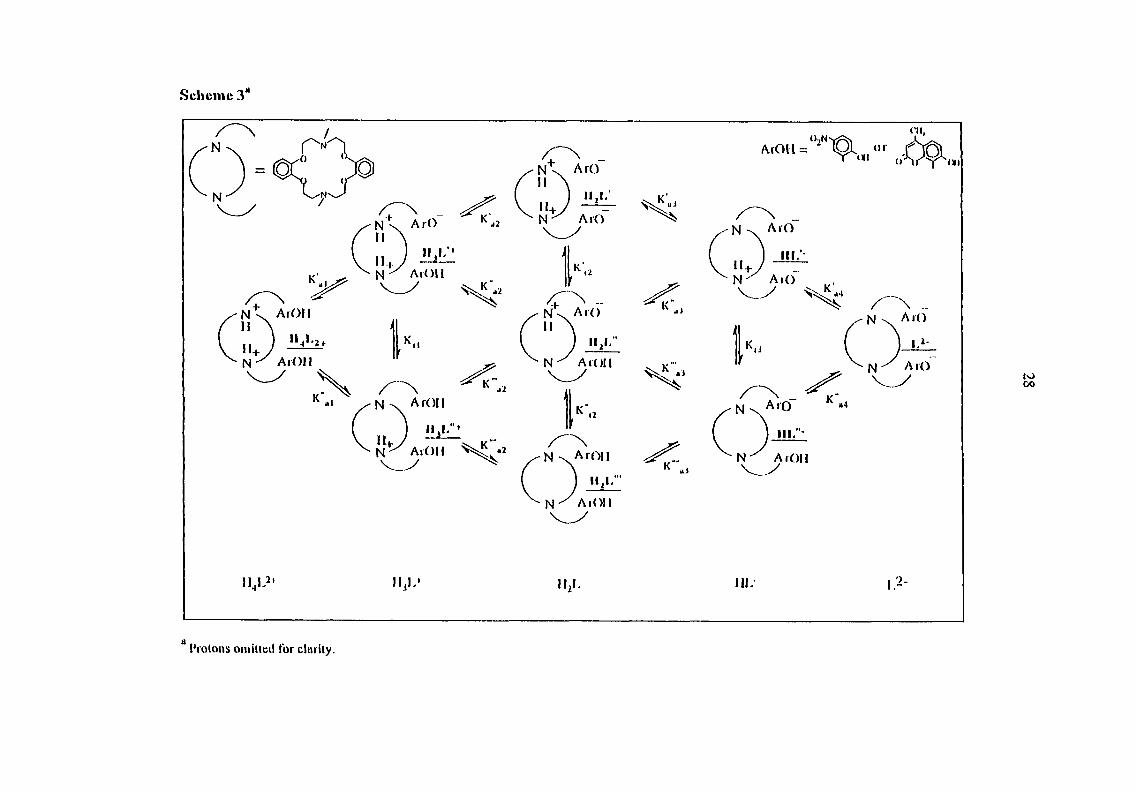
variety of tautomeric species. Scheme 3 siimmarizes each of the above possibilities. Thus,
the deprotonation of H4L2~ to L-" can pass through a host of alternate intermediates, the
distribution of which is dependent on several factors, including the cation, ionic strength, and
polarity of the solvent. Fully protonated CCE or FCE can then transform from to
either through the loss of a proton from the ammonium or the phenolic functionalities,
yielding the respective tautomeric forms HsL'"*" and HsL""^. Similarly, the loss of a proton
from HsL"^ could give rise to three different forms of H2L, i.e., H2L', H2L", and H2L'". The
loss of a third proton results in the formation of HL", which can exist as, HL'" or HL"-, and
27
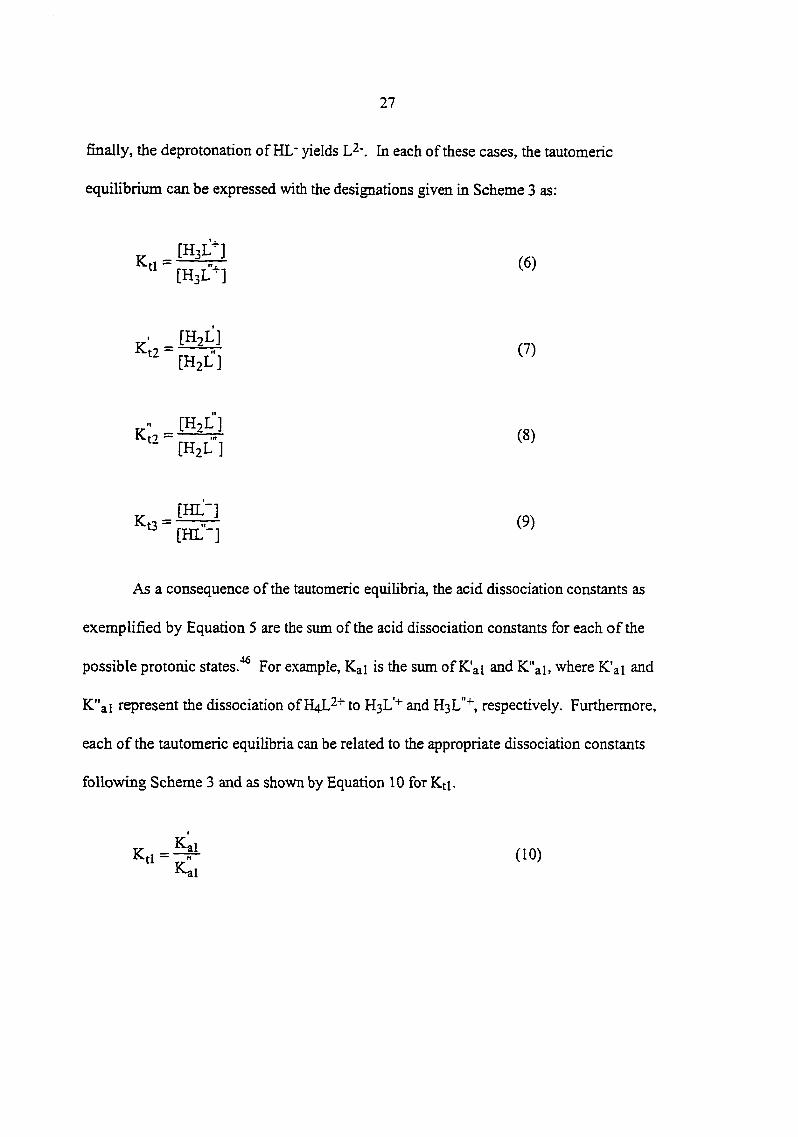
finally, the deprotonation of HL" yields L^". In each of these cases, the tautomeric
equilibrium can be expressed with the designations given In Scheme 3 as:
[H3L"]
K;,=ay (7) [HjL]
[H^L ] Kp = (8)
[H2L ]
K .3=^ (9) " [HL-]
As a consequence of the tautomeric equilibria, the acid dissociation constants as
exemplified by Equation 5 are the sum of the acid dissociation constants for each of the
possible protonic states/*^ For example, Kai is the sum of K'ai and K"ai, where K'ai and
K"ai represent the dissociation of H4L2''' to and respectively. Furthermore,
each of the tautomeric equilibria can be related to the appropriate dissociation constants
following Scheme 3 and as shown by Equation 10 for Kti.
K , i=f^ (10) IVal
Scheme 3*
ArO
ArO ArO
ArOU
111
ArOlI
ArOn
Protons oiniKcd for cluri ly.
(•II,
cv. K' ,
< Nj ^ ArO
N' ArO
|\ j ArO
N A rO
M ^ A rO
N-' ArOlI
I IL

To complete the development of the multi-step equilibrium for CCE and FCE, the
analytical concentration of the crown ether (C^) can be defined as the siim of the
concentrations of all of their possible protonic states and is expressed by Equation 11.
[H4L2T + [HsLT + [H2L] + [HL-] + [L2-] (11)
Combining the formulization for the acid-base equilibria for reactions 1-4 with that in
Equation 11, the concentration of each protonic form of the crown ether as a fimction of
hydrogen ion concentration can be written as represented in Equation 12 for H4L2"^.
[H4L2+] = Ct[HT»/G (12)
where,
G = [H-]4 + [H+]3 Kai + [H-]2 Kai Kal + [H^ Kai Ka2 Ka3 + Kal Ka2 Ka3 Ka4
Finally, following the additivity law, the absorbance (A^ of a solution of CCE or
FCE at a given wavelength (X) can be written as:
where is the molar absorptivity for each of the forms of CCE or FCE at k and £ is the
optical path length in a transmission measurement. These formulations will be used in a
subsequent section to characterize the equilibria for CCE and FCE.

Optical Properties of CCE and FCE as a Function of Solution pH and Acid
Dissociation Constants, (a) Optical Properties. Figure I details the absorption spectra of
CCE between 250 and 500 nin as a function of pH. A 7:3 MeOH-water (v/v) solution was
used for solubility purposes. At pH 2 and below (Figiire la), CCE has an absorption
maximum at 312 nm. Increases in pH (Figures la-d) results in the appearance of a new
feature at much longer wavelengths that undergoes a continuous evolution in neutral and
alkaline solutions. At pH 12 and above, the absorbance maximum is at 410 nm. Over this
pH range, four isosbestic points are observed: 326 nm in the pH range of 2-5 (Figure la), 340
nm in the pH range of 5-7 (Figure lb), 358 nm in the pH range of 7-9 (Figure Ic) and 374 nm
at pH 9-12 (Figure Id). The existence of the four isosbestic points is consistent with the
stepwise deprotonation process shown in Scheme 3. In addition, as described shortly, the
continual evolution of the spectrum reflects the existence of a tautomeric equilibrium at each
step in the dissociation process.
Considerations of the acid-base chemistry and the related optical properties of the
parent chromophore of CCE (i.e., p-nitrophenol) provide insight into the structural changes
that accompany the spectral changes shown in Figure 1. Based on the pH-dependent spectral
data for structural analogs of the chromophoric side arms of CCE (i.e., p-nitrophenol and 2-
hydroxy-5-nitrobenzyl alcohol^^'"*'), the changes in the spectra at high pH (Figures lc,d)
primarily reflect the acid-base chemistry of the side arms. The acid-base chemistry of the
amine fimctionaUties is therefore dominant at low pH. However, the tautomeric
transformation of a small amount of the chromophoric side arm gives rise to a small spectral
change m the low pH region.

31
pH 2.01
pH 2.47
pH 3.41
- - pH 3.88
pH 4.60
pH 3.30 pH 5.86 pH6.I2 pH 6.40 pH 6.78 pH 7.33
pH 7.33 • • • pH 7.87 - • pH 8.35
• pH 8.65 - - pH 9.02
pH 9.43
pH 9.43 pH 9.74
• pH 10.07 pH 10.47
- pH 10.96 pH 11.98
350 400 Wavelength (mn)
Figure 1. Absorbance spectra of CCE in 7;3 MeOH-water (v/v) as a function of pH between: a) 2.01-4.60, b) 5.30-7.33, c) 7.33-9.43, and d) 9.43-11.98. The arrows point to the isosbestic points.

Absorption spectra for FCE were also examined as a function of pH under the same
experimental conditions used for Figure 1. A portion of the results is shown in Figure 2.
Though the spectra lack well defined isosbestic points (an observation not at present
understood), the overall behavior of FCE is similar to that of CCE, with absorbance maxima
at slightly longer wavelengths at low pH and slightly shorter wavelengths at high pH. The
pH range for the transformations occurs at slightly higher values (~3 to 12.5). Further, a
comparison of the spectra of FCE between pH 8 and 11 (see Figure 2) with those of the
parent chromophore (7-hydroxy-4-methylcoumarin) reveals that the changes in the high pH
range arise primarily from the dissociation of the phenolic protons. Therefore, as with CCE,
the changes in the spectra at low pH are attributed to the acid-base chemistry of the amine
functionalities and the corresponding tautomeric equilibria.
(b) Determination of Acid Dissociatioii Constants. Based on the above
observations, CCE and FCE are present predominantly in their forms at pH 2. Thus,
the absorption coefficient (S^i) H4L2'^ can be readily calculated. The same analysis can
be applied to the data at the upper pH limit where CCE and FCE exist ahnost exclusively in
their L^- forms. Additionally, since the absorbance for CCE at 358 nm remains constant in
the pH range 4 to 5 and 7 to 10, and the absorbance for FCE at 344 mn remains constant in
the pH range 5 to 6 and above pH ~8, the values of pKai and pKai can be determined. The
value of pKai is found from the absorbance data below pH 5. The value of pKa2 can be
determined from the absorbance data between pH 5 and 7 using the method described by
lO Albert and Seijeant,

0.02
<u o 0 od A o c« <1
0.01
0 250 300
U1 Ui
350 400
Wavelength (nm)
450 500
Figure 2. Absorbance spectra of FCE in 7:3 MeOI I-water (v/v) as a ftinclion of pM: a) 1.9, b) 4.0, c) 6.2, tl) 7.2, e) 8.2, 0 9.4, g) 9.9, h) 10.3,1) 11.2 and j) 12.0.

34
pKa = pH-fIog ^ (14) A-Ain
where A is the absorbance at the analytical wavelength (358 nm for CCE and 344 nm for
FCE) and is the sum of the absorbances of the deprotonated species (AJ) and its conjugated
acid (Ahi).
The remaining two pKa values can be determined by a mathematical simulation of the
equilibria using the absorption maxima for the protonated and deprotonated forms of the
chromophores. This was accomplished by estimating values for Sx.,H3L*"' '
^ A,,HLr» P^a3 pKa4, and then calculating absorbances using Equation 13 at all
three wavelengths for the absorbance spectra shown in Figures I and 2. Typically, the first
estimates for ^A.,HLr chosen to be between the values for
and L^-. The two pKa values and absorption coefficients were changed iteratively
(increments of 0.05 and 100 M"^ cm-l for the pKa values and absorption coefficients,
respectively) until the average relative deviation between the simulated and experimental
absorbance data at each of the three wavelengths was less than 5%. The simulated and
measured absorbances at the three wavelengths are compared in Figure 3 a for CCE and
Figure 3b for FCE. The simulated data are shown by the solid lines. The agreement between
the simulated and the experimental data at all three wavelengths confirms the effectiveness of
the simulation. The absorption coefficients for the different ionized forms of CCE and FCE
in 7:3 MeOH-water (v/v) are listed in Table 1. The pKa values are listed in

35
0.02
0.01 r
D •J 0
0.01 -
0 6 8
PH
10 12
Figure 3. Measiored absorbances (a) for CCE in 7:3 MeOH-water (v/v) at 312 mn (o), 358 mn (A), and 410 nm (o), and (b) for FCE in 7:3 MeOH-water (v/v) at 322 nm (o), 344 nm (A), and 372 nm (0) in the pH range of 2-12. Circles, triangles and diamonds represent experimental data and solid lines represent the simulated data. The uncertainty of the absorbance data is about the size of the symbols.

Table 2, which also includes the results of a study of ionic strength effects (see below) and
comparison with the pKa values for 1, 2 and related functional analogs.
In agreement with the earlier interpretation of the optical data, the pKa values for p-
nitrophenol given in Table 2 support the general assignment of the processes at high pH to
the transformation of the phenolic functional groups of CCE. However, the differences in the
pKa values for each of the steps indicates that a subsequent dissociative step initiates before
completion of the ongoing step. These transformations, when coupled with the existence of
tautomeric equilibria, hinder an overall structural description for each of the steps in the
dissociation process. Nevertheless, each dissociative step can proceed through a variety of
possible pathways, with the viability of each pathway dependent on the polarity and ionic
strength of the solution. The existence of multiple pathways in the dissociation of CCE is
evident from the spectral data shown in Figure la which reflects the conversion of to
HsL"^. This series of spectra exhibit an increase in the absorbance at the absorbance
maximum (410 nm) for the L^- form of CCE that corresponds to -10% conversion of the
chromophoric side arms. This low level of conversion is inconsistent with a transformation
that occurs solely through either of the two pathways in Scheme 3. Thus, the loss of the first
proton from CCE yields both (~90%) and (-10%) as products."^' These data
also reveal that Kai" is greater than Kai' by almost an order of magnitude and that Kti is -9.
(c) Effects of Ionic Strength and Identity of Cation. The effects of the ionic
strength of the solution and of the identity of the cation on the acid-base chemistry of CCE
and FCE have also been investigated. An assessment of the former provides insight into the

37
Table 1. Molar Absorptivities (S x 10'^, L mof' cm"') of CCE and FCE at selected wavelengths in 7:3 methanol-water (v/v).
species CCE
312 nm 358 nm 400 nm
H4L2^ 19.2 4.4 1.0
HsL^ 16.2 10.0 1.8
H2L 15.6 13.0 9.0
HL- 9.0 13.0 22.2 L2- 4.6 11.8 40.2
species FCE
322 nm 344 nm 370 mn
H4L2+ 25.7 12.3 0.6
HbL^ 23.4 19.0 5.6
H2L 25.1 21.7 5.6
HL- 17.5 21.7 18.5
L2- 8.2 21.7 36.2
possible pathways for the dissociation of the two species. A study of the latter probes the
importance of cation uptake into the crown ether cavity on reactivity. The results of these
experiments, which used (CH3)4N''', Li"^, and Na"^ as cations and focused primarily on CCE,
are summarized in Table 2.
The ionic strength dependences of the acid-base chemistry were examined using two
different cations: (CH3)4N'^ and Li"*". In both cases, the pKa values in the first, second and
fourth dissociative steps exhibited an increase as the ionic strength of the methanolic solution
increased, whereas the value for pKas remained essentially constant. The trends in the pKai,
pKa2, and pKa4 values can be qualitatively attributed to the relative stabilization of each of

Table 2. Acid Dissociation Constants for CCE, FCE, and Related Compounds in Solutions of Varied Ionic Strength and Cation Content.
compd solvent ionic strength (M) cation pKui pKa2 pKa3 pKu4
CCE 70%MeOH .01-.035 (CH3)4N'- 3.42 6.00 8.15 9.65
CCE 70%MeOH 0.1 (cn3)4N+ 3.90 6.30 8.20 10.10
CCE 70%MeOIl 0.1 Na+ 3.50 6.00 8.00 8.90
CCE 70% MeOH 0.01-0.1 Li+ 3.60 6.20 8.15 9.75
CCE 70%MeOH 0.5-0.7 Li+ 3.95 6.48 8.10 10.15
la 10%Dioxane 0.1 (CH3)4N+ 4.03 5.52 9.80 -
p-nitrophenol^ Water 7.15 - - -
p-nitrophenol'^ 70%MeOH 0.1 (CU3)4N+ 8.03 - - -
FCE 70%MeOH .01-.035 (CH3)4N+ 4.30 7.21 9.35 10.05
FCE 70%MeOH O.l Na+ 4.80 6.40 8.30 10.00
FCE 70%]V!e011 0.01-0.1 Li+ 4.40 7.00 9.65 10.40
2d 10%Dioxane 4.28 7.23 10.38 -
7-hydroxy-4-methylcoumarin® Water 7.84 - - -
7-hydroxy-4-methyl coumarin'^ 70%Me01I 0.1 Na+ 8.80 - - -
" Reference26. Reference46, pi45. '"Vaidya, B.; Porter, M., unpublished results. *'Reference 33. " Mov'\ya,T. Bull. Chem. Soc. Jpn. 1983, 56, 6-14.

the possible species in each of the dissociative steps from microscopic charge
considerations/® Thus, in agreement with the analysis of the optical data shown in Figure la,
the transformation of H4L2+ to HsL"^ leads primarily to HsL""'" (as opposed to ) as the
more stable product. That is, the increase in the pKai with the increase in the ionic strength
as observed for CCE in Table 2 argues that the higher ionic strength favors the protonated
form more than the deprotonated form (HsL"'"). Since HsL'"*" has larger relative
charge separation than HsL"'*' should be the major species formed.
The second dissociative step, H3L"^-> H2L, can be analyzed in a similar, but more
qualitative, manner. From the ionic strength dependences, there are two possible dominant
pathways: HsL"*"' -> H2L" and H2L'". Both pathways are expected to exhibit an
increase in pKa values with increasing ionic strength. The spectroscopic data reveal that
-30% of the chromogenic side arms have been affected by the transformation at the
completion of the second dissociation step. Therefore, a large fraction (~70%) of H2L must
be present as H2L'". These data, together with the shift of tautomeric equilibria toward
species with a lower charge as ionic strength decreases, indicate that H2L'" and H2L" are
present to a greater extent than H2L'. These conclusions are consistent with the pathways
predicted by the ionic strength dependences, although small contributions from the other two
pathways are also possible.
The development of a description of the pathways for the third dissociative step is
also hampered by the complexities affecting the above treatments. Based on the large
relative amounts of H2L" and H2L" prior to dissociation and the virtual absence of an ionic

strength dependence of the pKa values, it is likely that all three of the possible conversions
are of importance. The collective result of these conversions yields roughly equal amounts of
HL'- and HL"-, with HL"- present at a marginally (a few percent) larger amount over HL'".
Lastly, the ionic strength dependences for the conversion of HL" to L-' indicate that
the favored pathway is the conversion of HL'" to L^-. This finding suggests that the
tautomeric conversion of HL"" to HL'" plays an obvious role in the process by the resupply of
HL'- when converted to L^".
The cation dependences reveal that the acid strengths of the ionizable protons in each
of the steps are affected by Na""", but not notably so by Li"*" and (CH3)4N^. Comparisons of
the sizes of each of these species to the cavity diameters of CCE and FCE reveal that Li"^ has
an ionic diameter (1.80 smaller than that required for strong interactions within the
cavity and that steric effects block the movement of (CH3)4N'^ (ionic diameter of 4.30
into the cavity. On the other hand, the uptake of Na"^ (ionic diameter of 2.32 A^') is driven in
part by a more favorable size match up with the cavity of the parent crown ether, 18-crown-6
(diameter 2.68-2.86 A^^). This added driving force results in the uptake of Na"^ by CCE,
which induces an effective decrease in the pKa value. Thus, the pKa data obtained using Li"^
and (CH3)4N'^ more accurately reflect the intrinsic reactivity of each of the dissociative steps.
We believe that similar arguments apply to an acid-base reactivity description of FCE.
In closing this section, we note that only three acid-base transitions have been
reported for 1 and 2, and structurally related compounds.^®*^^"^^ It is not yet clear whether
these differences reflect the inherent reactivity of the compounds or the properties of the

41
solvent system (e.g., the 7:3 MeOH-water solvent system used herein and the 1:9 dioxane-
water solvent system utilized in the studies of and 2^^).
Metal Ion Extraction, (a) Equilibrium Formulation. Capabilities of CCE and
FCE for extraction of divalent metal cations into 1,2-dichloroethane were tested. As a
starting point, the overall equilibrium for the extraction of a metal ion by a proton-ionizable
crown ether is considered. A generalized description of the overall process is shown in
Scheme 4, which depicts the transfer of the neutral extractant from the organic phase to the
aqueous phase, the multi-step ionization and metal ion complexation in the aqueous phase,
and the movement of the neutral complex (ML) into the organic phase. The equilibrium
between H2L in an organic phase and a divalent metal cation, M-"'", in aqueous phase can
then be described as:
[H2L]o + [M2^aq = [ML]o + (15)
where [H2L]o and [ML]o are the equilibrium concentrations of H2L and ML in the organic
phase and [M^'^'Jaq and [H"^]aq are the equilibrium concentrations of M^"^ and in the
aqueous phase, respectively. The extraction constant for this eqmlibrium, K^x, is written as:
Kex-p ^ rA/T^+l [H2L]o[M ]aq
This equation can be recast to give:
log Kex = log q - 2 pH - log[M2^]aq (17)

Scheme 4
HzL HL H M li
H2L
Aqueous phase
Organic phase

where q = [ML]o / [H2L]o.
(b) Metal Ion Extraction. Figures 4-6 summarize the extraction data of CCE and
FCE for Ba(II), Ca(II), Cd(II), Cu(II), Hg(II), Pb(II), and Sr(II). Figure 4 shows the
absorption spectra of CCE in 1,2-dichloroethane before (spectrum a) and after extraction of
Hg(n) (spectra b-i) as a function of the pH of the aqueous solution. The pH was varied
incrementally between 2 and 4. Formation of the complex results in a bathochromic shift in
the spectrum and an increase in molar absorptivity as compared to the spectrum of
uncomplexed CCE. Increasing the pH of the aqueous solution enhances formation of the
complex, which reaches a maximum at ~pH 4. The absorbance maximum of the complex is
388 nm and has an s of 4.1 X lO'^ L mol"^ cm"^ An isosbestic point at 348 nm confirms the
existence of only two forms of CCE in the organic phase as well as the negUgible loss of
CCE to the aqueous phase during the extraction process.
The complexes formed by CCE and FCE with the other metal ions exhibit similar
spectral characteristics, but have different pH dependences. For example, Figure 5 presents
the pH dependent absorption spectra of FCE in 1,2-dichloroethane before and after the
extraction of Cd(II). Changes in the spectra are similar to those noted in Figure 4. In the
case of Cd(iri, however, the uptake by FCE as well as by CCE (see below) occurs at higher
pH values, which translates to lower values for K^x-
Figures 6a and 6b summarize the pH dependences of the metal complexation for CCE
and FCE, respectively. For each of the cations, the plots of log q exhibit a linear dependence
on pH with a nominal slope of 2. This dependence confirms the general applicability of

280 320 360 400 440
Wavelength (nin)
Figure 4. Absorbance speclra for 25 fiM CCE solutions in 1 ,2-dichloroethane before (a) and afler extraction of Ily(ll) from an aqueous 1.0 niM nji(n) solulion at pll: 2.0 (b), 2.2 (c), 2.5 (d), 2.7 (e), 3.0 (0, 3.2 (g), 3.4 (h) and
3.9 (i).

0.5
360 400 320 280
Wavelength (nm)
Figure 5. Absorbance spectra for 25 fiM FCn solutions in 1,2-tlicIiloroelhane before, (a) atuI arter extraction of Cd(ll) from aqueous 1 niM Ctl(II) solution at pU: 5.8(b), 6.0(c), 6.3((l), 6.5 (e), 6.8 (f), 7.0 (g), 7.3 (h) and 7.6 (i).

46
1
0
• Hg(l l )
X Cu(l l ) • Cd{ll)
s Ca(I I )
O Sr(l l ) { Q Ba(l l ) !
1
1
0
1
1 3 pH
Figure 6. Selectivity of CCE (a), and FCE (b) shown by log ([ML]o/[H2L]) vs. pH plots where, MCH) is Hg(II), Pb(II), Cu(II), Cd(II), Ca(II), Sr(I[), Ba(II).

Equation 15 in describing the extraction process. The changes in the spectral properties of
the chelates upon complexation, which are similar to those observed for the dissociation of
the phenolic protons of H2L to L^- in Figures 1 and 2, are consistent with this conclusion.
The pH dependences of log q shown in Figure 6 can be used to calculate the values of
Kex for each of the metal ions with CCE and FCE. These data are presented in Table 3,
together with reported values for 1^' and 2.^^ CCE and FCE display similar, but not identical
binding preferences. For CCE, the order is Hg(II) > Pb(II) > Cu(II) > Cd(n) > Ca(n) > Sr(II)
> Ba(II). The order for FCE is Hg(II) > Cu(II) > Pb(II) > Cd(II) > Ca(II) > Sr(II) > Ba(II).
The selectivity of CCE for Hg(II) over the next best extracted cation, Pb(II), is 2 X 10^ and
that for FCE for Hg(II) over the next best extracted cation, Cu(n) is 5 X 10^. Both values
reflect unprecedented selectivities for Hg(II). Comparisons to the Kex values for 1 and 2
further reveal that both CCE and FCE have significantly greater binding strengths for Hg(IO,
suggesting an opportunity for these novel crown ethers in chemical analysis (see below).
Insights into the complexation properties of CCE and FCE towards Hg(II) can be
developed by comparison with those of 1 and 2. With the important exception of Hg(II), the
orders of preference toward metal ion binding for CCE and 1 are the same. However, the
binding by CCE of cations other than Hg(n) is notably weaker than that of 1. The same
conclusion, based on a more limited comparison of divalent metal ion species, is applicable
for FCE relative to 2. These diJSerences in binding reflect a complex mixture of chemical
and structural effects^^ which include the relative sizes of the crown ether ring and the cation,
the size and spatial orientation of the side arms, and the relative hardness/softness of the

Table 3. Extraction Constants and selectivity Factors of CCE, FCE, 1, and 2 for Ba(ll), Ca(II), Cd(II), Cu(ll),
Hg(n), Pb(Il), and Sr(ll).
Metal Ion CCE
-log K,
lb
ex
FCE CCE
Selectivity Factor"
FCE 1
Hgdl) 0.28 5.8 2.20 A 1 1 1
Pb(ll) 7.58 5.4 8.92 d 2.0 X 10^ 5.2 X 10^ 0.4
Cu(II) 8.52 5.6 7.94 d 1.7 X 10^ 8.7 X 10⁵ 0.6
cd(n) 10.50 8.4 10.80 d 1.6 X lOlO 4.0 X 10^ 4.0X10-
Ca([I) 15.30 12.5 16.70 14.7 6.8 X 10^5 3.2 X lOl'* 5.0 X 10<j
Sr(ll) 16.40 13.5 19.10 16.1 1.3 X 10^6 7.9 X I0l6 5.0 X 10^
Ba(ll) 17.70 15.1 20.70 17.1 2.7 X 10'7 3.2 X lO"^ 2X lO'O
" Selectivity factor = Kex (Hg)/Kex(M(Il)). " Reference 31. Reference 35. '' Data not available.

interactions of the active groups in the cavity. We attribute the generally lower BCex values of
CCE and FCE relative to 1 and 2, respectively, to the increased rigidities of the cavities of
CCE and FCE that resxilt from the incorporation of the two benzo groups into the ring. This
stiffening represents a barrier to the adaptation of a structural arrangement favorable for
interaction of CCE and FCE with metal ions. On the other hand, the reduction of electron
density at the four alkyl-aryl ether oxygens due to delocalization by resonance into the benzo
group substiments of CCE and FCE provides for softer ring oxygen binding sites that
enhance the extraction of the soft metal Hg(II). Together, these effects result in the
remarkable selectivity of CCE and FCE towards Hg(II).
The differences in the K^x values of CCE and FCE can also be ascribed to steric
effects that are coupled with chemical affinity issues. With the exception of Cu(II), the K^x
values of CCE for all of the metal ions examined are larger than those of FCE. The
differences for each metal ion reflect contributions from the steric hindrance imposed by the
more bulky side arms and the weaker acidity of die phenol fimctional groups of the side arms
of FCE. We attribute the favored uptake of Cu(II) by FCE (as opposed to Pb(II)) to the
smaller size of Cu(II), which reduces the steric barrier for complexation.
Potential Applicatioas. The extraction data suggest the potential application of CCE
and FCE as reagents for the selective detection of Hg(II) ion. With CCE, such an application
would be developed using absorbance-based measurements, whereas FCE offers the
possibility of fluorescence detection. In the latter case, we envisioned the selective extraction
of the Hg(II):FCE species, which has its absorbance maximum shifted to longer wavelength

by ~60 nm from that of unbound FCE. Such a strategy could then take advantage of the
enhanced detection capabilities of fluorescence as opposed to absorbance based technique .
Unfortunately, as is usually the case,^^'^'* we have found that the fluorescence of FCE is
quenched by the uptake of Hg(II), as well as by Pb(n) and Cu(II). In contrast, the
fluorescence is not quenched by the complexation of Cd(II), Ca(II), Sr(II), and Ba(n). Based
on these observations, it is likely that the quenching of fluorescence by Hg(II), Pb(II), and
Cu(n) results from the heavy atom effect via spin orbital coupling.^'^ Although, FCE could
still be used in a determination of Hg(II) by absorbance measurements, it was more difficult
to synthesize than CCE. However, FCE could be used in determination of Cd(II) and the
alkaline earth cations by fluorescence in the presence of Hg(n), Pb(II), and Cu(ir) since the
complexes of the latter do not fluoresce. Figure 7 shows excitation and emission spectra of
FCE solution in 1,2-dichloroethane before and after extraction of Cd(II) from aqueous
solutions at different pH values. The limit of detection of Cd(II) calculated using standard
solutions buffered at pH 8.0 at a signal-to-noise ratio of 3, is 6 ppb.
Studies of the use of CCE for the selective extraction of Hg(II) into an organic phase
like 1,2-dichloroethane revealed a linear calibration curve between 0.2 and 5.0 ppm Hg(ir).
These tests were conducted using a 25 fxM CCE solution to extract Hg(n) from a solution
buffered at pH 5.0. Estimated detection limits are ~0.2 ppm at a signal to noise ratio of 3:1.
Under this condition, even millimolar Ca(II), Sr(II), and Ba(II) did not exhibit a detectable
interference at the detection limit. However, as expected from Figure 6b, the presence of 100
p.M Cd(II) and Pb(II) lead to an increase in absorbance by -20% for a 0.2 ppm Hg(ir)

10
8
(/)
S 6
>
i2 >1 (u 4
0 250 300
VJl
350 400
Wavelength (nm)
450 500
Figure 7. Excitation and emission spectra for 25 fiM solutions of FCE before, (a), and after extraction of Cd(n) from aqueous solutions at pM: 5,6 (b), 5.8 (c), 6.0 (d), 6.3 (e), 6.5 (Q, 6.8 (tj), 7.0 (l\), 7.3 (i) and 7.6 (j)- liolh llie excitation and emission spectra of FCE equilibrated with aqueous solution buffered in the pll ranye of 5-8 were identical.

52
solution. These contributions however, can be reduced by performing the extraction at a
lower pH of the aqueous sample. In addition to other metal ions, some anions are potential
interferants for the determination of Hg(II) with CCE. Chloride ion at 100 |iM resulted in a
decrease in absorbance of ~30% in the determination of 0.2 ppm (1 jiM) Hg(II).
CONCLUSIONS
This joint effort has demonstrated that the novel crown ether compounds, CCE and
FCE, exhibit a remarkable selectivity in the binding of Hg(II) over a host of other divalent
metal cations (i.e., Pb(II), Cu(II), Cd(II), Ca(n), Sr(II), and Ba(II)). These improved
selectivities are attributed to the reduced basicity of the ring oxygen and enhanced rigidity of
the crown ether ring through the incorporation of benzo groups in the ring structure. Efforts
are presently underway to harness this selectivity for the development of new methods for
Hg(ir)-determinations based on conventional solvent extraction principles. Possible
extensions to chemical sensor applications are also under consideration.
ACKNOWLEDGMENT
Research conducted at Iowa State University was supported by the Office of Basic
Energy Research-Chemical Sciences Division of the U.S. Department of Energy-Ames
Laboratory, Center for Advanced Technology Development and by the Microanalytical
Instrumentation Center of ISU. Research conducted at Texas Tech University was supported
by the Division of Chemical Sciences of the Office of Basic Energy Sciences of the U.S.
Department of Energy (Grant DE-FG03-94ER14416 and earlier grants). RAB expresses his
appreciation to Professor Makoto Takagi of Kyushu University for sharing the experimental

details for the synthesis of 2. The Ames Laboratory is operated for the U.S. Department of
Energy by ISU under contract No. W-7405-eng-82.
REFERENCES AND NOTES
(1) Pedersen, C. J. J. Am. Chem. Soc. 1967, 89, 7017-7036.
(2) Bradshaw, J. S. In Synthetic Multidentate Macrocyclic Compounds', R. M. Izatt and J.
J. Christensen, Eds.; Academic Press: New York, 1978, pp 53-109.
(3) Gokel, G. W.; Korzeniowski, S. H. Reactivity and Structure Concepts in Organic
Chemistry, Springer-Verlag: New York, 1982; Vol. 13.
(4) Frensdorff, H. K. J. Am. Chem. Soc. 1971, 93,4684-4688.
(5) Pannell, K. H.; Hambrick, D. C.; Lewandos, G. S. J. Organometal. Chem. 1975, 99,
C21-C23.
(6) Danesi, P. R.; Meider-Gorican, H.; Chiarizia, R.; Scibona, G. J. Inorg. Nucl. Chem.
1975, 37, 1479-1483.
(7) Danesi, P. R.; Chiarizia, R.; Saltelli, A. J. Inorg. Nucl. Chem. 1978, 40, 1119-1123.
(8) Sadakane, A.; Iwachido, T.; Toei, K. Bull. Chem. Soc. Jpn. 1975, 48, 60-63.
(9) Bartsch, R. A.; Czech, B. P.; Kang, S. I.; Stewart, L. E.; Walkowiak, W.; Charwicz,
W. A.; Heo, G. S.; Son, B. J. Am. Chem. Soc. 1985,107,4997-4998.
(10) Katalnikov, S. G.; Mysheltsov, I. A. Tr. Inst.-Mosk. Khim.-Tekhnol. Inst. im. D. I
Mendeleeva 1989,156, 3-24.
(11) Ryba, 0.; Petranek, J. Talanta 1976, 23,158-159.
(12) Rechnitz, G. A.; Eyal, E. Anal. Chem. 1972, 44, 370-372.

54
(13) Patranek, J.; Ryba, 0. Anal. Chim. Acta 1974, 72, 375-380.
(14) Mascini, M.; Pallozzi, F. Anal. Chim. Acta 1974, 73, 375-382.
(15) Hiroka, M. Crown Compounds: Their Characteristics and Applications', Elsevier:
Amsterdam, 1982; Vol. 12, pp 151-213.
(16) Sanz-Medel, A.; Gomis, D. B.; Alvarez, J. R. G. Talanta 1981, 28,425-430.
(17) Sanz-Medel, A.; Gomis, D. B.; Fuente, E.; Jimeno, S. A. Talanta 1984,31, 515-519.
(18) Nazarenko, A. Y.; Pyatnitskii, I. V.; Stolyarchuk, T. A. Zhur. Anal. Khim. 1981, 36,
1719-1721.
(19) Sumiyoshi, H.; Nakahara, K.; Ueno, K. Talanta 1977, 24, 763-765.
(20) Pyatnitskii, I. V.; Nazarenko, A. Y. Russian J. Inorg. Chem. 1980,25, 592-594.
(21) Abrodo, P. A.; Gomis, D. B.; Sanz-Medel, A. Microchem. J. 1984,30, 58-70.
(22) Jawaid, M.; Ingman, F. Talanta 1978, 25, 91-95.
(23) Nishida, H.; Tazaki, M.; Takagi, M.; Ueno, K. Mikrochim. Acta 1981, /, 281-287.
(24) Nishida, H.; Katayama, Y.; Katsuki, H.; Nakamura, H.; Takagi, M.; Ueno, K. Chem.
Lett. 1982,1853-1854.
(25) Nakamura, H.; Nishida, H.; Takagi, M.; Ueno, K. Anal. Chim. Acta 1982,139, 219-
227.
(26) Shiga, M.; Nishida, H.; Nakamura, H.; Takagi, M.; Ueno, K. Bunseki Kagaku 1983,
32, E293-E300.
(27) Takagi, M.; Ueno, K. Top. Curr. Chem. 1984,121, 39-65.

55
(28) Katayama, Y.; Nita, K.; Ueda, M.; Nakamura, H.; Takagi, M. Anal. Chim. Acta 1985,
173,193-209.
(29) Sasaki, K.; Pacey, G. Anal. Chim. Acta 1985,174, 141-149.
(30) Kimura, K.; Tanaka, M.; Kitazawa, S.; Shono, T. Chem. Lett. 1985, 1239-1240.
(31) Sakai, Y.; Kawano, N.; Nakamura, H.; Takagi, M. Talanta 1986, 33,407-410.
(32) Katayama, Y.; Fukuda, R.; Takagi, M. Anal. Chim. Acta 1986, 185, 295-306.
(33) Takagi, M.; Nakamura, H. J. Coord. Chem. 1986,15, 53-82.
(34) Kimura, K.; Tanaka, M.; Shono, T. Bull. Chem. Soc. Jpn. 1987, 60, 3068-3070.
(35) Katayama, Y.; Fukuda, R.; Iwasaki, T.; Nita, K.; Takagi, M. Anal. Chim. Acta 1988,
204, 113-125.
(36) Czech, B. P.; Babb, D. A.; Czech, A.; Bartsch, R. A. J. Heterocyclic Chem. 1989, 26,
199-203. f
(37) Takagi, M. In Cation Binding by Macrocycles', Y. Inoue and G. W. Gokel, Eds.;
Dekker: New York, 1990; pp 465-495.
(38) Brown, P. R.; Bartsch, R. A. In Topics in Inclusion Science-, T. Osa and J. L. Atwood,
Eds.; Kluwer Academic Publishers: Dordrecht, 1991; Vol. 2; pp 1-57.
(39) Wilcox, K.; Pacey, G. E. Talanta 1991, 38, 1315-1324.
(40) Blair, T. L.; Desai, J.; Bachas, L. G. Anal. Lett. 1992, 25, 1823-1834.
(41) Graf, E.; Lehn, J. M. Helv. Chim. Acta 1981, 64,1051-1065.
(42) Pettit, G. R.; Chamberland, M. R.; Green, B. Can. J. Chem. 1967, 45, 1555-1560.
(43) Crossland, R. K.; Servis, K. L. J. Org. Chem. 1970, 35, 3198-3196.

(44) Hdgberg, S. A. G.; Cram, D. J. J. Org. Chem. 1975, 40, 151-152.
(45) Feiser, L. F.; Feiser, M. In Reagents for Organic Synthesis', Wiley: New York, 1970;
Vol. 1, pp 1030-1033.
(46) Albert, A.; Seijeant, E. P. The Determination of Ionization Constants: A Laboratory
Manual: 3rd ed.; Chapman and Hall: New York, 1984, pp 126-134.
(47) Koshland, D. E., Jr.; Karkhanis, Y. D.; Latham, H. G. J. Am. Chem. Soc. 1964,86,
1448-1450.
(48) Albert, A.; Serjeant, E. P. The Determination of Ionization Constants: A Laboratory
Manual; 3rd ed.; Chapman and Hall: New York, 1984, pp 70-73.
(49) We also attempted to investigate the structural detail of these transformations using
infrared Fourier-transform spectroscopy. Unfortunately, the low solubility of both
CCE and FCE precluded detection of any N-H vibrational modes, features which
would have aided our assessment.
(50) Finston, H. L.; Rychtman, A. C. A New View of Current Acid-Base Theories', Wiley:
New York, 1982.
(51) Huheey, J. E. Inorganic Chemistry, Harper & Row: New York, 1983, pp 73-78.
(52) Lamb, J. D.; Izatt, R. M.; Christensen, J. J. In Progress in Macrocyclic Chemistry, R.
M. Izatt and J. J. Christensen, Ed.; Wiley: New York, 1981; Vol. 2; pp 41-90.
(53) Becker, R. S.; Allison, J. B. J. Phys. Chem 1963, 67, 2662-2669.
(54) McGlyim, S. P.; Azumi, T.; Kinoshita, M. In Molecular Spectroscopy of The Triplet
State Prentice-Hall: Englewood Cliffs, New Jersey, 1969; pp 261-283.

57
CHAPTER 3. SELECTIVE DETERMINATION OF CADMIUM IN WATER USING
A CHROMOGENIC CROWN ETHER IN A MIXED MICELLAR SOLUTION
A paper submitted to Analytical Chemistry
Bikas Vaidya*, Marc D. Porter*, Marty D. Utterback^ and Richard A. Bartsch^
ABSTRACT
The chromogenic crown ether A';iV"-bis(2-hydroxy-5-nitrobenzyl)-4,13-diazadibenzo-
18-crown-6 (CCE) has been solubilized in a mixed micellar solution of sodium dodecyl
sulfate (SDS) and cetyl pyridinium chloride (CPC) and tested for selective determination of
heavy metal ions. The optical properties, acid-base equilibria, and metal ion binding
capabilities of the micellar solubilized CCE for Ba(n), Ca(II), Cd(II), Cu(II), Hg(II), Pb(II),
and Sr(II) are reported. Results show that the micellar solubilized CCE binds Hg(II) ~ Cd(II)
> Ca(II) > Sr(II), whereas the presence of Pb(n) and Ba(n) leads to precipitate formation.
There was no detectable binding with Cu(II). Based on these results, a spectrophotometric
determination for Cd(II) that utilizes chloride ions to mask Hg(I[) has been devised and
evaluated.
" Microanalytical Instrumentation Center, Ames Laboratory USDOE, and Department of Chemistry, Iowa StateUniversity, Ames, lA 50011
^ Department of Chemistry and Biochemistry, Texas Tech University, Lubbock, TX 79409
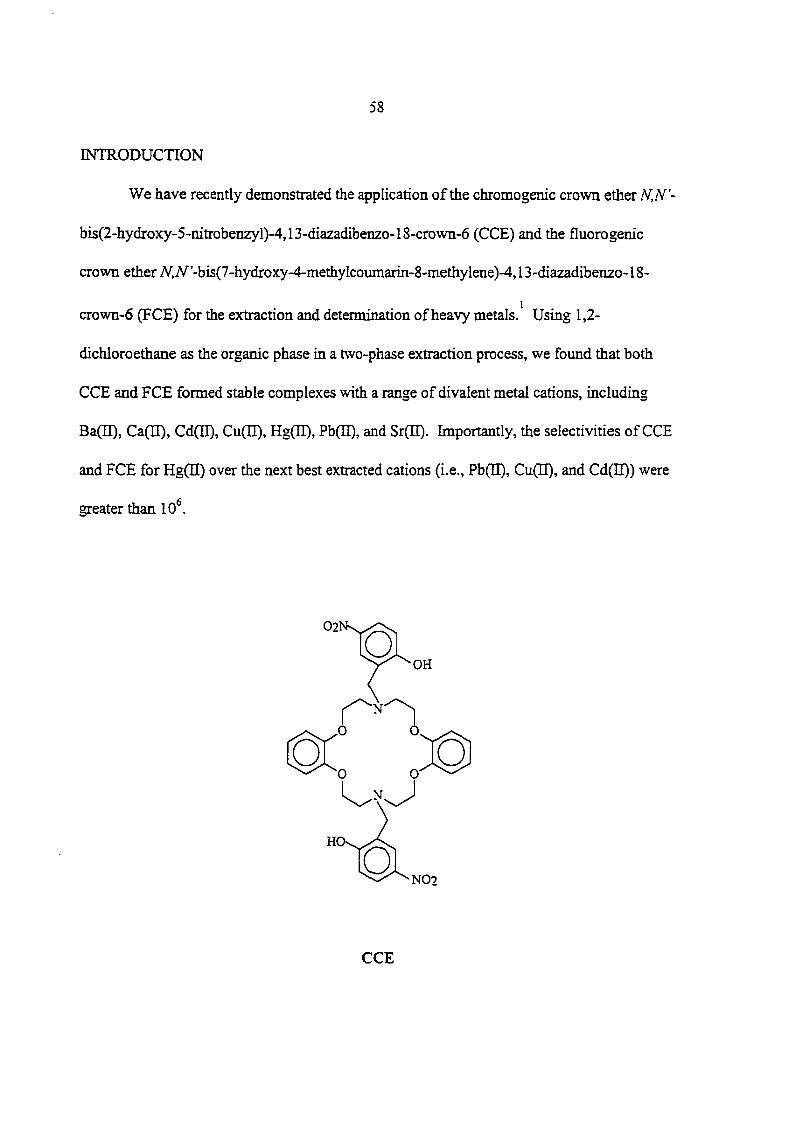
58
INTRODUCTION
We have recently demonstrated the application of the chromogenic crown ether M.N'-
bis(2-hydroxy-5-nitroben2yl)-4,13-diazadibenzo-18-crown-6 (CCE) and the fluorogenic
crown ether A'",// '-bis(7-hydroxy-4-methylcoumarin-8-methylene)-4,13-diazadibenzo-18-
crown-6 (FCE) for the extraction and determination of heavy metals/ Using 1,2-
dichloroethane as the organic phase in a two-phase extraction process, we found that both
CCE and FCE formed stable complexes with a range of divalent metal cations, including
Ba(II), Ca(II), Cd(II), Cu(II), Hg(II), Pb(II), and Sr(II). Importantly, the selectivities of CCE
and FCE for Hg(II) over the next best extracted cations (i.e., Pb(II), Cu(II), and Cd(II)) were
greater than 10®.
CCE

59
This paper reports on our exploration of different surfactant-derived micelles as
solubilization carriers for CCE and its corresponding metal ion complexes in aqueous
solutions. The main objective of this study was to facilitate the use of CCE for metal ion
determinations by reducing the lengthy processing associated with the above two-phase
extraction process. To this end, we tested the utility of single-component and two-
component micelles formed from cationic (cetyl pyridinium chloride, CPC), anionic (sodium
dodecyl sulfate, SDS), and nonionic (Triton X-100, TTN) surfactants as solubilizing agents
for CCE and the resulting metal complexes in aqueous solutions. This paper presents these
findings, including the ionization behavior and metal ion binding capabilities for CCE
solubilized by the different micelles and a comparison of the reactivities of the micellar
solubilized CCE to those found in our earlier two-phase extraction study.
EXPERIMENTAL SECTION
Reagents and Instrumentation. The synthesis of CCE has been described
previously. Reagent-grade inorganic and organic chemicals were obtained from commercial
suppliers and used without purification. All aqueous solutions were prepared with distilled
water that was subsequently deionized using a Millipore Milli-Q Water System.
Determinations of pH were performed with an Orion Research Digital lonalyzer
(Model 501) and an Orion combination glass pH electrode (Model 91-04). Absorbance
measurements were conducted with a computer-controlled Hewlett Packard diode array
spectrophotometer (EIP8453) at a spectral resolution of 1 rmi and integration time of 2 s.

60
Synthesis of CCE Disodium Salt CCE (1.88 g) was stirred in 0.05 N aqueous
NaOH followed by extraction with 1,2-dichIoroethane (5 x 50 niL), drying of the organic
layer with sodium sulfate, and evaporation of the solvent in vacuo to give 1.70 g (86%) of the
disodium salt of CCE with mp 170-172 °C (decomp.). IR (KBr): 1333 (NO2), 1126 (C-0)
cm"'. NMR (DMSO-d^): 5 2.98(br s, 8H0,3.69 (br s, 4H), 4.12 (br s, 8H), 6.31 (d, 2H,
y=9.2Hz), 6.7-7.0 (m, 8H), 7.72 (d of d, 2H, J^=9.1 Hz, ^=2.9 Hz), 7.98 (d, 2H, 7^=2.7 Hz).
Anal. Calcd for C34H34N4Na20io: C, 57.96; H, 4.86. Found: C, 57.93; H, 4.98.
Determination of Equilibrium Constants. Acid dissociation constants (Kjj) were
determined by an analysis of the spectral data for CCE in the aqueous micellar solutions
buffered with hydrochloric acid, citric acid, and boric acid, each present at a concentration of
0.01 M. In all cases, the pH of the solution was adjusted by addition of either hthium
hydroxide or sodium hydroxide.
Formation constants (KfJ for metal ion binding were determined in the micellar
solutions from the spectroscopically-derived concentrations of the metal complexes and
unbound CCE as a fimction of pH using the same buffer systems employed in the
determination of the values of Kg,. These measurements were conducted with a large excess
of each metal ion, ensuring that changes in the concentrations of uncomplexed metal ions
were negligible.
RESULTS AND DISCUSSION
Micellar Solubilization Characterizations. As a starting point, we tested the ability
of CPC, TTN, and SDS to form single-component micelles that were effective in solubilizing
the neutral form of CCE as well as in supporting the metal ion binding capabilities of the
solubilized CCE. These tests were conducted using the divalent metal cations Ba(ir), Ca(II),
Cd(II), Cu(II), HgCH), Pb(II), and Sr(II) at surfactant concentrations (i.e., 0.01 to 0.10 M)
2 well above the critical micelle concentration (cmc) for each surfactant." Of the three
surfactants, only the micellar solution composed of SDS was effective in solubilizing CCE
and the resulting metal ion complexes in aqueous solution; there were no detectable
enhancements in the concentration of CCE using either the CPC- or TTN-derived micelles in
comparison to aqueous solutions devoid of surfactants. We also found that the solutions
prepared at SDS concentrations between ~10 and 50 mM exhibited the most reproducible
extent of metal ion binding by solubilized CCE. However, precipitates were formed in these
solutions within 4-6 hours after preparation.
In an attempt to alleviate die above instability, the applicability of mixed micelles
prepared from different binary combinations of SDS, CPC, and TTN was explored, drawing
3-12 on earlier hterature precedents. This investigation revealed that a mixed micelle of CPC
and SDS resulted in a CCE-solubilized solution that was stable for several days, effectively
bound most of the noted divalent metal ions, and reached equilibrium with the metal ions
within a few seconds after mixing the metal ion solutions with the micellar solutions. This
mixed micelle was formed first by solubilizing the disodium salt of CCE (5-10 |iM) in a
CPC-containing (0.10 M) solution of chloroform, and then adding a small aliquot of the
resulting solution to an aqueous SDS (50 mM) solution. Dilutions in the last step were
generally ~50-fold. Interestingly, the solubilized form of the disodium salt of CCE, which

62
was prepared in a CPC-containing chloroform solution that was subsequently added as a
small aliquot to an aqueous micellar CPC solutions, was ionizable via acid-base chemistry,
but did not detectably bind metal ions. We do not yet have an explanation as to why the
CPC/SDS mixed micelle proved more viable for our application than the micelles prepared
from only SDS or CPC.
Based on the above findings, the remainder of this paper evaluates the utihty of CCE
solubilized in CPC/SDS mixed micelles for determination of divalent metal ions. The next
sections describe the optical characteristics and acid-base properties of the micellar
solubilized CCE, the results from the metal ion binding evaluations, and comparisons to the
reactivities of CCE reported in our earUer two-phase extraction study. In the last section, a
spectrophotometric determination of Cd(II) using CCE solubilized in mixed micelles is
devised and evaluated.
Acid-Base Equilibria and Optical Characteristics. We previously reported that
CCE behaves as a polybasic acid, existing in dicationic, cationic, neutral, anionic, and
dianionic protonic states. The stepwise acid-base equilibria for CCE can be written as
shown in eqs 1-4.
H4L2+ = H3L+ + (1)
H3L+ = H2L + H+ (2)
H2L = HL- + H+ (3)

63
HL- = L2- + (4)
Thus, the neutral form (H2L) of CCE can be successively protonated to its mono- (H3L'^) and
di- cationic forms, or successively deprotonated to its mono- (HL*) and dianionic
(L-') forms. The corresponding acid dissociation constants (Kai) for eqs 1-4 can be
formulated in terms of concentrations (assximing activity coefBcients of unity) as:
Kai= [H3L+][HT/[H4L2^ (5)
Ka2= [H2L][HT/[H3LT (6)
Ka3= [HL-][H+]/[H2L] (7)
Ka4= [L2-][HT/[HL-] (8)
At a more detailed structural level, however, the formation of zwitterions is possible,
a situation that would lead to a more complex multi-component equilibrium. Zwitterions can
arise if the phenolic groups of the side arms are stronger acids than the amine groups of the
13 diazacrown ether portion of CCE. In addition, the presence of the two pairs of amine-
phenol groups in CCE can lead to a variety of tautomeric species. As a consequence of the
tautomeric equilibria, the acid dissociation constants defined by eqs 5-8 are the sum of the
acid dissociation constants for the tautomers involved in each of the possible protonic
1,13 states. The formation of both zwitterions and tautomers have been examined in detail in
1 our earlier study of CCE.

Figiire 1 presents a series of spectra for CCE in the mixed CPC/SDS micellar solution
in the pH range from 2 to 12. At pH 2 and below (Figure la), CCE has an absorption
maximum at 310 nm. Increases in pH result in the appearance of new features at longer
wavelengths that undergo a continuous evolution up to a pH of ~12, a finding that reflects the
existence of a tautomeric equilibrium for each of the protonic states (see below). At pH 12
and above, the absorbance maximum is 414 nm. Between these pH extremes, three readily
identifiable isosbestic points are observed: 326 nm (pH range: 3.0-5.5), 364 nm (pH range:
9.4-12.0), and 393 nm (pH range: 8.0-8.8). A fourth isosbestic point, which is not as clearly
defined as the other three, is present at ~344 nm (pH range: 6.2-7.2). The existence of the
four isosbestic points is consistent with the stepwise deprotonation processes in eqs 1-4. The
positions of the absorbance maxima, as well as those of the isosbestic points, differ by only a
few nanometers from those for CCE dissolved in 70% aqueous methanol (i.e., a solution 70%
in methanol and 30% in water);' these similarities fluther support the uptake of CCE by the
CPC/SDS mixed micelle.
The results from an analysis of the spectroscopic data in Figure 1 for determinations
of the pKai values for CCE solubilized in CPC and CPC/SDS micelles are presented in Table
1, along with the values found for CCE dissolved in 70% aqueous methanol.' This analysis
1 is described in our earlier work. For the CPC micellar solution, all four values of pJCgj are
less than those found in 70% aqueous methanol; these differences are consistent with
expected destabilization of H4L and H3L as well as the stabilization of HL' and L " in the
16 cationic microenvironment of the CPC micelle. The uptake of CCE by the CPC/SDS

'r 0.4
ON
300 400 500
Wavelength (nm)
Figure 1. Absorbance spectra of 25 CCE in the niicellar solution (50 mM SDS and 0.4 niM CPC) as a function of pH: (a) pH 2.24, (b) 3.53, (c) 4.20, (d) 4.61, (e) 7.20, (0 8.09, (g) 8.60, (h) 9.38, (I) 9.87, (j) 10.13, (k) 10.60, ami (1) 11.98.
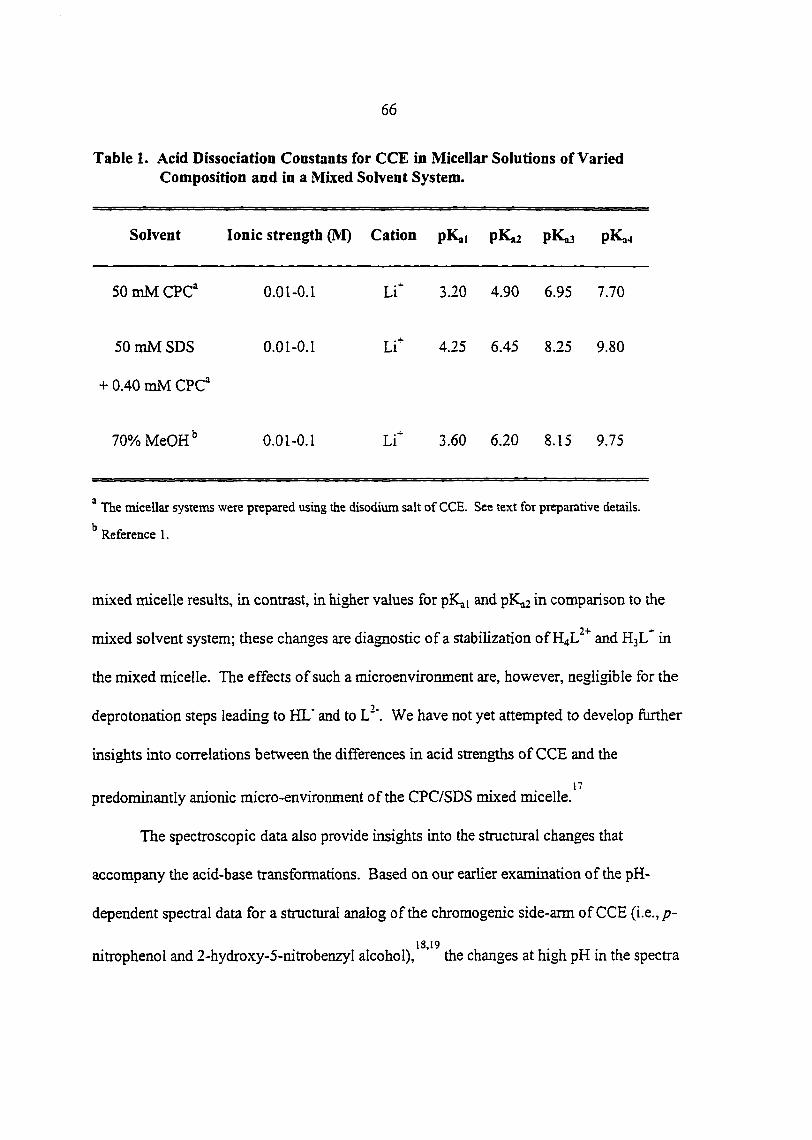
66
Table 1. Acid Dissociation Constants for CCE in Micellar Solutions of Varied Composition and in a Mixed Solvent System.
Solvent Ionic strength (M) Cation pKai pKa2 pKaj pKa4
50 mM CPC^ 0.01-0.1 Li^ 3.20 4.90 6.95 7.70
50 mM SDS O.OI-O.l Li^ 4.25 6.45 8.25 9.80
+ 0.40 mM C?C
yoroMeOH" O.Ol-O.l Li^ 3.60 6.20 8.15 9.75
^ The micellar systems were prepared using the disodium salt of CCE. See text for preparative details.
'' Reference 1.
mixed micelle results, in contrast, in higher values for pKji and in comparison to the
mixed solvent system; these changes are diagnostic of a stabilization of H4L"^ and in
the mixed micelle. The effects of such a microenvirormient are, however, negligible for the
deprotonation steps leading to HL' and to L'". We have not yet attempted to develop fiirther
insights into correlations between the differences in acid strengths of CCE and the
17 predominantly anionic micro-environment of the CPC/SDS mixed micelle.
The spectroscopic data also provide insights into the structural changes that
accompany the acid-base transformations. Based on our earlier examination of the pH-
dependent spectral data for a structural analog of the chromogenic side-arm of CCE (i.e., p-
18.19 nitrophenol and 2-hydroxy-5-nitroben2yl alcohol), the changes at high pH in the spectra
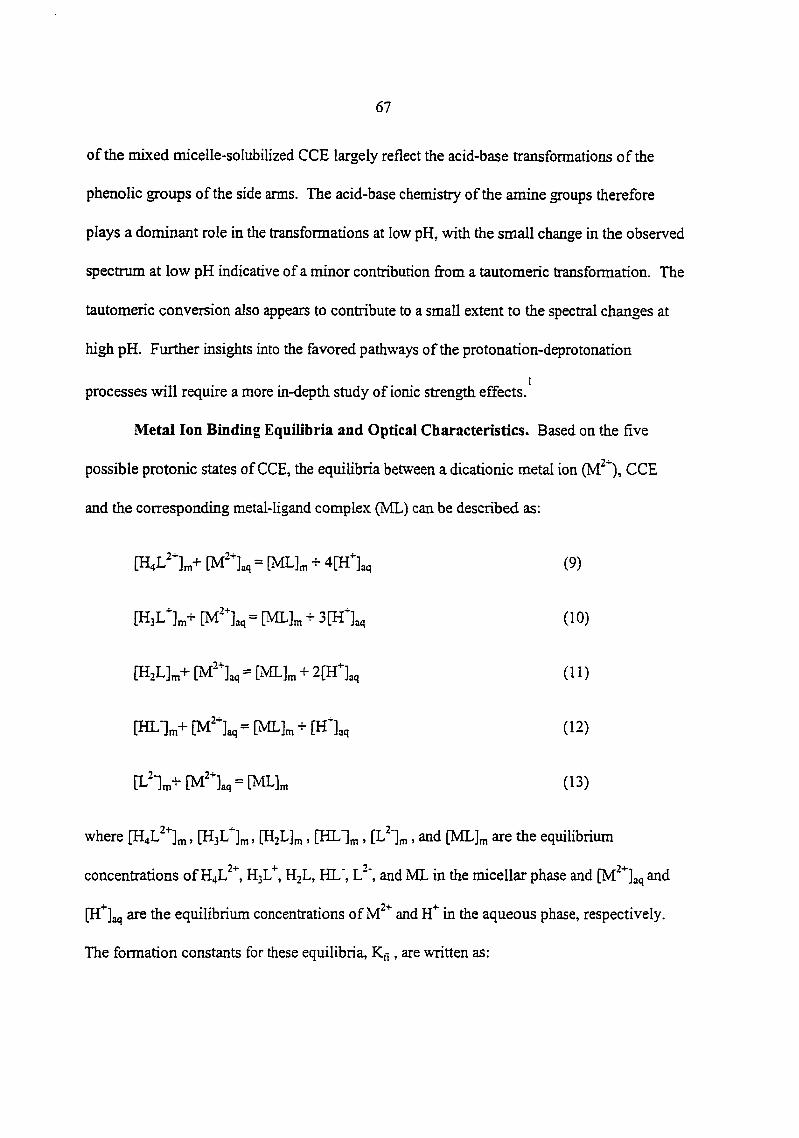
of the mixed micelle-solubilized CCE largely reflect the acid-base transformations of the
phenolic groups of the side arms. The acid-base chemistry of the amine groups therefore
plays a dominant role in the transformations at low pH, with the small change in the observed
spectrum at low pH indicative of a minor contribution from a tautomeric transformation. The
tautomeric conversion also appears to contribute to a small extent to the spectral changes at
high pH. Further insights into the favored pathways of the protonation-deprotonation
processes will require a more in-depth study of ionic strength effects.'
Metal Ion Binding Equilibria and Optical Characteristics. Based on the five
possible protonic states of CCE, the equilibria between a dicationic metal ion CCE
and the corresponding metal-ligand complex (ML) can be described as:
\M'X = P.IL], + 4[HX (9)
\K,LX+ [M'1aq= [ML]„ + 3\HX (10)
[H2L]„+ [M'X = [ML]^ + IIHX (11)
[HL-]^4-[M%=[MLL + [H% (12)
[L'"]n,+ [M'1aq = [ML], (13)
where [H4L^'^]n,, [HjL^]^, [HzLJn,, [HLI^, [L^'j^,, and [ML]n, are the equiUbrium
concentrations of H4L^'*', H3L"^, H2L, HL", L"', and ML in the micellar phase and [M^*]aq and
[H^]aq are the equilibrium concentrations of and in the aqueous phase, respectively.
The formation constants for these equilibria, , are written as:

68
[MLl„[H*]|q
[ML]„[H"1,,
[ML]„
Equations 14-18 can be recast to give:
log Kn = log q4 - 4pH - log [M^*] (19)
log Kq = log q3 - 3pH - log (20)
log Kd = log q2 - 2pH - log [M^^] (21)
log Kf4 = log qi - pH - log (22)
log K(3 = log qo - log [M^^] (23)
- [ML],, . _ [ML]„ _ _ [ML]^ . _ [ML]^ [ML]^ whereq4- + . (h' ^ j-, , andqo--^—
[H4L ]jjj [H3L ]uj [HzHin [HL ]jjj [L ]jjj
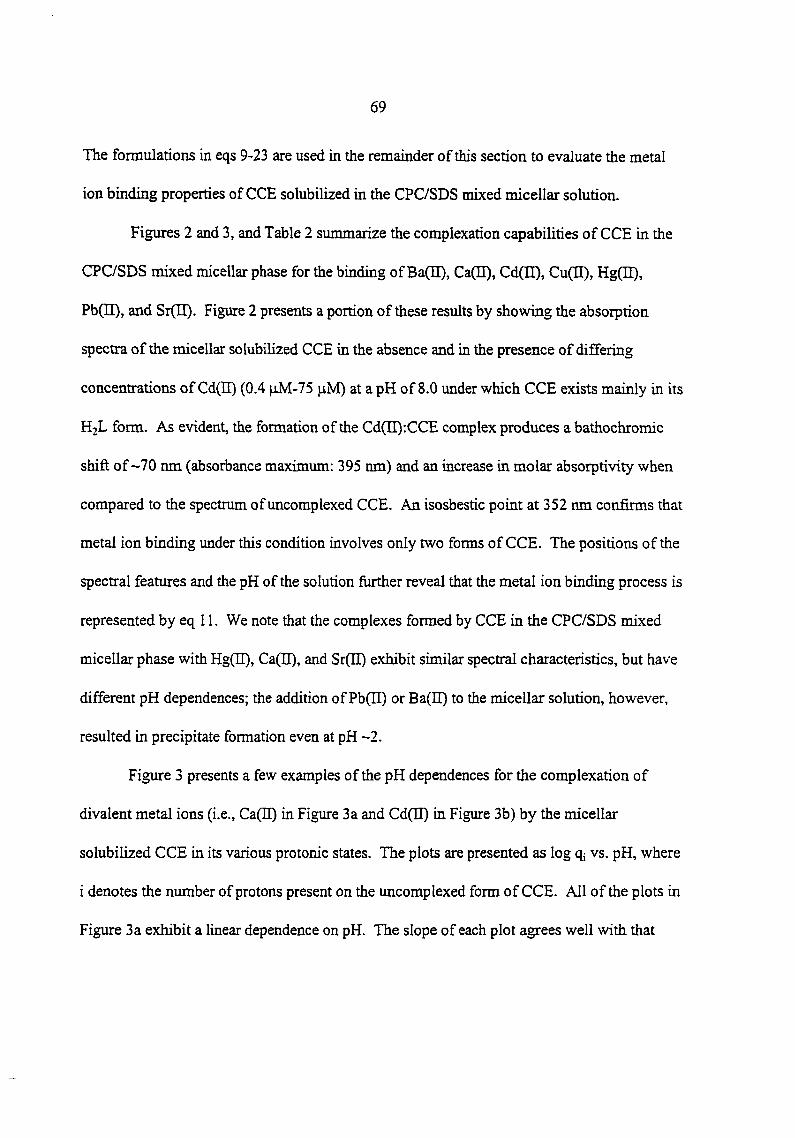
The formulations in eqs 9-23 are used in the remainder of this section to evaluate the metal
ion binding properties of CCE solubilized in the CPC/SDS mixed micellar solution.
Figures 2 and 3, and Table 2 summarize the complexation capabilities of CCE in die
CPC/SDS mixed micellar phase for the binding of Ba(II), Ca(n), Cd(II), Cu(n), Hg(II),
Pb(II), and Sr(II). Figure 2 presents a portion of these results by showing the absorption
spectra of the micellar solubilized CCE in the absence and in the presence of differing
concentrations of Cd(II) (0.4 |j.M-75 |iM) at a pH of 8.0 under which CCE exists mainly in its
H2L form. As evident, the formation of the Cd(II);CCE complex produces a bathochromic
shift of ~70 nm (absorbance maximum: 395 nm) and an increase in molar absorptivity when
compared to the spectrum of uncomplexed CCE. An isosbestic point at 352 mn confirms that
metal ion binding under this condition involves only two forms of CCE. The positions of the
spectral features and the pH of the solution further reveal that the metal ion binding process is
represented by eq 11. We note that the complexes formed by CCE in the CPC/SDS mixed
micellar phase with Hg(II), Ca(II), and Sr(II) exhibit similar spectral characteristics, but have
different pH dependences; the addition of Pb(II) or Ba(II) to die miceUar solution, however,
resulted in precipitate formation even at pH ~2.
Figure 3 presents a few examples of the pH dependences for the complexation of
divalent metal ions (i.e., Ca(II) in Figure 3a and Cd(II) in Figure 3b) by the micellar
solubilized CCE in its various protonic states. The plots are presented as log qj vs. pH, where
i denotes the number of protons present on the uncomplexed form of CCE. All of the plots in
Figure 3a exhibit a linear dependence on pH. The slope of each plot agrees well with that

300 400 500
Wavelength (nm)
Figure 2. Absorbance spectra of 20 fiM CCE in the micellar solution (50 niM SDS and 0.4 mM CPC) as a function of Cd^^ concentration in the range of 0 to 75 |.iM Cd^^

Figure 3. Plots of the log of q; for the binding of (a) Ca(ir) and (b) Cd(II) by CCE in a mixed tnicellar solution (1.0 mM Ca(II) or Cd(II), 25 (iM CCE, 0.4 mM CPC and 50 mM SDS): q4 (O ), q3 ( V), qj (•), q, (0 ) and qo (A) as a function of pH. The symbols represent the experimental data, and solid lines represent slopes of 4, 3, 2,1 and 0, as predicted from eqs 19-23 for each of the qj. The uncertainties of the absorbance data are slightly smaller than the size of the symbols.

72
cr OD O
pH
10 11
@ o
7
pH

73
expected from eqs 19-23, confirming the general applicability of the formulations in eqs 14-
18 for describing the complexation of Ca(II) by CCE in the mixed micellar phase. Though
not as well defined, plots for the other divalent metal ions, like that for Cd(II) presented in
Figure 3b, show the same general dependences but over different pH ranges.
Table 2. Formation and Extraction Constants of CCE for Ba(II), Ca(II), Cd(II), Cu(II), Hg(II), Pb(II), and Sr(n) in a CPC/SDS Mixed Micellar Solution and in a Mixed Solvent System.
Metal Ion -log Kq® -log K^j''
Hg(n) 9.44 ± 0.59 (8) 0.28
Pb(n) ppt.' 7.58
Cu(n) >16'' 8.52
Cd(II) 10.04 ±0.19 (6) 10.50
Ca(II) 13.89 ± 0.06 (5) 15.30
Sr(II) 14.49 ± 0.09 (5) 16.40
Ba(II) ppt.' 17.70
^ The Kfi values are related to each other by the acid dissociation constants (K^i) and can be transfonned from one to another by division with the corresponding K,; value. For example, Kf4 = Kq / K^j and = Kq / Kj4. The uncertainties in the values of Ko are given as standard deviations and the numbers in parenthesis are number of data points used in the analysis.
Reference 1.
The presence of this metal ion resulted in the formation of a precipitate.
CCE does not complex Cu(II) to any detectable extent in CPC/SDS solution.

In addition to confirming the reaction stoichiometries of the complexation equilibria,
the results in Figure 3 can be used to calculate the Kg values for Ca(II) and Cd(II) with each
of the protonic states of CCE. We note that the equilibrium represented by is analogous
in formulation to the solvent extraction constant (K^^) for the neutral form of CCE. Data for
both Kq and are presented in Table 2. As is evident, the metal ion binding capabilities of
CCE solubilized m the mixed micelle are in some ways similar and in some ways different
from those reported in our solvent extraction study. That is, where measurable for the
micellar system, the general order of the preferences for metal ion binding in the two cases is
the same: Hg(II)>Cd(II)>Ca(n)>Sr(II). However, the magnitudes of the equilibrium
constants are markedly different. For example, the values of Kq for Cd(II), Ca(II), and Sr(II)
are all higher than the analogous values of whereas the value of for Hg(r[) is
significantly less than the corresponding value of More importantly, the changes in the
metal ion binding strengths of CCE that arise from solubilization in the CPC/SDS mixed
micelle result in a loss of the marked selectivity of CCE for binding Hg(II) that was observed
in the solvent extraction process. We presently attribute these differences, along with
precipitate formation in the case of Pb(I[) and Ba(II) and the undetectable binding of Cu(II),
to the competitive binding by the sulfate end groups ui the SDS component of the mixed
micelles.
These results clearly dictate a reevaluation of the utility of CCE for divalent metal ion
determinations found in our solvent extraction study when a micellar solubilization procedure
is employed. Table 2 shows that there is an insufficient difference in the selectivity of the

75
micelle-solubilized CCE to discriminate Hg(II) (pK^ = 9.44) from Cd(II) (pKf3 = 10.04), but
that there is a siifficient difference in selectivity to discriminate Hg(II) and Cd(II) from Ca(n)
20 (pBCo = 13.89). Utilizing a masking agent for Hg(II) (e.g., chloride ion), it is conceivable
that an effective approach for a spectrophotometric determination of Cd(II) can be devised.
Determination of Cd(n). This section examines the potential application of the
micelle-solubilized CCE for the determination of Cd(II). To this end, we used an aqueous
buffer system (pH=8.0) composed of 0.1 M tris-(hydroxymethyl)aminomethane (THAM) and
0.1 M HCl. This solution composition was selected to include a high concentration of
chloride ion for the masking of Hg(II) and to employ a buffer system at a pH ~8 with high
capacity (pK^ of THAM = 8.06).
Figure 4 shows the calibration curve obtained at 395 nm under the above conditions
in the range of 0-75 |j,M Cd(II). As is evident, the absorbance at 395 nm increases with the
concentration of Cd(II), approaching a maximum value at the upper limit of the Cd(II)
concentration range. The response is linear, as shown by the inset, up to ~7 |j.M Cd(n). The
estimated detection limit is ~6 ppb at a signal-to-noise ratio of 3. This estimated limit of
detection compares favorably with that for the more commonly used complexing agent
22 dithizone. Furthermore, the procedure usmg micelle-solubilized CCE is more facile and
less time consuming than the dithizone-based solvent extraction process. We also note that
the generated wastes from our micelle-process are less hazardous than those from the
23 dithizone method, which requires the use of potassium cyanide as a masking agent. Finally,
the interference of a 1000-fold of excess of Ca(n), which is the next best complexed metal

76
0.4
0.3
a w s R
"S 0.2 o OA
<
0.1
0.0
0 20 40 60 80
[cd(iDi (m
Figure 4. Calibration curve at 395 nm for Cd(I[) in the range of 0-75 |aM concentration using 17 i^M CCE in the mixed micellar solution (0.4 mM CPC and 50 mM SDS) in pH 8.0 THAM/HCl buffer. The absorbance of a blank sample has been subtracted from the measured absorbances at each Cd(n) concentration. The inset shows the linear range, 0-7 ^M, of the calibration curve (correlation coefficient = 0.9996).
[Cd(ID] ( liM)

ion under this analysis condition, in the determination of 1 j^M Cd(II) results in -14%
increase in absorbance.
CONCLUSIONS
This paper has demonstrated that CCE can be used in a mixed micelle solubilization
procedure for the low level detection (~6 ppb) of Cd(II). The main advantages of our
procedure in comparison to that of solvent extraction with dithizone are ease of use and the
reduction of hazardous wastes. We are presently devising experiments aimed at delineating
further the factors that cause the differences in the metal ion binding capabilities when CCE
is solubilized in CPC/SDS micelles in comparison to our earlier findings for a solvent
extraction process.
ACKNOWLEDGMENTS
Insightful discussions with Monzir S. Abdel-Latif on the use of micelles are gratefully
acknowledged. The work at Iowa State University was supported by the Office of Basic
Energy Research-Chemical Sciences Division of the U.S. Department of Energy-Ames
Laboratory, and by the Microanalytical Instrumentation Center of the Iowa State University.
The work at Texas Tech University was supported by the Division of Chemical Sciences of
the Office of Basic Energy Research of the U.S. Department of Energy (Grant DE-FG03-
94ER14416). The Ames Laboratory is operated for the U.S. Department of Energy by the
Iowa State University under contract No. W-7405-eng-82.

REFERENCES AND NOTES
1) Vaidya, B.; Zak, J.; Bastiaans, G. J.; Porter, M. D.; Hallman, J. L.; Nabulsi, N. A. R.;
Utterback, M. D.; Strzelbicka, B.; Bartsch, R. A. Anal. Chem. 1995, 67, 4101-4111.
2) Klopf, L. L.; Nieman, T. A. Anal. Chem. 1984, 56,1539-1542.
3) Malliaris, A.; Binana-Limbele, W.; Zana, R. J. Colloid Interface Sci. 1986,110,114-120.
4) Jana, P. K.; Moulik, S. P. J. Phys. Chem. 1991, 95, 9525-9532.
5) Amante, J. C.; Scamehom, J.; Harwell, J. H. J. Colloid Interface Sci. 1991,144, 243-253.
6) Mehreteab, A. In Mixed Surfactant Systems; Holland, P. M. and Rubingh, D. N., Ed.;
American Chemical Society: Washington, DC, 1992; pp 402-415.
7) Scamehom, J. F.; Harwell, J. H. In Mixed Surfactant Systems; Ogino, K. and Abe, M.,
Ed.; Marcel Dekker. New York, 1993; pp 283-315.
8) Heirington, K. L.; Kaler, E. W. J. Phys. Chem. 1993, 97, 13792-13802.
9) Abdel-Latif, M. S. Anal. Lett. 1994, 27, 2341-2353.
10) Szajdzinska-Pietek, E.; Gebicki, J. L. J. Phys. Chem. 1995, 99,13500-13504.
11) Yatcilla, M. T.; Herrington, K. L.; Brasher, L. L.; Kaler, E. W.; Chiruvolu, S.;
Zasadzinski, J. A. J. Phys. Chem. 1996,100, 5874-5879.
12) Karukstis, K. K.; Suljak, S. W.; Waller, P. J.; Whiles, J. A.; Thompson, E. H. Z. J. Phys.
Chem. 1996,100, 11125-11132.
13) Albert, A.; Serjeant, E. P. The Determination of Ionization Constants: A Laboratory
Manual; 3rd ed.; Chapman and Hall: New York, 1984.
14) Bakshi, M. S.; Crissantioo, R.; Lisi, R. D.; Milioto, S. Langmuir 1994,10, 423-431.

79
15) Caponetti, E.; Martino, D. C.; Floriano, M. A.; Triolo, R.; Wignall, G. D. Langmuir
1995,11, 2464-2470.
16) Finston, H. L.; Rychtman, A. C. A New View of Current Acid-Base Theories', Wiley:
New York, 1982.
17) As discussed by Szajdzinska-Pietek (ref. 10), the pyridinium ring of CPC is sequestered
near the head group region of SDS micelle. Bakshi et al. (ref. 14) have shown that the
crown ether 18-crown-6 distributes between the aqueous and micellar phases based on
the observed decrease in both the micellar size and the cmc with the increase in the 18-
crown-6 concentration. Caponetti et al. (ref 15), using small angle neutron scattering,
concluded that the crown ethers were locaUzed in the SDS micellar phase, but were
unable to establish the exact distribution within the micelle.
18) Koshland, D. E., Jr.; Karkhanis, Y. D.; Latham, H. G. J. Am. Chem. Soc. 1964, 86, 1448-
1450.
19) Nishida, H.; Tazaki, M.; Takagi, M.; Ueno, K. Mikrochim. Acta 1981,1,281-287.
20) Ringbom, A. J. Complexation in Analytical Chemistry, Interscience Publishers: New
York, 1963.
21) Perrin, D. D. Buffers for pHand Metal Ion Control-, Chapman and Hall: New York,
1974.
22) APHA Standard Methods For The Examination of Water and Wastewater, 18th. ed.;
American Public Health Association: Washington, DC, 1992.
23) Saltzman, B. E. Anal. Chem. 1953, 25, 493-496.

80
CHAPTER 4. REDUCTION OF CHLORIDE INTERFERENCE IN CHEmCAL
OXYGEN DEMAND (COD) DETERMINATION WITHOUT USING
MERCURY SALTS
A paper to be submitted to Analytica Chimica Acta
Bikas Vaidya, Steve W. Watson, Shelley J. Coldiron, and Marc D. Porter
ABSTRACT
An efficient method for the reduction of chloride interference in the determination of
chemical oxygen demand (COD) without the use of Hg(II) as a masking agent is described.
Chloride ion is removed as hydrochloric acid gas from acidified sample solutions at 150 °C in
a closed reaction tube and captured by a bismuth-based adsorbent held in a specially designed
Teflon-basket above the solution. The effects of adsorbent composition, basket design,
sulfuric acid concentration, reflux time, chloride concentration, and silver(I) catalyst on the
efficiency of the removal of chloride ion and the COD determination are discussed.
INTRODUCTION
Oxygen demand is an important delimiter for the effect of organic pollutants in
I aqueous environmental systems. As these pollutants are consumed by microorganisms, the
oxygen content of water is depleted. This loss can have adverse effects on the balance of
natural ecosystems if the oxygen content falls below the level necessary to support aquatic
life. Chemical oxygen demand (COD), biological oxygen demand (BOD) and total organic
carbon (TOC) are the three main methods used to assess organic pollution in aqueous

81
systems. However, because of the tedious nature of BOD and TOC determinations, COD
u IS the predominant method of choice.
For COD determinations, a wide range of chemical reagents have been used as
oxidizing agents, including acidic dichromate, acidic permanganate, iodate, and persulfate.''^
However, dichromate has been found to be the most broadly effective oxidant when used in
1-34-23 strongly acidic solutions and with a Ag(I) catalyst. The standard COD determination
adds an oxidant (CvjO-f'), a catalyst (Ag(I)), and sulfuric acid to an aqueous sample that is
1.2 then heated for ~ 2 hours. This process results in the oxidation of organic compounds, as
shown in Equation 1 for the often used COD-calibration compound potassium hydrogen
phthalate (KC8H5O4 or KHP). This reaction is the equivalent of that in Equation 2 where
oxygen and not CvjO^^' is used as the oxidant. Thus, each mole of Cr207"" oxidizes the same
amount of BCHP as 1.5 moles of Oi. By determining spectroscopically the amount of Cr207'*
consumed or the amount of Cr^"^ generated by these reactions, the amoimt of oxygen that
would be required to complete the parallel conversion in Equation 2 can be calculated.
2 KC8H5O4 + 10 K^CraOv + 41 H2SO4 ->
16 CO2 + 46 H2O + 10 Cr2(S04)3 + 11 K2SO4 (1)
2 KC8H5O4 + 15 O2 + H2SO4 16 CO2 + 6 H2O + K2SO4 (2)
The primary focus of this study rests with the removal of chloride ion from water
samples prior to a COD determination. This step is necessary because chloride ion interferes

82
with a COD determination though the consumption of Cr207 , as shown in Equation 3.
The presence of chloride ion can therefore result in a positive deviation in a COD
determination. In addition, the product of the reaction in Equation 3, CU, can be converted in
24 the presence of ammonia back to chloride ion via the net reaction in Equation 4, thereby
amplifying the effect of the interference of chloride ion. Thus, the effect of chloride ion on a
COD determination cannot be quantitatively accounted for, a situation requiring the removal
of chloride ion prior to the addition of CuOj''.
6 CV + CrjOT^" + 14 H" 2Cr^^ + 3 CI, + 7 HjO (3)
2 NH4^ + 3 CI, -> Nj + 6 HCl + 2 (4)
HgS04 + 2Cr-> HgCl, + S04-' (5)
Almost all of the methods used in COD determinations mask chloride ion by the
1-3,8,10,11.1721-23 addmon of a mercury salt (e.g., HgS04). The masking reaction, shown in
Equation 5, yields an unreactive complex with respect to oxidation by Cr207^'. Other
approaches that attempt to manage the problem of chloride ion interference in COD include
13-16 the addition of silver salts to mask chloride ion, the addition of chromium(ni) to lower
18 the oxidation potential of the reaction in Equation 3, and the determination of the amount of
chloride ion oxidized by iodometric titration with a subsequent correction to the COD
9 determmation for chloride ion.

83
Tlie results described herein pursue an alternative pathway for the removal of chloride
ions from samples in COD determination. The goal is to develop a facile method for the
effective removal of chloride ion that negates the need of the hazardous masking agent like
Hg(n). At 10 mg/L, the interference of chloride ion is below the uncertainty of COD
determinations for most types of samples (e.g., ground water and waste treatment system
samples). Our approach derives in large part from a recent study that evaluated the capability
of removing chloride ion from aqueous samples by its room temperature evolution as gaseous
24.25 HCl. The evolved HCl was then removed from the vapor phase upon passage over a
calcium hydroxide adsorbent that was contained in a glass vessel with glass frits to provide
access to the adsorbent. This process was, however, ineffective in reducing the concenoration
of chloride ion to a level sufBcient to eliminate die use of Hg(II) as a masking agent. To
overcome this limitation, we have explored the apphcation of elevated temperatures to drive
HCl more exhaustively from the sample solution. This approach also necessitated an
investigation of alternative adsorbent materials that would be more insoluble than calcium
hydroxide because of the condensation of the moisture within the adsorbent container. This
paper describes our findings.
EXPERIMENTAL SECTION
Chemicals. Bismuth(III) oxide (Bi203) was purchased from Aldrich Chemical
Company. Standard potassium hydrogen phthalate (KHP) solutions were received from Hach
Company. Reagent grade chemicals were used throughout without further purification.
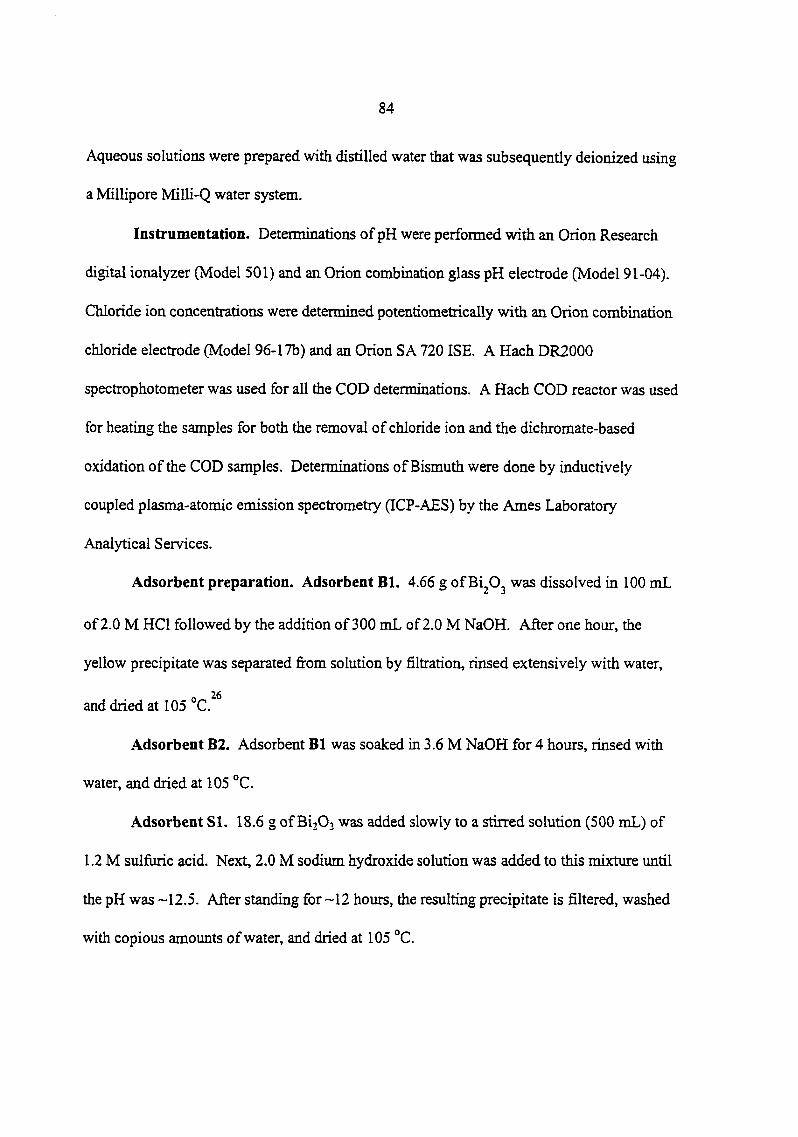
84
Aqueous solutions were prepared with distilled water that was subsequently deionized using
a Millipore Milli-Q water system.
Instrumentation. Determinations of pH were performed with an Orion Research
digital ionalyzer (Model 501) and an Orion combination glass pH electrode (Model 91-04).
Chloride ion concentrations were determined potentiometrically with an Orion combination
chloride electrode (Model 96-17b) and an Orion SA 720 ISE. A Hach DR2000
spectrophotometer was used for all the COD determinations. A Hach COD reactor was used
for heating the samples for both the removal of chloride ion and the dichromate-based
oxidation of the COD samples. Determinations of Bismuth were done by inductively
coupled plasma-atomic emission spectrometry (ICP-AES) by the Ames Laboratory
Analytical Services.
Adsorbent preparation. Adsorbent Bl. 4.66 g of 31,0^ was dissolved in 100 mL
of 2.0 M HCl followed by the addition of 300 mL of 2.0 M NaOH. After one hour, the
yellow precipitate was separated from solution by filtration, rinsed extensively with water,
and dried at 105 °C.
Adsorbent B2. Adsorbent Bl was soaked in 3.6 M NaOH for 4 hours, rinsed with
water, and dried at 105 °C.
Adsorbent SI. 18.6 g of 81303 was added slowly to a stirred solution (500 mL) of
1.2 M sulfuric acid. Next, 2.0 M sodium hydroxide solution was added to this mixture until
the pH was -12.5. After standing for ~12 hours, the resulting precipitate is filtered, washed
with copious amounts of water, and dried at 105 °C.

Basket design and preparation. A Teflon basket was designed to fit inside a
standard Hach COD reaction tube,' and is shown in Figure 1. The basket contains the
adsorbent, allows gas to flow over the adsorbent for the efficient uptake of HCl, and
physically separates the adsorbent from the sample by suspension of the basket above the
sample solution. The screw cap seals against the lip of the basket and tube to seal the
reaction vessel. The holes in the bottom and the large vents on the sides of the basket
facilitate gas and water reflux.
The basket is filled by first placing a layer of fine (~7 |im) pyrex glasswool in the
bottom of the basket. The adsorbents are then added to the basket and covered with another
layer of glasswool. The packed basket is soaked in deionized water for a few minutes to pre-
wet the adsorbent, which is then centrifuged to remove excess water.
Procedures for removal of chloride ion and COD determinations. The overall
procedure has two steps: chloride ion removal and solution digestion. For chloride ion
removal, the sample solutions are prepared by adding 1.00 mL of aqueous sample and 1.00
mL of concentrated sulfuric acid to a reaction tube. A pre-wetted basket with the adsorbent is
then inserted into the reaction tube, which is subsequently capped and gently shaken to mix
the sample with sulfluic acid. The reaction tube is then heated at 150° C for 2 hours. Next,
die reaction tubes are air-cooled and centrifuged. The baskets are then removed from the
reaction tube.
For digestion, the oxidant (K2Cr207) and catalyst (Ag2S04) are added to the sample
solution. The reaction tube is then capped, gently shaken to facilitate mixing, and reheated at

86
5.1 cm
glass wool.
Side View
~ vents for flux
Bismuth Comp.
holes for condensate
drainage
Hach Reaction
Tube
Bottom View
9.6 mm
(A)
Sample for CI"
Removal
(B)
Figure 1. Teflon basket (A) and basket loaded into the reaction tube (B).

87
150 °C for 2 hours. After cooling to room temperature, COD is determined spectroscopically
at 590 nm.
RESULTS AND DISCUSSION
In 18 N sulfuric acid, chloride ion is readily converted to molecular HCl, which is
readily evolved as a gas at elevated temperatures as shown by Equations 6 and 7. However,
to prevent the possible loss of volatile organic compounds in COD samples, the use of a
sealed reaction tube is required. We therefore designed an inert collection basket to contain
the adsorbent and collect HCl in the head space of the sealed reaction tube. The design of the
basket, which is shown in Figure 1, facilitates insertion and sealing in the reaction tube. The
latter characteristics are of importance because these reaction tubes have been designed to
function effectively at the temperature (150 °C) used in the dichromate digestion step in the
standard procedure for COD determinations. Our strategy then is to enhance thermally the
removal of HCl by using conditions similar to those ahready part of the standard COD
determination procedure, i.e., a temperature limit of 150 °C and a sulfuric acid concentration
As noted earlier, we explored the use of insoluble adsorbent materials. To this end,
we focused upon several oxy-compoimds of bismuth, since these materials and their chloride
complexes are insoluble in water as exemplified by Equation 8.
of~18N.
(6)
HC1(3<,) ^ HCl(g) (7)

88
HCl(g) + BiOOH(s) —> BiOCl(s) + H^O (8)
Four different forms of these compounds were tested: as-received Bi203, adsorbent Bl,
adsorbent B2, and adsorbent SI. We found that the as-received Bi203 and adsorbent Bl were
not effective in the extraction of HCl from the vapor phase. We then tested adsorbents that
were reformulations of Bl, which was prepared as previously described by the dissolution of
26 Bi203 in HCl and precipitation by 2.0 M NaOH. Two new formulations (i.e., adsorbent B2
and SI) were used. The first involved the extraction of adsorbent Bl in 3.6 M NaOH to yield
adsorbent B2, the second entailed the dissolution of Bi^Oa in H2SO4 and the precipitation
with NaOH to yield adsorbent SI. These formulations were designed to reduce the possible
presence of residual chloride ion in adsorbent Bl. The remaining portions of this paper
present the results of our tests of each of the adsorbents as extraction phases for the removal
of chloride ion for use in COD determinations.
Adsorbent capacity. In our initial evaluation of performance of each adsorbent, 10.0
mL of 0.0300 M (1065 ppm) HCl solution and 0.12 g of the different forms of the bismuth-
based adsorbents were loaded into separate capped reaction tubes and mixed by sonication
for -2 h. After allowing the liquid and solid phases to separate, the chloride ion
concentrations in the supematant were determined with a chloride ion selective electrode.
The results of these studies are summarized in Table 1. Our findings indicate that
with the exception of the as-received Bi203, each of the other three adsorbents is effective in
the removal of chloride ion. In addition, the data indicate that adsorbents B2 and SI were
more effective in removal of chloride ion than Bl. If then a viable approach can be
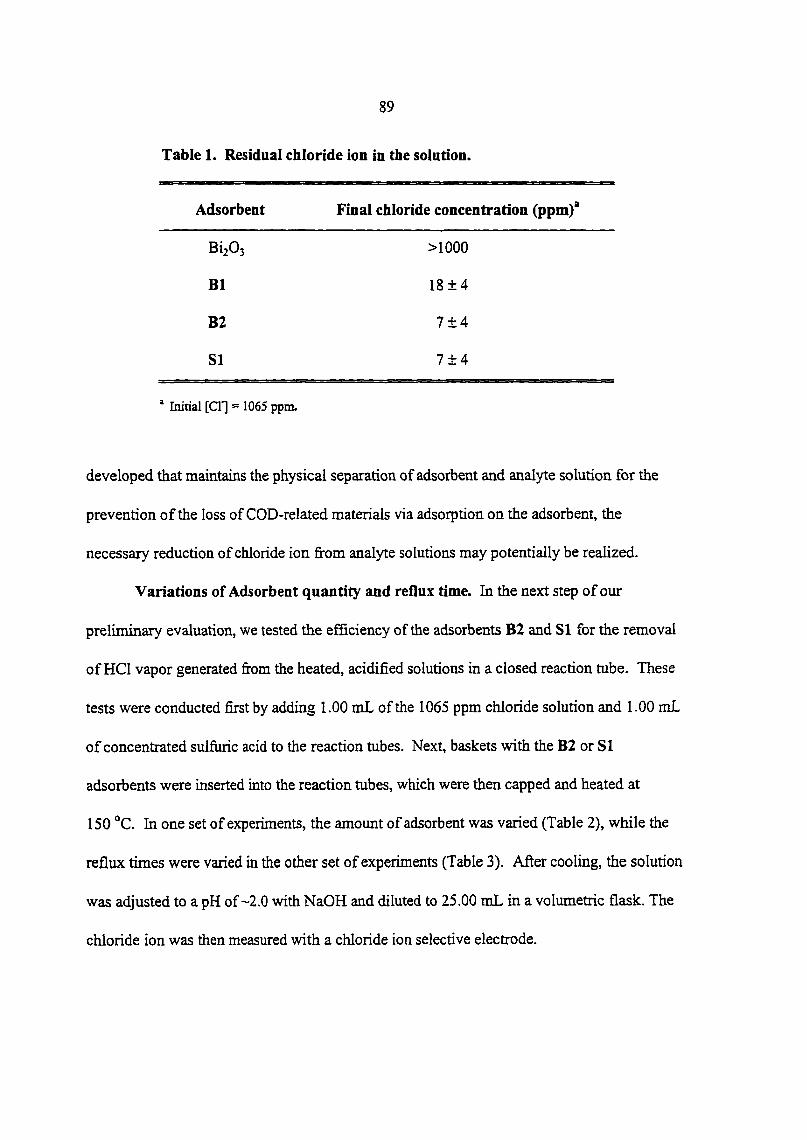
89
Table 1. Residual chloride ion in the solution.
Adsorbent Final chloride concentration (ppm)'
BizOj >1000
B1 18 ±4
B2 7 ±4
SI 7 ±4
* Initial [CI*] = 1065 ppm.
developed that maintains the physical separation of adsorbent and analyte solution for the
prevention of the loss of COD-related materials via adsorption on the adsorbent, the
necessary reduction of chloride ion from analyte solutions may potentially be realized.
Variations of Adsorbent quantity and reflux time. In the next step of our
preliminary evaluation, we tested the efficiency of the adsorbents B2 and SI for the removal
of HCl vapor generated from the heated, acidified solutions in a closed reaction tube. These
tests were conducted first by adding 1.00 mL of the 1065 ppm chloride solution and 1.00 mL
of concentrated sulfuric acid to the reaction tubes. Next, baskets with the B2 or 51
adsorbents were inserted into the reaction tubes, which were then capped and heated at
150 °C. In one set of experiments, the amount of adsorbent was varied (Table 2), while the
reflux times were varied in the other set of experiments (Table 3). After cooling, the solution
was adjusted to a pH of ~2.0 with NaOH and diluted to 25.00 mL in a volumetric flask. The
chloride ion was then measured with a chloride ion selective electrode.

Table 2. Ciiioride ion uptake by various quantities of adsorbents B2 and SI.
Adsorbent Amount of adsorbent (g) Final chloride concentration (ppm)* % Removal of chloride
B2 0.014 350 ± 50 33
B2 0.052 263 ± 50 50
B2 0.093 175 ±50 67
B2 0.734 87 ±50 83
SI 0.008 138 ±50 75
SI 0.041 138 ±50 75
SI 0.087 87 ±50 83
SI 0.748 87 ±50 83
" The uncertamty on the measured chloride ion concentration reflects the large dilution of the 18 N sulfuric acid required to bring the pll to ~2.0. Limit of detection of the chloride ion selective electrode is ~4 ppm.

Table 3. Chloride Ion uptake by adsorbents B2 and SI after refliixing at 150 "C for different periods of time.
Adsorbent Reflux time (min) Final chloride concentration (ppni)' % Removal of chloride
B2 45 275 ± 50 50
B2 60 225 ± 50 58
B2 120 175 ±50 67
SI 10 438 ± 50 17
SI 20 263 ± 50 50
SI 30 175 ±50 67
SI 60 113±50 79
SI 120 87 ±50 83
SI 180 50 ±50 90
SI 480 50 ±50 90
" The uncertainty on the measured chloride ion concentration reflects the large dilution of the 18 N sulfuric acid required to bring the pH to ~2.0. Limit of detection of the chloride ion selective electrode is ~4 ppm.

Table 2 summarizes the results when acidified samples were heated at 150 "C for 2
hours and the amounts of each of the two adsorbents were varied. The results indicate that
adsorbent SI is more efficient in capturing chloride ion than adsorbent B2. That is, adsorbent
SI has a higher capacity for the uptake of chloride ion than adsorbent B2. This difference is
evident, for example, by the much greater extraction capability of the 0.008 g sample of SI
compared to the 0.014 g sample of adsorbent B2. One possible reason for the improved
chloride ion removal efficiency of SI over B2 is the difference between synthesis
procedures. We suspect that, adsorbent B2 contained residual chloride that was possibly
present as BiOCl, with the residual chloride reducing the effective collection capacity. In
contrast, adsorbent SI, while probably containing residual sulfate, could exchange sulfate for
chloride.
Table 3 shows the remaining chloride ion and the fraction of the total chloride ion
removed when the acidified sample was heated at 150 °C for different periods of time in the
presence of the same amount (0.12 g each) of B2- and Sl-adsorbents. The chloride ion
removal efficiency of adsorbent SI after 30 minutes of refiuxing was essentially the same as
that for adsorbent B2 after 120 minutes of refiuxing. Results also indicate that the chloride
ion removal process slowed significantly after ~60 minutes of heating. Based upon these
experimental findings, we ascertained that a 2-hour heating period represented the lower limit
necessary for the removal of chloride ion to the indicated levels.
Sulfuric acid concentration. We next investigated the effect of the sulfuric acid
concentration on the evolution of HCl in the reaction tubes. Sulfiiric acid concentrations

were varied from 1 N to 24 N. Thus, 0.667 mL aliquots of a 1600 ppm chloride solution and
1.33 mL aliquots of the solutions of differing sulfiiric acid concentrations were pipetted into
the reaction tubes. A Teflon basket containing 0.12 g of adsorbent SI was then inserted into
the reaction tube, which was subsequently capped and heated at 150 °C for 2 hours. After
cooling to room temperature, the pH was adjusted to ~2.0 with NaOH, the resulting solution
diluted to 25.00 mL in a volumetric flask, and the residual chloride ion measured with a
chloride ion selective electrode. The results are presented in Figure 2. As expected from
Equations 6-8, the removal efSciency for chloride ion increases as the sulfuric acid
concentration increases, reaching a limiting value at a sulfuric acid concentration of -16 N.
Based upon these results, we adopted a sulfuric acid concentration of 18 N because this
concentration insures that the chloride ion removal process operates at its noted maximal
efBciency, and is similar to that used in the sample digestion process.
Dissolved The possible effects of dissolved Bi^^ on the measurement of COD
were also investigated in view of its possible extraction from the basket by reflux condensate.
Although not likely, there is a possibility that Bi^^ could be oxidized to Bi^^, resulting in a
positive contribution to the COD results. To this end, we dissolved various levels of Bi^~ in
an aqueous matrix and added this solution to two different (175 ppm and 600 ppm) standard
COD samples. The measurements of these COD samples were compared to blank solutions
and the results are shown in Table 4. From this study, we concluded that levels below 100
ppm Bi^^ would not contribute substantially to the determined COD level. In contrast, a
+10% deviation was found when Bi^^ was present at 1000 ppm. However, an analysis using

100
VO 4^
0 "T" 5 10 15
I 20 25
Sulfuric acid concentration (N)
Figure 2. Effect of sulfuric acid concentration on chloride ion removal (see text for details).
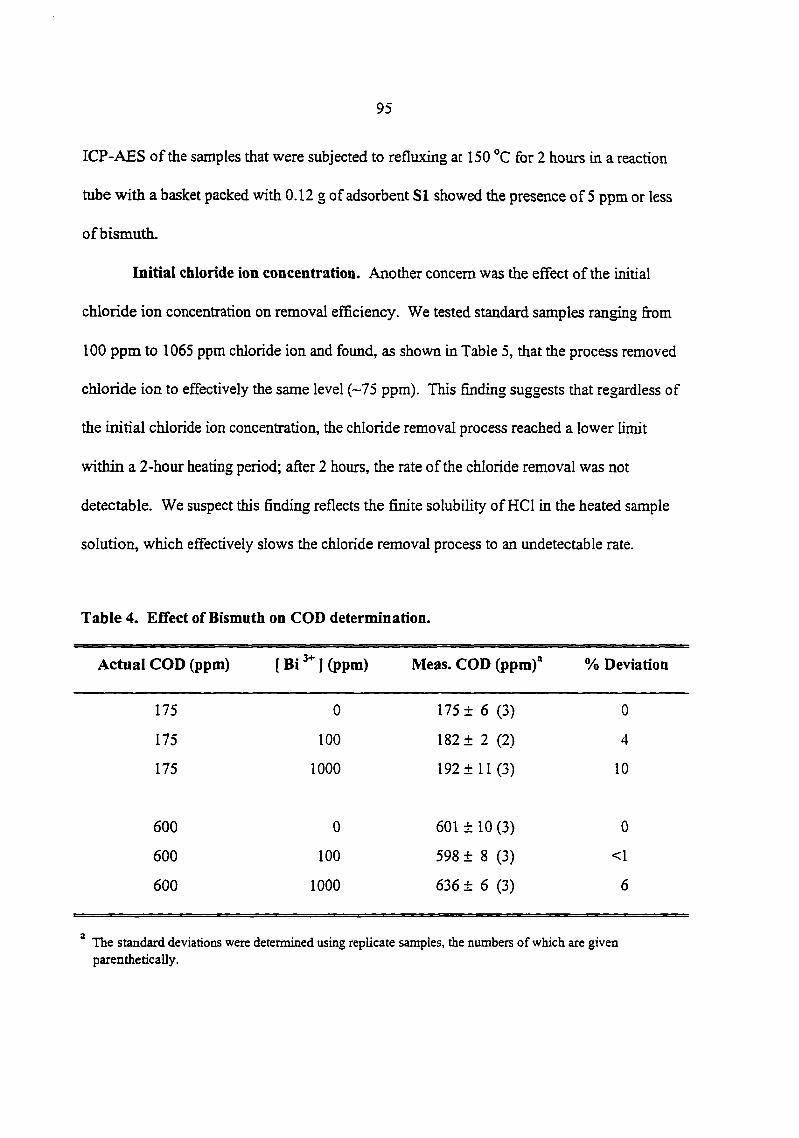
95
ICP-AES of the samples that were subjected to refluxing at 150 °C for 2 hours in a reaction
tube with a basket packed with 0.12 g of adsorbent SI showed the presence of 5 ppm or less
of bismuth.
Initial chloride ion concentration. Another concern was the effect of the initial
chloride ion concentration on removal efficiency. We tested standard samples ranging from
100 ppm to 1065 ppm chloride ion and found, as shown in Table 5, that the process removed
chloride ion to effectively the same level (~75 ppm). This finding suggests that regardless of
the initial chloride ion concentration, the chloride removal process reached a lower limit
within a 2-hour heating period; after 2 hours, the rate of the chloride removal was not
detectable. We suspect this finding reflects the finite solubility of HCl in the heated sample
solution, which effectively slows the chloride removal process to an undetectable rate.
Table 4. Effect of Bismuth on COD determination.
Actual COD (ppm) [Bi'"](ppm) Meas. COD (ppm)° % Deviation
175 0 175 ± 6 (3) 0
175 100 182 ± 2 (2) 4
175 1000 192 ± 11 (3) 10
600 0 601 ± 10 (3) 0
600 100 598 ± 8 (3) <1
600 1000 636 ± 6 (3) 6
^ The standard deviations were determined using replicate samples, the numbers of which are given parenthetically.
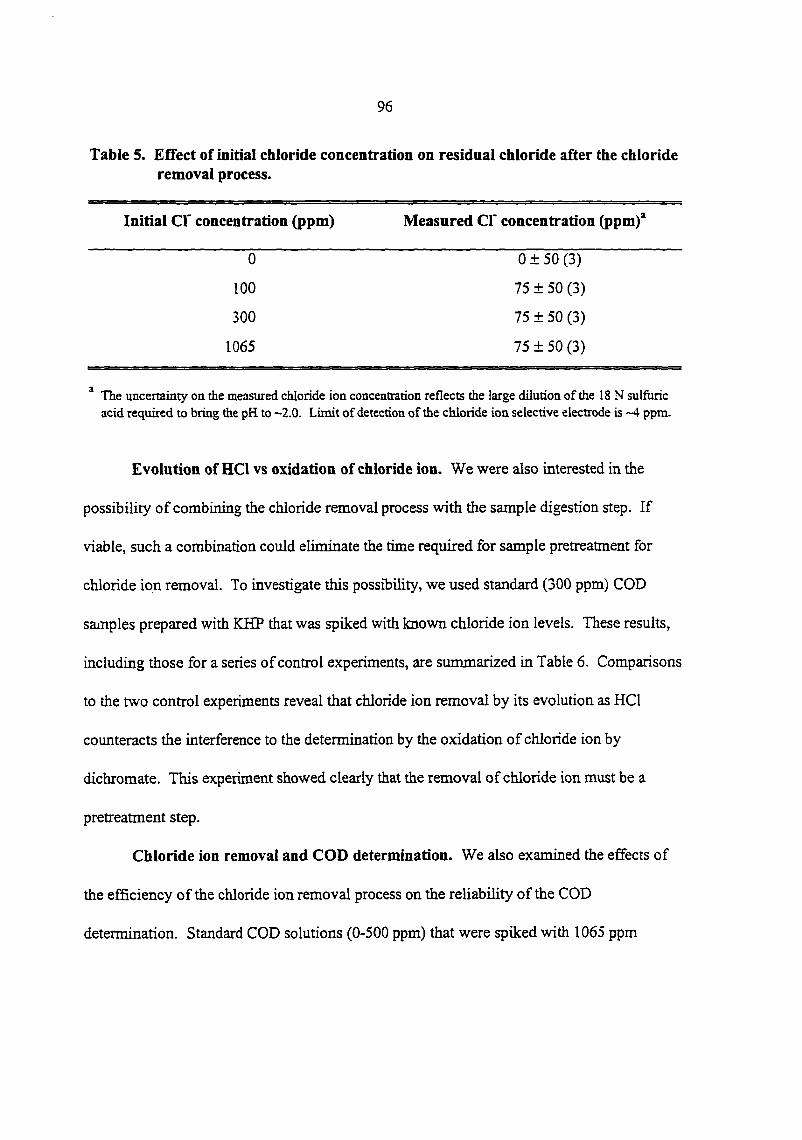
96
Table 5. Effect of initial chloride concentration on residual chloride after the chloride removal process.
Initial CI' concentration (ppm) Measured CI' concentration (ppm)'
0 0 ± 50 (3)
100 75 ± 50 (3)
300 75 ± 50 (3)
1065 75 ± 50 (3)
" The uncertainty on the measured chloride ion concentration reflects the large dilution of die 18 N sulfuric acid required to bring the pH to -2.0. Limit of detection of the chloride ion selective electrode is ~4 ppm.
Evolution of HCl vs oxidation of chloride ion. We were also interested in the
possibility of combining the chloride removal process with the sample digestion step. If
viable, such a combination could eliminate the time required for sample pretreatment for
chloride ion removal. To investigate this possibiUty, we used standard (300 ppm) COD
samples prepared with KHP that was spiked with known chloride ion levels. These results,
including those for a series of control experiments, are summarized in Table 6. Comparisons
to the two control experiments reveal that chloride ion removal by its evolution as HCl
counteracts the interference to the determination by the oxidation of chloride ion by
dichromate. This experiment showed clearly that the removal of chloride ion must be a
pretreatment step.
Chloride ion removal and COD determination. We also examined the effects of
the efficiency of the chloride ion removal process on the reliability of the COD
determination. Standard COD solutions (0-500 ppm) that were spiked with 1065 ppm

97
Table 6. Evolution of HCl vs. oxidation of chloride during COD oxidation.
Cr added (ppm) Adsorbent COD measured' (ppm)
none none 308
1065 none >450
1065 0.12 g SI >450
1065 0.12 gB2 >450
1065 50mgHgS04^ 330
" Before refluxing, samples contained 300 ppm COD in 18 N sulfuric acid. HgS04 was added to the solution, and no bismuth adsorbent was used.
chloride ion were first heated for two hours with the basket filled with 0.12 g of adsorbent
SI. The dichromate oxidant was then added to the sample, and heated for an additional two
hours. The results of this test are plotted in Figure 3. These data reveal a linear correlation
with a slope of 0.997 and a y-intercept of 73.2 ppm COD (correlation coefficient = 0.995).
The results indicate good agreement between the experimental and expected COD values,
with the offset attributed to a fixed level of residual chloride ion as discussed above (Table
5). However, the y-intercept is higher than expected based only on the residual chloride ion
listed on Table 5, which we believe reflects the presence of nitrogen-containing impurities in
the preparation solutions.
Ag(I) Catalyst Silver(I) ion is often iised as a catalyst in COD determinations to
insure the effective oxidation of a wide range of organic compounds by dichromate. To
determine the effects of Ag(I) ion upon the chloride ion removal process, samples were
prepared by mixing 1.00 mL of concentrated sulfuric acid containing 1% silver sulfate (w/v).

700
600
500
400
300
200
100
0
Fi
vo 00
I I I I
100 200 300 400 500 600
COD (ppm)
re 3. Effect of remaining chloride ion on the COD detemiination (see text for details).
and 1.00 mL of COD standard solution that were spiked with 1065 ppm chloride ion. The
chloride ion pretreatment process was conducted at 150 °C for 2 hours with 0.12 g of
adsorbent S1 in the basket. The basket was then removed, the oxidant added, and the
reaction tube heated again at 150 °C for another 2 hours. The COD content was determined
after cooling to room temperature. These findings are presented in Figure 4, which shows a
linear correlation (slope: 0.862, y-intercept: 72.0 ppm COD, and correlation coefficient:
0.999) between the measured and expected COD levels. Thus, the addition of Ag(I) salt to
the sample does not have a notable impact on the chloride ion removal process, as evident
fi-om a comparison to the correlation in Figure 3.
However, if Ag(I) salt is added after the chloride ion removal step and prior to
oxidation of the sample by dichromate, a decrease in the backgroimd interference due to
chloride ion is realized. This decrease is shown by the linear correlation (slope: 0.984, y-
intercept: 11.5 ppm COD, and correlation coefficient: 0.998) presented in Figure 5. The low
y-intercept of 11.5 ppm for the data, in comparison to those in Figures 3 and 4, is attributed
13-16 to the increased difficulty of oxidizing chlonde ion when it is bound with Ag(r) as AgCl.
CONCLUSIONS
Our results show that the use of highly toxic mercury salts to mask the interference of
chloride ion can potentially be avoided with a bismuth-based adsorbent and minor
modifications in the current standard method of COD determination. The bismuth adsorbent
prepared using sulfuric acid, adsorbent SI, proved the most effective with our basket design
in the minimization of chloride ion interference in COD determinations. The majority of

500
400
300
2 200
100
0
0 100 200 300 400 500
COD (ppni)
Figure 4. Chloride interference on COD determinations when Ag^ is present during the chloride ion removal step (see text for details).

500
100 200 300 400 500
COD (ppm)
Figure 5. Chloride interference on COD determination when Ag^ is present only in the oxidation step (see text for details).

102
chloride ion in an aqueous sample is removed as HCl gas, which is captured by the bismuth
adsorbent packed in the suspended basket. The residual chloride ion concentration is found
to be effectively constant regardless of the initial chloride ion content of the sample.
Interference in COD meastxrement resulting from the remaining chloride ion is further
reduced by the addition of Ag(I) salt after the completion of the bismuth-based chloride ion
removal step. The Ag(I) ion serves as a catalyst for the organic oxidation process with the
collateral masking of residual chloride ion. Tests are underway to delineate the scope of this
process in terms of the many types of COD samples often encountered in water testing
laboratories.
ACKNOWLEDGMENTS
This work was supported by the Hach Company, OfiSce of Basic Research-Chemical
Sciences Division of the United States Department of Energy-Ames Laboratory, and by the
Microanalytical Instrumentation Center of the Iowa State University. The Ames Laboratory
is operated for the United States Department of Energy by the Iowa State University under
contract No. W-7405-eng-82.
REFERENCES
1) Gibbs, C. R. Introduction to Chemical Oxygen Demand', Hach Company: Loveland, 1993; Booklet No. 8.
2) APHA Standard Methods for the Examination of Water and Wastewater, 19 th. ed.; American Public Health Association; Washington, DC, 1995.
3) Himebaugh, R. H.; Smith, M. J. Anal. Chem. 1979,51,1085-1087.
4) Medalia, A. I. Anal. Chem. 1951, 23, 1318-1320.

103
5) Moore, W. A.; Kroner, R. C.; Ruchhoft, C. C. Anal. Chem. 1949, 21, 953-957.
6) Moore, W. A.; Ludzack, F. J.; Ruchhoft, C. C. Anal. Chem. 1951, 23, 1297-1300.
7) Moore, W. A.; Walker, W, W. /fna/. CAem. 1956,28,164-167.
8) Dobbs, R. A.; Williams, R. T. Analytical Chemistry 1963, 35, 1064-1067.
9) Baumann, F. l.Anal. Chem. 1974, 46, 1336-1338.
10) Jirka, A. M.; Carter, M. J. Anal. Chem. 1975,47,1397-1402.
11) Canelli, E.; Mitchell, D. G.; Pause, R. W. Water Research 1976,10, 351-355.
12) Ryding, S.-O.; Forsberg, A. Water Research \911,11, 801-805.
13) Lloyd, A. Analyst 1982,107, 1316-1319.
14) Ballinger, D.; Lloyd, A.; Morrish, A. Analyst 1982,107, 1047-1053.
15) Pitrebois, L.; Schepper, H. D. Trib. Cebedeau 1984, 484, 83-86.
16) deCasseres, K. E.; Best, D. G.; May, B. D. WAT. Pollut. Control 1984, 416-419.
17) Jones, B. M.; Sakaji, R. H.; Daughton, C. G. Anal. Chem. 1985, 57, 223A-1331.
18) Thompson, K. C.; Mendham, D.; Best, D.; Casseres, K. E. D. Analyst 1986, 111, 483-485.
19) Gonzalez, J. F. Envirom. Tech. Lett. 1986, 7, 269-272.
20) Soto, M.; Veiga, M. C.; Mendez, R.; Lema, J. M. Envirom. Tech. Lett. 1989, 70, 541-548.
21) Dasgupta, P. K.; Petersen, K. Anal. Chem. 1990, 62, 395-402.
22) Belkin, S.; Brenner, A.; Abeliovich, A. Wat.Res. 1992, 26, 1577-1581.
23) BeUdn, S.; Brenner, A.; Abeliovich, A. Wat. Res. 1992, 26, 1583-1588.
24) Wagner, V. R.; Ruck, W. Z Wasser Abwasser Forsch. 1981,14,145-151.
25) Wagner, V. R.; Ruck, W. Z. Wasser Abwasser Forsch 1982,15, 287-290.
26) Fritsche, U. Process for removing nitrate from water. Patent No. DE 4,125,627 Al, German Patent Office, Federal Republic of Germany, 1993.

104
CHAPTER 5. STRUCTURAL ORIENTATION PATTERNS FOR A SERIES OF
ANTHRAQUEVONE SULFONATES ADSORBED AT AN AMEVOPHENOL
TmOLATE MONOLAYER CHEMISORBED AT GOLD
A paper to be submitted to The Journal of Physical Chemistry
Bikas Vaidya, Randall 8. Deinhaimner, and Marc D. Porter*
ABSTRACT
This paper presents the results of an investigation of the structural orientation and
binding patterns for a series of anthraquinone sulfonates at the protonated monolayer
spontaneously adsorbed at gold from 4-aminothiophenol (ATP). Both mono- (i.e., 2-
anthraquinone sulfonate) and di-sulfonated (1,5-anthraquinone disulfonate, 1,8-
anthraquinone disulfonate, and 2,6-anthraquinone disulfonate) anthraquinones with different
positioning of the sulfonate groups were used. The structural and binding patterns were
deduced using infrared reflection spectroscopy. These deductions relied primarily on
orientational inferences from the strengths of sulfonate vibrational modes, as coupled to die
infrared surface selection rule at substrates like gold with a high reflectivity. Implications to
the eventual control of the structure to multi-layer organized films are discussed.
INTRODUCTION
Spontaneously adsorbed monolayer and multilayer films have several intriguing
1-9 properties of value as both model and technologically relevant interfacial materials. In the
case of the former, these types of interfacial structures can be used to gain insights into the
105
fundamental basis of interfacial reactivity, lubrication, and related processes. This paper is
aimed at exploring issues that are of importance in extending the architecture of organic
monolayer films to more than a single layer. The intent is to assess some of the operational
principles requisite to the growth and orientation of a second adsorbed layer.
Approaches to construct ordered multilayer films via spontaneous adsorption have, to
10-13 date, focused on the use of stacked zirconium phosphonate and phosphate layers and on
biiimctional alkanethiolates. In both cases, the strategy entailed the use of a second
electrostatically-adsorbed layer that sterically matched that of the underlying layer in an
attempt to translate the stmctural integrity of the underlying layer to the second layer. These
approaches have met with varying degrees of success, with the disorder in the multilayer
structure increasing as the number of layer increase.
Like many other sulfur-containing organic compounds, 4-aminothiophenol (ATP) has
drawn attention of many surface scientists, mainly because of its ability to forai an ordered
14^1-29 24^0 monolayer on metal surfaces like gold and silver , and the presence of a reactive
22.28.31 amme group to serve as a site for subsequent modification. Monolayers of ATP on
gold (ATP/gold) has been used as a promoter for rapid heterogeneous electron transfer of
32 29 2U7 cytochrome c, and pyrroloqumine qumone, for growmg ordered polymer of aniline,
26 and to immobilize glucose oxidase and redox mediator in glucose selective electrode. In
addition, the amine group at low solution pH is protonated as shown in Scheme 1. The
protonated ATP monolayer on gold is capable of electrostatically binding anionic species Uke
14 2,6-anthraquinone disulfonate.

106
Scheme 1
rm2 1^2 1^3"
IIIIIIHIIIIHIIIIIIIIIIH Au
SH Illlllllllllllllllllllllll
ATP/An
IIHIIIIIIlflllllllllllll
ATP/Au ATP
The following sections investigate the formation and characterization adsorbed
anthraquinone mono- and di- sulfonates (Chart 1) at the protonated form of a gold-bound
monolayer formed from 4-aminothiophenol (ATP) using infrared reflection spectroscopy.
Through the use of the different structures of these adsorbates, msights into the binding and
structural orientation patterns of potential use in the controlled construction of ordered
multilayer fihns. This paper presents the results and conclusions of this study.
EXPERIMENTAL SECTION
Chemicals. 4-Aminothiophenol, and 1,8-anthraquinone disulfonate (dipotasium salt)
were obtained from TCI. 2-anthraquinone monosulfonate (sodium salt), 1,5-anthraquinone
disulfonate (disodium salt), and 2,6-anthraquinone disulfonate (disodium salt) were obtained
from Aldrich. All the reagents were used as received. Aqueous solutions were prepared with
distilled water that was subsequently deionized using Millipore Milli-Q water system.
Sample preparation. Substrates were prepared by the resistive evaporation of
~300 nm gold onto 75 mm x 25 mm glass slides primed with ~15 run of chromium in a

Chart 1.
2-AQMS
1,5-AQDS
oJOCOt
2,6-AQDS
o --1
1,8-AQDS

108
cryogenically pumped Edwards E306A coating system. The deposition rate of gold was 0.3-
0.4 mn/s.
After preparation, the gold substrates were immersed into 1-10 mM ethanolic solution
of ATP for one hour unless otherwise stated. The samples were rinsed extensively with
ethanol and dried on a spin coater. These samples were then immersed for one hour into 5
mM aqueous solutions of the anthraquinone derivatives composed of a pH 2.0 phosphate
buffer (0.1 M H3PO4 and 0.1 M NaH2P04). Upon immersion, the samples were lightly
rinsed with buffer (devoid of any anthraquinone), 0.01 M HCl, and dried on a spin coater.
Instrumentation. Infrared spectra were acquired with a Nicolet 750 FTIR
spectrophotometer and a liquid Nt cooled HgCdTe detector. Reflection spectra were
obtained using p-polarized light incident at 81° with respect to the surface normal. A home-
33 built sample holder was used to position the substrate in the spectrophotometer. The
reflection spectra are reported as -log(R/Ro), where R is the reflectance of the sample and R^
is the reflectance of a reference, octadecanethiolate- 37 monolayer on gold. Transmission
spectra were obtained by the dispersion of the samples in KBr. The spectra were collected at
2 cm"' resolution (zero filled) with Happ-Genzel apodization. Further details of these
34 methods are given elsewhere.
RESULTS AND DISCUSSION
Structural characterization of the 4-ATP monolayer at gold. As a starting point
for analyzing the bindings patterns of the anthraquinone sulfonates at ATP/gold, the spectra
for ATP dispersed in KBr (ATP/KBr) and for as-formed ATP/gold are presented between

109
1750 and 750 cm"' in Figures la,b, respectively. Peak positions and mode assignments are
summarized in Table 1. The strong correlations of the positions for several of the bands for
the two different types of samples confirm the general composition of ATP/gold. This
correlation is evident, for example, from the presence of the 5(N-H) band near 1620 cm"\ the
v(C=C) band near 1590 cm"', and the v(C-N) band near 1281 cm"' in both spectra.
These data also provide quahtative insight into the average spatial orientation of
ATP/gold. The analysis develops from the infrared surface selection rule which relies on the
preferential excitation of vibrations with transition dipoles having components normal to
35 highly reflective metallic surfaces. Thus, assuming that the symmetry species for 4-ATP
can be assigned to the C2v point group and that the plane of the aromatic ring is in the jyz
plane and 2 is the C2 axis, the transition dipoles for the infrared active ai and hj symmetry
30 species are in-plane modes and the bj symmetry species is an out-of-plane mode.
Therefore, the virtual absence in the ATP/gold spectrum of the bj vibrational mode found at
823 cm"' for ATP/KBr, coupled with the persistence of the aj modes at 1591 and 1178 cm"',
are indicative of an average orientation of the aromatic ring along the surface normal. This
assessment, which is represented in Scheme 1, is consistent with those in earlier reports on
28,30 this and closely related monolayers systems.
Infrared structural characterizations of anthraquinone mono- and di-sulfonates
adsorbed at ATP/Gold. ffl. General Observations. The infrared spectroscopic data for
diese systems are presented between 1750 and 750 cm"' in Figures 2-6. Summaries of band
assignments and peak positions for the bands central to the qualitative interpretation for the

0.2 A. U.
0.001 A. U.
T T T T T 1" T T T T
1700 1600 1500 1400 1300 1200 1100 1000 900 800
Wavenumber (cm*)
Figure 1. Infrared spectra of ATP in KBr (a) and ATP al gold (b).

I l l
Table 1. Infrared peak positions (cm'') and band assignments for 4-amino-thiophenoi dispersed in KBr (4-ATP/KBr) and chemisorbed at gold (4-ATP/gold).
peak positions
4-ATP/KBr 4-ATP/gold band assignments'
1620 1623 6(NH)
1594 1591 v(C=C), 8a (El)
1495 1488 v(C=C) + 5(C-H), 19a(ai)
1423 v(C=C) + 5(C-H), 19b (b,)
1404
1284 1281 v(C-N)
1222
1205
1176 1178 5(C-H),9a(ai)
1091 1078 v(C-S),7a(ai)
823 Tt(C-H), 11 (bi)
a) Mode descriptions: v, stretch; 5, bend; tc, wags.

0.001 A. U.
T T T T T T T
1700 1600 1500 1400 1300 1200 1100 1000 900 800
Wavenumber (cm"')
Figure 2. Infrared spectra of 2-AQMS in KBr (a) and at ATP/gold (b).

0.4 A. U.
0.001 A. U.
b T T T T T T T I • I I I ' I ' I ' I 1 1 1 1
1700 1600 1500 1400 1300 1200 1100 1000 900 800
Wavenumber (cm"^)
Figure 3. Infrared spectra of 2,6-AQDS in KBr (a) and at ATP/gold (b).

0.2 A. U.
0.001 A. U.
T T T T T T 1 ' « ' I ' I • I • I • I • I ' ' • - ' I ,
1700 1600 1500 1400 1300 1200 1100 1000 900 800
Waveniimber (cm'')
Figure 4. Infrared spectra of 1,5-AQDS in KBr (a) and at ATP/gold (b).

0.4 A. U.
0.001 A. U.
T T T T T T T T T
1700 1600 1500 1400 1300 1200 1100 1000 900 800
Wavenumber (cm"')
Figure 5. Infrared spectra of 1,8-AQDS in KBr (a) and at ATP/gold (b).

116
0.001 A. U.
V-
1600 1400 1200
Wavenumber (cm'^)
1000 800
Figure 6. Infrared spectra of 1,8-AQDS at ATP/gold formed by immersing in 5 mM 1,8-AQDS in pH 2 aqueous solution for (a) 5 minutes, (b) 20 minutes, (c) 1 hour, and (d) 1 day.

117
binding patterns of the anthraquinone sulfonates at ATP/gold are given in Table 2. These
interpretations will rely largely on the relative magnitudes of the v(C=0), the two
modes, and the V5(S03) mode of the adsorbed anthraquinone sulfonates and the perturbation
of the 5(NH) and v(CN) modes of the underlying ATP monolayer.
In general, we found that the formation of the adsorbed layers from the anthraquinone
mono- and di-sulfonates was complete within one hour after immersing freshly prepared
ATP/gold into the sample solutions. This conclusion was based on the observation that, with
the exception of 1,8-AQDS, there were only subtle changes ui the infrared spectra of these
systems after -60 min of immersion in the formation solutions. We will focus largely on the
general structural interpretations of the adsorbed anthraquinone sulfonates formed with -60
min immersion times, commenting in detail only on the much slower evolution of the 1,8-
AQDS system.
14 We also found, as previously described, that the presence of adsorbed anthraquinone
sulfonates were detectable via infrared spectroscopy only when using formation solutions
that insured the protonation of the amine group of ATP. Formation conditions where the
amine was not protonated failed to yield a detectable adsorbed species. We were also
successful in tests to adsorb small amounts of the anthraquinone sulfonates at uncoated gold
films. The resulting spectra, while having bands with magnitudes near the performance limit
of our instrument, aided in completing some of the vibrational mode assigimients.
CiiV 2-AOMS. The spectroscopic data for 2-AQMS/KBr and for 2-AQMS adsorbed
at ATP/gold are shown in Figures 2a,b, respectively. Though not quantifiable in terms of

Table 2. Infrared peak positions (cm'') and band assignments for anthraquinone mono- and di sulfonates dispersed in KBr, and adsorbed at an ATP monolayer on gold.
Anthraquinone modes ATP modes
Sample V (C=0) Vas (SO3) vJSOj) 8(NH) V (C=C) + 8(C-H), 19a(a,)
2-AQMS/KBr 1670 1234 1217
1047
2-AQMS/ATP/Au 1678 nd 1041 1625 1487
2,6-AQDS/KBr 1672 1240 1181
1045
2,6-AQDS/ATP/Au 1686 1178 1041 1625 1487
1,5-AQDS/KBr 1691 1243 1208
1042
1,5-AQDS/ATP/Au 1695 nd 1046 1627 1487
1,8-AQDS/KBr 1680 1210 1046
1.8-AQDS/ATP/Au 1695 1680
nd 1047 1622 1488

119
coverage, the presence of the v(C=0) band at 1678 cm'^ and the Vs(S03) band at 1041 cm"' in
Figure 2b confirms the adsorption of 2-AQMS at ATP/gold. The adsorption of 2-AQMS is
also demonstrated by the strong perturbations of the 6(NH) and v(CN) modes of ATP. The
former mode is at 1620 cm"' for ATP/KBr, but is weakened, broadened, and shifted (~5 cm"'
to higher energy) for ATP/gold. The latter mode is at 1284 cm"' for ATP/KBr, and is not
detected for ATP/gold.
In addition, the absence of bands around 1225 cm"', a region where the two Vjj.(S03)
bands are found in Figure 2a, is consistent with the general structural picture given in Scheme
2. This description develops, in part from the difference in the orientations of the transition
dipoles for the Vas(S03) and modes. Qualitatively, the V3(S03) mode is aligned along
the C-S bond of the tetrahedron formed by the C-SO3 substructure, whereas those for both of
the V3j(S03) modes are orthogonal to the Vs(S03) mode. Thus, the presence of the Vs(S03)
band, the absence of both of the Va5(S03) bands, the strong perturbation of the 5(NH) band,
and the absence of the v(CN) band when 2-AQMS is adsorbed at ATP/gold points to the
general structural orientation of adsorbed 2-AQMS that is depicted in Scheme 2.
Scheme 2 also suggests that adsorbed 2-AQMS interacts primarily through
electrostatic interactions with the underlying protonated amine of ATP/gold. That is, the
structure of the underlying ATP monolayer is not detectably affected by the adsorption of 2-
AQMS. This assertion is based on the similarity in the magnitudes of the band at 1488 cm"'
(i.e., a v(C=C)-t- 5(C-H) mode) in Figures 2a,b, which would likely exhibit a difference in
magnitude if the adsorption of 2-AQMS altered the spatial orientation of chemisorbed ATP.
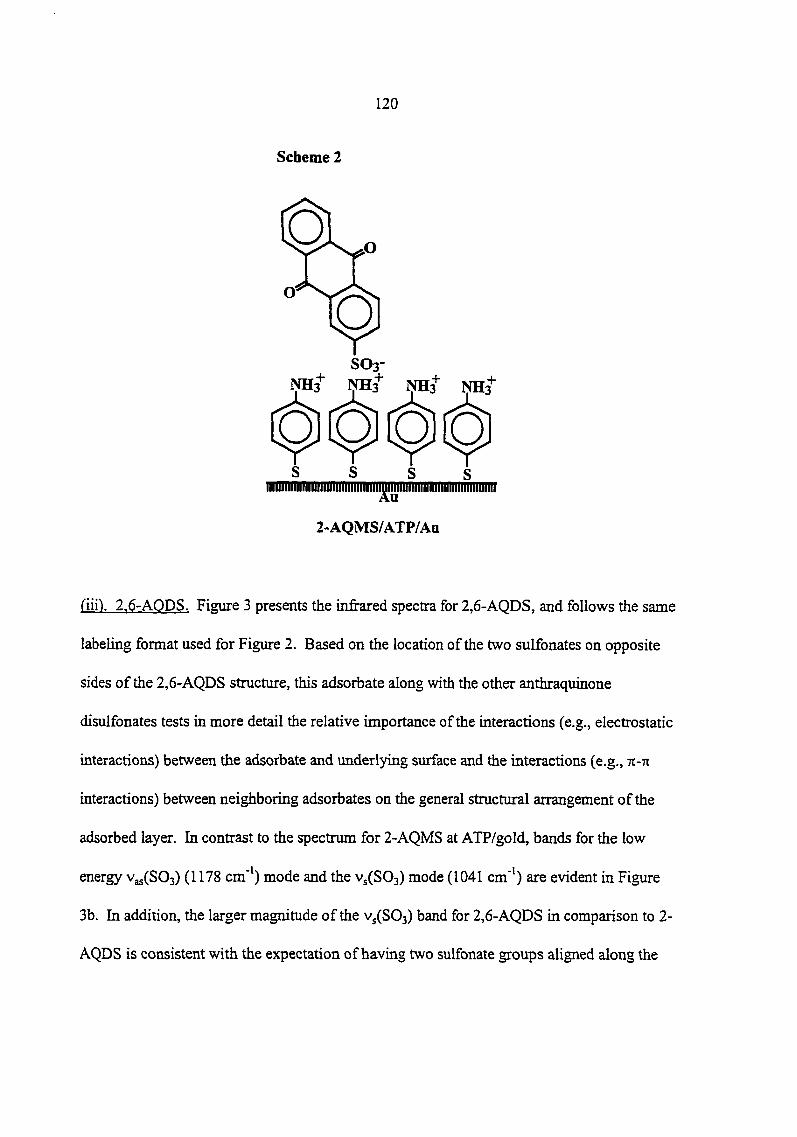
120
Scheme 2
o
o S03-
NHi^ mi NHi^
Q Q Q Q s s s s
iiiiiiiiiiiiiiiiiiiiiiiiiiiiiiiiiiiii]j|iniiiiiiiiiiiiiiiiiiiiiiiiiiiiiiiiii
2-AQMS/ATP/Au
Ciin. 2.6-AODS. Figure 3 presents the infrared spectra for 2,6-AQDS, and follows the same
labeling format used for Figure 2. Based on the location of the two sulfonates on opposite
sides of the 2,6-AQDS structure, this adsorbate along with the other anthraquinone
disulfonates tests in more detail the relative importance of the interactions (e.g., electrostatic
interactions) between the adsorbate and underlying surface and the interactions (e.g., n-n
interactions) between neighboring adsorbates on the general structural arrangement of the
adsorbed layer. In contrast to the spectrum for 2-AQMS at ATP/gold, bands for the low
energy Vjs(S03) (1178 cm"') mode and the Vs(S03) mode (1041 cm*') are evident in Figure
3b. In addition, the larger magnimde of the Vs(S03) band for 2,6-AQDS in comparison to 2-
AQDS is consistent with the expectation of having two sulfonate groups aligned along the

121
surface normal of the underlying substrate. These signatures give rise to the general
structural picture given in Scheme 3, which shows that the electrostatic interactions between
the protonated amine and one of the sulfonates play a strong role in controlling the spatial
orientation of adsorbed 2,6-AQDS.
Scheme 3.
SO3-
NH3 3 IVHi NH3
oppp s s s s
IIIIIIIIIIIIIIIIIIIIIIIIIIIIIIIII^IIIIIIIIIIIIIIIIHIIIIIIIIIIIIIIIIIIIIIIIII
2,6-AQDS/ATP/Au
fiv). 1.5-AODS. Like 2,6-AQDS, the structure of 1,5-AQDS tests the relative
importance of the interactions between the adsorbate and substrate and between neighboring
adsorbates in dictating the spatial arrangement of this adsorbate-substrate system. Indeed,
there are several parallels between the two spectra for 1,5-AQDS (Figure 4a,b) and the two
for 2,6-AQDS. In other words, the effect of adsorbed 1,5-AQDS on the underlying modes

122
(i.e., 5(NH) and v(C-N)) of ATP reflects the electrostatic interaction between adsorbed 1,5-
AQDS and the protonated amine group of the ATP monolayer.
There are, however, some additional striking differences between the spectra in Figures 4a,b.
These differences are indicative of a spatial arrangement for adsorbed 1,5-AQDS that differs
markedly from those of both 2-AQMS and 2,6-AQDS. Figure 4b, while exhibiting a strong
band at 1046 cm"' for the Vs(S03) mode, is virtually devoid of any detectable vibrational
modes between 1350 and 1100 cm"'. This region contains several strong bands in Figure 4a,
including the Vas(S03) modes at 1243 and 1208 cm"' as well as the C-(C=0)-C stretching
36 mode for the quinone substructure of the adsorbed species. While as yet uncertain as to the
specific band assignment, the latter mode has a transition dipole that lies along the long axis
of the anthraquinone structure. Therefore, the absence of the bands between 1350 and 1100
cm"', together with the presence of a strong Vs(S03) band in Figure 4a, supports the structural
arrangement presented in Scheme 4.
(v). 1.8-AQDS. The structural form of 1,8-AQDS differs from 2,6-AQDS and 1,5-AQDS by
having both of the sulfonate groups on the same side of the extended ring structure. The
effect of this structural variation is revealed by comparisons of Figures 5a,b. As found for
adsorbed 1,5-AQDS, the bands between 1350 and 1100 cm"' are notably weaker for 1,8-
AQDS adsorbed at ATP/gold (Figure 5b) than for 1,8-AQDS/iCBr. Indeed, the spectrum for
adsorbed 1,8-AQDS is more like that of adsorbed 1,5-AQDS than of adsorbed 2-AQMS and
adsorbed 2,6-AQDS. In other words, the presence of the large band for Vs(S03) at 1047 cm"',
coupled with the low magnitudes of the spectral features between 1350 and 1100 cm"', is

123
Scheme 4.
Q Q SO3- o
m} NH3" NH3 NH3
Q Q Q Q s s s s
IIIIIIIIIIIIIIIIIIIIIIIIIIIIIIIIIIIIH IIIIIIIIIIIIIIIIIIIIIIIIIIIIIIIIIIH
1,5-AQDS/ATP/Au
diagnostic of the general structural arrangement shown in Scheme 5 for 1,8-AQDS adsorbed
at an ATP monolayer.
Interestingly, the evolution of the IR spectra for 1,8-AQDS on ATP/Au requires a
more extended period of immersion than the ~60 minutes to reach an effectively unchanged
spectrum for the other three adsorbates. The evolution of the spectrum for this system is
presented in Figure 6. As evident, the v(C=0) (~1695 cm"') evolves with increasing
immersion time. At short immersion times (e.g., 5 min), the v(C=0) band has a relatively
undefined structure, where as the two distinct bands appear after 24 hours of immersion.
Interestingly, the low energy band at 24 hours is located at the same position as that for 1,8-
AQDS/KBr (1680 cm"'). This evolution indicates the formation of a more ordered layer of
1,8-AQDS dispersed in KBr. We believe the trend evolution of the v(C=0) band indicates

124
Scheme 5.
Q Q SO3- O SO3-
1} IfH^ NH^"
Q O Q Q s s s s
iiiiiiiiiiiiiiiiiiiiiiiimiiiimitiiiiiiiiiiiiiiiiiiiiiiiiiiiiiiiiiiiiiiiii Aa
1,8-AQDS/ATP/Au
the formation of a more ordered layer of 1,8-AQDS on ATP/Au as immersion time increases.
We attribute the slower ordering of 1,8-AQDS to the greater barrier to lateral movement
because of having two effective linkages to the siirface as opposed to the single linkages of
the other three adsorbates.
CONCLUSIONS
The chemisorption of ATP forms an ordered monolayer on gold with an average
orientation of the aromatic ring along the surface normal that can be protonated or
deprotonated by varying the pH of the contacting solution. Anthraquinone mono- and
disulfonates can be electrostatically attached to the protonated ATP monolayer on gold. The
orientation of the authraquinone mono- or disulfonate attached to the protonated ATP surface

125
is largely directed by the anionic sulfonate groups that bind to the surface-bound ammonium
group.
ACKNOWLEDGMENTS
This work was supported by the Office of Basic Research-Chemical Sciences
Division of the United States Department of Energy-Ames Laboratory, and by the
Microanalytical Instrumentation Center of the Iowa State University. The Ames Laboratory
is operated for the United States Department of Energy by the Iowa State University under
contract No. W-7405-eng-82.
REFERENCES
1) Whitesides, G. M.; Laibinis, P. E. Langmuir 1990, 6, 87-96.
2) Chau, L.; Porter, M. D. Chem. Phys. Lett. 1990,167,198-204.
3) Stole, S. M.; Porter, M. D. Langmuir 1990, 5,1199-1202.
4) Ulman, A. An Introduction to Ultrathin Organic Films from Langmuir-Blodgett to Self-
Assembly, Academic Press: Boston, 1991.
5) Walczak, M. M.; Chung, C.; Stole, S. M.; Widrig, C. A,; Porter, M. D. J. Am. Chem. Soc.
1991,112, 2370-2378.
6) Walczak, M. M.; Popenoe, D. D.; Deinhammer, R. S.; Lamp, B. D.; C, C.; M. D, P.
Langmuir 1991, 7,2687-2693.
7) Widrig, C. A.; Alves, C. A.; Porter, M. D. J. Am. Chem. Soc. 1991,113, 2805-2810.
8) Zak, J.; Yuan, H.; Woo, L. K.; Porter, M. D. Langmuir 1993, 9,2772-2774.

126
9) Walczak, M. M.; Alves, C. A.; Lamp, B. D.; Porter, M. D. J. Electroanal. Chem. 1995,
396,103-114.
10) Lee, H.; Kepley, L. J.; Hong, H.; Akhter, S.; Mallouk, T. E. J. Phys. Chem. 1988, 92,
2597-2601.
11) Keller, S. W.; Kim, H.; Mallouk, T. E. J. Am. Chem. Soc. 1994,116, 8817-8818.
12) Kaschak, D. M.; Mallouk, T. E. J. Am. Chem. Soc. 1996,118, 4222-4223.
13) Hanken, D. G.; Naujok, R. R.; Gray, J. M.; Com, R. M. Anal. Chem. 1997, 69, 240-248.
14) Sun, L.; Johnson, B.; Wade, T.; Crooks, R. M. J. Phys. Chem. 1990, 94, 8869-8871.
15) Evans, S. D.; Ulman, A. J. Am. Chem. Soc. 1991,113, 5866-5868.
16) Sun, L.; Kepley, L. J.; Crooks, R. M. Langmuir 1992, 8, 2101-2103.
17) Kim, T.; Crooks, R. M.; Tsen, M.; Sun, L. J. Am. Chem. Soc. 1995,117, 3963-3967.
18) WeUs, M.; Dermody, D. L.; Yang, H. C.; Kim, T.; Crooks, R. M. Langmuir 1996,12,
1989-1996.
19) Wells, M.; Crooks, R. M. J. Am. Chem. Soc. 1996,118, 3988-3989.
20) Yang, H. C.; Dermody, D. L.; Xu, C.; Ricco, A. J.; Crooks, R. M. Langmuir 1996,12,
726-735.
21) Rubinstein, I.; Rishpon, J.; Sabatini, E.; Redondo, A.; Gottesfeld, S. J. Am. Chem. Soc.
1990,112, 6135-6136.
22) Sun, L.; Thomas, R. C.; Crooks, R. M. J. Am. Chem. Soc. 1991,113, 8550-8552.
23) Kim, Y.-T.; McCarley, R. L.; Bard, A. J. J. Phys. Chem. 1992, 96, 7416-7421.
24) Hill, W.; Wehling, B. / Phys. Chem. 1993, 97, 9451-9455.
127
25) Bryant, M. A.; Crooks, R. M. Langmuir 1993, 9, 385-387.
26) Kajiya, Y.; Okamoto, T.; Yoneyama, H. Chem. Lett. 1993,2107-2110.
27) Sabatini, E.; Redondo, A.; Rishpon, J.; Rudge, A.; Rubinstein, I.; Gottesfeld, S. J. Chem.
Soc. Faraday Trans. 1993, 89, 287-294.
28) Hayes, W. A.; Shannon, C. Langmuir 1996,12, 3688-3694.
29) Katz, E.; Lion-Dagan, M.; Willner, 1. J. Electroanal. Chem. 1996, 408,107-112.
30) Osawa, M.; Matsuda, N.; Toshii, K.; Uchida, I. J. Phys. Chem. 1994,98, 12702-12707.
31) Vaidya, B.; Porter, M. D., Unpublished results.
32) Allen, P. M.; Hill, H. A. 0.; Walton, N. J. J. Electroanal. Chem. 1984,178, 69-86.
33) Stole, S. M.; Porter, M. D. Appl. Spectrosc. 1990, 44, 1418-1420.
34) Walczak, M. M.; Chung, C.; Stole, S. M.; Widrig, C. A.; Porter, M. D. J. Am. Chem.
Soc. 1991,113, 2370-2378.
35) Porter, M. D.AnaL Chem. 1988, 60, 1143A-1149A.
36) Silverstein, R. M.; Bassler, G. C.; Morrill, T. C. Spectrometric Identification of Organic
Compounds-, 4th ed.; John Wiley and Sons: New York, 1981.

128
CHAPTER 6. GENERAL CONCLUSIONS
The selectivity of a method in chemical analysis usually depends on a host of intricate
interactions and equilibria between the analyte, reagent, solvent and other species present in
the system. The interaction(s) can range, for example, from simple electrostatic attraction or
repulsion to hydrophobic/hydrophilic, acid-base, or electron donor-acceptor interactions.
These interactions depend heavily on the nature and the physical state of each of the species
present in the system, as well as on the relative and/or absolute amount of each of the species.
The selectivity of a method of chemical analysis can usually be enhanced by optimizing the
parameters that govern the equilibria of the system.
The feasibility for the improvement of different methods of chemical analysis by
manipulation of molecular structure, medium, phase and surface functionality and orientation
of the molecules adsorbed on a surface has been investigated. Chapter 2 has demonstrated a
remarkable enhancement in selectivity in the binding of divalent metal cations using two
novel crown ether compounds. The incorporation of benzo groups in the ring structure
reduced basicity of the ring oxygen and enhanced rigidity of the crown ether ring; as a result,
the two novel crown compounds CCE and FCE exhibited an unprecedented selectivity in the
binding of Hg(II) over a host of other divalent metal cations. Other desirable modifications
on the crown ethers would be to attach a thiol, silane, or amine tether so that the crown ether
could be attached to a metal, glass or carbon surface and be used as a sensor for the
continuous monitoring of Hg(II).

129
Methods of chemical analysis can also be improved by the elimination of phase
boundary, as exists between an aqueous and an organic phase, by introducing a micellar
phase. Different types of micelles can be used to solubilize compounds that are otherwise
insoluble in water to facilitate the determination of various analytes. In particular, two phase
extractions are often tedious and the use of micellar strategies have been shown to reduce
processing time. However, introduction of such a pseudo-phase can change, for better or
worse, the reactivity and selectivity of the reagent. For example, as described in Chapter 3,
the high selectivity of CCE for Hg(II) in a two phase extraction was ahnost fully attenuated
upon solubilization in the mixed micelle.
Use of micellar solution with fluorogenic crown ether could result in an increase in
fluorescence intensity as a result of the adsorption of the fluorophores on the micelles. In
addition a zwitterionic surfactant may show more interesting changes in metal ion binding
and spectral properties. Entrapment of the crown ethers using sol-gel material on an optical
probe is another possibility that solves the solubility problem and conserves the reagent, and
may be more suitable for continuous monitoring applications.
An improvement in a method of chemical analysis by removal of an interferrent into a
different phase has been demonstrated in Chapter 4. In the method developed for the
chloride removal for COD determinations, chloride ion is removed as HCl gas. HCl gas is
then captured by a bismuth-based adsorbent, eliminating the use of a toxic mercury salt.
The last chapter examined fundamental issues in the control of the architecture of
model sxirfaces to gain insight into the factors that can be explored for the construction of

130
ordered multilayer films. These studies may have value in guiding the design of architectures
for molecular recognition purposes. ATP forms an ordered monolayer on gold with an
average orientation of the aromatic ring along the surface normal and can be protonated or
deprotonated by varying the pH of die contacting solution. Anthraquinone mono- and
disulfonates can be electrostatically attached to the protonated ATP monolayer on gold. The
orientation of the adsorbed anthraquinone mono- or disiilfonate is largely directed by the
anionic sulfonate group that binds to the smface bound ammonixrai group. The orientation of
each of the four anthraquinone sulfonates studied have been determined from their respective
infrared spectra. Ongoing studies should build on these results, serving as a basis of guiding
principles for control of surface architectures in three dimensions.

131
APPENDIX. THE ROLE OF CHEmCALLY MODIFIED SURFACES IN THE
CONSTRUCTION OF MINIATURIZED ANALYTICAL INSTRUMENTATION
A paper presented at 23rd International Conference on Environmental Systemst
Marc D. Porter, Shelley J. Coldiron and Bikas Vaidya
ABSTRACT
This paper describes the development of a thin-firm optical sensor for measuring pH.
The indicator behaves as a polyprotic acid with differing optical properties in each of its
chemical fomis. Together, these properties facihtate the development of an internally
calibrated sensor by calculating the ratios of the absorption maximas for each form of the
indicator. The covalent immobilization procedure developed demonstrated long term
stability of 4 months without recalibration.
INTRODUCTION
The development of reversible multicomponent optical sensors remains a significant
challenge.Current optical pH sensor technology is hampered by the inaccuracies
resulting from variations in ionic strength.^' Also, since most of the sensor materials are
constructed from an impermeable thin film of an organic polymer, response times can be as
long as 10 minutes. Such long times are not suitable for real-time monitoring. This decreases
the operating efficiency of personnel through lengthy uistrumental operation procedures.
t Reprinted with permission of SAE Technical Paper Series, 1993, 932207. Copyright 1993 Society of Automotive Engineers, Inc.

132
In earlier work, we addressed these problems though the development of a highly
selective pH sensor (pH range 0-4.5) with a response time of <2 sec.^^ The sensor was
constructed by immobilizing Congo Red at a base-hydrolyzed cellulose acetate film. The
rapid response results from the porous structure of the hydrolyzed polymeric support which
minimizes barriers to mass transport between the analyte and iromobilized indicator.
We identified other indicators for expanding the capabiUties of our sensors. Brilliant
Yellow, with an optical transition occurring between pH 6 to 8 in solution, was the first
indicator investigated. However, upon immobilization, the optical transition occurred at
higher pH values (i.e., -2 pH units). A response shift to higher or lower pH values is an
effect frequently observed as a consequence of immobilization.''* Of the many immobilized
indicators tested, fluoresceinamine demonstrated the most desirable optical transition for pH
with a wide response range of 1 to 10.
Initial indicator attachment techniques with Congo Red utilized non-covalent
adsorption of the dye with the cellulosic film."" However, to increase long term stability of
the sensor, covalent coupling of the indicator with the film is strongly preferred. Several
published techniques, such as coupling of the indicator through cyanuric chloride for
attachment to the film,^^ crosslinking of the dye to the cellulosic film with glutaraldehyde,"'*
oxidizing hydrolyzed cellulose acetate hydroxy groups to aldehyde substituents followed by
amine substitution,^^ and replacing hydrolyzed cellulose acetate hydroxy groups with fosyl
chloride followed by indicator attachment,^® were investigated. However, once immobilized
by these methods, most of the indicators investigated either failed to exhibit an optical

133
response to a change in pH, or the amount of indicator immobilized was too deficient to yield
a significant signal for quantification. Ultimately, epoxy derivitized beads were identified as
an immobilization intermediary for cellulose acetate film inclusion. The following sections
detail research conducted to develop a pH sensing thin-film based upon covalently-bound
fluoresceinamine. The films are used with a miniaturized fiber-optic photometer that was
developed in our laboratory.
EXPERIMENTAL
Epoicy Bead Characteristics: Riedel-deHaen (Hannover, Germany) produces a
polymer carrier (Polymer Carrier VA-Epoxy BIOSYNTH®) for the covalent immobilization
of enzymes. Chemically, it is a copolymer based on vinyl acetate and divinylethylene-urea.
The surface is modified with oxirane groups after hydrolysis of the acetate groups."' These
epoxide linkages can be utilized to couple various compounds. Fluoresceinamine was
immobilized on the beads through the compound's primary amine with a base catalyzed
reaction (Figure 1). Advantageous properties of the beads include: high structural stability,
chemical stability over a wide pH range, and negligible swelling or shrinking with changing
pH or salt concentration. Particle size ranges from 50-200 jam. The epoxide equivalency for
the beads is 300 ^mol/g.
Immobilization: The epoxide beads were pulverized into a powder to minimize
particle aggregation in solution. Fluoresceinamine was coupled to the pulverized epoxy
beads by adding an excess (1:10 by weight) of indicator to beads. This mixture was

134
Surface
Fluoresceinamine, Isomer I
Base-Catalyzed Immobilization •<
1 M Na2HP04
OH I
Surface
OH H
O-CH2-CH-C I I OHH
OH
Figure 1. Base Catalyzed Immobilization of Fluoresceinamine at Epoxy Bead Surface.
135
immersed in I M Na2HP04 (pH 7.5). The suspension was stirred for 2 h, and excess dye was
removed by washing the beads with 0.1 M Na2HP04.
Fabrication of Sensing Film: The dried immobilized product was dissolved in
cyclohexanone, and cellulose acetate was added to produce a 14% w/v cellulose
acetate/cyclohexanone solution. The suspension was ultrasonicated to further disperse the
crushed, dyed beads within the viscous solution. The cellulosic suspension was cast onto
glass slides and dried at for 70 °C for -24 h. The dried films were then hydrolyzed with 0.1
MKOHfor24 h.
Evaluation of Sensor Response: The spectral attributes of the fluoresceinamine
films were examined with a Hewlett-Packard 8452A Diode Array Spectrophotometer. The
films were secured in a flow through cell (Figure 2) and positioned within the optical path of
the spectrophotometer. The absorbance characteristics of the films were measured at various
pH values.
Reagents: Fluoresceinamine was obtained from Aldrich and used without fiirther
purification. The pH of the solution was controlled by citric acid and disodium phosphate
28 buffers. All solutions were prepared with deionized water.
RESULTS AND DISCUSSION
In an attempt to verify the mode of immobilization shown in Figure 1, infrared (IR)
spectra were taken of the dyed epoxy beads and compared to spectra from unmodified beads
and the reagent dye using a Nicolet 740 Fourier transform infirared spectrometer. The
samples were mixed with KBr and pressed into pellets for absorption measurements.

136
0 BLACK 0 0 BLACK 0
ALUMINUM
^END PLATES"^
0
t 17.5 ftiffl
0
GLASS SLIDE GROOVE •
2.54 cm ^
0
OUTSIDE SURFACE
MIDDLE PLATE
INSIDE SURFACE
SIDE VIEW
PLEXIGLASS
O-RING GROOVE (both sices)
INLET
PORT
9.8 miti
3.3 mm
Figure 2. Flow Through Cells for Examining Absorbance Properties of Thin film Sensors.

137
Theoretically, with immobilization, comparative IR spectra of the dyed beads should
indicate a decrease in relative intensity of the primary amine peak positions and an increase
in relative intensity at the secondary amine peak positions. However, comparative spectra of
the unmodified epoxy beads and the dyed beads were only slightly distinguishable. Efforts
are currently underway to verify the predicted immobilization reaction from the IR data.
The films exhibit both visible and fluorescent spectroscopic transitions with changes
in pH from 1 to 10. The indicator behaves as a triprotic acid with absorption maxima at 440
nm, 464 mn, and 500 nm. This property facilitates the development of an internally
calibrated sensor by allowing the calculation of the ratio of the absorption maxima for each
form of the indicator. Such an approach also compensates for calibration difficulties that
may arise firom preparative variations in the amount of immobilized indicator and for
desorption loss of the mdicator from the film during use.
As can be seen from Figure 3, there are tangential spikes occurring at -485 nm and an
abnormal band occurring at 570-600 nm. For visual simphcity, the plot only depicts the
spectral response at the extremes (pH 1 and 10) and midpoint (pH 7). The anomalies are
collectively attributed to scattering caused by the flow through cell, the beads, and the
cellulosic film (Figiire 4). The fluoresceinamine absorption spectra can be enhanced by
subtracting this background signal (Figure 5). A calibration curve for the fiill pH range of 1-
10 can be constructed by ratioing the peak maxima of 500 nm to 464 nm. The curve can be
described by a fifth order polynomial, Y = 6.8448 x 10'^ +1.0095X - 3.8337 x 10"' +
6.4700 x 10"^-4.8200 x 10'^X^+ 1.3000 x 10"^X^ (see Figure 6).

pi I 1.0 pi I 7.0 pH 10.0 0.250 T
0.200 -
UJ
^ 0.150 •
ca a: O S 0.100 --<
0.050 -
0.000
450 350 400 500 550 600
WAVELENGTH (nin)
Figure 3. Absorlumce Spectra of Immobilized Fluoresceinumine.
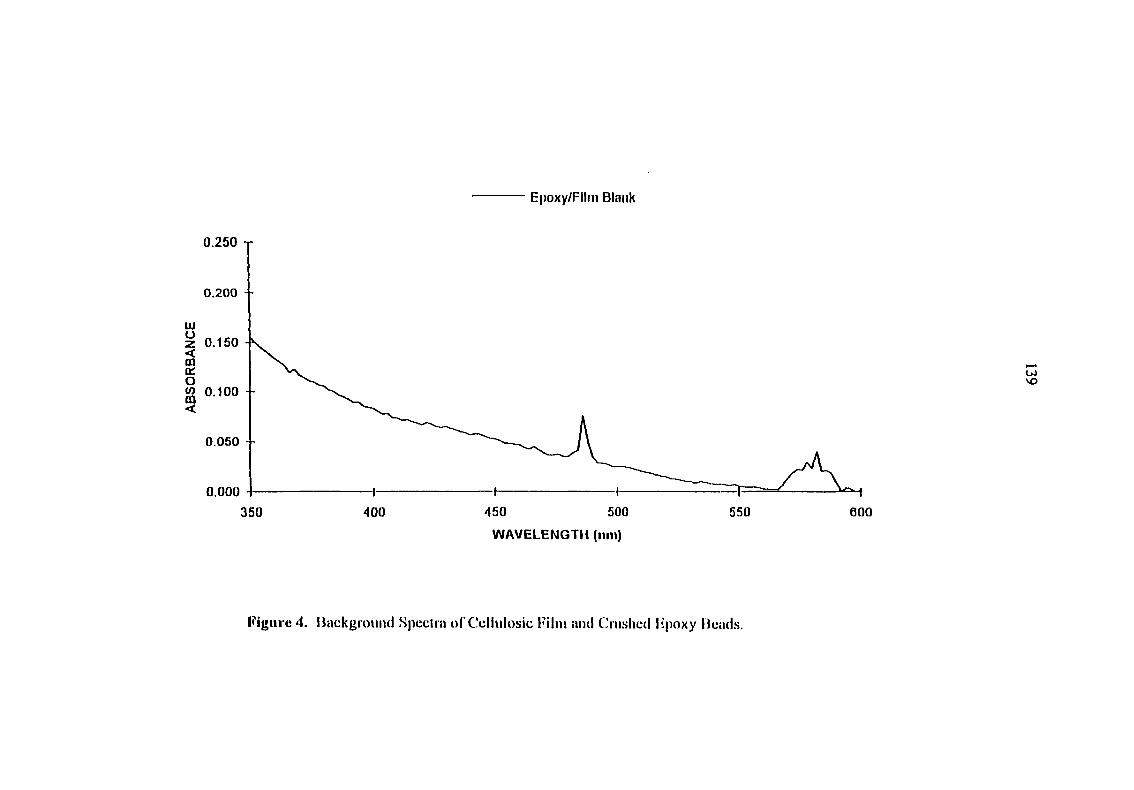
Epoxy/Flirn Blank
0.250 T
0.200 -
0.150 -
(0 0.100 --
0.050 --
0.000
450 400 500 550 350 600
WAVELENGTH (niii)
Figure 4. liackgrouiul Spectra ofCellulosic ImIiu ami Cnisheil lipoxy IJcacLs.

pH 1.0 pH 7.0 — pH 10.0
0.250 T
0.200
lU Z 0.150 -< ta a: O <n 0.100 -(U <
•*" s
0.050
0.000 -I
600 350 450 500 550
WAVELENGTH (nm)
Figure 5. Background Sublrncled Spcclra of immobilized Fluoresceinnmine.

1.80
1.40
1.20
ID > 0.00
0.40
0.20
0.00
5.0 7.0 11.0 1.0 3.0 9.0
pll
Figure 6. Calibration Curve of Immobilized Fluoresceinarniiie.

142
The normal pH range of human blood is 7.35 - 7.45.^' Any compromise of the
buffering capacity of the blood can lead to physiological problems and eventually death.
Therefore, a resolution of at least 0.05 pH is imperative in monitoring blood pH. To assess
the resolution of the thin -fihn sensor for this application, the spectral profile of the fibn was
obtained for buffers from 6.6 to 8.0; this encompasses the extreme values for human blood.^°
The buffers were measured at 0.2 intervals. Statistical evaluation of the data yields a pH
resolution of ± 0.03 units.
The long-term stability of the immobilized indicator was investigated. Two films
were prepared similarly, one dyed and the other undyed (for background correction), and
secured in separate flow through cells. Over a four month period, the fihns were subjected to
deionized water, a variety of buffers, and various states of hydration. A calibration of the
most sensitive, linear range of the film was constructed at the start and end of the trial period.
From Figure 7, it can be seen that the largest variation in calculated values corresponded to
-0.1 pH. Therefore, it can be inferred that the films maintain calibration to within 0.1 pH
over a 4 month period. Extended stability studies are being conducted.
The epoxy beads lend strength and durability to the films. Previous films prepared by
adsorption of Congo Red at cellulose acetate produced very fragile films that were difficult to
handle. However, the epoxy beads limit the minimum thickness of the fihns. The films
prepared by using the beads as an immobilization intermediary are typically 40-90 |im in
thickness, whereas the single component cellulose acetate films were, ~ 2 |am thick."" The

3.00 T
2.60
E c 3 2.20 <
o 1.80 o •o <
1.40
-•— 11/9/92
1.00
6.00 6.20 6.40 6.60 6.80
—«—
7.00
PH
Figure 7. Four Month Fihii Stability Calibration.
3/1/93
OJ
-I- -J.
7.20 7.40 7.60 7.00 8.00

144
thicker films respond slower, 40-60 sec, to changes in pH than the thirmer Congo Red
films, < 2 sec.
We are continuing experiments to modify the hydrolyzed cellulose acetate films for
direct covalent immobilization of fluoresceinamine. For commercialization, the structural
durability of the bead inclusion is desirable for ease of manufacture and handling of the films.
We anticipate that with the development of a direct immobilization procedure, we will
integrate opaque microscopic, polymeric beads in the film to maintain mechanical dunbility
with improved response times.
The large dynamic range and ease of fabrication make this pH sensor fihn attractive
in producing prototype instruments for commercialized sensor.^' The immobilization
technique described in this paper could be applied to the development of other sensor films.
We are currently examining the extension of this research to the fabrication of sensors for
quantifying other ions.
ACKNOWLEDGMENTS
The authors would like to expresses appreciation for the support of a NASA / Iowa
Space Grant Fellowship given to Shelley Coldiron through the College Consortium under the
NASA Space Grant Program. Also, this work was supported in part by the Center for
Advanced Technology Development at Iowa State University under USDOC Grant ITA 87-
02, by the Office of Basic Energy Research-Chemical Sciences Division of USDOE, and by
the Advanced Life Support Division of the NASA-JPL (Contract No. 959452). Ames

145
Laboratory is operated for the U. S. Department of Energy by Iowa State University under
Contract No. W-7405-Eng-82.
REFERENCES
1. J. I. Peterson and G. G. Vurek, Science 224, 123 (1984).
2. W. R. Seitz, Anal. Chem. 56,16a (1984).
3. H. WohlQ'en, yi/ia/. Chem. 56, 87a (1984).
4. T. Hirschfeld, J. B. Callis, and B. R. Kowalski, Science 226, 312 (1984).
5. R. Narayanaswamy, Anal. Proc. (London) 22, 204 (1985).
6. O. S. Wolfbeis, Fresenius' Z. Anal. Chem. 325, 387 (1986).
7. J. F. Alder, Fresenius' Z. Anal. Chem. 324 372 (1986).
8. D. M. Jordan, D. R. Walt, and F. P. Milanovich, Anal. Chem. 59, 437 (1987).
9. J. B. Callis, D. L. Illman, and B. R. Kowalski, Anal. Chem. 59, 624A (1987).
10. S. M. Angel, Spectroscopy (Springfield, Oregon) 2, 38 (1987).
11. 0. S. Wolfbeis, Anal. Proc. (London) 24, 14 (1987).
12. J. Janata and A. Bezegh, Anal. Chem. 60, 62R (1988).
13. S. Luo and D. R. Walt, Anal. Chem. 61,174 (1989).
14. S. M. Stole, T. P. Jones, L. K. Chau, and M. D. Porter, in Chemical Sensors and
Microinstrumentation, R. W. Murray, R. E. Dessy, W. R. Heineman, J. Janata, W. R.
Seitz, Eds., ACS Symposium Series 403 (American Chemical Society, Washington,
D.C., 1989), Chap. 19.

146
15. J. P. Dakin, in Optical Fiber Sensors, H. J. Arditty, J. P. Dakin, and R. Th. Kersten, Eds.,
Springer Proceeding in Physics 44, 186 (1989).
16. H. He, H. Li, G Mohr, B. Kovacs, T. Werner, and 0. S. Wolfbeis, Anal. Chem. 65, 123
(1993).
17. R. B. Thompson and E. R. Jones, Anal. Chem. 65, 730 (1993).
18. T. L. Blair, T. Cynkowski, and L. G. Bachas, Anal. Chem. 65,945 (1993).
19. J. C. Wells, P. G. Blystone, M. D. Johnson, W. R. Haag, and B. W. Colston, Jr., 3^*^ Int.
Symposium on Field Screening Methods for Hazardous & Toxic Chemicals (Las Vegas,
Nevada), 1 (1993).
20. R. B. Thompson and J. R. Lakowicz, Anal. Chem. 65, 853 (1993).
21. M. E. Collison and M. E. Meyerhoff, Anal. Chem. 62,425A (1990).
22. T. P. Jones and M. D. Porter, Anal. Chem. 60,404 (1988).
23. L. A. Saari, Anal. Chem., 1982, 54, 823-824.
24. Z. Zhujim, Y. Zhang, M. Wangbai, R. Russell, Z. M. Shaksher, C. L. Grant, and W. R.
Seitz, Anal. Chem. 61, 202 (1989).
25. R. Sternberg, D. S. Bindra, G. S. Wilson, and D. R. Thevenot, Anal. Chem. 60,24, 2782
(1988).
26. Y. Chang, A. Gee, A. Smith, and W. Lake, Bioconjugate Chem. 3, 200 (1992).
27. K. Burg, O. Mauz, S. Noetzel and K. Sauber, Die Angewandte Makromolekulare Chemie
157, 105 (1988).

28. D. D. Perrm, Buffers for pH and Metal Ion Control, Chapman and Hall, New York
(1974).
29. C. Lentner, Geigy Scientific Tables: Physical Chemistry Composition of Blood,
Hematology, Somatometric Data, Vol. 3, Medical Education Division, Ciba-Geigy
Corporation, West Caldwell, New Jersey (1984).
30. E, Goldberger, A Primer of Water, Electrolyte and Acid-Base Syndromes, Lea & Febiger,
Philadelphia, PA, 7"^ Edition (1986).
31. T. P. Jones, S. J. Coldiron, W. J. Deninger, and M. D. Porter, Anal. Chem. 45 1271
(1991).