Embed Size (px)
Citation preview

Coordination Chemistry Reviews200–202 (2000) 901–932
Spectroscopic and mass spectrometric methodsfor the characterisation of metal clusters
Brian F.G. Johnson, J. Scott McIndoe *Department of Chemistry, The Uni6ersity of Cambridge, Lensfield Road, Cambridge, CB2 1EW, UK
Received 13 September 1999; received in revised form 3 January 2000; accepted 26 January 2000
Contents
Abstract. . . . . . . . . . . . . . . . . . . . . . . . . . . . . . . . . . . . . . . . . . . . . . . . . . . . 9021. Introduction . . . . . . . . . . . . . . . . . . . . . . . . . . . . . . . . . . . . . . . . . . . . . . . 9022. Spectroscopic techniques . . . . . . . . . . . . . . . . . . . . . . . . . . . . . . . . . . . . . . . . 902
2.1 Vibrational spectroscopy . . . . . . . . . . . . . . . . . . . . . . . . . . . . . . . . . . . . . 9022.2 NMR spectroscopy . . . . . . . . . . . . . . . . . . . . . . . . . . . . . . . . . . . . . . . . 9042.3 UV–vis spectroscopy . . . . . . . . . . . . . . . . . . . . . . . . . . . . . . . . . . . . . . . 9062.4 Mossbauer effect spectroscopy . . . . . . . . . . . . . . . . . . . . . . . . . . . . . . . . . . 9072.5 EXAFS spectroscopy . . . . . . . . . . . . . . . . . . . . . . . . . . . . . . . . . . . . . . . 9072.6 EPR spectroscopy . . . . . . . . . . . . . . . . . . . . . . . . . . . . . . . . . . . . . . . . . 909
3. Mass spectrometric techniques . . . . . . . . . . . . . . . . . . . . . . . . . . . . . . . . . . . . . 9103.1 Electron impact ionisation . . . . . . . . . . . . . . . . . . . . . . . . . . . . . . . . . . . . 9113.2 Inductively coupled plasma ionisation . . . . . . . . . . . . . . . . . . . . . . . . . . . . . 9133.3 Field desorption . . . . . . . . . . . . . . . . . . . . . . . . . . . . . . . . . . . . . . . . . . 9133.4 Plasma desorption . . . . . . . . . . . . . . . . . . . . . . . . . . . . . . . . . . . . . . . . . 9143.5 Fast-atom bombardment . . . . . . . . . . . . . . . . . . . . . . . . . . . . . . . . . . . . . 9153.6 (Matrix assisted) laser desorption ionisation . . . . . . . . . . . . . . . . . . . . . . . . . . 9173.7 Electrospray ionisation . . . . . . . . . . . . . . . . . . . . . . . . . . . . . . . . . . . . . . 920
4. Summary . . . . . . . . . . . . . . . . . . . . . . . . . . . . . . . . . . . . . . . . . . . . . . . . . 927Acknowledgements . . . . . . . . . . . . . . . . . . . . . . . . . . . . . . . . . . . . . . . . . . . . . 928References . . . . . . . . . . . . . . . . . . . . . . . . . . . . . . . . . . . . . . . . . . . . . . . . . . 928
www.elsevier.com/locate/ccr
* Corresponding author. Fax: +44-1223-336362.E-mail address: [email protected] (J.S. McIndoe).
0010-8545/00/$ - see front matter © 2000 Elsevier Science S.A. All rights reserved.PII: S0010-8545(00)00306-4

902 B.F.G. Johnson, J.S. McIndoe / Coordination Chemistry Re6iews 200–202 (2000) 901–932
Abstract
This review covers some of the many spectroscopic and mass spectrometric techniquesused to characterise transition metal clusters. Special attention has been paid to recentadvances in mass spectrometry, which have allowed the study of compounds previouslyinaccessible to this method of characterisation. © 2000 Elsevier Science S.A. All rightsreserved.
Keywords: Clusters; Characterisation; Spectroscopy; Mass Spectrometry.
1. Introduction
There are few areas of synthetic research which have been so dependent on thedevelopment of appropriate techniques of characterisation as cluster chemistry. Theonset of high interest in metallic clusters came at a time when a range of new ormodified techniques began to emerge. Dominant amongst these was more rapidcrystal structure determination by X-ray diffraction, which furnished an effectivemeans of structural analysis of highly complicated systems. Mass spectrometry wasalso applied successfully to the problem of cluster characterisation, and IR spec-troscopy provided much useful information. These developments together withadvances in multinuclear NMR aided the synthetic chemist to such an extent thatthey have become routine. Where appropriate, other spectroscopic techniques, suchas EPR, EXAFS, Mossbauer and UV–vis spectroscopy, have also been utilised bythe cluster chemist for the purposes of obtaining structural or kinetic data. Selectedexamples of the application of each of these spectroscopic techniques to the studyof transition metal clusters are presented in this review.
The range of mass spectrometric methods now available to the cluster chemist ispresented in more detail. Until moderately recent times mass spectrometric analysiswas limited to those compounds which were neutral and highly volatile. This is nolonger the case, and in this article we review the wide variety of ionisation methodsnow available and assess their usefulness in a wide range of charged and neutralcluster species.
2. Spectroscopic techniques
2.1. Vibrational spectroscopy
Infrared spectroscopy was one of the first instrumental techniques to be applied(being one of only a few available) to the study of transition metal carbonylclusters. It is still a standard means of identifying carbonyl cluster compoundstoday, thanks to the speed and sensitivity of the technique. The CO stretchingregion typically exhibits strong bands in a region (�2150–1600 cm−1) largely freeof absorptions from other functional groups, and samples may be conveniently

903B.F.G. Johnson, J.S. McIndoe / Coordination Chemistry Re6iews 200–202 (2000) 901–932
analysed as solutions. However, a characteristic of the vibrational spectra ofcarbonyl clusters is that they show many less bands than expected by group theoryand therefore it is very difficult to draw firm conclusions about the structure orsymmetry of the cluster based on IR evidence alone. An example of this spectralsimplicity is shown in Fig. 1, the IR spectrum for [FeIr5(CO)15]3−.
The reasons for the simplicity of the IR spectrum has been a subject of debateand continues to draw interest [1]. For clusters, the fundamental question remains:when do the ‘molecular surface selection rules’ break down and the ‘surfaceselection rules’ take over? A recent analysis of a wide range of published transitionmetal cluster infrared spectra have led to the generalisation that most clusters canbe treated by a spherical harmonic model that predicts a single peak in the terminaln(CO) region [2]. More detailed spectral analyses of clusters have also been carriedout-qualitative arguments were used to obtain spectral assignment of the n(CO)vibrational (infrared and Raman) spectra of the cluster Ru3(CO)9(m3-h2:h2:h2-C6H6) [3], and confirmed by a normal coordinate analysis using the accurate forcefield available for Ru3(CO)12 [4]. It has been suggested that the bridging spectralregion is more structure-sensitive than the terminal region [5,6]. For example, theterminal n(CO) regions of the isostructural clusters Ir6(CO)16, [FeIr5(CO)16]− and[Fe2Ir4(CO)16]2− are very similar, yet their bridging n(CO) regions show consider-able variation [7]. Some studies of the vibrational spectra of clusters have looked atother ligands, such as hydrides [8], interstitial atoms [9] or even the metal core [10],
Fig. 1. The infrared spectrum (THF solution) of [FeIr5(CO)15]3− (the diagram of the structure showsonly the bridging COs (open circles); the terminal COs, two on each metal atom, are omitted for clarity.Reprinted with permission from Ref. [7].

904 B.F.G. Johnson, J.S. McIndoe / Coordination Chemistry Re6iews 200–202 (2000) 901–932
but such investigations do not represent a routine means of characterisation.Infrared spectroelectrochemistry has been employed to study the reactivity ofclusters, for example in examining the redox behaviour of Ru6C(CO)17 and[NBu4]2[Ru6C(CO)16] [11].
An advance in IR spectroscopy with implications for cluster chemistry is thedevelopment of fibre-optic probes for in situ measurement of IR spectra during areaction. This approach has been used to monitor reactions at elevated temperature[12] and inside electrochemical cells [13].
2.2. NMR spectroscopy
Modern nuclear magnetic resonance (NMR) spectroscopic techniques allowstraightforward acquisition of spectra for many elements important in clusterchemistry including 1H, 11B, 13C, 15N, 19F, 29Si, 31P, 103Rh, 117Sn and 195Pt. Mostother nuclei are more difficult to study, but with effort can yield useful spectra.NMR provides crucial insight into the nature of the coordination sphere of themetal, stereochemistry and metal–ligand bonding [14].
1H- and 13C-NMR spectroscopy was applied to organometallic clusters early on,and it was shown that they display a high degree of fluxionality [15,16]. The variouscoordination modes of carbonyl ligands on clusters can be differentiated using13C-NMR by virtue of their characteristic chemical shifts [17], the terminal ligand13C nucleus being more shielded [18]. Separate 13C-NMR signals are observed forinequivalent CO ligands when the molecule is not fluxional on the NMR time scale.1H-NMR spectroscopy is most useful when studying clusters with hydride ligands,as their location can not always be pinpointed or even inferred from the X-raycrystal structure. For example, the presence of twelve hydrido atoms in thehigh-nuclearity cluster H12Pd28(PtPMe3)(PtPPh3)12(CO)27 was revealed from the1H-NMR spectrum [19]. Terminal m2 and m3-hydrides generally have high-fieldsignals due to the fact they are heavily shielded — the range is typically d −8 to−30. Interstitial hydrides appear over an even greater range. Spin–spin couplingbetween other spin 1/2 nuclei such as 31P, 103Rh or 187Os [20] can give spectra thatenable the location of the hydride ligand on the cluster to be determined. Variabletemperature NMR studies have proved to be very useful in studying the movementof hydrides and carbonyls around the metal core as well as for structural identifica-tion [21]. The mobility of ligands other than CO and H has also been examined.Fig. 2 shows the variable temperature 1H-NMR spectrum of Os3(CO)8(h2-CH2CH2)(m3-h2:h2:h2-C6H6), in which the alkene and benzene ligands were inter-preted as undergoing ‘helicopter-like’ intramolecular rearrangements [22].
31P-NMR spectroscopy is also extremely useful in cluster chemistry, as phospho-rus ligands are commonplace. As well as assessing the number and type of ligands,coupling to NMR-active metal nuclei can provide further information on theenvironment of the phosphorus ligand. For example, the structure of the mixed-metal cluster Pt2Rh2(CO)7(PPh3)3 was established by the application of variousmultinuclear NMR techniques (13C, 31P, {31P–31P} COSY and {13C–103Rh} and{31P–103Rh} heteronuclear multiple quantum coherence, HMQC) [23]. The metal

905B.F.G. Johnson, J.S. McIndoe / Coordination Chemistry Re6iews 200–202 (2000) 901–932
Fig. 2. The variable temperature 1H-NMR spectrum of Os3(CO)8(h2-CH2CH2)(m3-h2:h2:h2-C6H6).Reprinted with permission from Ref. [22]. Copyright 1992 American Chemical Society.
core of [Rh9P(CO)21]2− was shown to be fluxional by 31P-NMR, as the highlydeshielded interstitial phosphorus atom produces a pattern that involves couplingof the phosphorus atom to nine equivalent rhodium atoms [24]. Upon cooling thepattern becomes more complex, indicating that the fluxionality has ceased on thetime scale of the experiment.
Transition metal NMR spectroscopy has been used for some time to probe themetal core of clusters, with interesting results. For example, early studies of the195Pt-NMR spectra of [Ptn(CO)2n ]2− (n=3, 6, 9, 12, 15) showed that not only dothe Pt3 triangles rotate with respect to one another at room temperature, inter-change of Pt3 triangles between clusters can also occur [25,26]. In recent yearstransition metal NMR spectroscopy has been boosted significantly by instrumentalimprovements, high-sensitivity detection methods and the availability of betterdatabases of information on multinuclear NMR. While the very large chemical shiftranges of many transition metal nuclei can mean that finding the right signal isdifficult, this property also means higher sensitivity to subtle structural perturba-tions. In addition to spin 1
2 nuclei such as 57Fe, 103Rh and 187Os, quadrupolar nucleiincluding 51V, 53Cr, 55Mn, 59Co and 91Zr have also been studied [27]. Variabletemperature multinuclear NMR has also been used successfully to probe thestructure of transition metal carbonyl clusters [28].

906 B.F.G. Johnson, J.S. McIndoe / Coordination Chemistry Re6iews 200–202 (2000) 901–932
The development of new NMR techniques has enabled the collection of high-reso-lution NMR spectra on solids [29]. One such technique is magic angle spinning(MAS), where the sample is spun at high speed at a particular angle with respect tothe field axis. Compounds with 1H, 13C, 31P and 29Si and other nuclei have been stud-ied in the solid state using this and other related techniques [30]. Examples of the util-ity of the technique include the examination of the solid state reactions of H2Os3-(CO)10 with gaseous reactants (NH3, CO, H2S) [31], studying the stereochemical non-rigidity of m3-arene/olefin triosmium complexes in the solid state [32], the applicationof 31P and 59Co-NMR to the study of the structure and dynamics of the tetrahedralmixed-metal cluster HFeCo3(CO)9[P(OCH3)3]3 [33], or the location of hydride ligandson (NMe4)4−x [HxNi12(CO)21] (x=1, 2) [34]. Solid-state NMR spectroscopy has pro-vided evidence for the libration of the Co4 metal core inside the icosahedral carbonylligand shell of Co4(CO)12 [35], in keeping with the ligand polyhedral model.
2.3. UV–6is spectroscopy
UV–vis data is only seldom collected for metal cluster compounds and even lessoften discussed, despite the fact that clusters are often very intensely coloured andgive strong, distinctive UV–vis spectra. The structural information provided by thetechnique is limited, though intense colours can be indicative of high nuclearity clus-ters as the HOMO/LUMO gap is smaller than in low nuclearity clusters. UV–visspectroscopy is most often used in cluster chemistry as a means of monitoring reac-tions to determine kinetics, such as following the substitution of CO ligands by PMe3
on the tricobalt cluster Co3(CO)6[m2-h2:h1-C(Ph)C=C(PPh2)C(O)OC(O)](m2-PPh2)[36]. UV–vis spectroscopy is also useful in providing a match between species in solu-tion and those absorbed onto a surface, for example the adsorption of [HRuOs3-(CO)13]− onto alumina [37], or the adsorption of clusters into zeolite pores [38]. UV–vis spectroelectrochemistry has been used to monitor structural changes in the high
Fig. 3. The changes observed in the UV-Visible spectrum of [PPh4][HRu10C(CO)24] upon exhaustivereduction. Reprinted with permission from Ref. [40].

907B.F.G. Johnson, J.S. McIndoe / Coordination Chemistry Re6iews 200–202 (2000) 901–932
nuclearity clusters [HxRu10C(CO)24](2−x)− (x=0, 1) [39]. Fig. 3 shows the changes inthe UV-Visible spectrum of [PPh4][HRu10C(CO)24] upon exhaustive reduction.
In conjunction with voltammetric studies, the changes in the UV spectrum were in-terpreted as representing a significant structural change (CO elimination was disre-garded as a possibility because the reaction was reversible), most likely the cleavageof an apical Ru�Ru bond.
2.4. Mossbauer effect spectroscopy
Mossbauer effect spectroscopy (MES) involves the nuclear resonance absorption(fluorescence) of g-rays. In systems that contain Mossbauer atoms (�15–20 ele-ments, for practical purposes) as central atoms, MES shows directly whether theseatoms are situated in identical or different bonding states and environments [40]. Thisproperty was used to help show errors in the first X-ray structural examination of thecluster Fe3(CO)12 by showing that the iron atoms were not in fact equivalent [41]. Thetechnique is equally applicable to larger clusters and has been used to examine the(controversial) gold compound Au55(PPh3)12Cl6 to show that it has four unique goldatom environments (Fig. 4) [42].
MES can also be used to determine the site of substitution in heteropolynuclearcompounds, such as showing that in the compounds FeCo2S(CO)9−n(PPh3)n (n=1,2) it is the cobalt atoms to which the phosphines coordinate preferentially [43]. Thegreat advantage of MES is that amorphous samples can be studied. However, MESis necessarily limited to those clusters containing Mossbauer atoms and is not a rou-tine technique largely for this reason. The technique is especially useful for iron clus-ters [44], as the 57Fe nucleus is particularly sensitive. Tin and gold also possesssuitable nuclei for study by MES.
2.5. EXAFS spectroscopy
Extended X-ray absorption fine structure (EXAFS) spectroscopy is an analyticaltechnique, which provides structural information about molecules in any physical
Fig. 4. The Mossbauer effect spectrum of Au55(PPh3)12Cl6. Reprinted with permission from Ref. [43].

908 B.F.G. Johnson, J.S. McIndoe / Coordination Chemistry Re6iews 200–202 (2000) 901–932
state (including solutions and amorphous solids). Atoms absorb X-rays, and at acertain energy specific to each element an electron is ejected (ionisation). At thispoint an absorption edge appears in the EXAFS spectrum. The ejected electrontravels out from the central absorbing atom, and back-scattering of this emittedelectron wave off neighbouring atoms causes oscillations in the absorption coeffi-cient near the edge. By analysing the frequency and amplitude of the oscillations,information about the local environment of the absorbing element can be derived.The primary limitations of EXAFS are the requirement for a synchrotron sourcefor the X-radiation, and the fact that the information extracted from the EXAFSdata is not easily converted into unambiguous three-dimensional structures.
The use of EXAFS for the characterisation of cluster species has been mostpopular for the study of catalytic materials generated by mounting clusters onvarious surfaces [45]. Clusters have been anchored inside zeolites [46], and thecatalytic species is often formed by decarbonylation [47] or hydrogenation [48]. Theassembly of large clusters from smaller precursors inside the zeolite has been carriedout with success and is known as ‘ship-in-bottle’ synthesis [49]. EXAFS has beencombined with XRD to investigate the effects of preparation conditions on the sizeof palladium clusters inside zeolite cavities [50]. Catalytic species have also beengenerated from cluster precursors on other surfaces, such as from PtRu5C(CO)16 oncarbon [51], Rh6(CO)16 on a GeO2/SiO2 monolayer [52], [Pd6Ru6(CO)24]2− inmesoporous silica [53], or Ir4(CO)12 on MgO powder [54], and been successfullystudied using EXAFS.
Less frequently, EXAFS has been used to probe the structure of saturatedclusters, and has shown, for example, the flexibility of the metal core in[Fe4CoC(CO)14]− [55] and the non-rigidity of the metal core in Pd4(CO)4(OAc)4
[56]. EXAFS may also be used to determine whether or not a structure persists inboth solid state and solution. Such a study was carried out on Ru3Pt(m-H)(m3-COMe)(CO)10(PR3) (R=Cy, iPr) [57], and small changes were ascribed to a more
Fig. 5. The observed k3-weighted Pt LIII-edge EXAFS spectra for the rearrangement of Ru3Pt(m-H)(m4-h2-CCtBu)(CO)9(dppe) to Ru3Pt(m4-h2-C=CHtBu)(CO)9(dppe) in THF solution. Measurements weremade at intervals over a 12 h period. Arrows indicate the direction in which features developed.Reprinted with permission from Ref. [59].
909B.F.G. Johnson, J.S. McIndoe / Coordination Chemistry Re6iews 200–202 (2000) 901–932
symmetrical structure being present in solution in the absence of packing effectsthat distort metal-metal distances in the solid state. In a more detailed study, therearrangement of the spiked triangular cluster Ru3Pt(m-H)(m4-h2-CCtBu)(CO)9-(dppe) in solution to the butterfly cluster Ru3Pt(m4-h2-C=CHtBu)(CO)9(dppe) wasmonitored over a period of 12 hours (Fig. 5) using EXAFS spectroscopy, toprovide both structural and kinetic imaging of the reaction profile [58].
The reaction was shown to be first order, and the rate constant was determinedas 6×10⁻³ min−1, a value comparable to that of 3.3×10⁻³ min−1 calculatedfrom solution NMR studies [59].
2.6. EPR spectroscopy
Electron paramagnetic resonance (EPR, alternatively known as electron-spinresonance, ESR) spectroscopy is a complementary technique to NMR, enabling thestudy of paramagnetic compounds [60]. EPR measures the absorption ofelectromagnetic radiation by a paramagnetic system placed in a static magnetic field[61]. It can provide structural information on species in solution, in polycrystallinepowders, and in single crystals. EPR gives information on the environment of theunpaired electron, and can help to decide the extent to which electrons aredelocalised over the ligands.
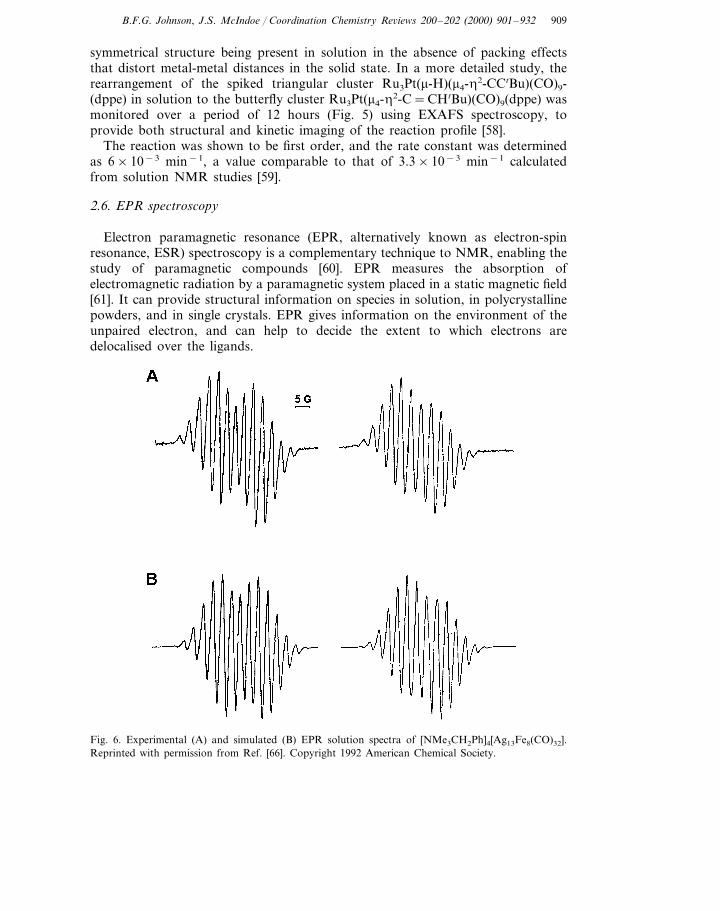
Fig. 6. Experimental (A) and simulated (B) EPR solution spectra of [NMe3CH2Ph]4[Ag13Fe8(CO)32].Reprinted with permission from Ref. [66]. Copyright 1992 American Chemical Society.

910 B.F.G. Johnson, J.S. McIndoe / Coordination Chemistry Re6iews 200–202 (2000) 901–932
Iron–sulfur clusters often display paramagnetism and EPR is a popular means ofstudying such clusters, along with investigations of redox behaviour [62]. EPRmeasurements are frequently collected in conjunction with electrochemical studies[63]. Magnetic moment measurements and EPR have been used to identify unpairedelectrons, such as in [Rh5Ni6(CO)21Hx ]3−; the odd electron was thought to necessi-tate the presence of either one or three hydrido atoms [64]. EPR can also be usedto explain structural features. The EPR spectrum of the paramagnetic[Ag13Fe8(CO)32]4− tetra-anion in solution consists of two almost equally intensedoublets, each split further into thirteen lines (Fig. 6(A)) [65].
The computer simulated spectrum matches perfectly (Fig. 6(B)), and the patternindicates that the unpaired electron is strongly coupled to a central silver atom andloosely coupled to 12 peripheral silvers. This assignment was confirmed by theX-ray crystal structure, which showed a central Ag13 cuboctahedron. Overall, thecluster was suggested to have nine more electrons than that explained by mostelectron counting schemes. However, by considering the structure as an outer Fe8
macrocube and an inner Ag12 cubeoctahedron encapsulating a neutral paramag-netic silver atom, the electron count is explicable [66].
3. Mass spectrometric techniques
The study of metal carbonyls by mass spectrometry has a long history. Thomson,the inventor of mass spectrometry [67], attempted to obtain a mass spectrum ofNi(CO)4 but the electric discharge he used to generate the ions caused the sampleto decompose [68]. Later, Ni, Fe, Cr, Mo and W carbonyls were studied withexcellent results (principally in efforts to determine the isotopic abundances of themetals). The first polynuclear metal carbonyl, Mn2(CO)10, was examined by massspectrometry over 50 years ago [69]. The highest mass ion observed was Mn2(CO)7
+,but the authors pointed out (correctly) that the molecular weight may be greater asthe parent-molecule ions are not always seen in a mass spectrum, remarkable sincethe electron counting methods familiar to us today were not known at that time.
Despite the development of cluster chemistry in the 1960s, study of polynuclearcarbonyl clusters by mass spectrometry was not a routine technique. Instrumentoperators, used to dealing with organic compounds only, were often suspicious thatdecomposition of clusters in the machine would lead to their machines beingdamaged or ruined by metal deposits. However, these fears proved largely un-founded and early experiments on simple binary carbonyl clusters [70,71] were soonfollowed by studies of larger clusters [72]. Despite difficulties with carbonyl hydrideclusters due to complications arising from the loss of both H and CO groups [73],mass spectrometry was shown to be a useful tool for elucidating the correctstoichiometry of such compounds (transition metals often possess a characteristicisotope pattern, which may be used to easily decipher the number of metals in anion) [74]. An advantage in the study of neutral metal carbonyl clusters is their

911B.F.G. Johnson, J.S. McIndoe / Coordination Chemistry Re6iews 200–202 (2000) 901–932
reasonably high volatility. The high vacuum and raised temperature used inconventional mass spectrometry did not preclude the study of the more robustspecies. However, substituted, thermally sensitive and charged clusters, with orwithout carbonyl ligands, remained inaccessible to mass spectrometry due to lack ofvolatility or decomposition.
Analysis by mass spectrometry requires compounds to be in the gas phase, andthe development of mass spectrometry is as much a story of generating gas-phaseions as it is of separating the ions by their mass-to-charge (m/z) ratio [75]. Manycompounds cannot be vaporised without considerable, adverse decomposition, andthese include the majority of cluster compounds. The techniques applied to volatilespecies are not always useful as they require stable, gas phase molecules. A greatamount of effort was directed towards the problem of propelling involatile speciesinto the gas phase and a number of solutions have been devised to extend theusefulness of mass spectrometry to the analysis of large, complex and fragilemolecules.
3.1. Electron impact ionisation
Volatile compounds can be introduced into a mass spectrometer very easily, viainlets that allow the sample to ‘leak’ into the machine (these include the very wellknown gas chromatographic inlets). Compounds insufficiently volatile to be intro-duced by these methods can be inserted straight into the ion source using a directprobe inlet, passing through a vacuum lock. With heating and at high vacuum, goodmass spectra of many relatively involatile compounds may be obtained. Oncepropelled into the gas phase, various means have been developed to ionise theneutral molecules to make them amenable to separation.
The classic ionisation technique is by means of electron impact (EI). Electrons areemitted from a resistively heated filament and accelerated through a voltage drop,typically 70 V. Because most covalent molecules have ionisation potentials ofaround 10 eV, an incident electron with a kinetic energy of 70 eV will dislodge anelectron from one of the higher energy molecular orbitals. Molecular ions (M+�) areproduced with varying internal energies, causing decomposition of those in higherenergy states to break apart into fragment ions. Ionisation can also be achieved withhigh-energy photons in photo ionisation (PhI), with electronically excited neutralspecies as in Penning ionisation (PeI), or with reactant gas ions as in chemicalionisation (CI) [76,77]. However, the utility of such sources for the mass spectrome-try of cluster species is limited as they share the same limitation as EI in that thesamples need to be volatile.
EI ionisation is quite effective for volatile clusters that are reasonably thermallystable, and has been used for some time. For example, excellent spectra of osmiumclusters as large as Os8C(CO)21 were obtained using EIMS some 25 years ago [78].These spectra correctly identified the number of carbonyl ligands. For these largeclusters elemental analysis and spectroscopic methods provided very little usefulinformation, so the ability of mass spectrometry to establish the molecular formula

912 B.F.G. Johnson, J.S. McIndoe / Coordination Chemistry Re6iews 200–202 (2000) 901–932
was crucial. Furthermore, mass spectrometry allowed the successful identificationof interstitial carbide atoms.
The very low operating pressures of FTICR instruments (10−7–10−8 torr) [79]allow the study of even less volatile or thermally unstable compounds. For example,the molecular formulae of the triosmium methylidene clusters H3Os3(CO)9(CX)(X=Cl, Br, Ph) were established using EI-FTICR/MS, and the sequential loss ofnine carbonyl groups further confirmed the assignment [80]. Likewise, useful massspectra of the cluster H2RhOs3(CO)10(h5-C5H5) could not be obtained as a probesample on a conventional instrument, because raising the probe temperature to givesufficient vapour pressure for the observation of high-mass peaks resulted inpyrolytic fragmentation [81]. However, the lower pressure of the FTICR instrumentallowed excellent spectra of this compound to be obtained. The use of FTICRinstruments also has the great advantage of extremely high resolution, providingunambiguous spectra of exceptional quality.
EI-FTICR mass spectrometry was used to unambiguously identify Pt4(PF3)8 asthe pyrolysis product generated from heating Pt(PF3)4 to temperatures below thatrequired for metal deposition [82]. For this unusual cluster, NMR spectroscopy (19Fand 31P) provided little information as the PF3 groups were shown to be equivalent,but whether this feature was due to tetrahedral symmetry or to fluxional behaviourwas unclear. No signal could be obtained using 195Pt-NMR. Crystals failed to yielddiffraction spots, and it was suggested that this may have been due to extensivemotion of the molecule due to the fluorine atoms on the periphery. However,low-temperature studies also failed to resolve the problem.
Experiments using electron impact ionisation in conjunction with FTICR havebeen carried out to probe ion-molecule reactions of clusters. The ionised cluster isintroduced to the ion chamber in the gas phase, in the presence of excess neutral
Fig. 7. The EI-FTICR mass spectrum of the parent ion region of H2Os3(CO)10. Reprinted withpermission from Ref. [85]. Copyright 1988 American Chemical Society.

913B.F.G. Johnson, J.S. McIndoe / Coordination Chemistry Re6iews 200–202 (2000) 901–932
cluster. Because the ions may be trapped for a significant period of time (up to 10s), ion–molecule reactions may be monitored. Cluster species as large as[Mn8(CO)25]+ from Mn2(CO)10 and [Re3Mn3(CO)19]+ from ReMn(CO)10 have beenobserved to form [83], and in similar experiments on H2Os3(CO)10, self-reaction viagas-phase ion–molecule reactions has been found to produce clusters containing upto 15 osmium atoms upon extended (]0.5 s) trapping [84]. Fig. 7 shows the parention region of H2Os3(CO)10, and gives an indication of the excellent quality of thespectra that can be obtained using this technique
Negative-ion mode electron impact ionisation mass spectra of the clustersYCCo3(CO)9 (Y=H, CH3, C6H5, C6H4F, CO2CH3, F, Cl) have been obtained [85].The molecular anions [YCCo3(CO)9]− were found to be unstable and instead thefragment ions [YCCo3(CO)n ]− were observed, formed by electron capture andsubsequent CO loss to form the fragment ions. The gas phase chemistry of thesefragments was studied using FTICRMS, by allowing the anions to react with theirneutral precursors. Higher-order clusters containing five or six cobalt atoms andboth apical substituents, e.g. [(YC)2Co5(CO)11]− or [(YC)2Co6(CO)13]− wereobserved.
3.2. Inducti6ely coupled plasma ionisation
For the purposes of elemental analysis, the inductively coupled plasma (ICP)source is useful but because it involves conversion of all analytes to singly chargedgas-phase ions, it provides no chemical information regarding the molecular formor oxidation state of the element in the original sample [86]. Nonetheless, it canprovide useful information on the ratios of various elements relative to others, andso the technique finds some use in studies of heteronuclear clusters. For example,ICP-MS analysis showed that the mixed-metal cluster [Pt(PPh3)(AuPPh3)6-(Cu4Cl3PPh3)](NO3) had a Pt:Au:Cu ratio of 1:5.9:4.0 [87]. Similarly, ICPMSprovided a Pt:Au:Cu ratio of 1:7.9:2.0 for the cluster [Pt(H)(AuPPh3)8-(CuCl)2](NO3) and a Pt:Au:P ratio of 1:8.9:8.1 for [Pt(H)(AuPy)(AuPPh3)8](NO3)2
[88]. ICP analysis has also been applied to the heterometallic cluster [Mo6BiS8-(H2O)18]8+, confirming the Mo:Bi:S ratio as 6:1:8 [89]. The clusters [Mo6SnSe4-(H2O)12]6+ and [Mo6SnSe8(H2O)18]8+ were characterised in similar fashion [90].The technique is a promising one for application to heteronuclear clusters for whichsingle crystals can not be obtained.
3.3. Field desorption
Application of a high positive electric potential to an electrode in the shape of apoint results in a very high potential gradient around the regions of high curvature.A molecule experiencing this field has its molecular orbitals distorted and quantumtunnelling of an electron can occur from the molecule to the positively chargedanode. This process occurs in field ionisation (FI) [91]. The positive electrode (anarray of very fine needles) repels the positive ion formed into the mass spectrome-ter. The practical consequence is that the molecular ion formed in this manner is

914 B.F.G. Johnson, J.S. McIndoe / Coordination Chemistry Re6iews 200–202 (2000) 901–932
not excited, and very little fragmentation occurs, giving an abundant [M]+ peak.The major drawbacks are that the high fields used generally require the use of amagnetic sector instrument and that anode preparation is tedious. Field desorption(FD) is closely related to FI, the major difference being that the sample is actuallycoated on the anode rather than being in the vapour phase around it. It suffersfrom the same drawbacks as FI, as well as being very sensitive to the temperatureof the emitter, and its application to cluster chemistry has been limited. Nonethe-less, a few clusters have been characterised using this method, such as thetetranuclear butterfly clusters Ru4(m-H)2(CO)8[R1C�C(H)C(H)�NR2]2 (R1, R2=Me, iPr; Me, Cy; Ph, iPr) [92], or the linear cluster FeRu3(CO)10[MeC�C(H)C(H)�NiPr][PhC�C(H)C(H)�NiPr] [93].
3.4. Plasma desorption
An assortment of ionisation techniques have been developed with a commonidea, based on a proposal that sufficiently rapid heating could desorb or vaporisecomplex molecules before decomposition occurred, on the grounds of rate theoryfor unimolecular decomposition [94]. These ‘energy sudden’ methods rely on nearlyinstantaneous and large increases in temperature, generally achieved by particlebombardment of the sample. The first such technique to be developed was plasmadesorption (PD), which uses radioactive 252Cf as the particle source. This nucleus isradioactive and decomposes into two particles, each about half the nuclear mass,which travel with very high kinetic energies (millions of eV). One fission fragmentpasses through a thin film of sample, causing the sample to desorb directly as ions.The other particle is used to trigger a time-of-flight (TOF) mass analyser. Draw-backs are the low ion yield and the many hours required to obtain a spectrum, aswell as the low resolution of the TOF analyser. Nonetheless, compounds withmolecular masses in the tens of thousands have been successfully analysed.
The series of trinuclear nickel clusters [Ni3(m3-L)(m3-I)(m2-dppm)2]n+ (L=I−,CO, CNCH3, CN-2,6-Me2C6H3, CNiC3H7, CNtC4H9, CNnC4H9 and NO+, n=0, 1,2) were characterised by PD and FABMS [95]. Strong molecular ion peaks wereobserved for all clusters except L=NO+ for both techniques. Dimers of thetrinuclear clusters, {[Ni3(m3-I)(m2-dppm)3]2(m3:m3’-h1:h1’-CN-R-NC)}2+ were pre-pared by the reaction of two equivalents of L=I− with one equivalent of theappropriate di-isocyanide, CN-R-NC and unambiguously identified by PD andFAB.
Very different results were obtained from a study of high-nuclearity anionicplatinum carbonyl clusters with Pt19, Pt24, Pt26 and Pt38 close-packed metal cores[96]. An envelope of peaks in the negative-ion spectrum corresponding to successivelosses of CO from the intact metal core was observed. More extraordinary was theobservation of a series of oligomeric ions formed from cluster aggregation, extend-ing out beyond 100 000 m/z (in excess of 500 platinum atoms) in the case of the Pt26
cluster (Fig. 8) [97]. A similar but less abundant positive ion spectrum was alsoobserved. The cation associated initially with the cluster was not incorporated intothe oligomers.

915B.F.G. Johnson, J.S. McIndoe / Coordination Chemistry Re6iews 200–202 (2000) 901–932
Fig. 8. The plasma desorption mass spectrum of [Pt26(CO)32]2−. Reprinted with permission from Ref.[98]. Copyright 1991 American Chemical Society.
PDMS has also been used to study the gold phosphine clusters [Au6(PPh3)6]-(NO3)2, [Au6(PPh3)8](NO3)2, [Au9(PPh3)8](NO3)3, [Au11(PPh3)8Cl2]Cl, Au13(PPh2-Me)8I4]I and [CAu6(PPh3)6](BF4)2, which had been previously well-characterised byother methods. Extensive fragmentation of these clusters occurred, to the extentthat it was judged impossible to assign a structure or even a formula based on themass spectral evidence [98]. The same authors [99] examined the large gold clusterfirst synthesised by Schmid and formulated as Au55(PPh3)12Cl6 [100], and despitebeing unable to prove or disprove this assignment (due to detecting only extremelybroad ‘mass zones’ rather than discrete peaks), claimed that the synthesis of thecompound was not entirely reproducible and that the product was likely to beinhomogeneous.
3.5. Fast-atom bombardment
FAB was developed in the 1980s [101]. A beam of fast-moving argon or xenonatoms is used to bombard the sample, which is dissolved in a non-volatile liquidsuch as glycerol and placed on the metal tip of a probe admitted to the ion source[102]. Momentum transfer causes ions of sample molecules to pass into the gasphase. Closely related to FAB is liquid secondary ion mass spectrometry (LSIMS),which uses fast ions (Ar+, Xe+, Cs+) instead of atoms and is technically somewhatmore convenient than FAB as it avoids the neutralising step. Molecular weights ofup to 24 000 Da have been recorded. FAB can be complicated by redox, fragmen-tation and clustering processes in the study of metal complexes [103]. Nonetheless,FAB has become a relatively routine technique for mass spectrometric analysis ofclusters, whether charged or neutral. Positive or negative ion spectra are producedwith similar facility.

916 B.F.G. Johnson, J.S. McIndoe / Coordination Chemistry Re6iews 200–202 (2000) 901–932
The positive ion FAB mass spectrum of Pt5(CNC8H9)10 shows a large number ofpeaks (see Fig. 9(a)) [104]. The highest mass peak, A, at m/z=2153, is due to[M−CNC8H9]+ and the most intense peak, I, is due to [M−7CNC8H9]+. Theremaining peaks, labelled B to S in the figure, are readily assigned to losses of Pt
Fig. 9. The FAB mass spectra of (a) Pt5(CNC8H9)10 and (b) Pt(m-SO2)2(CNC8H9)8. Reprinted withpermission of The Royal Society of Chemistry from Ref. [105].

917B.F.G. Johnson, J.S. McIndoe / Coordination Chemistry Re6iews 200–202 (2000) 901–932
and/or CNC8H9 ligands. The spectrum of the related compound Pt(m-SO2)2(CNC8H9)8 (see Fig. 9b) displays no sign of peaks retaining the SO2 ligands,and [M−2SO2]+ is the highest mass peak (A, m/z=2026) with the remainingpeaks due to losses of the CNC8H9 ligands [M−2SO2−xCNC8H9]+ (x=1–5,B�F).
High-nuclearity clusters have been examined successfully using FABMS, such asthe decanuclear clusters [Ru10C2(CO)22(L)]2− and [Ru10C2(CO)23(L)] (L=diphenyl-acetylene or norbornadiene) [105], or the mixed-metal clusters [Re6Ir(m6-C)(CO)20(AuPPh3)3−n ]n− (n=1, 2, 3) [106]. The large transition metal-gold clusters[Au2Pt(PPh3)4NO3]NO3, [Au6Pt(PPh3)7](BPh4)2, [Au2Re2H6(PPh3)6]PF6, [Au4ReH4-{P(p-Tol)3}2(PPh3)4]PF6 and other similar cationic and dicationic clusters wereanalysed by FAB [107], and gave well-resolved peaks for either the parent molecu-lar ion [M]+ for the cationic clusters or the ion pair [M+X]+ (where X=counter-ion) for the dicationic clusters. Fragments were also observed, corresponding tolosses of PPh3, H, CO, Ph and AuPPh3. A positive-ion FAB study of the clustercompounds [Au9M4Cl4(PPh2Me)8][C2B9H12] (M=Au, Ag, Cu) showed strong [M]+
molecular ions as well as fragment peaks due to losses of primarily PPh2Me butalso of Au and Cl [108]. In another study, a range of high-nuclearity anionicruthenium clusters were examined in negative-ion mode [109]. The anionic clustersgave intact anion peaks [M]−, and all of the dianionic clusters gave protonatedmonoanions [M+H]− peaks. Degradation of the cluster metal frameworks of[HRu10C(CO)24]− and [Ru10C(CO)24]2− into [HRu6C(CO)16]− was observed, andthis degradation process parallels their reactivity in solution.
Halide clusters have also been characterised using FAB mass spectrometry. Theclusters [Mo6Br8X6]2− (X=CF3CO2, SCN, NCO, Cl, Br, I) gave negative-ionspectra in which the highest mass envelopes corresponded to the parent ion pairedwith one cation, the parent anion, and the parent anion minus one ligand [110].
3.6. (Matrix assisted) laser desorption ionisation
Laser desorption ionisation (LDI) achieves rapid heating by using a pulse ofinfrared radiation from an ultraviolet laser or similar, creating a gaseous plumecontaining positively and negatively charged ions. Time-of-flight (TOF) andFourier transform ion cyclotron resonance (FTICR) mass analysers are well suitedto these experiments because an entire spectrum can be generated with a single shotof the laser. When the sample is dispersed in a solid matrix (generally a compoundthat efficiently absorbs the laser radiation, such as nicotinic acid) the technique istermed matrix-assisted laser desorption ionisation (MALDI) [111], which hasproved very popular for the study of polymers and large biomolecules [112]. Therecord molecular weight obtained for all types of compound is more than 1 000 000Da [113]. Surprisingly, the application of MALDI to cluster compounds has beenvery limited (vide supra).
Aggregation processes that probably arise from ion–molecule reactions in the gasphase complicate the LDI spectra of neutral metal carbonyl clusters. The hexanu-clear ruthenium carbide clusters Ru6C(CO)17, Ru6C(CO)14(h6-C6H5Me), Ru6C-

918 B.F.G. Johnson, J.S. McIndoe / Coordination Chemistry Re6iews 200–202 (2000) 901–932
Fig. 10. The negative-ion LDI-TOF mass spectrum of Ru6C(CO)17 in the range m/z 600–40 000.Reprinted with permission of The Royal Society of Chemistry from Ref. [116].
(CO)12(h6-C6H4Me2)(m-C6H7Me) and Ru6C(CO)14(C16H16) all show high molecularweight clusters (up to 50,000 Da) formed by aggregation processes [114,115]. Thenegative-ion LDI-TOF mass spectrum of Ru6C(CO)17 is shown in Fig. 10 and eachpeak represents a metal core, e.g. Ru6, Ru12, Ru18, Ru24 with varying numbers ofCO ligands. For example, the peak at 3980 m/z contains the species[Ru30C6(CO)x ]− (x�28–36), but the width of each isotopomer envelope is suchthat considerable overlap occurs.
Fragmentation of the metal core further complicates the spectra of trinuclearclusters, and in a study of the clusters M3(CO)12 (M=Fe, Ru, Os) species wereobserved in both positive and negative ion modes ranging in nuclearity from 1 to\50 for Fe3(CO)12, 2 to 9 for Ru3(CO)12 and 3 to 11 for Os3(CO)12 [116]. Thenegative-ion spectrum of Ru3(CO)12 shows clearly fragmentation of the metal core,loss of CO ligands and aggregation processes (see Fig. 11).
Very similar processes of fragmentation and aggregation occur for the phos-phine-substituted triruthenium clusters Ru3(CO)12−x(PPh3)x (x=1, 2, 3) [117]. Thephosphine ligands are stripped from the clusters during the desorption/ionisationprocess, and only homoleptic ruthenium carbonyl species Rux(CO)y are observed inthe mass spectrum.

919B.F.G. Johnson, J.S. McIndoe / Coordination Chemistry Re6iews 200–202 (2000) 901–932
Fig. 11. The negative-ion LDI-TOF mass spectrum of Ru3(CO)12. Reprinted with permission from Ref.[117]. Copyright 1999 American Chemical Society.
While the LDI mass spectra of neutral carbonyl clusters can be very complicated,LDI has been shown to be a useful method for the characterisation of large anionicosmium clusters [118]. The spectra obtained are clean and uncomplicated byaggregation, and the only fragment ions present are due to CO loss. Fig. 12 showsthe LDI-TOF spectrum of [Os10C(CO)24]2−, which contains peak envelopes for theions [Os10C(CO)x ]− (x=7–24).
The phosphorus containing clusters Fe4(h5-C5H4Me)4(CO)6P8 and Fe6(h5-C5H4Me)4(CO)13P8 have been successfully characterised by LDI-FTICR mass spec-trometry [119]. A comparative analysis of LDI-FTICR and EI-FTICR mass spectraof four organometallic complexes of varying volatilities, including the dimersFe2(h-C5Me5)2(m-P2)2 and Co2(h-C5Me5)2(m-P2)2, concluded that LDI gave eithersimilar or much superior information to that provided (if at all) by EI, especiallywhen the target complex was thermally unstable [120]. The halide clusters
Fig. 12. The negative-ion LDI-TOF mass spectrum of [PPN]2[Os10C(CO)24].

920 B.F.G. Johnson, J.S. McIndoe / Coordination Chemistry Re6iews 200–202 (2000) 901–932
[(Nb6X12)X2(H2O)4].4H2O (X=Cl, Br) were studied using LDI-FTICR mass spec-trometry [121]. The quasi-molecular ion [(Nb6X12)X2]− and fragment ions involvinglosses of 1–3 X were the most abundant in the spectrum, indicating the stability ofthe core cluster, Nb6X12.
The first example of the application of MALDI to cluster chemistry camerecently in a study of the clusters Cs3Re3X12 (X=Cl, Br) and (NBu4)2[Re2Cl8]. Theclusters were examined using LDI with and without the use of a matrix [122].MALDI produced the best spectra, and characteristic fragments due to loss of Xgave peaks that were used to identify the number of rhenium atoms and the identityof the ligands, by the isotope patterns and m/z values. The same authors have sincesuccessfully extended the utility of the technique to the cluster anions [Re3(m3-E)(m-Cl)3Cl6]2− (E=S, Se, Te) [123]. MALDI has also been used to characterise anumber of different dendritic carbosilanes containing ethynyl groups and dicobalthexacarbonyl clusters on the periphery [124]. Molecular masses of up to 8500 Dahave been successfully established [125].
Laser ablation has been used for the generation of metal cluster species. Forexample, laser ablation of CoS yields 83 gaseous ions [CoxSy ]−, detected andcharacterised by FTICR mass spectrometry [126]. The ions range in size from[CoS2]− to [Co38S24]−. Similar experiments have been carried out with FeS, NiS[127] and MnS [128]. Many experiments have also been carried out with variousmetal cluster sources attached to mass spectrometers, but are beyond the scope ofthis review, which is focused primarily on the characterisation of preformedclusters.
3.7. Electrospray ionisation
Electrospray ionisation (ESI) involves spraying a solution of a substance througha capillary into a chamber, through which is passing a stream of dry gas in theopposite direction to the spray [129]. A potential of several kilovolts is appliedbetween the capillary and the chamber wall. Charged droplets are produced thatbecome smaller as the solvent is evaporated, and eventually bare ions are formedwhich pass through a glass capillary into the pre-analyser region, where theremaining bath gas and residual solvent is pumped away. The ions are then focusedthrough the lensing system into the analyser of the mass spectrometer. Electrospraymass spectrometry experiments were first carried out by Dole and colleagues some30 years ago [130]. However, the real birth of ESIMS as an analytical tool came inthe mid-1980s when Fenn and co-workers improved on Dole’s designs and coupledan electrospray source to a quadrupole mass analyser [131]. Once it was shown thatESIMS could provide accurate molecular weights (with seemingly no upper limit)for proteins and other large, fragile molecules [132,133] it led to an explosion ofinterest in the technique, which has continued unabated.
Ionic compounds are particularly well suited to study by electrospray massspectrometry. They are transported into the gas phase essentially without changeand spectra typically consist of a single envelope of peaks due to the intact ion, withlittle or no fragmentation. Ionic inorganic species, quartenary ammonium and

921B.F.G. Johnson, J.S. McIndoe / Coordination Chemistry Re6iews 200–202 (2000) 901–932
Fig. 13. Comparison of calculated and experimental negative-ion ESI mass spectral isotope pattern for[S2Mo18O62]4−.
phosphonium salts, were amongst the very first compounds to be studied by ESIMS[134]. Inorganic chemists quickly realised the potential of the technique [135]. Astudy by Chait in 1990 showed that electrospray ionisation generated intactprincipal ions for ruthenium(II) dipyridyl complexes [136]. Anionic clusters weresoon being examined using ESIMS, with a notable early example being thesuccessful characterisation of the quadruply-charged heteropolymolybdate[S2Mo18O62]4− [137]. Fig. 13 shows the comparison between the experimental andexpected mass distribution patterns for this ion. The polymerisation of [MoO4]2−
that occurs upon acidification has been studied [138], with a number of newisopolyoxomolybdate species being identified. The formulation and speciation ofthese products has been difficult to establish by other methods.
Organometallic complexes can also provide good electrospray spectra [139]. Themixed metal anionic clusters [Fe3(CO)11(m-HgX)]− [X=Co(CO)4, Mn(CO)5,Fe(CO)2Cp, W(CO)3Cp and Mo(CO)3Cp] and [Fe6C(CO)16(AuPPh3)]− gave goodnegative-ion spectra with either the [M]− or the [M−CO]− peak being the mostintense in the spectrum [140]. The related clusters [Fe4C(CO)12(m-HgX)]− (X=asbefore) gave [M]− as the base peak in the spectrum [141]. Larger clusters alsoprovide excellent quality spectra, such as for the dianionic clusters[Ni10(BiMe)2(CO)18]2− [142], [Ru6C(CO)16]2− and [Os10C(CO)24]2− [143]. A spec-

922 B.F.G. Johnson, J.S. McIndoe / Coordination Chemistry Re6iews 200–202 (2000) 901–932
trum of [Os10C(CO)24]2− is presented in Fig. 14 that displays the lack of fragmen-tation typical of ESIMS.
Clusters in which the charge resides on the ligand, such as the water-solublecluster Ru3(CO)9[P(C6H4SO3Na)3]3, can provide good negative-ion spectra [144].Cationic clusters have also been investigated successfully, such as the water-solubletetraosmium cluster [Os4(m-H)4(CO)10(dppH)]+ (dpp=2,3-bis(2-pyridyl)pyrazine)[145]. ESIMS has been used to study the constitution of mercury and mixedmercury/cadmium dithicarbomato cations in dichloromethane and methanol solu-tions [146]. Average empirical compositions had been previously established bychemical, electrochemical and NMR techniques, but all showed evidence of labilitybetween several species in solution. ESIMS was shown to be well suited to studyinglabile, charged polynuclear species in solution and a large number of ionicoligomers were successfully identified.
ESIMS promises to be a very useful technique for the monitoring of clusterreactions. Experiments can be done on a very small scale varying the reactionconditions and times, enabling rapid and inexpensive optimisation. Furthermore,monitoring by ESIMS can in certain cases be useful in identifying intermediates andminor products, and in this case ESIMS is superior to IR spectroscopy as the lattertechnique often suffers from overlap of bands from different species. Recent successhas been had with this approach in the study of the reaction between GeCo4(CO)14
and [Co(CO)4]−. This reaction was first studied in 1982 and the product,[GeCo5(CO)16]−, was characterised by X-ray crystallography and IR spectroscopy[147]. Re-examination of this reaction in ether and CH2Cl2 and monitoring itscourse by ESIMS showed both this product as well as [GeCo7(CO)20]− and[Ge2Co7(CO)21]−, previously made from reactions of [GeCo5(CO)16]− [148]. Fur-thermore, a new product, the previously unknown dianion [Ge2Co10(CO)24]2− (seeFig. 15) was also identified. The disappearance of the [Co(CO)4]− starting materialwas also demonstrated [149].
Fig. 14. The negative-ion ESI mass spectrum of [PPN]2[Os10C(CO)24] run in a methanol mobile phaseat low (15 V) cone voltage.

923B.F.G. Johnson, J.S. McIndoe / Coordination Chemistry Re6iews 200–202 (2000) 901–932
Fig. 15. The negative-ion ESI mass spectrum recorded during the reaction between GeCo4(CO)14 and[Co(CO)4]− (see Ref. [150]).
By performing the reaction at the optimum temperature and stopping it after theyield of [Ge2Co10(CO)24]2− was shown to be highest, this new compound wassuccessfully isolated and structurally characterised. The structure of the dianion,shown in Fig. 16, is highly unusual and could certainly not have been predictedfrom the mass spectrometric evidence alone.
Fig. 16. The structure of [Ge2Co10(CO)24]2− (see Ref. [150]).

924 B.F.G. Johnson, J.S. McIndoe / Coordination Chemistry Re6iews 200–202 (2000) 901–932
Much cluster synthesis involves the use of an inert atmosphere. Samplingreactions using a syringe and injecting the (usually further diluted) solution directlyinto the ionisation source is generally sufficient to exclude air or moisture, butinterfacing a Schlenk line with the mass spectrometer is also possible and offers aversatile solution to the problem of air-sensitivity [150].
A number of methods have been developed for the analysis of neutral metalcarbonyl clusters using ESIMS [115]. Because the oxygen of the carbonyl ligand isnot appreciably basic, it will not protonate and hence species of the type [M+H]+
are not observed. Various other charged species have, however, been shown toderivatise neutral carbonyl clusters. The most effective and general method to dateis the use of alkoxide ion as an ionisation agent [151]. The sample is dissolved in thecorresponding alcohol, and a small quantity of sodium alkoxide solution is added.Nucleophilic attack by the alkoxide ion on a coordinated carbonyl ligand providesa charged species:
LnM�CO+OR−� [LnM�CO2R]−
This reaction is quite general for metal carbonyl compounds, is rapid and largeequilibrium constants favour the product, all of which are ideal characteristics fora derivatisation process. Table 1 shows a representative range of carbonyl clustersthat has been successfully analysed using this technique.
Metal carbonyl clusters, Mx(CO)y, are also attacked by the nucleophilic azideion, N3
−, to form isocyanato complexes of the type [Mx(NCO)(CO)y-1]−. Thisreaction has been studied by ESIMS and the isocyanato complexes observed for theclusters M2(CO)10 (M=Mn, Re), M3(CO)12 (M=Ru, Os) and Ir4(CO)12 [152]. Theazide-addition complex [Mx(CO)y+N3]− was also observed for some clusters, thefirst time evidence for this intermediate has been obtained. ESIMS appears to be anideal means of screening substrates to see which are most suitable for subsequentsmall-scale reactions.
Silver (I) ions also work as ionisation agents with some neutral metal carbonylclusters, such as Ru3(CO)12, Os3(CO)12, Re2(CO)10 and SiFe4(CO)16, providing[M+Ag]+ and/or [M+Ag+solvent]+ type ions (depending on the solvent andthe cone voltage) [153]. It seems likely that the interaction is between an electron-rich metal-metal bond of a cluster and the silver ion to form a M2Ag triangle [144].Clusters of this type are known which are sufficiently stable to be characterisedstructurally, though all the examples have strongly electron donating ligands.
Table 1Examples of neutral metal carbonyl clusters that give clean [M+OMe]− ions upon derivatisation withNaOMe
Rh4(CO)12Fe3(CO)11(CNtBu) Ru6C(CO)17Mn2(CO)10
Re2(CO)10 Rh6(CO)16Ir4(CO)12Ru3(CO)12
[Fe(CO)2Cp]2 Ru6C(CO)14(m3-h6-C16H16)NiRu3(m-H)3(CO)9Os3(CO)12
Ru6C(CO)14(h6-C6H5Me)Ru4H4(CO)12[Mo(CO)3Cp]2 Ru3(CO)11PPh3

925B.F.G. Johnson, J.S. McIndoe / Coordination Chemistry Re6iews 200–202 (2000) 901–932
Further evidence for this form of association is given by the fact that Ag+ does notgive [M+Ag]+ ions with mononuclear compounds.
The alkali metal ions Li+, Na+ and K+ will also associate with very electron-richclusters such as Ru3(CO)9(PPh3)3 to give species of the type [M+cation]+. Becausethis ionisation method works equally well with the mononuclear carbonyl com-plexes fac-[Re(X2bipy)(CO)3Y] (X2bipy=4,4%-X2-2,2%-bipyridine; X=H, Me, CF3;Y=CN, Cl, Br, OCHO) [154] or the nitrosyl complexes [Ru(NO)Cl3(EPh3)2](E=P, As, Sb) [155], it seems that the alkali metal cations are associating in adifferent way to the silver ions. The attachment is likely to be via an iso-carbonyl(or iso-nitrosyl) link of the type LnM�C�O···Na+.
Another strategy for obtaining electrospray mass spectra from neutral clusters isby use of ‘electrospray-friendly’ ligands, namely phosphines bearing basic groupsthat can be readily protonated under electrospray conditions [156]. Derivatives oftriphenylphosphine, PPhn(p-C6H4OMe)3−n and PPhn(p-C6H4NMe2)3−n (n=0, 1,2), have been shown to provide good positive ion electrospray spectra when boundto triruthenium clusters, and have the advantage that they are both chemically andelectronically similar to PPh3.
Fig. 17. ESI mass spectra at different ion source voltages of [Cr3O(CH3COO)6(H2O)3]+ dissolved inpyridine (2 mM) and diluted (1:10) with methanol: (a) 30 V; (b) 40 V; (c) 60 V; (d) 100 V. Reprinted withpermission from Ref. [160]. Copyright 1993 American Chemical Society.

926 B.F.G. Johnson, J.S. McIndoe / Coordination Chemistry Re6iews 200–202 (2000) 901–932
Fig. 18. An EDESI-MS two-dimensional map of m/z vs. cone voltage for [Rh6(CO)16+OMe]− from0–200 V.A combined one-dimensional spectrum appears at the top. Rh6(CO)16 was dissolved in MeOHand derivatised in situ with a drop of �0.1 mol l−1 solution of NaOMe in MeOH.
Because electrospray is a soft ionisation technique, very little fragmentationoccurs and spectra generally consist of a single isotopomer envelope due to theparent ion. This property can be used to advantage in the study of mixtures, as eachcomponent appears in the spectrum as a single peak. For example, the pyrolysis ofOs3(CO)12 at temperatures between 210 and 260°C is known to produce a mixtureof higher nuclearity osmium clusters [157]. At the lower end of this scale, thehexanuclear cluster Os6(CO)18 is known to predominate. The crude reaction mix-ture from pyrolysis of Os3(CO)12 at 210°C was dissolved, derivatised with methox-ide ion and examined using ESIMS. The spectrum showed a mixture of compoundsof nuclearities from four to seven, with Os6(CO)18 the most abundant as expected.

927B.F.G. Johnson, J.S. McIndoe / Coordination Chemistry Re6iews 200–202 (2000) 901–932
While the lack of fragmentation observed in ESI mass spectra means that themolecular weight is easily obtained, no structural information is provided. Frag-mentation can however be induced by means of increasing the cone voltage [158],which has the effect of increasing the kinetic energy of the ions in the presence ofthe bath gas (typically nitrogen) and fragmenting the ions by collision. In the studyof clusters, this ability enables the sequential stripping of the ligands. Fig. 17 showsan example of ligand stripping for the trinuclear complex [Cr3O(CH3COO)6-(H2O)3]+, run in a methanol mobile phase [159]. At a low cone voltages the massspectrum shows a series of peaks corresponding to ions containing theCr3O(CH3COO)6 core and up to three terminal ligands with various combinationsof water and methanol. As the voltage is increased, collision induced decomposi-tions occur more readily in the ion source and at a voltage of 70 V or higher, onlythe core ion [Cr3O(CH3COO)6]+ has significant intensity.
A considerable amount of fragmentation data can generated in this way, and away of presenting this data, termed ‘energy-dependent electrospray ionisation massspectrometry’ (EDESI-MS) is shown in Fig. 17 [160]. Fig. 18 is a two-dimensionalmap of mass vs. cone voltage for [Rh6(CO)16+OMe]− across the entire range ofcone voltages from 0–200V. At the top is a one-dimensional spectrum thatcombines all 201 spectra used to generate the map. This form of presentation allowsassessment of the entire fragmentation pattern at a glance.
The spectrum shows the sequential loss of the ligands down to a [Rh6+H]−
core. A loss of 30 m/z occurs midway through the fragmentation process, corre-sponding to a loss of H2CO via hydride transfer from the methoxy group to thecluster. Two series of peaks are therefore seen, [Rh6(CO)n+H]− (n=0–9) at618–870 m/z and [Rh6(CO)n+OMe]− (n=9–16) at 900–1096 m/z.
4. Summary
Cluster chemistry has benefited from the application of a wide range of increas-ingly powerful spectroscopic techniques to the characterisation of new compoundsand studies of their reactivity. Recent advances in mass spectrometry, particularlyin the area of new ionisation techniques, have also given cluster chemists new toolswith which to study compounds of interest, and has allowed access to thermallyunstable, involatile compounds. Spectroscopic and mass spectrometric develop-ments have reduced the emphasis placed on X-ray crystallography for the structuralcharacterisation of cluster compounds, and broadened the field to include thedetailed study of amorphous materials, mixtures, species in solution, in the gasphase and on surfaces. As spectroscopic and mass spectrometric techniques get evermore sophisticated, thanks to innovations in instrumentation, increases in process-ing power, and in the development of new experimental techniques, we can safelyexpect their application in all areas of cluster chemistry to become morewidespread.

928 B.F.G. Johnson, J.S. McIndoe / Coordination Chemistry Re6iews 200–202 (2000) 901–932
Acknowledgements
Thanks to Professor Brian Nicholson for details of unpublished work. J.S.M.thanks the New Zealand Foundation for Research, Science and Technology for aPostdoctoral Fellowship (contract CAM801).
References
[1] S.F.A. Kettle, E. Diana, R. Rossetti, P.L. Stanghellini, J. Am. Chem. Soc. 119 (1997) 8228.[2] S.F.A. Kettle, E. Diana, R. Rossetti, P.L. Stanghellini, Inorg. Chem. 37 (1998) 6502.[3] S.F.A. Kettle, R. Rossetti, P.L. Stanghellini, B.F.G. Johnson, Inorg. Chem. Acta 212 (1993) 69.[4] G.A. Battiston, G. Bor, U.K. Dietler, S.F.A. Kettle, R. Rossetti, G. Sbrignadello, P.L. Stanghel-
leni, Inorg. Chem. 19 (1980) 1961.[5] S.F.A. Kettle, E. Diana, P.L. Stanghellini, R. Dellapergola, A. Fumagalli, Inorg. Chim. Acta 235
(1995) 407.[6] G. Bor, F.H. Oldani, S.F.A Kettle, J. Clust. Science 9 (1998) 259.[7] S.F.A. Kettle, E. Diana, R. Rossetti, P.L. Stanghellini, R. Della Pergola, L. Garlaschelli, Inorg.
Chim. Acta 227 (1994) 241.[8] C.E. Anson, U.A. Jayasooriya, S.F.A Kettle, P.L. Stanghellini, R. Rossetti, Inorg. Chem. 30
(1991) 2282.[9] J.A. Creighton, R.D. Pergola, B.T. Heaton, S. Martinengo, L. Strona, D.A. Willis, J. Chem. Soc.
Chem. Commun. (1982) 864.[10] J.A. Creighton, B.T. Heaton, J. Chem. Soc. Dalton Trans. (1981) 1498.[11] R.J.H. Clark, P.J. Dyson, D.G. Humphrey, B.F.G. Johnson, Polyhedron 17 (1998) 2985.[12] P. MacLaurin, N.C. Crabb, I. Wells, P.J. Worsfold, D. Coombs, Anal. Chem. 68 (1996) 1116.[13] M.J. Shaw, W.E. Geiger, Organometallics 15 (1996) 13.[14] J.M. Sanders, B.K. Hunter, Modern NMR Spectroscopy: A Guide for Chemists, Oxford Univer-
sity Press, Oxford, 1993.[15] W. von, E. Doering, W.R. Roth, Angew. Chem. Int. Ed. Eng. 2 (1963) 115.[16] F.A. Cotton, Acc. Chem. Res. 1 (1968) 257.[17] B.E. Mann, B.F. Taylor, 13C-NMR Data for Organometallic Compounds, Academic Press,
London, 1981.[18] D.F. Shriver, P.W. Atkins, C.H. Langford, Inorganic Chemistry, 2nd edition, Oxford University
Press, Oxford, 1994.[19] J.M. Bemis, L.F. Dahl, J. Am. Chem. Soc. 119 (1997) 4545.[20] S.R. Drake, B.F.G. Johnson, J. Lewis, J. Chem. Soc. Dalton Trans. (1988) 1517[21] P.J. Bailey, L.H. Gade, B.F.G. Johnson, J. Lewis, Chem. Ber. 125 (1992) 2019.[22] M.A. Gallop, B.F.G. Johnson, J. Keeler, J. Lewis, S.J. Hayes, C.M. Dobson, J. Am. Chem. Soc.
114 (1992) 2510.[23] F.M. Dolgushin, E.V. Grachova, B.T. Heaton, J.A. Iggo, I.O. Koshevoy, I.S. Podkorytov, D.J.
Smawfield, S.P. Tunik, R. Whyman, A.I. Yanovskii, J. Chem. Soc. Dalton Trans. (1999) 1609.[24] J.L. Vidal, W.E. Walker, R.L. Pruett, R.C. Shoening, Inorg. Chem. 18 (1979) 129.[25] C. Brown, B.T. Heaton, P. Chini, A. Fumagalli, G. Longoni, J. Chem. Soc. Chem. Commun.
(1977) 309.[26] C. Brown, B.T. Heaton, A.D.C. Towl, P. Chini, A. Fumagalli, G. Longoni, J. Organomet. Chem.
181 (1979) 233.[27] W. von Philipsborn, Chem. Soc. Rev. 28 (1999) 95 and references therein.[28] T. Blum, M.P. Brown, B.T. Heaton, A.S. Hor, J.A. Iggo, J.S.Z. Sabounchei, A.K.N.A. Smith, J.
Chem. Soc. Dalton Trans. (1994) 513.[29] C.A. Fyfe, Solid State NMR for Chemists, CFC Press, Guelph, 1983.[30] T. Eguchi, B.T. Heaton, J. Chem. Soc. Dalton Trans. (1999) 3523.

929B.F.G. Johnson, J.S. McIndoe / Coordination Chemistry Re6iews 200–202 (2000) 901–932
[31] S. Aime, W. Dastru, R. Gobetto, A.J. Arce, Organometallics 13 (1994) 4232.[32] M.A. Gallop, B.F.G. Johnson, J. Lewis, P.R. Raithby, J. Chem. Soc. Chem. Commun. (1987)
1809.[33] P. Kempgens, J. Hirschinger, K. Elbayed, J. Raya, P. Granger, J. Rose, J. Phys. Chem. 100 (1996)
2045.[34] J.V. Barkley, T. Eguchi, R.A. Harding, B.T. Heaton, G. Longoni, L. Manzi, H. Nakayama, K.
Miyagi, A.K. Smith, A. Steiner, J. Organomet. Chem. 573 (1999) 254.[35] L.J. Farrugia, D. Braga, F. Grepioni, J. Organomet. Chem. 573 (1999) 60.[36] K.Y. Yang, S.G. Bott, M.G. Richmond, Organometallics 14 (1995) 2718.[37] J.P. Scott, J.R. Budge, A.L. Rheingold, B.C. Gates, J. Am. Chem. Soc. 109 (1987) 7736.[38] J.G.C. Shen, A.M. Liu, T. Tanaka, M. Ichikawa, J. Phys. Chem. B 102 (1998) 7782.[39] M.P. Cifuentes, M.G. Humphrey, G.A. Heath, Inorg. Chim. Acta 259 (1997) 273.[40] A. Vertes, L. Korecz, K. Burger, Mossbauer Spectroscopy, Elsevier, Amsterdam, 1979.[41] R.H. Herber, W.R. Kingston, G.K. Wertheim, Inorg. Chem. 2 (1963) 153.[42] G. Schmid, Struct. Bonding 62 (1985) 52.[43] K. Burger, L. Korecz, G. Bor, J. Inorg. Nucl. Chem. 31 (1969) 1527.[44] R. Reina, O. Rossell, M. Seco, P. GomezSal, A. Martin, D. deMontauzon, A. Mari, Organometal-
lics 17 (1998) 4127.[45] Y. Iwasawa, X-Ray Absorption Fine Structure for Catalysts and Surfaces, World Scientific,
Singapore, 1996.[46] J.G.C. Shen, M. Ichikawa, J. Phys. Chem. B 102 (1998) 5602.[47] W.A. Weber, B.C. Gates, J. Catal. 180 (1998) 207.[48] J.G.C. Shen, A.M. Liu, M. Ichikawa, J. Chem. Soc. Faraday Trans. 94 (1998) 1353.[49] G.J. Liu, T. Fujimoto, A. Fukuoka, M. Ichikawa, Catal. Lett. 12 (1992) 171.[50] W. Vogel, H. Knozinger, B.T. Carvill, W.M.H. Sachtler, Z.C. Zhang, J. Phys. Chem. B 102 (1998)
1750.[51] M.S. Nashner, A.I. Frenkel, D.L. Adler, J.R. Shapley, R.G. Nuzzo, J. Am. Chem. Soc. 119 (1997)
7760.[52] K. Okumura, K. Asakura, Y. Iwasawa, J. Phys. Chem. B 101 (1997) 9984.[53] R. Raja, G. Sankar, S. Hermans, D.S. Shephard, S. Bromley, J.M. Thomas, B.F.G. Johnson,
Chem. Commun. (1999) 1571.[54] S.E. Deutsch, G. Mestl, H. Knozinger, B.C. Gates, J. Phys. Chem. B 101 (1997) 1374.[55] S.P. Gubin, T.V. Galuzina, I.F. Golovaneva, A.P. Klyagina, L.A. Polyakova, O.A. Belyakova,
Y.V. Zubavichus, Y.L. Slovokhotov, J. Organomet. Chem. 549 (1997) 55.[56] I.I. Moiseev, J. Organomet. Chem. 488 (1995) 183.[57] D. Ellis, L.J. Farrugia, P. Wiegeleben, J.G. Crossley, A.G. Orpen, P.N. Waller, Organometallics
14 (1995) 481.[58] A.J. Dent, L.J. Farrugia, A.G. Orpen, S.E. Stratford, J. Chem. Soc. Chem. Commun. (1992) 1456.[59] L.J. Farrugia, N. Macdonald, R.D. Peacock, J. Chem. Soc. Chem. Commun. (1991) 163.[60] M.C.R. Symons, Chemical and Biochemical Aspects of Electron-Spin Resonance, Wiley, New
York, 1978.[61] A. Bencini, D. Gatteschi, in: E.I. Solomon, A.B.P. Lever (Eds.), Inorganic Electronic Structure
and Spectroscopy, Wiley, New York, 1999.[62] F. Calderoni, F. Demartin, M.C. Iapalucci, F. Laschi, G. Longoni, P. Zanello, Inorg. Chem. 35
(1996) 898.[63] D.S. Shephard, B.F.G. Johnson, A. Harrison, S. Parsons, S.P. Smidt, L.J. Yellowlees, J.
Organomet. Chem. 563 (1998) 113.[64] D.A. Nagaki, J.V. Badding, A.M. Stacy, L.F. Dahl, J. Am. Chem. Soc. 108 (1986) 3825.[65] V.G. Albano, L. Grossi, G. Longoni, M. Monari, S. Mulley, A. Sironi, J. Am. Chem. Soc. 114
(1992) 5708.[66] R.B. King, Inorg. Chim. Acta 227 (1994) 207.[67] J.J. Thomson, Rays of Positive Electricity and their Application to Chemical Analysis, Longmans,
Green & Co, London, 1913.

930 B.F.G. Johnson, J.S. McIndoe / Coordination Chemistry Re6iews 200–202 (2000) 901–932
[68] M. Tsutsui, Characterization of Organometallic Compounds, Part I, Interscience, New York,1969.
[69] D.T. Hurd, G.W. Sentell, F.G. Norton, J. Am. Chem. Soc. 71 (1949) 1899.[70] R.E. Winters, R.W. Kiser, J. Phys. Chem. 69 (1965) 1618.[71] R.B. King, J. Am. Chem. Soc. 88 (1966) 2075.[72] B.F.G. Johnson, J. Lewis, I.G. Williams, J.M. Wilson, J. Chem. Soc. (A) (1967) 341.[73] W. Fellman, D.K. Huggins, H.D. Kaesz, J.M. Smith, J. Am. Chem. Soc. 86 (1964) 4841.[74] B.F.G. Johnson, R.D. Johnston, J. Lewis, B.H. Robinson, J. Chem. Soc. Chem. Commun. (1966)
851.[75] M.T. Bowers, A.G. Marshall, F.W. McLafferty, J. Phys. Chem. 100 (1996) 12897.[76] M.S.B. Munson, F.H. Field, J. Am. Chem. Soc. 88 (1966) 2621.[77] M.S.B. Munson, Anal. Chem. 43 (1971) 28A.[78] C.R. Eady, B.F.G. Johnson, J. Lewis, J. Chem. Soc. Dalton Trans. (1975) 2606.[79] A.G. Marshall, Acc. Chem. Res. 18 (1985) 316.[80] S.G. Shore, D.-Y. Jan, W.-L. Hsu, L.-Y. Hsu, S. Kennedy, J.C. Huffman, T.-C. Lin Wang, A.G.
Marshall, J. Chem. Soc. Chem. Commun. (1984) 392.[81] L.-Y. Hsu, W.-L. Hsu, D.-Y. Jan, A.G. Marshall, S.G. Shore, Organometallics 3 (1984) 591.[82] C.L. Hammill III, R.J. Clark, C.W. Ross, A.G. Marshall, J. Schmutz, Inorg. Chem. 36 (1997)
5973.[83] W.K. Meckstroth, R.B. Freas, W.D. Reents Jr., D.P. Ridge, Inorg. Chem. 24 (1985) 3139.[84] S.L. Mullen, A.G. Marshall, J. Am. Chem. Soc. 110 (1988) 1766.[85] D.L. Vollmer, M.L. Gross, R.J. Waugh, M.I. Bruce, J.H. Bowie, Organometallics 13 (1994) 3564.[86] R.S. Houk, Acc. Chem. Res. 27 (1994) 33.[87] T.G.M.M. Kappen, P.P.J. Schlebos, J.J. Bour, W.P. Bosman, J.M.M Smits, P.T. Beurskens, J.J.
Steggerda, J. Am. Chem. Soc. 117 (1995) 8327.[88] T.G.M.M. Kappen, P.P.J. Schlebos, J.J. Bour, W.P. Bosman, J.M.M Smits, P.T. Beurskens, J.J.
Steggerda, Inorg. Chem. 34 (1995) 2133.[89] D.M. Saysell, A.G. Sykes, Inorg. Chem. 35 (1996) 5536.[90] R. Hernandez-Molina, D.N. Dybtsev, V.P. Fedin, M.R.J. Elsegood, W. Clegg, A.G. Sykes, Inorg.
Chem. 37 (1998) 2995.[91] W.D. Reynolds, Anal. Chem. 51 (1979) 283A.[92] W.P. Mul, C.J. Elsevier, M. Vanleijen, K. Vrieze, W.J.J. Smeets, A.L. Spek, Organometallics 11
(1992) 1877.[93] O.C.P. Beers, C.J. Elsevier, W.J.J. Smeets, A.L. Spek, Organometallics 12 (1993) 3199.[94] R.J. Beuhler, E. Flanigan, L.J. Green, L. Friedman, J. Am. Chem. Soc. 96 (1974) 3990.[95] D.A. Morgenstern, C.C. Bonham, A.P. Rothwell, K.V. Wood, C.P. Kubiak, Polyhedron 14 (1995)
1129.[96] J.M. Hughes, Y. Huang, R.D. MacFarlane, C.J. McNeal, G.J. Lewis, L.F. Dahl, Int. J. Mass
Spec. Ion Process. 126 (1993) 197.[97] C.J. McNeal, J.M. Hughes, G.J. Lewis, L.F. Dahl, J. Am. Chem. Soc. 113 (1991) 372.[98] C.J. McNeal, R.E.P. Winpenny, R.D. MacFarlane, L.H. Pignolet, L.T.J. Nelson, T.G. Gardner,
L.H. Irgens, G. Vigh, J.P. Fackler, Inorg. Chem. 32 (1993) 5582.[99] J.P. Fackler, C.J. McNeal, L.H. Pignolet, R.E.P. Winpenny, J. Am. Chem. Soc. 111 (1989) 6434.
[100] G. Schmid, Chem. Rev. 92 (1992) 1709 and references therein.[101] M. Barber, R.S. Bordoli, R.D. Sedgwick, A.N. Tyler, J. Chem. Soc. Chem. Commun. (1981) 325.[102] C. Fenselau, R.J. Cotter, Chem. Rev. 87 (1987) 501.[103] T.J. Kamp, Coord. Chem. Rev. 125 (1993) 333.[104] J.L. Haggitt, D.M.P. Mingos, J. Chem. Soc. Dalton Trans. (1994) 1013.[105] K. Lee, J.R. Shapley, Organometallics 17 (1998) 4368.[106] L.Q. Ma, U. Brand, J.R. Shapley, Inorg. Chem. 37 (1998) 3060.[107] P.D. Boyle, B.J. Johnson, B.D. Alexander, J.A. Casalnuovo, P.R. Gannon, S.M. Johnson, E.A.
Larka, A.M. Mueting, L.H. Pignolet, Inorg. Chem. 26 (1987) 1346.[108] R.C.B. Copley, D.M.P. Mingos, J. Chem. Soc. Dalton Trans. (1996) 491.[109] T. Chihara, L.P. Yang, Y. Esumi, Y. Wakatsuki, J. Mass Spec. 30 (1995) 684.

931B.F.G. Johnson, J.S. McIndoe / Coordination Chemistry Re6iews 200–202 (2000) 901–932
[110] S.M. Malinak, L.K. Madden, H.A. Bullen, J.J. McLeod, D.C. Gaswick, Inorg. Chim. Acta 278(1998) 241.
[111] F. Hillenkamp, M. Karas, R.C. Beavis, B.T. Chait, Anal. Chem. 63 (1991) 1193.[112] M. Karas, U. Bahr, A. Ingendoh, F. Hillenkamp, Angew. Chem. Int. Ed. Engl. 28 (1989) 760.[113] D.C. Muddiman, R. Bakhtiar, S.A. Hofstadler, R.D. Smith, J. Chem. Educ. 74 (1997) 1288.[114] M.J. Dale, P.J. Dyson, B.F.G. Johnson, P.R.R. Langridge-Smith, H.T. Yates, J. Chem. Soc.
Chem. Commun. (1995) 1689.[115] M.J. Dale, P.J. Dyson, B.F.G. Johnson, C.M. Martin, P.R.R. Langridge-Smith, R. Zenobi, J.
Chem. Soc. Dalton Trans. (1996) 771.[116] G. Critchley, P.J. Dyson, P.R.R. Langridge-Smith, B.F.G. Johnson, J.S. McIndoe, R.K. O’Reilly,
Organometallics 18 (1999) 4090.[117] P.J. Dyson, A.K. Hearley, B.F.G. Johnson, J.S. McIndoe, P.R.R. Langridge-Smith, Inorg. Chem.
Commun. 2 (1999) 590.[118] P.J. Dyson, P.R.R. Langridge-Smith, B.F.G. Johnson, J.S. McIndoe, unpublished results.[119] M.E. Barr, B.R. Adams, R.R. Weller, L.F. Dahl, J. Am. Chem. Soc. 113 (1991) 3052.[120] A. Bjarnason, R.E. Desenfants, M.E. Barr, L.F. Dahl, Organometallics 9 (1990) 657.[121] S. Martinovic, L.P. Tolic, D. Srzic, N. Kezele, D. Plavsic, L. Klasinc, Rapid Commun. Mass
Spectrom. 10 (1996) 51.[122] N.C. Dopke, P.M. Treichel, M.M. Vestling, Inorg. Chem. 37 (1998) 1272.[123] R.W. McGaff, R.K. Hayashi, D.R. Powell, P.M. Treichel, Polyhedron 17 (1998) 4425.[124] C. Kim, I. Jung, Inorg. Chem. Commun. 1 (1998) 427.[125] C. Kim, I. Jung, J. Organomet. Chem. 588 (1999) 9.[126] J.H. Elnakat, K.J. Fisher, I.G. Dance, G.D. Willett, Inorg. Chem. 32 (1993) 1931.[127] J.H. Elnakat, I.G. Dance, K.J. Fisher, D. Rice, G.D. Willett, J. Am. Chem. Soc. 113 (1991) 5141.[128] I.G. Dance, K.J. Fisher, G.D. Willett, J. Chem. Soc. Dalton Trans. (1997) 2557.[129] S.A. Hofstadler, R. Bakhtiar, R.D. Smith, J. Chem. Educ. 73 (1996) A82.[130] M. Dole, L.L. Mack, R.L. Hines, R.C. Mobley, L.D. Fergusson, M. Alice, J. Chem. Phys. 49
(1968) 2240.[131] J.B. Fenn, M. Mann, C.K. Meng, S.F. Wong, C.M. Whitehouse, Mass Spectrosc. Rev. 9 (1990)
37.[132] J.B. Fenn, M. Mann, C.K. Meng, S.F. Wong, C.M. Whitehouse, Science 246 (1989) 64.[133] I. Jardine, Nature 345 (1990) 747.[134] M. Yamashita, J.B. Fenn, J. Phys. Chem. 88 (1984) 4451.[135] R. Colton, A. D’Agostino, J.C. Traeger, Mass Spectrosc. Rev. 14 (1995) 79.[136] V. Katta, S.K. Chowdbury, B.T. Chait, J. Am. Chem. Soc. 112 (1990) 319.[137] R. Colton, J.C. Traeger, Inorg. Chim. Acta 201 (1992) 153.[138] D.K. Walanda, R.C. Burns, G.A. Lawrance, E.I. von Nagy-Felsobuki, J. Chem. Soc. Dalton
Trans. (1999) 311.[139] W. Henderson, B.K. Nicholson, L.J. McCaffrey, Polyhedron 17 (1998) 4291.[140] M. Ferrer, R. Reina, O. Rossell, M. Seco, G. Segales, J. Organomet. Chem. 515 (1996) 205.[141] R. Reina, O. Riba, O. Rossell, M. Seco, P. Gomez-Sal, A. Martın, Organometallics 16 (1997)
5113.[142] P.D. Mlynek, L.F. Dahl, Organometallics 16 (1997) 1655.[143] W. Henderson, J.S. McIndoe, B.K. Nicholson, P.J. Dyson, J. Chem. Soc. Dalton Trans. (1998)
519.[144] D.J.F. Bryce, P.J. Dyson, B.K. Nicholson, D.G. Parker, Polyhedron 17 (1998) 2899.[145] Y.Y. Choi, W.-T. Wong, J. Chem. Soc. Dalton Trans. (1999) 331.[146] A.M. Bond, R. Colton, J.C. Traeger, J. Harvey, Inorg. Chim. Acta 212 (1993) 233.[147] R.A. Croft, D.N. Duffy, B.K. Nicholson, J. Chem. Soc. Dalton Trans. (1982) 1023.[148] D.N. Duffy, K.M. Mackay, B.K. Nicholson, R.A. Thomson, J. Chem. Soc. Dalton Trans. (1982)
1029.[149] C.E. Evans, B.K. Nicholson, Personal communication.[150] B.K. Nicholson, Personal communication.

932 B.F.G. Johnson, J.S. McIndoe / Coordination Chemistry Re6iews 200–202 (2000) 901–932
[151] W. Henderson, J.S. McIndoe, B.K. Nicholson, P.J. Dyson, J. Chem. Soc. Chem. Commun. (1996)1183.
[152] J.S. McIndoe, B.K. Nicholson, J. Organomet. Chem. 573 (1999) 232.[153] W. Henderson, B.K. Nicholson, J. Chem. Soc. Chem. Commun. (1995) 2531.[154] H. Hori, J. Ishihara, K. Koike, K. Takeuchi, T. Ibusuki, O. Ishitani, Chem. Lett. (1997) 273.[155] S. Chand, R.K. Coll, J.S. McIndoe, Polyhedron 17 (1998) 507.[156] C. Decker, W. Henderson, B.K. Nicholson, J. Chem. Soc. Dalton Trans. (1999) 3507.[157] J.N. Nichols, M.D. Vargas, Inorg. Synth. 28 (1990) 289.[158] L.A.P. Kane-Maguire, R. Kanitz, M.M. Sheil, J. Organomet. Chem. 486 (1995) 243.[159] A. van den Bergen, R. Colton, M. Percy, B.O. West, Inorg. Chem. 32 (1993) 3408.[160] P.J. Dyson, B.F.G. Johnson, J.S. McIndoe, P.R.R. Langridge-Smith, Rapid Commun. Mass
Spectrom. 14 (2000) 311.
.