Embed Size (px)
Citation preview

Seattle Department of Transportation
SAFE ROUTES TO SCHOOL (SRTS)RACIAL EQUITY ANALYSIS REPORT
August 2019

CONTENTS
3 Acknowledgements
4 Introduction
5 Key Learnings
6 Childhood Health Lasts a Lifetime: Safe Routes to School Matter
10 SRTS Evolving Approach to Prioritizing
Infrastructure Investments
12 Community Engagement Process
17 Challenges to this Community Engagement Process
18 Who We Heard From
19 How Students Get To and From School
20 Barriers to Walking and Biking to School
28 Root Causes: Why Do These Barriers Exist for Communities of Color?
30 Strategies for Racial Equity and Inclusive Safe Routes to School
Programming
36 Unresolved Issues
37 Conclusion
Acronyms Included in this ReportPOC: Person/people of color RSJI: Race and Social Justice Initiative SDOT: Seattle Department of Transportation SPS: Seattle Public Schools SRTS: Safe Routes to School
38 Appendix A: Citywide Survey
40 Appendix B: School and Community Organization Partnerships & Community Events Attended
41 Appendix C: Citywide Survey Demographic Data
48 Appendix D: Transportation Data from the Citywide Survey
57 Appendix E: Memo of Summarized Findings from the Citywide Survey
59 Appendix F: Examples of Racial Equity Work Pertaining to Safe Routes to School Programs

SAFE ROUTES TO SCHOOL RACIAL EQUITY ANALYSIS REPORT | 3
ACKNOWLEDGEMENTS
On behalf of the Seattle Department of Transportation (SDOT), we would like to express our sincere gratitude and appreciation to those who assisted, partnered or engaged with the Safe Routes to School Racial Equity Analysis. This project is made possible only by the amazing individuals of Seattle. SDOT and the Safe Routes to School team remains humbled, dedicated, and excited to create better opportunities for our students.
Figure 1: Left to right: SDOT employees, Elise Rasmussen, Mitchell Lloyd, Belen Herrera; attending Dunlap Elementary School’s Health Foods and Family Fitness Night in the Rainier Beach neighborhood.
A heartfelt thank you to:• The Concord Elementary School Family• The Aki Kurose Middle School Family• The Wing Luke Elementary School Family• The West Seattle Elementary School Family• The Dearborn Park Elementary School
Family• The Dunlap Elementary School Family• The Rainier Beach High School Family• The Dr. Martin Luther King Jr. Elementary
School Family• The Emerson Elementary School Family• The Van Asselt Elementary School Family• African American Festival• Ethiopian Community of Seattle• Southeast Seattle Education Coalition• Refugee Women’s Alliance (ReWA)• Seattle Housing Authority• The Beacon Hill Community• The Rainier Beach Community• The High Point Community• Rainier Beach Action Coalition• South Park Community• SeaMar Community Health Centers• SRTS REA Steering Committee• Seattle School Traffic Safety Committee• SDOT Interns: Elise Rasmussen, Sarah
Bartosh, Rachel Yahn, Carrie White, JamieCarlson & Amber Berg

4 | SEATTLE DEPARTMENT OF TRANSPORTATION
INTRODUCTION
The goal of Seattle Department of Transportation’s (SDOT) Safe Routes to School (SRTS) program is to increase safe walking and biking to school. Unfortunately, many students encounter barriers at home and at school that make walking and biking difficult. The City of Seattle is also working to end institutional racism and race-based disparities in City government and throughout Seattle. To meet these significant goals, we performed a racial equity analysis to better understand how we can increase and improve options for safe walking and biking to school, particularly for Seattle’s students of color.
In addition to gaining a better understanding of the barriers to walking and biking to school, the SRTS team worked closely alongside communities of color to create potential solutions addressing the challenges their respective communities identified. Beyond improvements to transportation infrastructure (e.g. new crosswalks), we also focused on concerns pertaining to public safety, distance, weather, and access to bicycles. Through a citywide survey, focus groups and coffee chats, and one-on-one interactions with community members at nearly 70 community events in communities of color, SRTS staff learned about Seattle’s students’ and families’ lived experiences, choices and perceptions, and the decisions they make about getting to and from school every day.
In addition to sharing their lived experiences, communities of color in Seattle provided racial justice-oriented recommendations for the SRTS program that City staff captured in this report. These recommendations aim to make walking and biking a widely-used mode of transportation among all of Seattle’s students.
Seattle’s Safe Routes to School program is committed to taking a racial justice-driven approach to promote more active commuting among students because all children have the right to health, happiness, and academic success, regardless of race.
Safe Routes to School VisionThe Seattle Department of Transportation’s vision for Seattle’s school children is to start their day experiencing the benefits of walking and biking to school, including:
• Having fun• Feeling safe• Strengthening connections to their
communities• Arriving to school in time for breakfast and
ready to learn• Improved physical and mental health
To support Seattle’s effort to end institutionalized racism and build a more equitable city, SRTS staff are focused on students in these groups:
• Communities of color• Low-income communities• Immigrant and refugee communities• People with disabilities• People experiencing homelessness or
housing insecurity• The LGBTQ community• Girls

SAFE ROUTES TO SCHOOL RACIAL EQUITY ANALYSIS REPORT | 5
KEY LEARNINGS
3. Promoting EquitableInvestments in Communitiesof ColorNeighborhood improvements
such as new sidewalks or bike lanes increase neighborhood desirability which can lead to increasing nearby rents and home values that result in an increased risk for gentrification and displacement, yet, all Seattle communities deserve walkable and bikeable neighborhoods regardless of race or income. SRTS staff are committed to fulfilling SDOT’s mission to deliver a high-quality, equitable transportation system that works to avoid the unintended consequences of new development in a way that truly serves all of Seattle’s residents.
4. How to Collaborate withCommunities EffectivelySafe Routes to School staff workedclosely with numerous community
partners to foster long-term partnerships. Thoughtfully investing in community relationship building was a top priority of this project, and City staff greatly appreciated the honesty, patience, and investment from various communities around Seattle.
SRTS staff learned a great deal from communities about their daily lived experiences using Seattle’s transportation options, and also learned an incredible amount about best practices for inclusive community engagement. The following four areas summarize City staff’s major takeaways from this two-year process:
1. Barriers to Getting toSchool SafelySeattle residents shared thechallenges of getting students to
and from school each day through the SRTS citywide survey and at the nearly 70 community events in communities of color that SRTS staff attended. Community stories and input provided detailed nuances about the lived experiences and access to, or perceptions of, various transportation options for Seattle’s students across races, ethnicities, cultures, communities, and neighborhoods.
2. Recommendations toRemove BarriersThe recommendations in this reportare community-generated because
SRTS staff were committed to working alongside communities of color throughout this project to inform next steps for Seattle’s SRTS program. Community leaders provided recommendations based on their respective communities’ perspectives and lived experiences to authentically and effectively address infrastructure, distance, safety, bike access, and policy barriers.

6 | SEATTLE DEPARTMENT OF TRANSPORTATION
CHILDHOOD HEALTH LASTS A LIFETIME: SAFE ROUTES TO SCHOOL MATTERS
leading killer responsible for one in four American deaths: cardiovascular disease.
• Nationally, Black and Latinx children havehigher obesity rates and tend to have theleast access to parks, playgrounds, walkablestreets, or other fixtures in the builtenvironment that promote physical activity
• Nationally, nearly 25% of Black youth aregetting less than the recommended hour ofdaily physical activity, compared to 13% ofWhite youth
Student walk and bike rates have sharply declined nationally while youth obesity has almost quadrupled over the last four decades, and this epidemic has disproportionately affected youth of color. Seattle is no exception. Walk and bike rates increased 60% from 2005 to 2015 in Seattle, however, schools with high percentages of students of color have lower walking and biking rates than schools with fewer than 50% students of color (Figure 2).
Investing in Safe Routes to School means investing in an entire community’s physical, mental, and emotional health that will carry over to future generations.
The following section links Safe Routes to School to improved student and community health outcomes. SRTS programming in Seattle is one tool which we, as a city, can use to combat the current health challenges we face through promoting a more active lifestyle on both individual and community levels.
Direct Link Between Active Transportation and Lifelong Health Outcomes The United States is currently experiencing a national obesity epidemic among adults and youth, which is directly linked to the nation’s
2015 Seattle Student Bike and Walk Percentages by Race
Schools with more than50% Students of Color
WalkBike
Schools with less than50% Students of Color
25%
20%
15%
10%
5%
0%
Figure 2. 2015 Seattle Student Bike an Walk Percentages by Race

SAFE ROUTES TO SCHOOL RACIAL EQUITY ANALYSIS REPORT | 7
Students that walk and bike to school are likely to get the recommended 60 minutes of moderate to vigorous physical activity each day that health professionals recommend. Physical activity not only contributes to improved physical health, it is also directly linked to improved mental health, self-esteem,
67%
1 mile
of the daily recommended 60 minutes of physical activity
Less time in the car means more time for physical activity. Safer routes to school benefit all community members within a neighborhood through reducing traffic-related air pollution, which is linked to asthma and cardiovascular and respiratory diseases. Transportation infrastructure improvements like creating a
more connected network of sidewalks also allow pedestrians to avoid busy streets and reduces the risk of traffic collisions. Research shows that the availability of multiple safe pathways to school results in a higher likelihood of families choosing “active” modes of transportation, such as walking and biking.
mood, quality of sleep, and academic performance. Physical movement also significantly reduces stress, anxiety, depression and fatigue, which then reduces the risk for obesity, cancers, diabetes, strokes, and respiratory and cardiovascular diseases later in life.
Figure 3. Students who walk or bike a mile to and from school are likely to achieve the daily recommended physical activity.

8 | SEATTLE DEPARTMENT OF TRANSPORTATION
Percent Chronic SeattleTotal
Students
Number Chronically
AbsentAll SPS Students 57,057 7,386American Indian/Alaskan Native 408 118Asian 8,585 862Black/African American 9,392 1,874Hispanic/Latino 7,266 1,266Native Hawaiian/Other Pacific Islander 281 112Two or More Races 5,358 652White 25,767 2,502
12.9%28.9%
10%20%
17.4%39.9%
12.2%9.7%
Figure 4. Chronic Absenteeism in Seattle Public Schools by Race in 2016 (Chronic Absenteeism is defined as missing at least three weeks of school in an academic year).
Improving Safe Routes to School Means Increasing School Attendance & Academic Performance For many of Seattle’s students, walking and biking is the only reliable mode of transportation to school directly linking SRTS programming, policies, and investments to improved school attendance, access to free breakfast, and overall academic performance. Currently the Seattle Public School District’s underfunded transportation budget means regular two-hour school bus delays, or for many of Seattle’s students, no school bus service at all. Students of color are most likely to be chronically absent, defined as missing more than three weeks of school in a given academic year.
In 2016, 40% of Native Hawaiian and Pacific Islander students, 29% of American Indian and Alaskan Native students, 20% of Black students, and 17% of Latinx students were chronically absent, compared to 10% of White students in Seattle Public Schools.
Student attendance rates are heavily influenced by caretakers’ ability to provide reliable transportation for their student. Families that are fortunate enough to have flexible work schedules have cited taking over 100 vacation hours from work to accommodate getting their students to school. Majority White schools in Seattle tend to
have Parent Teacher Associations (PTA) with more robust financial resources and social networks with the flexibility to provide transportation for students by organizing volunteers for programs such as walking school buses or a carpooling system than schools that predominately serve students of color.

SAFE ROUTES TO SCHOOL RACIAL EQUITY ANALYSIS REPORT | 9
Income is also a contributing factor to safely getting to and from school. Race and income are inextricably linked due to the institutional racism that has systematically stripped resources from people of color, such as a quality education to prepare the next generation’s highly skilled workforce, or affordable and adequate homes in healthy neighborhoods that contribute to wealth accumulation over generations. Higher income households are also more likely to have flexibility with work demands (e.g. paid vacation time) or even a stay-at-home parent that supports their family in non-monetary ways such as providing reliable transportation to school, preparing healthy meals, or participating in the school PTA.
Improper nutrition, including a lack of adequate amounts of food, directly reduces a student’s ability to perform at their peak academic potential. Access to healthy meals is a concern
for many Seattle families, and getting to school on time is imperative to receiving free school breakfast. Students of color disproportionately receive Free-or-Reduced Priced Lunch in Seattle due to their low incomes, and many families depend on this free or low-cost meal to feed their students. Having a reliable route to school ensures that these students can arrive on time for school breakfast where they can positively engage with their peers and teachers to prepare them for a meaningful and productive school day.
Figure 5. Percentage of Seattle’s Students with Free-or-Reduced Price Lunch by Race in 2016
Black 84% Hispanic 64%Native American 69%Asian/Pacific Islander 52% White 10%

10 | SEATTLE DEPARTMENT OF TRANSPORTATION
SRTS’ EVOLVING APPROACH TO PRIORITIZING INFRASTRUCTURE INVESTMENTS
This section discusses the evolution of the SRTS project prioritization policy since the beginning of the SRTS program in Seattle in 2007. The reality of transportation planning in any city or town is that there are often too many infrastructure improvement projects for the resources that are available and this reality is certainly true of Seattle’s SRTS program. In an effort to provide and promote an equitable transportation system in Seattle, the SRTS program prioritizes schools for safety improvements based on Pedestrian Master Plan data, collision data, and equity data.More information about this prioritization system can be found in the Safe Routes to School Action Plan.
Previous Prioritization ProcessesSeattle’s Safe Routes to School project prioritization process has substantially evolved since its start in 2007.
Project prioritization did not specifically consider race when prioritizing investments. Instead, prioritization was based exisitng infrastructure needs within specific city sectors resembling council districts.
2007
SRTS began to integrate the percentage of students eligible for Free-or-Reduced Price Lunch by school as a factor in the project prioritization system.
2012
2015
Voters approved the Move Seattle Levy mandating that each public school in Seattle will get a SRTS engineering improvement by 2024. This requirement currently informs the project prioritizations and investment decisions.
2016
SRTS Action Plan adopted that created the current prioritization process which heavily weighs race.

SAFE ROUTES TO SCHOOL RACIAL EQUITY ANALYSIS REPORT | 11
Current Prioritization ProcessThe Safe Routes to School program uses weighted prioritization criteria to determine upcoming infrastructure improvement projects. Race is the main criterion, defined as the percentage of students of color at a school. For more information about the current prioritization criteria, visit the Safe Routes to School Action Plan Prioritization Process.
The purpose of conducting this racial equity analysis was to better understand complexities pertaining to physical barriers and public safety
barriers that hinge on racial, cultural, ethnic, and language differences to inform future infrastructure investments. SRTS staff recognize that this program can continue to improve the ways in which it accounts for race when prioritizing infrastructure investments. Currently race data are categorized by the percentage of students of color or non-White Hispanic students at a school, and the SRTS program acknowledges that there are nuanced barriers to walking and biking to school within various communities of color, cultures, or ethnicities that go beyond the physical infrastructure.

12 | SEATTLE DEPARTMENT OF TRANSPORTATION
COMMUNITY ENGAGEMENT PROCESS
SRTS staff worked to achieve an inclusive outreach and public engagement process that included a multi-pronged approach to reaching and communicating with communities of color, immigrants, refugees, and English Language Learners. Community-based organizations and schools that predominately serve communities of color were the backbone of this racial equity analysis. Another goal of this process was to identify the ways in which SDOT can support the outstanding work that already exists in communities.
The SRTS team identified potential community-based organizations and schools through consultation with SDOT’s Race and Social Justice Initiative (RSJI) Change Team, the SRTS Racial Equity Analysis Steering Committee, the Department of Neighborhoods Community Liaisons, and the Seattle Public Schools Equity and Race Advisory Committee.

SAFE ROUTES TO SCHOOL RACIAL EQUITY ANALYSIS REPORT | 13
SRTS staff used three approaches to identify key community stakeholders invested in students of color:
• School-based approach: Identified priorityschools based on their racial, ethnic, andlanguage diversity with feedback fromSeattle Public Schools.
• Geographic-based approach: Identifiedpriority community groups located inneighborhoods of color, such as RainierBeach, Chinatown-International District,South Park, and the Central District.
• Racial and Ethnic group-based approach:Identified priority community groups thatserve specific racial and ethnic groups,regardless of geographic boundaries.
Overview of Data Collection MethodsThe following is an overview of the ways in which the SRTS team engaged with communities. This section, and subsequent sections, will describe each method in greater detail.
1. A citywide survey (Appendix A) was mailedto all households in Seattle with school-agechildren, and was also available online innine languages. The purpose of this surveywas to provide an opportunity for input forall Seattle residents about the barriers theyface getting students to and from school.
2. Dot surveys were completed at in-personevents in communities of color. Thepurpose of this method was to quicklyget input about the barriers communitiesface in a setting that is less conducive to alonger survey (e.g. a community festival ora school lunch period).
3. Focused outreach consisted of communityconversations, coffee chats, and focusgroups with community organizations,schools (e.g. students, parents, staff, PTA),and community members at events. Thepurpose of this method was to understandthe lived experiences when commuting toschool, and to dive deeper into the nuancespertaining to barriers that the surveycould not capture. For a complete list ofcommunity partners, refer to Appendix B.
SRTS Racial Equity Analysis Process & TimelineThe Safe Routes to School Racial Equity Analysis was a two-year process that required community engagement and stakeholder feedback throughout.
Analyzed data on how SRTS has served communities in the past and data on race and languages spoken at home to inform the schools and neighborhoods to prioritize during Phase I
Additionally, conducted a focus group with Community Liaisons from the Department of Neighborhoods to provide feedback on our outreach approach
Phase I: Involved people impacted by our program through conversations and surveys
Partnered with specific schools and organizations based on their students’ racial, ethnic, and language diversity
Conducted citywide & focused outreach informed by data analysis in Fall of 2017
Phase II: Worked with communities to develop new strategies and partnerships to reach our racial equity vision
Phase III: Identified evaluation metrics to measure our progress toward this vision
Phase IV: Reported findings and next steps toward racial equity to communities
FALL2017
WINTER2019
2018
SUMMER2019
SPRING2019

14 | SEATTLE DEPARTMENT OF TRANSPORTATION
Phase I, Part A: Citywide SurveyThe citywide survey had 2,276 respondents and was released twice: the last month of the 2017-2018 school year and the first month of the 2018-2019 school year. Refer to Appendix C for survey respondent demographic data.
Purpose: The purpose of this survey was to reach the larger Seattle public to understand the barriers to walking and biking to school in the city.
The SRTS staff used the following strategies to promote the citywide survey:
• Partnered with neighborhood and ethnicmedia outlets and organizations that servecommunities of color to advertise the survey
• Worked with priority schools andcommunity organizations based on raceand language demographics to identifyappropriate methods for reaching theirrespective communities
• Mailed the survey to all households withschool-age children in Seattle (41,612households total), with a postage-paidreturn envelope
• Attended nearly 70 community events toprovide multiple opportunities to learnabout the racial equity analysis and take thecitywide survey. We had interpreters at manyof these events to translate conversationsbetween SRTS staff and communitymembers, and to guide individuals throughthe survey who do not read in their firstlanguage.
• Created an online version of the survey viathe survey platform, Survey Monkey
• Offered the survey in nine languagescorresponding to the most frequentlyspoken languages in Seattle
• Created a separate high school studentversion of the survey to understand thebarriers specific to this age demographic
• Printed copies of the survey for priorityschools and community organizationsin requested languages to address anytechnology barriers. SRTS staff coordinatedwith schools and organizations to bringsurveys to the school and pick up completedsurveys so schools and organizations did nothave to take on that burden
• Compensated as many communitymembers as possible for their time spenttaking our survey
Phase I, Part B: Dot Surveys The dot survey had nearly 600 responses, and focused on the question: What makes it hard for you or your students to walk and bike to school? Community members selected from ten barriers by placing a sticker on each barrier that corresponded to their lived experiences; they could also write an alternative response if their lived experience was not represented among the options on the board.
Purpose: Dot surveys revolutionized the data collection process, and created a more accessible input opportunity for communities of color. The dot survey took less than a minute, making it possible to reach more community members, and youth as young as five were able to participate because it was a relatively simple exercise. The dot surveys often stimulated rich conversations between SRTS staff and community and community members.

SAFE ROUTES TO SCHOOL RACIAL EQUITY ANALYSIS REPORT | 15
The Safe Routes to School staff used the following strategies to promote the dot surveys:
• Worked with priority schools andcommunity organizations to identifyappropriate methods and opportunities forreaching their respective communities
• Brought the dot surveys to dozens ofcommunity events or school dismissal,arrival, and lunch periods
• Translated the dot survey into languagesother than English
• Compensated all participants with bike lightsor blinking lights for pedestrians that theycould attach to their jackets or backpacks
Phase I, Part C: Focused Outreach Purpose: Focused outreach provided more insight into the lived experiences that the citywide survey or dot survey could not quite capture. As a part
of the focused outreach process, the SRTS team conducted focus groups with various community leaders in communities of color, and also hosted coffee chats—or informal conversations with coffee and refreshments—with community members in partnership with schools and community organizations that primarily serve students of color. Community stories and experiences greatly added to the richness and specificity of the Racial Equity Analysis findings and recommendations for the future of the Safe Routes to School program. SRTS staff worked closely with schools and community organizations (Appendix B) to carefully plan for any focused outreach event to ensure that each event catered specifically to that community’s needs (e.g. having translators for specific languages, or making sure the event date did not interfere with cultural or religious priorities) and preferences for engaging with local government.
Figure 6. Example of a “dot survey”. Poster boards were available in other languages when attending community events with specific language needs.

16 | SEATTLE DEPARTMENT OF TRANSPORTATION
Figure 7. Coffee chat event at an organization that builds community and power among Seattle’s Ethiopian community. The event had an interpreter, and SDOT purchased food and coffee from the organization’s café. Thoughtful planning and partnership contributed to a much more relaxed atmosphere where individuals were willing to share their personal stories about the barriers getting their students safely to and from school.
Phase II: Community-Driven Strategy Identification & Closing the LoopPurpose: After listening to community members about the barriers to walking and biking school, Phase II provided a natural opportunity to share the findings from Phase I (surveys and focused outreach) with community leaders to ensure City staff correctly heard and understood their
respective communities. The second major focus of Phase II conversations was to listen to community leaders’ ideas for potential solutions to the barriers that their communities face. Community leaders, unsurprisingly, had several recommendations that were specific and actionable.

SAFE ROUTES TO SCHOOL RACIAL EQUITY ANALYSIS REPORT | 17
CHALLENGES TO THIS COMMUNITY ENGAGEMENT PROCESS
Language and LiteracyMany of our respondents speak and read languages other than English.
Translators were almost always present at community outreach events, and the survey was translated into nine different languages, but there were still several missed opportunities to get community perspectives due to language and literacy barriers. SRTS staff acknowledge these shortcomings in engaging all of Seattle’s residents, and are continually working to reach truly inclusive outreach approaches.
Digital DivideOf the 32% of respondents who completed the survey online, most everyone who completed the online
survey were White, well-educated, and had annual household incomes exceeding $150,000. SRTS staff carefully examined the accessibility of various mediums (e.g. paper survey, online survey, focus groups, etc.) with subsets of Seattle’s population to create a variety of other engagement opportunities to provide input about the barriers to walking and biking to school. This racial equity analysis demonstrated what SRTS staff already knew to be true: inclusive public engagement incorporates much more than asking the public to complete a survey.
PrivacyThe citywide survey included a limited set of questions in order to protect
respondents’ privacy. A key priority of this racial equity analysis was to keep survey responses anonymous by asking questions that could not be disaggregated to the individual level, so SRTS staff omitted several desired questions from the survey.
Mailing SurveysThis project included SDOT’s first attempt to mail a citywide survey to a subset of Seattle’s population:
households with school-age students. Mailing the survey was highly effective and greatly contributed to the volume and range of responses. However, this was an imperfect process in which several households without school-age students also received the survey, causing a small amount of public confusion.

18 | SEATTLE DEPARTMENT OF TRANSPORTATION
WHO WE HEARD FROM
Figure 8. Race group designations asked in citywide survey versus groups used in this report. Survey respondents were asked to describe their student’s race or ethnicity by checking one or more boxes corresponding to the race groups in the left column. There was also a write-in opportunity if the options did not fully describe the student’s race or ethnicity. Some groups in the left column were then combined (right column) for reporting purposes when necessitated by the small numbers of respondents in that group. All groups except for White only Non-Hispanic were then included as People of Color (POC) in the report.
The survey was mailed to 41,612 households with children within the City of Seattle and was also shared online through community organizations that work with people of color (POC) located in Appendix B. Of all responses, 68% were completed by mail and 32% were completed online (Appendix C). When examining race, ethnicity and culture, respondent counts from all racial and ethnic communities were disaggregated when statistically possible, but some groups with small numbers of respondents were combined with other groups for reporting purposes (Figure 8). Any community not listed in these combined groups or respondents who selected multiple races were included in the “Multiracial or Race(s) not listed” group.
A comprehensive breakdown of citywide survey respondents by race, household income, and grade level is located in Appendix C.

SAFE ROUTES TO SCHOOL RACIAL EQUITY ANALYSIS REPORT | 19
HOW STUDENTS GET TO AND FROM SCHOOL
Although racial differences in how students travel to school were not statistically significant across any age group, different groups face different barriers, and disparities across race and grade level do exist (Figure 9).
• Cars are the most popular mode of transportation: Across all races and grade levels, car/carpool is the most frequent mode of transportation used getting to and from school among Seattle’s students (61%), which may influence parent and guardian work schedules for many families across the city.
• Racial disparities in student walking rates: White elementary school students have the highest rates of walking to school over any other group at 33%, whereas only 23% of
their POC elementary school peers walk, the lowest walking rate of any group. POC elementary schoolers are also the most likely to rely on a car/carpool to get to school than any other group (53%).
• Public transit is widely used among older students: Students use public transit at higher rates as they get older. Universal ORCA cards for all high school students makes accessing the Metro Bus much easier, resulting in fewer students relying upon personal vehicles than previous years. On the other hand, some respondents reported that bus schedules are not well-aligned with school schedules, citing instances of waiting an hour between buses to get to school.
Figure 9. Mode of transportation broken down by age group and by students who identify as POC (solid) versus White (unfilled). Data from the citywide survey indicated how students traveled to and from school each day for the week leading up to taking the survey. Percentages for each day and group were averaged to find the average percent of students using each mode of transport over the course of a week.

20 | SEATTLE DEPARTMENT OF TRANSPORTATION
BARRIERS TO WALKING AND BIKING TO SCHOOL
influencing factors.1 For a more detailed analysis, Appendix D includes more transportation data derived from the citywide survey and Appendix E is a memo that summarizes the key findings from the citywide survey.
The following section synthesizes findings from all three data collection methods, the citywide survey, dot survey, and focused outreach. The barriers that communities identified are grouped into five different categories: distance, infrastructure, safety, bicycling, and other
Figure 10. Dot Data gathered from community outreach identifying barriers that influence students’ decision to walk or bike to school. Numbers indicate the total absolute number of dots from all community outreach events (See Appendix B for outreach sites and events). Participants were able to select as many barriers as they wished. Barriers were then categorized into the categories used in this report (Distance, Infrastructure, Safety, and Bicycling).
1The citywide and dot surveys asked for information regarding trips to and from school without distinguishing between the two. However, for simplicity this report uses the language “to school” instead of “to/from school” to refer to the roundtrip commute.

SAFE ROUTES TO SCHOOL RACIAL EQUITY ANALYSIS REPORT | 21
COMMUNITY OUTREACH RESPONSESGiven the high proportion of survey responses that were completed by students and families who identify as White, dot surveys translated and interpreted in several different languages were administered at community outreach events in communities of color (Appendix B). This provided an opportunity to hear from individuals of color more directly about the barriers they face. Figure 10 shows the barriers identified during these events, grouped by category, and is referred to throughout this report. DISTANCE BARRIERS The Distance category is related to findings involving distance between a student’s home and school. Figures 11 and 12 include the citywide survey data pertaining to distance barriers.
• School is too far to walk or bike: Distance between a student’s school and home is the third most common factor that influences decisions to walk or bike to school, reported by 32% survey of respondents (Figure 11), and was overwhelmingly the most frequently cited barrier among students and families that participated in our dot survey with 132 total responses (Figure 10).
Most elementary school students, regardless of whether they identify as White or POC, live within a mile of their school (58% POC and 65% White). This group was the least influenced by distance in their decision to walk or bike to school. On the other hand, most high school students live 2+ miles from school (53% POC and 52% White) and were the most influenced by distance (Figure 11, 12). However, racial disparities in distance were more apparent for middle schoolers, with the largest number of White students living 1-2 miles from their school (41%), which is within the walking radius, while the largest contingent of students who are POC live 2+ miles from their school (42%), outside of the walking radius.
Figure 11. Students for whom distance is an influencing factor in their decision to walk or bike to school, broken down by grade group and students who identify as POC (solid) versus White (unfilled). Data were collected from the citywide survey where respondents were given the opportunity to identify as many factors as desired. Percentages represent the proportion of participants within each age and race group who identified distance as a barrier.
Longer distances are often attributed to housing instability or residential displacement, which was often mentioned in conversations during focused outreach. Community members reported that 20% to 30% of the annual student turnover in some Seattle Public Schools is due to students moving outside of the city as their families search for more affordable housing options. Compounding this issue, respondents who said distance influences their decision to walk or bike to school were also two times more likely to report that poor traffic safety also influences their decision.

22 | SEATTLE DEPARTMENT OF TRANSPORTATION
Figure 12. Reported distance between school and home for students broken down by age group and students who identify as POC (blue) versus White (purple). Data were collected from the citywide survey where respondents were asked to identify if they lived less than a half mile, ½ mile to less than 1 mile, 1 mile to less than 2 miles, or 2 miles or farther from school. The dotted line labeled ‘walking radius’ represents the school walk boundary for each grade group. Students living within the walk boundary are not eligible for Seattle Public Schools district arranged transportation.
INFRASTRUCTURE BARRIERSThe Infrastructure category is related to findings involving the physical environment existing in the public right-of-way.
• Busy and/or confusing intersections: In the citywide survey, busy or confusing intersections was the most common infrastructure barrier to walking or biking to school across all races (47% POC, 71% White and 66% overall), and was the biggest infrastructure-related barrier identified in the dot survey during community outreach (Figure 10). Multiple lane roadways with bus lanes and light rail tracks are especially concerning for young students.
During focused outreach, respondents emphasized the dangers of Rainier Ave, and how even crossing to or from the bus stop feels unsafe, to the point where traveling by bus is not perceived as a safe option.
• Missing/disconnected sidewalks: About a third of citywide survey respondents reported frequently encountering stretches of streets with disconnected, cracked, or missing sidewalks. Students in far North and South Seattle experience such conditions at much higher rates. Families specifically expressed concerns about missing sidewalks near arterial roads.

SAFE ROUTES TO SCHOOL RACIAL EQUITY ANALYSIS REPORT | 23
• Poor lighting: 23% of overall respondents reported that poor lighting influences their decision to walk/bike to school. 13% of overall respondents stated they experienced poor lighting on their route to school. Black/African American respondents were most influenced by poor lighting (33%). Lighting is especially an issue in the winter when it becomes dark by 4 pm.
When accounting for other influences like student and household characteristics, the following respondents were more likely to say poor lighting influences their route to school:
• Students who are influenced by poor traffic safety
• Students who are influenced by bullying • Students who are influenced by and have
experienced drug activity on their route • Students in temporary or unstable housing • Students who encounter sections that do
not have sidewalks when walking or biking to school
Of all the infrastructure improvements, improving lighting offers the broadest positive influence for addressing equity for students in the survey.
SAFETY BARRIERS The Safety category is related to concerns about public safety (e.g. violence, perceived threats, bullying, etc.) as opposed to infrastructure barriers that may also affect the safety of students.
• Lack of adult supervision: The most common barrier encountered by respondents for walking or biking to school is students crossing intersection(s) without adult crossing guards (50% POC, 68% White and 67% Overall). This is closely tied with parent(s)/guardian(s) work schedules, which was overall the most common influence on students’ decisions to walk or bike to school (Figure 13). In write-in responses, many reported having concerns about whether students would be capable of traveling to school without adult supervision, and that walking would
be a possibility if there was an adult to accompany the child to school. However, while parents expressed that established walking programs could be beneficial, some also noted they may not trust other adults with their children.
Write-in responses related to adult supervision were closely related to student gender. Guardians were more likely to write about concerns regarding young girls walking/biking alone than for boys. Written responses implied that girls were more vulnerable to being attacked, while guardians with boys were more likely to voice concerns about age and developmental maturity.
Figure 13. Safety factors related to adult supervision that influence students’ decision to walk or bike to school by age group and students who identify as POC (solid) versus White (unfilled). Data were taken from the citywide survey where respondents could select as many factors as they desired. Percentages indicate the proportion of respondents in each group who identified these factors as an influence.

24 | SEATTLE DEPARTMENT OF TRANSPORTATION
• Concerns about violence: While 14% of overall respondents reported that the threat of gang or gun violence influences their decision walk or bike to school, only 3% of overall respondents reported experiencing this kind of violence firsthand (Figure 14). Students of color are at least two times more likely to fear the occurrence of gang or gun violence during their commute than White students, with Black students being over three times more likely to have this potential threat influence their decision to walk or bike to school than White students (8% White vs 31% Black or African American). In the dot surveys, gang/gun violence was the second biggest barrier identified (Figure 10).
In citywide survey written responses, participants also referenced crime in broader terms. Sexual harassment was a concern, especially among students who are POC, although fewer people reported that their student had experienced this first-hand. For almost all the safety barriers, but especially those related to violence, Black or African American respondents were most likely to report being influenced by the perception of these dangers but were often the least likely to have experienced them firsthand. During focused outreach, community members noted that their neighborhoods are often portrayed in the media as unsafe, whereas crime data suggests that criminal activity has actually decreased in recent years.
Figure 14. Threats to safety experienced by students (solid bar) versus safety concerns that influence students’ decision to walk or bike to school (T-line), disaggregated by race. Data were collected from the citywide survey, in which respondents could select as many factors as desired. Respondents were asked to identify whether each factor influenced their decision to walk or bike to school (T-line) and whether they had actually experienced those conditions on their way to school (solid bar).

SAFE ROUTES TO SCHOOL RACIAL EQUITY ANALYSIS REPORT | 25
• Concerns about bullying: Students whobike to school are four times more likelyto have experienced bullying on theirroute to school, while students who walkto school are three times more likely tohave experienced bullying. Students whoidentify as POC are more likely to haveexperienced and be influenced by bullying(Figure 14). Black or African Americanstudents were most influenced by theperceived danger of bullying.
• Concerns about unfamiliar people and/or unpredictable behaviors: Concernsabout unfamiliar people, including peopleexperiencing homelessness, commonlyinfluence the decision for students towalk/bike to school (Figure 10). Theseconcerns also influence the routes ofstudents who do choose to walk or biketo school in order to avoid any evidence ofundesirable or unpredictable behaviors.However, many of those who wereconcerned reported that their studentshad not actually experienced instances inwhich unfamiliar people threatened theirsafety during their trip to school.
• Unjust criminalization of youth of colorand their guardians: Survey respondentsand community members shared instancesin which neighbors called law enforcementon youth of color without evidence ofcriminal activity, and some reporting thatpolice presence caused them to avoidcertain areas because they feel unsafe.Community members also reportedsituations in which neighbors called lawenforcement on guardians of color for lackof supervision while youth were walkinghome from school or playing in their ownneighborhoods, again, with no evidence ofcriminal activity.
BICYCLING BARRIERS The Bicycling category is related to findings involving bike access, infrastructure and education (Figure 15).
• Biking is not an option: More students ofcolor never bike to school because it isnot an option for them (52%), compared totheir White peers (37%). The most commonreasons why biking is not an option are:no access to affordable bikes, lack of bikestorage options and concerns about bicycletheft, minimal bicycle infrastructure (e.g.bike lanes) along their routes, and a lackof trust between predominately Whitebicycle advocates and communities of color.Lack of access to a bike was identifiedas a common barrier to biking to schoolaccording to the dot surveys conductedduring community outreach (Figure 10).The citywide survey showed parents/guardians with fewer years of formaleducation were over two times more likelyto say owning/affording a bike influencesstudents’ walking or biking to school. Blackand African American students and Latinxstudents were two times more likely to notown a bicycle or not be able to afford one.Additionally, concern regarding a student’sability to follow the rules of the road wasespecially high among Black and AfricanAmerican respondents (24%) (Figure 15).
• Lack of bicycle infrastructure: 33% POC,71% White, and 54% for overall surveyrespondents reported that missing bicyclelanes impact their ability to ride a bike; thiswas the second largest barrier to walkingor biking to school across all racial groups.Until Seattle’s separated or protectedbicycle lane network is further developed,student cyclists who are still learning therules of the road may encounter sectionsalong their routes where they are bicyclingnext to vehicles.

26 | SEATTLE DEPARTMENT OF TRANSPORTATION
Figure 15. Barriers that influence students’ decision to bike to school broken down by race. Data were collected from citywide survey where respondents could select as many factors as they felt applied. Percentages represent the proportion of respondents who selected each barrier from each racial group.
OTHER INFLUENCING FACTORS The Other category includes key findings outside of Infrastructure, Distance, Safety, or Bicycling categories.
• Weather: Over 60% of respondents (64% POC, 63% White) who normally walk or bike to school were deterred or prevented from walking or biking due to cold or rainy weather. For immigrants, refugees, and other Seattle newcomers, weather conditions can be drastically different from what they are used to, and they may not have appropriate weather gear.
• Physical limitations: Both students of color and White students may have difficulty walking and biking to school due to physical limitations. The challenging terrain and distance students must travel during a commute can be difficult to overcome for students with mobility needs, and this becomes especially challenging when considering the compounded effects of multiple barriers that communities of color face when attempting to walk or bike to school.

SAFE ROUTES TO SCHOOL RACIAL EQUITY ANALYSIS REPORT | 27
• Before- and after-school activities: Factoring extracurricular activities into transportation decisions is more of an influence for White students than their POC peers across all grade levels. It is the second most common influence on White students’ decision to walk or bike to school and the third most common influence for students who are POC. Overall, high school students were twice as likely to report before- or after-school activities influence their transportation options than elementary school students (Figure 16). Respondents, especially high schoolers, also cited weight concerns relating to before- and after-school activities, including instruments and heavy backpacks, influencing their decision to walk or bike to school.
• Housing: In most cases, White students are more likely to have permanent housing than their peers who are POC, who are more likely to have unstable or temporary housing. Temporary or unstable housing greatly influences transportation options, as routes to school may vary more for students who move often than for students with permanent housing. Citywide survey data confirmed this; students who reported walking to school were five times more likely to have permanent housing versus unstable or temporary housing.
Figure 16. Students who reported before or after-school activities influenced their decision to walk or bike to school, separated by age group and by those who identify as POC (solid) versus White (unfilled). Data were taken from the citywide survey where respondents could select as many influencing factors as they desired. Percentages represent the proportion of students belonging to each grade and race group who indicated that this was an influencing factor.

28 | SEATTLE DEPARTMENT OF TRANSPORTATION
ROOT CAUSES: WHY DO THESE BARRIERS EXIST FOR COMMUNITIES OF COLOR?
RacismInstitutional Racism: The barriers to walking and biking to school that students of color in Seattle face are symptoms of larger racist systems and institutions. Investments have often historically intentionally neglected communities of color segregated from the White communities that often benefitted the most from public and private resources. As a result of this inequitable distribution of resources, communities of color continue to live in neighborhoods that are less walkable or bikeable than many of Seattle’s predominately White neighborhoods. Neighborhoods of color often have less access to opportunity centers, and often rely on cars to get to work, high-quality schools, healthy food options, and parks. Currently, people of color are disproportionately displaced from Seattle as the cost of living continues to soar. Although displaced individuals may not live within city limits, they continue to work and play in Seattle despite the longer commute time and increase in commute expenses. All of these factors contribute to lower walking and biking rates among Seattle’s communities of color, and ultimately result in higher rates of toxic stress, obesity, diabetes, and other adverse health outcomes.
Racism among individuals: Families of color who are long-time residents in their neighborhoods reported feeling a decreased sense of belonging as their neighborhoods continue to gentrify. Families have clearly stated that they do not want their Black sons to walk, bike, or take public transit to school to avoid any potential interactions with law enforcement, and have even stated that their neighbors have called enforcement officials simply due to the presence of youth of color on their block.
DistanceImpacts of Residential Displacement: Communities of color are disproportionately displaced from the city as Seattle’s cost of living soars. Several families reported that they are working to maintain some semblance of consistency by keeping their students in the same school community after they are forced to move. Displacement for many students means a commute distance or route that is not bikeable or walkable even for older, or more experienced, cyclists and pedestrians.
CultureCultural Differences & Preferences: Many communities across Seattle do not view walking or biking as a reliable mode of transportation. Instead, they prefer driving, or view walking and biking as a recreational activity. This is true for both communities of color and white communities.
Stories of Negative Experiences: Often a few individuals within a community had heard about negative, or even tragic, experiences pertaining to walking and biking within community such as pedestrian collisions. Furthermore, media outlets disproportionately highlight undesirable or violent situations in communities of color, effectively spreading fear around a community. If a family has a multiple transportation options, these factors may directly influence a guardian’s decision about how their student gets to and from school to avoid walking and biking.

SAFE ROUTES TO SCHOOL RACIAL EQUITY ANALYSIS REPORT | 29
Public Safety ConcernsPublic safety was a resounding theme among students and guardians alike. Fear of the unknown, “stranger danger,” the potential threat of violence, the presence of people experiencing homelessness, and unpredictable behaviors of individuals suffering from mental health or substance use issues are all influencing factors as families decide how students should get to and from school each day.

30 | SEATTLE DEPARTMENT OF TRANSPORTATION
STRATEGIES FOR RACIAL EQUITY AND INCLUSIVE SAFE ROUTES TO SCHOOL PROGRAMMING
• Explore opportunities with school PTAs andother community organizations to host a walkwith families using these physical wayfindingmarkers at community events (e.g. at aBack to School Night event) so students andfamilies are familiar with the safe routes theycan use throughout the school year.
• Support City efforts to create new citywidewayfinding designs and implementationplans, especially in communities of color.
• Explore opportunities to implementLearning Landscapes in communities ofcolor in Seattle.
Measures of Success:• Increased usage of marked safe routes
by families as measured by observationalsurveys.
Infrastructure Recommendation 2: Continue to prioritize communities of color when seeking opportunities with schools to complete walking audits identifying areas for improvement of the current infrastructure along routes to and from school.
Infrastructure Recommendation 3: Explore ways to support SDOT’s efforts to develop a curriculum for communities of color, immigrants, and refugees about how to advocate for SDOT resources in their communities.
These community-generated strategies were compiled from meetings with school principals and community leaders in communities of color in Seattle. The recommendations in this report are organized into six categories: infrastructure, distance and weather, safety, bicycling, policy and neighborhood-specific recommendations. When appropriate, a category has a vision statement with corresponding recommendations, implementation options, and measures of success.
Recommendations to Address Infrastructure BarriersVision: Leverage opportunities to elevate safety in neighborhoods and along routes to schools through infrastructure and engineering improvements.
Infrastructure Recommendation 1: Explore opportunities to pilot the installation of physical markers indicating safe routes to school throughout neighborhoods of color.
Implementation Options:• Make yard signs modeled after the Vision
Zero campaign available to schools toclearly mark safe routes.
• Explore opportunities to install Thermoplastic markers or Rainworks on sidewalksto guide students safely to and from schoolas a wayfinding measure with messagesto prompt students to stop and look beforecrossing. For example, directional ordistance markers can be installed on thesidewalks to prompt students.

SAFE ROUTES TO SCHOOL RACIAL EQUITY ANALYSIS REPORT | 31
Implementation Options:• Work with SDOT’s Interdepartmental
Transportation Equity team (IDT) toincorporate existing Safe Routes toSchool programming and resources intotheir Transportation Equity Workgroupcurriculum. The goal of this curriculumis to bolster community advocacy effortsin navigating and understanding many ofSDOT’s initiatives and policies.
• Disseminate curriculum to schoolsand community organizations servingcommunities of color, immigrants, andrefugees identified in the Safe Routes toSchool Racial Equity Analysis Workplan.
• Connect community organizations tofunding opportunities such as the SDOT’sTransportation Equity Grant.
Infrastructure Recommendation 4: Explore ways to improve street or pedestrian lighting in poorly lit areas alongside upcoming infrastructure improvements.
Recommendations to Address Distance and Weather BarriersDistance and Weather Recommendation 1: Support SDOT’s Transit & Mobility Division, Department of Neighborhood’s Community Liaisons, the Office of Immigrant and Refugee Affairs, and other local government agencies to connect communities of color, immigrants, and refugees to resources that would mitigate barriers to walking and biking to school such as bike, helmet, cold/rainy weather gear giveaways.
Implementation Options:• Contact local companies such as
Patagonia, REI, and Charlie’s Coats forweather gear donations for communityorganizations, schools, initiatives, etc. thatserve communities of color, immigrants,and refugees.
• Pilot a reflective/bright umbrella donationprogram with specific schools andcommunity organizations identified inthe Racial Equity Analysis Workplan thatprimarily serve immigrants and refugees inSeattle.
• Provide Safe Routes to School informationand weather gear (e.g. umbrellas) atcommunity events for communities of color,immigrants, and refugees.
Recommendations to Address Safety BarriersVision: All Seattle’s school children feel safe walking and biking to school.
Safety Recommendation 1: Explore options for partnership between schools and existing adult walking and biking programs to increase chaperone presence for students walking and biking to school.
Implementation Options:• Connect with Seattle’s Human Services
Department’s Healthy Aging work, AgeFriendly Seattle, and Seattle Parks andRecreation’s Sound Steps Walking Program(ages 50+) to explore opportunitiesfor walking school bus chaperones.Partnerships between these programs andthe Safe Routes to School program wouldfoster intergenerational interactions and isa natural fit for a volunteer chaperone baseto kickstart walking school buses acrossSeattle.
• Connect with Girl Trek’s Seattle Chapterto explore potential opportunities forwalking school bus chaperones. Girl Trekis a program to rally “Black women to walkin their neighborhoods for radical self-care and healing.” Girl Trek organizers inSeattle expressed great interest in workingwith youth and getting more students outwalking in initial conversations about apotential partnership to chaperone walkingschool buses.

32 | SEATTLE DEPARTMENT OF TRANSPORTATION
Measures of Success:• Dedicated funding is allocated for
community member volunteers.• Every public school has received a Walking
School Bus handbook.
Safety Recommendation 2: Partner with schools and community organizations to create a safety awareness campaign to look out for students.
Implementation Options:• Work with community organizations,
schools and City Departments to engagein community mapping exercises invarious neighborhoods to map “humaninfrastructure” or assets within acommunity that would contribute toneighborhood safety to answer thefollowing questions:
- Who is looking out for students inthe community?
- Where can you stop by on your wayto school to feel safe?
• Create window clings and pledges to“watch out for students” and promoteactive transportation in participatingneighborhoods.
• Support partnerships and incentives forneighborhood businesses (e.g. a coffeeshop) to place window clings pledgingsupport for safe routes to school in thewindow of their business for discounts orother perks (e.g. discounted coffee) foradults who are chaperoning students toschool via active transportation. If donesuccessfully, these discounts will bringmore customers to small businesses, bringmore awareness to the community to lookafter students through community pledges,get more people to walk and bike, andincrease the odds that students are walkingor biking with a responsible and trustedchaperone.
• Use the work of the Urban Peace Instituteand Advancement Project as a guide forcreative ways to leverage neighborhoodassets.
Safety Recommendation 3: Incorporate analysis findings into the development of walking and bicycling safety education curriculum at the middle school level with Seattle Public Schools and Cascade Bicycle Club.
Implementation Options:• Part of the curriculum could be homework or
group assignments for students to map outwalking, biking or transit routes to and fromschool that they recognize as safe to travel.Students can identify safe places along theirroute, such as a friend’s or relative’s home,library, community center, local business,etc. where they could go for help, if needed.These maps can also support emergencypreparedness efforts.
• Routes that students identify throughcommunity asset mapping exercises couldbe candidates for yard signs and windowclings that indicate safe routes for students.
• Incorporate positive behavior interventionstrategies (PBIS) into safety educationcurriculum language, where available.PBIS can reinforce positive behavior forstudents and is consistent with languageand behaviors that the student is learningin the classroom.
Measures of Success:• Window clings and pledges are made and
disseminated to communities.• Contracts with communities to fund “human
infrastructure” and asset mapping arecreated.
• Communities map human infrastructure orassets within their neighborhoods.
• Marked routes identified by the “humaninfrastructure” or asset maps are utilized inobservation surveys.

SAFE ROUTES TO SCHOOL RACIAL EQUITY ANALYSIS REPORT | 33
Safety Recommendation 4: Amplify existing community efforts that are successfully addressing perceptions of neighborhood crime by activating neighborhood pockets that residents perceive as dangerous in a way that brings more agency and power to long-time residents of communities of color.
Implementation Options:• Continue to partner with Rainier Beach
Action Coalition’s Corner Greeters programto beautify and activate corners in theRainier Beach neighborhood.
• Seek potential partnerships with the SeattleNeighborhood Group’s NeighborhoodClean-Ups and Rainier Beach: A BeautifulSafe Place to beautify neighborhoods andprevent crime with the goal of makingcommunities feel safer to walk through.
Measures of Success:• Communities are connected to City
beautification efforts such as Seattle PublicUtilities’ Spring Clean events.
• SDOT staff participate in neighborhoodbeautification projects.
Safety Recommendation 5: Consult with City and regional leadership as enforcement policies are reevaluated to identify areas for improvement in training programs to decriminalize enforcement approaches.
Implementation Options:• Connect with Sound Transit’s Equity
Diversity and Inclusion Director and theMayor’s Office as Sound Transit’s fareenforcement policies are reconsidered.
• Connect with SDOT’s Vision Zero teamas they coordinate targeted enforcementcampaigns with the Seattle PoliceDepartment.
Safety Recommendation 6: Partner with schools in communities of color with strong family and community engagement to leverage walking school buses.
Implementation Options:• Fund walking school bus coordinators at
schools through the Safe Routes to SchoolMini Grants program. Consult with schoolsto identify community leaders at the schoollevel that may be a good fit.
• Provide schools with a Walking School Bushandbook that lays out step-by-step how toorganize walking school buses.
• Disseminate Walking School Bus handoutsto schools and community organizations.
Measures of Success:• Dedicated funding is allocated for
community member volunteers.
Safety Recommendation 7: Bring community stories from people of color to the forefront to highlight their positive experiences walking/biking through their neighborhoods.
Implementation Options:• Partner with media outlets (e.g. Freedom
Net and Seattle Emerald), City of Seattlesocial media outlets (e.g. SDOT, Mayor’sOffice), and Seattle Public Schools.
Measures of Success:• At least five stories are highlighted each
year.

34 | SEATTLE DEPARTMENT OF TRANSPORTATION
Recommendations to Address Bicycling BarriersBicycle Recommendation 1: Support and raise awareness around students bicycling to and from school in communities with limited bicycle infrastructure.
Implementation Options:• Find ways to center the voices of those who
are dependent on bikes as their sole modeof transportation when making policy andprogramming decisions for the Safe Routesto School program.
• Support Odyssey Teams, Cascade BicycleClub, Bike Works, and the McDonalds inthe Rainier Beach neighborhood to connectschools to bike, skateboard, bike lock, bikelight, reflective gear and helmet donations.
• Continue sponsoring Cascade BicycleClub’s work to support Seattle PublicSchools in providing walking and bicyclingsafety education for every 3rd, 4th, and 5thgrade student, as well as the developmentof a similar program for middle school.Communities highly valued this educationalexperience.
• Continue to prioritize school bike parkingfor schools that predominately servestudents of color by using the School BikeParking Inventory Analysis.
• Consider partnering with private funders tofund school bike parking.
Measures of Success:• Partnerships with organizations in Rainier
Beach neighborhood that link schools tobike/skateboard donations are created.
• Bike parking is added to schools incommunities of color.
Recommendations to Address PolicyPolicy Recommendation 1: Support ongoing efforts by agencies and community groups that are involved in work related to expanding transportation options for students and families.
Implementation Options:• Identify opportunities to work with King
County Metro’s Safe Routes to Schoolprogram to leverage county-wideresources.
• Coordinate with Seattle Public Schools’Superintendent Transportation Task Force,Seattle School Traffic Safety Committee,and other City or County Departments suchas Public Health Seattle & King County tocreate a walking school bus coordinatorposition that bolsters Safe Routes toSchool programs, aside from infrastructureimprovements.
• Identify grant opportunities for activetransportation coordinator positionsspecifically for schools and students.
• Support Seattle Public Schools in theirefforts to address student transportationchallenges including alternativetransportation options.
• Encourage and support communityorganizations identified through the SRTSRacial Equity Analysis to apply to theTransportation Equity Program’s youth-focused grants pertaining to transit.
• Create a Mini Grant program thataccepts applications on a rolling basisto support community groups, schoolsand organizations that implement SRTSrecommendations in their neighborhoods.This new Mini Grant program would alsoserve to build leverage among communityorganizations to contract with the SRTSprogram to provide funding to take on largeprojects in neighborhoods.
Measures of Success:• A permanent Walking School Bus (WSB)/
Active Transportation Coordinator positionis created.

SAFE ROUTES TO SCHOOL RACIAL EQUITY ANALYSIS REPORT | 35
Neighborhood/Community-Specific Recommendations:
• Coordinate with Rainier Beach ActionCoalition (RBAC) and Concord ElementarySchool to incorporate positive behaviorintervention strategies (PBIS) for bothstudents and adults that is congruent withPBIS strategies used in neighborhoodschools.
South Park Community Recommendations:• Continue to leverage existing partnerships
with community organizations and schoolsthat serve communities of color suchas Seattle Neighborhood Group, SeattleNeighborhood Greenways, Duwamish RiverOpportunity Fund, and Concord PTA.
Rainier Beach Community Recommendations:• Support RBAC’s Corner Greeters efforts to
report crime data, which has shown thatcrime is down in Rainier Beach.
• Bring community stories to the forefrontto highlight their positive experienceswalking/biking through the Rainier Beachneighborhood.
• Financially support organizations that areimplementing SRTS recommendations orstrategies (or closely related strategies)through the Mini Grant program.

36 | SEATTLE DEPARTMENT OF TRANSPORTATION
UNRESOLVED ISSUES
SDOT recognizes that there are many contributing factors that influence the decision making of parents or guardians that are outside of SDOT’s realm of influence. Issues that remain unresolved include:
• Available funding for programming and resources needed to effectively provide the access to information and personnel capacity needed to run programs are insufficient in city and school budgets.
• The Government Sector throughout the region historically has a muddy past with communities of color with damaging past policies and ideals that have broken trust and strained working relationships with communities decades ago and remain disconnected.
• As Seattle prospers, the City will need to strategically ensure that all residents have an opportunity to also prosper within city limits. Currently, there is a disparity in who benefits, and it manifests in people’s ability to access affordable housing options at low- and middle-income wages.
• Distracted driving consistently poses a threat to the safety of all, whether it’s driving under the influence of drugs and alcohol, texting and driving, etc.
SDOT is committed to addressing these complex social issues by continuing to build on the relationships with community-based organizations and other government agencies that this racial equity analysis has fostered and try to support the recommendations this report offers.

SAFE ROUTES TO SCHOOL RACIAL EQUITY ANALYSIS REPORT | 37
CONCLUSION
In conclusion, the findings of this analysis demonstrate the need for continued efforts to dismantle barriers for students to walking and biking, especially those barriers disproportionately affecting students of color. One lesson learned from this analysis was that flexibility is key for reaching the people you want to reach and building strong relationship with community members. The flexibility to mold your process based on the needs of diverse communities earns the trust and entrance into previously inaccessible spaces.
Furthermore, the role of media plays a different role in communities of color than White communities. Social media and word of mouth are the quickest and most trusted ways community members get information, so finding the right spokespeople that are respected is key.
Last, the Safe Routes to School staff will need to find a delicate balance between programming and physical improvements. While the need for physical improvements is enormous, those improvements do not guarantee people will utilize the new infrastructure because social and personal barriers remain. Furthermore, building physical improvements without understanding community needs and building strong programming can contribute to the displacement of communities.
Not only will the findings benefit the Safe Routes to School program, but they will also inform SDOT practices, as well as other City-led initiatives.
Promising Practices for Community Engagement
• Provide a variety of ways to engage while listening to trusted community leaders about what are the preferred or most effective ways to engage with respective communities.
• Never assume the input you receive from individuals is representative of entire communities. Close the loop with communities by sharing what you heard and asking for feedback before drawing conclusions.
• Community members and organizations are experts in their communities and often have the best solutions.
• Compensate communities for their time and participation in the planning process through knowledge sharing, skill building, financial incentives or other ways that are mutually beneficial.
• Be consistently present in the community even when you are not seeking input. Reinforce that you are a community resource and not only an implementer.
This racial equity analysis is the first step towards making sure the SRTS team is holding ourselves accountable to having a racially equitable Safe Routes to School program in Seattle. This process has illuminated ways in which the City can effectively partner with organizations and schools to reach the shared vision and goals for all students to enjoy the benefits of walking and biking to school. Going forward, the Safe Routes to School team will strive to continue to be present in these communities to continuing building a “shared leadership” model for community involvement and program improvement.

38 | SEATTLE DEPARTMENT OF TRANSPORTATION
APPENDIX A: CITYWIDE SURVEY1 What is the grade of your student? Kindergarten – 5th grade 6th – 8th grade 9th – 12th grade
2 How far does your student live from school?
Less than 1/2 mile (less than a 10 minute walk; less than a 2 minute drive)
1/2 mile to less than 1 mile (about a 15 minute walk; 5 minute drive)
1 mile to less than 2 miles (about a 30 minute walk; 7 minute drive)
2 miles or farther (more than a 40 minute walk; at least a 10 minute drive)
3 Think about how your student traveled to and from school last week (Monday to Friday). Mark an X for each mode of travel they used during their morning and afternoon trips. Mark all that apply.
Walk (including scooter, skateboard, wheelchair, etc.) - Morning
Monday Tuesday Wednesday Thursday Friday
Afternoon
Family car or carpool (riding with other students in a personal vehicle) - Morning
Afternoon
School Bus - Morning
Afternoon
Bike - Morning
Afternoon
Light rail (Sound Transit light rail) - Morning
Afternoon
Public bus (Metro Transit, Sound Transit) - Morning
Afternoon
Other (please specify):_________________________________ - Morning
Afternoon
4 Which of the following applies to your student for the 2018-2019 school year?
They never walk to/from school because it is not an option for them.
They never walk to/from school, but it is an option for them.
They have walked to/from school at least once.
5 Which of the following applies to your student for the 2018-2019 school year?
They never bike to/from school because it is not an option for them.
They never bike to/from school, but it is an option for them.
They have biked to/from school at least once.
6 If your student normally walks or bikes to school, does cold or rainy weather deter or prevent the student from walking or biking?
Yes, often Yes, sometimes No It's complicated
7 Thinking about your student’s route for walking/biking to school, would they encounter any of the following on their trip? Select all that apply.
Busy/confusing intersection(s)
Crosses under/over a freeway
Crosses road(s) with 4+ lanes
Intersection(s) without adult crossing guards
Section(s) do not have sidewalks
Section(s) have poor lighting
Section(s) with train tracks or light rail tracks
Section(s) without bike lanes
Other (please specify)___________________________
None of the above
8 Do any of these factors influence your decision for your student to walk or bike to/from school? Select all that apply.
Coordination with other children’s schedules
Parent(s)/Guardian(s) work schedule(s)
Student’s before or after-school activities
Don’t own a bicycle or can’t afford to buy one
Student’s ability to follow rules of the road
Distance (the school is too far away)
Student has physical limitations or accessibility concerns
Other (please specify)___________________________
None of these
9 Check all boxes that apply
Do any of these factors influence your decision for your student to walk or bike to/from school?
Has your student experienced any of these conditions on their way to/from school?
Sexual harassment
Bullying
Poor traffic safety (cars speeding, not stopping, etc.)
Poor lighting
Drug activity
Gang or gun violence
Other (please specify):___________________________________
These demographic questions help us shape our outreach efforts more appropriately to diverse groups of people in Seattle. All questions are OPTIONAL and ANONYMOUS.
10 How long has your student lived in your current neighborhood? Less than 2 years Between 2 and 5 years More than 5 years
11What is the zip code of your student’s school?
12 With which gender does your student most identify? Female Male Gender(s) not listed here
13 How many students do you have in Kindergarten through 12th grade? 1 2 3 4 or more
14 How many members of your household are 18 years or older, including yourself? 1 2 3 4 or more
15 How would you describe your student’s race or ethnicity? Please select all that apply.
American Indian or Alaska Native
Black or African American
Native Hawaiian or Pacific Islander
Asian or Asian American
Hispanic, Latino, Latinx or Spanish
White
Some other race(s) (please specify):_______________
Please continue on next page
16 The options listed above might not fully describe or define a person’s racial, ethnic, or cultural identity. How would you describe your student’s race, ethnicity, or culture? (examples include: Vietnamese, Japanese, mixed race, Oromo, Pakistani, Samish, Samoan)

SAFE ROUTES TO SCHOOL RACIAL EQUITY ANALYSIS REPORT | 39
17 Does your student speak languages other than English at home? No Yes (please specify):________________________
18 Which of the following categories include your 2017 annual household income, before taxes?
Less than $14,999
$15,000 to $24,999
$25,000 to $34,999
$35,000 to $49,999
$50,000 to $74,999
$75,000 to $99,999
$100,000 to $149,999
$150,000 or more
19 Does your household have access to a working vehicle? No Yes
20 Which of the following best describes your student’s housing stability? Long-term/permanent Temporary Unstable
21 Does your student use accommodations to get safely to or from school? (e.g. ramps, audible signals at intersections, etc.) No Yes
22 What is the highest level of schooling that you or another parent/guardian of your student has completed?
Some high school, no diploma
High school graduate, diploma or the equivalent (GED)
Some college or trade/vocational school/Associate’s degree
Bachelor’s degree/Post-graduate degree (PhD, MA, JD, MD, etc.)
23 How did you hear about this survey?
My student
My student’s school
A friend or family member
Social media
City of Seattle/SDOT website
A local organization (please specify):____________________________________
Other (please specify):____________________________________
Seattle Department of Transportation (SDOT)’s Safe Routes to School Program – Racial Equity Analysis Parent Survey
Through our Safe Routes to School program at the Seattle Department of Transportation (SDOT), it’s our goal to get more kids walking and biking to school. Unfortunately, many kids encounter barriers between home and school that make walking and biking a difficult choice. As a City, we’re also working to end institutional racism and race-based disparities in city government and throughout Seattle. To meet these significant goals, we’re performing a racial equity analysis to better understand how we can increase safe walking and biking to school options, particularly for students from communities of color.
Please take a few minutes to share your thoughts and experiences in this survey so we can customize our programs and services around the challenges people face. This will help us create the best possible Safe Routes to School program to serve our students in the ways they need it the most. We plan to share the findings of this survey and how it will inform our program’s direction during the 2018-2019 school year. All questions are OPTIONAL and ANONYMOUS and results will be shared in the coming months. This information may be subject to citizen information requests. You can fill out the paper questionnaire provided here or take the survey online here: http://www.seattle.gov/transportation/srts-rea
This survey will take less than 10 minutes to complete. If you have multiple students, please fill out the survey for the student you feel faces the most barriers in their commute or submit additional surveys online for multiple students.
Thank you for participating in our survey!

40 | SEATTLE DEPARTMENT OF TRANSPORTATION
APPENDIX B: SCHOOL AND COMMUNITY ORGANIZATION PARTNERSHIPS & COMMUNITY EVENTS ATTENDED
Community and School PartnershipsThe Safe Routes to School Team partnered with schools and community organizations in communities of color to host several events, in addition to attending the community events.
SchoolsAki Kurose Middle School
Concord Elementary School
Dearborn Park Elementary School
Dunlap Elementary School
Emerson Elementary School
MLK Jr. Elementary School
Rainier Beach High School
Rainier View Elementary School
Van Asselt Elementary School
West Seattle Elementary School
Wing Luke Elementary School
Seattle Public School District
Community OrganizationsEthiopian Community of Seattle
Rainier Beach Action Coalition: Corner Greeter Program
Refugee Women's Alliance (ReWA)
Seattle Neighborhood Group
South Park Neighborhood Association
Southeast Seattle Education Coalition
Community EventsBack 2 School Bash (Rainier Beach neighborhood)
Discover Your Community/Bee Festival (High Point neighborhood)
Fiestas Patrias (Latinx Festival)
Juneteenth Celebration (African American Festival)
Lake Washington Apartments Night Out (Rainier Beach neighborhood)
Neighbor Night Out (Rainier Beach neighborhood)
Neighborhood House Healthy Families Event (High Point neighborhood)
Numerous Rainier Beach Action Coalition Corner Greeters Events
Rainier Vista Health Fair and Block Party (Rainier Valley neighborhood)
ReWA Youth Summer Program workshop (High Point neighborhood)
SeaMar Health Clinic Fresh Produce Distribution
Seattle Teen Summit (Seattle Housing Authority event)
Umoja Fest (African American Festival)

SAFE ROUTES TO SCHOOL RACIAL EQUITY ANALYSIS REPORT | 41
APPENDIX C: CITYWIDE SURVEY DEMOGRAPHIC DATA
Multiracial or Race(s) not listed
Latinx or Hispanic (of any race)Asian/Asian American or Pacific Islander/Native HawaiianBlack or African American
White
Total Respondents to Citywide SurveyBy Grade and Race Group
K - 5th grade 6th - 8th grade 9th - 12th grade
560 (53%)
136 (13%)
158 (15%)
54 (5%)
140 (13%)
369 (69%)
25 (5%)
46 (9%)26 (5%)
64 (12%)
486 (70%)
30 (4%)
61 (9%)28 (4%)
93 (13%)
n = 1048 (46%)
n = 530 (23%)
n = 698 (31%)
Citywide survey respondent demographic data, by age and race group. This graph illustrates the demographics of citywide survey respondents by race and age group. Numbers indicate the absolute number of respondents and the percentage in parantheses gives the percent of respondents of each race or ethnicity for each age group. Guardians had the option to complete a survey for each of their students, and high school students (grades 9 though 12) had the option to participate in the citywide survey designed specifically for high school students. Survey respondents were asked to describe the student’s race or ethnicity by checking one or more boxes corresponding to the race groups listed in Figure 8, or, if the options did not fully describe the student’s race or ethnicity, they had the option to write in a response. Some groups with fewer responses were then combined for reporting purposes (see Figure 8). All groups except for White only Non-Hispanics were then included as People of Color (POC). Survey respondents were also asked to select from the following options to indicate the student’s approximate age: Kindergarten through 5th grade, 6th grade through 8th grade, and 9th grade through 12th grade.

42 | SEATTLE DEPARTMENT OF TRANSPORTATION
Race and EthnicityAll Students
Multiracial orRace(s) not listed
Latinx or Hispanic
Asian/Asian AmericanPacific Islander
Black or African American
White
14%
5%
9%
10%
12%
13%
8%
11%
62%
57%
SRTS Citywide Survey Respondents
2017 Seattle American Community Survey Data

SAFE ROUTES TO SCHOOL RACIAL EQUITY ANALYSIS REPORT | 43
Department of Transportation
Demographic Profile: All students (n = 2,465)
76%More than 5 years
18%Between 2 and 5 years
Years in Current Neighborhood
Less than 2 years 7%
Long-term/Permanent
2%Temporary
Housing Stability
Unstable 1%
2
2%4 or more
48%1
8%3
42%
Household Size, Number of Students
6%4 or more
11%1
12%3
71%
Household Size, Number of Adults
2
10%Some college or Associate’s Degree
3%Some high school, no diploma
83%Bachelor’s Degree or higher
4%High school diploma or equivalent
Parent/Guardian Education Level
% 92%No
8%Yes
Student Uses Accommodations to Travel Safely
97%
13
Department of Transportation
47%47%
4%Less than $14,999
5%$35,000 to $49,999
22%$100,000 to $149,999
3%$15,000 to $24,999
9%$50,000 to $74,999
42%$150,000 or more
5%$25,000 to $34,999
11%$75,000 to $99,999
Household Income
46%Kindergarten –5th grade
23%6th grade –8th grade
30%9th grade –12th grade
Student’s Grade
Demographic Profile: All students (n = 2,465)
Latinx of any race
Female
50%Male
Student’s Gender
18%Yes
Speaks Language(s) other than English at Home
12%Asian/Asian American or
Native Hawaiian/Pacific Islander
14%Additional race(s)
8%Black/African American
62%
5%
White
Race and Ethnicity (single-select)
Gender(s) not listed here
1%
95%Yes
Access to a Working Vehicle
Due to rounding, percentages may not sum to 100%. Rounding occurs on all slides. 2017 American Community Survey data on children age 5-18 used for comparison purposes only. Respondents’ most common languages spoken at home are Spanish, Vietnamese, and Chinese.
49%
12
ACS 2017 ACS 2017
21%
50%
50%
N/A
84%
10%
6%
7%
10%
15%
12%
17%
23%
13%
11%
10%
9%
57%

44 | SEATTLE DEPARTMENT OF TRANSPORTATION
Department of Transportation
16
1%Less than $14,999
2%$35,000 to $49,999
24%$100,000 to $149,999
.4%$15,000 to $24,999
7%$50,000 to $74,999
52%$150,000 or more
1%$25,000 to $34,999
11%$75,000 to $99,999
Household Income
40%Kindergarten – 5th grade
26%6th grade – 8th grade
34%9th grade – 12th grade
Student’s Grade
Demographic Profile: White students (n = 1,546)
Latinx of any race47%Female
51%Male
Student’s Gender
5%Yes
Speaks Language(s) other than English at HomeAsian/Asian American or
Native Hawaiian/Pacific Islander
0%Additional race(s)
0%Black/African American
100%
0%
White
Race and Ethnicity (single-select)
Gender(s) not listed here 1 %
0%
98%Yes
Access to a Working Vehicle
Department of Transportation
14
7%Less than $14,999
10%$35,000 to $49,999
19%$100,000 to $149,999
6%$15,000 to $24,999
12%$50,000 to $74,999
25%$150,000 or more
10%$25,000 to $34,999
11%$75,000 to $99,999
Household Income
56%Kindergarten – 5th grade
19%6th grade – 8th grade
25%9th grade – 12th grade
Student’s Grade
Demographic Profile: Students who are POC (n = 1,139)
Latinx of any race
50%Female
49%Male
Student’s Gender
35%Yes
Speaks Language(s) other than English at Home
31%Asian/Asian American or
Native Hawaiian/Pacific Islander
36%Additional race(s)
21%Black/African American
12%
POC Race and Ethnicity (single-select)
Gender(s) not listed here .7%
Yes 91%
Access to a Working Vehicle
91%Yes
Access to a Working Vehicle
Students who selected Asian/Asian American were combined with Native Hawaiian/Pacific Islander students for reporting purposes. Any community not listed in these combined groups (e.g., American Indian or Alaskan Native) appears in the “Additional race(s)” category. This includes individuals who selected more than one race.

SAFE ROUTES TO SCHOOL RACIAL EQUITY ANALYSIS REPORT | 45 Department of Transportation
17
Demographic Profile: White students (n = 1,546)
2
80%More than 5 years
16%Between 2 and 5 years
Years in Current Neighborhood
Less than 2 years 4%
2
99%Long-term/Permanent
1%Temporary
Housing Stability
Unstable .2%
2
2%4 or more
48%1
8%3
42%
Household Size, Number of Students
1%4 or more
48%1
7%3
45%
Household Size, Number of Adults
2
4%Some college or
Associate’s Degree
.2%Some high school, no diploma
95%Bachelor’s degree or higher
.6%High school diploma or equivalent
Parent/Guardian Education Level
% 94%No
6%Yes
Student Uses Accommodations to Travel Safely
Department of Transportation
15
Demographic Profile: Students who are POC (n = 1,139)
70%More than 5 years
21%Between 2 and 5 years
Years in Current Neighborhood
Less than 2 years 10%
Long-term/Permanent
5%Temporary
Housing Stability
Unstable 2%
2
4%4 or more
48%1
10%3
39%
Household Size, Number of Students
10%4 or more
14%1
13%3
64%
Household Size, Number of Adults
2
93%
18%Some college or Associate’s Degree
7%Some high school, no diploma
66%Bachelor’s degree or higher
9%High school diploma or equivalent
Parent/Guardian Education Level
% 89%No
11%Yes
Student Uses Accommodations to Travel Safely

46 | SEATTLE DEPARTMENT OF TRANSPORTATION
0%
0.1-4.9%
5.0-9.9%
10.0-14.9%
All Gradesn = 1438
15.0-19.9%
White StudentsWhite Students
All Gradesn = 1438
0%
0.1-4.9%
5.0-9.9%
10.0-14.9%
40.0-44.9%
15.0-19.9%
Black or African American Students
All Gradesn = 200
0%
0.1-4.9%
5.0-9.9%
10.0-14.9%
15.0-19.9%
35.0-39.9%
Asian/Asian American or Pacific Islander/Native HawaiianStudents
All Gradesn = 275
School zip code map of citywide survey participants by race. The following maps show the distribution of respondents belonging to each race who reported attending school in each zip code. Data were collected from the citywide survey. To protect the privacy of survey participants, the survey asked for school zip codes rather than asking for the zip code of a student’s residence. Note that some maps (e.g. the “Black or African American Students” map) may have gaps in the percentage increments in the legend because there were no zip codes in which students of a specified race matched the percentage of that particular percentage increment.

SAFE ROUTES TO SCHOOL RACIAL EQUITY ANALYSIS REPORT | 47
0%
0.1-4.9%
5.0-9.9%
10.0-14.9%
Multiracial or Race(s) not listed Students
All Gradesn = 306
0%
0.1-4.9%
5.0-9.9%
10.0-14.9%
Latinx or Hispanic Students
All Gradesn = 109
Department of Transportation
The most common way respondents learnedabout the survey is via direct mail (41% POC, 68%White, and 57% Overall).
The second-most common way respondentslearned about the survey is via the City of Seattleor Seattle Department of Transportation website(14% POC and 11% White, and 12% Overall).
Schools are the third-most common wayrespondents learned about the survey (15% POC,8% White, and 11% Overall).
Most respondents learned about the survey via direct mailing or the City of Seattle/SDOT website.
How did you hear about the survey? (multi-select option).Base: all respondents (n = 2,465).
Even after accounting for other student and householdcharacteristics, the respondents were: Four times more likely to get this survey directly from
the student if the family has temporarily/unstable housing.
Four times more likely to get this survey by mail iftheir student does not need accommodations to travel safely to school.
Three times more likely get this survey from theschool if student speaks a language other than English at home.
Two times less likely to have received the survey by mail if student speaks a language other than Englishat home.
Two times more likely get the survey directly from thestudent if the student is Black/African American.
Looking Deeper
18
47
54
47
82
63
47
40 67
38
173
40
48
97
122
159
978
2%
2%
0%
0%
1%
1%
1%
1%
2%
3%
4%
7%
5%
6%
7%
6%
42%
16%
0% 5% 10% 15% 20% 25% 30% 35% 40% 45%
Other
Community event
Social Media
A local organization
A friend or family member
My student
My student's school
City of Seattle/SDOT website
Mailed to home
Asian/Asian American or Pacific IslanderBlack/African AmericanLatinx or HispanicAdditional race(s)White
Other includes: unsure, paper copy.

48 | SEATTLE DEPARTMENT OF TRANSPORTATION
APPENDIX D: TRANSPORTATION DATA FROM CITYWIDE SURVEY
Department of Transportation
Key Findings
In the past year, about half of the students in this survey (53%)have walked to/from school and fewer (20%) have biked.
• Twice as many students have walked as those who havebiked, but some students have done both. Only somestudents (28%) who have walked in the past year have alsobiked in the past year. Conversely, most who have bikedhave also walked (79%)
About half of the students who are POC (52%) never biketo/from school because it is not an option for them, only abouta third of their White peers say the same (37%).
Young elementary students (e.g., Kindergartners) and older highschool (e.g., students old enough to drive) students are lesslikely to walk or bike to school.
Students who report they live farther away from the school areless likely to walk or bike to school.
Under a third of students who are POC (30%) and over a thirdof White respondents (35%) walked to/from school in the lastweek.
Overall, few (7%) students in this survey need accommodationsto safely get to school.
About half of the students in this survey have walked or biked to/from school in the past year.
Concerns about unfamiliar people, including peopleexperiencing homelessness, commonly influence the decisionfor students to walk/bike to school. These concerns alsoinfluence the specific routes of those who do choose to walk orbike to school.
Concerns about unfamiliar adults are top of mind for many respondents.
Students commonly encountered intersections without adultcrossing guards (67%), busy/confusing intersections (66%), andsections without bike lanes (54%) on their route as they walk orbike to school.
Students often have to use intersections without adult crossing guards or bike lanes.
Parent/Guardian work schedules (43%), student extracurricularactivities (40%), and distance (35%) are the most commonfactors influencing their decision to walk or bike to/from school.
Caregivers’ work schedules are the most popular social barrier for the decision for students to walk or bike to/from school.
6
Department of Transportation
Key Findings
In the last week, morning trips to and from school differ slightlyfrom afternoon trips.
In the last week, cars (59%), walking (33%), and the school bus(17%) were the most popular ways students travelled to schoolin the morning.
In the last week, cars (56%), walking (38%), and the public bus(20%) were the most popular ways students travelled to/fromschool in the afternoon. School buses were the fourth-mostpopular choice (18%) in the afternoon.
Trips to and from school in the last week were typically by car, walking, or bus.
Generally, conditions like poor traffic safety (57%) and/orlighting (24%), and gun/gang violence (14%) influenced thedecision about how students travel to/from school.
When asked about the difference between perceived barriersand respondents’ first-hand experience, respondents usuallynamed the same issues. Poor traffic (34%), poor lighting (13%),and gang/gun violence (3%) are the top barriers.
Traffic safety, poor lighting and gang/gun violence are top of mind for respondents.
Many students (63%) who normally walk or bike to school aredeterred or prevented from walking or biking due to cold orrainy weather. This is true for both students who are POC (64%)and White students (63%).
Weather deters most students who normally walk or bike to school.
Older students generally carry more weight, including musicalinstruments and heavy backpacks. Students (including thosewho took the teen version) and adults who took the surveyboth described weight-related concerns that prevent travelingto/from school by biking or walking.
Older students are generally carrying more weight and this weight deters walking or biking to/from school.
7

SAFE ROUTES TO SCHOOL RACIAL EQUITY ANALYSIS REPORT | 49
Department of Transportation
Key Findings
There are not any statistically significant race group differencesin the mode of travel by day of the week. The lack of anysignificant differences by race indicates that overall, otherdemographic variables (especially age and distance fromschool) are the main predictors of differences in how studentstravel to and from school during the last week.
Age and distance from school are stronger predictors than race for how students traveled in the past week.
Latinx respondents are eight times more likely to say physicallimitations or accessibility concerns influences the decision forstudents to walk or bike to school.
Black/African American students are two times more likely tobe say before or after school activities influence the decisionfor students’ walking or biking to or from school.
When comparing students who are POC with White students,students who are POC are more likely to be influenced byconcerns about gun or gang violence. Some students who arePOC are more likely to be influenced by concerns about gun organg violence than others.
• Black and Asian/Asian American or Pacific Islander studentsare over three times more likely than White students to beinfluenced by concerns about gun or gang violence.
Different racial/ethnic groups are more or less likely to experience or be influenced by specific barriers to walking or biking to or from school.
8
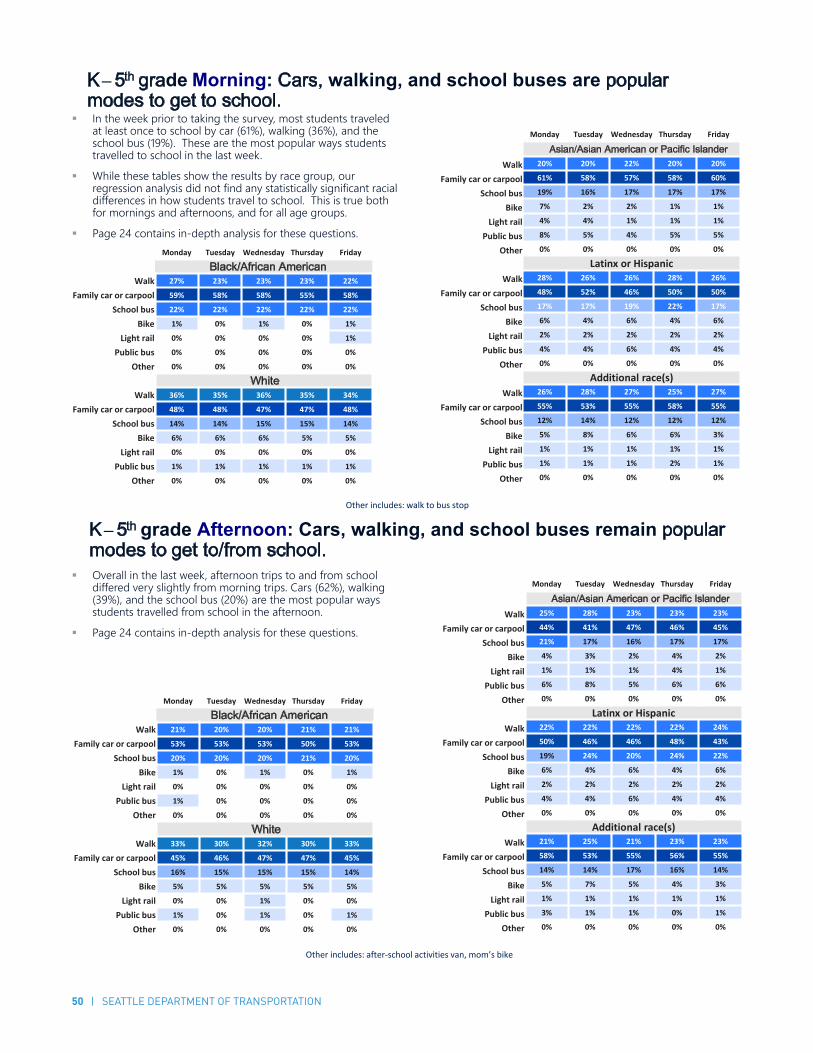
50 | SEATTLE DEPARTMENT OF TRANSPORTATION
Department of Transportation
K– 5th grade Morning: Cars, walking, and school buses are popularmodes to get to school.
Monday Tuesday Wednesday Thursday Friday
Black/African American Walk 27% 23% 23% 23% 22%
Family car or carpool 59% 58% 58% 55% 58%
School bus 22% 22% 22% 22% 22%
Bike 1% 0% 1% 0% 1%
Light rail 0% 0% 0% 0% 1%
Public bus 0% 0% 0% 0% 0%
Other 0% 0% 0% 0% 0%
WhiteWalk 36% 35% 36% 35% 34%
Family car or carpool 48% 48% 47% 47% 48%
School bus 14% 14% 15% 15% 14%
Bike 6% 6% 6% 5% 5%
Light rail 0% 0% 0% 0% 0%
Public bus 1% 1% 1% 1% 1%
Other 0% 0% 0% 0% 0%
Monday Tuesday Wednesday Thursday Friday
Asian/Asian American or Pacific IslanderWalk 20% 20% 22% 20% 20%
Family car or carpool 61% 58% 57% 58% 60%
School bus 19% 16% 17% 17% 17%
Bike 7% 2% 2% 1% 1%
Light rail 4% 4% 1% 1% 1%
Public bus 8% 5% 4% 5% 5%
Other 0% 0% 0% 0% 0%
Latinx or HispanicWalk 28% 26% 26% 28% 26%
Family car or carpool 48% 52% 46% 50% 50%
School bus 17% 17% 19% 22% 17%
Bike 6% 4% 6% 4% 6%
Light rail 2% 2% 2% 2% 2%
Public bus 4% 4% 6% 4% 4%
Other 0% 0% 0% 0% 0%
Additional race(s)Walk 26% 28% 27% 25% 27%
Family car or carpool 55% 53% 55% 58% 55%
School bus 12% 14% 12% 12% 12%
Bike 5% 8% 6% 6% 3%
Light rail 1% 1% 1% 1% 1%
Public bus 1% 1% 1% 2% 1%
Other 0% 0% 0% 0% 0%
In the week prior to taking the survey, most students traveledat least once to school by car (61%), walking (36%), and theschool bus (19%). These are the most popular ways studentstravelled to school in the last week.
While these tables show the results by race group, ourregression analysis did not find any statistically significant racialdifferences in how students travel to school. This is true bothfor mornings and afternoons, and for all age groups.
Page 24 contains in-depth analysis for these questions.
22Other includes: walk to bus stop
Department of Transportation
K– 5th grade Afternoon: Cars, walking, and school buses remain popular modes to get to/from school.
Monday Tuesday Wednesday Thursday Friday
Black/African American Walk 21% 20% 20% 21% 21%
Family car or carpool 53% 53% 53% 50% 53%
School bus 20% 20% 20% 21% 20%
Bike 1% 0% 1% 0% 1%
Light rail 0% 0% 0% 0% 0%
Public bus 1% 0% 0% 0% 0%
Other 0% 0% 0% 0% 0%
WhiteWalk 33% 30% 32% 30% 33%
Family car or carpool 45% 46% 47% 47% 45%
School bus 16% 15% 15% 15% 14%
Bike 5% 5% 5% 5% 5%
Light rail 0% 0% 1% 0% 0%
Public bus 1% 0% 1% 0% 1%
Other 0% 0% 0% 0% 0%
Monday Tuesday Wednesday Thursday Friday
Asian/Asian American or Pacific IslanderWalk 25% 28% 23% 23% 23%
Family car or carpool 44% 41% 47% 46% 45%
School bus 21% 17% 16% 17% 17%
Bike 4% 3% 2% 4% 2%
Light rail 1% 1% 1% 4% 1%
Public bus 6% 8% 5% 6% 6%
Other 0% 0% 0% 0% 0%
Latinx or HispanicWalk 22% 22% 22% 22% 24%
Family car or carpool 50% 46% 46% 48% 43%
School bus 19% 24% 20% 24% 22%
Bike 6% 4% 6% 4% 6%
Light rail 2% 2% 2% 2% 2%
Public bus 4% 4% 6% 4% 4%
Other 0% 0% 0% 0% 0%
Additional race(s)Walk 21% 25% 21% 23% 23%
Family car or carpool 58% 53% 55% 56% 55%
School bus 14% 14% 17% 16% 14%
Bike 5% 7% 5% 4% 3%
Light rail 1% 1% 1% 1% 1%
Public bus 3% 1% 1% 0% 1%
Other 0% 0% 0% 0% 0%
Overall in the last week, afternoon trips to and from schooldiffered very slightly from morning trips. Cars (62%), walking(39%), and the school bus (20%) are the most popular waysstudents travelled from school in the afternoon.
Page 24 contains in-depth analysis for these questions.
23Other includes: after-school activities van, mom’s bike

SAFE ROUTES TO SCHOOL RACIAL EQUITY ANALYSIS REPORT | 51
Department of Transportation
6th – 8th grade: Half were driven to or from school at least once in the last week and a third walked. Walking was slightly more common in the afternoon.
Monday Tuesday Wednesday Thursday Friday
POCWalk 26% 25% 25% 25% 23%
Family car or carpool 41% 40% 42% 40% 41%
School bus 25% 24% 25% 25% 24%
Bike 5% 5% 4% 4% 7%
Light rail 0% 1% 1% 1% 1%
Public bus 7% 9% 7% 8% 8%
Other 0% 0% 0% 0% 0%
WhiteWalk 29% 30% 27% 30% 28%
Family car or carpool 40% 40% 41% 42% 42%
School bus 21% 21% 20% 18% 20%
Bike 6% 6% 5% 5% 6%
Light rail 1% 1% 0% 1% 0%
Public bus 9% 8% 9% 9% 8%
Other 0% 0% 0% 0% 0%
Overall, cars (51%), walking (32%), and the school bus(25%) were the most popular ways students travelledto/from school in the last week.
Page 24 contains in-depth analysis for these questions.
Morning AfternoonMonday Tuesday Wednesday Thursday Friday
POCWalk 29% 29% 28% 30% 25%
Family car or carpool 31% 29% 31% 29% 30%
School bus 25% 25% 25% 25% 24%
Bike 6% 5% 5% 5% 7%
Light rail 2% 3% 2% 3% 2%
Public bus 9% 10% 10% 10% 10%
Other 0% 0% 0% 0% 0%
WhiteWalk 34% 33% 33% 33% 31%
Family car or carpool 29% 35% 30% 35% 32%
School bus 22% 16% 19% 17% 19%
Bike 6% 6% 6% 5% 6%
Light rail 1% 0% 0% 1% 1%
Public bus 9% 10% 12% 11% 10%
Other 0% 0% 0% 0% 0%
Categories are collapsed into POC instead of the disaggregated groups because some groups have numbers that are too small to be meaningful in this format. 24
Other includes: ferry
Overall in the week prior to the survey, afternoon tripsdiffered slightly from morning trips. Cars (50%), walking(41%), and the school bus (28%) were the most popular waysstudents travelled to/from school in the afternoon.
Department of Transportation
Monday Tuesday Wednesday Thursday Friday
POCWalk 30% 24% 25% 22% 27%
Family car or carpool 38% 41% 39% 41% 37%
School bus 4% 2% 4% 2% 3%
Bike 4% 2% 2% 2% 2%
Light rail 6% 6% 6% 6% 7%
Public bus 32% 32% 33% 34% 33%
Other 0% 0% 0% 0% 0%
WhiteWalk 26% 25% 25% 26% 26%
Family car or carpool 33% 35% 35% 35% 33%
School bus 5% 5% 4% 4% 4%
Bike 4% 3% 3% 3% 2%
Light rail 2% 2% 2% 2% 2%
Public bus 36% 35% 36% 34% 36%
Other 0% 0% 0% 0% 0%
Monday Tuesday Wednesday Thursday Friday
POCWalk 26% 28% 27% 25% 27%
Family car or carpool 48% 50% 46% 50% 48%
School bus 6% 5% 5% 5% 4%
Bike 4% 3% 3% 3% 2%
Light rail 7% 6% 5% 6% 7%
Public bus 29% 28% 29% 26% 26%
Other 0% 0% 0% 0% 0%
WhiteWalk 23% 22% 22% 22% 22%
Family car or carpool 48% 49% 51% 50% 50%
School bus 8% 8% 6% 8% 7%
Bike 3% 3% 2% 2% 2%
Light rail 2% 2% 2% 2% 2%
Public bus 21% 21% 20% 21% 21%
Other 0% 0% 0% 0% 0%
9th – 12th grade: Most students in these grades traveled in the morning via car or bus, but used more different travel modes in the afternoon.
Overall, cars (61%), public buses (30%), and walking (29%)were the most popular ways students travelled to school inthe last week.
Page 24 contains in-depth analysis for these questions.
Morning Afternoon
In the week prior to taking the survey, afternoon trips to andfrom school differed from morning trips. Cars (51%), publicbuses (46%), and walking (33%), were the most popular waysstudents travelled to/from school in the afternoon.
Categories are collapsed into POC instead of the disaggregated groups because some groups have numbers that are too small to be meaningful in this format. 25Other includes: ferry, monorail

52 | SEATTLE DEPARTMENT OF TRANSPORTATION
Mode of TransportationK - 5th Grade
Public BusWalk Car/Carpool School Bus Bike Light Rail
33%
22%
22% 25
%25
%
47%
55%
52%
48%
55%
15%
21%
17% 20
%14
%
5%
2% 0.1%
0.1%2% 1%0.6%
0.1%
1% 0.8%4%6%
3%
5% 5%
Multiracial or Race(s) not listed
Latinx or Hispanic
Asian/Asian American or Pacific Islander/Native HawaiianBlack or African American
White
Mode of transportation disaggregated by race for K-5th grade students. Citywide survey respondents were asked to report which modes of transportation their student used to travel to and from school each day for the previous week. For each group, percentages for each day were averaged to find the average percent of students using each mode of transport in a week. Participants could select all modes of transportation that applied to their lived experiences. This graph is disaggregated by race for Kindergarten through 5th grade students. Transportation mode data for students in 6th through 12th grade disaggregated by race are not reported due a small quantity of surveys highlighting the experiences of students in 6th through 12th grade.
Department of Transportation
Looking Deeper: Meaningful relationships in the data.
Students who bike to/from school are:
Four times more likely to have experienced bullying ontheir route to/from school.
Three times more likely to speak a language other thanEnglish at home.
Thee times less likely to have access to a householdvehicle.
Two times more likely to be male.
Two times more likely to be deterred by cold or rainyweather.
Students who walk to/from school are:
Five times more likely to have permanent housing (versusunstable or temporary housing).
Three times more likely to have experienced bullying ontheir route to/from school.
Three times more likely to report they live closer to school.
Students who use the school bus to/from school are: Three times more likely to be younger. Over two times more likely to live farther from school.
Students who use the public bus to/from school are: Four times more likely be older. Three times more likely to live father from school.
Two times more likely to have experienced bullying ontheir route to/from school.
There are not any statistically significant race group differences in the mode of travel by day of the week. The lack of any significant differences by race indicates that overall, other demographic variables (especially age and distance from school) are the main predictors of differences in how students travel to and from school.
26
The zip codes for students who bike and also speak a language other than English at home are: 98103, 98117, 98105, 98116, 98102,98118, 98125, and 98136.

SAFE ROUTES TO SCHOOL RACIAL EQUITY ANALYSIS REPORT | 53
Department of Transportation
9
7
8
14
22
31
7
10
9
15
13
7
8
7
13
21
19
20
27
26
39
50
51
76
113
118
120
220
279
266
6%8%
20%15%
2%1%
10%8%
30%22%
31%29%
32%30%
59%44%
74%65%
71%67%
0% 20% 40% 60% 80%
The most common barrier for respondents is that there are intersection(s) without adults (50% POC, 68% White, and 67% Overall). The second-most common barrier for this survey is busy or confusing intersections (47% POC, 71% White, and 66% Overall). Section(s) without bike lanes are the third-most common barrier (33% POC, 71% White, and 54% Overall).Thinking about your student's route for walking/biking to school, would they encounter any of the following on their trip?
(multi-select option).Base: all respondents (n = 2,465).
Difficult intersections and sections without bike lanes are common encounters for students traveling to/from school.
K – 5th Grade (n = 1,143) 6th – 8th Grade (n = 573) 9th – 12th Grade (n = 750)
17
23
22
23
29
29
12
7
14
10
15
15
11
9
11
16
16
16
35
31
33
52
52
48
86
89
153
192
162
274
309
311
7%11%
17%13%
6%10%
18%12%
31%34%
39%32%
33%36%
55%47%
63%50%
63%49%
0% 20% 40% 60% 80%
30
24
38
52
69
35
19
32
48
49
21
25
36
39
50
39
68
98
67
93
192
115
157
341
408
385
7%15%
16%11%
1%6%
8%4%
34%27%
20%15%
28%19%
60%33%
71%47%
68%50%
0% 20% 40% 60% 80%
None of the aboveNone of the above
Other
Section(s) with train tracks or light rail tracks
Crosses under/over a freeway
Section(s) do not have sidewalks
Crosses road(s) with 4+ lanes
Section(s) have poor lighting
Section(s) without bike lanes
Intersection(s) without adult crossing guards
Busy/confusing intersection(s)
Other includes: general safety, steep
hills, car traffic
Asian/Asian American or Pacific Islander Black/African American Latinx or Hispanic Additional race(s) White
29a

54 | SEATTLE DEPARTMENT OF TRANSPORTATION
Barriers to Walking or Biking to SchoolCitywide Survey Data
Parent(s)/Guardian(s)
work schedules
Student’s beforeor after-school
activities
Distance(school too
far away)
Student’s abilityto follow the
rules of the road
Don’t own abicycle or can’t
afford to buy one
Student hasphysical
limitation oraccessibility
concerns
50%52%
44%40%
25%26%
27%25%
35%39%
38%45%
23%27%
12%11%
6%4%
11%2%
5%4%
8%6%
7%1%
3%2%
4%4%
24%36%
34%44%
40%47%
POC
White
K - 5th grade
6th - 8th grade9th - 12th grade
K - 5th grade
6th - 8th grade9th - 12th grade
Social barriers to walking and biking to school by age group and students who identify as POC (solid) versus White (unfilled). In addition to infrastructure-related barriers (e.g. busy or confusing intersections), survey respondents were asked to report on social barriers to walking and biking to school. Data were collected from the citywide survey where respondents were given the opportunity to identify as many barriers as corresponded to their lived experiences.

SAFE ROUTES TO SCHOOL RACIAL EQUITY ANALYSIS REPORT | 55
Department of Transportation
ExperiencedInfluenced Poor traffic safety, poor lighting, and and/or
drug activity are the top three negativeexperiences that influence the decisions abouthow Kindergarten – 5th grade students travelto/from school.
However, most K-5 students have notpersonally had these negative experiences. Itwas not uncommon for the students to haveexperienced poor traffic safety, but poorlighting was less common, and 5% or less of allK-5 students had faced these other negativeexperiences.
Respondents who provided their own answersin this survey told us:
Concerns about if students in these gradeswould be capable of traveling to/fromschool without adult supervision arecommon for this group.
Walking is generally possible for thesestudents when an adult accompanies thechild to/from school.
Some children do not know how to ride abike and instead are bike passengersto/from school.
Many K-5 students’ travel modes are influenced by negative experiences, even if students have not personally had bad experiences on their way to school.
34
Asian/Asian American or Pacific Islander Black/African AmericanLatinx or Hispanic Additional race(s)White
K – 5th Grade (n = 1,143)
145
36 23 71
3%
2%
1%
2%
1%
3%
3%
4%
5%
6%
10%
8%
40%
24%
0% 10% 20% 30% 40% 50% 60% 70%
Other
Sexual harassment
Gang or gun violence
Bullying
Drug activity
Poor lighting-POC
Poor traffic safety
91
221
27
36
31
35
39
94
52
49
40
40
45
79
20
34
29
45
47
131
6%
9%
8%
19%
5%
21%
7%
17%
15%
22%
20%
23%
64%
55%
0% 10% 20% 30% 40% 50% 60% 70%
Other
Sexual harassment
Gang or gun violence
Bullying
Drug activity
Poor lighting
Poor traffic safety
Other includes: unfamiliar people,
general safety
Department of Transportation
221
6%
4%
2%
1%
2%
4%
4%
9%
12%
11%
15%
14%
39%
25%
0% 10% 20% 30% 40% 50% 60% 70%
Other
Sexual harassment
Gang or gun violence
Bullying
Drug activity
Poor lighting-POC
Poor traffic safety
Many 6th – 8th students’ travel modes are influenced by negative experiences, even if students have not personally had bad experiences on their way to school.
35
Asian/Asian American or Pacific Islander Black/African AmericanLatinx or Hispanic Additional race(s)White
6th – 8th Grade (n = 573) Poor traffic safety, poor lighting, and and/or
drug activity are also the top three negativeexperiences that influence decisions abouthow 6th grade – 8th grade students travelto/from school.
While poor traffic safety, poor lighting, anddrug activity are also the experienced by 6th –8th grade students, fewer students have hadthese negative experiences than are influencedby them. Overall, most students do notexperience these barriers on their way to/fromschool.
Respondents who provided their own answersin this survey wrote:
Concerns about if 6th grade – 8th gradestudents would be exposed to sexuallyinappropriate advertising, behavior (e.g.,prostitution), or drugs (alcohol or cannabisadvertising) are also common concerns forthis group.
Concerns about if students could carrytheir heavy school supplies while travelingby foot or bike are also common for thisgroup. However, this was less common forthis group compared to the 9th grade – 12th
grade group.
Other includes: unfamiliar people,
general safety
ExperiencedInfluenced
91
221
11
7
6
10
11
29
6
5
4
8
11
15
19
13
11
22
34
60
9%
7%
14%
17%
11%
13%
11%
11%
24%
19%
24%
26%
59%
50%
0% 10% 20% 30% 40% 50% 60% 70%
Other
Sexual harassment
Gang or gun violence
Bullying
Drug activity
Poor lighting
Poor traffic safety
Other includes: unfamiliar people,
general safety
145
339

56 | SEATTLE DEPARTMENT OF TRANSPORTATION
Department of Transportation
85
85
167
6%
3%
6%
7%
5%
5%
4%
4%
18%
11%
18%
14%
35%
29%
0% 10% 20% 30% 40% 50% 60% 70%
Other
Sexual harassment
Gang or gun violence
Bullying
Drug activity
Poor lighting
Poor traffic safety
Poor traffic safety, poor lighting, and drugactivity continue to be the top 3 concerns thatinfluence the decisions about how 9th grade –12th grade students travel to/from school.
These three factors are experienced by some9th grade – 12th grade students in the survey.Overall, most students did not experiencethese conditions on their way to/from school.
Respondents who provided their own answersin this survey shared concerns about if 9thgrade – 12th grade students would becapable of carrying heavy school supplies (e.g.,instruments) as they travel to/from school.
Many 9th – 12th grade students are influenced by negative experiences, even if students have not personally had bad experiences traveling to or from school.
36
Asian/Asian American or Pacific Islander Black/African AmericanLatinx or Hispanic Additional race(s)White 9th – 12th Grade (n = 750)
ExperiencedInfluenced
98
101
228
9%
4%
10%
16%
9%
20%
6%12%
20%
26%
21%
24%
48%
44%
0% 10% 20% 30% 40% 50% 60% 70%
Other
Sexual harassment
Gang or gun violence
Bullying
Drug activity
Poor lighting
Poor traffic safety 15 8 5 4730 19 7 57
21 6 3 37
16 56 27
16 4 21 Other includes: unfamiliar people,
general safety
Department of Transportation
Looking Deeper: Meaningful relationships in the data about what influences the decision for students to walk and or bike to school.
Respondents who say distance influences students’ walking or biking to school are: Six times more likely to report they live farther away from
school. Two times more likely to report that poor traffic safety
influences their decision to walk or bike to school. Theserespondents are also two times less likely to say the student’sschool is too far away.
It is unclear how much the distance between home andschool dissuades respondents who might otherwise walk orbike to school. It is clear that for many respondents this wasthe main barrier.
Respondents’ demographics influence students’ walking or biking to/from school: Parents/Guardians with fewer years in formal education are
over two times more likely to say owning/affording a bike influences students’ walking or biking to/from school.
Latinx respondents are eight times more likely to say students’use of accommodations influences the decision for studentsto walk or bike to/from school.
Black/African American students are two times more likely tobe say before/after school activities influence the decision forstudents’ walking or biking to/from school.
Respondents who say physical limitations or accessibility concernsinfluence students’ walking or biking to school are: Eight times more likely say they are Latinx. More than seven times more likely say they experience poor
traffic on their trip to get to or from school. Seven times more likely say they are influenced by poor traffic
(e.g., speeding cars) on their trip to get to or from school. Four times less likely say they are influenced by owning a bike
for their trip to get to or from school.
Respondents who say weather influences students’ walking or biking to school are: Six times more likely to report they live farther away from
school. Two times more likely to report that they are influenced by:
Coordination with parent/guardian work schedules Coordination with family members’ schedules Extracurricular activities Owning or affording a bike
33

SAFE ROUTES TO SCHOOL RACIAL EQUITY ANALYSIS REPORT | 57
APPENDIX E: MEMO OF SUMMARIZED FINDINGS FROM THE CITYWIDE SURVEY
Department of Transportation
Barriersto Walking/Bikingto Schoolfor Studentsof ColorMemoKey Findings and Survey Confirmation Memo
We picked out themes from all qualitative data we collected in 2018. These findings are what we heard from various community members repeatedly, but are not meant to be representative of an entire community’s lived experiences/opinions. Phase II of the racial equity analysis will aim to refine these key findings and create generated solutions/ideas for SRTS programming/services via conversations with community leaders.
Language notes:
The term “influenced by” or “influence(s) their” signals that this finding is a Yes/No response to survey questions eight and nine. These questions both include the text, “Do any of these factors influence your decision for your student to walk or bike to/from school”? Both options include the ability for respondents to add their own words by writing in their answer.
The term “Developmental maturity” includes concerns about if the student is old enough, if the student has sufficient social skills navigating the trip without adult supervision, as well as concerns about possible developmental and cognitive delays.
Because respondent may choose not to write-in their answers, the open-ended responses are not reported by counts or percentages for this memo. Similar responses were grouped together and a generic quantitative word was used, instead. For this memo “a couple” represents two or three responses, “a few” represents three to five responses, “some” represents more than five responses, and “most” represent more than half of the responses for any particularquestion.
Perception/reality of what is too faro Biggest barrier is living too far to walk
Distance is one of the most commonly written-in barriers, but logistics aroundparenting schedules and extracurricular activities are also popular responses onthe online survey.
Overall, 32% of respondents say distance influences their decision for studentsto talk to school.
Students who live farther away from school are five times more likely to havedistance influence their walking or biking to school. This accounts for otherinfluences like student and household characteristics.
Respondents who say distance influences their walking or biking to school aretwo more likely to say that poor traffic safety influenced their decision. Theserespondents are two times less likely to say the student experienced distance on their way to school. This accounts for other influences like student andhousehold characteristics. It is unclear if these respondents are deciding not totravel the distance because of the distance, or if there is another explanation for
why they are more likely to be influenced by distance and less likely to travel the distance.
Perception vs. reality of safetyo Hearing about tragic incidents of child ped collisions in their community – do not want
their students walking alone The survey did not explicitly ask about how collisions influence their decision for
how students travel to school. A few respondents wrote-in about this specific concern in the survey.
o Gang/gun violence Respondent concerns about violence (including gang violence) influenced their
decision to walk or bike to school (14% overall), though fewer people reported that the student had experienced gun or gang violence first-hand (3% overall).
Respondents generally wrote about crime in broader terms for their write-inresponses to barriers. Few respondents discussed gangs and guns, though acouple respondents reported students had been directly solicited by gangs.
o When comparing students who are POC with White students, students who are POC aremore likely to be influenced by concerns about gun or gang violence. Some students who are POC are more likely to be influenced by concerns about gun or gang violence thanothers. Black and Asian/Asian American or Pacific Islander students are over three times
more likely than White students to be influenced by concerns about gun or gang violence. This accounts for other influences like student and householdcharacteristics.
o Unpredictable behaviors of people experiencing homelessness Most people who listed barriers in the open-ended parts of the survey talked
about fears of unfamiliar people including fears about people experiencinghomelessness. This fear of unfamiliar people influences their decision to allow students to walk/bike to school. It also influences the route of those who do choose to walk or bike to school with their child.
Many who are concerned about the presence of unfamiliar people(e.g., strangers) did not encounter unfamiliar people on their trip to school.There were fewer respondents who had directly encountered unfamiliar people on their route, compared to the number of respondents who said that seeingunfamiliar people influenced their school travel decisions.
o People hearing about violence, but never experiencing it themselves Respondent concerns about violence (including sexual harassment) influenced
their decision to walk or bike to school, though fewer people reported that thestudent had experienced this first-hand.
o They hear police reports, next door app, news 40
Department of Transportation
The survey did not explicitly ask about how respondents perceived safety orwhere they went for information about the safety of the routes to school. The survey did allow write-in responses for factors that influence the decision forstudents’ walking or biking to/from school.
Next door (application), police reports, and news reports were not explicitly asked in the survey. No survey respondent shared insights into these, explicitly.
People did write about seeing police presence and being influenced to avoid certain areas because of the police presence.
o Black families – reports of their white neighbors calling cops on them – unjustcriminalization of youth The survey did not explicitly ask about the criminalization of youth or neighbor-
initiated police calls. The survey did allow write-in responses for factors thatinfluence the decision for students’ walking or biking to/from school.
This response appeared a couple times in the survey’s write-in responses. Onerespondent discussed concerns that a neighbor might call child protective services if the child is seen traveling to school unaccompanied by an adult.
Need for infrastructure improvementso Traffic calming
Busy or fast traffic was a pressing concern for some respondents, but respondents generally did not explicitly request traffic calming measures.
A few people mentioned traffic calming devices such as speed bumps/humps intheir write-in responses.
o Lighting Lighting was discussed both in terms of general lighting, as well as to increase
visibility and safety in the dark winter weeks. 23% of overall respondents stated poor lighting influences their decision to
walk/bike to school. 13% of overall respondents stated they experienced poor lighting on their route
to school. Of all the infrastructure improvements for this memo, improving lighting offers
the broadest positive influence for addressing equity for students in the survey.• When accounting for other influences like student and household
characteristics, the following respondents are more likely to be say poor lighting influences their route to school:
o Students who are influenced by poor traffic safetyo Students who are influenced by bullyingo Students who are influenced by drug activityo Students who experience drug activity on their routeo Students in temporary or unstable housingo Students who encounter sections that do not have sidewalks
when walking or biking to school.o Sidewalks- Uneven, missing, or sidewalks that need more maintenance were mentioned
by respondents as needing to be fixed. Parents also discussed particular concerns around missing sidewalks near arterial roads.
About a third of respondents (30%) report that students encounter missing, damaged, or concerning sidewalks on their route to school.
The survey did not explicitly ask about arterial roads, though a few respondents mentioned large and heavy traffic roads in their write-in responses.
o Bike facilities The survey did not explicitly ask about bike facilities. Some respondents wrote-
in responses about the need for more bike facilities. Some mention of places to store bikes, including perhaps school-based
solutions. A couple respondents mention concerns about theft withoutproper storage solutions.
o Lots of mention of Rainier Ave – don’t want students crossing that street The survey did not explicitly ask about which locations cause the most concern.
The only location data collected was the zip code for the school and theapproximate distance between the school and the students’ residence.Nevertheless, some respondents offer details about which bus routes andintersections are the most concerning to them.
Respondents explicitly mention Rainier Avenue as being a street that isdangerous to cross.
Survey respondents mention that heavy police presence on Rainier Avenuemakes them feel unsafe. They also mention that crossing to/from the busstop feels unsafe, to the point they avoid traveling by bus.
There are also bus routes that people reported are not well-aligned with theschool schedule. A few people reported they would need to wait an hourbetween buses before they could take the bus to school, it is unclear in someinstances if their route includes Rainier Avenue.
Lack of access to bikes and lacking bike safety awarenesso Access to bikes
Overall, 6% of respondents said that students not having access to a bikeinfluences their decision for whether they walk or bike to/from school.
When comparing People of Color (POC) with White peers, POC are moreinfluenced by students having access to a bike.
Respondents who are not influenced by lacking student access to a student bikeare more likely to use accommodations to get safety to/from school. This accounts for other influences like student and household characteristics. Note:It is unclear how much of this is related to the nature of the student’s accommodation.
o Families may not know that their student is getting bike safety education in school. Orthey may feel that the education they are getting is insufficient. The survey did not explicitly ask about bike safety education, or if the school
education in bike safety was sufficient. For the write-in responses, no respondent mentioned bike safety in school,
though a couple respondents mentioned their children could not bike because they are still learning how to ride a bike.
41

58 | SEATTLE DEPARTMENT OF TRANSPORTATION
Department of Transportation
Lack of awareness of SRTS current programming (e.g. mini grants) The survey did not ask specifically about mini grants, and no respondent
wrote about mini grants in the open-ended responses.
Language barriers for students. Families unsure their students could safely get to school if the student is learning English
The survey did not ask specifically about language barriers. The survey did ask if the student speaks a language other than English at home. 17% of students speak at least one language other than English at home.
Students’ language barriers did appear a few times in write-in responses, asa deterrence to walking/biking.
Schools and community groups are generally interested in partnershipsNote of Interest: Idea that we can share with communities to get more insight about feasibility of Walking School Buses (WSB) in their communities
• Widespread interest in the WSBo Wing Luke parents wonder if there is a way to partner with daycare centers that
provide child care for Wing Luke students The survey did not ask specifically about WSB or daycare centers.
o No respondent wrote about daycare partnerships in this survey. Biggest barrier seems to be unsupervised children The survey did not ask specifically about unsupervised children as a barrier.
There was a question about if the student encountered crosswalks without an adult crossing guard, but not about WSB explicitly.
Fewer than ten people wrote explicitly about the need for adult supervision inthe open-ended response. Some of the concerns about student’s maturity and developmental capacity for walking or biking implies there may be additional concerns about supervision.
• Elementary school families concerned with student maturity and ability to walk aloneo Developmental maturity and distance both influence how families decide students go
to/from school. Developmental maturity includes concerns about whether a child is“ready” or “old enough”, as well as any cognitive or emotional barriers the student may affect their trip. The survey did not explicitly ask about concerns about student maturity. There
was one question that asked if respondents were influenced by students’ ability to follow the rules of the road.
Some respondents (15%) said they are influenced by student’s ability to follow the rules of the road.
Some respondents chose to write-in responses related to student maturity. Inthese write-in responses, elementary students are a popular group where respondents expressed concerns. The decision for students to walk or bike to/from school was based in part on student maturity for this group.
o Opportunities in apartment complexes where families can take turns walking kids who live in that complex to school. Some parents are not okay with WSB for their
children because they don’t trust other adults, but feel as though this would be a good idea in general for other families.
The survey did not ask specifically about apartment complexes or families taking turns to walk students to school.
A few responses about students being accompanied by rotating adults appearedin the survey’s write-in responses.
o Families who are okay with WSB said participation is contingent on knowing thechaperone and feeling confident that their child is safe. Some parents are not okay withWSB for their children because they don’t trust other adults, but feel as though this would be a good idea in general for other families. The survey did not ask specifically about WSB or adult chaperones. In the write-in responses for the survey, respondent generally wrote favorably
about students being supervised on their routes to school. The reasons adults offered to justify adult supervision was explicitly related to student gender. Parents wrote about how girls in particularly should be protected. Respondents wrote about concerns about young girls walking/biking alone more than they wrote about concerns about boys walking alone. In the case of girls, it wasimplied they are vulnerable to being attacked but with boys respondents voiceconcerns about age and developmental maturity. Respondents did not express concerns about non-binary or youth with genders not listed on the survey.
o Partner with bike share – this may be tricky because many of the bikes are moving towards e-bikes. Must be 18+ to ride those bikes. The survey did not ask specifically about bike shares. Respondents did not write-in responses about bike shares influencing their
decisions.
Other notes for the report• Estimate of the number of people we reached overall, and by methods
o 2,685 people Mail = 1,812 people Online = 474 people Public schools = 309 people Community Centers & Events in Chinese, Spanish, Vietnamese= 92 people
• Estimate of how many participants were POC 42% are People of Color
• Ask PRR to pull the numbers from survey respondents who reportedneeding accommodations – are there any reoccurring themes?
o When comparing students who are POC with White students, students who are POC are more likely to use accommodations to get safety to/from school. Some students who are POC use accommodations at higher rates than others. Latinx students (of any race) are three times more likely than non-Latinx
students to use accommodations to travel to/from school. This accounts for other influences like student and household characteristics.
42

SAFE ROUTES TO SCHOOL RACIAL EQUITY ANALYSIS REPORT | 59
APPENDIX F: EXAMPLES OF RACIAL EQUITY WORK PERTAINING TO SAFE ROUTES TO SCHOOL PROGRAMSSafe Routes to School: Equity Research Addressing Racial Equity
Program Dept./Org. Ideas for Seattle Link Tacoma Safe Routes to School Tacoma Public
Schools, Public Works Provide additional volunteer support to under-resourced schools | Safety & equity needs analysis conducted by school | Cultural competency guidance for outreach
Link
Portland Safe Routes to School Portland Bureau of Transportation
Consider who participates in Encouragement activities | Considers communication of and how Enforcement is conducted | Equity lens on providing infrastructure funding to schools
Link
Clackamas County Safe Routes to School
Clackamas County Safe Routes to School
Ensure students are able to participate in events for free and without a parent | hold bike events during school day | provide food, childcare, transit vouchers, and/or other compensation to families and volunteers to encourage participation in events
Link
Promoting walking/biking Program Dept./Org. Ideas for Seattle Link Tacoma Safe Routes to School Tacoma Public
Schools, Public Works Kidical Mass, a “legal, safe and fun bike ride for kids, kids at heart, and their families” | Provide bike/skateboard/scooter parking
Link
St. Paul Safe Routes to School MN DOT, MN Safe Routes to School
“Stop for Me” campaign to educate drivers about how stopping for pedestrians is the law | early dismissal for students who walk or bike | hire community volunteers as “Corner Captains,” people who discourage bullying and other unsafe behaviors at “hot spot” locations | “Walking Routes for Youth” maps that show suggested routes to school and other youth destinations like parks and libraries
Link
Portland Safe Routes to School Portland Bureau of Transportation
‘Walk + Roll Challenge Month” competition between schools for the number of student trips walked, biked, and rolled | Stop + Walk program to let kids walk part of the way to school | Bike Fairy, character who visits schools and leaves gifts for those who rode their bikes | Bike to Books program, a design contest hosted by PBOT and Multnomah County Library that invites students
Link Link Link
to design a bike lane for installation, second place gets free passes to a bike park and third place gets free helmets
Chula Vista Elementary School District Safe Routes to School
Chula Vista Elementary School District
Student contests (mascot name, art, jokes) as part of Encouragement | Community rides, “Welcome Back to School Bike Ride”
Link
Clackamas County Safe Routes to School
Clackamas County Safe Routes to School
Incorporate seasonal themes into SRTS events, such as Penguin Day or Earth Day | event like Pajama Walk Day and Crossing Guard Appreciation Day
Link
National Center for SRTS USDOT SRTS Encouragement Guide: Mileage clubs and contests | Park and Walk | On-campus walking activities
Link
Los Angeles Safe Routes to School
Los Angeles Vision Zero, City of LA, LA Unified School District
Walking Field Trips | Community Walks and Bicycle Rides | Golden Sneaker Program, use competitions and prices to reward students who walk, bike, carpool, or take the bus to school | piloted curb extensions in advance of construction
Link
Massachusetts SRTS MassDOT Flagship days to celebrate those who chose active transp. or encourage people to start taking active transp. | Walk Across America and Walk Across Massachusetts help kids learn geography while calculating their total distance walked over a week
Link
Providing bicycle access Program Dept./Org. Ideas for Seattle Link Tacoma Safe Routes to School Tacoma Public
Schools, Public Works Youth Bike Education | Earn-a-Bike Program | Provide students with free/low-cost bikes/skateboards/gear, by participating with community orgs | Skate classes in partnership with Alchemy Skateboarding | Rotating bike fleet for PE classes
Link
City of Fort Collins Safe Routes to School
FC Moves Dept. Give away bike helmets | walk/bike camps, clubs, field trips funded by CDOT SRTS grant | “No Child Left Behind” approach to field trips using “adaptive equipment” to allow every student the equipment to participate
Link
Recycle Bikes for Kids N/A Free bikes for children, Earn-a-Bike for adults Link Earn-A-Bike BikeWalkKC (non-
profit) Bike education and donation Link
Working Bikes N/A (Chicago non-profit)
Donates bikes to organizations locally in Chicago and globally Link

60 | SEATTLE DEPARTMENT OF TRANSPORTATION
Bicycle Recycle Project Nevada City School District
Teach students bike mechanic skills | provides students with refurbished bikes | an after-school program for students to build bicycles | Recycles community members’ bikes and bike parts | kid-friendly bike club
Link
Recycle-A-Bicycle Bike New York Bike donation and education | supports sending children to bike events, camps, and summits
Link
Organization • San Mateo, CA – housed under Public Works • Denver, CO – housed under Dept. of Public Health & Environment • San Francisco, CA – housed under San Francisco Dept. of Public Health • Madison, WI – housed under the Madison Metropolitan School District • St. Louis, MO – ran by Trailnet, a local non-profit organization dedicated to walking and biking • Cambridge, MA – housed under the Community Development Department • Philadelphia, PA – Safe Routes Philly is a project of the Bicycle Coalition of Greater Philadelphia • Omaha, NE – ran by Live Well Omaha, a coalition of organizations committed to the health of Omaha • Champaign-Urbana, IL – the SRTS program is known as C-U Safe Routes to School Project and is an organization with representatives
from the CU Mass Transit District, Champaign County Regional Planning Commission, CU Public Health District, Urbana and Champaign planning, engineering and law enforcement, Champaign County Bikes, Urbana and Champaign School Districts, as well as other educators, parents, and community members. The organization is fully committed to SRTS in the area.
to design a bike lane for installation, second place gets free passes to a bike park and third place gets free helmets
Chula Vista Elementary School District Safe Routes to School
Chula Vista Elementary School District
Student contests (mascot name, art, jokes) as part of Encouragement | Community rides, “Welcome Back to School Bike Ride”
Link
Clackamas County Safe Routes to School
Clackamas County Safe Routes to School
Incorporate seasonal themes into SRTS events, such as Penguin Day or Earth Day | event like Pajama Walk Day and Crossing Guard Appreciation Day
Link
National Center for SRTS USDOT SRTS Encouragement Guide: Mileage clubs and contests | Park and Walk | On-campus walking activities
Link
Los Angeles Safe Routes to School
Los Angeles Vision Zero, City of LA, LA Unified School District
Walking Field Trips | Community Walks and Bicycle Rides | Golden Sneaker Program, use competitions and prices to reward students who walk, bike, carpool, or take the bus to school | piloted curb extensions in advance of construction
Link
Massachusetts SRTS MassDOT Flagship days to celebrate those who chose active transp. or encourage people to start taking active transp. | Walk Across America and Walk Across Massachusetts help kids learn geography while calculating their total distance walked over a week
Link
Providing bicycle access Program Dept./Org. Ideas for Seattle Link Tacoma Safe Routes to School Tacoma Public
Schools, Public Works Youth Bike Education | Earn-a-Bike Program | Provide students with free/low-cost bikes/skateboards/gear, by participating with community orgs | Skate classes in partnership with Alchemy Skateboarding | Rotating bike fleet for PE classes
Link
City of Fort Collins Safe Routes to School
FC Moves Dept. Give away bike helmets | walk/bike camps, clubs, field trips funded by CDOT SRTS grant | “No Child Left Behind” approach to field trips using “adaptive equipment” to allow every student the equipment to participate
Link
Recycle Bikes for Kids N/A Free bikes for children, Earn-a-Bike for adults Link Earn-A-Bike BikeWalkKC (non-
profit) Bike education and donation Link
Working Bikes N/A (Chicago non-profit)
Donates bikes to organizations locally in Chicago and globally Link


62 | SEATTLE DEPARTMENT OF TRANSPORTATION
The Seattle Department of Transportation700 5th Avenue, Suite 3800PO Box 34996Seattle, WA 98124-4996(206) 684-ROAD (7623)www.seattle.gov/transportation 8.2019