Embed Size (px)
Citation preview

Seasonal forecasts of North Atlantic tropical cyclone activity in the North American MultiModel Ensemble Article
Accepted Version
Manganello, J. V., Cash, B. A., Hodges, K. I. and Kinter III, J. L. (2017) Seasonal forecasts of North Atlantic tropical cyclone activity in the North American MultiModel Ensemble. Climate Dynamics. ISSN 09307575 doi: https://doi.org/10.1007/s0038201736705 Available at http://centaur.reading.ac.uk/70252/
It is advisable to refer to the publisher’s version if you intend to cite from the work. Published version at: http://link.springer.com/article/10.1007/s0038201736705
To link to this article DOI: http://dx.doi.org/10.1007/s0038201736705
Publisher: Springer
All outputs in CentAUR are protected by Intellectual Property Rights law, including copyright law. Copyright and IPR is retained by the creators or other copyright holders. Terms and conditions for use of this material are defined in the End User Agreement .
www.reading.ac.uk/centaur

CentAUR
Central Archive at the University of Reading
Reading’s research outputs online

Seasonal Forecasts of North Atlantic Tropical Cyclone 1
Activity in the North American Multi-Model Ensemble 2
3
Julia V. Manganello1, Benjamin A. Cash1,Kevin I. Hodges2, James L. Kinter III1,3 4
5
1 Center for Ocean-Land-Atmosphere Studies (COLA), George Mason University 6
(GMU), Fairfax, Virginia, USA 7
2 Dept. of Meteorology, University of Reading, Reading, UK 8
3 George Mason University (GMU), Fairfax, Virginia, USA 9
10
For Submission to the NMME Special Issue in Climate Dynamics 11
12
Corresponding Author: 13 Julia V. Manganello 14 Center for Ocean-Land-Atmosphere Studies 15 113 Research Hall, Mail Stop 2B3 16 George Mason University 17 4400 University Drive 18 Fairfax, VA 22030 USA 19 [email protected] 20 Phone: 703-993-5716 21 Fax: 703-993-5700 22
23
2
Abstract 24
The North American Multi-Model Ensemble (NMME)-Phase II models are evaluated 25
in terms of their retrospective seasonal forecast skill of the North Atlantic (NA) 26
tropical cyclone (TC) activity, with a focus on TC frequency. The TC identification 27
and tracking algorithm is modified to accommodate model data at daily resolution. 28
It is also applied to three reanalysis products at the spatial and temporal resolution 29
of the NMME-Phase II ensemble to allow for a more objective estimation of forecast 30
skill. When used with the reanalysis data, the TC tracking generates realistic 31
climatological distributions of the NA TC formation and tracks, and represents the 32
interannual variability of the NA TC frequency quite well. 33
34
Forecasts with the multi-model ensemble (MME) when initialized in April and later 35
tend to have skill in predicting the NA seasonal TC counts and TC days. At longer 36
leads, the skill is low or marginal, although one of the models produces skillful 37
forecasts when initialized as early as January and February. At short lead times, 38
while demonstrating the highest skill levels the MME also tends to significantly 39
outperform the individual models and attain skill comparable to the reanalysis. In 40
addition, the short-lead MME forecasts are quite reliable. It is found that the overall 41
MME forecast skill is limited by poor representation of the low-frequency variability 42
in the predicted NA TC frequency, and large fluctuations in skill on decadal time 43
scales. Addressing these deficiencies is thought to increase the value of the NMME 44
ensemble in providing operational guidance. 45
3
1. Introduction 46
Recognizing high socioeconomic significance of tropical cyclone (TC) prediction, 47
dynamical seasonal forecasts of TC activity have been pursued since the early 2000s 48
using low-resolution climate models (see reviews by Camargo et al. 2007; Camargo 49
and Wing 2016). These efforts have been gaining ground in recent years with the 50
improvements in the prediction systems including the increase of horizontal and 51
vertical resolutions of the component models (Molteni et al. 2011; Vecchi et al. 52
2014; Camp et al. 2015; Manganello et al. 2016) and wider use of ensemble 53
forecasting and multi-model ensemble approach (MME; Vitart 2006; Vitart et al. 54
2007). One such system is the North American Multi-Model Ensemble (NMME) 55
experimental multiagency seasonal forecasting system (Kirtman et al. 2014), which 56
is currently delivering real-time seasonal-to-interannual predictions used for 57
operational guidance. In the second stage of this project (NMME-Phase II), 58
improvements to the modeling and data assimilation systems have been introduced, 59
the size of forecast ensembles has increased, and more complete and higher 60
temporal frequency data has become available. In light of these developments, it 61
has become possible to evaluate the skill of dynamical seasonal forecasts of TC 62
activity by the individual NMME models and the corresponding MME to determine 63
whether these forecasts are skillful enough to be used in operational hurricane 64
outlooks. 65
In this paper, we examine the performance of the NMME-Phase II retrospective 66
forecasts of the North Atlantic (NA) seasonal mean TC activity where predicted 67
storms are identified directly in the model data using a feature-tracking algorithm. 68

4
Due to data limitations and relatively coarse horizontal resolution of the NMME 69
models (see Sections 2a and b), our analysis is largely limited to TC frequency, and 70
we briefly examine TC days1 and regional TC activity as represented by track 71
density (see Vecchi et al. 2014; Manganello et al. 2016). For verification purposes, 72
we use three different reanalysis products in addition to the postseason best track 73
data, such as IBTrACS (see Section 2c). This is done to isolate the influence of model 74
resolution and the TC identification approach on the verification results. In addition 75
to assessing the overall level of skill, our goal is to identify aspects of the simulations 76
that could lead to potential improvements in the TC forecast skill and translate into 77
further developments of the NMME models. 78
Section 2 presents the NMME-Phase II models and hindcast datasets, and 79
introduces the observational and reanalysis data used to assess the skill of TC 80
hindcasts. It also describes the methodology of identifying and tracking the TCs in 81
the model data and reanalysis. Assessment of the seasonal forecast skill of the NA 82
TC activity, its dependence on the month of initialization and low-frequency 83
variability are presented in Section 3, along with a brief description of the 84
climatology of TC formation and tracks. Discussion of the results and concluding 85
remarks are included in Section 4. 86
87
1 “TC days” is defined as a lifetime of all TCs accumulated over a season, measured in days.

5
2. Data and Methods 88
a. NMME-Phase II models and data 89
The NMME-Phase II ensemble consists of coupled prediction systems from North 90
American modeling centers and the Canadian Meteorological Centre (CMC). Table 1 91
contains information about the NMME-Phase II models and hindcast datasets used 92
in this study2. The NMME System Phase II hindcasat data is available for download 93
from the Earth System Grid at the National Center for Atmospheric Research (NCAR) 94
(https://www.earthsystemgrid.org/search.html?Project=NMME). 95
Atmospheric horizontal resolution of the models in Table 1 is relatively coarse 96
(between about 1 and 2 degrees), which is common to most present-day operational 97
seasonal prediction systems. (The output resolution is 1°x1° grid for all models.) 98
Daily frequency is the highest temporal output resolution for the majority of the 99
NMME-Phase II models. This rather coarse horizontal and temporal resolution of 100
the data puts additional constraints on the choices of objective criteria used for TC 101
identification, which is further elaborated below. A roughly 30-year period is 102
considered long enough to evaluate the skill of long-range predictions. The hindcast 103
start times include all 12 calendar months, which in addition to a large number of 104
lead times allows for an assessment of long-lead (forecasts initialized as early as 105
January) and short-lead (initialization as late as August) predictions. 106
107
b. Tracking of tropical cyclones 108
2 At the time of this writing, daily dynamical fields for a common 1982-2012 hindcast period were available for download only for a subset of the NMME-Phase II models, which are listed in Table 1.

6
Identification and tracking of TCs in coarse- (horizontal) resolution models has 109
been done since the early 1980s, and a variety of methods exist to minimize the 110
effect of resolution on detection criteria (e.g., Walsh et al. 2007; Strachan et al. 111
2013). On the other hand, to resolve the TC trajectory, including its pre- and post-112
TC stages, a sufficiently high temporal resolution is generally required with the 6-113
hourly output frequency preferred for direct comparison with the best track data. 114
Tracking with daily data is not usually done, except in Smith et al. (2010) where TCs 115
are identified as minima in daily sea level pressure as they are tracked, which 116
reduces the number of possible matches but only captures the most intense part of 117
the lifecycle. In their study, the analysis is also restricted to the region between 0° 118
and 25°N. Recently, Vitart (2016) has successfully adjusted the tracking scheme 119
used at the European Centre for Medium-Range Weather Forecasts (ECMWF) to 120
evaluate the skill of sub-seasonal TC predictions using daily data. 121
In this study, the initial TC identification and tracking is based on the objective 122
feature-tracking methodology of Hodges (1995, 1999) and is tuned to work with 123
daily data, as opposed to 6-hourly data. The detection algorithm identifies vortices 124
as maxima in the 850-hPa relative vorticity field (in the Northern Hemisphere) 125
spectrally truncated at T42 with an intensity threshold of 1x10⁻⁵ s-1 and lifetimes 126
greater than 2 days (2 time steps). This tracking method allows TC tracks to be 127
captured in the deep tropics quite well but may underrepresent the extra-tropical 128
extensions of the tracks (see also Section 3a). 129
To separate predicted TCs from other synoptic-scale features, a set of TC 130
identification criteria needs to be applied to the raw tracks generated above. This 131

7
should include (1) a structural requirement of a warm core, (2) an intensity 132
threshold, along with (3) the formation region and (4) duration requirements. Due 133
to the coarseness of the spatial and temporal resolutions of the NMME-Phase II 134
models and limited availability of the surface wind data, we decided to base our TC 135
identification criteria solely on multi-level relative vorticity (at 850-hPa, 500-hPa 136
and 200-hPa levels common to all models in Table 1). To derive detection 137
thresholds in this case, simulated TC counts need to be calibrated against 138
observations. In this respect, our approach is similar to the method of Strachan et 139
al. (2013). 140
We have tested seven sets of TC identification criteria using May-November3 141
(MJJASON) reanalyses and model data (forecasts initialized in April). We varied the 142
number of levels used to define the vertical structure, assessed the sensitivity to the 143
presence of vorticity center at each level and monotonic reduction of vorticity with 144
height, and varied the minimum number of days when structural conditions need to 145
be satisfied (see Supplementary Material for more detail). In all cases, a warm core 146
condition remained the same, cyclogenesis was restricted to 0°-20°N over land and 147
0°-30°N over oceans, and 850-hPa vorticity at output resolution was used to 148
calibrate seasonal TC counts. For each reanalysis and NMME model, we have chosen 149
a set of TC identification criteria that maximizes their MJJASON TC frequency 150
correlation skill. These criteria are therefore not the same for all the datasets, 151
although the sensitivities are not large and are further discussed in the 152
Supplementary Material. While this is not a general practice, we believe that the 153
3 The MJJASON period encompasses most of the TC season in the NA basin.

8
above approach allows to better gauge the skill of each individual reanalysis and 154
model. These dataset-specific criteria do not change for the rest of the analysis, 155
including the skill assessment of long- and short-range predictions. 156
157
c. Observational and reanalysis data 158
For comparison with observations, we use data from the International Best 159
Track Archive for Climate Stewardship (IBTrACS, version v03r07; Knapp et al. 2010; 160
available online at https://www.ncdc.noaa.gov/ibtracs/). IBTrACS makes available 161
for public use a global dataset of post season analysis of TC position and intensity 162
(also know as “best track”) by merging storm information from multiple centers into 163
one product. The observed tracks are further processed here by retaining systems 164
with lifetimes greater than 2 days, of tropical storm strength for at least 1 day and 165
with first identification occurring between 0°-20°N over land and 0°-30°N over 166
oceans, to be more in line with the model and reanalysis tracks (see Section 2b). We 167
also use sea surface temperature (SST) data from the National Oceanic and 168
Atmospheric Administration (NOAA) Optimum Interpolation SST version 2 data set 169
(OISSTv2; Reynolds et al. 2002). 170
Since our choice of TC identification criteria (Section 2b) does not imply a close 171
match with the observational ones, it is prudent to use reanalysis data for more 172
direct verification of model results. In reanalyses, historical observations are 173
objectively ingested into the models with a goal to produce a consistent estimate of 174
the state of the climate. As such, reanalyses have an advantage of models by 175
providing a more comprehensive dataset. They are constrained by the observations 176

9
but limited by the raw input data and its quality, the resolution of the models used, 177
and the capabilities of the data assimilation system. Overall, applying the same 178
tracking methodology to the reanalysis and model data of the same spatial and 179
temporal resolution would allow a more objective estimation of the model skill. 180
We have used the following three reanalysis datasets: the National Centers for 181
Environmental Prediction (NCEP) Climate Forecast System Reanalysis (CFSR; Saha 182
et al. 2010); the Interim ECMWF Re-Analysis (ERA-I; Dee et al. 2011); and the 183
National Aeronautics and Space Administration (NASA) Modern Era Retrospective-184
Analysis for Research and Applications (MERRA; Rienecker et al. 2011). The spatial 185
resolution of all reanalysis data was downgraded to the 1°x1° grid of the NMME-186
Phase II model data. The temporal resolution was converted to daily, and the period 187
of 1982-2014 was used for analysis. 188
189
3. Results 190
a. Climatologies of TC formation and tracks 191
Prior to evaluating the skill of TC frequency forecasts, we verify whether the TC 192
identification and tracking approach chosen here generates realistic distributions of 193
genesis locations and tracks. Figs. 1 and 2 show NA genesis and track densities, 194
respectively, for the IBTrACS, reanalyses and the NMME-Phase II retrospective 195
seasonal forecasts. Reanalysis products reproduce main features of the genesis 196
pattern quite well, with varying levels of success depending on the specific 197
cyclogenesis center (Figs. 1a-d). CFSR is most accurate in representing the Main 198
Development Region (MDR; 10°-25°N, 80°-20°W), whereas in ERA-I and MERRA, 199

10
activity in this area is largely concentrated near the west coast of Africa. (Origin of 200
some tracks over West Africa is likely related to their tropical easterly wave 201
precursors being captured by the tracking algorithm (see also Manganello et al. 202
2012). For the same reason, the bulk of the MDR genesis is shifted further to the 203
east compared to observations.) The Gulf of Mexico center is underrepresented in 204
all reanalysis products, whereas the western Atlantic center is quite realistic across 205
the board. The Caribbean genesis is shifted southeast and is somewhat overactive in 206
ERA-I. This shift has been noted earlier and linked to the coarse spatial resolution of 207
the models (Manganello et al. 2012, 2016). The associated track density is overall 208
well reproduced (Figs. 2a-d), except in the extra-tropics which is likely a 209
consequence of tracking using daily data (see Section 2b). 210
Predicted genesis and track densities on the whole are less realistic compared to 211
observations and reanalyses, where formation regions are strongly concentrated in 212
space (Figs. 1e-h), and track density is overpredicted and too zonal in the tropics 213
and quite weak further north (Figs. 2e-h). However, the MDR genesis is rather 214
active in all the hindcasts, and other centers are well defined, except for the Gulf of 215
Mexico and the western Atlantic centers being absent in the CanCM3 forecasts. In 216
addition, the Gulf of Mexico center, where present, is more realistic than in the 217
reanalysis. On the other hand, the Caribbean genesis is too strong, and the 218
associated tracks are largely confined to the northern tip of South America. To 219
summarize, the tracking algorithm is capable of generating climatologies of the NA 220
TC formation and tracks with many realistic features, particularly when applied to 221
reanalysis products. 222

11
223
b. April forecasts of the North Atlantic seasonal mean TC activity 224
1). TC frequency 225
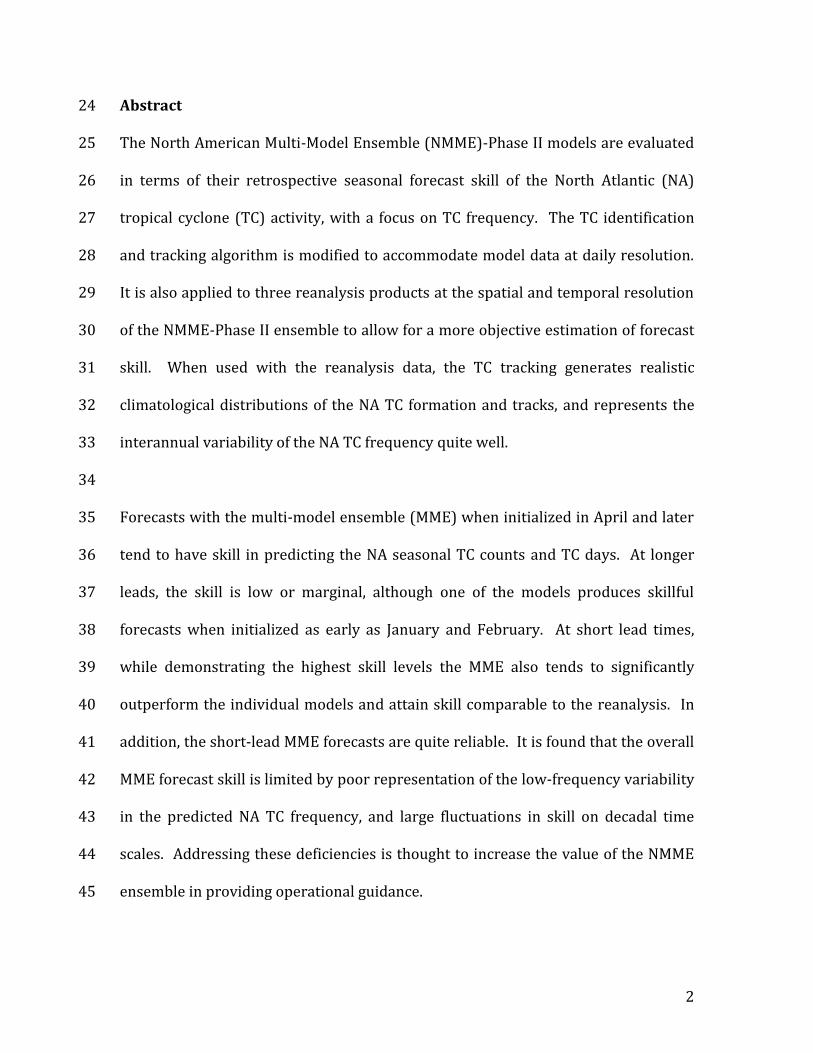
Fig. 3 shows the interannual variability of the observed and reanalyses-based NA 226
TC frequency, which is another demonstration of the utility of the TC tracking 227
method in estimating seasonal mean TC activity using daily data. The reanalysis 228
datasets reproduce the interannual variability quite well, with major peaks of 1995 229
and 2005 to the most part realistically represented. The correlation coefficients 230
between the reanalyses and the observed time series are also quite high ranging 231
from 0.67 to 0.81 (see Table 2). The reanalyses do differ considerably in terms of 232
their skill in representing multidecadal changes characterized by low activity in the 233
1980s and early 1990s and high activity in the latter part of the record (e.g., 234
Goldenberg et al. 2001). ERA-I is the most successful in capturing this trend, 235
whereas CFSR displays no trend (see Fig. 3). 236
Retrospective correlation skill varies markedly among the NMME-Phase II 237
models (see Table 2 for MJJASON forecasts initialized in April). It is quite high for 238
CCSM4 and CanCM4 and is in fact similar to the skill of experimental high-239
atmospheric-resolution coupled prediction systems in Project Minerva (Manganello 240
et al. 2016), whereas it is close to zero for GEOS-5 and CanCM3. As a consequence, 241
correlation of the MME mean4 is significant but rather modest and does not exceed 242
4 The MME mean is defined as the average over all the hindcasts, with all ensemble members of each model having equal weight.

12
the skill of all models in the ensemble. The root-mean-square error5 (RMSE), which 243
a measure of forecast accuracy, is fairly large, although the differences are not major 244
when the MME mean is compared to reanalyses (Table 3). RMSE for the detrended 245
time series is smaller across the board suggesting that low-frequency variability is 246
not well reproduced in the forecasts (see below). For short-range predictions, the 247
overall skill improves, and the advantages of the MME approach become more 248
evident (see Secion 3d). 249
A natural question arises whether the individual NMME-Phase II models are 250
indeed more or less skillful than their MME mean, and whether these models 251
including the MME display skill that is significantly different from the skill based on 252
the reanalyses data. The correlation coefficient is not considered a very good 253
measure to compare skill, as the presence of noise may lead to large differences in 254
this quantity. It is found that the squared error is a more appropriate metric 255
(DelSole and Tippett, 2014), and we choose the Wilcoxon signed-rank test for the 256
forecast skill comparison since it is not sensitive to the type of distribution (ibid.). 257
We find that at the 95% confidence level, the differences in skill among the four 258
NMME models and their MME mean are insignificant, except that the skill of GEOS-5 259
and CanCM3 is significantly lower that the skill of CanCM4. We also find that all 260
NMME models and the MME mean are as skillful as CFSR and ERA-I but less skillful 261
than MERRA. (The skill of CanCM3 is also significantly lower compared to ERA-I). It 262
5 Forecasts are calibrated (without cross-validation) where each ensemble member is multiplied by a constant factor so that the predicted ensemble-mean and observed climatologies become equal.

13
is worth emphasizing that the above skill comparison is based on the MJJASON 263
season (forecasts initialized in April). 264
Ensemble forecasts have an additional advantage of being able to quantify 265
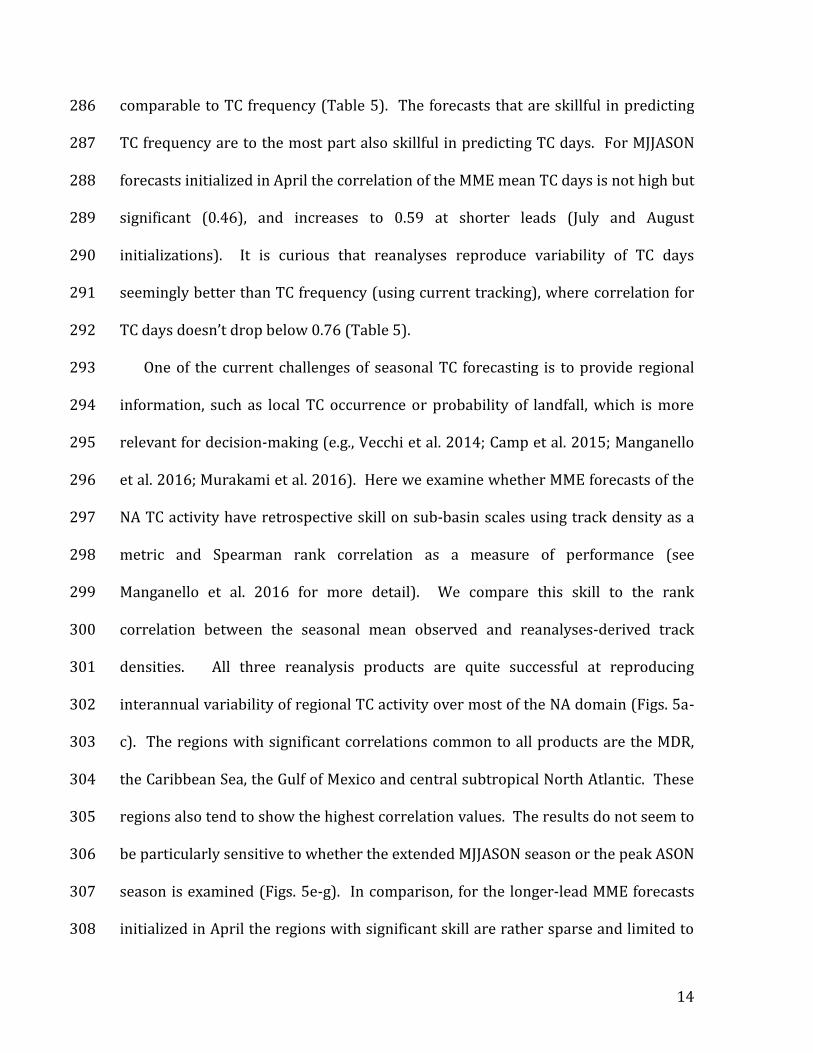
uncertainty based on the probabilistic approach. One such measure is statistical 266
reliability, which can be expressed as a ratio of the ensemble spread and the RMSE 267
(SPRvERR). In a perfectly reliable ensemble forecast, forecast probabilities match 268
the observed frequencies, and the SPRvERR is equal to one. Individual NMME and 269
the MME mean April forecasts are found to be underdispersed (or overconfident; 270
Table 4). Detrending the time series enhances reliability quite a bit which indicates 271
that poor low-frequency variability of the predicted NA TC frequency is indeed a 272
distinct source of forecast error. These results are similar to our findings in Project 273
Minerva (Manganello et al. 2016). 274
To further illustrate the above results, Fig.4 shows seasonal mean TC frequency 275
predicted by the CCSM4 and CanCM4 models along with their ensemble information 276
compared with observations. Both models capture year-to-year fluctuations quite 277
well, particularly in the 1990s and early 2000s where only several seasons fall 278
outside the 10th-90th percentile range (1992, 1997, and 2005 for CCSM4; and 1992, 279
1995, 1997 and 2005 for CanCM4). Neither of the models reproduces the secular 280
trend, and the hindcast skill appears to be inferior in the 1980s and 2010s, which is 281
further discussed below. 282
2) TC days and TC track density 283
Seasonally accumulated lifetime of all TCs in the basin, or “TC days” (see 284
definition in Section 1), exhibits retrospective correlation skill behavior quite 285
14
comparable to TC frequency (Table 5). The forecasts that are skillful in predicting 286
TC frequency are to the most part also skillful in predicting TC days. For MJJASON 287
forecasts initialized in April the correlation of the MME mean TC days is not high but 288
significant (0.46), and increases to 0.59 at shorter leads (July and August 289
initializations). It is curious that reanalyses reproduce variability of TC days 290
seemingly better than TC frequency (using current tracking), where correlation for 291
TC days doesn’t drop below 0.76 (Table 5). 292
One of the current challenges of seasonal TC forecasting is to provide regional 293
information, such as local TC occurrence or probability of landfall, which is more 294
relevant for decision-making (e.g., Vecchi et al. 2014; Camp et al. 2015; Manganello 295
et al. 2016; Murakami et al. 2016). Here we examine whether MME forecasts of the 296
NA TC activity have retrospective skill on sub-basin scales using track density as a 297
metric and Spearman rank correlation as a measure of performance (see 298
Manganello et al. 2016 for more detail). We compare this skill to the rank 299
correlation between the seasonal mean observed and reanalyses-derived track 300
densities. All three reanalysis products are quite successful at reproducing 301
interannual variability of regional TC activity over most of the NA domain (Figs. 5a-302
c). The regions with significant correlations common to all products are the MDR, 303
the Caribbean Sea, the Gulf of Mexico and central subtropical North Atlantic. These 304
regions also tend to show the highest correlation values. The results do not seem to 305
be particularly sensitive to whether the extended MJJASON season or the peak ASON 306
season is examined (Figs. 5e-g). In comparison, for the longer-lead MME forecasts 307
initialized in April the regions with significant skill are rather sparse and limited to 308

15
some parts of the MDR and the westernmost margins of the Caribbean Sea and the 309
Gulf of Mexico (Fig. 5d). The absence of any skill north of about 30°N is likely 310
related to strong underprediction of climatological tracks at these latitudes in the 311
NMME models (see Section 3a). At shorter leads (MME forecasts initialized in July), 312
the region with significant skill markedly increases and now covers the western part 313
of the MDR and the whole Caribbean Sea (Fig. 5h). Fairly high retrospective forecast 314
skill in the vicinity of Caribbean islands suggests that predictions of TC landfall 315
frequency in this region may also be skillful. Overall, the skill of regional TC activity 316
forecasts in the NMME is rather modest compared to other coupled prediction 317
systems that employ atmospheric models with much higher horizontal resolution 318
(see Vecchi et al. 2014; Manganello et al. 2016; Murakami et al. 2016). 319
320
c. Low-frequency variability in prediction skill 321
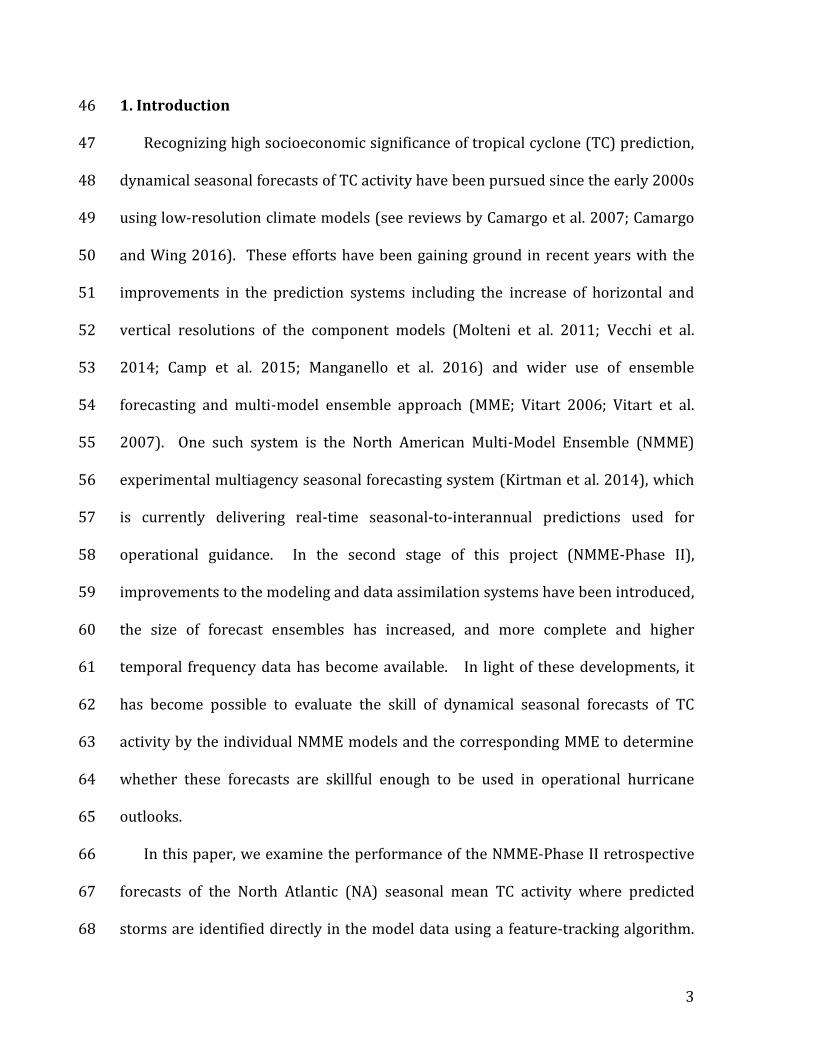
The NMME-Phase II ensemble exhibits variability in the retrospective forecast 322
skill of the NA TC frequency (Fig. 6). Compared to the reanalyses, which maintain 323
relatively constant skill throughout the hindcast period, the MME mean displays 324
markedly lower skill in the 1980s and early 1990s, and also late 2000s and 2010s 325
(Fig. 6a). During these two periods, the model skill deviates from the reanalyses. In 326
contrast, it is quite comparable to the reanalyses in the late 1990s and early 2000s. 327
Since the NA TC season peaks in August-October, forecasts initialized in June could 328
be considered short-lead forecasts of the full hurricane season. We find that at 329
shorter leads (Fig. 6b), forecast skill becomes more in line with the reanalyses in the 330

16
latter part of the record. This tendency is also present in forecasts initialized in May 331
(not shown). 332
Loss of skill in the 1980s is not unique to the NMME-Phase II models. Similar 333
behavior was also found in all Minerva hindcasts (Manganello et al. 2016) where it 334
was linked to more deficient initialization of ocean fields. It is also feasible that 335
predictability of the NA TC activity can fluctuate from one decade to another. The 336
influence of certain climatic factors that serve as predictors of the NA TC activity 337
may depend on the underlying climate conditions (Fink et al. 2010; Caron et al. 338
2015). Current seasonal prediction systems are perhaps able to reproduce some of 339
the relationships but not others or do not time them correctly, which may 340
contribute to the drop in skill. 341
While a detailed analysis of these influences is beyond the scope of the current 342
paper, as a first step we examine here the relationship between the NMME forecasts 343
of TC frequency and several well established predictors of the NA TC genesis, and 344
compare results to observations and reanalyses. The selected climate indices are: 1) 345
SST averaged over the MDR; 2) relative SST index6, and 3) the Niño-3.4 index7 (see, 346
e.g., Villarini et al. 2010; Vecchi et al. 2011; Caron et al. 2015 and the extensive lists 347
of references in these papers). Both observations and reanalyses suggest a stronger 348
relationship between the MDR SSTs and the NA TC frequency in the late 1990s and 349
early 2000s compared to the earlier and latter parts of the record where 350
correlations become marginally significant (Fig. 7a). The correlation with the 351
6 Relative SST index is defined as the difference between MDR SST and global tropical-mean SST (e.g., Zhao et al. 2010). 7 Niño-3.4 index is defined as SST averaged over 5°S-5°N, 120°-170°W.
17
relative SST index is higher and more constant throughout the time period (Fig. 7b), 352
as is the negative connection with the El Niño and the Southern Oscillation (ENSO) 353
except perhaps in 2000s where reanalyses data suggest a weakening of this 354
relationship (Fig. 7c). The NMME models and their MME mean tend to display 355
rather different behavior. During the earlier and latter parts of the hindcast period, 356
TC frequency forecasts appear to be much stronger driven by variations in the 357
predicted MDR SSTs and the relative SST index compared to the middle part of the 358
record, opposite to what observations and reanalyses demonstrate (Figs. 7a and b). 359
It is curious that the late 1990s and early 2000s when the MME correlations with 360
the MDR SSTs and the relative SST index are most realistic coincide with the period 361
of the highest MME TC frequency forecast skill (Fig. 6a). On the other hand, the rest 362
of the hindcast period when these correlations are too high and markedly outside 363
the range of the observed/reanalyses values is also when the forecast skill is at the 364
lowest levels as described above and shown in Fig. 6a. In addition, the retrospective 365
forecast skill of the MDR and relative SST indices is generally quite high except in 366
the 1980s and early 1990s when forecasts of the relative SST index are not skillful 367
(see Fig. S1 in the Supplementary Material). This could further limit the quality of 368
the TC frequency predictions during this time period. In contrast, the influence of 369
ENSO appears to be captured quite well by the MME forecasts, except possibly in the 370
1980s and late 2000s when it appears to be somewhat stronger (Fig. 7c); the 371
hindcast skill of the Niño-3.4 index is the highest among the indices examined and 372
also fairly constant throughout the record (Fig. S1). 373
374
18
d. Long- and short-lead forecasts 375
The NA TC hindcast skill as a function of the initialization month is shown in Fig. 376
8, along with the results for the reanalyses and measures of “null skill”. At longer 377
lead times (earlier than April), the MME mean shows marginal skill when initialized 378
in February relative to the IBTrACS trailing 5-yr average, which is a skill metric 379
recommended by the World Meteorological Organization (WMO 2008; Fig. 8a). In 380
this reference forecast, the interannual variability is smoothed out but the 381
interdecadal variability is preserved to some extent. The best performing forecasts 382
at long leads are produced by CanCM4 and are skillful for January and February 383
initializations. It is notable that for most models and the MME mean the skill curves 384
in Fig. 8a display substantial variability from month to month. This “noisiness” is 385
largely due to low-frequency variability being forecasted at varying levels of skill 386
depending on the initialization month. (Compare also with Fig. 8b that shows 387
similar metrics computed for the detrended time series and displaying a more 388
consistent increase in skill with lead time.) Relative to persistence, or the previous 389
season’s TC count, the detrended MME mean shows no long-lead skill except 390
perhaps when initialized in March. All detrended long-lead CanCM4 forecasts show 391
skill albeit marginal. 392
When the hurricane season is approached (March and June initializations) the 393
skill drops somewhat (Figs. 8a and b). At short lead times (July and August), it 394
rebounds and displays the highest levels overall (see also Table 2). It is notable that 395
all detrended MME mean forecasts initialized in April and later are consistently 396
skillful relative to persistence (Fig. 8b). The short-lead MME mean correlation skill 397

19
(RMSE) also shows the highest (lowest) value among all the models (detrended 398
only; see Tables 2 and 3). In addition, it becomes comparable to the skill of the 399
reanalyses. For instance, RMSEs of forecasts initialized in July are lower than for 400
CFSR and ERA-I (detrended only in the latter case; Table 3). The short-lead MME 401
mean forecasts are also quite reliable, although somewhat over-dispersed when 402
detrended (Table 4). It is curious that among the forecasts initialized in June 403
through August the best performing model is CanCM3, whereas it is one of the worst 404
performing at longer leads. If April forecasts were chosen as a benchmark and the 405
MME are based on two models with skill (CCSM4 and CanCM4), the resultant 406
correlation at short leads is markedly lower compared to the MME based on all 407
available models (not shown). This is one of the advantages of the multi-model 408
ensemble approach that is not always obvious. 409
The skill of the MME mean relative to the individual NMME-Phase II models and 410
the reanalyses is further assessed using the difference between the squared error as 411
a skill metric and testing the significance by applying the Wilcoxon signed-rank test 412
(see Fig. 9; DelSole and Tippett, 2014). In the vast majority of cases, the MME mean 413
outperforms the individual model with differences being statistically significant at 414
short lead times (June and July initializations). Relative to the reanalyses, the MME 415
mean shows larger error most of the time (except at short leads with respect to 416
CFSR), although it is significant primarily at long leads and when compared to 417
MERRA only. It is also notable that at most lead times, the reliability is improved 418
slightly for the MME mean and to a larger extent when the time series are detrended 419
(not shown). 420

20
421
4. Summary and conclusions 422
In this study, the NMME-Phase II models are interrogated in terms of the 423
retrospective seasonal forecast skill of the NA TC frequency. The TCs are identified 424
explicitly in the model data by means of an objective feature-tracking methodology. 425
Due to the synoptic nature of these storms, daily resolution (the highest available 426
for the ensemble) is generally considered coarse for TC tracking. As part of this 427
work, we have adjusted the TC identification and tracking algorithm to work with 428
daily data and also applied it to three reanalysis products (CFSR, ERA-I and MERRA) 429
that were coarsened to have the same spatial and temporal resolution of the NMME-430
Phase II ensemble. The latter step provides additional verification data (apart from 431
best track data) where the effects of resolution and the TC identification approach 432
have been isolated which allows for a more objective estimation of forecast skill. 433
The TC tracking method used here, when applied to reanalysis data, produces 434
realistic climatological distributions of the NA TC formation and tracks. Low track 435
density in the extra-tropics is a common deficiency, which is a result of tracking 436
using daily data. The tracking is also quite skillful in reproducing the interannual 437
variability of the TC frequency relative to the IBTrACS with correlations ranging 438
between 0.67 and 0.81 depending on the reanalysis product. These values are quite 439
comparable to the estimates obtained in Strachan et al. (2013) and Roberts et al. 440
(2015) where both studies utilized six-hourly data. 441
Long-lead (March and earlier) retrospective seasonal forecasts of the NA TC 442
frequency with the MME based on the available NMME-Phase II models are found to 443

21
have low or marginal skill, although one of the models (CanCM4) produces skillful 444
forecasts when initialized as early as in January and February. At shorter leads 445
(April and later), the MME mean forecasts are largely skillful with the best 446
performance for July and August initializations. Skill metrics evaluated for the 447
detrended time series display a more systematic increase in skill with shorter lead 448
time, and all detrended MME mean forecasts initialized in April and later are 449
consistently skillful. At short lead times (June through August), the MME mean also 450
tends to significantly outperform the individual models and attain skill comparable 451
to the reanalysis. The short-lead MME mean forecasts are also quite reliable, while 452
being under-dispersed at longer leads. 453
We have identified several deficiencies in the simulations that likely limit the 454
NMME-Phase II seasonal hindcast skill of the NA TC frequency. 455
1. None of the models or the MME mean independent of the initialization month 456
can realistically represent low-frequency variability characterized by low 457
activity in the 1980s and early 1990s and higher activity thereafter. The skill 458
metrics computed for the detrended time series show higher scores in the 459
vast majority of cases. This suggests that poor multi-year variability in the 460
forecasts may indeed be a source of forecast error. This problem is not trivial 461
and is characteristic of other prediction systems like Minerva (Manganello et 462
al. 2016) and several reanalysis products, e.g., MERRA and CFSR. It could be 463
related, for instance, to poor skill in reproducing downward trends in upper 464
tropospheric temperature (Emanuel et al. 2013; Vecchi et al. 2013), 465
inadequate representation of the effects of aerosols and ozone (Evan et al. 466

22
2009, 2011; Emanuel et al. 2013), possibly deficiencies in simulating tropical 467
heating and atmospheric teleconnections (Manganello et al. 2016), and the 468
sensitivity to the identification of weak and short-lived TCs in the model and 469
reanalysis data. 470
2. We have shown that the MME mean forecasts exhibit a large drop in skill in 471
the 1980s and early 1990s and also late 2000s and 2010s (mostly at longer 472
leads). It is curious that during the rest of the period (late 1990s and early 473
2000s), the MME mean skill is quite comparable to the reanalyses, which 474
maintain relatively constant skill throughout the hindcast time period. Early 475
in the record, forecast errors could be partly related to deficiencies in the 476
model initialization. Although the problem as a whole may be more complex 477
and indicate that certain physical relationships that underline predictability 478
of the NA TC activity may not be consistently reproduced or properly timed. 479
Addressing the above issues, while not an easy task, could lead to marked 480
improvements in the seasonal forecast skill and increase the value of the NMME 481
ensemble in providing operational guidance. 482
483
Acknowledgements. Funding of COLA for this study is provided by grants from NSF 484
(AGS-1338427), NOAA (NA09OAR4310058 and NA14OAR4310160), NASA 485
(NNX14AM19G), and the ONR grant (N00014-15-1-2745). We acknowledge NOAA 486
MAPP, NSF, NASA, and the DOE that support the NMME-Phase II system, and we 487
thank the climate modeling groups (Environment Canada, NASA, NCAR, 488
NOAA/GFDL, NOAA/NCEP, and University of Miami) for producing and making 489

23
available their model output. NOAA/NCEP, NOAA/CTB, and NOAA/CPO jointly 490
provided coordinating support and led development of the NMME-Phase II system. 491
We also gratefully acknowledge computing resources on the Yellowstone 492
supercomputer provided by the National Center for Atmospheric Research. 493
494

24
References 495
Camargo, S. J., A. G. Barnston, P. J. Klotzbach, and C. W. Landsea, 2007: Seasonal 496
tropical cyclone forecasts. World Meteorological Organization Bulletin, 56, 297-497
309. 498
Camargo, S. J., and A. A. Wing, 2016: Tropical cyclones in climate models. WIREs 499
Climate Change, 7, 211-237. 500
Camp, J., M. Roberts, C. MacLachlan, E. Wallace, L. Hermanson, A. Brookshaw, A. 501
Arribas, A. A. and Scaife, 2015: Seasonal forecasting of tropical storms using the 502
Met Office GloSea5 seasonal forecast system. Q.J.R. Meteorol. Soc., doi: 503
10.1002/qj.2516. 504
Caron, L.-P., M. Boudreault, and C. L. Bruyere, 2015: Changes in large-scale controls 505
of Atlantic tropical cyclone activity with the phases of the Atlantic multidecadal 506
oscillation. Clim. Dyn., 44, 1801-1821. 507
Dee, D. P., and Coauthors, 2011: The ERA-Interim reanalysis: configuration and 508
performance of the data assimilation system. Q.J.R. Meteorol. Soc., 137, 553–597. 509
doi: 10.1002/qj.828 510
DelSole, T., and M. K. Tippett, 2014: Comparing Forecast Skill, Mon. Weather Rev., 511
142(12), 4658–4678. 512
Emanuel, K. A., S. Solomon, D. Folini, S. Davis, and C. Cagnazzo, 2013: Influence of 513
tropical tropopause layer cooling on Atlantic Hurricane activity. J. Clim., 26, 514
2288–2301. 515
Evan, A. T., G. R. Foltz, D. Zhang, and D. J. Vimont, 2011: Influence of African dust on 516
ocean-atmosphere variability in the tropical Atlantic. Nature Geoscience, 4, 762-517

25
765. 518
Evan, A. T., D. J. Vimont, A. K. Heidinger, J. P. Kossin, ad R. Bennartz, 2009: The Role 519
of Aerosols in the Evolution of Tropical North Atlantic Ocean Temperature 520
Anomalies. Science, 324, 778-781. 521
Fink, A. H., J. M. Schrage, and S. Kotthaus, 2010: On the potential causes of the 522
nonstationary correlations between West African Precipitation and Atlantic 523
Hurricane Activity. J. Climate, 23, 5437-5456. 524
Goldenberg, S. B., C. W. Landsea, A. M. Mestas-Nu.ez, and W. M. Gray, 2001: The 525
recent increase in Atlantic hurricane activity: Causes and implications. Science, 526
293, 474–479. 527
Hodges, K. I., 1995: Feature tracking on the unit sphere. Mon. Wea. Rev., 123, 3458–528
3465. 529
Hodges, K. I., 1999: Adaptive constraints for feature tracking. Mon. Wea. Rev., 127, 530
1362–1373. 531
Kirtman, B.P., and Coauthors, 2014: The North American multimodel ensemble: 532
phase 1 seasonal-to-interannual prediction; phase-2 toward developing 533
intraseasoanl prediction. Bull. Am. Meteorol. Soc., 95, 585–601. 534
Knapp, K. R., M. C. Kruk, D. H. Levinson, H. J. Diamond, and C. J. Neumann, 2010: The 535
International Best Track Archive for Climate Stewardship (IBTrACS). Bull. Amer. 536
Meteor. Soc., 91, 363–376. 537
Manganello, J. V., K. I. Hodges, B. A. Cash, J. L. Kinter III, E. L. Altshuler, M. J. Fennessy, 538
F. Vitart, F. Molteni, and P. Towers, 2016: Seasonal Forecasts of Tropical Cyclone 539

26
Activity in a High Atmospheric Resolution Coupled Prediction System, J. Climate, 540
29, 1179-1200. 541
Manganello, J. V., K. I. Hodges, J. L. Kinter III, B. A. Cash, L. Marx, T. Jung, D. 542
Achuthavarier, J. M. Adams, E. L. Altshuler, B. Huang, E. K. Jin, C. Stan, P. 543
Towers and N. Wedi, 2012: Tropical Cyclone Climatology in a 10-km Global 544
Atmospheric GCM: Toward Weather-Resolving Climate Modeling. J. Climate, 25, 545
3867-3893. 546
Merryfield, W. J., and Coauthors, 2013: The Canadian seasonal to interannual 547
prediction system. Part I: Models and initialization. Mon. Wea. Rev., 141, 2910–548
2945. 549
Molteni, F., T. Stockdale, M. Balmaseda, G. Balsamo, R. Buizza, L. Ferranti, L. 550
Magnusson, K. Mogensen, T. Palmer, and F. Vitart, 2011: The new ECMWF 551
seasonal forecast system (System 4). ECMWF Technical Memorandum, No. 656, 552
pp. 49. 553
Murakami, H., G. A. Vecchi, G. Villarini, T. L. Delworth, R. Gudgel, S. Underwood, X. 554
Yang, W. Zhang, and S.-J. Lin, 2016: Seasonal forecasts of major hurricanes and 555
landfalling tropical cyclones using a high-resolution GFDL coupled climate 556
model. J. Climate, 29, 7977-7989. 557
Reynolds, R. W., N. A. Rayner, T. M. Smith, D. C. Stokes, and W. Wang, 2002: An 558
improved in situ and satellite SST analysis for climate. J. Climate, 15, 1609-1625. 559
Rienecker, M. M., and Coauthors, 2011: MERRA: NASA’s Modern-Era Retrospective 560
Analysis for Research and Applications. J. Climate, 24, 3624–3648. 561
Roberts, M. J., P. L. Vidale, M. S. Mizielinski, M.-E. Demory, R. Schiemann, J. Strachan, 562

27
K. Hodges, R. Bell, and J. Camp, 2015: Tropical Cyclones in the UPSCALE 563
Ensemble of High-Resolution Global Climate Models. J. Climate, 28, 574-596. 564
Saha, S., and Coauthors, 2010: The NCEP Climate Forecast System Reanalysis. Bull. 565
Am. Meteorol. Soc., 91(8), 1015–1057. 566
Smith, D. M., R. Eade, N. J. Dunstone, D. Fereday, J. M. Murphy, H. Pohlmann, and A. A. 567
Scaife, 2010: Skilful multi-year predictions of Atlantic hurricane frequency. 568
Nature Geoscience, 3, 846–849. 569
Strachan, J., Vidale, P. L., Hodges, K., Roberts, M., and Demory, M.-E., 2013: 570
Investigating global tropical cyclone activity with a hierarchy of AGCMs: the role 571
of model resolution. J. Climate, 26, 133–152. 572
Vecchi, G. A., T. Delworth, R. Gudgel, S. Kapnick, A. Rosati, A. T. Wittenberg, F. Zeng, 573
W. Anderson, V. Balaji, K. Dixon, L. Jia, H.-S. Kim, L. Krishnamurthy, R. Msadek, W. 574
F. Stern, S. D. Underwood, G. Villarini, X. Yang, and S. Zhang, 2014: On the 575
Seasonal Forecasting of Regional Tropical Cyclone Activity. J. Climate, 27, 7994–576
8016. 577
Vecchi, G. A., S. Fueglistaler, I. M. Held, T. R. Knutson, and M. Zhao, 2013: Impacts of 578
atmospheric temperature trends on tropical cyclone activity. J. Clim., 26, 3877–579
3891. 580
Vecchi, G. A., M. Zhao, H. Wang, G. Villarini, A. Rosati, A. Kumar, I. M. Held, and R. 581
Gudgel, 2011: Statistical-dynamical predictions of seasonal North Atlantic 582
hurricane activity. Mon. Wea. Rev., 139, 1070-1082. 583
Vernieres, G., C. Keppenne, M.M. Rienecker, J. Jacob, and R. Kovach, 2012: The GEOS-584
ODAS, description and evaluation. NASA Technical Report Series on Global 585

28
Modeling and Data Assimilation, NASA/TM–2012–104606, Vol. 30. 586
Villarini, G., G. A. Vecchi, and J. A. Smith, 2010: Modeling the dependence of tropical 587
storm counts in the North Atlantic basin on climate indices. Mon. Wea. Rev., 138, 588
2681-2705. 589
Vitart, F., 2006: Seasonal forecasting of tropical storm frequency using a multi-590
model ensemble. Q. J. R. Meteorol. Soc., 132, 647-666. 591
Vitart, F. 2016: Tropical cyclogenesis in the S2S Database. S2S News Letter, No. 3, 3-592
6. 593
Vitart, F., M. R. Huddleston, M. Déqué, D. Peake, T. N. Palmer, T. N. Stockdale, M. K. 594
Davey, S. Ineson, and A. Weisheimer, 2007: Dynamically-based seasonal 595
forecasts of Atlantic tropical storm activity issued in June by EUROSIP. Geophys. 596
Res. Lett., 34, L16815, doi:10.1029/2007GL030740. 597
Walsh, K. J. E., M. Fiorino, C. W. Landsea, K. L. McInnes, 2007: Objectively 598
Determined Resolution-Dependent Threshold Criteria for the Detection of 599
Tropical Cyclones in Climate Models and Reanalyses. J. Climate, 20, 2307–2314. 600
WMO, 2008: Report from expert meeting to evaluate skill of tropical cyclone 601
seasonal forecasts. World Meteorological Organization. Tech. Doc. 1455, 602
Geneva, Switzerland. 27 pp. 603
Zhao, M., I. M. Held, and G. A. Vecchi, 2010: Retrospective forecasts of the hurricane 604
season using a global atmospheric model assuming persistence of SST 605
anomalies. Mon. Wea. Rev., 138, 3858-3868. 606
607

29
608 609 610 611 612 613 614 615 616 617 618 619 620 621 622 623 624 625 626 627 628 629 630 631 632 633 634 635 636 637 638 639 640 641 642 643 644 645 646 647 Figure 1: NA genesis densities for the MJJASON season as number density per 648 season per unit area equivalent to a 5° spherical cap for (a) IBTrACS (OBS), (b) 649 CFSR, (c) ERA-I, and (d) MERRA reanalyses based on 1982-2014, and (e) CCSM4, (f) 650 GEOS-5, (g) CanCM3, and (h) CanCM4 seasonal hindcasts (all ensemble members) 651 based on the time periods listed in Table 1. 652 653

30
654 655 656 657 658 659 660 661 662 663 664 665 666 667 668 669 670 671 672 673 674 675 676 677 678 679 680 681 682 683 684 685 686 687 688 689 690 691 692 693 694 695 696 Figure 2: As in Fig. 1, but for the track density. 697 698

31
699 700 701 702 703 704 705 706 707 708 709 710 711 712 713 714 715 716 717 718 Figure 3: Time series of the NA MJJASON TC frequency based on the IBTrACS (OBS) 719 data (red), and the CFSR (black), ERA-I (blue) and MERRA (green) reanalysis data 720 sets. Linear trends for each time series are shown in the upper-left corner, units are 721 counts per season per year. 722 723

32
724 725 726 727 728 729 730 731 732 733 734 735 736 737 738 739 740 741 742 743 744 745 746 747 748 749 750 751 752 753 754 755 756 757 758 759 760 761 Figure 4: Retrospective forecasts (initialized in April) of the NA MJJASON TC 762 frequency for the (a) CCSM4 and (b) CanCM4 NMME-Phase II models. Red and black 763 lines show the observed time series and the ensemble-mean forecasts, respectively. 764 Black dots mark predictions from the individual ensemble members. Box-and-765 whisker plots denote the 25th-75th and 10th-90th percentile ranges. 766 767

33
768 769 770 771 772 773 774 775 776 777 778 779 780 781 782 783 784 785 786 787 788 789 790 791 792 793 794 795 796 797 798 799 800 801 802 803 804 Figure 5: Rank correlation between the MJJASON observed (IBTrACS) and 805 reanalysis-derived TC track densities for 1982-2014 using (a) CFSR, (b) ERA-I, and 806 (c) MERRA. TC track density is defined as number density per season per unit area 807 equivalent to a 5° spherical cap. (E)-(g) are the same as (a)-(c) but for the ASON 808 season. (D) and (h) show retrospective rank correlation of the observed vs. MME 809 predicted TC track density for MJJASON (April ICs) and ASON (July ICs) of 1982-810 2012, respectively. Values statistically significant at a two-sided p=0.1 level are 811 shown by color shading. Grey shading marks the regions where the observed track 812 density above zero for at least 25% of the years. 813

34
814 815 816 817 818 819 820 821 822 823 824 825 826 827 828 829 830 831 832 833 834 835 836 837 838 839 840 841 842 843 844 Figure 6: Sliding 15-year correlation of the predicted (ensemble mean) and 845 reanalysis NA TC frequency with the observed (IBTrACS) for the (a) May-November 846 season (forecasts initialized in April), and (b) July-November season (forecasts 847 initialized in June). NMME-Phase II model results are shown in black and solid line 848 for CCSM4, dotted for GEOS-5, long-dash-short-dash for CanCM3, and dot-dot-dash 849 for CanCM4. Results for the MME mean are shown in magenta, and blue for the 850 reanalyses (solid line for CFSR, long-dash-short-dash for ERA-I and dot-dot-dash for 851 MERRA). Horizontal dashed line signifies statistically significant correlation. 852 Horizontal axis marks the central year in the 15-year window. 853 854

35
855 856 857 858 859 860 861 862 863 864 865 866 867 868 869 870 871 872 873 874 875 876 877 878 879 880 881 882 883 884 885 886 887 888 889 Figure 7: Sliding 15-year correlation of the MJJASON NA TC frequency with the ASO 890 mean (a) MDR SST index; (b) relative SST index; and (c) Niño-3.4 index (see 891 definitions in the text) for observations (IBTrACS vs. OISSTv2), reanalysis and 892 ensemble mean forecasts (initialized in April). NMME-Phase II model results are 893 shown in black and solid line for CCSM4, dotted for GEOS-5, long-dash-short-dash 894 for CanCM3, and dot-dot-dash for CanCM4. Results for the MME mean are shown in 895 magenta, green for observations, and blue for the reanalyses (solid line for CFSR, 896 long-dash-short-dash for ERA-I and dot-dot-dash for MERRA). Grey shading 897 denotes the range of observed/reanalysis values. Horizontal dashed line signifies 898 statistically significant correlation. Horizontal axis marks the central year in the 15-899 year window. 900

36
901 902 903 904 905 906 907 908 909 910 911 912 913 914 915 916 917 918 919 920 921 922 923 924 925 926 927 928 929 930 931 932 Figure 8: Correlation skill of the seasonal mean NA TC frequency for the NMME-933 Phase II models, the MME mean and the reanalyses as a function of forecast lead 934 time, shown for the (a) full time series, and the (b) detrended time series. The solid 935 colored lines display the skill of the CCSM4 (orange), GEOS-5 (brown), CanCM3 936 (lilac), CanCM4 (violet), and the MME mean (magenta). The black lines show the 937 skill of CFSR (solid), ERA-I (long-dash), and MERRA (dot-dot-dash). Results shown 938 are for the May-November average for forecasts initialized in January through April; 939 June-November, July-November, August-November and September-November 940 means when initialized in May, June, July and August, respectively. For the full time 941 series, the skill is compared to a reference forecast comprising of the lagged 5-yr 942 average of the observed TC frequency (solid gray; WMO 2008), and to persistence, 943 or the previous season’s observed TC frequency, (long-dash grey) for the detrended 944 cases. 945 946

37
947 948 949 950 951 952 953 954 955 956 957 958 959 960 961 962 963 964 965 966 Figure 9: Difference between the squared error of the MME mean hindcasts and the 967 squared error of the NMME-Phase II model or reanalysis indicated on the vertical 968 axis, as a function of forecast lead time. Light blue (light red) color indicates that the 969 MME mean squared error is smaller (larger) than the respective model/reanalysis. 970 Dark blue (dark red) color indicates that the squared error of the MME mean is 971 significantly smaller (larger) than the comparison model/reanalysis at the 95% 972 confidence level using Wilcoxon signed-rank test. White blanks indicate that there 973 are no results due to incompleteness/unavailability of the model data. 974 975

38
Table 1. NMME-Phase II models and forecasts. 976
Model Name
Modeling Center Reference Hindcast
Period Ensemble
Size Lead Times
(months)
Atmospheric Model
Resolution
CCSM4
University of Miami-Rosenstiel School for Marine and Atmospheric Science (UM-RSMAS)
Kirtman et al. (in prep.)
1982-2014 10 0-11 0.9x1.25 deg.
L26
GEOS-5 National Aeronautics and Space Administration (NASA)
Verniers et al. (2012)
1982-2012 10 0-8 1x1.25 deg.
L72
CanCM3 Canadian Centre for Climate Modeling and Analysis (CCCMA)
Merryfield et al. (2013)
1981-2012 10 0-11 T63L31
CanCM4 Canadian Centre for Climate Modeling and Analysis (CCCMA)
Merryfield et al. (2013)
1981-2012 10 0-11 T63L35
977
978
39
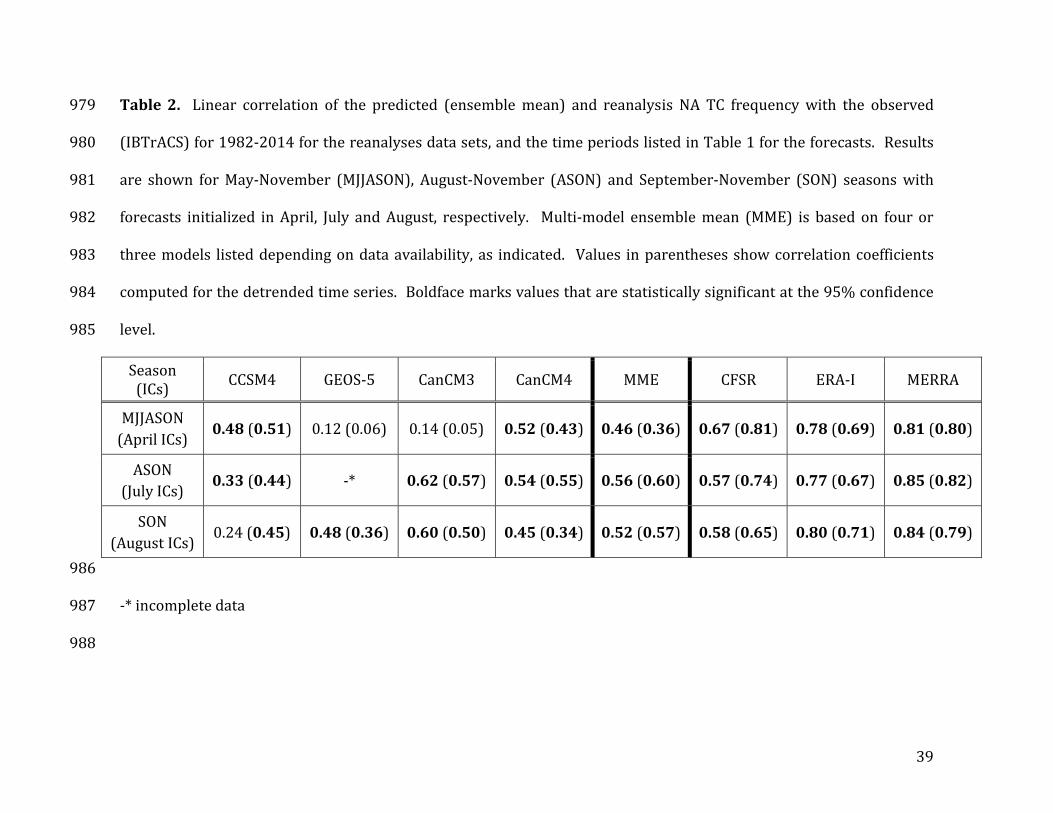
Table 2. Linear correlation of the predicted (ensemble mean) and reanalysis NA TC frequency with the observed 979
(IBTrACS) for 1982-2014 for the reanalyses data sets, and the time periods listed in Table 1 for the forecasts. Results 980
are shown for May-November (MJJASON), August-November (ASON) and September-November (SON) seasons with 981
forecasts initialized in April, July and August, respectively. Multi-model ensemble mean (MME) is based on four or 982
three models listed depending on data availability, as indicated. Values in parentheses show correlation coefficients 983
computed for the detrended time series. Boldface marks values that are statistically significant at the 95% confidence 984
level. 985
Season (ICs)
CCSM4 GEOS-5 CanCM3 CanCM4 MME CFSR ERA-I MERRA
MJJASON
(April ICs) 0.48 (0.51) 0.12 (0.06) 0.14 (0.05) 0.52 (0.43) 0.46 (0.36) 0.67 (0.81) 0.78 (0.69) 0.81 (0.80)
ASON
(July ICs) 0.33 (0.44) -* 0.62 (0.57) 0.54 (0.55) 0.56 (0.60) 0.57 (0.74) 0.77 (0.67) 0.85 (0.82)
SON
(August ICs) 0.24 (0.45) 0.48 (0.36) 0.60 (0.50) 0.45 (0.34) 0.52 (0.57) 0.58 (0.65) 0.80 (0.71) 0.84 (0.79)
986
-* incomplete data 987
988
40
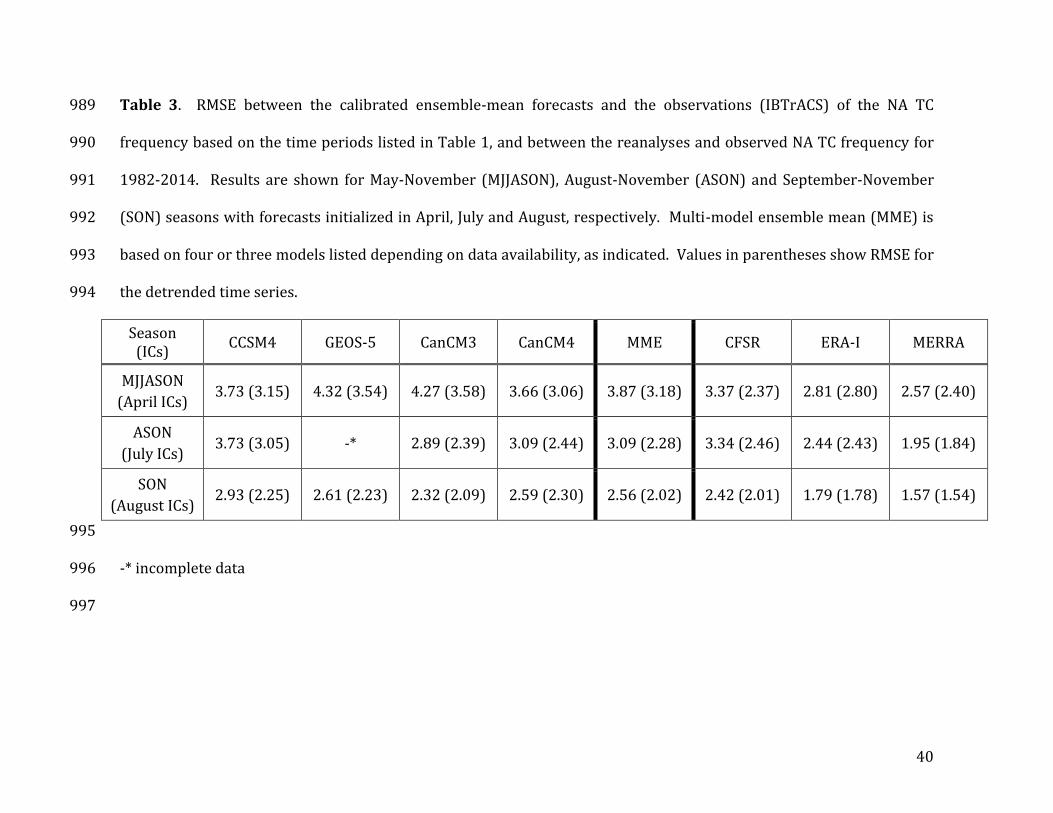
Table 3. RMSE between the calibrated ensemble-mean forecasts and the observations (IBTrACS) of the NA TC 989
frequency based on the time periods listed in Table 1, and between the reanalyses and observed NA TC frequency for 990
1982-2014. Results are shown for May-November (MJJASON), August-November (ASON) and September-November 991
(SON) seasons with forecasts initialized in April, July and August, respectively. Multi-model ensemble mean (MME) is 992
based on four or three models listed depending on data availability, as indicated. Values in parentheses show RMSE for 993
the detrended time series. 994
Season (ICs)
CCSM4 GEOS-5 CanCM3 CanCM4 MME CFSR ERA-I MERRA
MJJASON
(April ICs) 3.73 (3.15) 4.32 (3.54) 4.27 (3.58) 3.66 (3.06) 3.87 (3.18) 3.37 (2.37) 2.81 (2.80) 2.57 (2.40)
ASON
(July ICs) 3.73 (3.05) -* 2.89 (2.39) 3.09 (2.44) 3.09 (2.28) 3.34 (2.46) 2.44 (2.43) 1.95 (1.84)
SON
(August ICs) 2.93 (2.25) 2.61 (2.23) 2.32 (2.09) 2.59 (2.30) 2.56 (2.02) 2.42 (2.01) 1.79 (1.78) 1.57 (1.54)
995
-* incomplete data 996
997

41
Table 4. The SPRvERR for the calibrated predicted NA TC frequency based on the time periods listed in Table 1. 998
Results are shown for May-November (MJJASON), August-November (ASON) and September-November (SON) seasons 999
with forecasts initialized in April, July and August, respectively. Multi-model ensemble mean (MME) is based on four or 1000
three models listed depending on data availability, as indicated. Values in parentheses show SPRvERR for the 1001
detrended time series. 1002
1003
1004
1005
1006
1007
1008
1009
-* incomplete data 1010
1011
Season (ICs)
CCSM4 GEOS-5 CanCM3 CanCM4 MME
MJJASON
(April ICs) 0.79 (0.91) 0.59 (0.70) 0.60 (0.69) 0.74 (0.86) 0.74 (0.88)
ASON
(July ICs) 0.74 (0.88) -* 0.93 (1.07) 0.93 (1.11) 1.00 (1.31)
SON
(August ICs) 0.75 (0.93) 0.77 (0.88) 0.96 (1.04) 0.90 (0.99) 0.97 (1.20)

42
Table 5. As in Table 2 but for TC days. Only values for the full time series are shown. 1012
1013
Season (ICs)
CCSM4 GEOS-5 CanCM3 CanCM4 MME CFSR ERA-I MERRA
MJJASON
(April ICs) 0.39 0.21 0.29 0.57 0.46 0.85 0.82 0.82
ASON
(July ICs) 0.37 -* 0.67 0.55 0.59 0.80 0.82 0.83
SON
(August ICs) 0.37 0.54 0.66 0.38 0.59 0.76 0.80 0.79
1014
-* incomplete data 1015
1016