Embed Size (px)
Citation preview
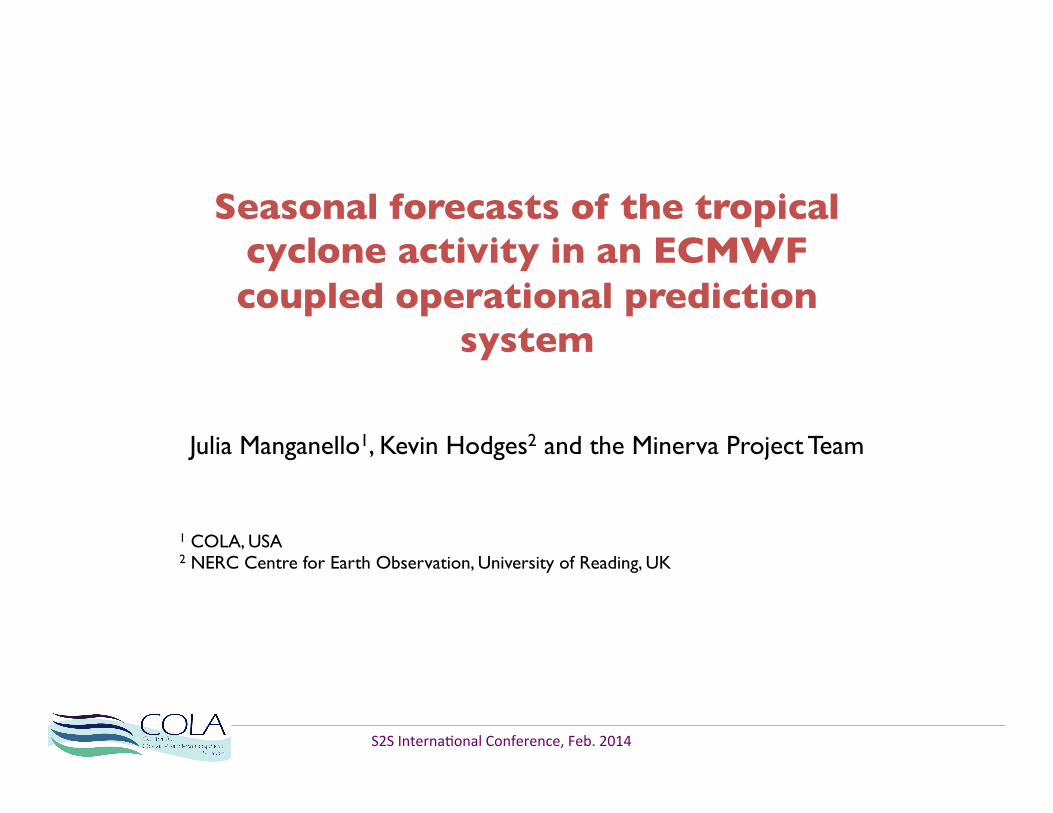
Seasonal forecasts of the tropical cyclone activity in an ECMWF coupled operational prediction
system
Julia Manganello1, Kevin Hodges2 and the Minerva Project Team
1 COLA, USA 2 NERC Centre for Earth Observation, University of Reading, UK
S2S Interna*onal Conference, Feb. 2014
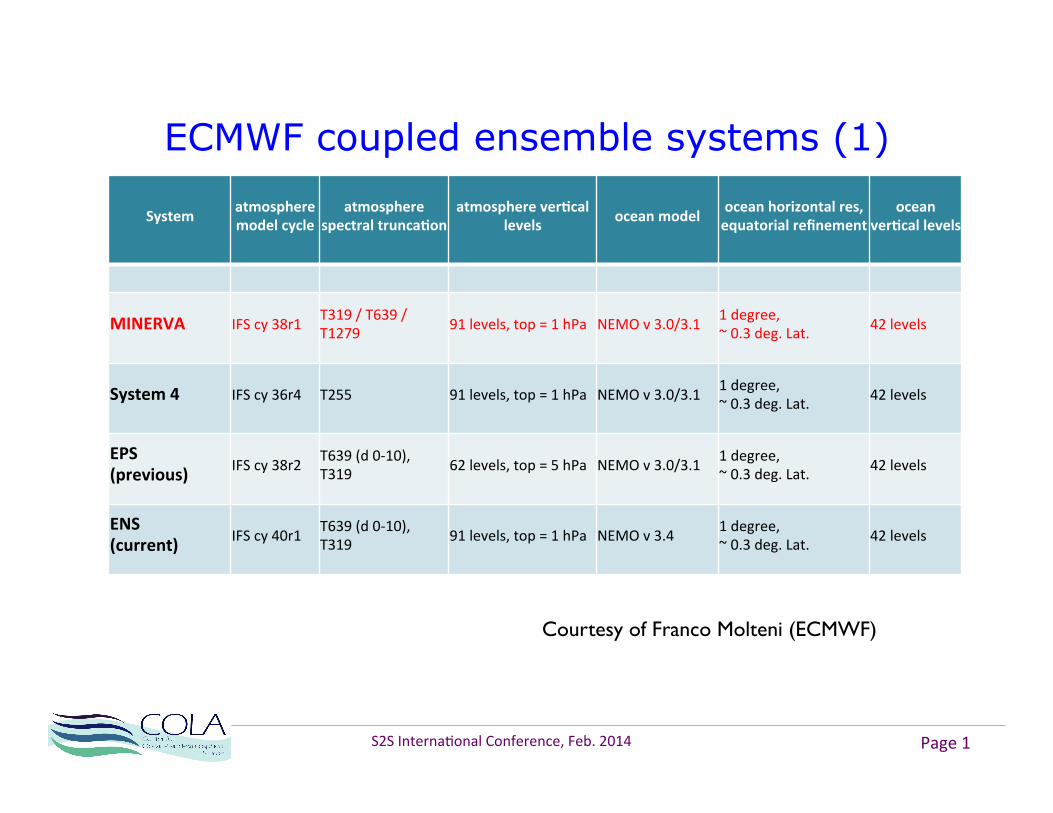
ECMWF coupled ensemble systems (1)
System atmosphere model cycle
atmosphere spectral trunca2on
atmosphere ver2cal levels ocean model ocean horizontal res,
equatorial refinement ocean
ver2cal levels
MINERVA IFS cy 38r1 T319 / T639 / T1279 91 levels, top = 1 hPa NEMO v 3.0/3.1 1 degree,
~ 0.3 deg. Lat. 42 levels
System 4 IFS cy 36r4 T255 91 levels, top = 1 hPa NEMO v 3.0/3.1 1 degree, ~ 0.3 deg. Lat. 42 levels
EPS (previous) IFS cy 38r2 T639 (d 0-‐10),
T319 62 levels, top = 5 hPa NEMO v 3.0/3.1 1 degree, ~ 0.3 deg. Lat. 42 levels
ENS (current) IFS cy 40r1 T639 (d 0-‐10),
T319 91 levels, top = 1 hPa NEMO v 3.4 1 degree, ~ 0.3 deg. Lat. 42 levels
S2S Interna*onal Conference, Feb. 2014 Page 1
Courtesy of Franco Molteni (ECMWF)
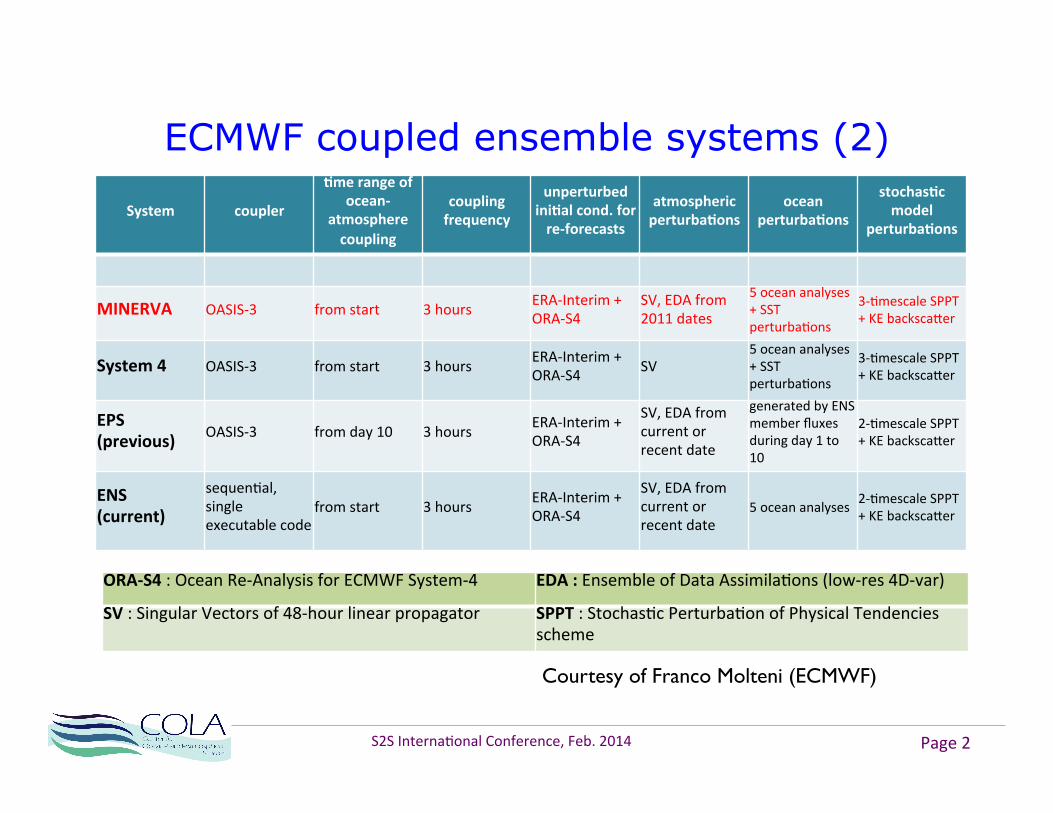
ECMWF coupled ensemble systems (2)
System coupler
2me range of ocean-‐
atmosphere coupling
coupling frequency
unperturbed ini2al cond. for re-‐forecasts
atmospheric perturba2ons
ocean perturba2ons
stochas2c model
perturba2ons
MINERVA OASIS-‐3 from start 3 hours ERA-‐Interim + ORA-‐S4
SV, EDA from 2011 dates
5 ocean analyses + SST perturba*ons
3-‐*mescale SPPT + KE backsca[er
System 4 OASIS-‐3 from start 3 hours ERA-‐Interim + ORA-‐S4 SV
5 ocean analyses + SST perturba*ons
3-‐*mescale SPPT + KE backsca[er
EPS (previous) OASIS-‐3 from day 10 3 hours ERA-‐Interim +
ORA-‐S4
SV, EDA from current or recent date
generated by ENS member fluxes during day 1 to 10
2-‐*mescale SPPT + KE backsca[er
ENS (current)
sequen*al, single executable code
from start 3 hours ERA-‐Interim + ORA-‐S4
SV, EDA from current or recent date
5 ocean analyses 2-‐*mescale SPPT + KE backsca[er
ORA-‐S4 : Ocean Re-‐Analysis for ECMWF System-‐4 EDA : Ensemble of Data Assimila*ons (low-‐res 4D-‐var)
SV : Singular Vectors of 48-‐hour linear propagator SPPT : Stochas*c Perturba*on of Physical Tendencies scheme
S2S Interna*onal Conference, Feb. 2014 Page 2
Courtesy of Franco Molteni (ECMWF)
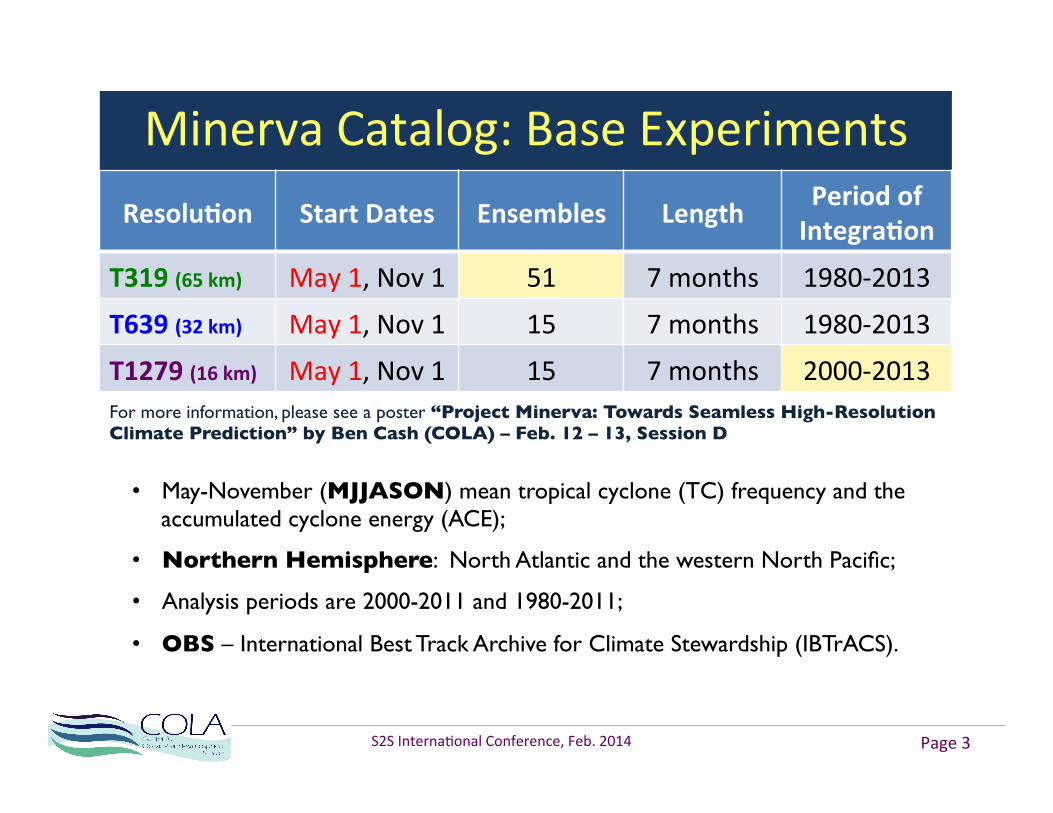
Minerva Catalog: Base Experiments
Resolu2on Start Dates Ensembles Length Period of Integra2on
T319 (65 km) May 1, Nov 1 51 7 months 1980-‐2013
T639 (32 km) May 1, Nov 1 15 7 months 1980-‐2013
T1279 (16 km) May 1, Nov 1 15 7 months 2000-‐2013
S2S Interna*onal Conference, Feb. 2014 Page 3
For more information, please see a poster “Project Minerva: Towards Seamless High-Resolution Climate Prediction” by Ben Cash (COLA) – Feb. 12 – 13, Session D
• May-November (MJJASON) mean tropical cyclone (TC) frequency and the accumulated cyclone energy (ACE);
• Northern Hemisphere: North Atlantic and the western North Pacific;
• Analysis periods are 2000-2011 and 1980-2011;
• OBS – International Best Track Archive for Climate Stewardship (IBTrACS).
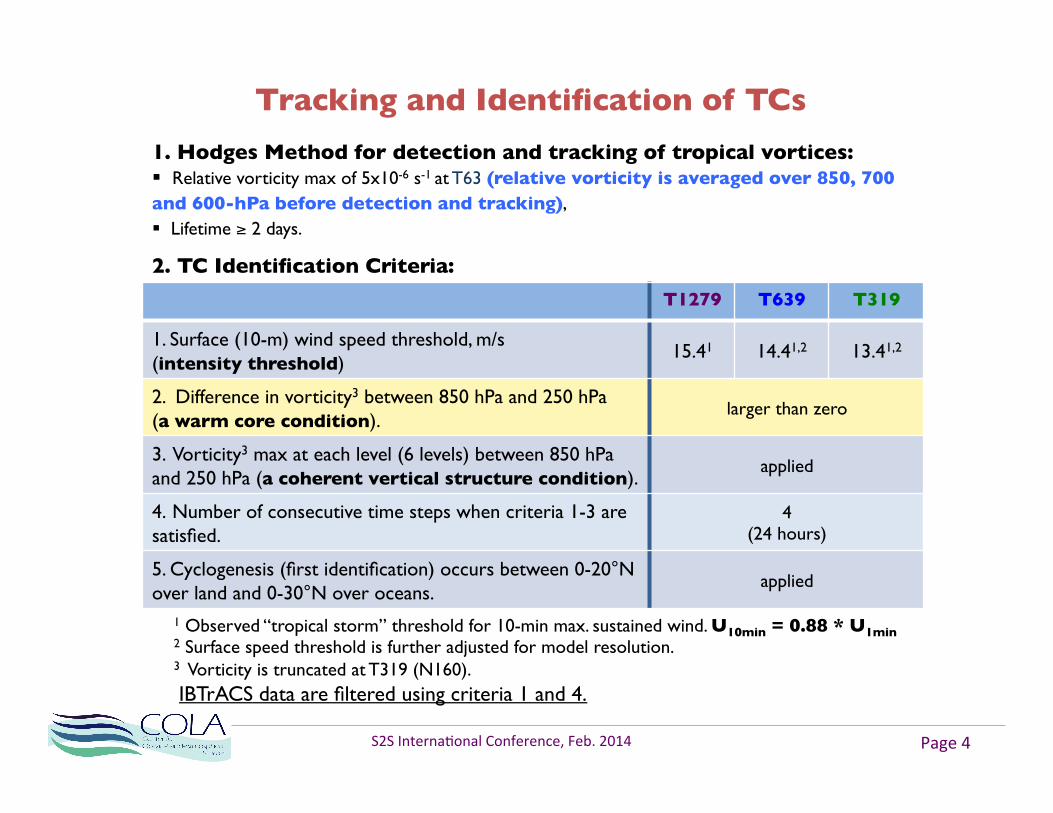
Tracking and Identification of TCs
T1279 T639 T319
1. Surface (10-m) wind speed threshold, m/s (intensity threshold)
15.41 14.41,2 13.41,2
2. Difference in vorticity3 between 850 hPa and 250 hPa (a warm core condition).
larger than zero
3. Vorticity3 max at each level (6 levels) between 850 hPa and 250 hPa (a coherent vertical structure condition).
applied
4. Number of consecutive time steps when criteria 1-3 are satisfied.
4 (24 hours)
5. Cyclogenesis (first identification) occurs between 0-20°N over land and 0-30°N over oceans.
applied
2. TC Identification Criteria:
1. Hodges Method for detection and tracking of tropical vortices: § Relative vorticity max of 5x10⁻⁶ s-1 at T63 (relative vorticity is averaged over 850, 700 and 600-hPa before detection and tracking), § Lifetime ≥ 2 days.
1 Observed “tropical storm” threshold for 10-min max. sustained wind. U10min = 0.88 * U1min 2 Surface speed threshold is further adjusted for model resolution. 3 Vorticity is truncated at T319 (N160). IBTrACS data are filtered using criteria 1 and 4.
S2S Interna*onal Conference, Feb. 2014 Page 4
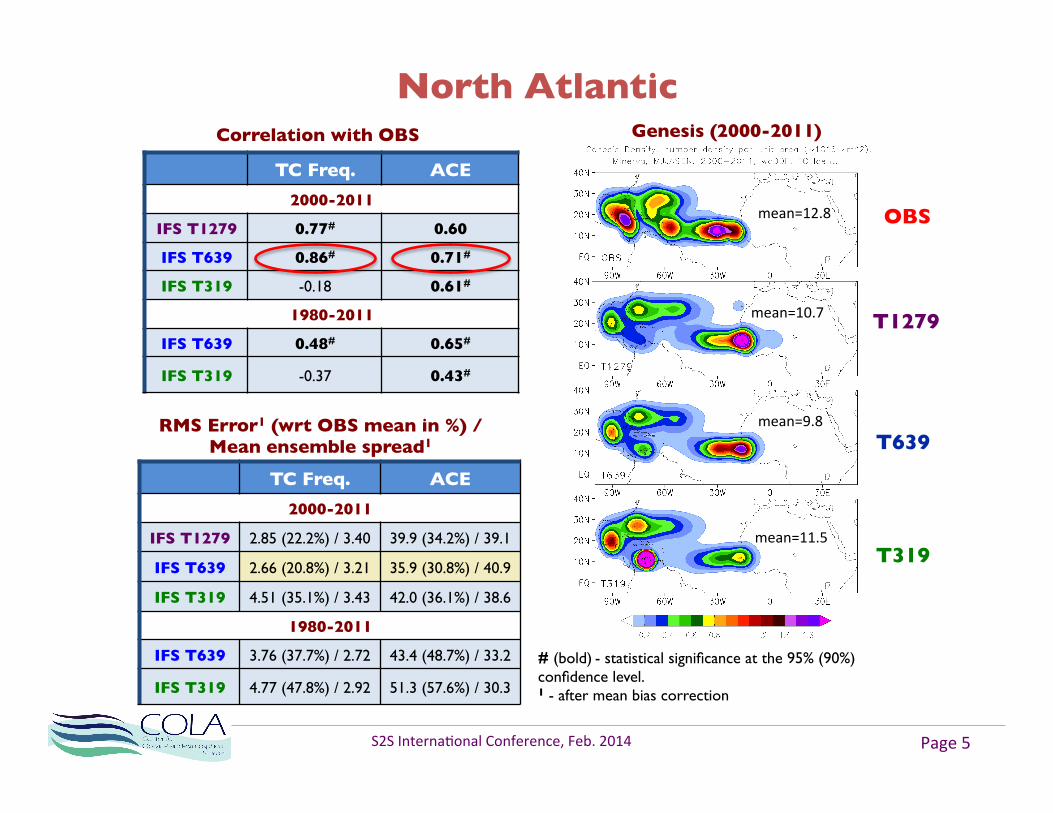
RMS Error1 (wrt OBS mean in %) / Mean ensemble spread1
TC Freq. ACE
2000-2011
IFS T1279 0.77# 0.60
IFS T639 0.86# 0.71#
IFS T319 -0.18 0.61#
1980-2011
IFS T639 0.48# 0.65#
IFS T319 -0.37 0.43#
Genesis (2000-2011)
North Atlantic
Correlation with OBS
TC Freq. ACE
2000-2011
IFS T1279 2.85 (22.2%) / 3.40 39.9 (34.2%) / 39.1
IFS T639 2.66 (20.8%) / 3.21 35.9 (30.8%) / 40.9
IFS T319 4.51 (35.1%) / 3.43 42.0 (36.1%) / 38.6
1980-2011
IFS T639 3.76 (37.7%) / 2.72 43.4 (48.7%) / 33.2
IFS T319 4.77 (47.8%) / 2.92 51.3 (57.6%) / 30.3
OBS
T1279
T639
T319
mean=12.8
mean=10.7
mean=9.8
mean=11.5
# (bold) - statistical significance at the 95% (90%) confidence level. 1 - after mean bias correction
S2S Interna*onal Conference, Feb. 2014 Page 5
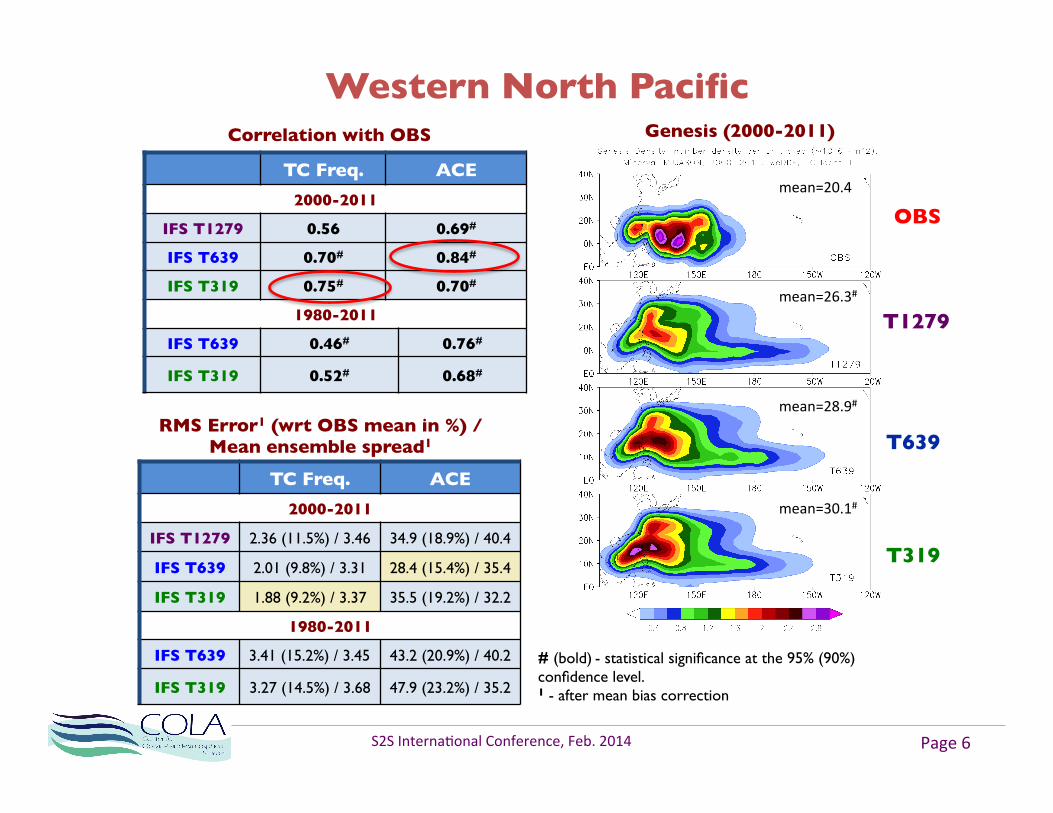
RMS Error1 (wrt OBS mean in %) / Mean ensemble spread1
TC Freq. ACE
2000-2011
IFS T1279 0.56 0.69#
IFS T639 0.70# 0.84#
IFS T319 0.75# 0.70#
1980-2011
IFS T639 0.46# 0.76#
IFS T319 0.52# 0.68#
Genesis (2000-2011)
Western North Pacific
Correlation with OBS
TC Freq. ACE
2000-2011
IFS T1279 2.36 (11.5%) / 3.46 34.9 (18.9%) / 40.4
IFS T639 2.01 (9.8%) / 3.31 28.4 (15.4%) / 35.4
IFS T319 1.88 (9.2%) / 3.37 35.5 (19.2%) / 32.2
1980-2011
IFS T639 3.41 (15.2%) / 3.45 43.2 (20.9%) / 40.2
IFS T319 3.27 (14.5%) / 3.68 47.9 (23.2%) / 35.2
OBS
T1279
T639
T319
mean=20.4
mean=26.3#
mean=28.9#
mean=30.1#
S2S Interna*onal Conference, Feb. 2014 Page 6
# (bold) - statistical significance at the 95% (90%) confidence level. 1 - after mean bias correction
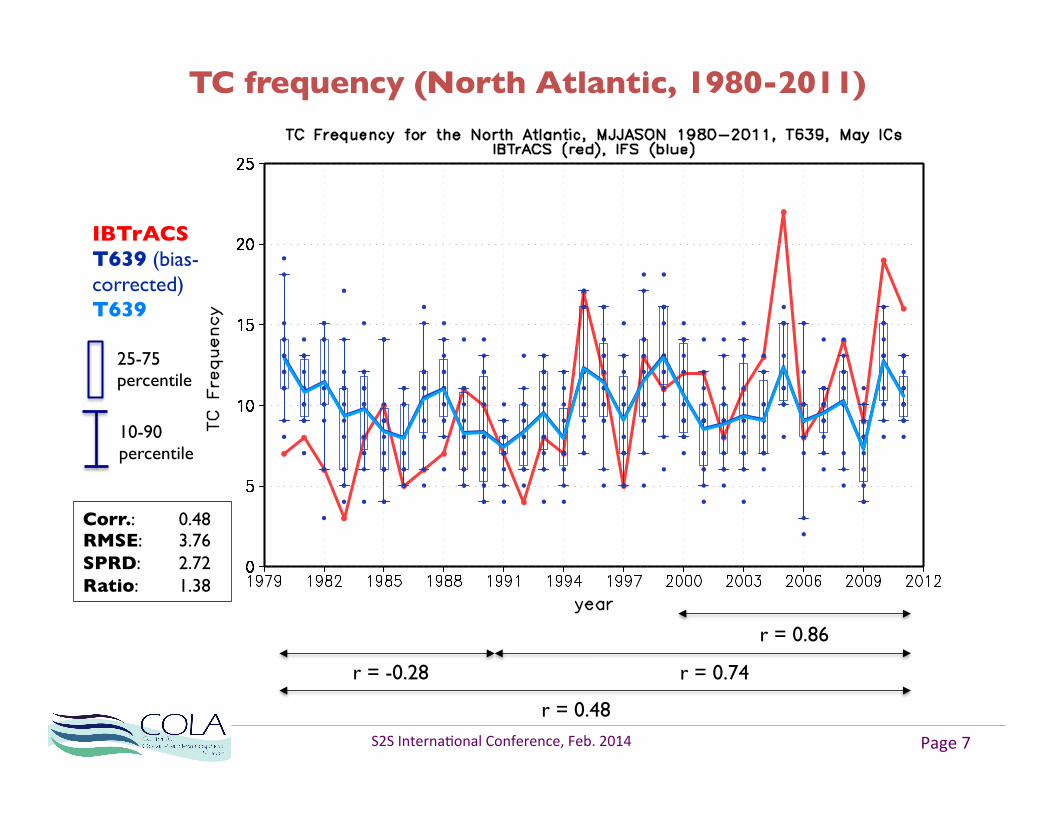
TC frequency (North Atlantic, 1980-2011)
IBTrACS T639 (bias-corrected) T639
r = 0.48
25-75 percentile
10-90 percentile
r = -0.28 r = 0.74
r = 0.86
Corr.: 0.48 RMSE: 3.76 SPRD: 2.72 Ratio: 1.38
S2S Interna*onal Conference, Feb. 2014 Page 7
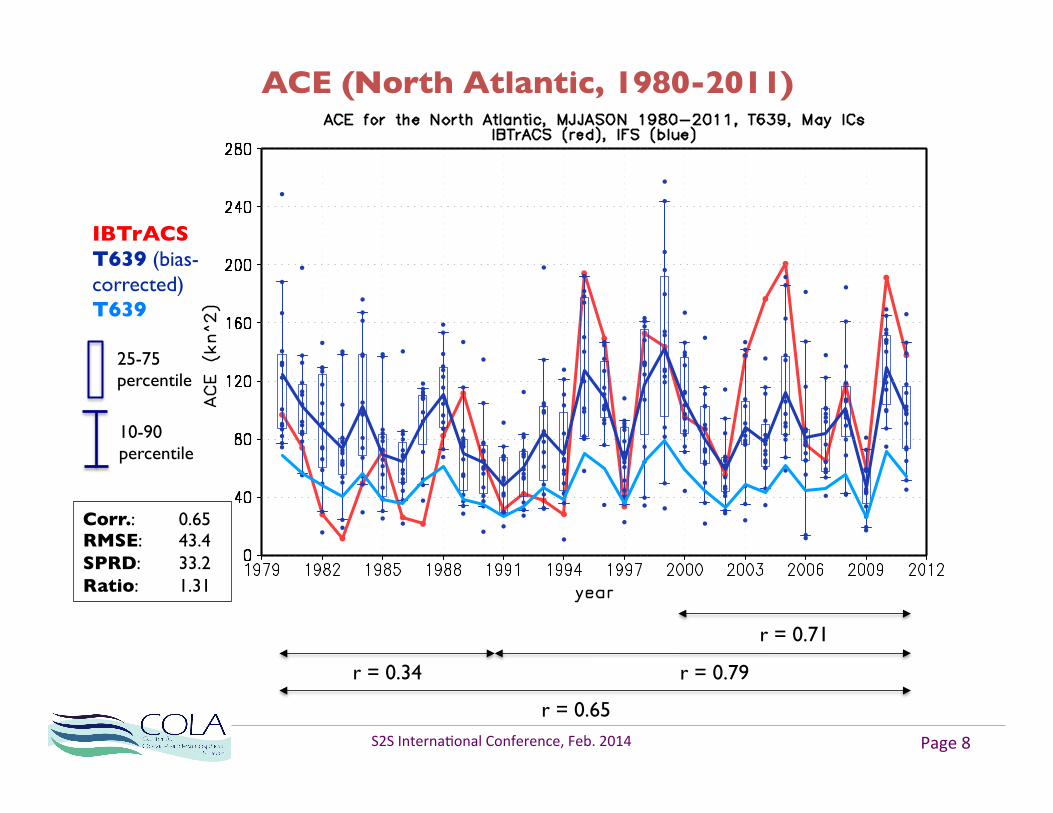
ACE (North Atlantic, 1980-2011)
r = 0.65
r = 0.34 r = 0.79
r = 0.71
IBTrACS T639 (bias-corrected) T639
25-75 percentile
10-90 percentile
Corr.: 0.65 RMSE: 43.4 SPRD: 33.2 Ratio: 1.31
S2S Interna*onal Conference, Feb. 2014 Page 8
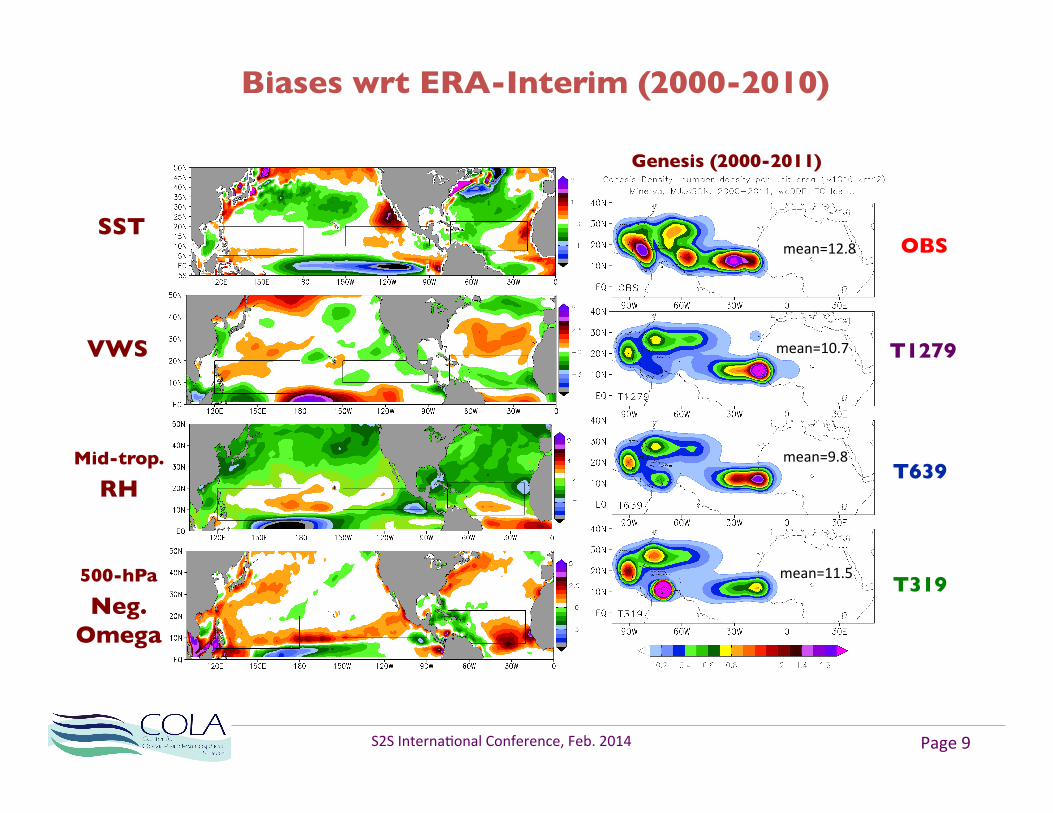
Biases wrt ERA-Interim (2000-2010)
VWS
SST OBS
T1279
T639
T319
Genesis (2000-2011)
Mid-trop.
RH
500-hPa
Neg. Omega
S2S Interna*onal Conference, Feb. 2014 Page 9
mean=12.8
mean=10.7
mean=9.8
mean=11.5
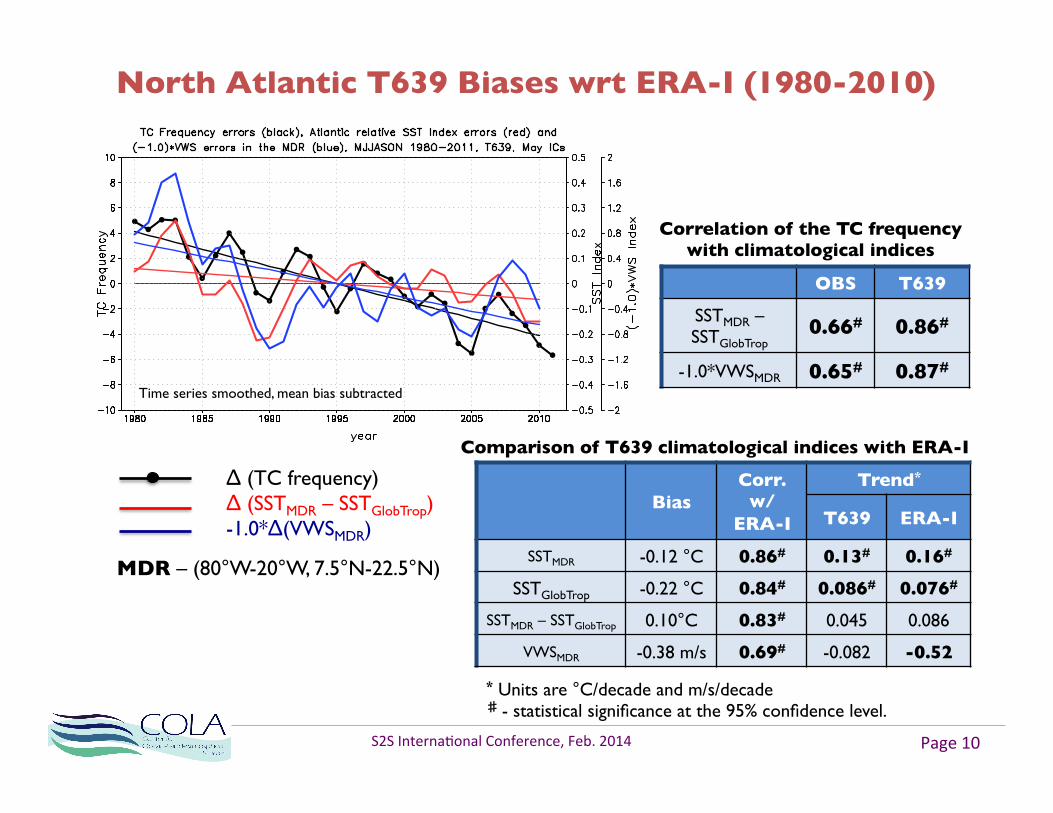
North Atlantic T639 Biases wrt ERA-I (1980-2010)
Δ (TC frequency) Δ (SSTMDR – SSTGlobTrop) -1.0*Δ(VWSMDR)
Time series smoothed, mean bias subtracted
OBS T639
SSTMDR – SSTGlobTrop
0.66# 0.86#
-1.0*VWSMDR 0.65# 0.87#
Correlation of the TC frequency with climatological indices
MDR – (80°W-20°W, 7.5°N-22.5°N)
Bias Corr.
w/ ERA-I
Trend*
T639 ERA-I
SSTMDR -0.12 °C 0.86# 0.13# 0.16#
SSTGlobTrop -0.22 °C 0.84# 0.086# 0.076#
SSTMDR – SSTGlobTrop 0.10°C 0.83# 0.045 0.086
VWSMDR -0.38 m/s 0.69# -0.082 -0.52
* Units are °C/decade and m/s/decade ♯ - statistical significance at the 95% confidence level.
Comparison of T639 climatological indices with ERA-I
S2S Interna*onal Conference, Feb. 2014 Page 10
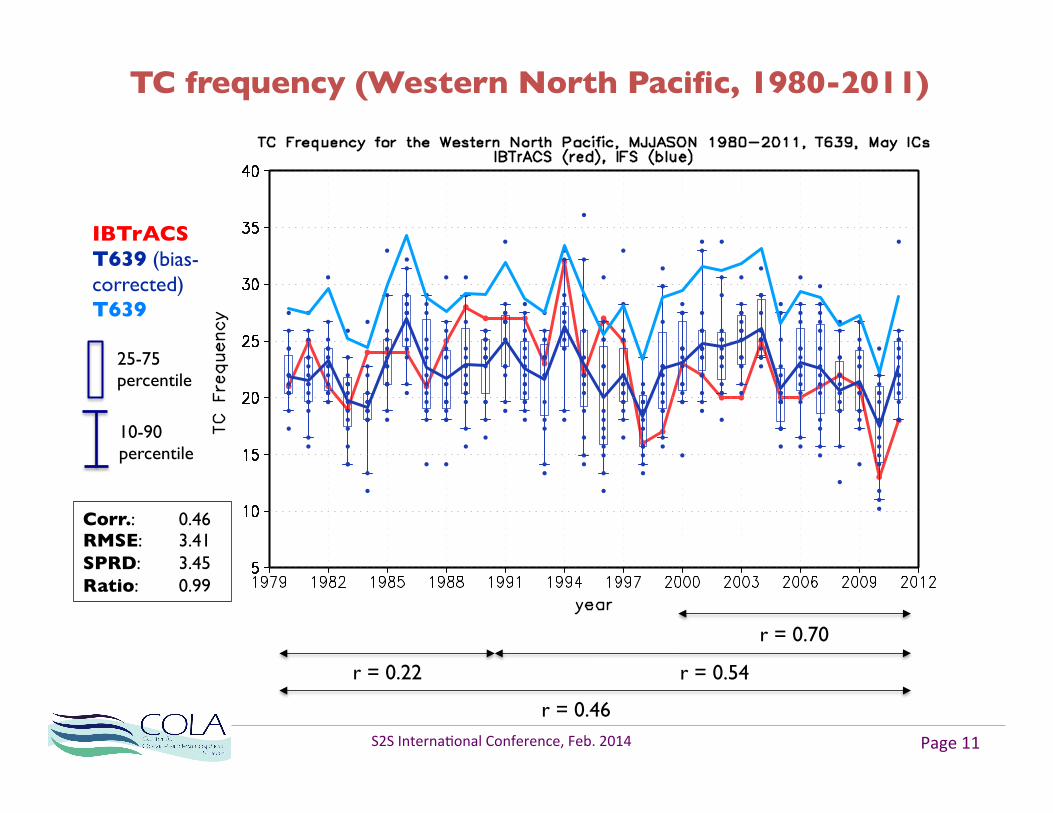
TC frequency (Western North Pacific, 1980-2011)
IBTrACS T639 (bias-corrected) T639
25-75 percentile
10-90 percentile
r = 0.46
r = 0.22 r = 0.54
r = 0.70
Corr.: 0.46 RMSE: 3.41 SPRD: 3.45 Ratio: 0.99
S2S Interna*onal Conference, Feb. 2014 Page 11
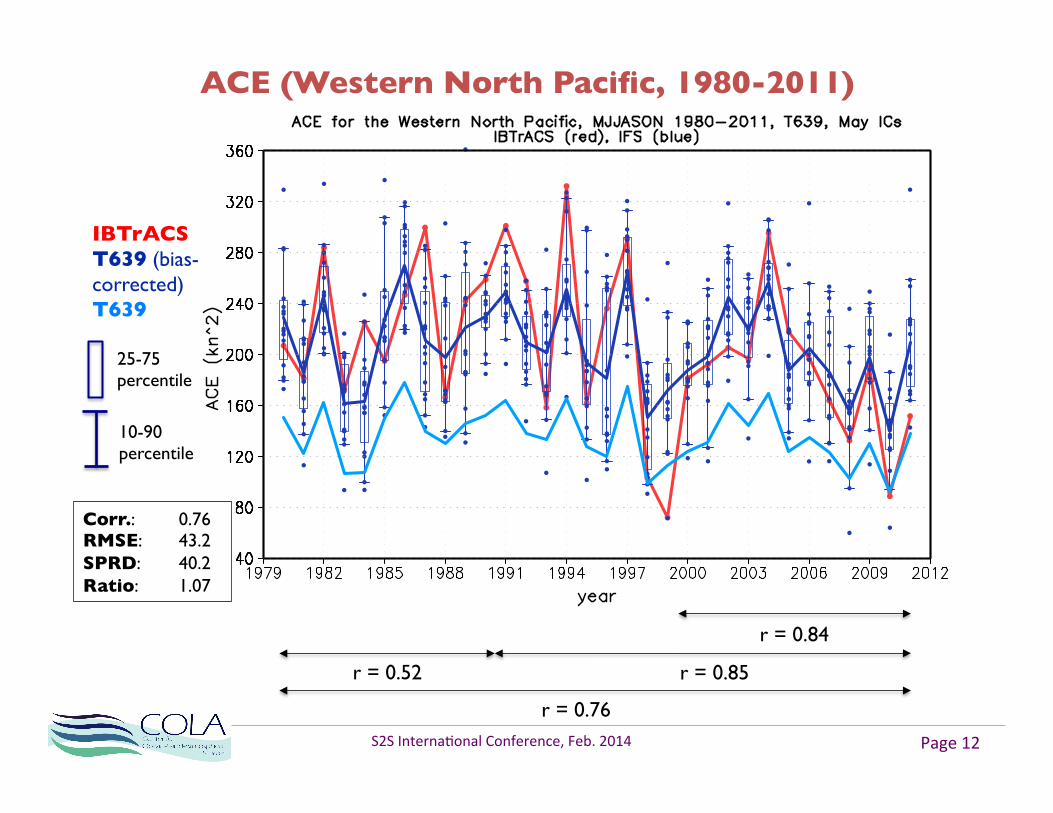
ACE (Western North Pacific, 1980-2011)
IBTrACS T639 (bias-corrected) T639
25-75 percentile
10-90 percentile
r = 0.76
r = 0.52 r = 0.85
r = 0.84
Corr.: 0.76 RMSE: 43.2 SPRD: 40.2 Ratio: 1.07
S2S Interna*onal Conference, Feb. 2014 Page 12
Summary and Conclusions
• Overall, the forecast skill of the seasonal mean TC frequency and the ACE in Minerva can be considered as good, particularly for the western North Pacific basin. • The largest errors in the North Atlantic are associated with the inability of the model to reproduce decadal scale changes (inactive/active periods or a trend). They appear to be primarily driven by errors in the MDR VWS which also shows no trend, rather than the relative SSTs. This suggests a possible connection to the tropical Pacific, although the actual mechanism is not clear.
S2S Interna*onal Conference, Feb. 2014 Page 13