Embed Size (px)
Citation preview

1
Seasonal Climate Watch May to September 2020
Date issued: April 30, 2020
1. Overview
The El Niño-Southern Oscillation (ENSO) is currently in a borderline weak El Niño state and
the forecast indicates that it will most likely remain at the border between the weak El Niño
and neutral states during early- and mid-winter. The influence of ENSO during the winter
months on South African rainfall and temperature is limited during the coming seasons, thus
there is no additional information to interpret with the seasonal forecasts.
The multi-model rainfall forecast for early- and mid-winter (May-Jun-Jul, Jun-Jul-Aug) indicate
increased chances of above-normal rainfall over the South-Western and Southern parts of the
country with drier than normal conditions throughout the rest of South Africa. In general,
most of the country is expected to experience above-normal temperatures during winter.
The South African Weather Service will continue to monitor and provide updates on any
future assessments that may provide more clarity on the current expectations for the coming
seasons.

2
2. South African Weather Service Prediction System
2.1. Ocean-Atmosphere Global Climate Model
The South African Weather Service (SAWS) is currently recognised by the World Meteorological
Organization (WMO) as the Global Producing Centre (GPC) for Long-Range Forecasts (LRF). This is
owing to its local numerical modelling efforts which involve coupling of both the atmosphere and
ocean components to form a fully-interactive coupled modelling system, named the SAWS Coupled
Model (SCM), the first of its kind in both South Africa and the region. Below are the first season (May-
June-July) predictions for rainfall (Figure 1) and average temperature (Figure 2).
Figure 1: May-June-July global prediction for total rainfall probabilities.

3
Figure 2: May-June-July global prediction for average temperature probabilities.
2.2. Seasonal Forecasts for South Africa from the SAWS OAGCM
The above mentioned global forecasting system’s forecasts are combined with the NOAA-GFDL and
NOAA-GFDL A06 systems (part of the North American Multi-Model Ensemble System) for South
Africa, as issued with the April 2020 initial conditions, and are presented below for South Africa.

4
Figure 3: May-June-July 2020 (MJJ; left), June-July-August 2020 (JJA; middle), July-August-September 2020 (JAS; right) seasonal precipitation prediction. Maps indicate the highest
probability from three probabilistic categories namely Above-Normal, Near-Normal and Below-Normal.

5
Figure 4: May-June-July 2020 (MJJ; left), June-July-August 2020 (JJA; middle), July-August-September 2020 (JAS; right) seasonal minimum temperature prediction. Maps indicate the
highest probability from three probabilistic categories namely Above-Normal, Near-Normal and Below-Normal.

6
Figure 5: May-June-July 2020 (MJJ; left), June-July-August 2020 (JJA; middle), July-August-September 2020 (JAS; right) seasonal maximum temperature prediction. Maps indicate the
highest probability from three probabilistic categories namely Above-Normal, Near-Normal and Below-Normal.

7
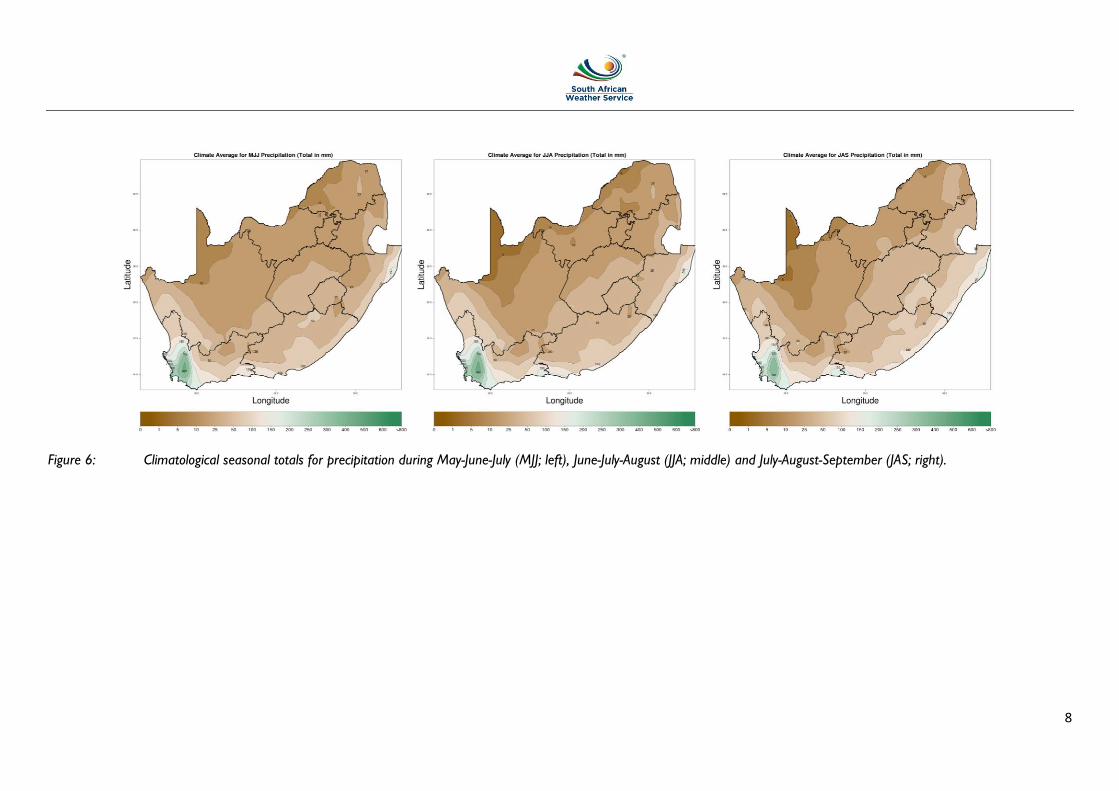
2.3. Climatological Seasonal Totals and Averages
The following maps indicate the rainfall and temperature (minimum and maximum) climatology for the autumn (Mar-
Apr-May), late-autumn (Apr-May-Jun) and the early-winter (May-Jun-Jul). The rainfall and temperature climate is
representative of the average rainfall and temperature conditions over a long period of time for the relevant 3-month
seasons presented here.
8
Figure 6: Climatological seasonal totals for precipitation during May-June-July (MJJ; left), June-July-August (JJA; middle) and July-August-September (JAS; right).

9
Figure 7: Climatological seasonal averages for minimum temperature during May-June-July (MJJ; left), June-July-August (JJA; middle) and July-August-September (JAS; right).

10
Figure 8: Climatological seasonal averages for maximum temperature during May-June-July (MJJ; left), June-July-August (JJA; middle) and July-August-September (JAS; right).
.

11
3. Contributing Institutions and Useful links
All the forecasts presented here are a result of the probabilistic prediction based on the ensemble members
from the coupled climate model from the South African Weather Service. Other useful links for seasonal
forecasts are:
http://www.weathersa.co.za/home/seasonal (Latest predictions from SAWS for the whole of SADC)
https://iri.columbia.edu/our-expertise/climate/forecasts/enso/current/ (ENSO predictions from various
centres)
https://iri.columbia.edu/our-expertise/climate/forecasts/seasonal-climate-forecasts/ (Copernicus Global
forecasts)