Embed Size (px)
DESCRIPTION
Seasonal Climate Diagnostics Consortium: Analysis of the NDJF 2002-03 climate forecasts and observations in NE U.S. (What the heck happened?). Tony Barnston, Arun Kumar, Lisa Goddard and Marty Hoerling CDPW, October 2003, Reno, Nevada. ‘ ‘. o. - PowerPoint PPT Presentation
Citation preview
Seasonal Climate Diagnostics Consortium:Analysis of the NDJF 2002-03 climateforecasts and observations in NE U.S.
(What the heck happened?)
Tony Barnston, Arun Kumar,Lisa Goddard and Marty Hoerling
CDPW, October 2003, Reno, Nevada
‘ ‘
o
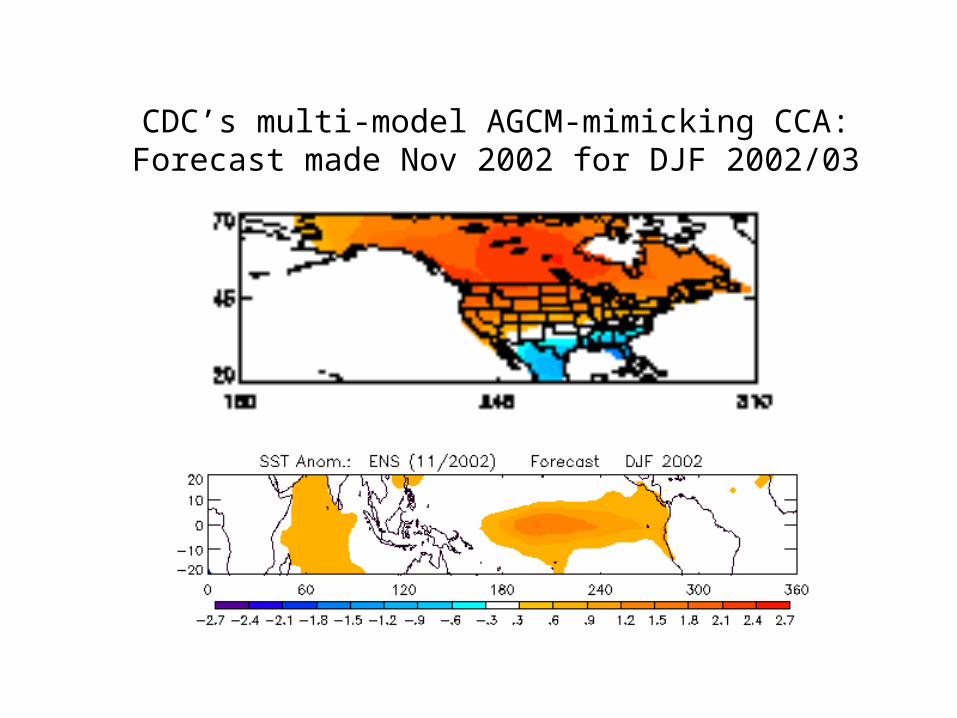
CDC’s multi-model AGCM-mimicking CCA:Forecast made Nov 2002 for DJF 2002/03
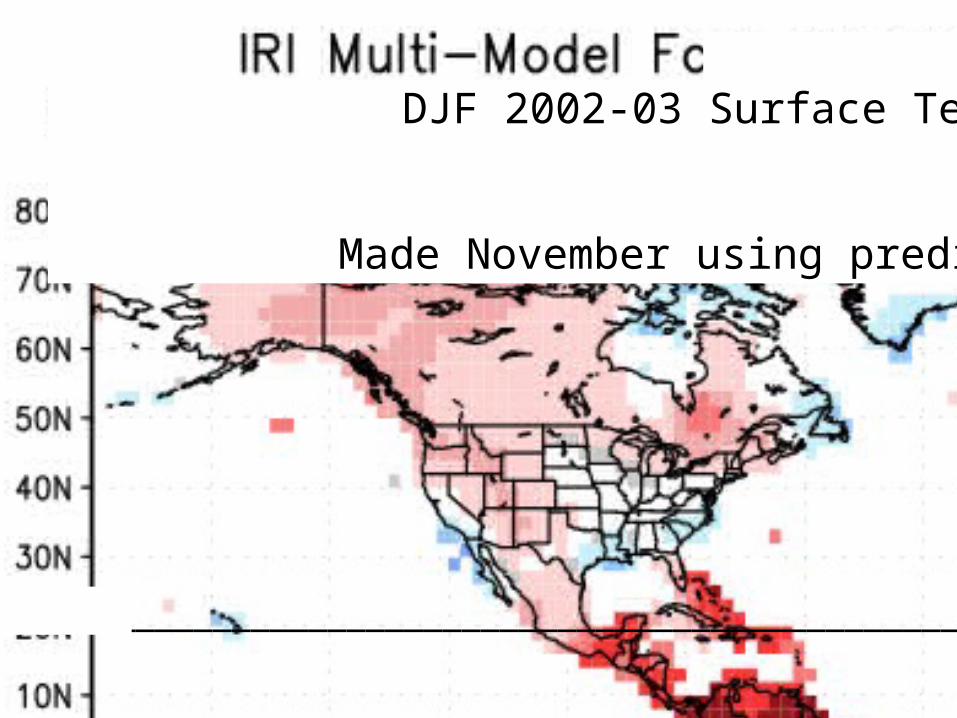
DJF 2002-03 Surface Temperature Made November using predicted SST
_______________________________________________________

Canonical surface temperature El Nino response
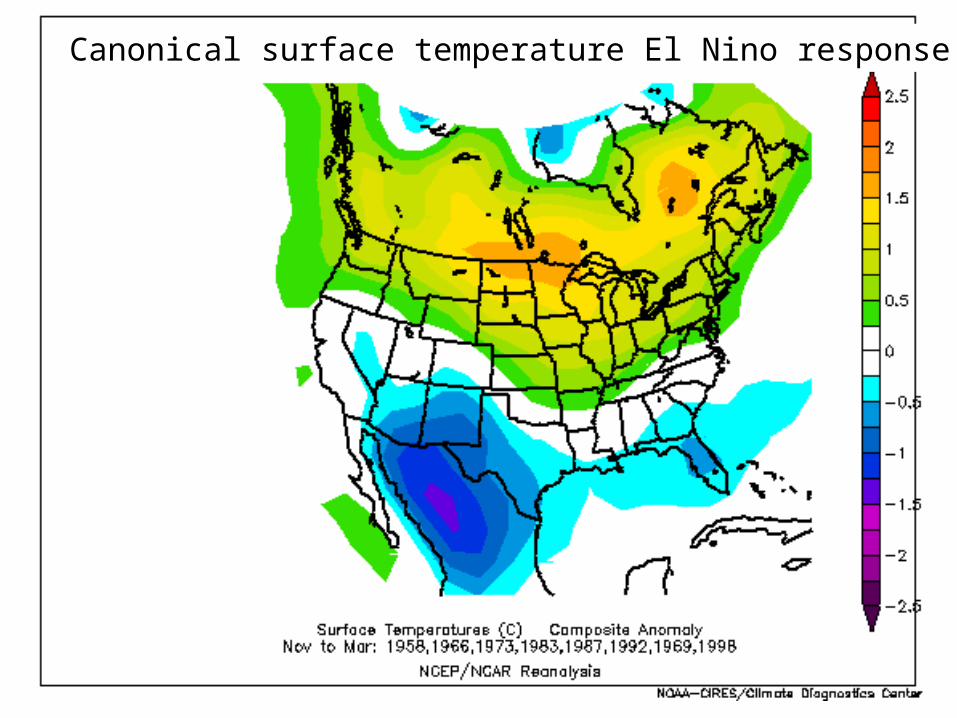
Canonical surface temperature El Nino response
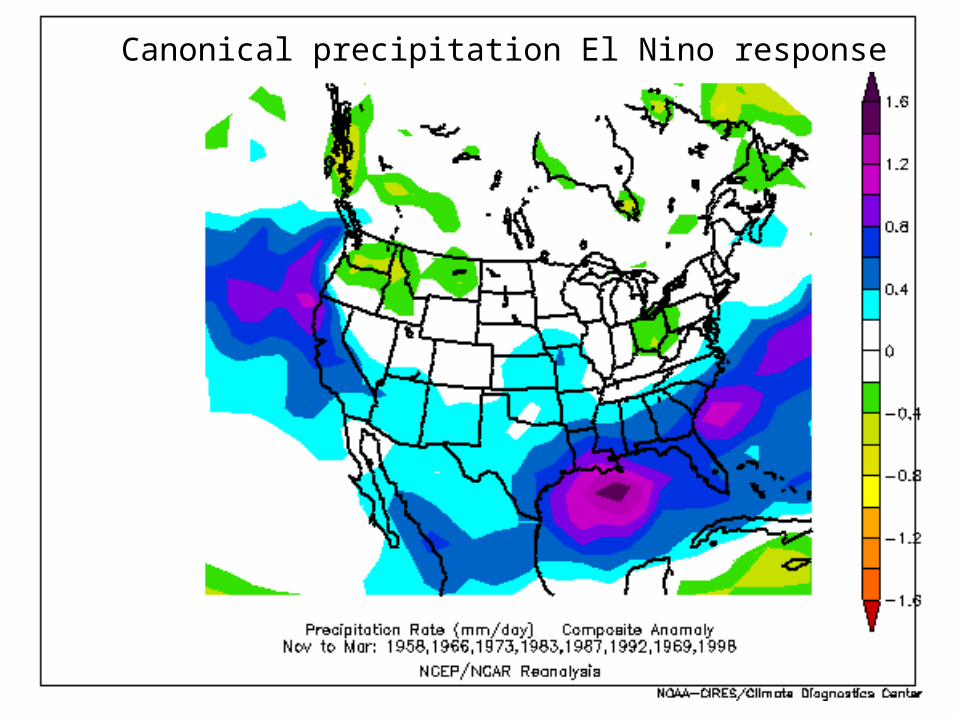
Canonical precipitation El Nino response

CPC temperature forecast for DJF 2002-03Made mid-November
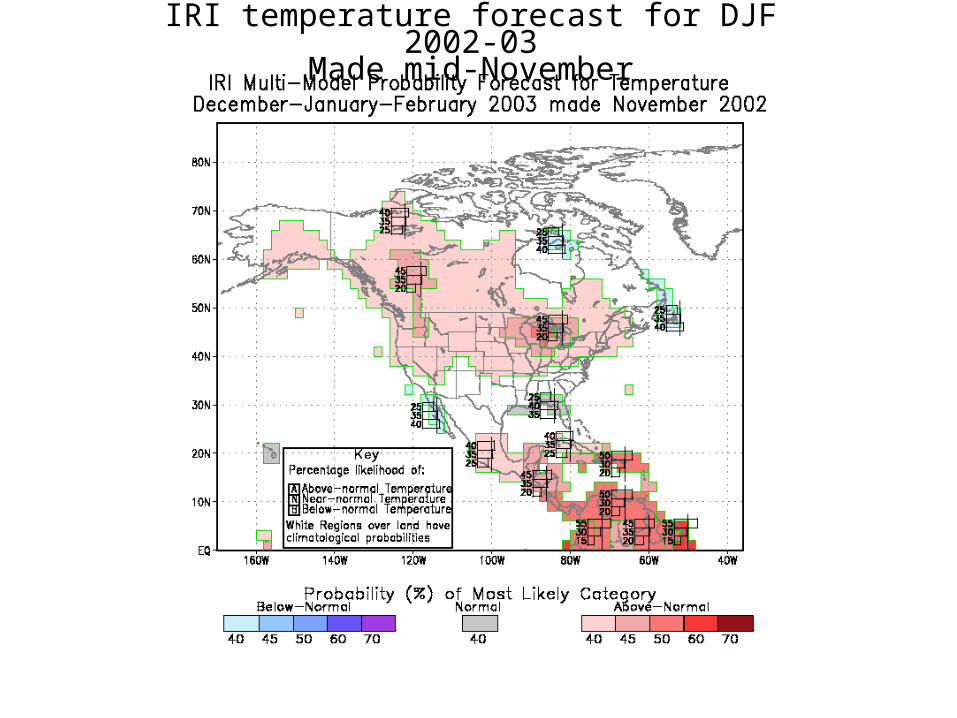
IRI temperature forecast for DJF 2002-03Made mid-November
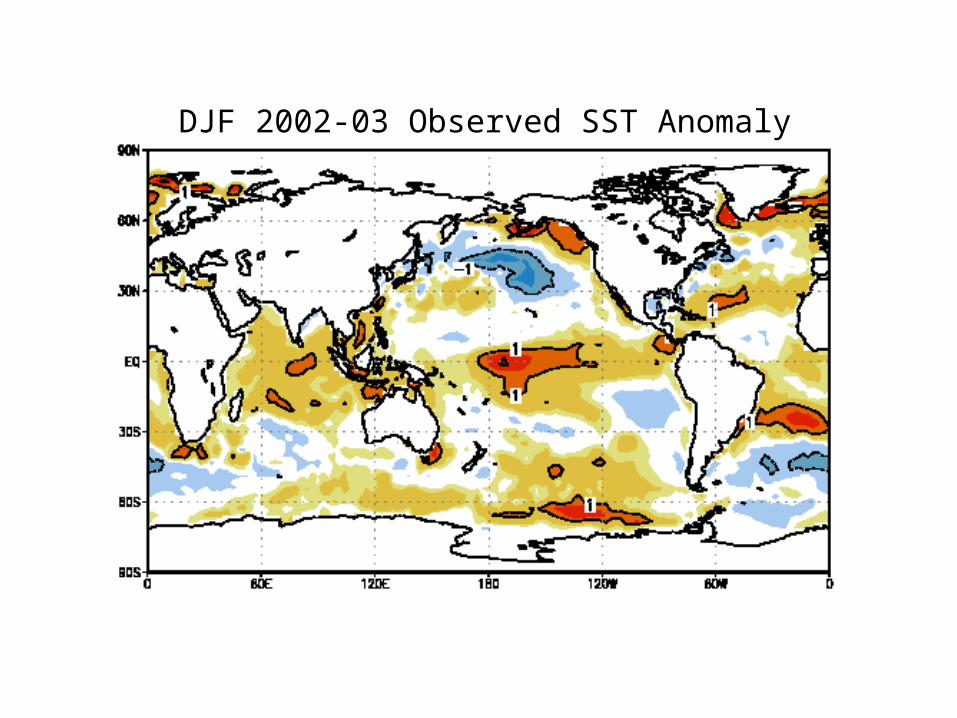
DJF 2002-03 Observed SST Anomaly

X
X
X = significant errorin IRI’s SST forecast
X


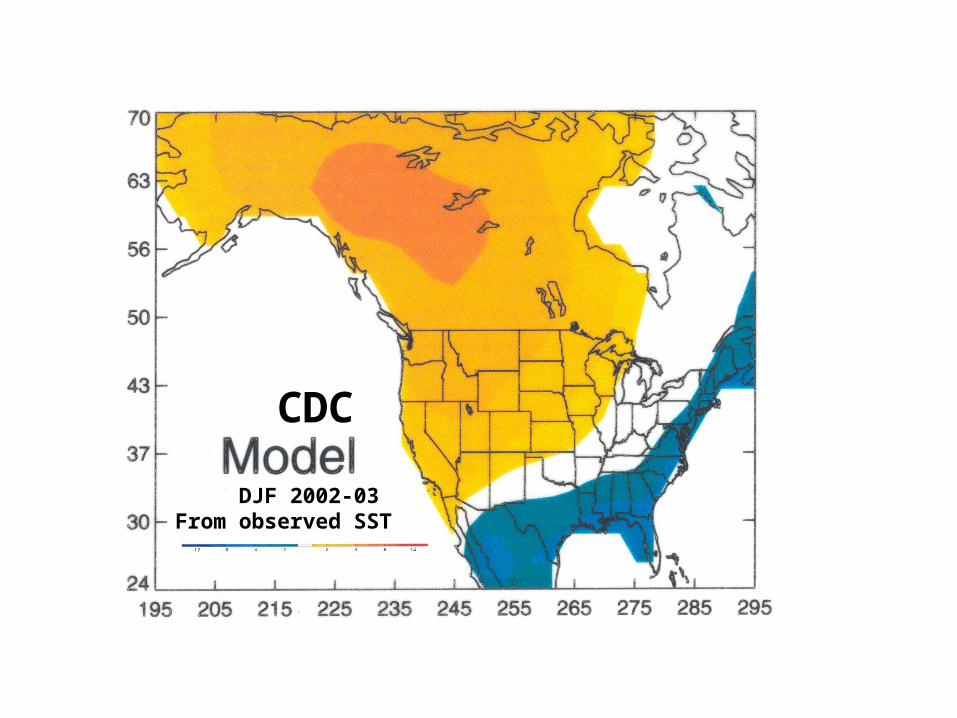
CDC
DJF 2002-03From observed SST
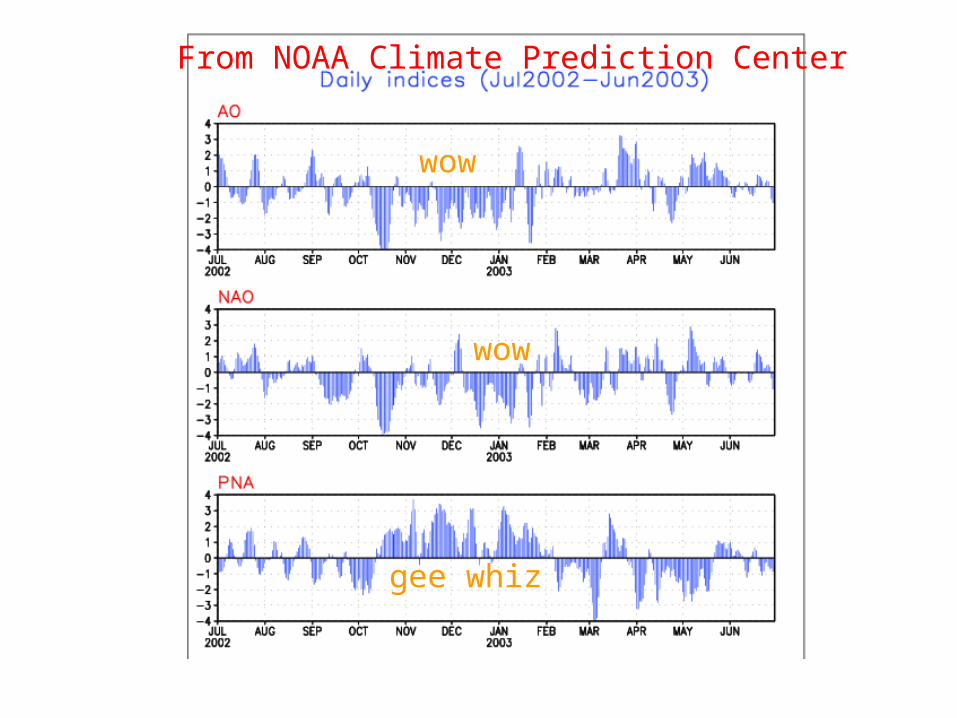
From NOAA Climate Prediction Center
wow
wow
gee whiz
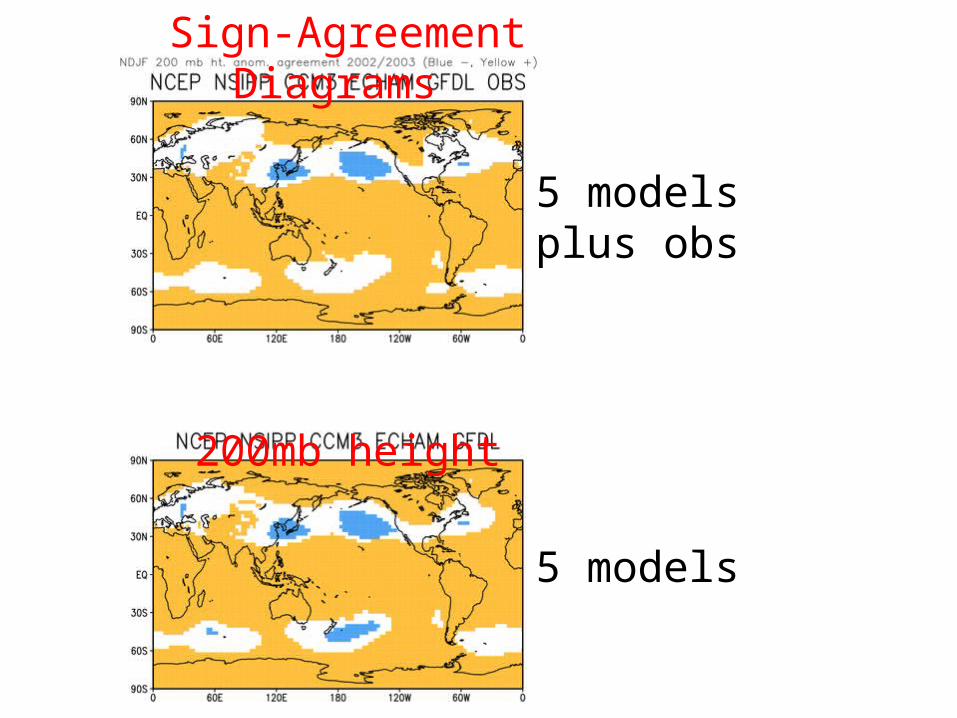
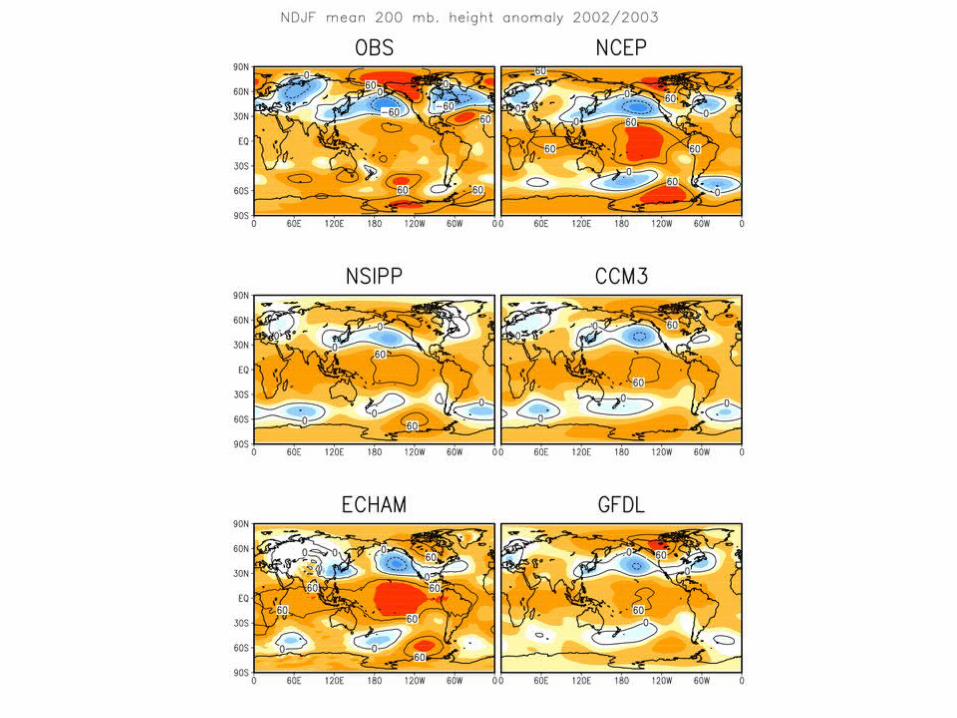
Sign-Agreement Diagrams
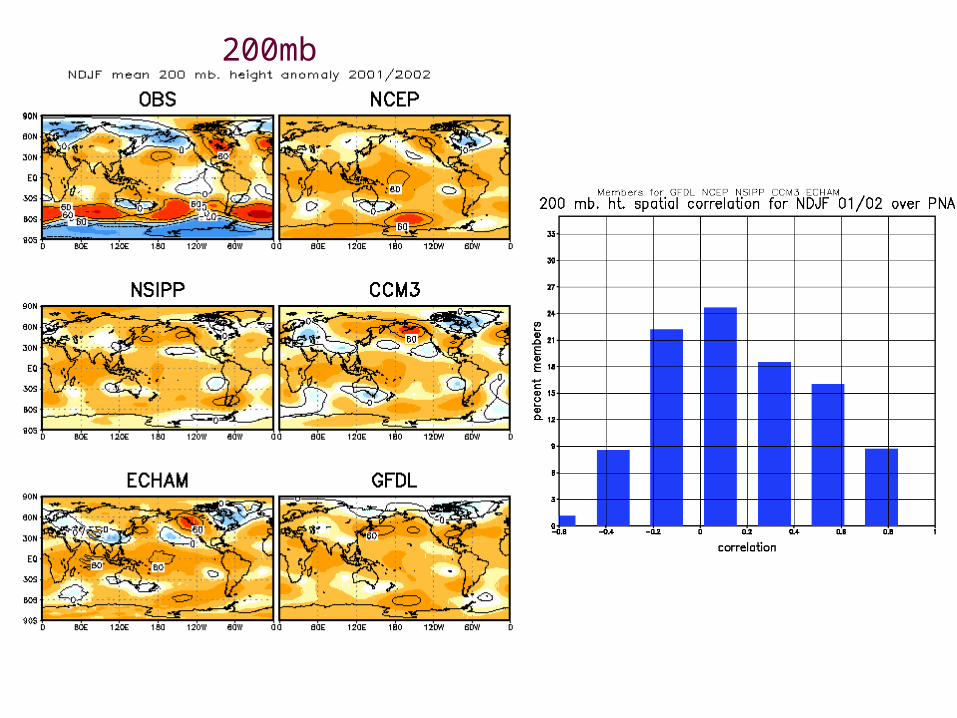
200mb height
5 modelsplus obs
5 models
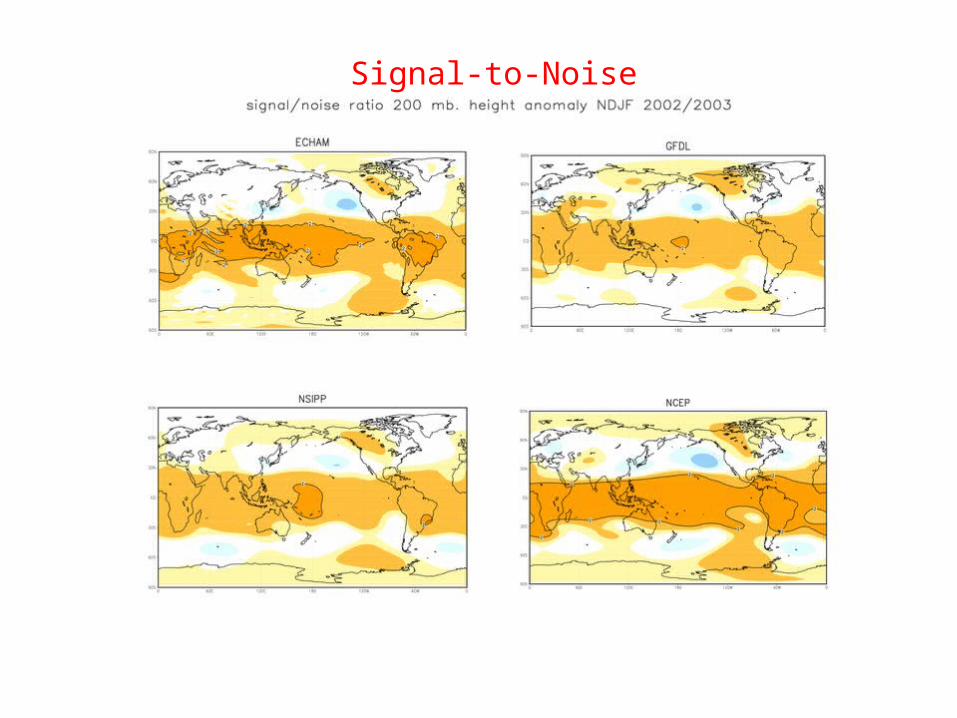
Signal-to-Noise
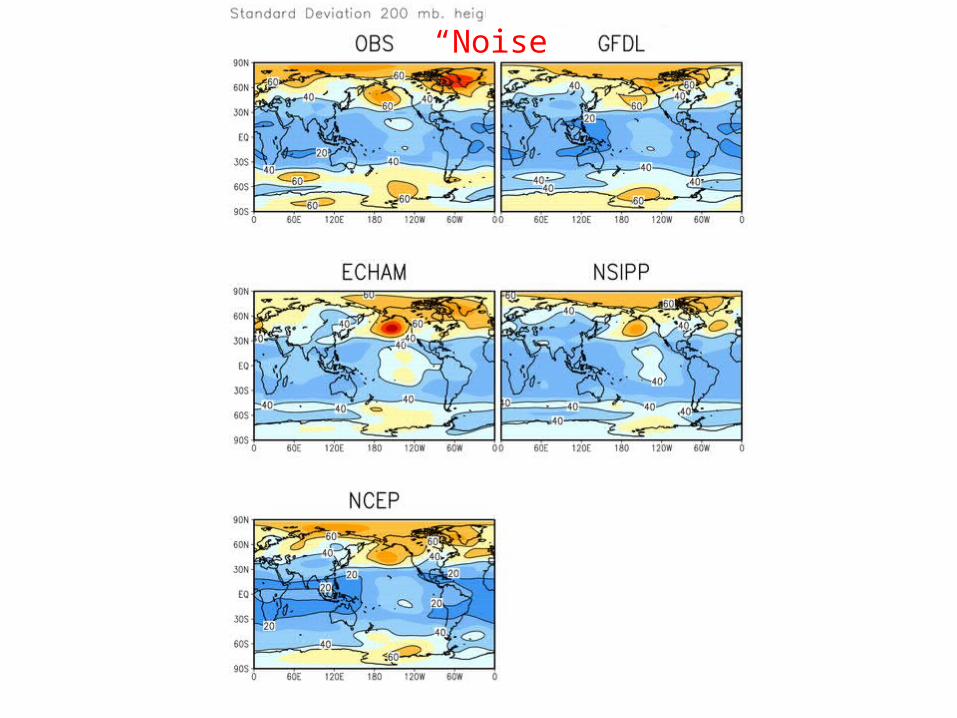
“Noise”

Signal-to-Noise
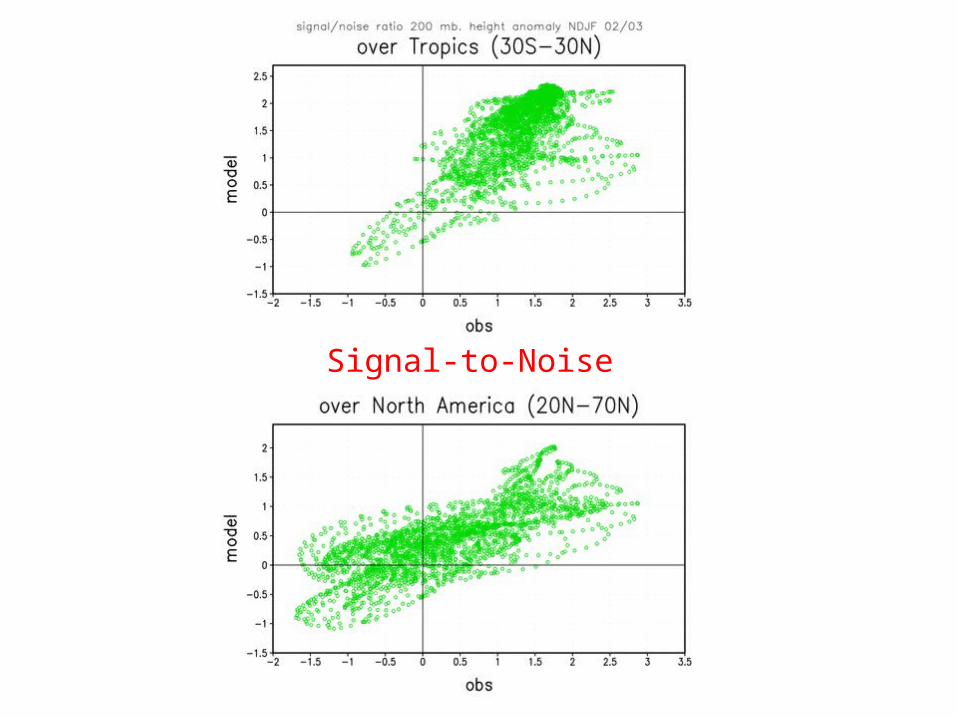
Signal-to-Noise

Individual ensemble members from the various models
EnsAvg
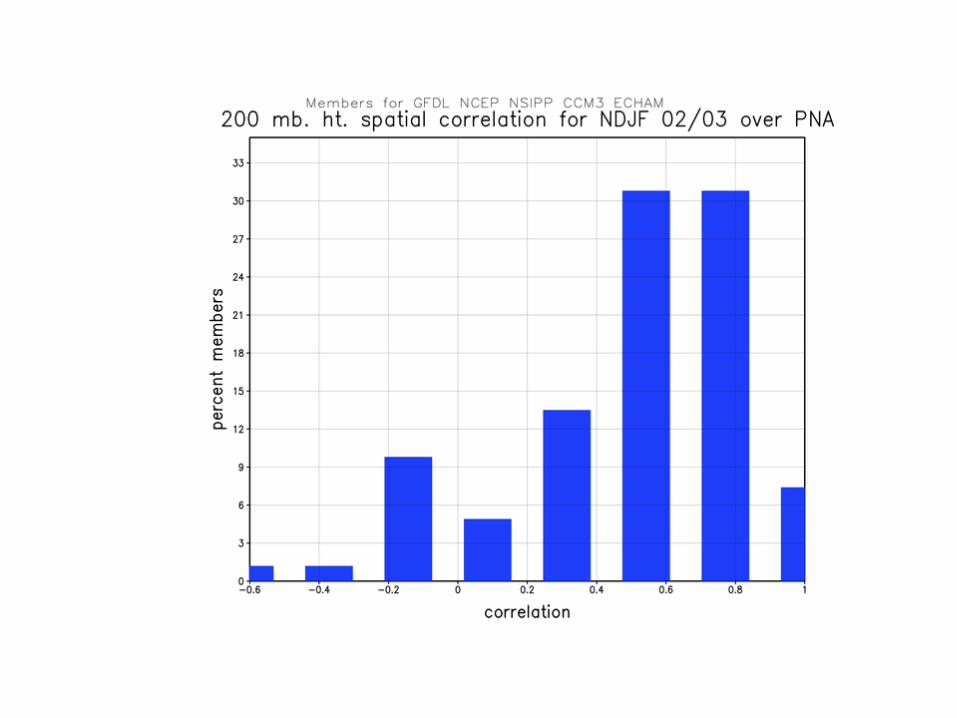
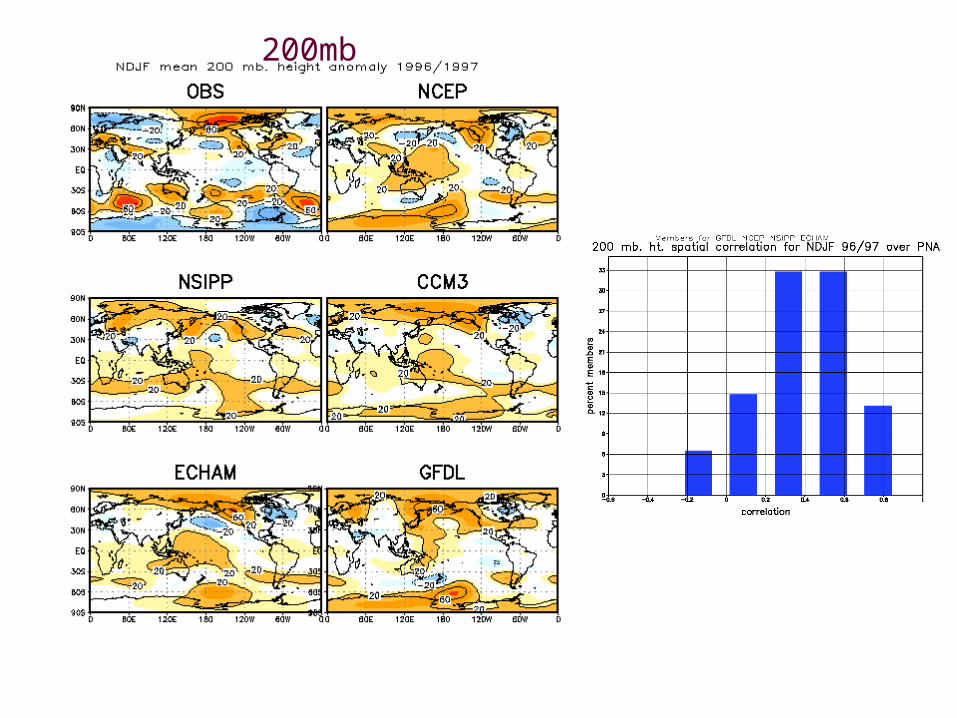
200mb

200mb
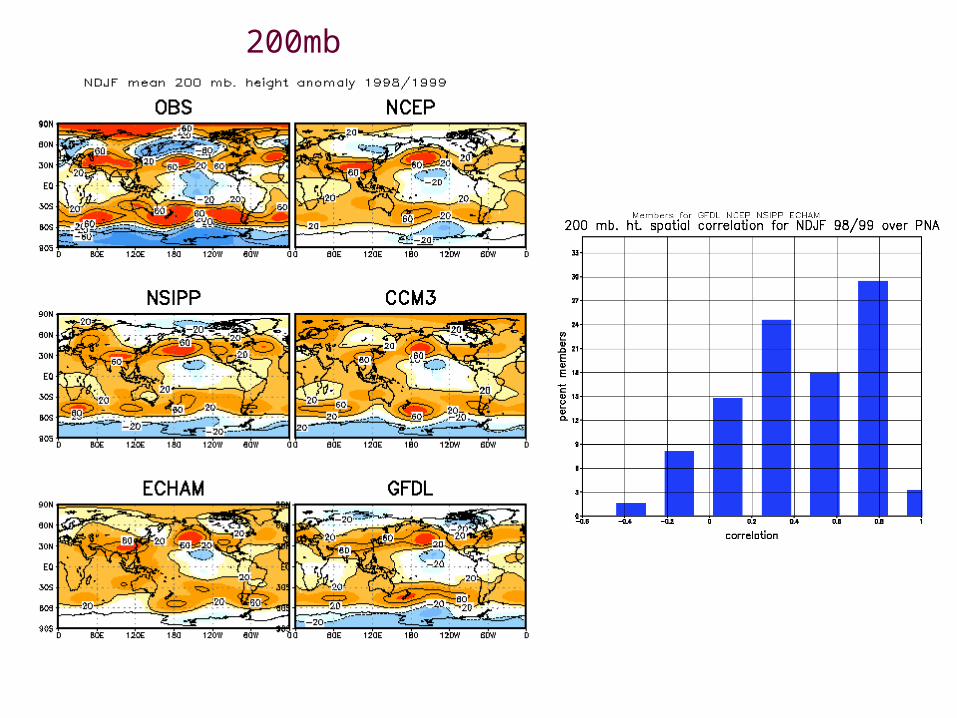
200mb
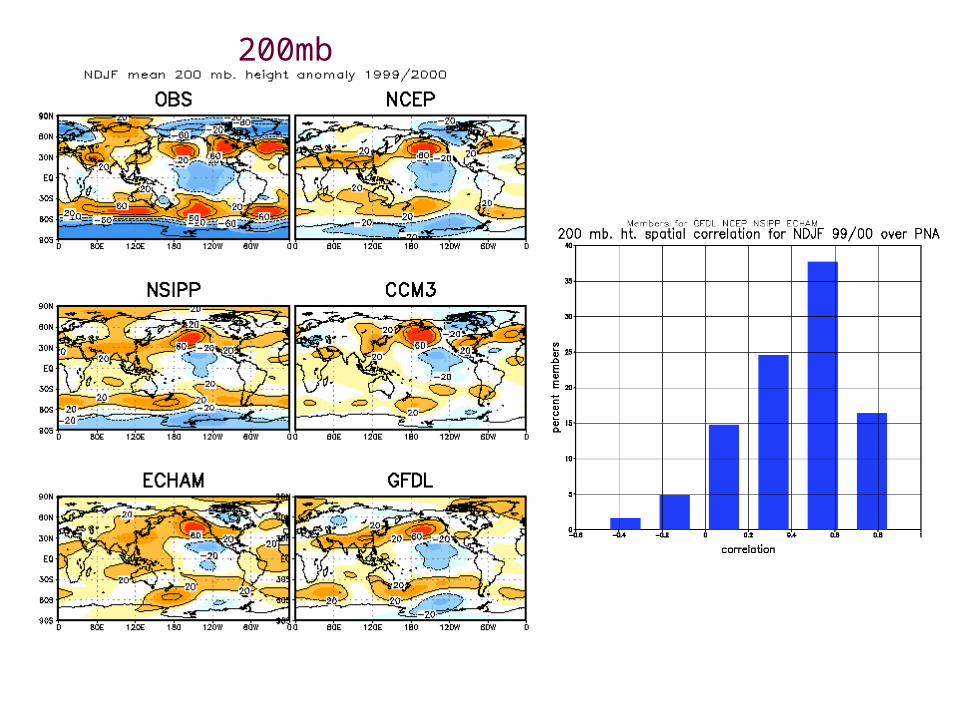
200mb

200mb
200mb

200mb
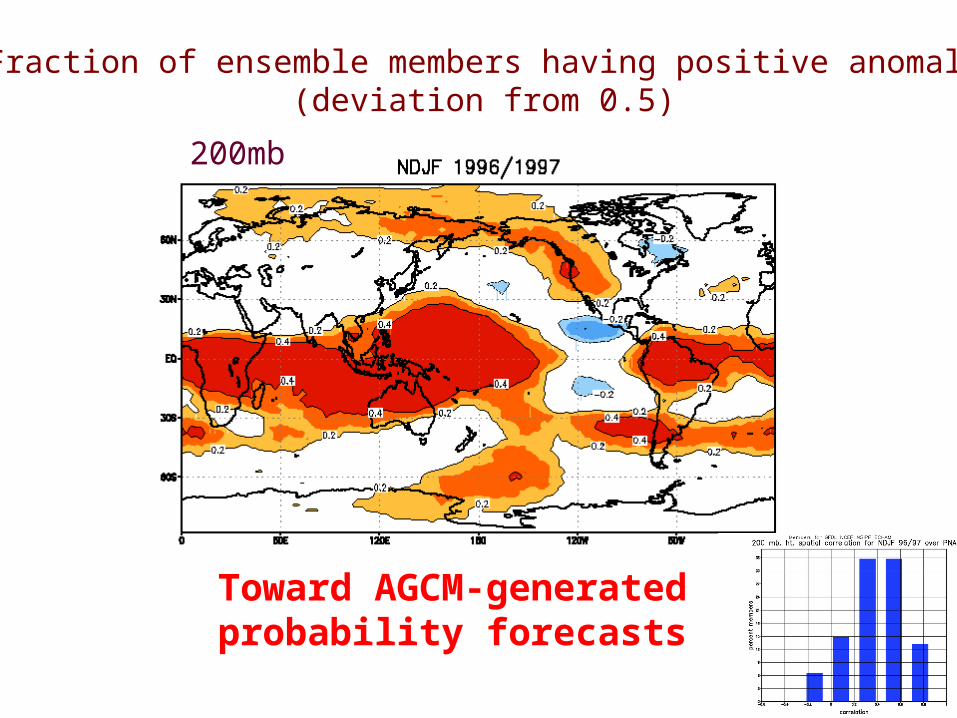
Fraction of ensemble members having positive anomaly(deviation from 0.5)
200mb
Toward AGCM-generatedprobability forecasts

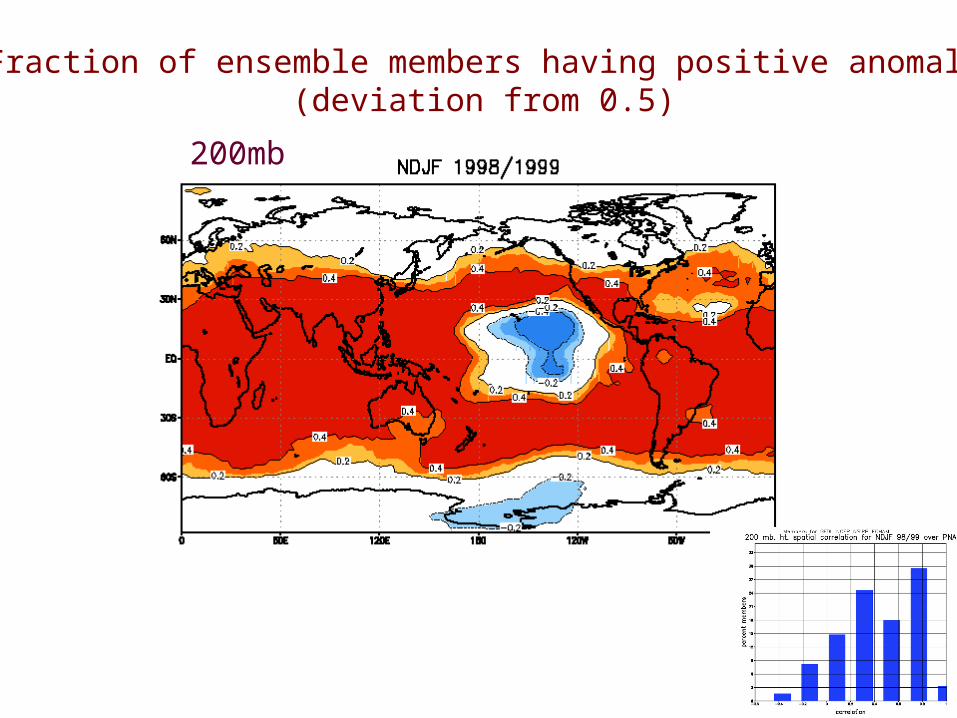
Fraction of ensemble members having positive anomaly(deviation from 0.5)
200mb
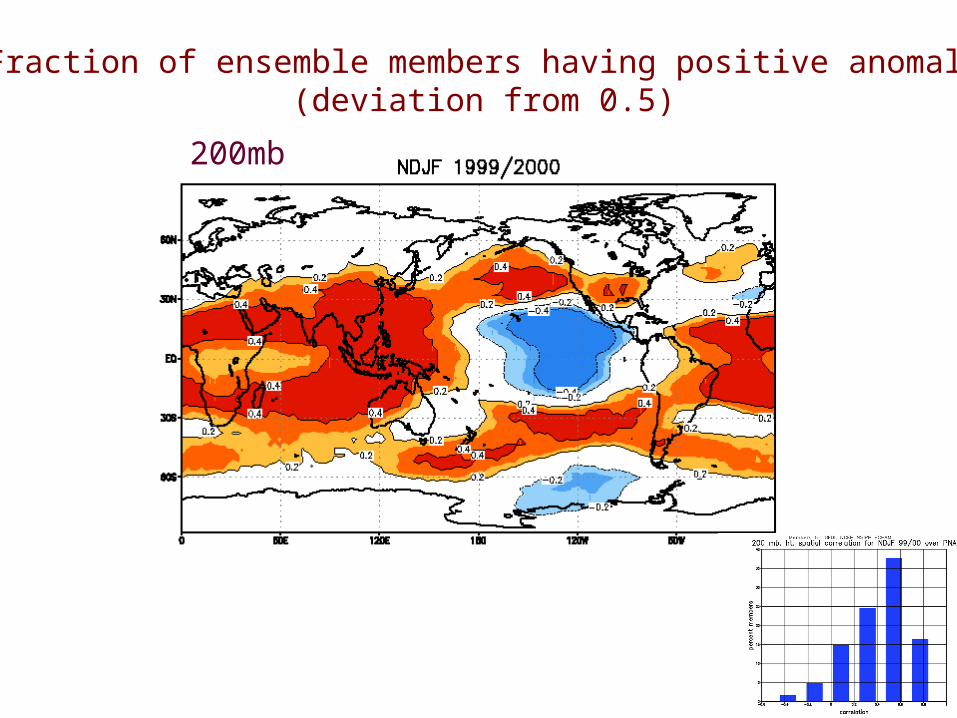
Fraction of ensemble members having positive anomaly(deviation from 0.5)
200mb
Fraction of ensemble members having positive anomaly(deviation from 0.5)
200mb

Fraction of ensemble members having positive anomaly(deviation from 0.5)
200mb
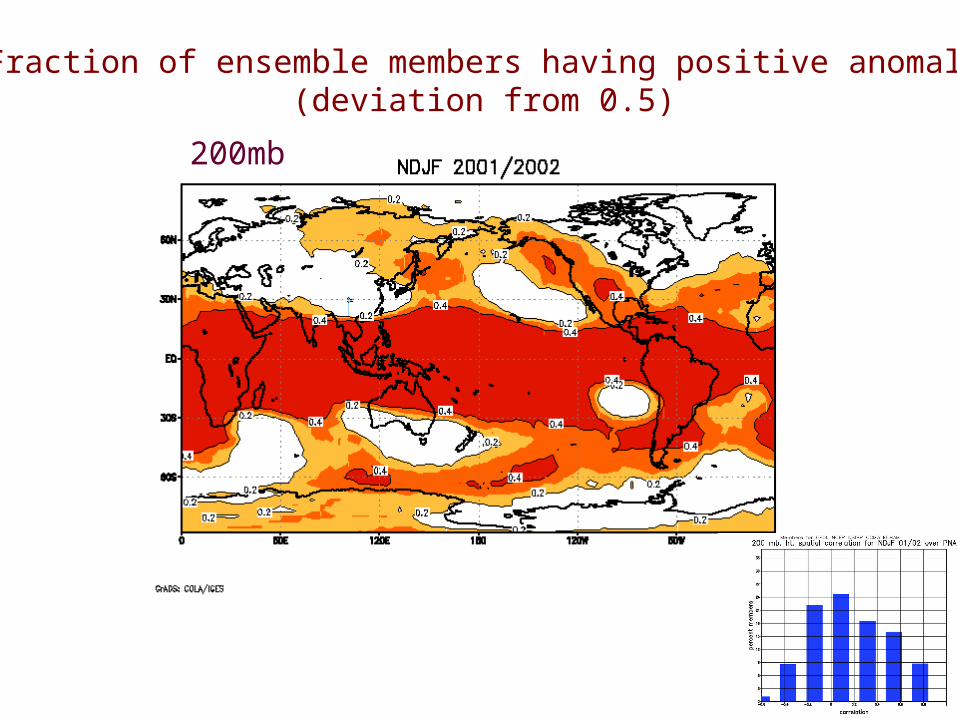
Fraction of ensemble members having positive anomaly(deviation from 0.5)
200mb
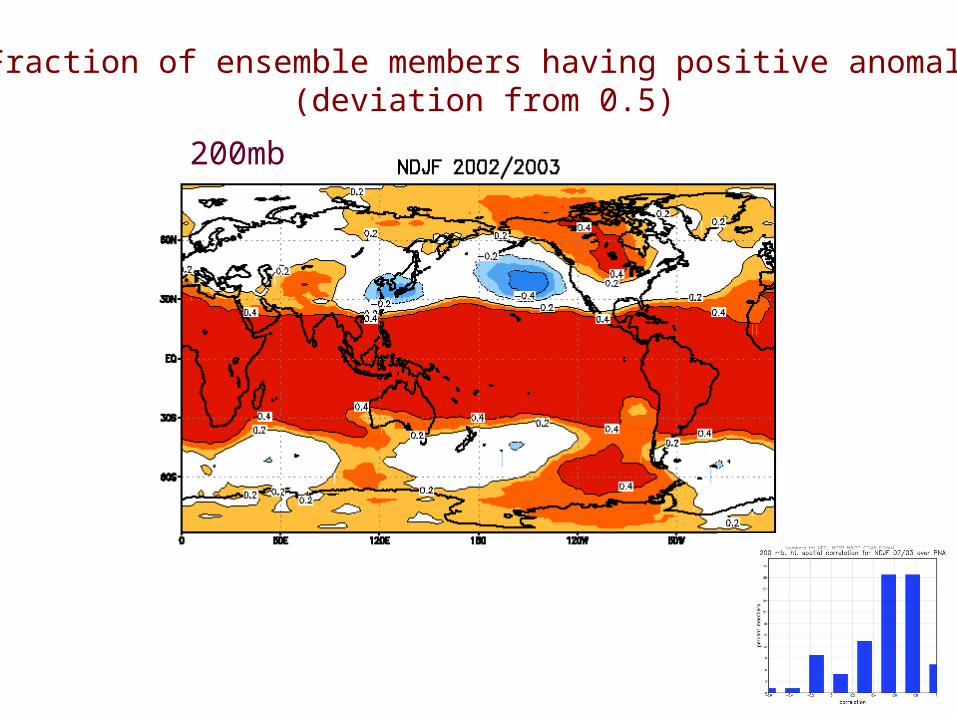
Fraction of ensemble members having positive anomaly(deviation from 0.5)
200mb
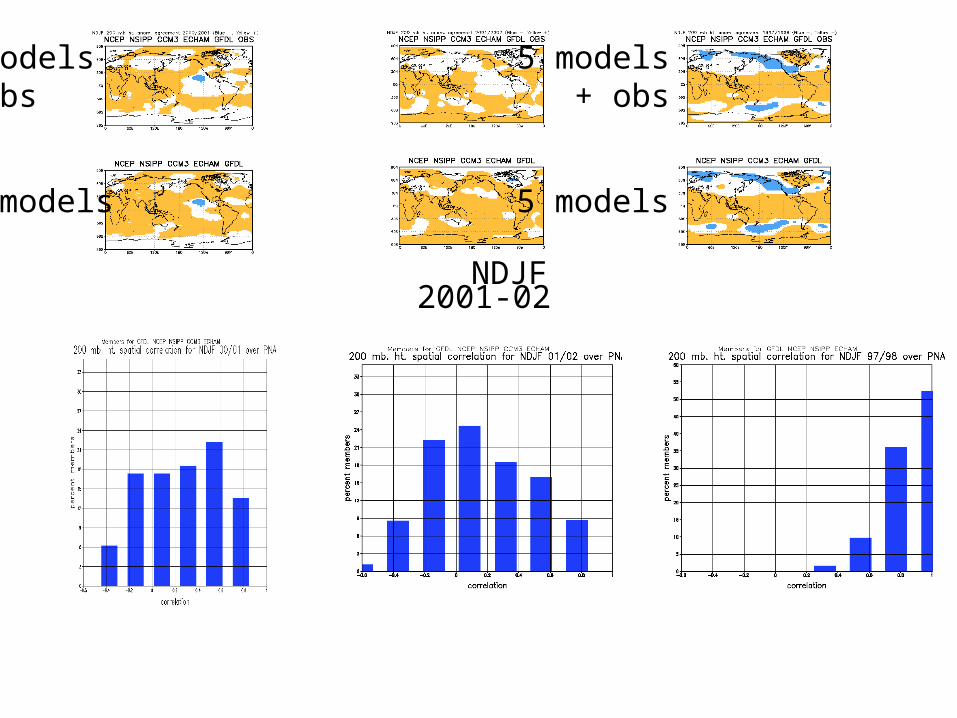
2000-01 2001-02 1997-98 NDJF NDJF NDJF
5 models 5 models 5 models + obs + obs + obs
5 models 5 models 5 models

Reliability Diagram 1997-2001
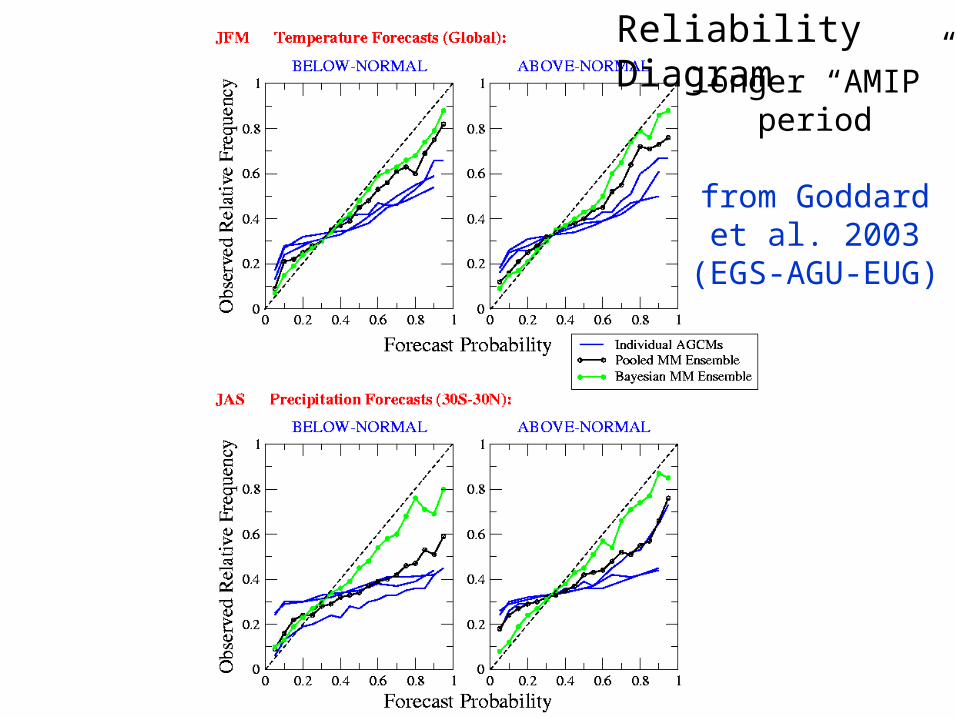
Reliability Diagramlonger “AMIP”
period
from Goddardet al. 2003
(EGS-AGU-EUG)