Embed Size (px)
Citation preview

Searching events in AFM force-separation
curves: a wavelet approach
R. Benıtez1, V. J. Bolos2
1 Dpto. Matematicas, Centro Universitario de Plasencia, Universidad de Extremadura.
Avda. Virgen del Puerto 2, 10600 Plasencia (Caceres), Spain.
e-mail: [email protected]
2 Dpto. Matematicas para la Economıa y la Empresa, Facultad de Economıa,
Universidad de Valencia. Avda. Tarongers s/n, 46022 Valencia, Spain.
e-mail: [email protected]
May 2016
Abstract
An algorithm, based on the wavelet scalogram energy, for automatically detectingevents in force-extension AFM force spectroscopy experiments is introduced. The eventsto be detected are characterized by a discontinuity in the signal. It is shown how thewavelet scalogram energy has different decay rates at different points depending on thedegree of regularity of the signal, showing faster decay rates at regular points and slowerrates at singular points (jumps). It is shown that these differences produce peaks in thescalogram energy plot at the event points. Finally, the algorithm is illustrated in a tetheranalysis experiment by using it for the detection of events in the AFM force-extensioncurves susceptible to being considered tethers.
1 Introduction
Atomic Force Microscopy (AFM) is a type of scanning probe microscopy which has become anindispensable tool in the analysis of mechanical properties of biological samples [1, 2]. Forcespectroscopy is the main mode for assessing forces between the probe (tip) and the sample,and its relationship with the distance between them. Typically, the result of an AFM forcespectroscopy experiment is a force -extension curve (hereafter F-z curve), being the extensionmeasured from the position of the piezoelectric onto which the sample is placed and the forceobtained from the deflection of the cantilever on which the tip is mounted, provided that thespring constant of the cantilever is known in advance. An F-z curve delivers information aboutdifferent aspects of the interactions between the surfaces. Special focus is to be placed on thepoints of the curve in which changes occur. For example, jumps in the approach segment ofthe F-z curve could be related to attracting forces such as Van der Waals interactions, changesin the slope of the curve could be caused by the presence of materials with different elasticproperties, protein unfolding events are characterized by peaks in the retract segment curve,adhesion phenomena and tether formation is also pictured in the F-z curve by discontinuitiesin the retract segment of the curve, to name a few [3,4].
Although these events can be analyzed directly one by one, the increasing use of theAFM as a technique for determining mechanical properties of samples at the micro andnanoscale has created the necessity of analyzing every time larger number of curves. Thus,
1

there is a need for algorithms which allow us to make all these analysis in batch mode, thatis, automatically; being the first step of all these algorithms the same: the automatic andreliable detection of the events to be analyzed.
The problem of detecting changes in a signal is a very important problem that has alreadybeen addressed from several different points of view [5] and in a lot of different fields, fromseismology [6] and economics [7] to social networks analysis [8]. In particular, in the AFMF-z curves analysis, several approaches have been made to implement algorithms for theautomatic extraction of features from the measurements [9–14].
Wavelet analysis has become an essential mathematical method for analyzing signalsat different scales [15]. It has been successfully used for image compression and featureextraction and for the analysis of non-stationary time signals such as economic time series,where Fourier analysis fails to be an adequate tool for its study [16].
In this work we are going to use the wavelet scalogram as a tool for identifying abruptchanges in a signal and we sill show how can it be used to detect interesting events in an F-zcurve. As an example, we will illustrate its use with the automatic detection of events in theframework of tether analysis.
2 Mathematical background
2.1 Wavelet analysis
A wavelet is a function ψ ∈ L2 (R) with zero average (i.e.∫R ψ = 0), normalized (‖ψ‖ = 1)
and “centered” in the neighborhood of t = 0 in a time series framework (see [15]). Scaling ψby s > 0 and translating it by u ∈ R, we can create a family of time–frequency atoms (alsocalled daughter wavelets), ψu,s, as follows
ψu,s(t) :=1√sψ
(t− us
). (1)
Given a time series f ∈ L2 (R), the continuous wavelet transform (CWT) of f at a timeu and scale s with respect to the wavelet ψ is defined as
Wf (u, s) := 〈f, ψu,s〉 =
∫ +∞
−∞f(t)ψ∗u,s(t) dt, (2)
where ∗ denotes the complex conjugate. The CWT allows us to obtain the frequency com-ponents (or details) of f corresponding to scale s and time location u, providing thus atime-frequency decomposition of f .
On the other hand, the dyadic version of (1) is given by
ψj,k(t) :=1√2kψ
(t− 2kj
2k
), (3)
where j, k ∈ Z (note that there is an abuse of notation between (1) and (3), nevertheless thecontext makes it clear whether we refer to (1) or (3)). It is important to construct waveletsso that the family of dyadic wavelets {ψj,k}j,k∈Z is an orthonormal basis of L2 (R). Thus,any function f ∈ L2 (R) can be written as
f =∑j,k∈Z
dj,kψj,k, (4)
being dj,k := 〈f, ψj,k〉 the discrete wavelet transform (DWT) of f at time 2kj and scale 2k.In fact, the DWT is the particular dyadic version of the CWT given by (2).
2

The scalogram of f at s > 0 is defined by
S(s) :=
(∫ +∞
−∞|Wf (u, s) |2 du
)1/2
. (5)
The scalogram of f is the L2-norm of Wf (u, s) (with respect to the time variable u) and itcaptures the “energy” of the CWT of the time series f at this particular scale.
Taking into account the decomposition of a function f by means of the DWT (see (4)),it is convenient to redefine the scalogram in terms of base 2 power scales, thus we will write
S(k) :=
(∫ +∞
−∞|Wf
(u, 2k
)|2 du
)1/2
, (6)
where k ∈ R is the binary logarithm of the scale (again, there is an abuse of notation thatwill be clarified by the context, this time between (5) and (6)), which is called log-scale. Notethat in (6) we use the CWT and k ∈ R, while in the framework of the DWT k ∈ Z (e.g. in(3) and (4)).
The windowed scalogram of a time series f centered at time t with time radius τ is definedby
WSτ (t, k) :=
(∫ t+τ
t−τ|Wf
(u, 2k
)|2 du
)1/2
. (7)
Plainly, the windowed scalogram is nothing more than the scalogram given in (6) restrictedto a given finite time interval [t− τ, t+ τ ]. Its principal feature is that it allows to determinethe relative importance of the different scales around a given time point.
In order to quantify the “energy” of a given scalogram (windowed or not) in a deter-mined scale range [smin, smax], first we have to consider the corresponding log-scale interval[kmin, kmax] where kmin = log2 smin and kmax = log2 smax. Then we can estimate the energyof the scalogram computing, for example, the L1-norm
Energy1 :=
∫ kmax
kmin
1√2kS(k) dk, (8)
or the L2-norm
Energy2 :=
(∫ kmax
kmin
(1√2kS(k)
)2
dk
)1/2
. (9)
The factor 1√2k
(i.e. 1√s) converts the scalogram into an “energy density” measure, and it is
also employed in other wavelet tools, such as the wavelet squared coherency (see [17,18]), fornormalizing the weight of each scale in the scalogram (see Figure 1). Since we are looking forlocal maxima in the “energy”, both expressions (8) or (9) are good choices and equivalent.
In our particular case, we work with a force-extension curve f(z) instead of a time seriesf(t), where the spatial variable z is the vertical position of either a moving tip or a movingsample.
2.2 Abrupt changes detection with wavelets
Wavelet transforms are an excellent mathematical tool for detecting singularities in a signal.This is so because the degree of regularity of a signal at a given point is related to the decayrate of the wavelet transform at that point as the scales get smaller. In particular, followingthe notation in [15], the regularity of a signal is determined by its Lipschitz regularity degree.We say that a signal f(z) is Lipschitz of order α ≥ 0 at a point z0 if there exists a polynomialpz0 of degree bαc (i.e. the floor of α) and a constant K such that
|f(z)− pz0(z)| ≤ K|z − z0|α.
3

Figure 1: Left: Scalogram of the signal sin(2π8 t)
+ sin(2π16 t)
with t ∈ [0, 1000], that is acombination of two signals of period 8 and 16 respectively with the same amplitude. Thereare two local maxima at the scales corresponding with the periods 8 and 16 respectively, butthe scalogram takes different maximum values at these scales. Right: The same scalogrammultiplied by the factor 1√
s. Now, the scalogram takes the same maximum values, showing
that both scales contribute with the same “energy”.
Then, the Lipschitz regularity of f at z0 is the supremum of all α for which f is Lipschitzof order α. Thus, a signal having a discontinuity at a point z0 would have a zero Lipschitzregularity degree, a continuous function (but not continuously differentiable) would have aregularity degree between 0 and 1, a continuously differentiable function (but not twice con-tinuously differentiable) between 1 and 2, and so on. The main result relating the regularityof a signal and its wavelet transform states that if a signal f is of uniform Lipschitz regularitydegree α, then
|Wf(u, s)| ≤ Asα+1/2,
that is, its wavelet transform has a decay rate sα+1/2 as s goes to zero. Therefore, the scalo-gram energy decays, roughly, as s2α+1, when s is small. Thus, the energy of the scalogrammay take values which are even orders of magnitude larger in points where the signal has asingularity than in points where the signal is regular. These differences in the decay rate ofthe wavelet transform between regular and singular points are translated into peaks in theenergy of the scalogram, the smaller the Lipschitz degree of regularity is, the higher the peakin the energy will be.
Thus, the problem of finding singular points on a signal is now reduced to the problem offinding peaks in the energy of the windowed scalogram. This one is a widely studied problemand there are already a quite large number of specific functions in both commercial andopen software devoted to determine peaks on a noisy signal (see [19] and references therein).We made use of a self developed MATLAB (The Mathworks Inc., Natick, Massachussetts,USA) code for computing the energy of the windowed scalogram, partially based on [17],and the MATLAB function peakfinder contributed by Nathanael Yoder to the Mathworks’MATLAB File Exchange [20].
Figure 2 shows, as an example, a synthetic signal constructed by the juxtaposition offour pieces. The joining points are z = 0.2, z = 0.5 and z = 0.7, being the first one a jumpin the slope, while the other two are discontinuities of the signal itself. Note that for thefirst singularity, the Lipschitz regularity degree is positive because the signal is continuous atthat point, and for the other two singularities, the signal has a vanishing Lipschitz regularitydegree, since it is not even continuous there. Therefore, the differences on the decay rate ofthe wavelet transform between the singularity and the surrounding points are less remarkablein the first case than in the second and third ones, producing then a smaller peak in the energyof the windowed scalogram. The windowed scalogram was computed using the Haar wavaletfor scales ranging from 1 to 256 and a time window of 150 points.
4

0.1 0.2 0.3 0.4 0.5 0.6 0.7 0.8 0.9
1
1.5
2
z
Sig
nal
0.1 0.2 0.3 0.4 0.5 0.6 0.7 0.8 0.9
0
20
40
60
z
WS
Ene
rgy
Figure 2: Top: Artificial signal having three singularities at z = 0.2, z = 0.5 and z = 0.7.Bottom: Energy of the Windowed Scalogram (with L1 norm) of the above signal. The scalesemployed are between 1 and 256. The dots mark the points where the singularities are placed.
3 Example: event detection in tether analysis
We will see how to make use of the wavelet scalogram energy in the AFM F-z curves analysis.In particular, focus will be set in the detection of events in the retract part of the curve inthe study of tethers formation. A tether is a long, thin nanotube whose membrane is a lipidbilayer [21, 22]. They play an important role in cell mechanics as it is a typical dynamicalresponse of the cell wall to a normal external force. One of the main difficulties in the studyof these structures is its extreme small diameter below optical resolution. Thus, a way ofovercoming such drawback is the use of Atomic Force Microscopy for determining both, theirlength and mechanical properties. Typically, tethers are observed in the retract part of aforce-extension curve as well defined constant segments, or plateaus, which are present afterthe adhesion phenomena take place (see Figure 3).
Data description: For the analysis of the efficiency of the energy of the scalogramin the event detection in the force-extension curves, we will consider a set of 30 curvesof an experiment consisting on samples of recrystallized bacterial protein SbpA on silicondioxide and a modified Atomic Force Microscopy-tip with SCWP. AFM experiments werecarried out in Millipore water using the Force Probe from Asylum Research. Silicon nitride(Si3N4) cantilevers of nominal 0.06 N7M were utilized. The tips were functionalised byAminosilanisaiton in the gas phase followed by covalent coating of thiolated SCWP.
5

A
B
C
DE
A
B
C
D
E
Figure 3: Scheme of a typical retract segment of a F-z curve in a tether extension experiment.A: The cantilever crosses the zero force point and the adhesion phenomena begins. B: Theadhesion force reaches its maximum before the unbinding jump takes place. C and D: Multipletethers formation and breaking events. E: The tip is no longer in contact with the sample.
Data preprocessing: Force-extension curves were processed using a set of self-developedfunctions implemented in the R software programming language [23] and bundled in thepackage afmToolkit. The workflow was as follows: first, the curves were slipt into approachand retract segments, then the contact point in the approach segment and the detach pointin the retract segment were found using an implementation of the algorithm described in [12].Once the contact and detach points were estimated, a baseline correction was performed for,finally, determining the zero-force point marked in Figure 3 with a letter A. Then, the subsetof the retract curves from point A to the end of the curve were stored in a matrix-like table tobe later used in the aforementioned wavelet scalogram analysis described in Section 2 withthe MATLAB software.
Parameter tuning: The first step for the scalogram analysis is the election of the motherwavelet. Several choices can be made but, depending on the purpose of the analysis ones aremore suitable than others. For the detection of abrupt changes in nonstationary time series,Morlet wavelets (Figure 4 (a)) have been very used since they detect not only changes in themagnitude of a signal, but also changes in their frequencies, having therefore been successfullyused in the analysis of climatic [18], seismic [24], economical and ECG signals [25], amongothers. However, for our objective of detecting the events in the retract segment of the AFMforce-extension curves that may be deemed to be susceptible for being tethers, we foundthat the simpler Haar wavelet (Figure 4 (b)) performs better than the Morlet wavelet whenonly jumps in the signal are to be detected. The main reason for this suitability of the Haarwavelet lies in the fact that, in order to extract a given pattern from a signal, the more similarto such pattern the shape of the wavelet is, the better the detection will be. Since the Haarwavelet is itself a step function, its performance when detecting jumps is much better thanother wavelets, such the Morlet wavelet. However, some authors [26] have considered themore general Daubechies wavelet family [27] for detecting either jumps or sharp cusps. Thiswould be, indeed, a more correct choice if the events in the AFM F-z curve to be detectedwere characterized by an abrupt change in the slope, i.e. a jump in the derivative of thesignal, instead of a jump the signal itself.
The most important parameters to be determined are the time radius τ in the computation
6

-4 -3 -2 -1 0 1 2 3 4-0.6
-0.4
-0.2
0
0.2
0.4
0.6(a)
Morlet real partMorlet imaginary part
-1 -0.5 0 0.5 1 1.5 2
-1
-0.5
0
0.5
1
(b)
Figure 4: (a) Real (solid line) and imaginary (dashed line) parts of the complex Morletwavelet. (b) Haar wavelet.
of the windowed scalogram given in equation (7) and the scales, kmin, kmax over which theenergy of the scalogram is computed (see equations (8) and (9)).
The choice of scales is important to determine the abrupt changes in the signal. Sincethese events occur at very small scales, kmin should be small enough to deliver the informationof the signal at such scales. However, since the method of detecting the events relies on thedifferent decay rates of the wavelet transform as the scales tend to zero, depending on theLipschitz degree of regularity, larger scales should be also taken into account for they willgreatly contribute to the energy of the scalogram at the points were the events take place.Making, thus, these energy values much larger than in the surrounding points where thesignal is regular. Therefore, the value of kmax should be large enough for the aforementioneddifferences be noted.
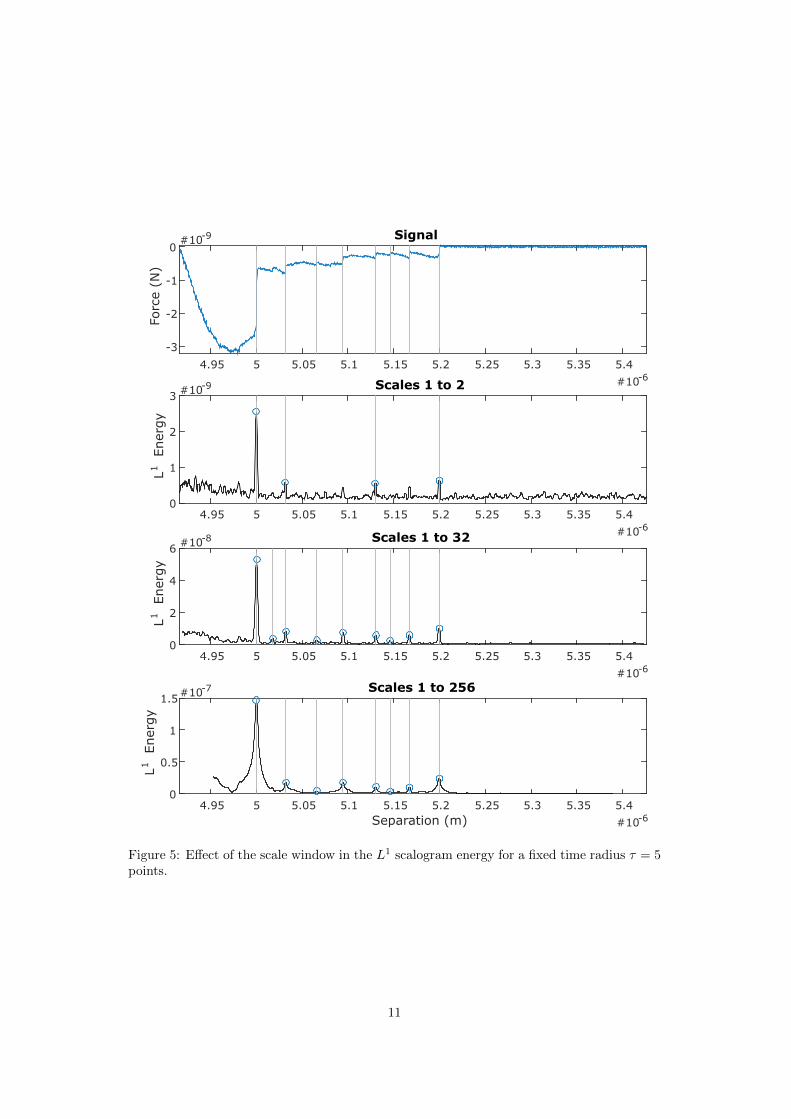
Figure 5 shows, in the top plot, a typical AFM force-extension curve, taken out of from our30 curves sample and, in the other three plots, the values of the L1-energy of the scalogramfor different values of the scale windows, ranging from kmin = 1 to kmax = 2, 32, and 256, fora fixed time radius τ = 5 points. It is noteworthy how, in the first case, some of the eventswere not found, because the scale window was too narrow, so the differences between thescalogram energy at the singular points and at the regular points were not big enough. Inthe two other cases, the addition of larger scales, produces larger differences in the scalogramenergy, showing well defined peaks at those points.
On the other hand, let us recall that a typical AFM force-extension curve will usuallyshow a background noise due to the thermal energy of the cantilever. Such noise will beseen in the baseline, where the cantilever is away from the contact, as a white noise withan amplitude of about 20-40 pN, and it will be also reflected in the scalogram energy as abackground noise of certain amplitude which will largely depend on the scales used. The timeradius parameter, τ , works as a smoothing operator. The bigger the radius is, the smootherthe scalogram energy will be. In Figure 6, the L1-energy of the scalogram has been computedfor the same curve as in Figure 5, but for values of the time radius τ = 1, 5 and 20 points.It is clearly seen how increasing the value of τ affects the scalogram energy in two aspects:the background noise is damped and the width of the peaks located at the event points isincreased, indeed, for very large values of τ , the peaks are transformed into plateaus.
7

Peak detection: Once the parameters have been set and the energy of the scalogram hasbeen computed (being it either the L1 or the L2-energy), the next step is determining thepeaks in the energy signal. The problem of finding peaks (or local extrema) within a noisysignal has been already studied from different points of view. Indeed there are several nativeroutines in practically all commercial and open-source mathematical software. As stated inthe Introduction, we will use the MATLAB user-contributed function peakfinder, which wefound to be a very flexible tool as there were several parameters that could be adjusted inorder to obtain the best results. In particular, two parameters were especially important:the minimum threshold and the selectiveness. The former determines the minimum heightall peaks should have, while the later determines the amount above surrounding data for apeak to be, i.e. larger values of the selectiveness make the detector more selective in findingpeaks.
In our 30 curves sample, in order to determine these two parameters, we first estimatedthe background noise in the scalogram energy by computing, for each curve, the standarddeviation, σ, of the last 10% of the scalogram energy, corresponding to the last part of theF-z curve (i.e. the baseline). Then, we set the minimum threshold as 5σ and the selectivenessas 10σ.
4 Conclusions
We have introduced a wavelet method for detecting singularities in AFM force-extensioncurves. This method has the novelty of using a windowed scalogram operator which allowsus to focus on the scales which are more sensitive to the existence of singularities. Moreover,since the final measure, the scalogram energy, is a one-dimensional signal, it is easier toanalyze than the classical method of following the local extrema of the wavelet transformthrough all scales [15]. The method is reliable and easily implementable in any programminglanguage. We chose MATLAB because there is a quite large wavelet function library available,so the implementation of the modifications required is simple.
We have illustrated the method with an example of event search in tether analysis. In thiscase, the events we are looking for are step-like jumps, which are easily found with the Haarwavelet basis. Nevertheless, it should be noted that finding the events is just the first steptowards the automatic detection of tethers. Once the events are properly located, a neuralnetwork, a scalar vector machine, or other type of machine learning classifier, can be trainedin order to obtain a fully automatic algorithm that could extract the information requiredfrom large amounts of force-extension curves.
Moreover, tether analysis is just one example of the applicability of the method intro-duced here. Other possible areas of application of this method in the automatic AFM force-extension curves are: peak detection in protein unfolding experiments, finding unbindingforces and adhesion energies, measuring jumps to contact in the approach segments of thecurves, determining different elastic properties of surfaces where two or more layers arepresent, to name a few.
Acknowledgements
Both authors would like to express their gratitude to Prof. Jose Luis Toca-Herrera for hisinsightful comments and kindly contributing the force-extension AFM data curves for testingthe algorithms.
References
[1] A. Alessandrini, P. Facci. AFM: a versatile tool in biophysics. Measurement Science andTechnology 16 (2005), R65–R92.
8

[2] S. Moreno-Flores, J.L. Toca-Herrera. Hybridizing Surface Probe Microscopies: Towarda Full Description of the Meso- and Nanoworlds. CRC Press (2012).
[3] B. Cappella, G. Dietler. Force-distance curves by atomic force microscopy. Surface Sci-ence Reports 34 (1999), 1–104.
[4] H.J. Butt, B. Cappella, M. Kappl. Force measurements with the atomic force microscope:Technique, interpretation and applications. Surface Science Reports 59 (2005), 1–152.
[5] M. Basseville, I.V. Nikiforov. Detection of abrupt changes: theory and application(1993).
[6] X.Q. Liu, et al. An automatic seismic signal detection method based on fourth-orderstatistics and applications. Applied Geophysics 11 (2014), 128–138.
[7] M. Lavielle, G. Teyssiere. Adaptive detection of multiple change-points in asset pricevolatility. Long memory in economics (2007), 129–156.
[8] N.A. James, A. Kejariwal, D.S. Matteson. Leveraging Cloud Data to Mitigate UserExperience from “Breaking Bad”. arXiv:1411.7955 (2014).
[9] D.C. Lin, E.K. Dimitriadis, F. Horkay. Robust strategies for automated AFM forcecurve analysis–I. Non-adhesive indentation of soft, inhomogeneous materials. Journal ofBiomechanical Engineering 129 (2007), 430–440.
[10] D.C. Lin, E.K. Dimitriadis, F. Horkay. Robust strategies for automated AFM forcecurve analysis-II: adhesion-influenced indentation of soft, elastic materials. Journal ofbiomechanical engineering 129 (2007), 904–12.
[11] Y.R. Chang, et al. Automated AFM force curve analysis for determining elastic modulusof biomaterials and biological samples. Journal of the mechanical behavior of biomedicalmaterials 37 (2014), 209–18.
[12] R. Benıtez, et al. A new automatic contact point detection algorithm for AFM forcecurves. Microscopy Research and Technique 76 (2013), 870–876.
[13] B. Andreopoulos, D. Labudde. Efficient unfolding pattern recognition in single moleculeforce spectroscopy data. Algorithms for Molecular Biology 6 (2011), p.16.
[14] Z.N. Scholl, P.E. Marszalek. Improving single molecule force spectroscopy through au-tomated real-time data collection and quantification of experimental conditions. Ultra-microscopy 136 (2014), 7–14.
[15] S. Mallat. A Wavelet Tour of Signal Processing: The Sparse Way. Academic Press (2008).
[16] F. In, S. Kim. An Introduction to Wavelet Theory in Finance: A Wavelet MultiscaleApproach. World Scientific (2013).
[17] C. Torrence, G. P. Compo. A practical guide to wavelet analysis. B. Am. Meteorol. Soc.79 (1998), 61–78.
[18] C. Torrence, P. J. Webster. Interdecadal changes in the ENSO-monsoon system. J.Climate 12 (1999), 2679–2690.
[19] F. Scholkmann, J. Boss, M. Wolf. An efficient algorithm for automatic peak detectionin noisy periodic and quasi-periodic signals. Algorithms 5 (2012), 588–603.
[20] N. Yoder. peakfinder(x0, sel, thresh, extrema, includeEndpoints, interpolate), MATLABCentral File Exchange. MATLAB Central File Exchange. peakfinder (2009) [AccessedApril 29, 2016].
9

[21] M. Sun, et al. Multiple membrane tethers probed by atomic force microscopy. Biophysicaljournal 89 (2005), 4320–9.
[22] S. Baoukina, S.J. Marrink, D.P. Tieleman. Molecular structure of membrane tethers.Biophysical Journal 102 (2012), 1866–1871.
[23] R Core Team. R: A Language and Environment for Statistical Computing. r-project(2016).
[24] P. Goupillaud, A. Grossmann, J. Morlet. Cycle-octave and related transforms in seismicsignal analysis. Geoexploration 23 (1984), 85–102.
[25] I. Nouira, et al. A robust R peak detection algorithm using wavelet transform for heartrate variability studies. International Journal on Electrical Engineering and Informatics5 (2013), 270–284.
[26] Y. Wang. Jump and sharp cusp detection by wavelets. Biometrika 82 (1995), 385–397.
[27] I. Daubechies. Ten Lectures on Wavelets. Philadelphia, PA: Society for Industrial andApplied Mathematics (SIAM) (1992).
10
#10-64.95 5 5.05 5.1 5.15 5.2 5.25 5.3 5.35 5.4
Forc
e (N
)
#10-9
-3
-2
-1
0Signal
#10-64.95 5 5.05 5.1 5.15 5.2 5.25 5.3 5.35 5.4
L1Ener
gy
#10-9
0
1
2
3Scales 1 to 2
#10-64.95 5 5.05 5.1 5.15 5.2 5.25 5.3 5.35 5.4
L1Ener
gy
#10-8
0
2
4
6Scales 1 to 32
Separation (m) #10-64.95 5 5.05 5.1 5.15 5.2 5.25 5.3 5.35 5.4
L1Ener
gy
#10-7
0
0.5
1
1.5Scales 1 to 256
Figure 5: Effect of the scale window in the L1 scalogram energy for a fixed time radius τ = 5points.
11

x 10-64.95 5 5.05 5.1 5.15 5.2 5.25 5.3 5.35 5.4
Forc
e (N
)
x 10-9
-3
-2
-1
0Signal
x 10-64.95 5 5.05 5.1 5.15 5.2 5.25 5.3 5.35 5.4
L1Ener
gy
x 10-8
0
1
2
3
4Time window radius 1
x 10-64.95 5 5.05 5.1 5.15 5.2 5.25 5.3 5.35 5.4
L1Ener
gy
x 10-8
0
2
4
6Time window radius 5
Separation (m) x 10-64.95 5 5.05 5.1 5.15 5.2 5.25 5.3 5.35 5.4
L1Ener
gy
x 10-8
0
2
4
6Time window radius 20
Figure 6: Effect of the time window in the L1 scalogram energy for a scale window rangingfrom kmin = 1 to kmax = 32.
12