Embed Size (px)
Citation preview
UNITED STATES AIR FORCEAFIOH
IOH-RS-BR-TR-2008-0001 USACHPPM 47-MA-08PV-08
Screening Health Risk Assessment Burn Pit Exposures,
Balad Air Base, Iraq and Addendum Reportand Addendum Report
Gregory TaylorVi i R hVivian RushAdam Deck
U.S. Army Center for Health Promotion and Preventive Medicine
5158 Blackhawk RoadAberdeen Proving Ground, MD 21010-5403
Jay A. Vietas, Lieutenant Colonel, USAF, BSC
May 2008
Air Force Institute for Operational Health
Distribution Statement A: Approved for public release; distribution is unlimited.
Risk Analysis DirectorateHealth and Safety Division2513 Kennedy CircleBrooks City-Base TX 78235-5116

NOTICES When Government drawings, specifications, or other data are used for any purpose other than in connection with a definitely Government-related procurement, the United States Government incurs no responsibility or any obligation whatsoever. The fact that the Government may have formulated or in any way supplied the said drawings, specifications, or other data, is not to be regarded by implication, or otherwise in any manner construed, as licensing the holder or any other person or corporation; or as conveying any rights or permission to manufacture, use, or sell any patented invention that may in any way be related thereto. The mention of trade names or commercial products in this publication is for illustration purposes and does not constitute endorsement or recommendation for use by the United States Air Force. The Office of Public Affairs has reviewed this report, and it is releasable to the National Technical Information Service, where it will be available to the general public, including foreign nationals. This report has been reviewed and is approved for publication. Government agencies and their contractors registered with Defense Technical Information Center (DTIC) should direct requests for copies to: Defense Technical Information Center, 8725 John J. Kingman Rd., STE 0944, Ft. Belvoir, VA 22060-6218. Non-Government agencies may purchase copies of this report from: National Technical Information Services (NTIS), 5285 Port Royal Road, Springfield, VA 22161-2103. //signed// //signed// JAY A. VIETAS, Lt Col, USAF, BSC Mark H. Smith, Col, USAF, BSC Chief, Health and Safety Division Director, Risk Analysis Directorate

Standard Form 298 (Rev. 8-98) Prescribed by ANSI-Std Z39-18
REPORT DOCUMENTATION PAGE Form Approved OMB No. 0704-0188
Public reporting burden for this collection of information is estimated to average 1 hour per response, including the time for reviewing instructions, searching data sources, gathering and maintaining the data needed, and completing and reviewing the collection of information. Send comments regarding this burden estimate or any other aspect of this collection of information, including suggestions for reducing this burden to Washington Headquarters Service, Directorate for Information Operations and Reports, 1215 Jefferson Davis Highway, Suite 1204, Arlington, VA 22202-4302, and to the Office of Management and Budget, Paperwork Reduction Project (0704-0188) Washington, DC 20503. PLEASE DO NOT RETURN YOUR FORM TO THE ABOVE ADDRESS.1. REPORT DATE (DD-MM-YYYY) May 2008
2. REPORT TYPEFinal
3. DATES COVERED (From - To)01 Jan - 30 Apr 2007
4. TITLE AND SUBTITLE Screening Health Risk Assessment Burn Pit Exposures, Balad Air Base, Iraq and Addendum Report
5a. CONTRACT NUMBER
5b. GRANT NUMBER
5c. PROGRAM ELEMENT NUMBER
6. AUTHOR(S) *Vietas, Jay A., Lt Col Taylor, Gregory Rush, Vivian Deck, Adam
5d. PROJECT NUMBER
5e. TASK NUMBER
5f. WORK UNIT NUMBER
7. PERFORMING ORGANIZATION NAME(S) AND ADDRESS(ES)*Air Force Institute for Operational Health 2513 Kennedy Circle, Brooks City-Base, TX 78235-5118/ U.S. Army Center for Health Promotion and Preventive Medicine 5158 Blackhawk Road, Aberdeen Proving Ground, MD 21010-5403
8. PERFORMING ORGANIZATION REPORT NUMBER IOH-RS-BR-TR-2008-0001/ USACHPPM 47-MA-08PV-08
9. SPONSORING/MONITORING AGENCY NAME(S) AND ADDRESS(ES)
10. SPONSOR/MONITOR'S ACRONYM(S)
11. SPONSORING/MONITORING AGENCY REPORT NUMBER
12. DISTRIBUTION AVAILABILITY STATEMENT Distribution Statement A: Approved for public release; distribution is unlimited. SAF/PA Case No. 08-0732, 19 Dec 2008
13. SUPPLEMENTARY NOTES
14. ABSTRACT This report documents the results of ambient air sampling of multiple classes of pollutants expected to be emitted by municipal waste open burn pit operations conducted at Balad Air Base, Iraq. The results were used to develop a screening health risk assessment (HRA) of military personnel located at the site and likely exposed to these pollutants. Findings indicate that measured exposure levels from burn pit operations are not routinely above deployment military exposure guidelines (MEGs) for exposures up to 1 year, levels which are not likely to cause short-term, onset health effects. A human HRA was performed under guidance outlined by the U.S. Environmental Protection Agency (U.S. EPA). These results indicate an “acceptable” health risk for both cancer and non-cancer long-term health effects. Recommendations are provided to reduce the generation of burn pit emissions, thereby reducing exposure to personnel.
15. SUBJECT TERMS Balad Air Base, Iraq, health risk assessment, burn pit operations,CHPPM, CENTCOM, AFCENT
16. SECURITY CLASSIFICATION OF: 17. LIMITATION OF ABSTRACT SAR
18. NUMBER OF PAGES 135
19a. NAME OF RESPONSIBLE PERSON
a. REPORT UNCLASSIFIED
b. ABSTRACT UNCLASSIFIED
c. THIS PAGE UNCLASSIFIED
19b. TELEPONE NUMBER (Include area code)

THIS PAGE INTENTIONALLY LEFT BLANK
ii
USACHPPM Report No. 47-MA-08PV-08/ AFIOH Report No. IOH-RS-BR-TR-2008-0001
ADDENDUM
SCREENING HEALTH RISK ASSESSMENT BURN PIT EXPOSURES
BALAD AIR BASE, IRAQ MAY 2008
JOINTLY PREPARED BY:
U.S. ARMY CENTER FOR HEALTH PROMOTION AND PREVENTIVE MEDICINE
AND
AIR FORCE INSTITUTE OF OPERATIONAL HEALTH
Distribution Statement A: Approved for public release; distribution is unlimited.
SAF/PA Case No. 08-0732, 19 Dec 2008
Preventive Medicine Survey: 40-5f1

ADDENDUM SCREENING HEALTH RISK ASSESSMENT
BURN PIT EXPOSURES BALAD AIR BASE, IRAQ
USACHPPM REPORT NO. 47-MA-08PV-08/ AFIOH REPORT NO. IOH-RS-BR-TR-2008-0001
MAY 2008 1. REFERENCES. See Appendix A for reference information. 2. PURPOSE. This addendum is intended to formally address comments on the Screening Health Risk Assessment (HRA) Burn Pit Exposures, Balad Air Base, Iraq (reference 1) provided by the Defense Health Board (reference 2). 3. BACKGROUND. a. The U.S. Army Center for Health Promotion and Preventive Medicine (USACHPPM) and the U.S. Air Force Institute for Operational Health (AFIOH), (now known as the Air Force School of Aerospace Medicine (USAFSAM)), developed a screening HRA documenting the current understanding of the health risk from burn pit operations at Balad Air Base, Iraq (reference 1). (Note that the Balad Air Base has been renamed Joint Balad Base (JBB), Iraq.) b. A 29 February 2008 memorandum from Ms. Ellen P. Embrey, Deputy Assistant Secretary of Defense for Force Health Protection and Readiness (reference 3), requested the Defense Health Board (DHB) review and comment on the draft version of the final USACHPPM/AFIOH HRA, 2008. Preliminary comments from the DHB were received in April 2008 and incorporated into the final USACHPPM/AFIOH technical report (reference 1). In June 2008, a final memorandum from the DHB was released. Although many of the comments provided by the DHB were incorporated into the joint final report, this addendum provides additional information in response to the DHB’s final memorandum comments (reference 2). 4. RESPONSE TO COMMENTS. a. Air Sample Collection and Screening Health Risk Assessment.
(1) DHB Comments.
(a) “The report as reviewed by the DHB subcommittee did not clearly state that a screening risk assessment was conducted. Apparently in Department of Defense (DoD) parlance, screening risk assessments differ from comprehensive assessments in that they typically attempt to quantify the level of various environmental exposures and compare the results to established permissible standards. Screening assessments may also collect data on health outcomes and biological exposure markers to compare with standards or background
Addendum to USACHPPM Report No. 47-MA-08PV-08/AFIOH Report No. IOH-RS-BR-TR-2008-0001, May 08
2
levels, but do not typically attempt to establish multivariate correlations. It is essential that the final version of the government's risk assessment report clearly state a screening risk assessment was conducted, and explain the distinction used by DoD between a screening and comprehensive risk assessment. (b) The report recognized the small number of environmental samples collected in relation to the estimated length of exposure and the number of sites under study. According to DoD, typical of most screening risk assessments, a determination as to whether any samples should be rejected for quality control reasons was not made due to the paucity of data. In addition, the report acknowledged that actual locations and activities of study subjects while stationed at Balad Air Base were unknown. Therefore, the relationship between locations and personnel-level exposure is not defined. In contrast, even in this screening risk assessment, the locations of environmental samples were known but not fully used to differentiate potential exposures by area.” (2) USACHPPM/USAFSAM Response. (a) The main purpose of the screening health risk assessment was to document ambient air sampling conducted at Balad Air Base, Iraq by on-site military environmental health personnel during the months of January through April of 2007. The sampling effort collected multiple classes of pollutants expected to be emitted by the installation municipal waste open burn pit, which operated 24 hours per day, 7 days per week. The results were used to develop a screening health risk assessment (a health risk assessment that used conservative exposure factors and conservative assumptions to identify whether exposures should be more carefully evaluated for potential risk) and to determine follow-on actions at JBB and other sites with burn pit operations in the U.S. Central Command (CENTCOM) area of responsibility. (b) The Balad Burn Pit Air Sampling Plan (reference 4) used to collect ambient air samples was based primarily on guidance provided in the USACHPPM Technical Guide (TG) 251, A Soldiers Guide to Environmental and Occupational Field Sampling for Military Deployments, (reference 5) and the Air Force Institute for Operational Health (AFIOH) document, Sampling and Analysis Plan for The Collection of Ambient Air Samples at Receptor Locations from Open Pit Burning Operations in the Deployed Environment (reference 6). The USACHPPM TG 251 was used as the primary reference. (c) All of the ambient air samples were collected following quality assurance and quality control protocols outlined in the source documents in order to ensure the soundness of the collected data. Additionally, because the ambient monitoring is based on U.S. Environmental Protection Agency (USEPA) sampling protocols (references 7–10), the quality assurance and quality control practices outlined in those protocols were likewise followed. Some of the quality

Addendum to USACHPPM Report No. 47-MA-08PV-08/AFIOH Report No. IOH-RS-BR-TR-2008-0001, May 08
3
assurance and quality control practices include collocated samples, field blanks, and reagent blanks. Any sample that did not adequately meet the quality assurance and quality control practices was rejected as not valid and was not included in developing exposure point concentrations for the screening health risk assessment. The number of samples collected was not a consideration when choosing to accept or reject a sample. A total of 29 samples (15 percent) were rejected due to equipment errors, calibration errors, or damaged sample media. (d) Screening health risk estimates were calculated from samples of the various exposure areas and of all exposure areas summed together. The report notes that actual locations and activities of personnel stationed are unknown. Because actual locations and activities of individual personnel stationed at Balad Air Base varied, the report developed conservative risk estimates to account for personnel who had the potential to be located at each sampling point. b. Materials Disposed in Burn Pit. (1) DHB Comment. “Since the amount and type of material disposed in the burn pits are not well controlled, burn pit emissions were not fully characterized. To help counter this uncertainty, the investigators employed a broad list of analytes in their sampling efforts. While this represents a reasonable approach, an inventory of disposed materials would have improved the sampling process and helped assure no contaminant was overlooked.” (2) USACHPPM/USAFSAM Response. During the times of sampling plan development and sample collection, solid waste delivered to the burn pit for disposal was inspected on a limited basis for unapproved items, and an inventory of items was not maintained. Since an accurate inventory of what was disposed into the burn pit was not maintained, air samples were collected for a comprehensive list of chemicals expected to be generated by the open burning of solid waste (such as, plastics, paper, wood, metal cans, and so forth) to include dioxins, furans, polycyclic aromatic hydrocarbons (PAHs), metals, volatile organic compounds (VOCs), and particulate matter (PM). c. Non-Burn Pit Air Pollutants.
(1) DHB Comment. “The report did not indicate whether the activities on Balad Air Base, including aircraft and their attendant auxiliary equipment, were considered in calculations regarding air pollutants, particularly with respect to particulate matter and polycyclic aromatic hydrocarbons. These pollutants could impact health and may impact the assessment. While it may be assumed that aircraft operations were ongoing and any contribution from aircraft engine combustion would be included in the results, the report should clearly state this information, as well as that such operations are typically not known to generate dioxins.”

Addendum to USACHPPM Report No. 47-MA-08PV-08/AFIOH Report No. IOH-RS-BR-TR-2008-0001, May 08
4
(2) USACHPPM/USAFSAM Response. While it was recognized that personnel may be exposed to contaminants that may have been produced by other mission-related sources (such as, aircraft operations, vehicular traffic, and other base sustaining activities), the air sampling effort could not specifically distinguish between burn pit exposures and other exposures. This was done deliberately, recognizing that any contaminants with exposure levels of concern would require further investigation regardless of their source. Again, the sampling plan focused on characterizing the areas most potentially affected by burn pit emissions. d. Worst-Case Exposure Scenario. (1) DHB Comment. “While the report indicated a comprehensive ambient air sampling effort was conducted, it also reports a relatively large level of uncertainty regarding actual personnel exposure levels and health risks. It is important that the report clearly define "comprehensive" in that the obtained samples were analyzed for a large number of environmental agents, but the actual number of samples was relatively small. The report acknowledged high variability of both the meteorological conditions at Balad Air Base and the quantity and composition of material burned. These factors would indicate a high level of heterogeneity with respect to airborne exposures. In addition, the multiple 24-hour sample collection process used to account for any meteorological or operational variability in exposure levels, had the potential to dilute exposure peaks by averaging the exposure levels within each sampling period. To counter this problem, this screening assessment used risk calculation methodologies depicting "worst case exposures. Such methodologies include the calculation of exposure point concentrations for every compound of potential concern at the 95th upper confidence limit of the average, with a conservative exposure duration estimate of 24 hours a day for seven days a week. While these methods may over-represent actual human exposure if the time and locations samples as taken produced accurate exposure estimates, they are preferable to methods that do not take "worst case" scenarios into account. The final report should clearly detail the "worst case" methodology used and the reasons it was employed. Due to the nature of burn pit activities, it would be preferable to acquire samples at shorter time intervals in the future.” (2) USACHPPM/USAFSAM Response. Any inference of personal exposure would result from the population-based exposure sampling strategy and assumptions, not from personal sampling conducted with the intent of quantifying individual exposures. Individual exposures to the burn pit can vary with respect to the activities performed, the locations in which personnel reside, and the duration of their deployment. Although the sampling efforts assumed personnel spent 100 percent of their time on the installation, some personnel left the base for a period of time. Instead of attempting to estimate how often each individual was exposed to emissions from the burn pit and to ensure that the exposure of all individuals was accurately considered, it was conservatively assumed that all personnel were exposed to emissions for 24 hours per day.

Addendum to USACHPPM Report No. 47-MA-08PV-08/AFIOH Report No. IOH-RS-BR-TR-2008-0001, May 08
5
While this conservative, “worst-case” assumption overestimated the exposure for some individuals, it assured that no individuals had their exposure underestimated. Therefore, the assigned exposure level calculated in this risk assessment for personnel assigned to Balad Air Base is a conservative estimate of exposure and likely overestimates the maximum health risk to any actual individual. Exposure peaks were not a health concern to personnel at Balad Air Base because all the detected analyte results were examined individually and determined to be below the 1-hr and 8-hr MEGs (provided these are available) and because the maximum detections for all of the chemicals of potential concern retained in the quantitative risk assessment were more than 4 orders of magnitude below the most conservative 1-hour air MEGs (provided there were 1-hour air MEGs for the compound). e. Dioxin Serum Sampling Pilot Study.
(1) DHB Comments.
(a) “The screening risk assessment did not clearly state that dioxin body burden measures (pre- and post-deployment serum specimens) were obtained from randomly selected anonymous service members, leading the reader to wonder why no attempt was made to determine level of environmental exposure and dioxin body burdens based on workplace location or job category (personnel maintaining burn pit fires). If a more definitive risk assessment were conducted, person-level data such as proximity to the burn pit fires and other covariates would be valuable. (b) Furthermore, the serum samples of the pilot study were deidentified and obtained at random from the Department of Defense Serum Repository (DoDSR); as a result, personal information was not linked to the samples tested. Consequently, the random samples screened may not be representative of actual human exposure, if the time and location characteristics of the samples chosen were not conducive for the accurate ascertainment of actual exposure.” (2) USACHPPM/USAFSAM Response. (a) While evaluating the sampling data (which later was determined to be erroneous), it was noted that the “dioxin” (meaning all the tetrachlorodibenzo-p-dioxin toxicity equivalent (TEQ) components analyzed) air-exposure point concentrations (EPCs), and subsequently calculated health risks, appeared disconcertingly high. We calculated that modeled body burden levels (that is, body fat concentrations) after a year's deployment could be in the hundreds of picograms per grams (pg/g) or parts per trillion (ppt) based on the false EPCs. The dioxin calculation error, which was rooted in a computer programming error, was discovered and corrected after the serum study was underway. Corrected EPCs were used for the model, and the recalculated body-burden levels showed only a minimal, incremental increase in dioxin, which is not expected to impact health.
Addendum to USACHPPM Report No. 47-MA-08PV-08/AFIOH Report No. IOH-RS-BR-TR-2008-0001, May 08
6
(b) A pilot study to test “dioxin” serum fat concentrations was performed for the sole purpose of better clarifying quickly whether the initial calculated dioxin levels could be real for the exposed, deployed population. Under these circumstances, a well-designed epidemiological study was neither feasible nor intended. Such a study might correlate exposure (along with time-activity relationships) with serum fat levels in known individuals. In addition, enough serum would be obtained, per specimen, to distinguish the impact of the burn pit (pre- versus post-deployment) down to precise, low levels. Discussion was ongoing regarding details of such a follow-on study should it be indicated. (c) This pilot study used DOD databases to create a personnel roster, the DODSR to obtain pre- and post-deployment serum specimens, and the Centers for Disease Control and Prevention (CDC), National Center for Environmental Health (NCEH), laboratory to analyze the specimens for “dioxin.” The NCEH laboratory agreed to a maximum number of 25-paired samples to analyze with a short turnaround time. Due to the requirement for quick results, the “most-exposed” Service member population was defined by length of time deployed to Balad Air Base. Specifically, the “most-exposed” population was defined as those Service members who had been at Balad Air Base for at least 1 year as of the time the air sampling was being done and who had at least one previous 1-year deployment to Balad Air Base. “Dioxins” accumulate in body fat over time with exposure (and could be a measure of integrated exposure from all routes) and only leave slowly. The roster was randomly narrowed down to 25 personnel and deidentified by the DODSR. The DODSR could only provide 1 cubic centimeter (cc) of serum for each specimen, rather than the 7 cc that NCEH usually worked with, which raised the detection limits substantially. Because of these various circumstances and in the interest of time and feasibility, this study, as compared to most studies, had a much lower power and higher than normally achieved limit of detection. It is only because we were looking for impacts even above that level of detection that the study became feasible and useful.
f. Interpreting Results. (1) DHB Comments. (a) “While the report provided an adequate account regarding uncertainties and their impact on assumptions required for data interpretation and analysis, the report offered limited data examination and information on the potential effects of Service member burn pit combustion product exposures, the exposure variance, and the relation of exposures to the Military Exposure Guideline (MEG) benchmark.
(b) Although comparisons to the MEG value occurred frequently in the report, insufficient information and discussion precluded determinations as to whether it was derived or used appropriately, since exposure was not limited to a traditional work week.”

Addendum to USACHPPM Report No. 47-MA-08PV-08/AFIOH Report No. IOH-RS-BR-TR-2008-0001, May 08
7
(2) USACHPPM/USAFSAM Response.
(a) The USACHPPM/AFIOH HRA (reference 1) approached the assessment of the deployed Soldiers at Balad Air Base in a number of complementary ways, each meant to provide information contributory to the whole. These include the MEGs and composite risk management (CRM) methodology; the quantitative health risk assessment methodology; disease and nonbattle injury (DNBI) rate comparisons; and a pilot study of dioxin TEQ serum fat concentrations in a random sample of Service members deployed to Balad Air Base for the longest time (references 11 and 12).
(b) The use of MEGs and CRM methodology is a health risk tool developed specifically
for the military population during periods of deployment. This risk estimation method differs from the quantitative human health risk assessment. Its focus is primarily on the operational mission during the deployment rather than any potential additive, chronic health risk to a given individual. The health risk estimate derived through use of the MEGs and CRM process is one of a number of mission-related risk assessments that comprise a field commander's overall CRM evaluation of a situation. However, the MEGs themselves are useful as media-specific, time-specific screening levels, utilizing deployment exposures while in a deployed location. For example, the MEGs were used in this report to specifically address inhalation exposure to VOCs for a deployment rotation to Balad Air Base (now JBB).
(c) The MEGs were developed by USACHPPM to identify potential hazards and to
estimate the associated health risk in the context of the mission in a deployed setting. The MEGs are used in a manner consistent with U.S. Army and U.S. Air Force doctrinal health risk management procedures and terminology and the Army-specific, CRM-matrixed guidelines (references 12 and 13). This method includes identification of the hazard(s), assessment of the hazard severity and probability, and determination of a risk estimate and associated level of confidence. As part of the hazard identification step, the long-term (1-year) MEGs are used as screening criteria to identify those hazards that are potential health threats to the mission. These 1-year MEGs represent chemical concentrations above which certain types of health effects may begin to occur in individuals within the exposed deployed population after a continuous, single exposure of the specified duration. If the 1-year MEGs are exceeded, the 1-hour, 8-hour, or 14-day MEGs are used to determine if a shorter-term exposure could pose a health concern. Note that while a chemical exposure may be a potential threat after 1 year, it often will not pose a threat for a shorter exposure duration. Typically the shorter-term MEGs are higher (less conservative) than the 1-year MEGs.
(d) The MEGs are not designed to determine casualty estimates but are instead used as
preventive guidelines. The underlying toxicological basis for the MEGs is addressed in the USACHPPM Reference Document (RD) 230 (reference 14). The MEGs differ from other
Addendum to USACHPPM Report No. 47-MA-08PV-08/AFIOH Report No. IOH-RS-BR-TR-2008-0001, May 08
8
published health screening values (such as, preliminary remediation goals or risk-based concentrations) due to the unique characteristics (including body weight, age, exposure duration, and inhalation rate) of the exposure group (deployed Service members) when compared to the general population. Since toxicological information about potential health effects varies among different chemicals, the determination of hazard severity when MEGs are exceeded involves professional judgment. Hazards with exposure concentrations greater than MEGs are identified as potential health threats, carried through the hazard assessment process, and assigned a risk estimate consistent with CRM methodology. Hazards that are either not detected or are present only at levels below the 1-year MEGs are not considered health threats and, therefore, are automatically assigned a low-operational risk estimate.
g. Particulate Matter. (1) DHB Comments. (a) “Although 50 of the 163 samples surpassed the one-year MEG for particulate matter PM10, the report stated the PM10 levels are characteristic for this region. Burn pit combustion products typically contain elevated levels of particulate matter in the ultra fine and fine range. Uncertainty in the risk assessment could be reduced if characterization of the size distribution of particulate matter, including PM2.5 and PM10 associated with the burn pit environment were conducted and compared to normal background levels outside this environment, in addition to particle composition and associated potential health risks.
(b) While dioxin levels did not exceed the 1-year MEG among the 32 air samples analyzed, characterization of these samples by particulate size would have provided information regarding exposure to the burn plume. Particulates should have been used to sort the air samples into strata in order to determine whether the 32 samples analyzed for dioxin levels were derived from high or low particulate samples.”
(2) USACHPPM/USAFSAM Response. While PM10 was assessed according to
screening health risk guidance (reference 6), a year-long PM sampling survey was conducted in 2006–2007 at 15 locations within the CENTCOM area of responsibility, including Balad Air Base. The PM2.5, PM10, and total suspended particulate were collected every 6 days and analyzed for over 70 individual chemical species. Different sample collection media were used so that different analyses could be performed. Bin sizing and scanning-electron microscopy (SEM) were also conducted on a portion of these samples. The results of this study were published in the Department of Defense Enhanced Particulate Matter Surveillance Program (reference 15). The PM10 concentrations at Balad Air Base, consistent with the other sampled sites, were found to be up to 10 times those measured at U.S. urban and rural reference sites. However, the mineralogical content, chemical composition, as well as individual particle results
Addendum to USACHPPM Report No. 47-MA-08PV-08/AFIOH Report No. IOH-RS-BR-TR-2008-0001, May 08
9
of ambient and resuspended soil, bear the signature of that region’s geology rather than anthropologic sources, such as the Balad Air Base (now JBB) burn pit. In general the PM2.5 and PM10 were similar to that in other desert regions, differing primarily in the relative proportions of common minerals (such as, silicates, carbonates, oxides, sulfates, and so forth). The SEM results showed the fine and ultrafine particulate contained an average carbon content of 1.4 percent by mass, which indicates the predominant source of these particulates was the regional dust and not combustion by-products. Speciation of carbon into elemental versus organic was not possible due to adsorption of carbonaceous vapors onto the quartz sample filters. The PM10 concentrations were not significantly different for each of the sampling locations and, therefore, were not stratified for dioxin sample results. h. Dioxin Concentration Error Correction.
(1) DHB Comments.
(a) “The report did not provide a clear explanation regarding the source of the initial erroneous risk assessment. Errors can occur by miscalculation, in transcription or the use of the wrong unit of measurement and inaccurate programming of automated systems, among other ways. Various methods can be employed which ensure quality control, including peer-review, adequate staff training or field-testing of systems to ensure accuracy, and automatic alerts which indicate when data exceeds a predetermined range. It is not clear whether quality control approaches were employed in this risk assessment.
(b) As depicted in the report issued by the Institute of Medicine To Err Is Human: Building a Safer Health System, preventable errors which transpire in the clinical setting can have severe and substantial repercussions, while exacting significant costs. Lessons learned from the clinical setting can also be applicable in the public health arena. Upon review of the revised report, the Board found the systems in place for error prevention and detection in the Draft Health Risk Assessment should be reviewed. This should include an analysis into the source of the error which occurred in the initial Draft Risk Assessment report, so that necessary and appropriate steps are taken in the attempt to prevent errors, as well as any resulting adverse consequences, from occurring in the future.
(c) The screening assessment report further detail the source of the mathematical error in the original report, with the goal of identifying systematic opportunities for their prevention in the future.”

Addendum to USACHPPM Report No. 47-MA-08PV-08/AFIOH Report No. IOH-RS-BR-TR-2008-0001, May 08
10
(2) USACHPPM/USAFSAM Response. (a) The error in the initial draft dioxin results was due to the underlying calculation method programmed into the laboratory sample calculation database. The database had been programmed to calculate concentrations based on an input of dioxin mass in nanograms (ng). However, the analytical method used by the laboratory generated dioxin mass data in picograms (pg). The database accepted that input as though it was in ng, and since 1 ng equals 1,000 pg, the database calculated the dioxin concentrations at 1,000 times higher than the actual values. The database coding was corrected, and all other calculation algorithms for other parameters were verified for their accuracy. The corrected database was then used to regenerate the dioxin results. This resulted in the dioxin concentrations being correctly adjusted lower by a factor of 1,000. The corrected concentrations were less than their respective MEGs, and when used to calculate risk using USEPA human health risk assessment methodology, the carcinogenic and noncarcinogenic risk estimates were determined to be "acceptable" per USEPA guidelines for long-term exposure (reference 16). (b) All automated laboratory sample calculations were reviewed for accuracy. No additional programming issues were found. Since the time of the initial dioxin calculation error, a new database was brought on-line and is being used for laboratory data processing. All database calculations involving new parameters or methods are rigorously tested prior to usage. Also, the new database architecture is designed to verify data integrity and report any potential concerns prior to the generation of any final results. i. Rates of Respiratory Illness.
(1) DHB Comment. “The geographic analysis of respiratory illness was presented as
incidence of respiratory illness at various bases. However, the data were limited to a single syndromic entity (respiratory illness) and did not include detailed information regarding whether other contributory factors (such as smoking) were associated with respiratory illness. For purposes of comparison between bases, this analysis is of limited value, particularly given the paucity of base-specific environmental sampling and the lack of information on person-level risk correlates for respiratory disease. While it is somewhat reassuring to find no substantive differences in respiratory illness between the bases, these finding add little to the overall assessment.”
(2) USACHPPM/USAFSAM Response. It is true that the rate of reported respiratory
diagnoses is calculated using a broad category (as found in the ICD-9) that is not specific to effects of inhaled toxic agents and not specifically related to exposures at Balad Air Base (now JBB). It was compared to the rates at other Air Force locations in the CENTCOM area of

Addendum to USACHPPM Report No. 47-MA-08PV-08/AFIOH Report No. IOH-RS-BR-TR-2008-0001, May 08
11
responsibility. The reported average rate for Balad Air Base (now JBB) was approximately equal to the composite average rate for all the sites. Although not definitive as a stand-alone product, this comparison serves as another piece of evidence used in the overall risk assessment. It should be noted that there were many uncertainties in the calculations for each location, including inconsistent reporting and uncertain denominator population numbers.
j. Risk Communication. (1) DHB Comment. “There is a need to develop, implement, and deploy in a timely fashion effective risk communication plans, particularly since misinformation regarding dioxin risk at Balad abounds within the military community.” (2) USACHPPM/USAFSAM Response. (a) In August 2008, Multi-National Corps Iraq, in conjunction with U.S. Air Force Central Command, implemented a JBB burn pit risk communication plan jointly developed by the U.S. Army and U.S. Air Force. Public affairs played an active role in theater at the tactical and operational level developing and deploying both print and video messages reaching Service members deployed to JBB. (b) Force Health Protection Officers, from both the U.S. Army and Air Force, already deployed to Balad Air Base, conducted town hall meetings to address Service members’ concerns and misinformation regarding dioxin and other related public health risks. (c) The USACHPPM and the USAFSAM developed the following fact sheets that can be found on the Deployment Health and Family Readiness Library, (http://deploymenthealthlibrary.fhp.osd.mil/home.jsp): i. Burning Trash and Human Waste Exposures for Service Members and Their Families, (http://deploymenthealthlibrary.fhp.osd.mil/accessLog.jsp?prodid=313). ii. Health Effects of Dioxin Exposure for Service Members, (http://deploymenthealthlibrary.fhp.osd.mil/products/Health%20Effect%20of%20Dioxin%20Exposure%20(314).pdf). iii. Open Pit Burning, General Facts and Information, (http://deploymenthealthlibrary.fhp.osd.mil/products/Open%20Pit%20Burning%20(55).pdf). (d) The entire Deployment Health and Family Readiness Library product list can be found at (http://deploymenthealthlibrary.fhp.osd.mil/products.jsp).
Addendum to USACHPPM Report No. 47-MA-08PV-08/AFIOH Report No. IOH-RS-BR-TR-2008-0001, May 08
A–1
APPENDIX A
REFERENCES
References Cited. 1. USACHPPM REPORT NO. 47-MA-08PV-08/AFIOH REPORT NO. IOH-RS-BR-TR-2008-0001, Screening Health Risk Assessment, Burn Pit Exposures, Balad Air Base, Iraq, May 2008. 2. Memorandum, Defense Health Board, subject: Defense Health Board Findings Pertaining to Health Risk Assessment, Burn Pit Exposures, Balad Air Base, Iraq, 26 June 2008. 3. Memorandum, Deputy Assistant Secretary of Defense for Force Health Protection and Readiness, subject: Defense Health Board Findings Pertaining to Health Risk Assessment, Burn Pit Exposures, Balad Air Base, Iraq, 29 February 2008. 4. Memorandum, Air Force Institute for Occupational Health, subject: Balad Burn Pit Air Sampling Plan, 28 August 2006 5. USACHPPM TG 251, A Soldiers Guide to Environmental and Occupational Field Sampling for Military Deployments. (http://chppm-www.apgea.army.mil/documents/TG/TECHGUID/TG251.pdf) 6. AFIOH, Sampling and Analysis Plan for The Collection of Ambient Air Samples at Receptor Locations from Open Pit Burning Operations in the Deployed Environment. (https://kx.afms.mil/kxweb/dotmil/file/web/ctb_110326.pdf) 7. USEPA. 1999. Compendium of Methods for the Determination of Toxic Organic Compounds in Ambient Air Second Edition, Compendium Method TO-9A, Determination Of Polychlorinated, Polybrominated And Brominated/Chlorinated Dibenzo-p-Dioxins And Dibenzofurans In Ambient Air, January 1999. Center for Environmental Research Information Office of Research and Development. 8. USEPA. 1999. Compendium of Methods for the Determination of Toxic Organic Compounds in Ambient Air Second Edition, Compendium Method TO-13A Determination of Polycyclic Aromatic Hydrocarbons (PAHs) in Ambient Air Using Gas Chromatography/Mass Spectrometry (GC/MS), January 1999. Center for Environmental Research Information Office of Research and Development.
Addendum to USACHPPM Report No. 47-MA-08PV-08/AFIOH Report No. IOH-RS-BR-TR-2008-0001, May 08
A–2
9. USEPA. 1999. Compendium of Methods for the Determination of Toxic Organic Compounds in Ambient Air Second Edition, Compendium Method TO-14A, Determination Of Volatile Organic Compounds (VOCs) In Ambient Air Using Specially Prepared Canisters With Subsequent Analysis By Gas Chromatography, January 1999. Center for Environmental Research Information Office of Research and Development. 10. USEPA. 1999. Compendium of Methods for the Determination of Inorganic Compounds in Ambient Air, June 1999. Center for Environmental Research Information Office of Research and Development. 11. USACHPPM TG 230, Chemical Exposure guidelines for Deployed Military Personnel, May 2003 with January 2004 Addendum. 12. Department of the Army. Field Manual 5-19, Composite Risk Management, July 2006. 13. U.S. Air Force. Air Force Manual 48-153, Health Risk Assessment, March 28, 2007, (http://www.e-publishing.af.mil/shared/media/epubs/AFMAN48-153.pdf). 14. USACHPPM RD 230, Chemical Exposure Guidelines for Deployed Military Personnel, Version 1.3. May 2003 with January 2004 addendum. 15. Desert Research Institute, Department of Defense Enhanced Particulate Matter Surveillance Program, February 2008. 16. USEPA. 1989 EPA/540/1-89/002, Risk Assessment Guidance for Superfund. Office of Emergency and Remedial Response. Other Publications. Institute of Medicine. 1999. To Err Is Human: Building A Safety Health System. National Academy Press, Washington, DC. (http://books.nap.edu/html/to_err_is_human/reportbrief.pdf); or (http://www.nap.edu/books/0309068371/html/).
USACHPPM Report No. 47-MA-08PV-08/ AFIOH Report No. IOH-RS-BR-TR-2008-0001
SCREENING HEALTH RISK ASSESSMENT
BURN PIT EXPOSURES BALAD AIR BASE, IRAQ
MAY 2008
JOINTLY PREPARED BY:
U.S. ARMY CENTER FOR HEALTH PROMOTION AND PREVENTIVE MEDICINE
AND
AIR FORCE INSTITUTE OF OPERATIONAL HEALTH
Distribution Statement A: Approved for public release; distribution is unlimited. SAF/PA Case No. 08-0732, 19 Dec 2008

DEPARTMENT OF THE ARMY US ARMY CENTER FOR HEALTH PROMOTION AND PREVENTIVE MEDICINE
5158 BLACKHAWK ROAD ABERDEEN PROVING GROUND MD 21010-5403
Readiness thru Health
EXECUTIVE SUMMARY SCREENING HEALTH RISK ASSESSMENT
BURN PIT EXPOSURES BALAD AIR BASE, IRAQ
USACHPPM REPORT NO. 47-MA-08PV-08/ AFIOH REPORT NO. IOH-RS-BR-TR-2008-0001
MAY 2008 1. PURPOSE. This report documents the results of ambient air sampling conducted at Balad Air Base, Iraq by on-site military environmental health personnel. The ambient air sampling was intended to collect multiple classes of pollutants expected to be emitted by the Air Base municipal waste open burn pit, which operated 24 hours (hrs), 7-days per week. The results of the ambient air sampling will provide the foundation for a screening health risk assessment (HRA) of military personnel located at the site and likely exposed to these pollutants. The ambient sampling relied upon for this report was performed 2 January 2007 through 21 April 2007, prior to the operation of on-site incinerators. Subsequent air sampling will be conducted following the installation and operation of multiple municipal waste incinerators. No incinerators were operational during this sampling period. 2. CONCLUSIONS. a. The U.S. Army Center for Health Promotion and Preventive Medicine (USACHPPM) and the U.S. Air Force Institute for Operational Health (AFIOH) have jointly developed a screening HRA documenting the current understanding of the health risk from burn pit operations at Balad Air Base, Iraq. Findings indicate that measured exposure levels from burn pit operations are not routinely above deployment military exposure guidelines (MEGs) for exposures up to 1 year. The MEGs, as published in USACHPPM Technical Guide (TG) 230, (Chemical Exposure Guidelines for Deployed Military Personnel), represent chemical concentrations above which certain types of health effects may begin to occur in individuals within an exposed population after a continuous, single exposure of specified duration. The MEGs are not designed for determining casualty estimates but are instead used as preventive guidelines. The occupational and environmental health (OEH) risk estimate for exposure to all substances sampled for in the ambient air (except particulate matter particles of 10 micrometers or less (PM10) at Balad Air Base indicates adverse health risks are unlikely. These levels are not likely to cause short-term onset health effects. b. In addition, a human HRA was performed under guidance outlined by the U.S. Environmental Protection Agency (U.S. EPA). Cancer (carcinogenic) and non-cancer (or non-carcinogenic, which means any health effect other than cancer) risk estimates were developed. These results indicate an “acceptable” health risk for both cancer and non-cancer long-term health effects. This methodology and resulting estimates do not indicate an absolute measure of an individual’s probability of an adverse health effect. Instead, the results indicate the likelihood

EXSUM, USACHPPM Report No. 47-MA-08PV-08/AFIOH Report No. IOH-RS-BR-TR-2008-0001, May 08
ES–2
that such outcomes (longer term/delayed cancer or non-cancer health effects) might occur under very specific exposure conditions. c. Dioxins were evaluated separately for non-cancer risks since they do not have the “toxicity value” from U.S. EPA needed for that methodology. Using a model to estimate body-burden level (build up of dioxins in the body), the burn pit has minimal impact on body-burden level. A pilot serum study supports this finding. d. A software error resulting from an improperly programmed access database in the initial reporting of sample results for dioxin congeners produced results which were 1,000 times greater than the measured value. Consequently, initial draft reports, to include a document released on 3 December 2007 titled "Balad Burn Pit Interim Report—Executive Summary," significantly overestimated the carcinogenic risk to personnel. As noted above, revised estimates for carcinogenic and non-carcinogenic effects find the health risk levels “acceptable” by U.S. EPA guidelines for long-term exposure. These results reflect conditions through June 2007, upon which two incinerators became operational and are expected to reduce contaminant levels. e. This report is based on the results of a comprehensive air sampling effort conducted by U.S. Air Force Bioenvironmental Engineering and U.S. Army preventive medicine personnel in the first four months of 2007. The air sampling study targeted expected emissions from the burn pit to include particulate matter, volatile organics, metals, polycyclic aromatic hydrocarbons, and polychlorodibenzodioxins/furans (hereafter called “dioxins” and “furans”). Sampling locations were selected to represent typical and maximum exposure levels for the general population serving at Balad Air Base. The samples were also collected over multiple 24-hour periods to account for some of the operational and meteorological variability in exposure levels. A total of 163 samples were collected, resulting in 4811 individual analyte results. The 1-year MEGs were exceeded in 52 samples, to include 50 samples for particulate matter less than 10 (PM10) microns in size and two samples for volatile organic compounds. Particulate matter levels were typical of what would be expected in the region and similar to background levels. Testing results do not indicate that PM10 was significantly increased by burn pit operations. Particulate matter exposure in the U.S. Central Command (USCENTCOM) region has been previously identified as a potential health concern and is being addressed in other studies. Results from the particulate matter were not evaluated as part of this assessment. f. Despite the comprehensive sampling effort, there is significant uncertainty about actual exposure levels and the associated health risk estimates for those who currently are or have been assigned to Balad Air Base. Therefore, the exposure scenario was performed using a worse-case scenario approach and most individual exposures and resulting risks are expected to be less than predicted. Contaminant concentrations and related exposure levels are highly variable due to changing meteorological conditions (such as, wind direction and speed), differences in amount and type of material burned, as well as the temperature at which the material is burned. The risk assessment in this report conservatively assumed air sample results were representative of daily

EXSUM, USACHPPM Report No. 47-MA-08PV-08/AFIOH Report No. IOH-RS-BR-TR-2008-0001, May 08
ES–3
exposure, continuous, and stable burn pit operations and that the base population remained constant. g. Continued work by preventive medicine personnel in the U.S. Air Force and U.S. Army will be aimed at protecting the health of all Service members and reducing the level of uncertainty in these estimates. Any significant refinement that improves the precision of the estimate will be shared with Balad Air Base and USCENTCOM leadership as they are obtained. 3. RECOMMENDATIONS. The following recommendations should be considered in the development of an action plan to reduce any future burn pit exposures at Balad Air Base and at other locations in USCENTCOM area of responsibility. These include the following: a. Reduce or eliminate the open burning of plastic materials. The main source of ambient levels of dioxins and furans is low-temperature burning plastic materials, especially in the presence of metal catalysts. These conditions typify open pit burning operations. b. Assess effectiveness of control measures. Assess air pollution levels at Balad Air Base after controls are implemented. Air sampling should be performed to ensure that recommended control measures for reducing exposure levels to personnel are implemented and working. c. Develop a risk communication plan. A risk communication plan, to include both information products and open discussion opportunities, should be developed. Appropriate risk communication products, such as fact sheets for Service members and commanders, should be disseminated to communicate the results of any HRAs and potential plans for determining the meaning of the results. While information products can be helpful in increasing understanding, open discussion opportunities are proven to help minimize unnecessary concerns by outwardly reinforcing leadership focus on Force Health Protection; clarifying misinformation/ misperceptions; and by ensuring that decision makers remain cognizant of nonexperts’ interests, values, and concerns.
d. Conduct a policy review. Recommend Force Health Protection and Readiness, Joint Staff, and Under Secretary of Defense (Acquisition, Technology and Logistics) conduct a comprehensive policy review concerning proper use of burn pits and develop new policies to fill any gaps. e. Force Health Protection and Readiness coordinated with the Defense Health Board (DHB) to review the updated USACHPPM/AFIOH Balad screening health risk assessment and corresponding calculations for health risks for individuals deployed to Balad Air Base. The DHB remarks were documented in a draft Memorandum, Defense Health Board (DHB), subject: Defense Health Board Findings Pertaining to Final “Draft Health Risk Assessment, Burn Pit Exposures, Balad Air Base, Iraq”.
USACHPPM Report No. 47-MA-08PV-08/AFIOH Report No. IOH-RS-BR-TR-2008-0001, May 08
i
TABLE OF CONTENTS
Page 1. PURPOSE ...............................................................................................................................1 2. INTRODUCTION AND BACKGROUND............................................................................1 3. RESULTS AND MILITARY EXPOSURE GUIDELINE COMPARISONS........................5 4. DESCRIPTION OF PREVIOUSLY REPORTED CANCER RISK ESTIMATES ASSOCIATED WITH AIRBORNE DIOXIN LEVELS ........................................................7 5. COMPOSITE RISK MANAGEMENT ESTIMATE (SHORT-TERM ONSET/ ACUTE RISK) ........................................................................................................................9 6. DISEASE AND NON-BATTLE INJURY RESULTS...........................................................9 7. QUANTITATIVE RISK ESTIMATE (LONG-TERM ONSET/ CHRONIC RISK)..................................................................................................................10 8. DISCUSSION OF THE HEALTH RISK ASSESSMENT NUMBERS...............................12 9. DISCUSSION OF RISK UNCERTAINTY AND LIMITATIONS OF THE HUMAN HEALTH RISK ASSESSMENT PROCESS........................................................13 10. DIOXIN NON-CANCERCINOGENIC HEALTH EFFECTS ASSESSMENT AND PILOT SERUM STUDY.............................................................................................15 11. SUMMARY AND CONCLUSIONS....................................................................................16 12. RECOMMENDATIONS ......................................................................................................17 13. POINTS OF CONTACT.......................................................................................................19 Appendices
A. REFERENCES...................................................................................................................A–1 B. AIR SAMPLING METHODOLOGIES ............................................................................B–1 C. COMPOSITE RISK ASSESSMENT.................................................................................C–1
USACHPPM Report No. 47-MA-08PV-08/AFIOH Report No. IOH-RS-BR-TR-2008-0001, May 08
ii
Page
Appendices (continued) D. QUANTITATIVE RISK ASSESSMENT..........................................................................D–1 E. PROGRAMMING CODE OUTLINING ORIGINAL CALCULATION ERROR AND THE CORRECTED CALCULATION .................................................................... E–1 F. AIR SAMPLING DATA.................................................................................................... F–1 G. QUANTITATIVE RISK ASSESSMENT RESULTS BY LOCATION ...........................G–1 H. REPORT ON DIOXIN BODY BURDEN PREDICTION AND PILOT SERUM STUDY....................................................................................................H–1 I. SUPPLEMENTAL INFORMATION ON DIOXIN SERUM STUDY AND HEALTH EFFECTS ........................................................................................................... I–1 GLOSSARY ................................................................................................................ Glossary–1
LIST OF TABLES
Page
1. Summary of Data Parameters Collected .................................................................................4 2. Balad Air Base MEG Exceedances by Date ...........................................................................5 3. Conversion Formula Effect on Reported Concentration.........................................................9 4. Summary of Weekly Respiratory Diagnoses per 1000 Persons from U.S. Air Force Location in U.S. Central Command Air Forces (May 2003–June 2007)..............................10 5. Non-cancer Hazard Indices ...................................................................................................12 6. Cancer Risk Levels................................................................................................................12 7. Risk Assessment Elements which May Introduce Uncertainty and Degree .........................14 B–1. List of Dioxins and Furans Target Analytes .................................................................B–3 B–2. List of PAH Target Analytes ........................................................................................B–4 B–3. List of VOC Target Analytes........................................................................................B–5 B–4. List of 10 Metals Analyzed in PM10......................................................................................................................B–8 D–1. COPCs Frequency of Duration .....................................................................................D–3 D–2. COPCs ..........................................................................................................................D–5
USACHPPM Report No. 47-MA-08PV-08/AFIOH Report No. IOH-RS-BR-TR-2008-0001, May 08
iii
LIST OF TABLES (continued) Page
D–3. Toxicity Equivalency Factors for PCDDs and PCDFs.................................................B–8 D–4. Exposure Point Concentrations.....................................................................................D–9 D–5. Exposure Pathway Assessment Values.......................................................................D–11 D–6. Inhalation Intake (mg/kg-day) for Receptors Located at the EPC Containing All Samples....................................................................................................D–13 D–7. Inhalation Intake (mg/kg-day) for Receptors Located at the Guard Tower Transportation Field EPC.................................................................................................D–14 D–8. Inhalation Intake (mg/kg-day) for Receptors Located at the H6 Housing Area/CASF EPC...............................................................................................................D–15 D–9. Inhalation Intake (mg/kg-day) for Receptors Located at the Mortar EPC..................D–16 D–10. Toxicity Values...........................................................................................................D–18 D–11. Non-cancer Hazard Indices.........................................................................................D–21 D–12. Cancer Risk Levels .....................................................................................................D–22 F–1. Ambient Air TO-9 Methodology Samples ................................................................... F–1 F–2. Ambient Air TO-13 Methodology Samples ................................................................. F–7 F–3. Ambient Air TO-14 Methodology Samples ............................................................... F–13 G–1. Non-carcinogenic Risk Results for Personnel Present for 12 Months..........................G–1 G–2. Carcinogenic Risk Results for Personnel Present for 12 Months .................................G–2 G–3. Non-carcinogenic Risk Results for Personnel Present for 4 Months............................G–3 G–4. Carcinogenic Risk Results for Personnel Present for 4 Months ...................................G–4 G–5. Non-carcinogenic Risk Results for Personnel Present for 1 Month .............................G–5 G–6. Carcinogenic Risk Results for Personnel Present for 1 Month ....................................G–6 H–1. Toxicity Equivalency Factors for PCDDs and PCDFs.................................................H–4 I–1. NCEH Laboratory Results of the 25 Soldiers’ Pre- and Post-Deployment Serum for7 Detected Dioxin Congeners ........................................................................ I–3
LIST OF FIGURES
Page
1. Wind Rose of Balad Air Base Meteorology............................................................................2 2. Diagram of Balad Sites of Interest ..........................................................................................4 B–1. Sampling Equipment Used at Balad Air Base ..............................................................B–1 C–1. Operational Risk Management Process ........................................................................C–1

Use of trademarked name(s) does not imply endorsement by the U.S. Army but is intended only to assist in the identification of a specific product.
SCREENING HEALTH RISK ASSESSMENT BURN PIT EXPOSURES
BALAD AIR BASE, IRAQ USACHPPM REPORT NO. 47-MA-08PV-08/
AFIOH REPORT NO. IOH-RS-BR-TR-2008-0001 MAY 2008
1. PURPOSE. This report is intended to document the results of ambient air sampling conducted at Balad Air Base, Iraq by on-site military public health personnel. The ambient air sampling was intended to collect multiple classes of pollutants expected to be emitted by the Air Base municipal waste open burn pit, which operated 24 hours (hrs), 7-days per week. The results of the ambient air sampling will provide the foundation for a screening health risk assessment (HRA) of military personnel located at the site and likely exposed to these pollutants. The ambient sampling relied upon for this report was performed 2 January 2007 through 21 April 2007, prior to the operation of on-site incinerators. Subsequent air sampling will be conducted following the installation and operation of multiple municipal waste incinerators. No incinerators were operational as of April 2007, the last month air sampling was conducted during this phase. 2. INTRODUCTION AND BACKGROUND. a. Location. Balad Air Base, also known as Logistic Support Area Anaconda, is located in Northern Iraq approximately 68 kilometers (km) north of Baghdad and 1.5 km from the Tigris River. It occupies a 25 square kilometer site and is protected by a 20-km security perimeter. Balad is currently one of the largest airbases in Iraq. It was built in the 1980s, designed by a Yugoslavian firm, and was previously used as an Air Base for the Iraqi military. The airfield is served by two runways about 11,000 feet in length and is the launching point for Air Force fighters, Army helicopters, and Army unmanned aerial systems. Balad is home to approximately 25,000 military, civilian, and coalition personnel.
b. Adjacent Land Use. The adjacent property is primarily used for agriculture. Irrigation canals fed by the Tigris River run around the outside northeastern and western sections of the base perimeter. An earthen berm lies between the fence line and canal on the northeastern side of the Air Base.
c. Climate. (1) The Iraqi climate is similar to that of the extreme southwestern United States with hot dry summers, cold winters, and a comfortable spring and fall. Approximately 90 percent of the annual rainfall occurs between November and April, mostly during the winter months from December through March. The remaining 6 months, particularly the hottest period of the year (June through August), are dry. The Persian Gulf has limited influence on the climate of Iraq.
USACHPPM Report No. 47-MA-08PV-08/AFIOH Report No. IOH-RS-BR-TR-2008-0001, May 08
2
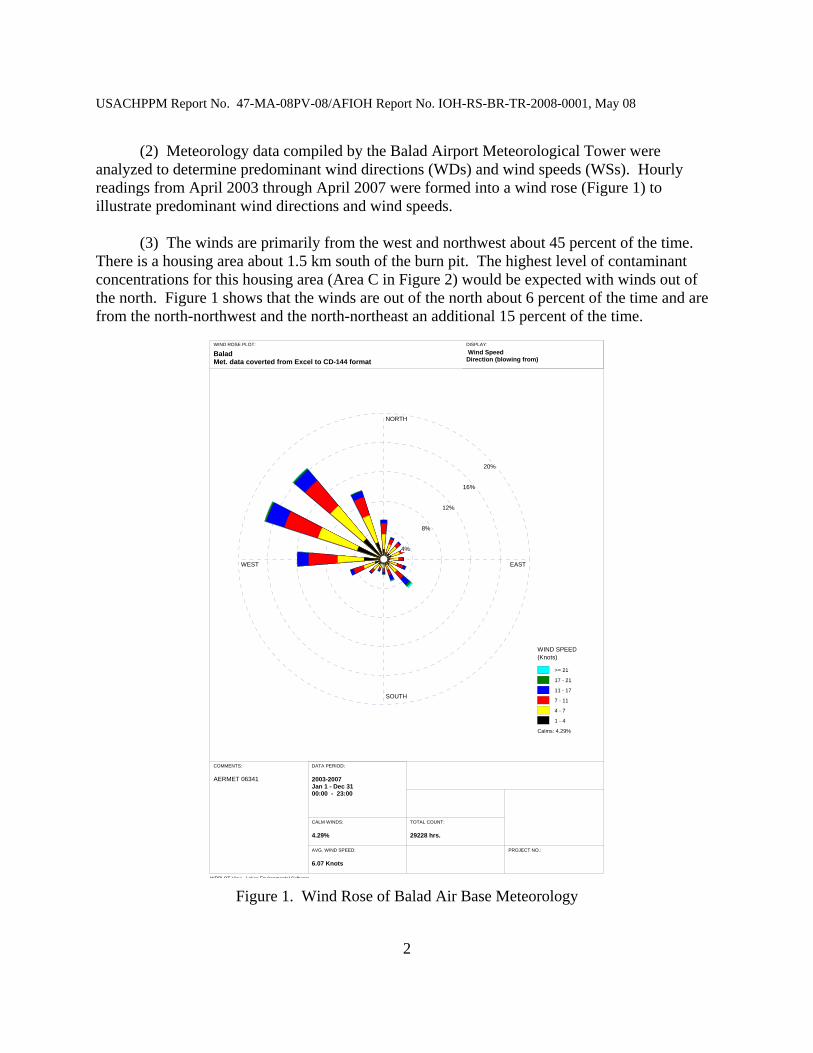
(2) Meteorology data compiled by the Balad Airport Meteorological Tower were analyzed to determine predominant wind directions (WDs) and wind speeds (WSs). Hourly readings from April 2003 through April 2007 were formed into a wind rose (Figure 1) to illustrate predominant wind directions and wind speeds. (3) The winds are primarily from the west and northwest about 45 percent of the time. There is a housing area about 1.5 km south of the burn pit. The highest level of contaminant concentrations for this housing area (Area C in Figure 2) would be expected with winds out of the north. Figure 1 shows that the winds are out of the north about 6 percent of the time and are from the north-northwest and the north-northeast an additional 15 percent of the time.
WRPLOT View - Lakes Environmental Software
WIND ROSE PLOT:
BaladMet. data coverted from Excel to CD-144 format
COMMENTS:
AERMET 06341
PROJECT NO.:
NORTH
SOUTH
WEST EAST
4%
8%
12%
16%
20%
WIND SPEED (Knots)
>= 21
17 - 21
11 - 17
7 - 11
4 - 7
1 - 4
Calms: 4.29%
TOTAL COUNT:
29228 hrs.
CALM WINDS:
4.29%
DATA PERIOD:
2003-2007 Jan 1 - Dec 3100:00 - 23:00
AVG. WIND SPEED:
6.07 Knots
DISPLAY:
Wind SpeedDirection (blowing from)
Figure 1. Wind Rose of Balad Air Base Meteorology

USACHPPM Report No. 47-MA-08PV-08/AFIOH Report No. IOH-RS-BR-TR-2008-0001, May 08
3
d. Background. (1) Since 2003, open burn pits have been used to facilitate solid waste disposal activities from solid wastes generated at Balad Air Base. The amount of solid waste being burned was estimated at about 2 tons of material per day in the early stages of troop deployment and currently may be as much as several hundred tons per day. The Balad burn pit is an open burning pit which is a source of air pollution and may present potential health risk from inhalation of combustibles and combustion products to personnel assigned to the base. Limited segregation or “rough sort” of solid wastes is conducted during which flammables, ammunition, and bulk metal materials are removed. However, inspection of waste to properly account for items entering the burn pit does not occur. Solid wastes, which were generated and dumped into the burn pit, have included: plastics, metal/aluminum cans, rubber, chemicals (such as, paints, solvents), petroleum, oil, and lubricant products, munitions, unexploded ordnance, wood waste, and incomplete combustion by-products with jet fuel (JP-8) being used as the accelerant. The burn pit does not effectively burn the volume of wastes generated, and smoke from the burn pit occasionally blows over the Air Base and into living areas.
(2) Permanent-party population has increased by about one third since 2006 and is expected to continue to increase. The recent commissioning of two incinerators in June 2007, as part of the installation operation and maintenance plan, has reduced the volume of trash burned in the pit by about half and allowed burning operations to keep pace with growing population demands; however, emissions from the incinerators still contribute some impact to air quality in the immediate area. Information related to associated control devices and control efficiencies will be important for future HRAs.
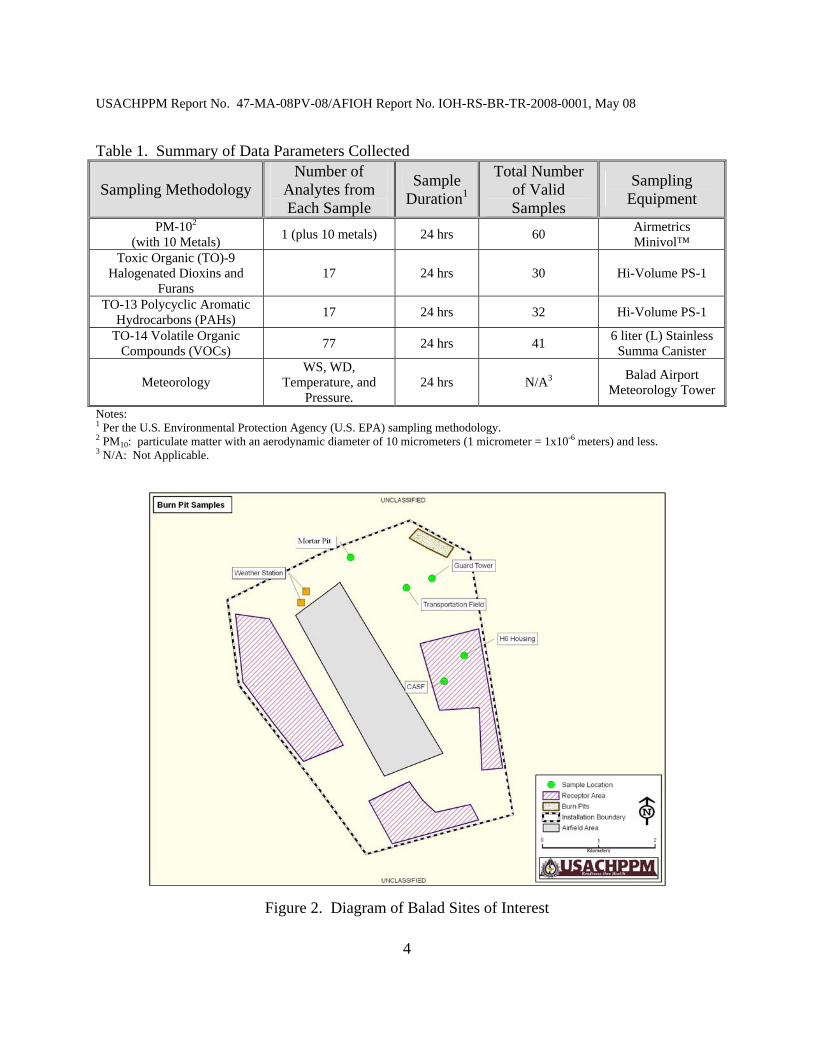
(3) Personnel at the site have expressed health concerns from intermittent exposure to burn pit emissions. Complaints regarding the odor from burning waste, a lack of visibility due to emitted smoke, and eye and respiratory discomfort have been made by personnel at the site. Air samples were collected at Balad Air Base from 2 January 2007 to 21 April 2007 to quantify the type and amount of compounds being emitted from the burn pits during trash disposal activities. The focus of this sampling was to assess the potential for adverse health effects to personnel at the Air Base who were exposed to burn pit emissions. (4) The burn pit is located at the northeast corner of the Air Base property (see Figure 2). Due to the location of the burn pit in relation to personnel and seasonal WDs and WSs, thick plumes of smoke tended to drift across the Air Base. Air sampling, conducted over the course of 4 months at five different sites, was intended to assess possible hazardous levels of air pollutants. The five air sampling sites included the mortar pit site west of the burn pit and sites south of the burn pit at the northeast guard tower, the transportation field, around the H6 housing area, and near the Contingency Aeromedical Staging Facility (CASF). Table 1 summarizes the data parameters collected during this period, and Figure 2 illustrates the relative locations of sites of interest at Balad. The complete sampling methodology is located in Appendix B.
USACHPPM Report No. 47-MA-08PV-08/AFIOH Report No. IOH-RS-BR-TR-2008-0001, May 08
4
Table 1. Summary of Data Parameters Collected
Sampling Methodology Number of
Analytes from Each Sample
Sample Duration1
Total Number of Valid Samples
Sampling Equipment
PM-102 (with 10 Metals) 1 (plus 10 metals) 24 hrs 60 Airmetrics
Minivol™ Toxic Organic (TO)-9
Halogenated Dioxins and Furans
17 24 hrs 30 Hi-Volume PS-1
TO-13 Polycyclic Aromatic Hydrocarbons (PAHs) 17 24 hrs 32 Hi-Volume PS-1
TO-14 Volatile Organic Compounds (VOCs) 77 24 hrs 41 6 liter (L) Stainless
Summa Canister
Meteorology WS, WD,
Temperature, and Pressure.
24 hrs N/A3 Balad Airport Meteorology Tower
Notes: 1 Per the U.S. Environmental Protection Agency (U.S. EPA) sampling methodology. 2 PM10: particulate matter with an aerodynamic diameter of 10 micrometers (1 micrometer = 1x10⁻⁶ meters) and less. 3 N/A: Not Applicable.
Figure 2. Diagram of Balad Sites of Interest
USACHPPM Report No. 47-MA-08PV-08/AFIOH Report No. IOH-RS-BR-TR-2008-0001, May 08
5
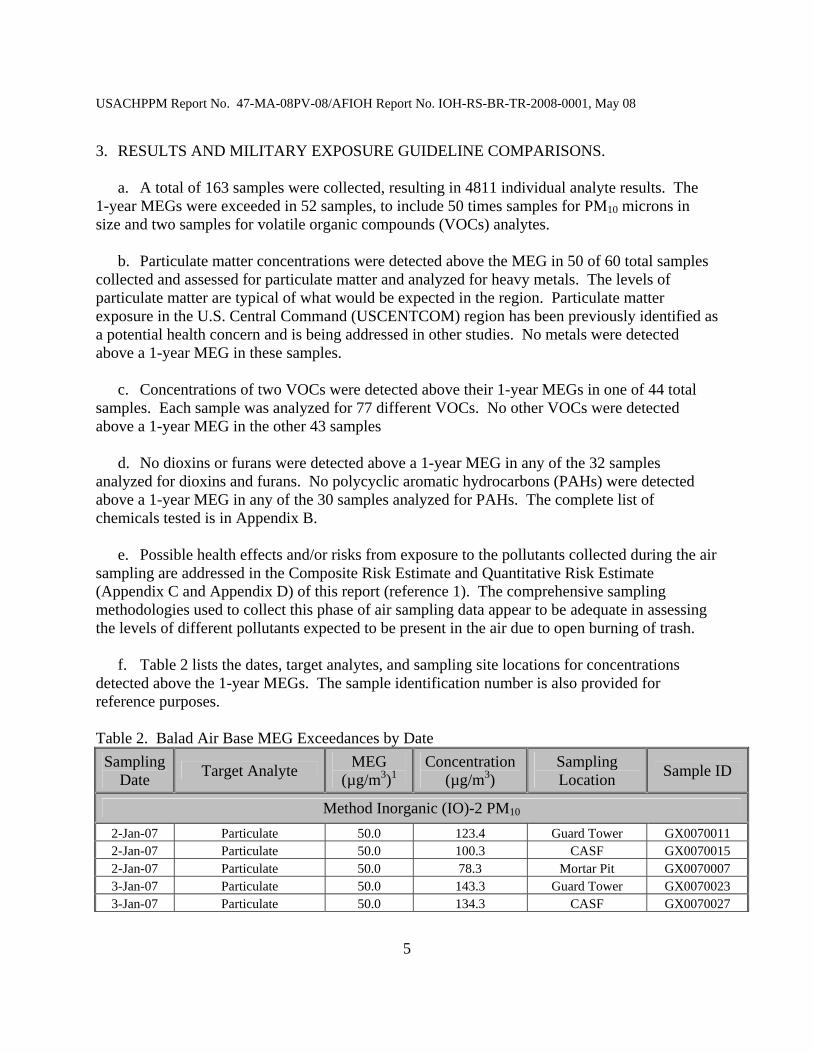
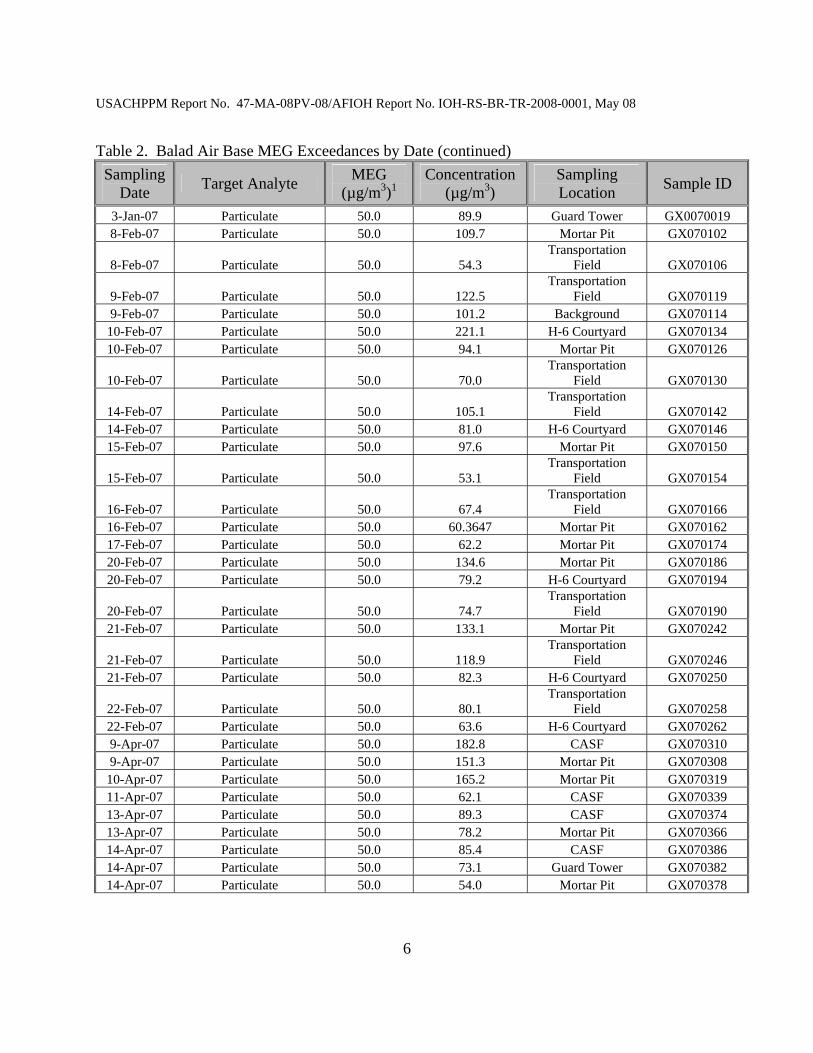
3. RESULTS AND MILITARY EXPOSURE GUIDELINE COMPARISONS. a. A total of 163 samples were collected, resulting in 4811 individual analyte results. The 1-year MEGs were exceeded in 52 samples, to include 50 times samples for PM10 microns in size and two samples for volatile organic compounds (VOCs) analytes. b. Particulate matter concentrations were detected above the MEG in 50 of 60 total samples collected and assessed for particulate matter and analyzed for heavy metals. The levels of particulate matter are typical of what would be expected in the region. Particulate matter exposure in the U.S. Central Command (USCENTCOM) region has been previously identified as a potential health concern and is being addressed in other studies. No metals were detected above a 1-year MEG in these samples. c. Concentrations of two VOCs were detected above their 1-year MEGs in one of 44 total samples. Each sample was analyzed for 77 different VOCs. No other VOCs were detected above a 1-year MEG in the other 43 samples d. No dioxins or furans were detected above a 1-year MEG in any of the 32 samples analyzed for dioxins and furans. No polycyclic aromatic hydrocarbons (PAHs) were detected above a 1-year MEG in any of the 30 samples analyzed for PAHs. The complete list of chemicals tested is in Appendix B. e. Possible health effects and/or risks from exposure to the pollutants collected during the air sampling are addressed in the Composite Risk Estimate and Quantitative Risk Estimate (Appendix C and Appendix D) of this report (reference 1). The comprehensive sampling methodologies used to collect this phase of air sampling data appear to be adequate in assessing the levels of different pollutants expected to be present in the air due to open burning of trash. f. Table 2 lists the dates, target analytes, and sampling site locations for concentrations detected above the 1-year MEGs. The sample identification number is also provided for reference purposes. Table 2. Balad Air Base MEG Exceedances by Date
Sampling Date Target Analyte MEG
(µg/m3)1 Concentration
(µg/m3) Sampling Location Sample ID
Method Inorganic (IO)-2 PM10 2-Jan-07 Particulate 50.0 123.4 Guard Tower GX0070011 2-Jan-07 Particulate 50.0 100.3 CASF GX0070015 2-Jan-07 Particulate 50.0 78.3 Mortar Pit GX0070007 3-Jan-07 Particulate 50.0 143.3 Guard Tower GX0070023 3-Jan-07 Particulate 50.0 134.3 CASF GX0070027
USACHPPM Report No. 47-MA-08PV-08/AFIOH Report No. IOH-RS-BR-TR-2008-0001, May 08
6
Table 2. Balad Air Base MEG Exceedances by Date (continued) Sampling
Date Target Analyte MEG (µg/m3)1
Concentration (µg/m3)
Sampling Location Sample ID
3-Jan-07 Particulate 50.0 89.9 Guard Tower GX0070019 8-Feb-07 Particulate 50.0 109.7 Mortar Pit GX070102
8-Feb-07 Particulate 50.0 54.3 Transportation
Field GX070106
9-Feb-07 Particulate 50.0 122.5 Transportation
Field GX070119 9-Feb-07 Particulate 50.0 101.2 Background GX070114
10-Feb-07 Particulate 50.0 221.1 H-6 Courtyard GX070134 10-Feb-07 Particulate 50.0 94.1 Mortar Pit GX070126
10-Feb-07 Particulate 50.0 70.0 Transportation
Field GX070130
14-Feb-07 Particulate 50.0 105.1 Transportation
Field GX070142 14-Feb-07 Particulate 50.0 81.0 H-6 Courtyard GX070146 15-Feb-07 Particulate 50.0 97.6 Mortar Pit GX070150
15-Feb-07 Particulate 50.0 53.1 Transportation
Field GX070154
16-Feb-07 Particulate 50.0 67.4 Transportation
Field GX070166 16-Feb-07 Particulate 50.0 60.3647 Mortar Pit GX070162 17-Feb-07 Particulate 50.0 62.2 Mortar Pit GX070174 20-Feb-07 Particulate 50.0 134.6 Mortar Pit GX070186 20-Feb-07 Particulate 50.0 79.2 H-6 Courtyard GX070194
20-Feb-07 Particulate 50.0 74.7 Transportation
Field GX070190 21-Feb-07 Particulate 50.0 133.1 Mortar Pit GX070242
21-Feb-07 Particulate 50.0 118.9 Transportation
Field GX070246 21-Feb-07 Particulate 50.0 82.3 H-6 Courtyard GX070250
22-Feb-07 Particulate 50.0 80.1 Transportation
Field GX070258 22-Feb-07 Particulate 50.0 63.6 H-6 Courtyard GX070262 9-Apr-07 Particulate 50.0 182.8 CASF GX070310 9-Apr-07 Particulate 50.0 151.3 Mortar Pit GX070308
10-Apr-07 Particulate 50.0 165.2 Mortar Pit GX070319 11-Apr-07 Particulate 50.0 62.1 CASF GX070339 13-Apr-07 Particulate 50.0 89.3 CASF GX070374 13-Apr-07 Particulate 50.0 78.2 Mortar Pit GX070366 14-Apr-07 Particulate 50.0 85.4 CASF GX070386 14-Apr-07 Particulate 50.0 73.1 Guard Tower GX070382 14-Apr-07 Particulate 50.0 54.0 Mortar Pit GX070378

USACHPPM Report No. 47-MA-08PV-08/AFIOH Report No. IOH-RS-BR-TR-2008-0001, May 08
7
Table 2. Balad Air Base MEG Exceedances by Date (continued) Sampling
Date Target Analyte MEG (µg/m3)1
Concentration (µg/m3)
Sampling Location Sample ID
17-Apr-07 Particulate 50.0 130.7 Background GX070390 17-Apr-07 Particulate 50.0 112.6 CASF GX070398 17-Apr-07 Particulate 50.0 98.2 Guard Tower GX070394 18-Apr-07 Particulate 50.0 299.0 Guard Tower GX070406 18-Apr-07 Particulate 50.0 295.3 Mortar Pit GX070402 18-Apr-07 Particulate 50.0 127.0 H-6 Courtyard GX070433
19-Apr-07 Particulate 50.0 165.6 Transportation
Field GX070429 19-Apr-07 Particulate 50.0 160.2 Mortar Pit GX070425 20-Apr-07 Particulate 50.0 170.8 Mortar Pit GX070435
20-Apr-07 Particulate 50.0 95.7 Transportation
Field GX070453
20-Apr-07 Particulate 50.0 76.6 Transportation
Field GX070441 21-Apr-07 Particulate 50.0 146.5 H-6 Courtyard GX070457 21-Apr-07 Particulate 50.0 113.1 Mortar Pit GX070449
Method TO-14 VOCs 3-Jan-07 Acrolein 0.014 2.6 Guard Tower GX0070022 9-Apr-07 Hexachlorobutadiene 5.2 27.8 CASF GX070307
Note: 1 µg/m3: microgram per cubic meter g. Acrolein was measured at the transportation field once at 2.6 µg/m3, which is above the 1-year MEG of 0.014 µg/m3 but below the 14-day MEG of 23 µg/m3. Acrolein can be an irritant above the threshold of 625 µg/m3 to the eyes, nose, and lungs at an elevated level. h. Hexachlorobutadiene was measured at the CASF once at 27.8 µg/m3, which is above the 1-year MEG of 5.2 µg/m3 but below the 8-hour MEG of 240 µg/m3. Hexachlorobutadiene is a solvent that may cause dizziness or headaches at an elevated level. 4. DESCRIPTION OF PREVIOUSLY REPORTED CANCER RISK ESTIMATES ASSOCIATED WITH AIRBORNE DIOXIN LEVELS. a. The U.S. Army Center for Health Promotion and Preventive Medicine (USACHPPM), in conjunction with the U.S. Air Force Institute for Operational Health (AFIOH), produced a draft Executive Summary (EXSUM) on ambient air dioxin levels and associated cancer risk estimates from burn pit operations at Balad Air Base, Iraq on 3 December 2007. This draft EXSUM outlined the potential elevated cancer risks to military personnel at Balad Air Base. This EXSUM reported the carcinogenic risk estimates for personnel assigned to Balad Air Base as 2
USACHPPM Report No. 47-MA-08PV-08/AFIOH Report No. IOH-RS-BR-TR-2008-0001, May 08
8
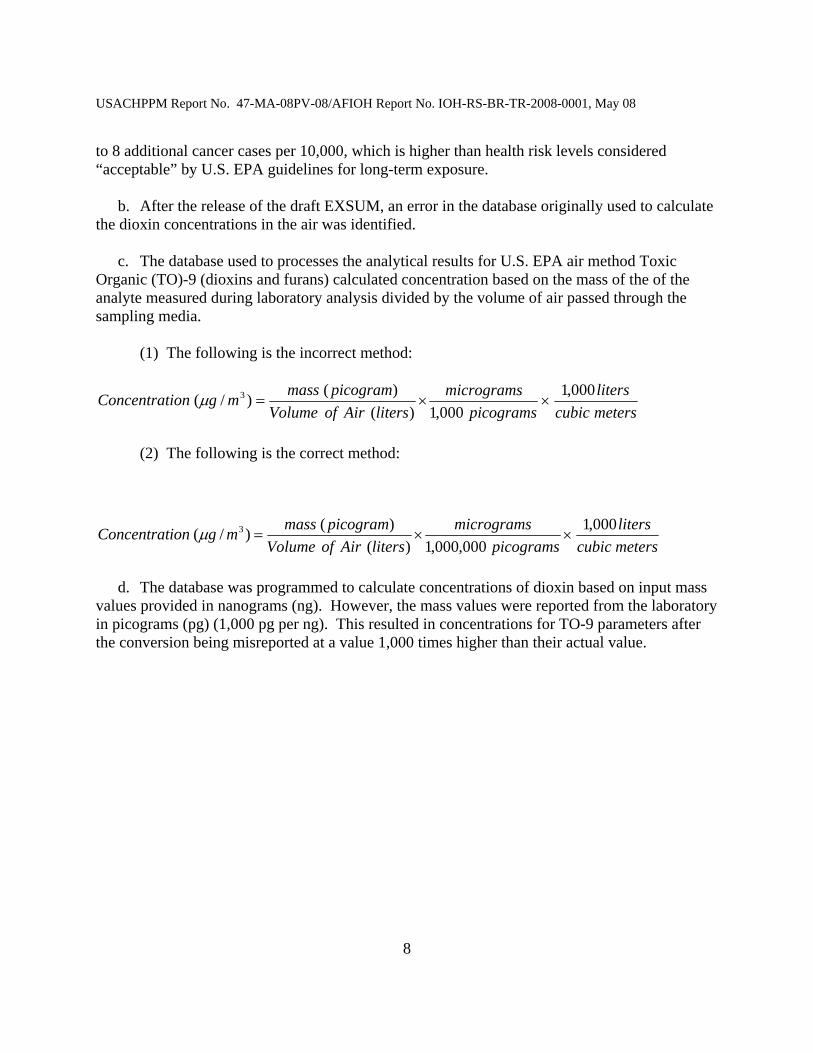
to 8 additional cancer cases per 10,000, which is higher than health risk levels considered “acceptable” by U.S. EPA guidelines for long-term exposure. b. After the release of the draft EXSUM, an error in the database originally used to calculate the dioxin concentrations in the air was identified. c. The database used to processes the analytical results for U.S. EPA air method Toxic Organic (TO)-9 (dioxins and furans) calculated concentration based on the mass of the of the analyte measured during laboratory analysis divided by the volume of air passed through the sampling media. (1) The following is the incorrect method:
(2) The following is the correct method:
d. The database was programmed to calculate concentrations of dioxin based on input mass values provided in nanograms (ng). However, the mass values were reported from the laboratory in picograms (pg) (1,000 pg per ng). This resulted in concentrations for TO-9 parameters after the conversion being misreported at a value 1,000 times higher than their actual value.
meterscubicliters
picogramsmicrograms
litersAirofVolumepicogrammassmgionConcentrat 000,1
000,1)()()/( 3 ××=μ
meterscubicliters
picogramsmicrograms
litersAirofVolumepicogrammassmgionConcentrat 000,1
000,000,1)()()/( 3 ××=μ
USACHPPM Report No. 47-MA-08PV-08/AFIOH Report No. IOH-RS-BR-TR-2008-0001, May 08
9
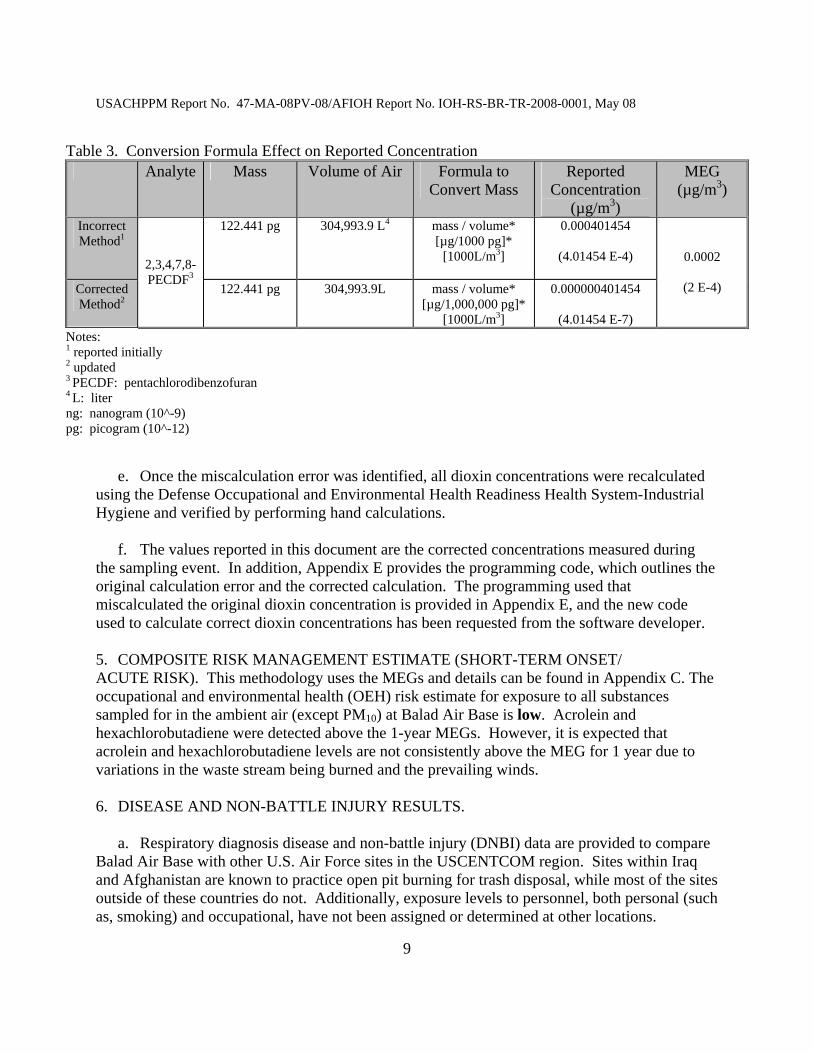
Table 3. Conversion Formula Effect on Reported Concentration Analyte Mass Volume of Air Formula to
Convert Mass Reported
Concentration (µg/m3)
MEG (µg/m3)
Incorrect Method1
122.441 pg
304,993.9 L4 mass / volume* [µg/1000 pg]*
[1000L/m3]
0.000401454
(4.01454 E-4)
Corrected Method2
2,3,4,7,8-PECDF3
122.441 pg 304,993.9L mass / volume* [µg/1,000,000 pg]*
[1000L/m3]
0.000000401454
(4.01454 E-7)
0.0002
(2 E-4)
Notes: 1 reported initially 2 updated 3 PECDF: pentachlorodibenzofuran 4 L: liter ng: nanogram (10^-9) pg: picogram (10^-12)
e. Once the miscalculation error was identified, all dioxin concentrations were recalculated using the Defense Occupational and Environmental Health Readiness Health System-Industrial Hygiene and verified by performing hand calculations. f. The values reported in this document are the corrected concentrations measured during the sampling event. In addition, Appendix E provides the programming code, which outlines the original calculation error and the corrected calculation. The programming used that miscalculated the original dioxin concentration is provided in Appendix E, and the new code used to calculate correct dioxin concentrations has been requested from the software developer. 5. COMPOSITE RISK MANAGEMENT ESTIMATE (SHORT-TERM ONSET/ ACUTE RISK). This methodology uses the MEGs and details can be found in Appendix C. The occupational and environmental health (OEH) risk estimate for exposure to all substances sampled for in the ambient air (except PM10) at Balad Air Base is low. Acrolein and hexachlorobutadiene were detected above the 1-year MEGs. However, it is expected that acrolein and hexachlorobutadiene levels are not consistently above the MEG for 1 year due to variations in the waste stream being burned and the prevailing winds. 6. DISEASE AND NON-BATTLE INJURY RESULTS. a. Respiratory diagnosis disease and non-battle injury (DNBI) data are provided to compare Balad Air Base with other U.S. Air Force sites in the USCENTCOM region. Sites within Iraq and Afghanistan are known to practice open pit burning for trash disposal, while most of the sites outside of these countries do not. Additionally, exposure levels to personnel, both personal (such as, smoking) and occupational, have not been assigned or determined at other locations.

USACHPPM Report No. 47-MA-08PV-08/AFIOH Report No. IOH-RS-BR-TR-2008-0001, May 08
10
Therefore, this data serve a limited role in assessing the relationship between exposure and health effect. b. Table 4 shows the average, maximum, and the standard deviation of the weekly rate of respiratory diagnoses per 1,000 persons at each of these sites. Although the category of diagnosis is broad and there are some uncertainties with the quality of the data collected, it appears to show that there is no noticeable difference between them, for acute respiratory illnesses, despite the presence of the burn pit at Balad Air Base. Uncertainties in the data make credible interpretation more difficult. c. Some of the problems with the data include unreliable denominator (population at risk) data since it is unit-reported. Additionally, reporting of the cases can be incomplete and inconsistent by time and location. These uncertainties become more problematic when trying to compare DNBI rates between sites and for long duration; it is typically less of a problem to use DNBI rates within one location and for relative short-time periods. Finally, respiratory cases are defined as a broad category (a set of International Statistical Classification of Diseases (ICD)-9 codes), which is not specific to effects of inhaled toxic agents and not specifically related to exposures. d. The inclusion of this data, while not definitive as a stand alone product, serves as another piece of evidence to be included in the overall risk assessment.
Table 4. Summary of Weekly Respiratory Diagnoses per 1000 Persons from U.S. Air Force Locations in U.S. Central Command Air Forces (May 2003–June 2007) Average Maximum Std Deviation Afghanistan #1 8.31 41.17 7.03 Balad Air Base 11.66 61.24 8.78 Iraq #1 8.91 41.47 7.28 Iraq #2 16.11 46.59 9.95 Iraq #3 7.60 28.37 6.56 Kuwait #1 8.89 23.91 5.07 Kyrgyzstan #1 18.46 64.55 10.90 Qatar #1 11.38 30.25 5.81 UAE #1 10.09 36.89 5.50 Grand Total 11.36 64.55 8.42
7. QUANTITATIVE RISK ESTIMATE (LONG-TERM ONSET/CHRONIC RISK). a. Using the Human Health Risk Assessment Guidance for Superfund methodology outlined by the U.S. EPA, a quantitative screening human HRA was performed on the ambient air sampling data to evaluate the chronic health risks from exposure to Balad burn pit emissions (reference 2). Evaluation of potential health risks at the site using a quantitative screening HRA
USACHPPM Report No. 47-MA-08PV-08/AFIOH Report No. IOH-RS-BR-TR-2008-0001, May 08
11
methodology will allow for the potential additive effects from exposure to the compounds of potential concern, which were not taken into account in the operational risk assessment. b. Estimates of personnel exposure were determined using an air sampling strategy developed to obtain results, which reflected emissions from the burn pit at varying distances. The route of exposure evaluated at this site was limited to inhalation of the burn pit emissions. Appendix B details the air sampling methodologies and Appendix D contains the full text for the risk assessment. c. To develop the risk assessment, exposure point concentrations (EPC) were calculated as the 95th percent upper-confidence limit (UCL) of the mean for each chemical of potential concern (COPC). It was assumed that these were the constant air concentrations breathed 24 hours/day and 7-days/week while the various personnel were on the site. Four EPCs were calculated for each COPC. One EPC contained all sample results, and three EPCs were derived from sampling points at varying distances from the burn pit location. The guard tower/transportation field EPC-contained samples closest to the burn pit; the mortar pit EPC contained samples farther from the burn pit than the guard tower/transportation field sampling locations; and the H6 housing/CASF EPC contained samples farthest from the burn pit. d. All personnel were assumed to weigh 70 kilograms (kg) with a breathing rate of 20 cubic meters per day (m3/day) (standard U.S. EPA values). e. Three populations of personnel were considered based upon varying lengths of tour and, therefore, length of exposure— (1) Personnel at Balad Air Base for 12 months. (2) Personnel at Balad Air Base for 4 months. (3) Personnel at Balad Air Base for 1 month. f. Each of the populations was assessed at the conservative exposure time estimate of 24-hours per day. g. Using the methodologies in Appendix D, non-cancer health hazards and cancer risks were calculated by population and EPC. These are presented in the tables below and in Appendix D.

USACHPPM Report No. 47-MA-08PV-08/AFIOH Report No. IOH-RS-BR-TR-2008-0001, May 08
12
Table 5. Non-cancer Hazard Indices Receptor Overall
Base Guard Tower/ Transportation Field
H6 Housing/ CASF
Mortar Pit
Personnel present for 12 months 0.47 0.75 0.42 0.25
Personnel present for 4 months 0.15 0.25 0.14 0.08
Personnel present for 1 month 0.04 0.06 0.03 0.02
Note: According to guidelines provided by the U.S. EPA, non-cancer health hazards are assessed as “acceptable” or “safe” if the hazard index is less than 1.0; that is, if the sum of the ratios is below 1.0 for all the chemicals of concern (COC). Table 6. Cancer Risk Levels Receptor Overall
Base Guard Tower/ Transportation Field
H6 Housing/ CASF
Mortar Pit
Personnel present for 12 months 1.68E-6 4.61E-6 1.55E-6 9.01E-7
Personnel present for 4 months 5.52E-7 1.52E-6 5.10E-7 2.96E-7
Personnel present for 1 month 1.38E-7 3.79E-7 1.28E-7 7.40E-8
Note: According to guidelines provided by the U.S. EPA, cancer health hazards are assessed as “acceptable” or “safe” if the “calculated” cancer risk is in the range of 1E-4 (one in 10,000) to 1E-6 (one in one million) or lower. 8. DISCUSSION OF THE HEALTH RISK ASSESSMENT NUMBERS. a. The following points about a quantitative risk assessment should be emphasized: (1) First, an estimate of carcinogenic risk or non-carcinogenic hazard is dependent upon the assumptions and numerical values used in the risk characterization, toxicity evaluation, and exposure assessment components. Risk assessment estimates should not be taken as absolute measures of an individual’s probability of an adverse health effect. Rather, the estimates should be viewed as a threshold of concern for the receptor populations. Since most exposure parameters incorporate methods designed to yield a high-end estimate plus some degree of safety factor, the estimate of risk is most likely an overestimate. (2) Second, these estimates do not indicate that an adverse outcome actually will occur; they only indicate the likelihood or probability that such outcomes might occur under very specific exposure conditions. However, the flexibility to adjust exposure assumptions and values allows risk managers to analyze a number of different exposure conditions and reach a more informed decision than if a risk assessment was not conducted.
USACHPPM Report No. 47-MA-08PV-08/AFIOH Report No. IOH-RS-BR-TR-2008-0001, May 08
13
(3) Third, a risk assessment is only to be used to make informed risk management decisions and is only one of several tools that can provide useful information for a final risk management solution. When all uncertainties associated with the assumptions and exposure values are identified, however, a comprehensive risk assessment can assist policy developers and risk managers in reaching a more informed risk management decision about available management options. b. Because of the limitations and assumptions inherent in risk assessment, this assessment must not be used as an absolute determination of the probability of health effects from the possible exposures at the site. The risk evaluation was focused on estimating potential environmental exposures and may not represent an actual exposure or risk at the site. This assessment should only be used to assist in making decisions regarding health concerns of personnel who were present at Balad Air Base during the use of the burn pits for 12 months, 4 months, or 1 month. The uncertainties and limitations of the HRA used in the evaluation are discussed in the next section. c. According to guidelines provided by the U.S. EPA, non-cancer health hazards are assessed as “acceptable” or “safe” if the hazard index is less than 1.0. Non-cancer (non-carcinogenic) health effects from an exposure are considered to be subject to the “threshold” effect, or the level of exposure below which health effects are not expected. Each chemical has an “acceptable” or “safe” level (such as, a reference dose (RfD) from the U.S. EPA); the actual exposure is compared to this safe level as a ratio. This ratio is the Hazard Quotient (HQ). The sum of all HQs is the Hazard Index (HI). If the sum of the ratios is below 1.0 for all of the COCs, the site is considered safe for non-carcinogenic effects. The detailed explanation of this calculation is in Appendix D. d. For the Balad burn pit air exposures, hazard indices for all populations are below 1.0 and, thus, considered acceptable. None of the chemical exposures for which there are toxicity values, such as an RfD, were above the threshold for health effects. Dioxins do not have a toxicity value and are evaluated separately in Section 10 and Appendix H. e. Cancer risks are calculated differently and are considered non-threshold. Theoretically, one molecule of chemical could change a cell and cause cancer, but the risk/probability would be infinitesimally small. Each additional dose of a chemical is considered to add an additional amount of risk. As a result, it is assumed that the risk rises as the dose increases in a linear manner. The detailed explanation of this evaluation is in Appendix D. f. Humans have a probability of cancer of some type in their lifetimes of one in two or three, for all the “usual” reasons, known or unknown (such as, genetics or lifestyle). This would be the equivalent of 3,333 or 5,000 in 10,000. The U.S. EPA has provided guidelines that if a “calculated” cancer risk using U.S. EPA methodology is in the range of 1E-4 (1 in 10,000) to 1E-6 (one in one million) or even lower due to exposure to a specific cause like the burn pit, this is considered “acceptable” or “safe;” no action needs to be taken to limit exposure or remediate.
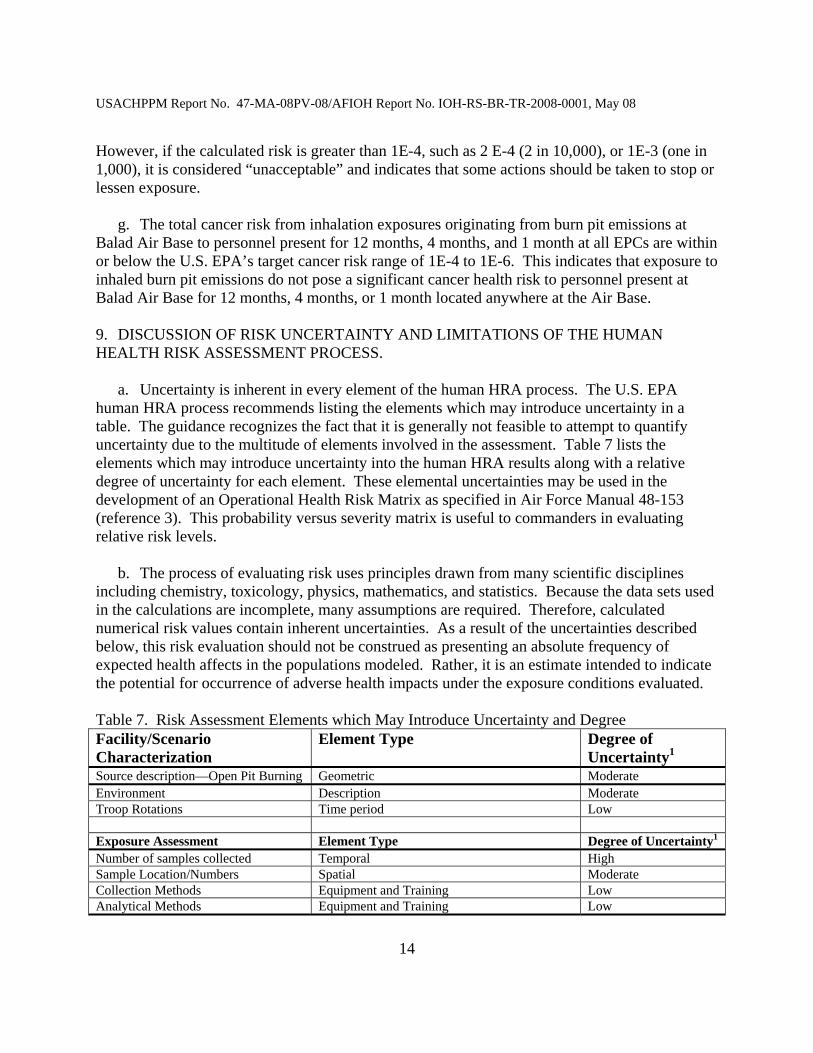
USACHPPM Report No. 47-MA-08PV-08/AFIOH Report No. IOH-RS-BR-TR-2008-0001, May 08
14
However, if the calculated risk is greater than 1E-4, such as 2 E-4 (2 in 10,000), or 1E-3 (one in 1,000), it is considered “unacceptable” and indicates that some actions should be taken to stop or lessen exposure. g. The total cancer risk from inhalation exposures originating from burn pit emissions at Balad Air Base to personnel present for 12 months, 4 months, and 1 month at all EPCs are within or below the U.S. EPA’s target cancer risk range of 1E-4 to 1E-6. This indicates that exposure to inhaled burn pit emissions do not pose a significant cancer health risk to personnel present at Balad Air Base for 12 months, 4 months, or 1 month located anywhere at the Air Base. 9. DISCUSSION OF RISK UNCERTAINTY AND LIMITATIONS OF THE HUMAN HEALTH RISK ASSESSMENT PROCESS. a. Uncertainty is inherent in every element of the human HRA process. The U.S. EPA human HRA process recommends listing the elements which may introduce uncertainty in a table. The guidance recognizes the fact that it is generally not feasible to attempt to quantify uncertainty due to the multitude of elements involved in the assessment. Table 7 lists the elements which may introduce uncertainty into the human HRA results along with a relative degree of uncertainty for each element. These elemental uncertainties may be used in the development of an Operational Health Risk Matrix as specified in Air Force Manual 48-153 (reference 3). This probability versus severity matrix is useful to commanders in evaluating relative risk levels. b. The process of evaluating risk uses principles drawn from many scientific disciplines including chemistry, toxicology, physics, mathematics, and statistics. Because the data sets used in the calculations are incomplete, many assumptions are required. Therefore, calculated numerical risk values contain inherent uncertainties. As a result of the uncertainties described below, this risk evaluation should not be construed as presenting an absolute frequency of expected health affects in the populations modeled. Rather, it is an estimate intended to indicate the potential for occurrence of adverse health impacts under the exposure conditions evaluated. Table 7. Risk Assessment Elements which May Introduce Uncertainty and Degree Facility/Scenario Characterization
Element Type Degree of Uncertainty1
Source description—Open Pit Burning Geometric Moderate Environment Description Moderate Troop Rotations Time period Low Exposure Assessment Element Type Degree of Uncertainty1 Number of samples collected Temporal High Sample Location/Numbers Spatial Moderate Collection Methods Equipment and Training Low Analytical Methods Equipment and Training Low
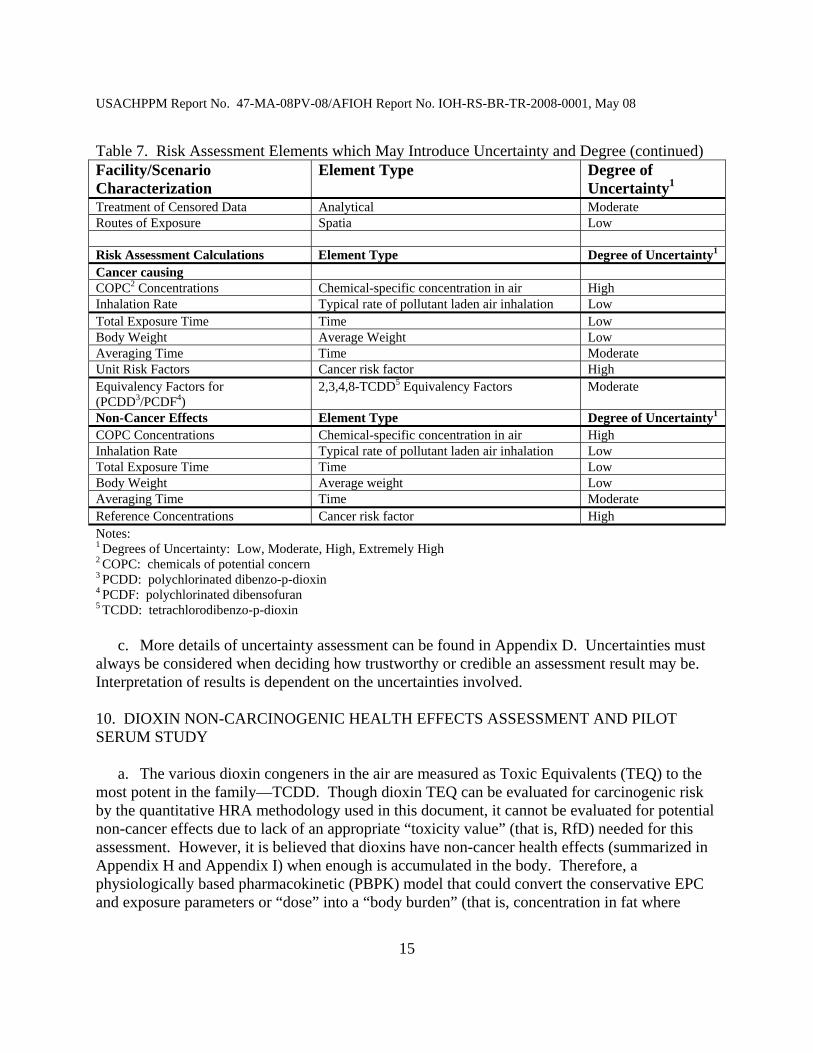
USACHPPM Report No. 47-MA-08PV-08/AFIOH Report No. IOH-RS-BR-TR-2008-0001, May 08
15
Table 7. Risk Assessment Elements which May Introduce Uncertainty and Degree (continued) Facility/Scenario Characterization
Element Type Degree of Uncertainty1
Treatment of Censored Data Analytical Moderate Routes of Exposure Spatia Low Risk Assessment Calculations Element Type Degree of Uncertainty1 Cancer causing COPC2 Concentrations Chemical-specific concentration in air High Inhalation Rate Typical rate of pollutant laden air inhalation Low Total Exposure Time Time Low Body Weight Average Weight Low Averaging Time Time Moderate Unit Risk Factors Cancer risk factor High Equivalency Factors for (PCDD3/PCDF4)
2,3,4,8-TCDD5 Equivalency Factors Moderate
Non-Cancer Effects Element Type Degree of Uncertainty1 COPC Concentrations Chemical-specific concentration in air High Inhalation Rate Typical rate of pollutant laden air inhalation Low Total Exposure Time Time Low Body Weight Average weight Low Averaging Time Time Moderate Reference Concentrations Cancer risk factor High Notes: 1 Degrees of Uncertainty: Low, Moderate, High, Extremely High 2 COPC: chemicals of potential concern 3 PCDD: polychlorinated dibenzo-p-dioxin 4 PCDF: polychlorinated dibensofuran 5 TCDD: tetrachlorodibenzo-p-dioxin c. More details of uncertainty assessment can be found in Appendix D. Uncertainties must always be considered when deciding how trustworthy or credible an assessment result may be. Interpretation of results is dependent on the uncertainties involved. 10. DIOXIN NON-CARCINOGENIC HEALTH EFFECTS ASSESSMENT AND PILOT SERUM STUDY a. The various dioxin congeners in the air are measured as Toxic Equivalents (TEQ) to the most potent in the family—TCDD. Though dioxin TEQ can be evaluated for carcinogenic risk by the quantitative HRA methodology used in this document, it cannot be evaluated for potential non-cancer effects due to lack of an appropriate “toxicity value” (that is, RfD) needed for this assessment. However, it is believed that dioxins have non-cancer health effects (summarized in Appendix H and Appendix I) when enough is accumulated in the body. Therefore, a physiologically based pharmacokinetic (PBPK) model that could convert the conservative EPC and exposure parameters or “dose” into a “body burden” (that is, concentration in fat where
USACHPPM Report No. 47-MA-08PV-08/AFIOH Report No. IOH-RS-BR-TR-2008-0001, May 08
16
dioxin gravitates in the body) was used to estimate the impact on body burden of spending a year at Balad with 24-hour a day exposure. b. A U.S. EPA contact (M. Lorber, reference 4) supplied a PBPK model, which was utilized in the World Trade Center (WTC) U.S. EPA assessment. This was in the form of a Microsoft® Excel® spreadsheet. The more conservative exposure parameters for the inhalation route of exposure used in this document (as compared to the WTC assessment), and the EPC of the dioxin TEQ in air used in this document were applied. The outcome showed an incremental increase of dioxin in fat, after 1 year of exposure, of 1 picogram per gram (pg/g) (equivalent to parts per trillion (ppt)) fat. This is minimal and not expected to impact health. Background levels in the United States tend to be around 10–20 pg/g fat. (Microsoft® and Excel® are registered trademarks of the Microsoft Corporation, Inc.) c. A pilot serum study was done to determine actual serum fat levels of dioxin in Soldiers who have been to Balad. The sera from 25 Soldiers stationed at Balad for 1 year at the time of the air sampling (and who had been previously stationed there on another tour of duty) were randomly selected, de-identified, and obtained from the Department of Defense Serum Repository (DoDSR). Their before and after deployment sera were tested at the laboratory at Centers for Disease Control and Prevention (CDC), National Center for Environmental Health (NCEH). See Appendix H for full details. The results of the study appear to show no significant impact within the constraints of the detection limits (as described in H-2.a.-c.) on the dioxin body-burden levels after 1 year of deployment to Balad. This is consistent with the calculations of the dioxin TEQ EPC. 11. SUMMARY AND CONCLUSIONS. a. Acute Risk. (1) Other than acute (short-term onset) respiratory irritation, no other types of illness would be expected as a result of exposure to emissions from the burn pit at Balad Air Base. Though DNBI rates are highly uncertain, it does not appear that Balad has a different rate of respiratory diagnoses than other USCENTCOM sites when DNBI rates were compared. Respiratory diagnoses are more of a concern from high particulate levels, and all sites could potentially be affected by high particulate levels common in USCENTCOM area of operation. The MEGs were only consistently exceeded for particulate concentrations. (2) Although the particulate matter was consistently detected above its 1-year MEG in the samples evaluated, the levels were consistent with the high levels all over USCENTCOM. Therefore, it is not clear how much of an impact the burn pit has had on the concentrations. b. Chronic Hazards/Risks. For non-carcinogenic effects, the total hazard indices of all receptors from inhalation exposures to burn pit emissions at Balad Air Base are below the unit 1.0 for all EPCs. Dioxins are calculated to have minimal impact on body burden and non-cancer
USACHPPM Report No. 47-MA-08PV-08/AFIOH Report No. IOH-RS-BR-TR-2008-0001, May 08
17
health effects. For carcinogenic effects, the cumulative carcinogenic risk levels of all receptors from inhalation exposures to burn pit emissions at Balad Air Base are within or below the U.S. EPA’s target cancer risk range of 1E-4 to 1E-6. These results indicate that exposure to inhaled burn pit emissions do not pose unacceptable non-carcinogenic or carcinogenic health threats to personnel located anywhere at the site. 12. RECOMMENDATIONS. a. Engineering Controls to Reduce or Eliminate the Open Burning of Plastic Materials. The main source of ambient levels of dioxins and furans is low temperature burning plastic materials, especially in the presence of metal catalysts. These conditions typify open pit burning operations. Operational and environmental conditions, as well as resource availability, will dictate specific solutions; however, a few of the options that should be considered include— (1) Elimination/Source Reduction. Reduced plastic consumption will reduce the amount of plastic waste generated and, consequently, the amount of plastic burned. Examples include the use of metal utensils in lieu of plastic utensils in dining facility operations. (2) Recycling. Plastic materials can be recycled into virgin product. This requires segregation and, in some cases, the shredding of material to ease transportation requirements. (3) Incineration. When plastics are burned at higher temperatures, decreased amounts of dioxins and furans are produced. Use specially designed incinerators to burn municipal waste. By using incinerators especially designed to control combustion temperatures and supplies of oxygen, ambient air pollutant levels can generally be reduced if not eliminated. Depending on the design of the incinerator, scrubbers, electrostatic precipitators, or other pollution control devices may be installed to reduce or eliminate specific air pollutants. (4) Landfill. In some cases, land filling certain toxic materials may be less risky than open burning. For example, lead acid batteries may be drained of acids and temporarily stored until removal rather than incinerated in the burn pit, which could spread toxic lead across a facility. Other batteries containing various toxic heavy metals and materials (such as, arsenic, cadmium, and lithium) probably should be stored rather than incinerated in the burn pit to prevent human exposures via the inhalation pathway. (5) Burn Pit Siting. When no alternatives are available to open burning trash in the field, choose a site located downwind from receptors for the burn pit. Climatology data may be found using a popular internet search engine or consulting with nearby municipal or international airports. Open burning should not take place for longer than 6 months and during that time alternative plans need to be made for waste disposal. b. Improve Base Camp Planning. During base camp planning, waste generation should be estimated to determine long-term plans for waste disposal. Volume and type of waste should be
USACHPPM Report No. 47-MA-08PV-08/AFIOH Report No. IOH-RS-BR-TR-2008-0001, May 08
18
considered along with sorting needs, space requirements, and personnel availability during the first months of base camp operation. c. Recommended Additional Studies. (1) This phase of air sampling was conducted prior to the incinerators commencing operation at Balad. Additional air sampling should be conducted using the same sampling design now that two incinerators are operating and aiding in the reduction of open pit burning. Reductions in most ambient air pollutants would be expected. Also, depending on the exit velocities of the incinerator’s stack exhaust, pollutants could be forced higher over Balad Air Base, thus, mitigating personnel exposure to the hazards. Samples have been collected using the same sampling strategy during October and November of 2007 after 2 incinerators were commissioned. These results will be interpreted and reported in a supplemental report and further recommendation for monitoring will be made. (2) In addition, other sites using burn pits will be evaluated, and a determination will be made concerning additional sampling at those locations. d. Risk Communication.
(1) Develop a Risk Communication Plan. This should include products, such as fact sheets for Service members and commanders. These should be disseminated to communicate the results of any HRAs and plans for determining the meaning of the results.
(2) Conduct a Policy Review. Recommend Force Health Protection and Readiness
(FHP&R) and the Under Secretary of Defense (Acquisition, Technology, and Logistics (USD (AT&L)) conduct a comprehensive policy review concerning proper use of burn pits and develop new policies to fill any gaps. This should include addressing the appropriate use, placement, operations, and maintenance of burn pits, as well as determining the appropriate types of mission situations in which burn pits should be employed (reference 5).
USACHPPM Report No. 47-MA-08PV-08/AFIOH Report No. IOH-RS-BR-TR-2008-0001, May 08
USACHPPM Report No. 47-MA-08PV-08/AFIOH Report No. IOH-RS-BR-TR-2008-0001, May 08
A–1
APPPENDIX A REFERENCES
1. U.S. EPA. 1999. EPA/625/R-96/010b. Compendium of Methods for the Determination of Toxic Organic and Inorganic Compounds in Ambient Air. U.S. Environmental Protection Agency, Center for Environmental Research Information. (http://www.epa.gov/ttn/amtic/airtox.html) 2. U.S. EPA. 1989. EPA/540/1-89/002, Risk Assessment Guidance for Superfund. Office of Emergency and Remedial Response. 3. U.S. Air Force. Air Force Manual 48-153, Health Risk Assessment, March 28, 2007. (http://www.e-publishing.af.mil/shared/media/epubs/AFMAN48-153.pdf) 4. E-mail, Lorber, M., 6 November 2007, subject: RE: FW: Atsugi Health Study (UNCLASSIFIED). 5. National Research Council. 1989. Improving Risk Communication. Washington, DC: National Academy Press. (http://www.nap.edu/openbook.php?isbn+0309039346) 6. USACHPPM Technical Guide (TG) 251. A Soldier’s Guide to Environmental and Occupational Field Sampling for Military Deployment, August 2001. ((For information e-mail, [email protected]; or http://chppm-www.apgea.army.mil/documents/TG/TECHGUID/TG251.pdf) 7. AFIOH. IOH-RS-BR-SR-2005-0002, Sampling and Analysis Plan for the Collection of Ambient Air Samples at Receptor Locations from Open Pit Burning Operations in the Deployed Environment, January 2005. (http://airforcemedicine.afms.mil/idc/groups/public/documents/afms/ctb_036666.pdf) 8. USACHPPM TG 230, Chemical Exposure Guidelines for Deployed Military Personnel. Version 1.3, May 2003. (http://chppm-www.apgea.army.mil/documents/TG/TECHGUID/TG230.pd) 9. USACHPPM Reference Document (RD) 230, Chemical Exposure Guidelines for Deployed Military Personnel, Version 1.3, A Companion Document to USACHPPM TG 230, Chemical Exposure Guidelines for Deployed Military Personnel, updated May 2003. (http://chppm-www.apgea.army.mil/documents/TG/TECHGUID/RD230.pdf)
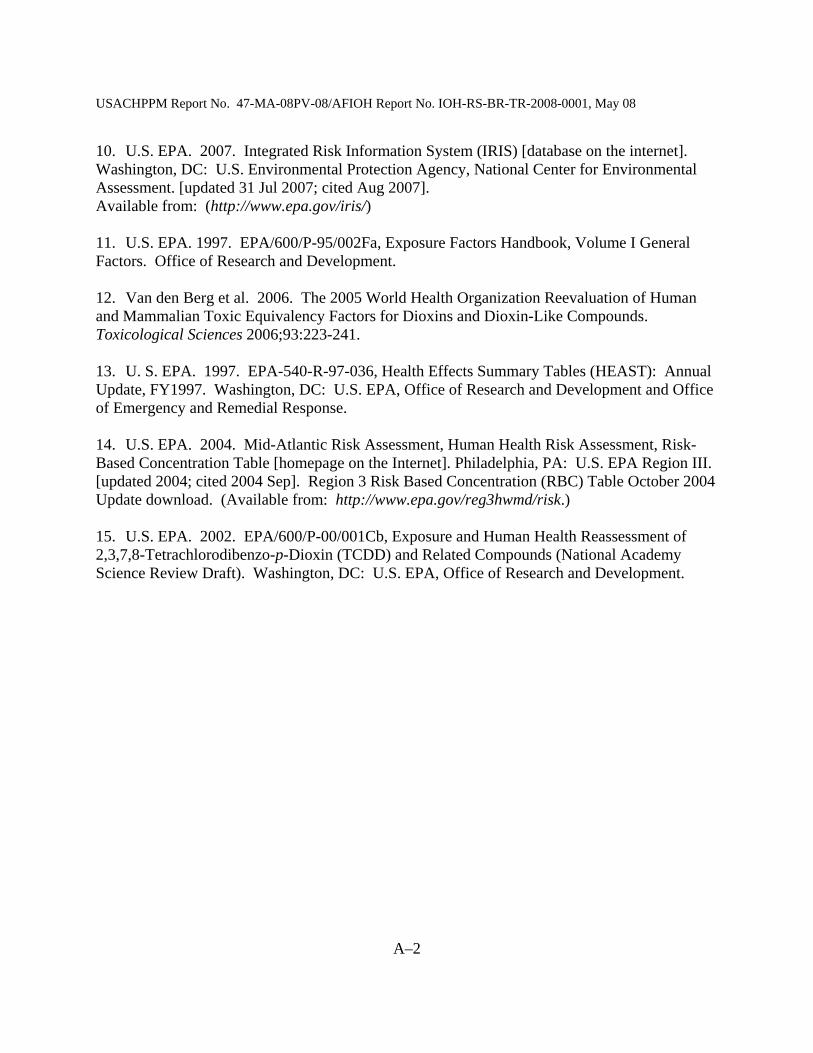
USACHPPM Report No. 47-MA-08PV-08/AFIOH Report No. IOH-RS-BR-TR-2008-0001, May 08
A–2
10. U.S. EPA. 2007. Integrated Risk Information System (IRIS) [database on the internet]. Washington, DC: U.S. Environmental Protection Agency, National Center for Environmental Assessment. [updated 31 Jul 2007; cited Aug 2007]. Available from: (http://www.epa.gov/iris/) 11. U.S. EPA. 1997. EPA/600/P-95/002Fa, Exposure Factors Handbook, Volume I General Factors. Office of Research and Development. 12. Van den Berg et al. 2006. The 2005 World Health Organization Reevaluation of Human and Mammalian Toxic Equivalency Factors for Dioxins and Dioxin-Like Compounds. Toxicological Sciences 2006;93:223-241. 13. U. S. EPA. 1997. EPA-540-R-97-036, Health Effects Summary Tables (HEAST): Annual Update, FY1997. Washington, DC: U.S. EPA, Office of Research and Development and Office of Emergency and Remedial Response. 14. U.S. EPA. 2004. Mid-Atlantic Risk Assessment, Human Health Risk Assessment, Risk-Based Concentration Table [homepage on the Internet]. Philadelphia, PA: U.S. EPA Region III. [updated 2004; cited 2004 Sep]. Region 3 Risk Based Concentration (RBC) Table October 2004 Update download. (Available from: http://www.epa.gov/reg3hwmd/risk.) 15. U.S. EPA. 2002. EPA/600/P-00/001Cb, Exposure and Human Health Reassessment of 2,3,7,8-Tetrachlorodibenzo-p-Dioxin (TCDD) and Related Compounds (National Academy Science Review Draft). Washington, DC: U.S. EPA, Office of Research and Development.

USACHPPM Report No. 47-MA-08PV-08/AFIOH Report No. IOH-RS-BR-TR-2008-0001, May 08
B-1
APPENDIX B AIR SAMPLING METHODOLOGIES
B–1. GENERAL. a. Available guidance documents for the collection of pollutants in the ambient air include the U.S. EPA’s Compendium of Methods for the Determination of Toxic Organic Compounds in Ambient Air (reference 1), the USACHPPM Technical Guide (TG) 251 (reference 6), and the U.S. AFIOH Sampling and Analysis Plan for the Collection of Ambient Air Samples at Receptor Locations from Open Pit Burning Operations in the Deployed Environment (reference 7). All sampling equipment inlets were placed near the breathing zone in order to capture pollutants humans were expected to inhale. Figure B–1 shows the different pieces of equipment used to collect the data at Balad.
Note: MiniVol® is a registered trademark of Airmetrics
Figure B–1. Sampling Equipment Used at Balad Air Base
Portable, gasoline powered generator.
PS-1 exhaust hoses.
Hi-Volume PS-1 Samplers (Methods
TO-9 & TO-13).
Summa Canister (Method TO-14).
Airmetrics MiniVol® and
Calibrator
Approximate site of the burn pit.

USACHPPM Report No. 47-MA-08PV-08/AFIOH Report No. IOH-RS-BR-TR-2008-0001, May 08
B-2
b. Based on predominant WDs and WSs, five locations were selected as ambient air sampling points. Four of the sampling locations were located in the predominant downwind direction from the burn pit and one sampling location was located upwind from the burn pit. (See Figure 2 for ambient air sampling locations.) c. The sampling methodologies used and target compounds collected during the Balad air sampling are discussed in general terms in the following paragraphs: B–2. TO-9A METHOD. a. The TO-9A is the U.S. EPA-approved ambient air sampling and laboratory analysis method for polyhalogenated dibenzo-p-dioxins and dibenzofurans, commonly referred to as “dioxins and furans” (reference 1). The equipment used was high volume PS-1 air samplers (manufactured by Tisch Environmental) with chemical adsorbent polyurethane foam (PUF) plugs and quartz fiber pre-filters as media. This sampler operated by drawing air into a covered housing through a 102 millimeter (mm) quartz fiber filter and then through a PUF-adsorbent cartridge. The filter-trapped particulates and the PUF collected the vapor phase of dioxins and furans that were present in the air. b. Since dioxin and furan compounds may be present in the form of particulate as well as vapor, both the filter and the PUF were combined and analyzed for the target compounds. The concentration of the ambient levels of dioxins and furans was determined by dividing the mass of each compound (from the laboratory) by the volume of air pulled through the cartridge during the sample period (calculated from field data sheets). Total collected sample volumes varied but were generally between the recommended 325 and 400 cubic meters (m3) for a 24-hour sample period. The most significant source of dioxins and furans in the ambient air at Balad was likely due to inefficient combustion of municipal waste containing halogenated compounds (such as, plastics, wood) in the burn pit. c. Dioxins and furans, however, can also be released to the ambient air as a result of burning coal (and other fossil fuels), wood products, or through various industrial chemical processes. Table B–1 lists the dioxins and furan target analytes reported by the analysis laboratory.

USACHPPM Report No. 47-MA-08PV-08/AFIOH Report No. IOH-RS-BR-TR-2008-0001, May 08
B-3
Table B–1. List of Dioxins and Furans Target Analytes Target Analyte CAS No.1
1,2,3,4,6,7,8-HPCDD2 35822469 1,2,3,4,6,7,8-HPCDF 67562394 1,2,3,4,7,8,9-HPCDF 55673897 1,2,3,4,7,8-HXCDD3 39227286 1,2,3,4,7,8-HXCDF 70648269 1,2,3,6,7,8-HXCDD 57653857 1,2,3,6,7,8-HXCDF 57117449 1,2,3,7,8,9-HXCDD 19408743 1,2,3,7,8,9-HXCDF 72918219 1,2,3,7,8-PECDD 40321764 1,2,3,7,8-PECDF 57117416 2,3,4,6,7,8-HXCDF 60851345 2,3,4,7,8-PECDF 57117314 2,3,7,8-TCDD 1746016 2,3,7,8-TCDF 51207319 OCDD4 3268879 OCDF5 39001020
Note: 1 CAS No.: Chemical Abstract Service Number 2 HPCDD: heptachlorodibenzo-p-dioxin 3 HXCDD: hexachlorodibenzo-p-dioxin 4 OCDD: octachlorodibenzodioxin 5 OCDF: octachlorodibenzofuran
d. Equipment calibration of the PS-1 sampler was performed within the guidance provided in the U.S. EPA’s Method TO-9A prior to sampling, the main reference document for TG-251 (reference 6). A laboratory-calibrated orifice transfer standard was used to calibrate the PS-1 magnehelic gauge (not shown in Figure 2) in order to determine sampler flow rates. Flow checks were performed during each sampling event by confirming the magnehelic gauge reading. In addition to flow checks, periodic calibration checks were performed. Flow and calibration checks are designed to ensure accurate flow rates during a sampling event but are not absolutely critical to data quality. e. Prior to sampling, the integrity of PUF sampling cartridges was ensured by cleaning them with solvents and vacuum drying, then wrapping them in aluminum foil, and storing them in separate protective shipping containers. Aluminum foil protects the cartridges from photodecomposition prior to air sampling and prevents loss of collected dioxins and furans post-air sampling. The 102-mm quartz fiber filters were heated to remove VOCs prior to air sampling. After each sampling event, the quartz fiber filters were removed from the sample assembly, folded in half twice, and then placed in the top of the sample cartridges containing the
NOTE: The PS-1 motors will maintain flow rates better when the motor’s internal brushes are replaced, or the motor is replaced altogether after 500 hrs of use.

USACHPPM Report No. 47-MA-08PV-08/AFIOH Report No. IOH-RS-BR-TR-2008-0001, May 08
B-4
PUF media. Sample cartridges were rewrapped in aluminum foil and stored in the same sealed protective shipping container. Samples were stored in a refrigerator until they were shipped to the laboratory. Samples were placed in coolers with ice or ice packs for the return shipment to the analyzing laboratory. The analyzing laboratory received the cartridges well preserved and within holding times and temperatures within 1 to 2 weeks of air sampling. B–3. TO-13A METHOD. a. The TO-13A is the U.S. EPA-approved ambient air sampling and laboratory analysis method for PAHs. The equipment used was high volume PS-1 air samplers manufactured by Tisch Environmental using XAD-2 resin and quartz fiber pre-filters as media. Total collected volumes varied but were in the range of the recommended total volumes of approximately 300 m3. Sources of PAHs in ambient air include fossil fuel combustion in refineries, utilities, motor vehicle exhaust, forest fires, and open burning of trash. The most significant source of PAHs at Balad was likely the open burning of municipal waste at the burn pit. Secondary sources of PAHs included exhaust from motor vehicles and electricity generators. Table B–2 lists the PAHs target analytes reported by the analysis laboratory.
Table B–2. List of PAH Target Analytes Target Analyte CAS No.
Acenaphthene 83329 Acenaphthylene 208968 Anthracene 120127 Benzo(a)anthracene 56553 Benzo(a)pyrene 50328 Benzo(b)fluoroanthene 205992 Benzo(e)pyrene 192972 Benzo(g,h,i)perylene 191242 Benzo(k)fluoroanthene 207089 Chrysene 218019 Dibenz(a,h)anthracene 53703 Fluoranthene 206440 Fluorene 86737 Indeno(1,2,3-cd)pyrene 193395 Naphthalene 91203 Phenanthrene 85018 Pyrene 129000
b. Equipment calibration of the PS-1 sampler was performed within the guidance provided in the U.S. EPA’s Method TO-13A prior to sampling, the main reference document for TG-251. laboratory-calibrated orifice transfer standard was used to calibrate the PS-1 magnehelic gauge (not shown in Figure 2) in order to determine sampler flow rates. Flow checks are generally recommended to be performed during each sampling event by confirming the magnehelic gauge reading but may be subject to equipment access during sampling events. In addition to flow checks, periodic calibration checks are also recommended to be performed subject to equipment

USACHPPM Report No. 47-MA-08PV-08/AFIOH Report No. IOH-RS-BR-TR-2008-0001, May 08
B-5
access. Flow and calibration checks are designed to ensure accurate flow rates during a sampling event but are not absolutely critical to data quality. c. Prior to sampling, XAD-2 resin cartridges were cleaned in solvents and vacuum dried, then wrapped in aluminum foil and stored in separate protective shipping containers. The aluminum foil provided protection from photo-decomposition of the resin and subsequently collected PAHs. The 102-mm quartz fiber filters were heated to remove VOCs prior to use. After each sampling event, the quartz fiber filters were removed from the sampling assembly, folded in half twice, and then placed inside the top of the cartridge with the resin media. Sample cartridges were rewrapped in aluminum foil and stored in the same protective shipping containers. Samples then were stored in a refrigerator until ready for shipping to the analyzing laboratory. When shipping PAH samples to the laboratory, the cartridges should have been inside the protective shipping containers and packed in coolers with ice or ice packs to preserve the collected PAHs. The analyzing laboratory received the cartridges within 2 to 3 weeks of air sampling, depending on available logistics in the field. B–4. TO-14A METHOD. a. The TO-14A is the U.S. EPA-approved ambient air sampling and laboratory analysis method for VOCs. The equipment used was a flow controller and evacuated-6 L stainless steel, spherical cans consisting of a specialized interior coating designed to stabilize VOCs until laboratory analysis. The sampling period and approximate volumes at Balad were 24 hours and 4 to 5 L of air at ambient conditions. Since TO-14A sampling consists of a “whole air sample” and does not consist of a media, per se, precise volumes are not as important as with other sampling methods. The VOCs are common in ambient air, normally at low levels, since their sources are common. Ambient air levels of VOCs tend to be related to petroleum fuel storage and processing, motor vehicle exhaust, industrial processes, combustion sources (such as, utilities, forest, and brush fires), and natural sources. Air emissions of VOCs from the open burning of municipal waste, fuels, and paints in the burn pit were likely significant but not the sole source of ambient levels of VOCs. Table B–3 lists the 77 VOC compounds reported by the analyzing laboratory.
Table B–3. List of VOC Target Analytes Target Analyte CAS No.
1,1,1,2-Tetrachloroethane 630206 1,1,2,2-Tetrachloroethane 79345 1,1,2-Trichloroethane 79005 1,1-Dichloroethane 75343
NOTE: The PS-1 motors will maintain flow rates better when the motor’s internal brushes are replaced, or the motor is replaced altogether after 500 hrs of use.
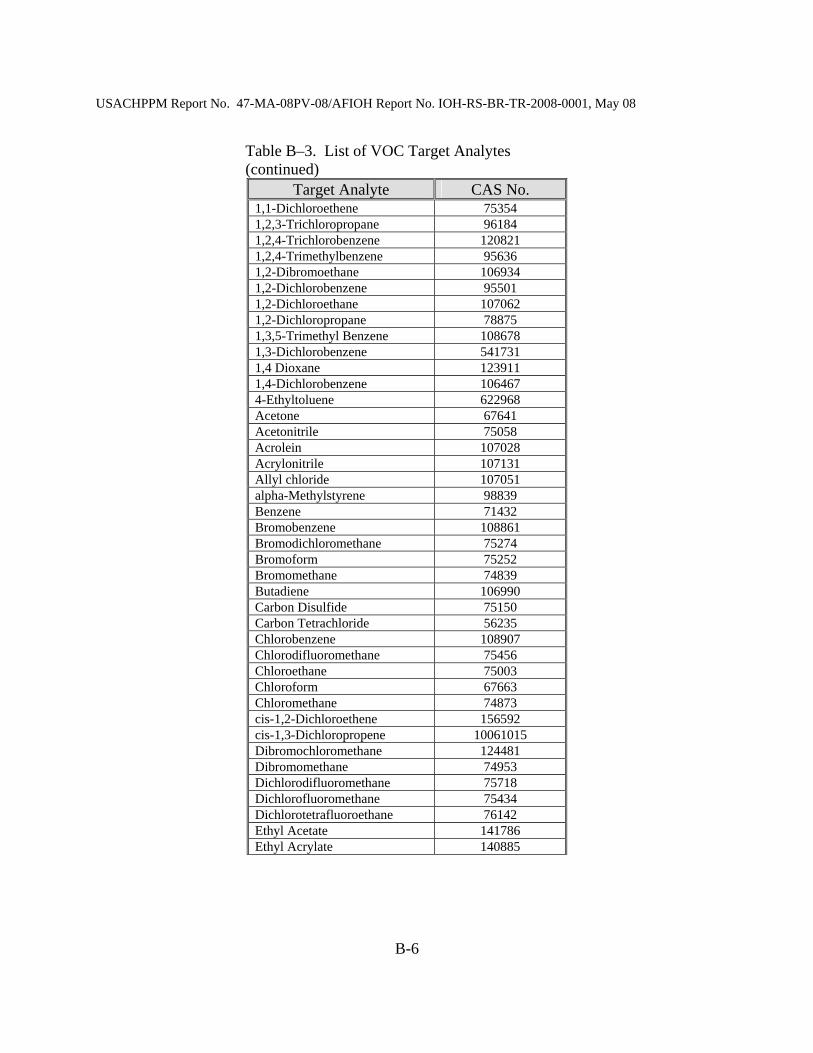
USACHPPM Report No. 47-MA-08PV-08/AFIOH Report No. IOH-RS-BR-TR-2008-0001, May 08
B-6
Table B–3. List of VOC Target Analytes (continued)
Target Analyte CAS No. 1,1-Dichloroethene 75354 1,2,3-Trichloropropane 96184 1,2,4-Trichlorobenzene 120821 1,2,4-Trimethylbenzene 95636 1,2-Dibromoethane 106934 1,2-Dichlorobenzene 95501 1,2-Dichloroethane 107062 1,2-Dichloropropane 78875 1,3,5-Trimethyl Benzene 108678 1,3-Dichlorobenzene 541731 1,4 Dioxane 123911 1,4-Dichlorobenzene 106467 4-Ethyltoluene 622968 Acetone 67641 Acetonitrile 75058 Acrolein 107028 Acrylonitrile 107131 Allyl chloride 107051 alpha-Methylstyrene 98839 Benzene 71432 Bromobenzene 108861 Bromodichloromethane 75274 Bromoform 75252 Bromomethane 74839 Butadiene 106990 Carbon Disulfide 75150 Carbon Tetrachloride 56235 Chlorobenzene 108907 Chlorodifluoromethane 75456 Chloroethane 75003 Chloroform 67663 Chloromethane 74873 cis-1,2-Dichloroethene 156592 cis-1,3-Dichloropropene 10061015 Dibromochloromethane 124481 Dibromomethane 74953 Dichlorodifluoromethane 75718 Dichlorofluoromethane 75434 Dichlorotetrafluoroethane 76142 Ethyl Acetate 141786 Ethyl Acrylate 140885

USACHPPM Report No. 47-MA-08PV-08/AFIOH Report No. IOH-RS-BR-TR-2008-0001, May 08
B-7
Table B–3. List of VOC Target Analytes (continued)
Target Analyte CAS No. Ethyl methacrylate 97632 Ethylbenzene 100414 Hexachlorobutadiene 87683 Hexachloroethane 67721 Hexane 110543 Isooctane 540841 Isopropylbenzene 98828 m/p-Xylene 108383;10 Methyl Acrylate 96333 Methyl Chloroform 71556 Methyl Ethyl Ketone 78933 Methyl iodide 74884 Methyl Isobutyl Ketone 108101 Methyl methacrylate 80626 Methylene Chloride 75092 Methyl-tert-butyl-ether 1634044 n-Heptane 142825 Octane 111659 o-Xylene 95476 Pentane 109660 Propylene 115071 Styrene 100425 t-Butyl Alcohol 75650 Tetrachloroethylene 127184 Toluene 108883 trans-1,2-Dichloroethene 156605 trans-1,3-Dichloropropene 10061026 Trichloroethene 79016 Trichlorofluoromethane 75694 Trichlorotrifluoroethane 76131 Vinyl acetate 108054 Vinyl Chloride 75014
b. The flow rates of the controllers were preset at USACHPPM to allow for 24 hours of air sampling. This equated to a flow rate of approximately 4 milliliters per minute (mL/min). It is generally recommended to confirm this flow rate prior to air sampling and adjusting only when necessary. Final vacuum readings of the canister were annotated in the field data sheets and should generally not drop below 4–5 inches of mercury. Canisters reaching atmospheric pressure (0 inches of mercury vacuum) may be tainted, and this must be annotated in the field data sheets. c. Prior to shipping canisters to the field, they are specially cleaned and leak-checked by the analyzing laboratory. Canisters should have been received in the field with vacuum readings around 29–30 inches of mercury vacuum, with the approximate vacuum annotated in the field
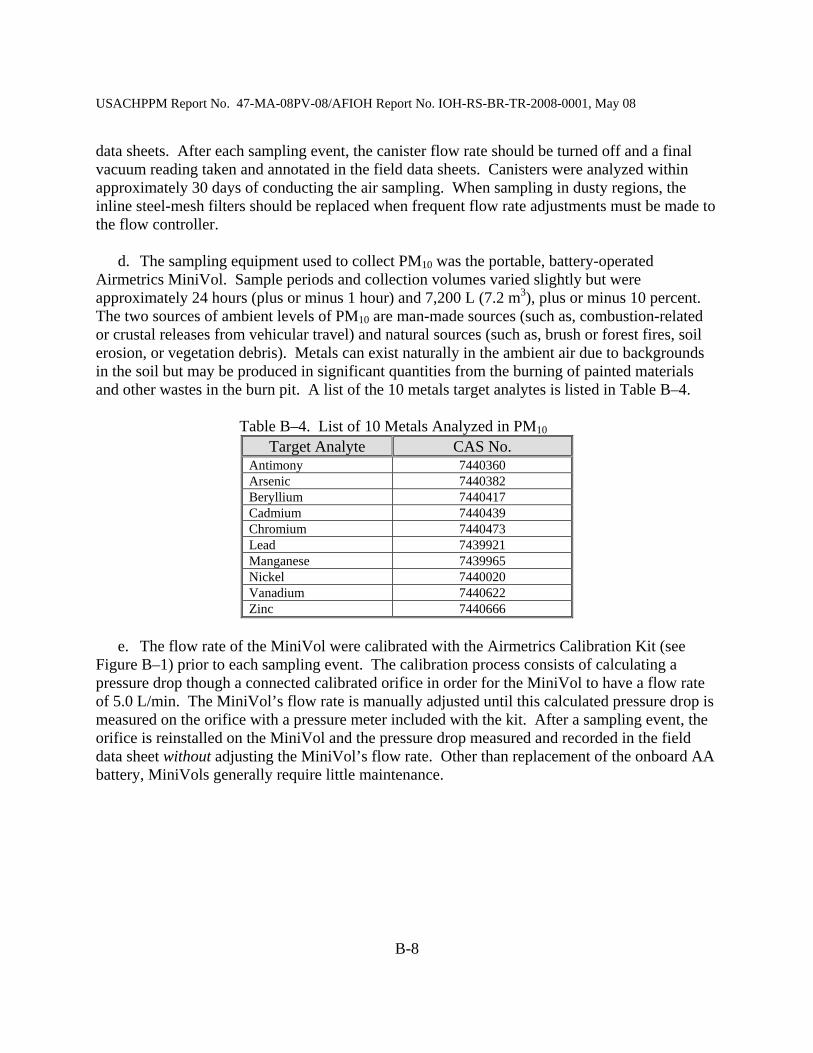
USACHPPM Report No. 47-MA-08PV-08/AFIOH Report No. IOH-RS-BR-TR-2008-0001, May 08
B-8
data sheets. After each sampling event, the canister flow rate should be turned off and a final vacuum reading taken and annotated in the field data sheets. Canisters were analyzed within approximately 30 days of conducting the air sampling. When sampling in dusty regions, the inline steel-mesh filters should be replaced when frequent flow rate adjustments must be made to the flow controller. d. The sampling equipment used to collect PM10 was the portable, battery-operated Airmetrics MiniVol. Sample periods and collection volumes varied slightly but were approximately 24 hours (plus or minus 1 hour) and 7,200 L (7.2 m3), plus or minus 10 percent. The two sources of ambient levels of PM10 are man-made sources (such as, combustion-related or crustal releases from vehicular travel) and natural sources (such as, brush or forest fires, soil erosion, or vegetation debris). Metals can exist naturally in the ambient air due to backgrounds in the soil but may be produced in significant quantities from the burning of painted materials and other wastes in the burn pit. A list of the 10 metals target analytes is listed in Table B–4.
Table B–4. List of 10 Metals Analyzed in PM10 Target Analyte CAS No.
Antimony 7440360 Arsenic 7440382 Beryllium 7440417 Cadmium 7440439 Chromium 7440473 Lead 7439921 Manganese 7439965 Nickel 7440020 Vanadium 7440622 Zinc 7440666
e. The flow rate of the MiniVol were calibrated with the Airmetrics Calibration Kit (see Figure B–1) prior to each sampling event. The calibration process consists of calculating a pressure drop though a connected calibrated orifice in order for the MiniVol to have a flow rate of 5.0 L/min. The MiniVol’s flow rate is manually adjusted until this calculated pressure drop is measured on the orifice with a pressure meter included with the kit. After a sampling event, the orifice is reinstalled on the MiniVol and the pressure drop measured and recorded in the field data sheet without adjusting the MiniVol’s flow rate. Other than replacement of the onboard AA battery, MiniVols generally require little maintenance.
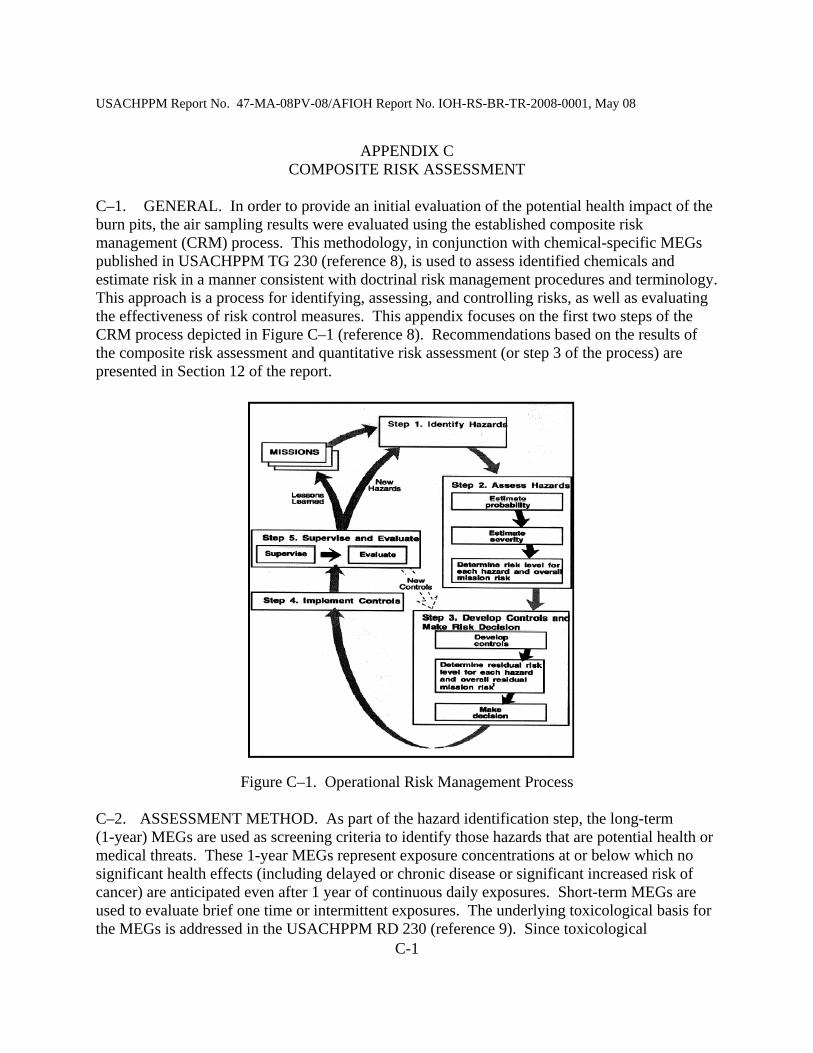
USACHPPM Report No. 47-MA-08PV-08/AFIOH Report No. IOH-RS-BR-TR-2008-0001, May 08
C-1
APPENDIX C COMPOSITE RISK ASSESSMENT
C–1. GENERAL. In order to provide an initial evaluation of the potential health impact of the burn pits, the air sampling results were evaluated using the established composite risk management (CRM) process. This methodology, in conjunction with chemical-specific MEGs published in USACHPPM TG 230 (reference 8), is used to assess identified chemicals and estimate risk in a manner consistent with doctrinal risk management procedures and terminology. This approach is a process for identifying, assessing, and controlling risks, as well as evaluating the effectiveness of risk control measures. This appendix focuses on the first two steps of the CRM process depicted in Figure C–1 (reference 8). Recommendations based on the results of the composite risk assessment and quantitative risk assessment (or step 3 of the process) are presented in Section 12 of the report.
Figure C–1. Operational Risk Management Process
C–2. ASSESSMENT METHOD. As part of the hazard identification step, the long-term (1-year) MEGs are used as screening criteria to identify those hazards that are potential health or medical threats. These 1-year MEGs represent exposure concentrations at or below which no significant health effects (including delayed or chronic disease or significant increased risk of cancer) are anticipated even after 1 year of continuous daily exposures. Short-term MEGs are used to evaluate brief one time or intermittent exposures. The underlying toxicological basis for the MEGs is addressed in the USACHPPM RD 230 (reference 9). Since toxicological

USACHPPM Report No. 47-MA-08PV-08/AFIOH Report No. IOH-RS-BR-TR-2008-0001, May 08
C-2
information about potential health effects varies among different chemicals, the determination of severity of effects when MEGs are exceeded involves professional judgment. Hazards with exposure concentrations greater than MEGs are identified as potential health threats, carried through the hazard assessment process, and assigned a risk estimate consistent with CRM methodology. Hazards that are either not detected or are present only at levels below the 1-year MEGs are not considered health threats and, therefore, are automatically assigned a low operational risk estimate. It should be noted that this methodology does not account for additive effects of multiple chemicals.
C–3. HAZARD IDENTIFICATION. a. As discussed above, the first step in the CRM process involves identifying potential hazards that need to be evaluated further in the hazard assessment. Potential chemical hazards can be associated with different media and exposure routes. For Balad Air Base, exposures may have occurred via inhalation of airborne chemicals released from combustion of solid wastes at the burn pit. b. Identification of potential hazards began with the collection of chemical information through field sampling. Ambient air samples collected at Balad Air Base were analyzed by the USACHPPM laboratory for dioxins and furans using the U.S. EPA-approved TO-9 Method; PAHs using U.S. EPA-approved TO-13 Method; and VOCs using U.S. EPA-approved TO-14 Method. Although samples were collected for PM or 10 micrometers or less, (PM10 or less), PM10 was not included in the hazard assessment because it is being addressed in other studies. None of the substances exceeding the 1-year MEGs were identified with greater than a 5 percent frequency of detection; therefore, no hazards were identified. C–4. RISK ESTIMATE AND CONFIDENCE. a. The OEH risk estimate for exposure to all substances sampled for in the ambient air at Balad Air Base is low. Acrolein and hexachlorobutadiene were detected above the 1-year MEGs. However, it is expected that acrolein and hexachlorobutadiene levels are not consistently above the MEG for 1 year. According to TG 230, Table 3–5 (reference 8), confidence in the risk estimate at this location is considered low because it is unclear if the samples represent conditions to which personnel are typically exposed for the deployment duration. b. In general, the confidence level in risk estimates is usually low to medium due to consistent lack of specific exposure information associated with troop movement and activity patterns; other routes/sources of potential OEH hazards not identified; and uncertainty regarding impacts of multiple chemicals present, particularly those affecting the same body organs/systems.

USACHPPM Report No. 47-MA-08PV-08/AFIOH Report No. IOH-RS-BR-TR-2008-0001, May 08
D–1
APPENDIX D QUANTITATIVE RISK ASSESSMENT
D–1. INTRODUCTION. a. The health threat from a site can be estimated through the use of risk assessment techniques. These estimates are useful in supporting whether health effects could be anticipated from the evaluated use of the site. Such calculations have also proved valuable in developing and supporting planning decisions about the need for remedial actions on sites thought or known to be affected by activities involving chemical releases. b. This appendix presents a quantitative screening risk assessment performed for evaluating the health implications of on-site military personnel at the Balad Air Base in Iraq from exposure to burn pit emissions. The risk assessment is limited to these receptors because they represent a range of exposed individuals based on their duration of assignment at Balad Air Base. This quantitative approach provides an understanding of the potential health threats that may be posed by being stationed at the site during the use of burn pits, and risk estimates could be extrapolated for personnel residing at Balad Air Base for different durations. c. This quantitative risk assessment will follow the same methods used for conducting a quantitative baseline risk assessments as outlined by the U.S. EPA’s Risk Assessment Guidance for Superfund (reference 2). d. The following three points about a risk assessment should be emphasized: (1) First, an estimate of carcinogenic risk or non-carcinogenic hazard is dependent upon the assumptions and numerical values used in the risk characterization, toxicity evaluation, and exposure assessment components. Risk assessment estimates should not be taken as absolute measures of an individual’s probability of an adverse health effect. Rather, the estimates should be viewed as a threshold of concern for the receptor populations. Since most exposure parameters incorporate methods designed to yield a high-end estimate plus some degree of safety factor, the estimate of risk most likely represents an overestimate. (2) Second, these estimates do not indicate that an adverse outcome actually will occur; they only indicate the likelihood or probability that such outcomes might occur under very specific exposure conditions. However, the flexibility to adjust exposure assumptions and values allows risk managers to analyze a number of different exposure conditions and reach a more informed decision than if a risk assessment was not conducted. (3) Third, a comprehensive risk assessment is only one of several tools that can provide useful information for risk management decisions. Results of a risk assessment only contribute to a final risk management solution; they are not the final solution. When all uncertainties
USACHPPM Report No. 47-MA-08PV-08/AFIOH Report No. IOH-RS-BR-TR-2008-0001, May 08
D–2
associated with the assumptions and exposure values are identified, however, a comprehensive risk assessment can assist policy developers and risk managers in reaching a more informed risk management decision about available management options. D–2. METHODOLOGY AND ORGANIZATION OF DOCUMENT. The methodology employed for the quantitative risk assessment follows U.S. EPA guidance. Four steps in the risk assessment process are outlined below. These steps are discussed in more detail in Sections D–3 through D–6. a. Selection of Chemicals of Concern (Section D–3). This section summarizes how samples were evaluated and discusses the reasons for eliminating chemicals from further evaluation in the risk assessment. b. Exposure Assessment (Section D–4). For human exposure to occur, a pathway must be complete. This includes: (1) a source, a transport media (such as, air); (2) an exposure point (such as, location); (3) and an exposure route (such as, inhalation). This section includes derivation and presentation of the exposures expected at the site and used in the human HRA. Examples of scenarios which may be active on this site include personnel present at the site for 12 months, 4 months, and 1 month. Chemical intake values are calculated based on exposure pathways, specific exposure values, and assumptions. Equations used to calculate intakes for all applicable exposure pathways are presented in this section. c. Toxicity Assessment (Section D–5). This section presents the toxicity values used in the human health risk calculations. Reference to the appropriate data sources, such as the Integrated Risk Information System (reference 10), is provided to support the toxicity values. d. Risk Characterization (Section D–6). This section presents the risk calculations for all complete human health exposure pathways. Non-carcinogenic and carcinogenic risk estimates are summarized for each receptor and exposure pathway. In all scenarios, the calculated risk values apply to a hypothetical individual on the site and represents an upper-bound (reasonable maximum) risk estimate. Thus, the calculated risk is not directly applicable to actual individuals working on the site. All of the exposure assumptions have been chosen to protect the maximum, reasonably exposed individual. This provides a conservative estimate of risk, which tends to overestimate the maximum risk to any actual individual.
D–3. SELECTION OF CHEMICALS OF POTENTIAL CONCERN. a. For this study, a sampling scheme was developed which involved sampling air concentrations near the Balad Air Base burn pits for a large suite of contaminants at five sample locations. Ambient air samples were collected via U.S. EPA methodology guidance and using Hi-Volume PS-1 Samplers, Airmetrics MiniVols, and Summa Canisters (see Appendix B for more detail). Since the amount and type of material that was disposed of in the burn pits is not well controlled or characterized, a broad list of analytes was included in the sampling effort. Air

USACHPPM Report No. 47-MA-08PV-08/AFIOH Report No. IOH-RS-BR-TR-2008-0001, May 08
D–3
samples were analyzed for dioxins and furans using the U.S. EPA-approved TO-9A Method; PAHs using the U.S. EPA-approved TO-13A Method; VOCs using the U.S. EPA-approved TO-14A Method; and metals and particulate matter with an aerodynamic diameter of 10 micrometers and less (PM10). Appendix C extrapolates on the methodology which was used to collect and analyze the air samples at Balad Air Base. b. A large number of these analytes were detected in one or more samples. To reduce the list of compounds to a manageable number, those with a frequency of detection of less than 5 percent were eliminated from further consideration. Table D–1 summarizes the analyzed chemicals, their frequency of detection and whether they were further evaluated. Table D–1. COPCs Frequency of Detection Chemical Sampling
MethodologyNumber
of Samples
Detection Frequency
Notes
1,2,3,4,6,7,8-HPCDD TO-9A 39 97.44% Evaluated as a COPC 1,2,3,4,6,7,8-HPCDF TO-9A 39 100.0% Evaluated as a COPC 1,2,3,4,7,8,9-HPCDF TO-9A 39 84.62% Evaluated as a COPC 1,2,3,4,7,8-HXCDD TO-9A 39 84.62% Evaluated as a COPC 1,2,3,4,7,8-HXCDF TO-9A 39 100.0% Evaluated as a COPC 1,2,3,6,7,8-HXCDD TO-9A 39 89.74% Evaluated as a COPC 1,2,3,6,7,8-HXCDF TO-9A 39 97.44% Evaluated as a COPC 1,2,3,7,8,9-HXCDD TO-9A 39 87.18% Evaluated as a COPC 1,2,3,7,8,9-HXCDF TO-9A 39 15.38% Evaluated as a COPC 1,2,3,7,8-PECDD TO-9A 39 84.62% Evaluated as a COPC 1,2,3,7,8-PECDF TO-9A 39 94.87% Evaluated as a COPC 2,3,4,6,7,8-HXCDF TO-9A 39 97.44% Evaluated as a COPC 2,3,4,7,8-PECDF TO-9A 39 97.44% Evaluated as a COPC 2,3,7,8-TCDD TO-9A 39 61.54% Evaluated as a COPC 2,3,7,8-TCDF TO-9A 39 100.0% Evaluated as a COPC OCDD TO-9A 39 100.0% Evaluated as a COPC OCDF TO-9A 39 100.0% Evaluated as a COPC Particulate PM-10 60 100.0% Not evaluated further a Acenaphthene TO-13A 32 96.88% Evaluated as a COPC Acenaphthylene TO-13A 32 96.88% Evaluated as a COPC Anthracene TO-13A 32 96.88% Evaluated as a COPC Benzo(a)anthracene TO-13A 32 93.75% Evaluated as a COPC Benzo(a)pyrene TO-13A 32 87.5% Evaluated as a COPC Benzo(b)fluoroanthene TO-13A 32 93.75% Evaluated as a COPC Benzo(e)pyrene TO-13A 32 93.75% Evaluated as a COPC Benzo(g,h,i)perylene TO-13A 32 93.75% Evaluated as a COPC
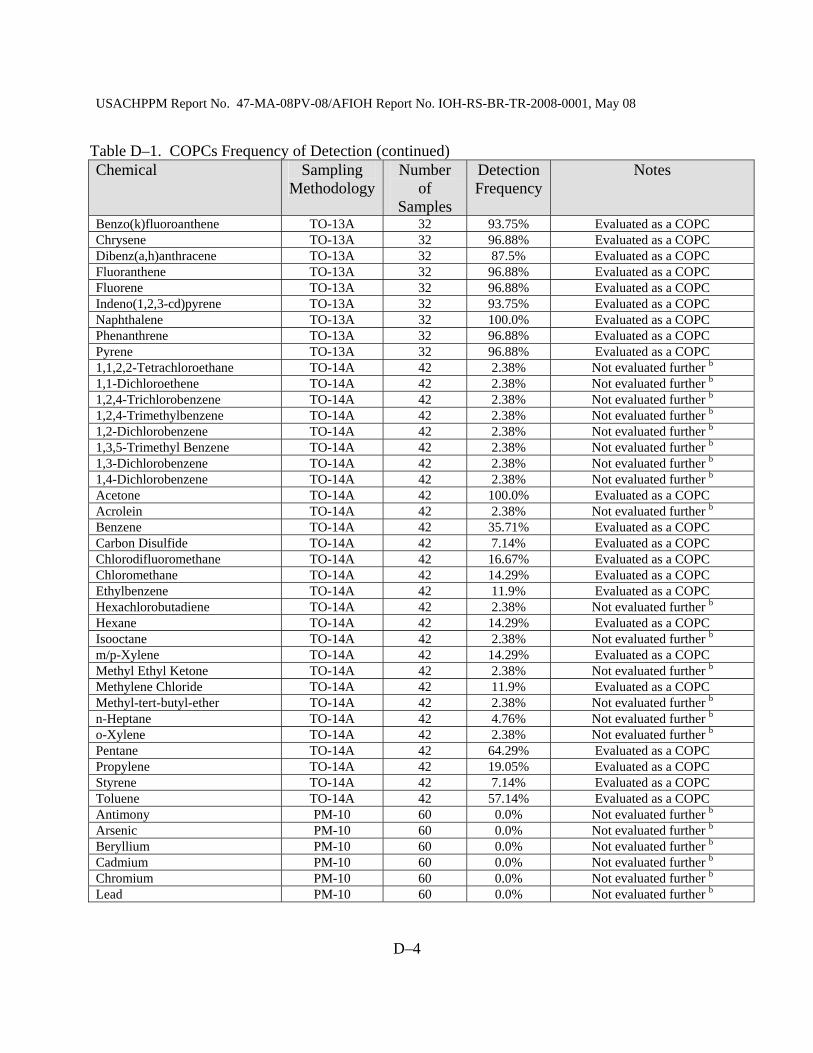
USACHPPM Report No. 47-MA-08PV-08/AFIOH Report No. IOH-RS-BR-TR-2008-0001, May 08
D–4
Table D–1. COPCs Frequency of Detection (continued) Chemical Sampling
MethodologyNumber
of Samples
Detection Frequency
Notes
Benzo(k)fluoroanthene TO-13A 32 93.75% Evaluated as a COPC Chrysene TO-13A 32 96.88% Evaluated as a COPC Dibenz(a,h)anthracene TO-13A 32 87.5% Evaluated as a COPC Fluoranthene TO-13A 32 96.88% Evaluated as a COPC Fluorene TO-13A 32 96.88% Evaluated as a COPC Indeno(1,2,3-cd)pyrene TO-13A 32 93.75% Evaluated as a COPC Naphthalene TO-13A 32 100.0% Evaluated as a COPC Phenanthrene TO-13A 32 96.88% Evaluated as a COPC Pyrene TO-13A 32 96.88% Evaluated as a COPC 1,1,2,2-Tetrachloroethane TO-14A 42 2.38% Not evaluated further b 1,1-Dichloroethene TO-14A 42 2.38% Not evaluated further b 1,2,4-Trichlorobenzene TO-14A 42 2.38% Not evaluated further b 1,2,4-Trimethylbenzene TO-14A 42 2.38% Not evaluated further b 1,2-Dichlorobenzene TO-14A 42 2.38% Not evaluated further b 1,3,5-Trimethyl Benzene TO-14A 42 2.38% Not evaluated further b 1,3-Dichlorobenzene TO-14A 42 2.38% Not evaluated further b 1,4-Dichlorobenzene TO-14A 42 2.38% Not evaluated further b Acetone TO-14A 42 100.0% Evaluated as a COPC Acrolein TO-14A 42 2.38% Not evaluated further b Benzene TO-14A 42 35.71% Evaluated as a COPC Carbon Disulfide TO-14A 42 7.14% Evaluated as a COPC Chlorodifluoromethane TO-14A 42 16.67% Evaluated as a COPC Chloromethane TO-14A 42 14.29% Evaluated as a COPC Ethylbenzene TO-14A 42 11.9% Evaluated as a COPC Hexachlorobutadiene TO-14A 42 2.38% Not evaluated further b Hexane TO-14A 42 14.29% Evaluated as a COPC Isooctane TO-14A 42 2.38% Not evaluated further b m/p-Xylene TO-14A 42 14.29% Evaluated as a COPC Methyl Ethyl Ketone TO-14A 42 2.38% Not evaluated further b Methylene Chloride TO-14A 42 11.9% Evaluated as a COPC Methyl-tert-butyl-ether TO-14A 42 2.38% Not evaluated further b n-Heptane TO-14A 42 4.76% Not evaluated further b o-Xylene TO-14A 42 2.38% Not evaluated further b Pentane TO-14A 42 64.29% Evaluated as a COPC Propylene TO-14A 42 19.05% Evaluated as a COPC Styrene TO-14A 42 7.14% Evaluated as a COPC Toluene TO-14A 42 57.14% Evaluated as a COPC Antimony PM-10 60 0.0% Not evaluated further b Arsenic PM-10 60 0.0% Not evaluated further b Beryllium PM-10 60 0.0% Not evaluated further b Cadmium PM-10 60 0.0% Not evaluated further b Chromium PM-10 60 0.0% Not evaluated further b Lead PM-10 60 0.0% Not evaluated further b
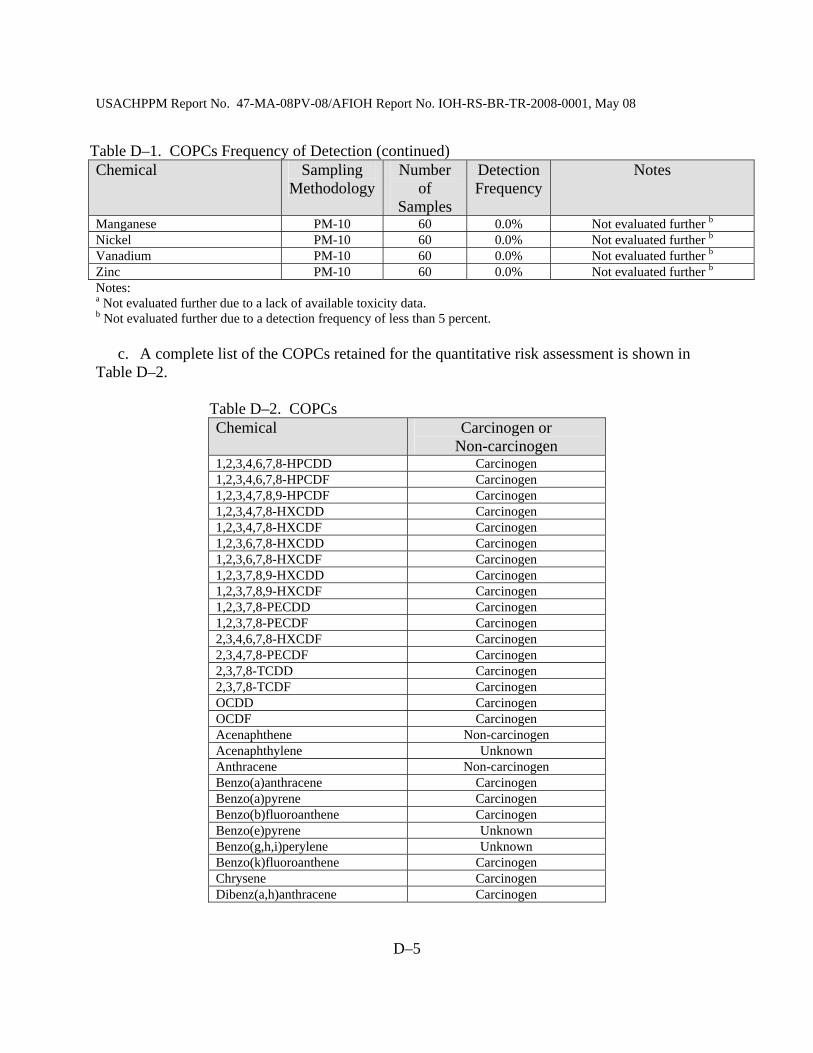
USACHPPM Report No. 47-MA-08PV-08/AFIOH Report No. IOH-RS-BR-TR-2008-0001, May 08
D–5
Table D–1. COPCs Frequency of Detection (continued) Chemical Sampling
MethodologyNumber
of Samples
Detection Frequency
Notes
Manganese PM-10 60 0.0% Not evaluated further b Nickel PM-10 60 0.0% Not evaluated further b Vanadium PM-10 60 0.0% Not evaluated further b Zinc PM-10 60 0.0% Not evaluated further b Notes: a Not evaluated further due to a lack of available toxicity data. b Not evaluated further due to a detection frequency of less than 5 percent. c. A complete list of the COPCs retained for the quantitative risk assessment is shown in Table D–2.
Table D–2. COPCs Chemical Carcinogen or
Non-carcinogen 1,2,3,4,6,7,8-HPCDD Carcinogen 1,2,3,4,6,7,8-HPCDF Carcinogen 1,2,3,4,7,8,9-HPCDF Carcinogen 1,2,3,4,7,8-HXCDD Carcinogen 1,2,3,4,7,8-HXCDF Carcinogen 1,2,3,6,7,8-HXCDD Carcinogen 1,2,3,6,7,8-HXCDF Carcinogen 1,2,3,7,8,9-HXCDD Carcinogen 1,2,3,7,8,9-HXCDF Carcinogen 1,2,3,7,8-PECDD Carcinogen 1,2,3,7,8-PECDF Carcinogen 2,3,4,6,7,8-HXCDF Carcinogen 2,3,4,7,8-PECDF Carcinogen 2,3,7,8-TCDD Carcinogen 2,3,7,8-TCDF Carcinogen OCDD Carcinogen OCDF Carcinogen Acenaphthene Non-carcinogen Acenaphthylene Unknown Anthracene Non-carcinogen Benzo(a)anthracene Carcinogen Benzo(a)pyrene Carcinogen Benzo(b)fluoroanthene Carcinogen Benzo(e)pyrene Unknown Benzo(g,h,i)perylene Unknown Benzo(k)fluoroanthene Carcinogen Chrysene Carcinogen Dibenz(a,h)anthracene Carcinogen
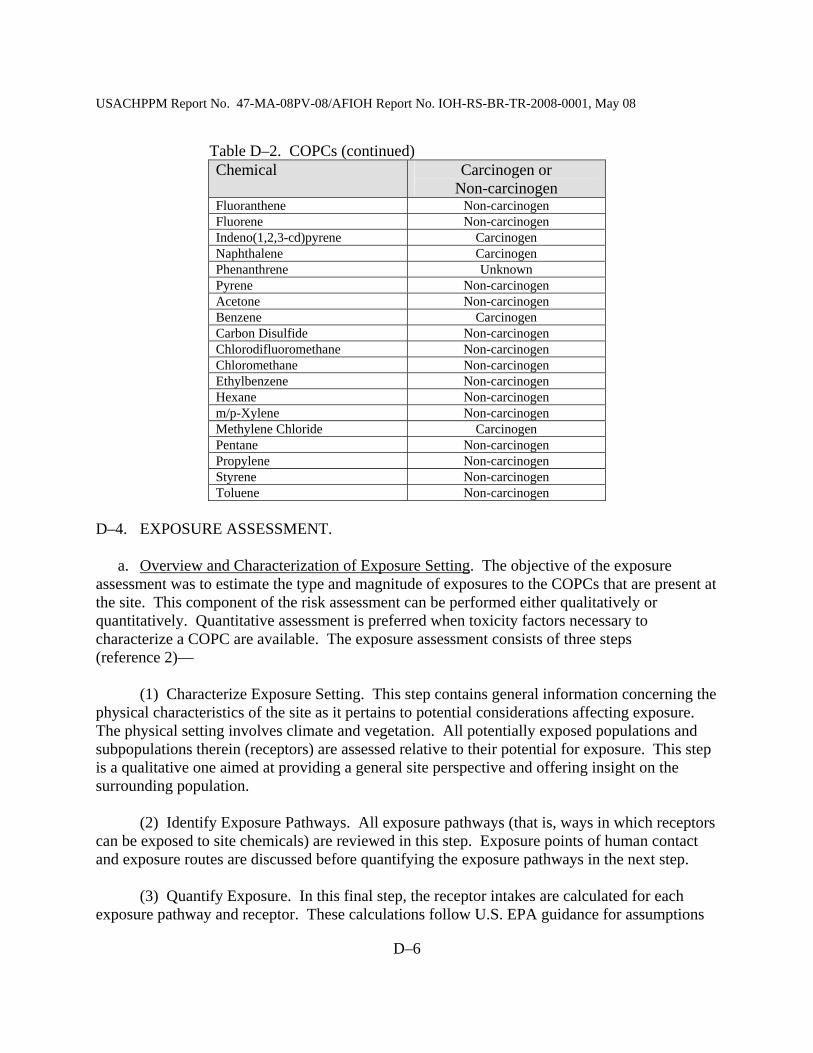
USACHPPM Report No. 47-MA-08PV-08/AFIOH Report No. IOH-RS-BR-TR-2008-0001, May 08
D–6
Table D–2. COPCs (continued) Chemical Carcinogen or
Non-carcinogen Fluoranthene Non-carcinogen Fluorene Non-carcinogen Indeno(1,2,3-cd)pyrene Carcinogen Naphthalene Carcinogen Phenanthrene Unknown Pyrene Non-carcinogen Acetone Non-carcinogen Benzene Carcinogen Carbon Disulfide Non-carcinogen Chlorodifluoromethane Non-carcinogen Chloromethane Non-carcinogen Ethylbenzene Non-carcinogen Hexane Non-carcinogen m/p-Xylene Non-carcinogen Methylene Chloride Carcinogen Pentane Non-carcinogen Propylene Non-carcinogen Styrene Non-carcinogen Toluene Non-carcinogen
D–4. EXPOSURE ASSESSMENT. a. Overview and Characterization of Exposure Setting. The objective of the exposure assessment was to estimate the type and magnitude of exposures to the COPCs that are present at the site. This component of the risk assessment can be performed either qualitatively or quantitatively. Quantitative assessment is preferred when toxicity factors necessary to characterize a COPC are available. The exposure assessment consists of three steps (reference 2)— (1) Characterize Exposure Setting. This step contains general information concerning the physical characteristics of the site as it pertains to potential considerations affecting exposure. The physical setting involves climate and vegetation. All potentially exposed populations and subpopulations therein (receptors) are assessed relative to their potential for exposure. This step is a qualitative one aimed at providing a general site perspective and offering insight on the surrounding population. (2) Identify Exposure Pathways. All exposure pathways (that is, ways in which receptors can be exposed to site chemicals) are reviewed in this step. Exposure points of human contact and exposure routes are discussed before quantifying the exposure pathways in the next step. (3) Quantify Exposure. In this final step, the receptor intakes are calculated for each exposure pathway and receptor. These calculations follow U.S. EPA guidance for assumptions
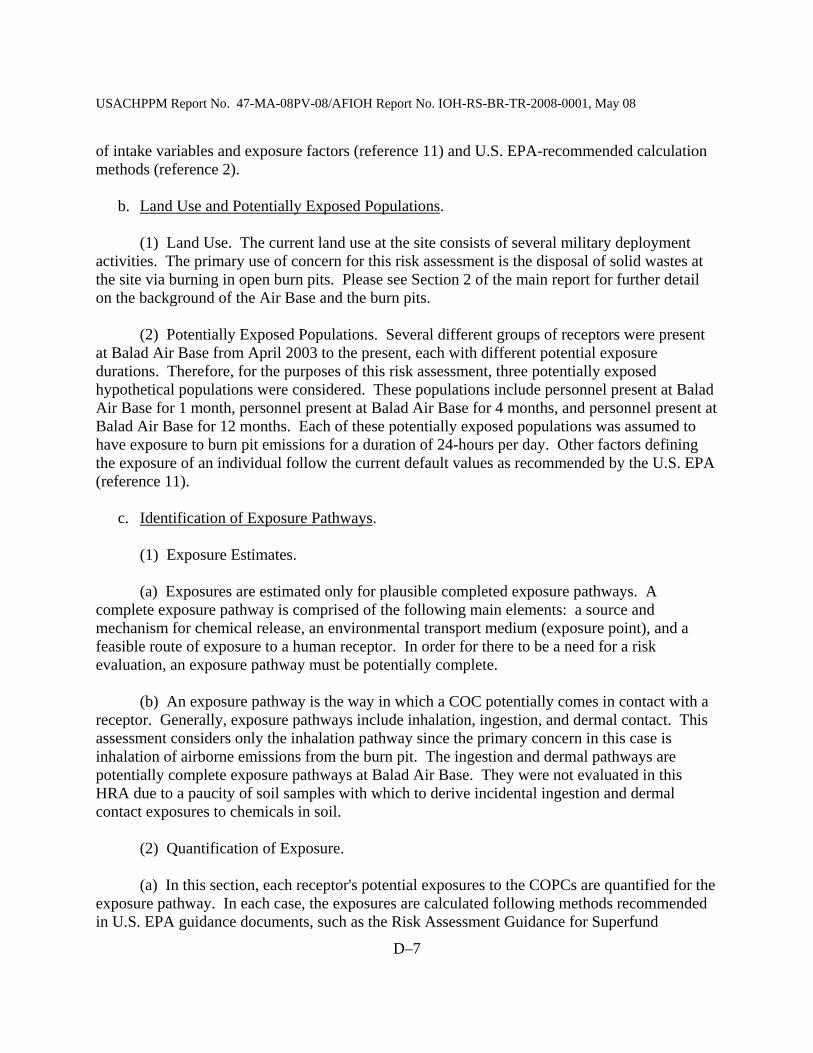
USACHPPM Report No. 47-MA-08PV-08/AFIOH Report No. IOH-RS-BR-TR-2008-0001, May 08
D–7
of intake variables and exposure factors (reference 11) and U.S. EPA-recommended calculation methods (reference 2). b. Land Use and Potentially Exposed Populations. (1) Land Use. The current land use at the site consists of several military deployment activities. The primary use of concern for this risk assessment is the disposal of solid wastes at the site via burning in open burn pits. Please see Section 2 of the main report for further detail on the background of the Air Base and the burn pits. (2) Potentially Exposed Populations. Several different groups of receptors were present at Balad Air Base from April 2003 to the present, each with different potential exposure durations. Therefore, for the purposes of this risk assessment, three potentially exposed hypothetical populations were considered. These populations include personnel present at Balad Air Base for 1 month, personnel present at Balad Air Base for 4 months, and personnel present at Balad Air Base for 12 months. Each of these potentially exposed populations was assumed to have exposure to burn pit emissions for a duration of 24-hours per day. Other factors defining the exposure of an individual follow the current default values as recommended by the U.S. EPA (reference 11). c. Identification of Exposure Pathways. (1) Exposure Estimates. (a) Exposures are estimated only for plausible completed exposure pathways. A complete exposure pathway is comprised of the following main elements: a source and mechanism for chemical release, an environmental transport medium (exposure point), and a feasible route of exposure to a human receptor. In order for there to be a need for a risk evaluation, an exposure pathway must be potentially complete. (b) An exposure pathway is the way in which a COC potentially comes in contact with a receptor. Generally, exposure pathways include inhalation, ingestion, and dermal contact. This assessment considers only the inhalation pathway since the primary concern in this case is inhalation of airborne emissions from the burn pit. The ingestion and dermal pathways are potentially complete exposure pathways at Balad Air Base. They were not evaluated in this HRA due to a paucity of soil samples with which to derive incidental ingestion and dermal contact exposures to chemicals in soil. (2) Quantification of Exposure. (a) In this section, each receptor's potential exposures to the COPCs are quantified for the exposure pathway. In each case, the exposures are calculated following methods recommended in U.S. EPA guidance documents, such as the Risk Assessment Guidance for Superfund
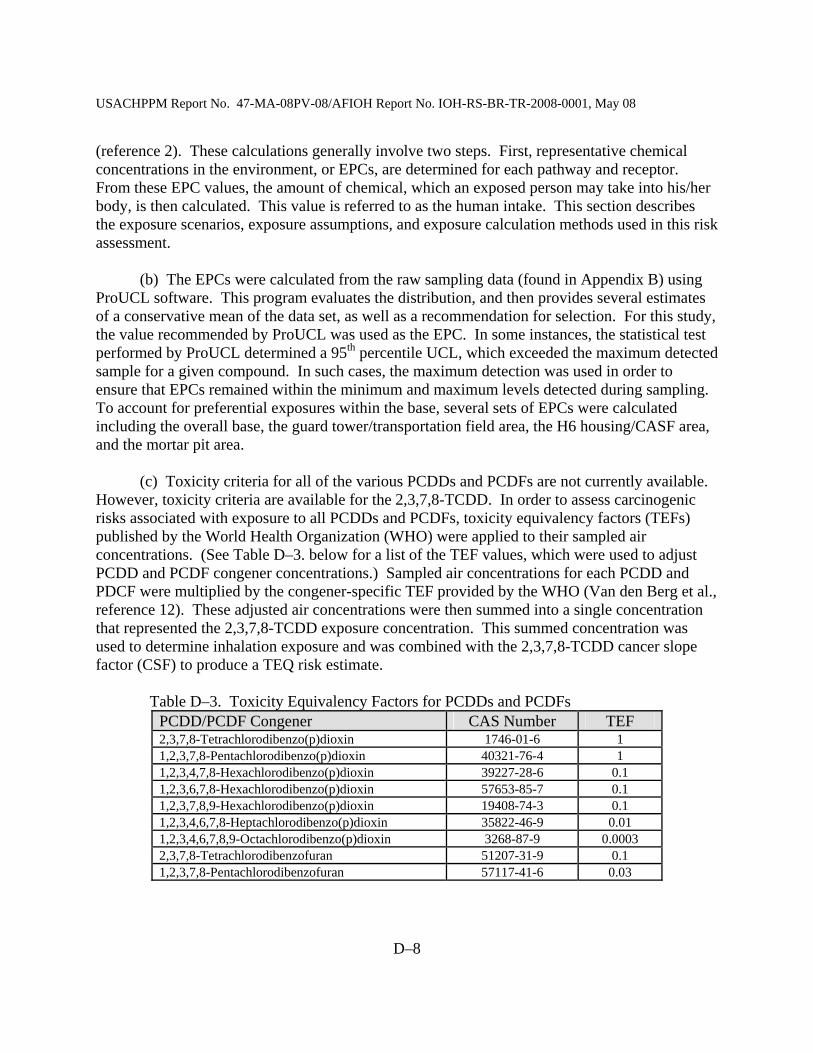
USACHPPM Report No. 47-MA-08PV-08/AFIOH Report No. IOH-RS-BR-TR-2008-0001, May 08
D–8
(reference 2). These calculations generally involve two steps. First, representative chemical concentrations in the environment, or EPCs, are determined for each pathway and receptor. From these EPC values, the amount of chemical, which an exposed person may take into his/her body, is then calculated. This value is referred to as the human intake. This section describes the exposure scenarios, exposure assumptions, and exposure calculation methods used in this risk assessment. (b) The EPCs were calculated from the raw sampling data (found in Appendix B) using ProUCL software. This program evaluates the distribution, and then provides several estimates of a conservative mean of the data set, as well as a recommendation for selection. For this study, the value recommended by ProUCL was used as the EPC. In some instances, the statistical test performed by ProUCL determined a 95th percentile UCL, which exceeded the maximum detected sample for a given compound. In such cases, the maximum detection was used in order to ensure that EPCs remained within the minimum and maximum levels detected during sampling. To account for preferential exposures within the base, several sets of EPCs were calculated including the overall base, the guard tower/transportation field area, the H6 housing/CASF area, and the mortar pit area. (c) Toxicity criteria for all of the various PCDDs and PCDFs are not currently available. However, toxicity criteria are available for the 2,3,7,8-TCDD. In order to assess carcinogenic risks associated with exposure to all PCDDs and PCDFs, toxicity equivalency factors (TEFs) published by the World Health Organization (WHO) were applied to their sampled air concentrations. (See Table D–3. below for a list of the TEF values, which were used to adjust PCDD and PCDF congener concentrations.) Sampled air concentrations for each PCDD and PDCF were multiplied by the congener-specific TEF provided by the WHO (Van den Berg et al., reference 12). These adjusted air concentrations were then summed into a single concentration that represented the 2,3,7,8-TCDD exposure concentration. This summed concentration was used to determine inhalation exposure and was combined with the 2,3,7,8-TCDD cancer slope factor (CSF) to produce a TEQ risk estimate.
Table D–3. Toxicity Equivalency Factors for PCDDs and PCDFs PCDD/PCDF Congener CAS Number TEF 2,3,7,8-Tetrachlorodibenzo(p)dioxin 1746-01-6 1 1,2,3,7,8-Pentachlorodibenzo(p)dioxin 40321-76-4 1 1,2,3,4,7,8-Hexachlorodibenzo(p)dioxin 39227-28-6 0.1 1,2,3,6,7,8-Hexachlorodibenzo(p)dioxin 57653-85-7 0.1 1,2,3,7,8,9-Hexachlorodibenzo(p)dioxin 19408-74-3 0.1 1,2,3,4,6,7,8-Heptachlorodibenzo(p)dioxin 35822-46-9 0.01 1,2,3,4,6,7,8,9-Octachlorodibenzo(p)dioxin 3268-87-9 0.0003 2,3,7,8-Tetrachlorodibenzofuran 51207-31-9 0.1 1,2,3,7,8-Pentachlorodibenzofuran 57117-41-6 0.03
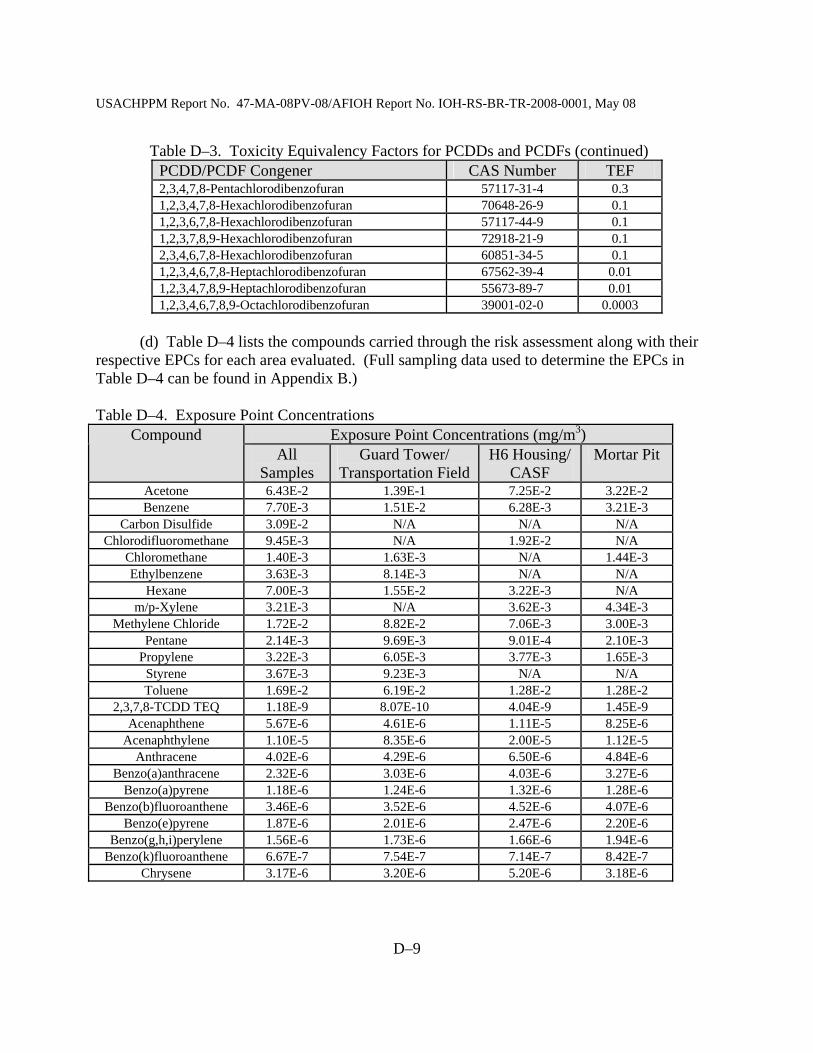
USACHPPM Report No. 47-MA-08PV-08/AFIOH Report No. IOH-RS-BR-TR-2008-0001, May 08
D–9
Table D–3. Toxicity Equivalency Factors for PCDDs and PCDFs (continued) PCDD/PCDF Congener CAS Number TEF 2,3,4,7,8-Pentachlorodibenzofuran 57117-31-4 0.3 1,2,3,4,7,8-Hexachlorodibenzofuran 70648-26-9 0.1 1,2,3,6,7,8-Hexachlorodibenzofuran 57117-44-9 0.1 1,2,3,7,8,9-Hexachlorodibenzofuran 72918-21-9 0.1 2,3,4,6,7,8-Hexachlorodibenzofuran 60851-34-5 0.1 1,2,3,4,6,7,8-Heptachlorodibenzofuran 67562-39-4 0.01 1,2,3,4,7,8,9-Heptachlorodibenzofuran 55673-89-7 0.01 1,2,3,4,6,7,8,9-Octachlorodibenzofuran 39001-02-0 0.0003
(d) Table D–4 lists the compounds carried through the risk assessment along with their respective EPCs for each area evaluated. (Full sampling data used to determine the EPCs in Table D–4 can be found in Appendix B.) Table D–4. Exposure Point Concentrations
Exposure Point Concentrations (mg/m3) Compound All
Samples Guard Tower/
Transportation Field H6 Housing/
CASF Mortar Pit
Acetone 6.43E-2 1.39E-1 7.25E-2 3.22E-2 Benzene 7.70E-3 1.51E-2 6.28E-3 3.21E-3
Carbon Disulfide 3.09E-2 N/A N/A N/A Chlorodifluoromethane 9.45E-3 N/A 1.92E-2 N/A
Chloromethane 1.40E-3 1.63E-3 N/A 1.44E-3 Ethylbenzene 3.63E-3 8.14E-3 N/A N/A
Hexane 7.00E-3 1.55E-2 3.22E-3 N/A m/p-Xylene 3.21E-3 N/A 3.62E-3 4.34E-3
Methylene Chloride 1.72E-2 8.82E-2 7.06E-3 3.00E-3 Pentane 2.14E-3 9.69E-3 9.01E-4 2.10E-3
Propylene 3.22E-3 6.05E-3 3.77E-3 1.65E-3 Styrene 3.67E-3 9.23E-3 N/A N/A Toluene 1.69E-2 6.19E-2 1.28E-2 1.28E-2
2,3,7,8-TCDD TEQ 1.18E-9 8.07E-10 4.04E-9 1.45E-9 Acenaphthene 5.67E-6 4.61E-6 1.11E-5 8.25E-6
Acenaphthylene 1.10E-5 8.35E-6 2.00E-5 1.12E-5 Anthracene 4.02E-6 4.29E-6 6.50E-6 4.84E-6
Benzo(a)anthracene 2.32E-6 3.03E-6 4.03E-6 3.27E-6 Benzo(a)pyrene 1.18E-6 1.24E-6 1.32E-6 1.28E-6
Benzo(b)fluoroanthene 3.46E-6 3.52E-6 4.52E-6 4.07E-6 Benzo(e)pyrene 1.87E-6 2.01E-6 2.47E-6 2.20E-6
Benzo(g,h,i)perylene 1.56E-6 1.73E-6 1.66E-6 1.94E-6 Benzo(k)fluoroanthene 6.67E-7 7.54E-7 7.14E-7 8.42E-7
Chrysene 3.17E-6 3.20E-6 5.20E-6 3.18E-6
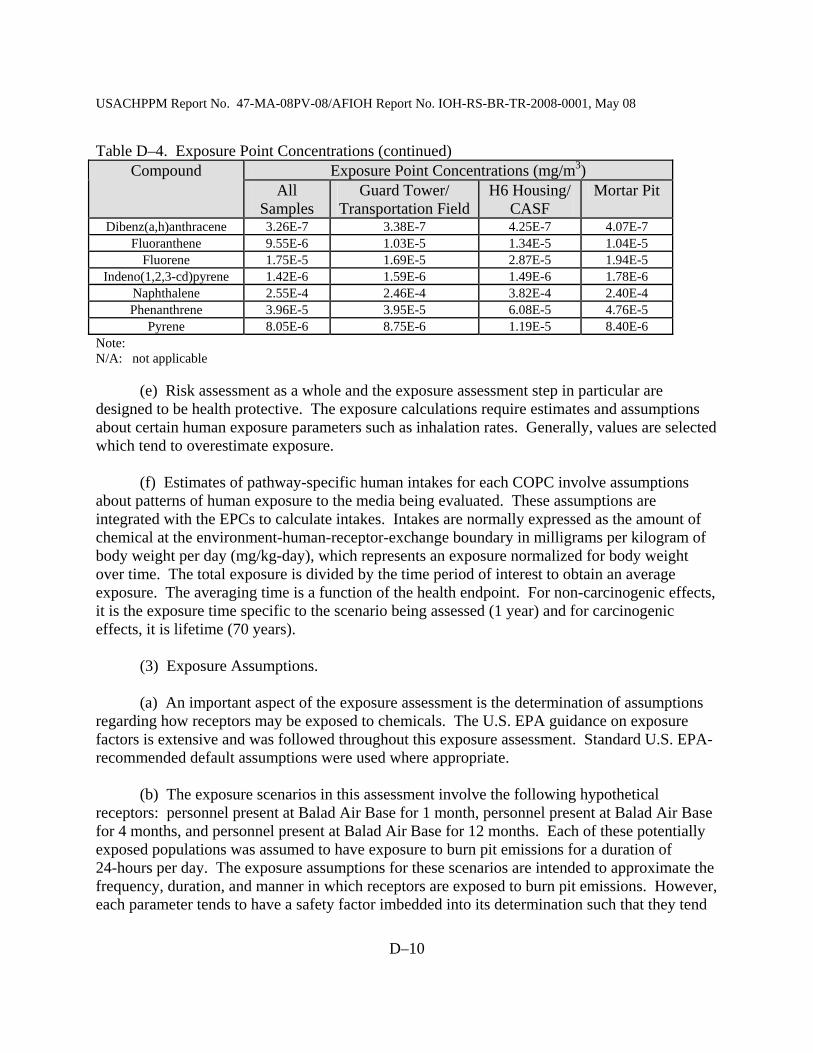
USACHPPM Report No. 47-MA-08PV-08/AFIOH Report No. IOH-RS-BR-TR-2008-0001, May 08
D–10
Table D–4. Exposure Point Concentrations (continued) Exposure Point Concentrations (mg/m3) Compound
All Samples
Guard Tower/ Transportation Field
H6 Housing/ CASF
Mortar Pit
Dibenz(a,h)anthracene 3.26E-7 3.38E-7 4.25E-7 4.07E-7 Fluoranthene 9.55E-6 1.03E-5 1.34E-5 1.04E-5
Fluorene 1.75E-5 1.69E-5 2.87E-5 1.94E-5 Indeno(1,2,3-cd)pyrene 1.42E-6 1.59E-6 1.49E-6 1.78E-6
Naphthalene 2.55E-4 2.46E-4 3.82E-4 2.40E-4 Phenanthrene 3.96E-5 3.95E-5 6.08E-5 4.76E-5
Pyrene 8.05E-6 8.75E-6 1.19E-5 8.40E-6 Note: N/A: not applicable (e) Risk assessment as a whole and the exposure assessment step in particular are designed to be health protective. The exposure calculations require estimates and assumptions about certain human exposure parameters such as inhalation rates. Generally, values are selected which tend to overestimate exposure. (f) Estimates of pathway-specific human intakes for each COPC involve assumptions about patterns of human exposure to the media being evaluated. These assumptions are integrated with the EPCs to calculate intakes. Intakes are normally expressed as the amount of chemical at the environment-human-receptor-exchange boundary in milligrams per kilogram of body weight per day (mg/kg-day), which represents an exposure normalized for body weight over time. The total exposure is divided by the time period of interest to obtain an average exposure. The averaging time is a function of the health endpoint. For non-carcinogenic effects, it is the exposure time specific to the scenario being assessed (1 year) and for carcinogenic effects, it is lifetime (70 years). (3) Exposure Assumptions. (a) An important aspect of the exposure assessment is the determination of assumptions regarding how receptors may be exposed to chemicals. The U.S. EPA guidance on exposure factors is extensive and was followed throughout this exposure assessment. Standard U.S. EPA-recommended default assumptions were used where appropriate. (b) The exposure scenarios in this assessment involve the following hypothetical receptors: personnel present at Balad Air Base for 1 month, personnel present at Balad Air Base for 4 months, and personnel present at Balad Air Base for 12 months. Each of these potentially exposed populations was assumed to have exposure to burn pit emissions for a duration of 24-hours per day. The exposure assumptions for these scenarios are intended to approximate the frequency, duration, and manner in which receptors are exposed to burn pit emissions. However, each parameter tends to have a safety factor imbedded into its determination such that they tend

USACHPPM Report No. 47-MA-08PV-08/AFIOH Report No. IOH-RS-BR-TR-2008-0001, May 08
D–11
to overestimate exposure and, therefore, risk. Details of the exposure assumptions and parameters for each exposure scenario are shown in Table D–5. (4) Exposure Scenarios. To quantitatively assess the potential exposures associated with the evaluated pathway, estimates of chemical concentrations at the exposure point are combined with values describing the extent, frequency, and duration of the exposure to provide an estimate of the daily intake of chemicals. Table D–5 presents the values used for the various intake parameters. These values are based on U.S. EPA-recommended values and are discussed below. Table D–5. Exposure Pathway Assessment Values
Pathway Parameter Value Source
Body Weight 70 kg
U.S. EPA (reference 2)
Exposure Time 24-hours/day Conservative Exposure Estimate
Exposure Frequency 365-days/year 120-days/year 30-days/year
Estimated Exposure Ranges
Exposure Duration 1 year U.S. EPA (reference 2)
Averaging Time (non-carcinogenic) 365 days U.S. EPA
(reference 2)
Averaging Time (carcinogenic) 25550 days U.S. EPA
(reference 2)
Inhalation
Inhalation Rate 0.8 m3/hour U.S. EPA (reference 2)
(a) Body Weight (BW). The U.S. EPA recommends a conservative BW of 70 kilograms (kg) for adult receptors. This represents the mean value for men and women between 19 and 65 years old. (b) Exposure Time (ET). A conservative ET estimate of 24-hours per day will be used. This is an estimated value, which assumes the receptor spends all of its time on the base. This value is intended to be conservative and will tend to overestimate potential risk. (c) Exposure Frequency (EF). The EFs are estimates based on typical deployment and contract durations of personnel at Balad Air Base. These EFs assume that the receptor remains on the base for their entire deployment or contract. (d) Exposure Duration (ED). An ED of 1 year will be used. This number represents the maximum value for a receptor at Balad Air Base.

USACHPPM Report No. 47-MA-08PV-08/AFIOH Report No. IOH-RS-BR-TR-2008-0001, May 08
D–12
(e) Averaging Time (AT). The AT for non-carcinogenic effects is the exposure duration, 365 days (1 year). For carcinogenic effects, an average lifetime of 25,550 days (70 years) is used. (f) Inhalation Rate (IR). The recommended IR for adults is 20 m3/day. This represents an average value for adult males. (g) Inhalation of burn pit emissions. For both carcinogenic and non-carcinogenic effects, intake was calculated using the following equation: Intake (mg/kg-day) = CA * IR * ET * EF * ED BW * AT
Where: CA = Contaminant Concentration in Air (mg/m3) IR = Inhalation Rate (m3/hour) ET = Exposure Time (hours/day) EF = Exposure Frequency (days/year) ED = Exposure Duration (years) BW = Body Weight (kg) AT = Averaging Time (days)
(h) Tables D–6 through D–9 provide the intakes of each COPC due to inhalation for each receptor at each respective exposure point.

USACHPPM Report No. 47-MA-08PV-08/AFIOH Report No. IOH-RS-BR-TR-2008-0001, May 08
D–13
Table D–6. Inhalation Intake (mg/kg-day) for Receptors Located at the EPC Containing All Samples
Receptors Personnel present
for 12 months Personnel present
for 4 months Personnel present
for 1 month Compound NC1
Intake CA2
Intake NC
Intake CA
Intake NC
Intake CA
Intake Acetone 1.76E-2 2.52E-4 5.79E-3 8.28E-5 1.45E-3 2.07E-5 Benzene 2.11E-3 3.02E-5 6.94E-4 9.92E-6 1.74E-4 2.48E-6
Carbon Disulfide 8.47E-3 1.21E-4 2.78E-3 3.98E-5 6.96E-4 9.95E-6 Chloro-
difluoromethane 2.59E-3 3.70E-5 8.52E-4 1.22E-5 2.13E-4 3.04E-6
Chloromethane 3.83E-4 5.47E-6 1.26E-4 1.80E-6 3.15E-5 4.49E-7 Ethylbenzene 9.96E-4 1.42E-5 3.28E-4 4.68E-6 8.19E-5 1.17E-6
Hexane 1.92E-3 2.74E-5 6.31E-4 9.01E-6 1.58E-4 2.25E-6 m/p-Xylene 8.80E-4 1.26E-5 2.89E-4 4.13E-6 7.23E-5 1.03E-6 Methylene Chloride 4.72E-3 6.75E-5 1.55E-3 2.22E-5 3.88E-4 5.55E-6
Pentane 5.88E-4 8.40E-6 1.93E-4 2.76E-6 4.83E-5 6.90E-7 Propylene 8.84E-4 1.26E-5 2.91E-4 4.15E-6 7.27E-5 1.04E-6
Styrene 1.01E-3 1.44E-5 3.31E-4 4.73E-6 8.27E-5 1.18E-6 Toluene 4.64E-3 6.62E-5 1.52E-3 2.18E-5 3.81E-4 5.44E-6
2,3,7,8-TCDD 3.22E-10 4.61E-12 1.06E-10 1.51E-12 2.65E-11 3.79E-13 Acenaphthene 1.56E-6 2.22E-8 5.12E-7 7.31E-9 1.28E-7 1.83E-9
Acenaphthylene 3.01E-6 4.30E-8 9.90E-7 1.41E-8 2.47E-7 3.54E-9 Anthracene 1.10E-6 1.58E-8 3.63E-7 5.18E-9 9.07E-8 1.30E-9 Benzo(a)
anthracene 6.37E-7 9.10E-9 2.09E-7 2.99E-9 5.23E-8 7.48E-10
Benzo(a)pyrene 3.24E-7 4.62E-9 1.06E-7 1.52E-9 2.66E-8 3.80E-10 Benzo(b)
fluoroanthene 9.48E-7 1.35E-8 3.12E-7 4.45E-9 7.79E-8 1.11E-9
Benzo(e)pyrene 5.12E-7 7.32E-9 1.68E-7 2.41E-9 4.21E-8 6.02E-10 Benzo(g,h,i)
perylene 4.27E-7 6.10E-9 1.40E-7 2.01E-9 3.51E-8 5.02E-10
Benzo(k) fluoroanthene 1.83E-7 2.61E-9 6.02E-8 8.59E-10 1.50E-8 2.15E-10
Chrysene 8.69E-7 1.24E-8 2.86E-7 4.08E-9 7.14E-8 1.02E-9 Dibenz(a,h) anthracene 8.94E-8 1.28E-9 2.94E-8 4.20E-10 7.35E-9 1.05E-10
Fluoranthene 2.62E-6 3.74E-8 8.62E-7 1.23E-8 2.15E-7 3.08E-9 Fluorene 4.81E-6 6.86E-8 1.58E-6 2.26E-8 3.95E-7 5.64E-9
Indeno(1,2,3-cd) pyrene 3.90E-7 5.58E-9 1.28E-7 1.83E-9 3.21E-8 4.58E-10
Naphthalene 6.99E-5 9.99E-7 2.30E-5 3.28E-7 5.75E-6 8.21E-8 Phenanthrene 1.09E-5 1.55E-7 3.57E-6 5.10E-8 8.93E-7 1.28E-8
Pyrene 2.21E-6 3.15E-8 7.26E-7 1.04E-8 1.81E-7 2.59E-9 Notes: 1 NC: Non-carcinogenic; 2 CA: Carcinogenic
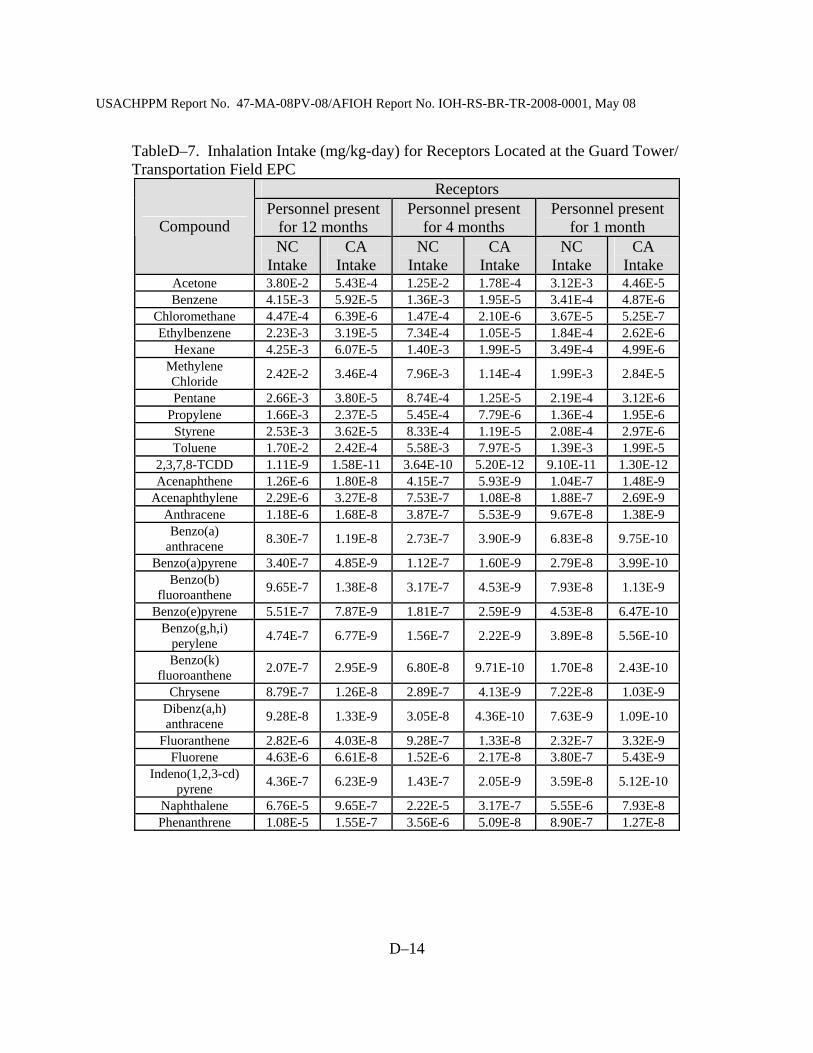
USACHPPM Report No. 47-MA-08PV-08/AFIOH Report No. IOH-RS-BR-TR-2008-0001, May 08
D–14
TableD–7. Inhalation Intake (mg/kg-day) for Receptors Located at the Guard Tower/ Transportation Field EPC
Receptors Personnel present
for 12 months Personnel present
for 4 months Personnel present
for 1 month Compound NC
Intake CA
Intake NC
Intake CA
Intake NC
Intake CA
Intake Acetone 3.80E-2 5.43E-4 1.25E-2 1.78E-4 3.12E-3 4.46E-5 Benzene 4.15E-3 5.92E-5 1.36E-3 1.95E-5 3.41E-4 4.87E-6
Chloromethane 4.47E-4 6.39E-6 1.47E-4 2.10E-6 3.67E-5 5.25E-7 Ethylbenzene 2.23E-3 3.19E-5 7.34E-4 1.05E-5 1.84E-4 2.62E-6
Hexane 4.25E-3 6.07E-5 1.40E-3 1.99E-5 3.49E-4 4.99E-6 Methylene Chloride 2.42E-2 3.46E-4 7.96E-3 1.14E-4 1.99E-3 2.84E-5
Pentane 2.66E-3 3.80E-5 8.74E-4 1.25E-5 2.19E-4 3.12E-6 Propylene 1.66E-3 2.37E-5 5.45E-4 7.79E-6 1.36E-4 1.95E-6
Styrene 2.53E-3 3.62E-5 8.33E-4 1.19E-5 2.08E-4 2.97E-6 Toluene 1.70E-2 2.42E-4 5.58E-3 7.97E-5 1.39E-3 1.99E-5
2,3,7,8-TCDD 1.11E-9 1.58E-11 3.64E-10 5.20E-12 9.10E-11 1.30E-12 Acenaphthene 1.26E-6 1.80E-8 4.15E-7 5.93E-9 1.04E-7 1.48E-9
Acenaphthylene 2.29E-6 3.27E-8 7.53E-7 1.08E-8 1.88E-7 2.69E-9 Anthracene 1.18E-6 1.68E-8 3.87E-7 5.53E-9 9.67E-8 1.38E-9 Benzo(a)
anthracene 8.30E-7 1.19E-8 2.73E-7 3.90E-9 6.83E-8 9.75E-10
Benzo(a)pyrene 3.40E-7 4.85E-9 1.12E-7 1.60E-9 2.79E-8 3.99E-10 Benzo(b)
fluoroanthene 9.65E-7 1.38E-8 3.17E-7 4.53E-9 7.93E-8 1.13E-9
Benzo(e)pyrene 5.51E-7 7.87E-9 1.81E-7 2.59E-9 4.53E-8 6.47E-10 Benzo(g,h,i)
perylene 4.74E-7 6.77E-9 1.56E-7 2.22E-9 3.89E-8 5.56E-10
Benzo(k) fluoroanthene 2.07E-7 2.95E-9 6.80E-8 9.71E-10 1.70E-8 2.43E-10
Chrysene 8.79E-7 1.26E-8 2.89E-7 4.13E-9 7.22E-8 1.03E-9 Dibenz(a,h) anthracene 9.28E-8 1.33E-9 3.05E-8 4.36E-10 7.63E-9 1.09E-10
Fluoranthene 2.82E-6 4.03E-8 9.28E-7 1.33E-8 2.32E-7 3.32E-9 Fluorene 4.63E-6 6.61E-8 1.52E-6 2.17E-8 3.80E-7 5.43E-9
Indeno(1,2,3-cd) pyrene 4.36E-7 6.23E-9 1.43E-7 2.05E-9 3.59E-8 5.12E-10
Naphthalene 6.76E-5 9.65E-7 2.22E-5 3.17E-7 5.55E-6 7.93E-8 Phenanthrene 1.08E-5 1.55E-7 3.56E-6 5.09E-8 8.90E-7 1.27E-8
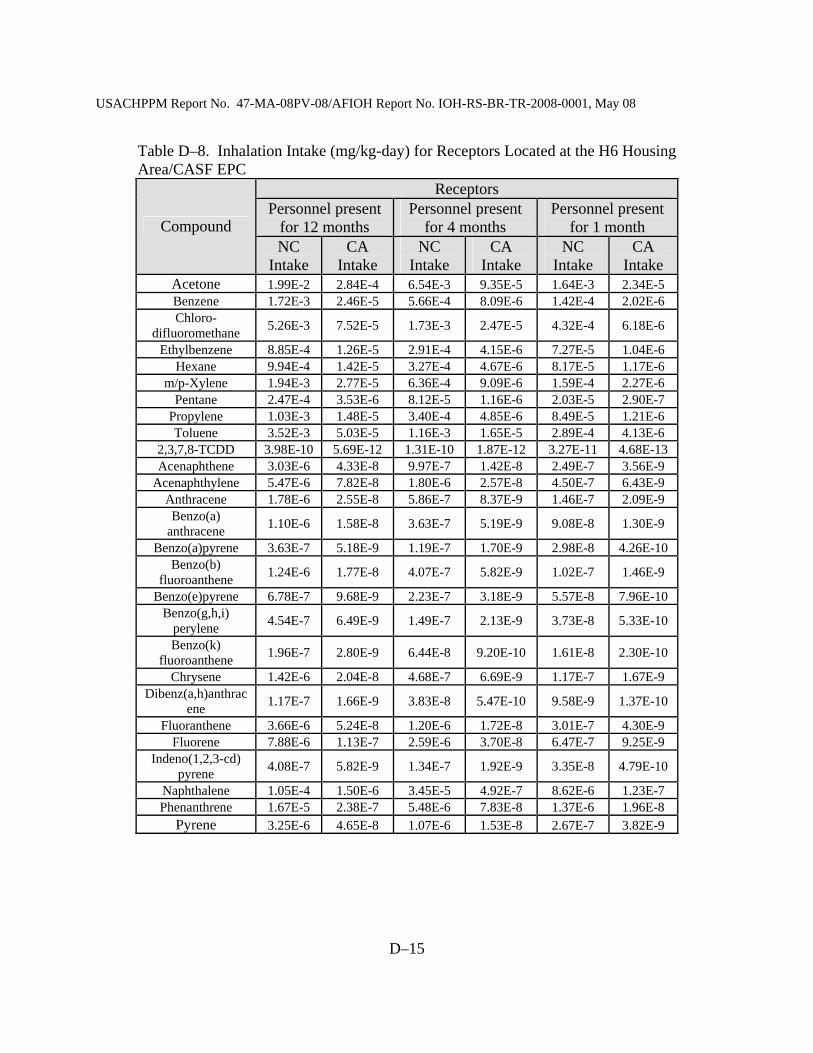
USACHPPM Report No. 47-MA-08PV-08/AFIOH Report No. IOH-RS-BR-TR-2008-0001, May 08
D–15
Table D–8. Inhalation Intake (mg/kg-day) for Receptors Located at the H6 Housing Area/CASF EPC
Receptors Personnel present
for 12 months Personnel present
for 4 months Personnel present
for 1 month Compound NC
Intake CA
Intake NC
Intake CA
Intake NC
Intake CA
Intake Acetone 1.99E-2 2.84E-4 6.54E-3 9.35E-5 1.64E-3 2.34E-5 Benzene 1.72E-3 2.46E-5 5.66E-4 8.09E-6 1.42E-4 2.02E-6 Chloro-
difluoromethane 5.26E-3 7.52E-5 1.73E-3 2.47E-5 4.32E-4 6.18E-6
Ethylbenzene 8.85E-4 1.26E-5 2.91E-4 4.15E-6 7.27E-5 1.04E-6 Hexane 9.94E-4 1.42E-5 3.27E-4 4.67E-6 8.17E-5 1.17E-6
m/p-Xylene 1.94E-3 2.77E-5 6.36E-4 9.09E-6 1.59E-4 2.27E-6 Pentane 2.47E-4 3.53E-6 8.12E-5 1.16E-6 2.03E-5 2.90E-7
Propylene 1.03E-3 1.48E-5 3.40E-4 4.85E-6 8.49E-5 1.21E-6 Toluene 3.52E-3 5.03E-5 1.16E-3 1.65E-5 2.89E-4 4.13E-6
2,3,7,8-TCDD 3.98E-10 5.69E-12 1.31E-10 1.87E-12 3.27E-11 4.68E-13 Acenaphthene 3.03E-6 4.33E-8 9.97E-7 1.42E-8 2.49E-7 3.56E-9
Acenaphthylene 5.47E-6 7.82E-8 1.80E-6 2.57E-8 4.50E-7 6.43E-9 Anthracene 1.78E-6 2.55E-8 5.86E-7 8.37E-9 1.46E-7 2.09E-9 Benzo(a)
anthracene 1.10E-6 1.58E-8 3.63E-7 5.19E-9 9.08E-8 1.30E-9
Benzo(a)pyrene 3.63E-7 5.18E-9 1.19E-7 1.70E-9 2.98E-8 4.26E-10 Benzo(b)
fluoroanthene 1.24E-6 1.77E-8 4.07E-7 5.82E-9 1.02E-7 1.46E-9
Benzo(e)pyrene 6.78E-7 9.68E-9 2.23E-7 3.18E-9 5.57E-8 7.96E-10 Benzo(g,h,i)
perylene 4.54E-7 6.49E-9 1.49E-7 2.13E-9 3.73E-8 5.33E-10
Benzo(k) fluoroanthene 1.96E-7 2.80E-9 6.44E-8 9.20E-10 1.61E-8 2.30E-10
Chrysene 1.42E-6 2.04E-8 4.68E-7 6.69E-9 1.17E-7 1.67E-9 Dibenz(a,h)anthrac
ene 1.17E-7 1.66E-9 3.83E-8 5.47E-10 9.58E-9 1.37E-10
Fluoranthene 3.66E-6 5.24E-8 1.20E-6 1.72E-8 3.01E-7 4.30E-9 Fluorene 7.88E-6 1.13E-7 2.59E-6 3.70E-8 6.47E-7 9.25E-9
Indeno(1,2,3-cd) pyrene 4.08E-7 5.82E-9 1.34E-7 1.92E-9 3.35E-8 4.79E-10
Naphthalene 1.05E-4 1.50E-6 3.45E-5 4.92E-7 8.62E-6 1.23E-7 Phenanthrene 1.67E-5 2.38E-7 5.48E-6 7.83E-8 1.37E-6 1.96E-8
Pyrene 3.25E-6 4.65E-8 1.07E-6 1.53E-8 2.67E-7 3.82E-9
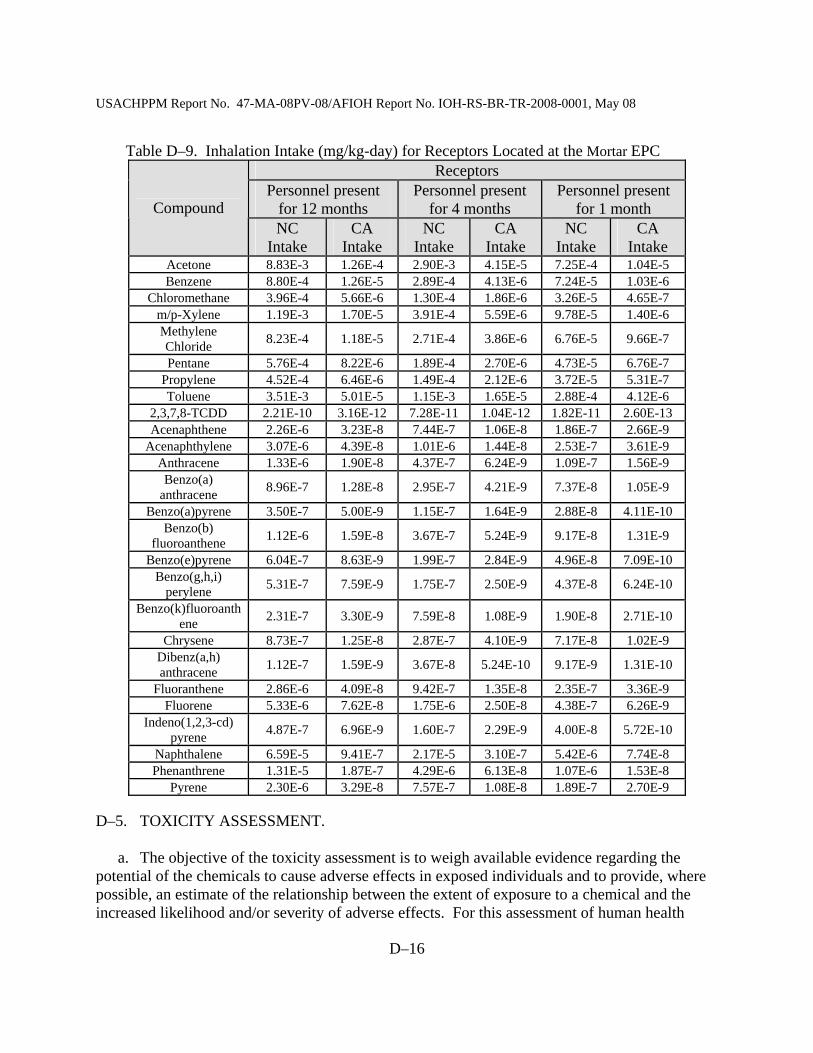
USACHPPM Report No. 47-MA-08PV-08/AFIOH Report No. IOH-RS-BR-TR-2008-0001, May 08
D–16
Table D–9. Inhalation Intake (mg/kg-day) for Receptors Located at the Mortar EPC Receptors
Personnel present for 12 months
Personnel present for 4 months
Personnel present for 1 month Compound
NC Intake
CA Intake
NC Intake
CA Intake
NC Intake
CA Intake
Acetone 8.83E-3 1.26E-4 2.90E-3 4.15E-5 7.25E-4 1.04E-5 Benzene 8.80E-4 1.26E-5 2.89E-4 4.13E-6 7.24E-5 1.03E-6
Chloromethane 3.96E-4 5.66E-6 1.30E-4 1.86E-6 3.26E-5 4.65E-7 m/p-Xylene 1.19E-3 1.70E-5 3.91E-4 5.59E-6 9.78E-5 1.40E-6 Methylene Chloride 8.23E-4 1.18E-5 2.71E-4 3.86E-6 6.76E-5 9.66E-7
Pentane 5.76E-4 8.22E-6 1.89E-4 2.70E-6 4.73E-5 6.76E-7 Propylene 4.52E-4 6.46E-6 1.49E-4 2.12E-6 3.72E-5 5.31E-7 Toluene 3.51E-3 5.01E-5 1.15E-3 1.65E-5 2.88E-4 4.12E-6
2,3,7,8-TCDD 2.21E-10 3.16E-12 7.28E-11 1.04E-12 1.82E-11 2.60E-13 Acenaphthene 2.26E-6 3.23E-8 7.44E-7 1.06E-8 1.86E-7 2.66E-9
Acenaphthylene 3.07E-6 4.39E-8 1.01E-6 1.44E-8 2.53E-7 3.61E-9 Anthracene 1.33E-6 1.90E-8 4.37E-7 6.24E-9 1.09E-7 1.56E-9 Benzo(a)
anthracene 8.96E-7 1.28E-8 2.95E-7 4.21E-9 7.37E-8 1.05E-9
Benzo(a)pyrene 3.50E-7 5.00E-9 1.15E-7 1.64E-9 2.88E-8 4.11E-10 Benzo(b)
fluoroanthene 1.12E-6 1.59E-8 3.67E-7 5.24E-9 9.17E-8 1.31E-9
Benzo(e)pyrene 6.04E-7 8.63E-9 1.99E-7 2.84E-9 4.96E-8 7.09E-10 Benzo(g,h,i)
perylene 5.31E-7 7.59E-9 1.75E-7 2.50E-9 4.37E-8 6.24E-10
Benzo(k)fluoroanthene 2.31E-7 3.30E-9 7.59E-8 1.08E-9 1.90E-8 2.71E-10
Chrysene 8.73E-7 1.25E-8 2.87E-7 4.10E-9 7.17E-8 1.02E-9 Dibenz(a,h) anthracene 1.12E-7 1.59E-9 3.67E-8 5.24E-10 9.17E-9 1.31E-10
Fluoranthene 2.86E-6 4.09E-8 9.42E-7 1.35E-8 2.35E-7 3.36E-9 Fluorene 5.33E-6 7.62E-8 1.75E-6 2.50E-8 4.38E-7 6.26E-9
Indeno(1,2,3-cd) pyrene 4.87E-7 6.96E-9 1.60E-7 2.29E-9 4.00E-8 5.72E-10
Naphthalene 6.59E-5 9.41E-7 2.17E-5 3.10E-7 5.42E-6 7.74E-8 Phenanthrene 1.31E-5 1.87E-7 4.29E-6 6.13E-8 1.07E-6 1.53E-8
Pyrene 2.30E-6 3.29E-8 7.57E-7 1.08E-8 1.89E-7 2.70E-9 D–5. TOXICITY ASSESSMENT. a. The objective of the toxicity assessment is to weigh available evidence regarding the potential of the chemicals to cause adverse effects in exposed individuals and to provide, where possible, an estimate of the relationship between the extent of exposure to a chemical and the increased likelihood and/or severity of adverse effects. For this assessment of human health

USACHPPM Report No. 47-MA-08PV-08/AFIOH Report No. IOH-RS-BR-TR-2008-0001, May 08
D–17
risks from exposure to chemicals, there are two basic toxicity values that are of principal importance—RfDs and CSFs. b. When evaluating health effects, the U.S. EPA recommends two different approaches for evaluating non-carcinogenic and carcinogenic health effects. The two approaches reflect the fundamental difference in the proposed mechanism of toxic action.
(1) Reference Doses. In assessing the potential for non-cancer health effects, the U.S.
EPA assumes that there is a toxicological threshold below which no adverse health effects occur. These toxicological thresholds are represented by RfCs (which are converted to reference doses by multiplying an RfC by an inhalation rate of 20 m3/day and dividing by 70 kg to obtain units of mg/kg-day) for inhalation exposures. In general, the RfD is an estimate of an average daily exposure to an individual (including sensitive individuals) below which there will not be an appreciable risk of adverse health effects. The RfD is derived using uncertainty factors (such as, to adjust from animals to humans and to protect sensitive subpopulations) to ensure that it is unlikely to underestimate the potential for adverse non-carcinogenic effects to occur. The purpose of the RfD is to provide a benchmark against which an intake from human exposure to various environmental conditions might be compared. Intakes of doses, which are significantly higher that the RfD, may indicate that an inadequate margin of safety could exist for exposure to that substance and that an adverse health effect could occur.
(2) Cancer Slope Factors. (a) For carcinogens, the threshold response level is believed to be inappropriate. The
CSFs are developed under the assumption that cancer risk is linearly related to dose. Therefore, even though most of the cancer data obtained from laboratory animal studies are for relatively high doses, it is assumed that these doses can be extrapolated down to the extremely small doses that would be expected from environmental exposure. This non-threshold theory assumes that even a single molecule of a carcinogen may cause changes in a single cell that could result in the cell dividing in an uncontrolled manner and eventually lead to cancer. It should be pointed out that this method leads to a plausible upper limit of cancer risk but does not necessarily give a realistic prediction of the true risk.
(b) The carcinogenic potency of a substance depends, in part, on its route of entry into the
body. Therefore, CSFs are classified, like RfDs, according to the route of administration (inhalation, ingestion). Ideally, route-specific CSFs should be used to evaluate the carcinogenic risk posed by each carcinogen through each exposure route of concern.
(c) The U.S. EPA has developed a classification system which indicates the likelihood that a particular chemical is a human carcinogen based on a weight-of-evidence (WOE) judgment using human and animal evidence. The following describes this system:

USACHPPM Report No. 47-MA-08PV-08/AFIOH Report No. IOH-RS-BR-TR-2008-0001, May 08
D–18
• A – Human carcinogen. • B1 – Probable human carcinogen—limited evidence of human
carcinogenicity. • B2 – Probable human carcinogen—sufficient animal evidence and
inadequate human data. • C – Possible human carcinogen—limited evidence in animals and no human
data. • D – Not classified as to carcinogenicity. • E – No evidence for carcinogenicity.
(3) Toxicity Sources. Since only inhalation exposures are being evaluated in this study, inhalation RfDs and inhalation CSFs are the only values that will be used. The primary source of toxicity information is the U.S. EPA’s Integrated Risk Information System (IRIS) (reference 10). If values were not available in IRIS, the Health Effects Assessment Summary Tables (HEAST) (reference 13), or the U.S. EPA Region III Risk Based Concentration Table were consulted (reference 14). Table D–10 provides a summary of the toxicological reference values used in this assessment. The carcinogenic WOE classification is also provided along with the source of the reference value.
Table D–10. Toxicity Values Chemical RfC
(mg/m3) Source RfDi (mg/kg-d) Source WOE CSFi
(mg/kg-d)-1 Source Acetone N/A N/A 9.00E-1 Rte-Rte N/A N/A N/A Benzene 3.00E-2 IRIS 8.60E-3 IRIS A 2.7E-2 IRIS Carbon Disulfide 7.00E-1 IRIS 2.00E-1 IRIS N/A N/A N/A Chlorodifluoromethane 50 IRIS 14 IRIS N/A N/A N/A Chloromethane 9.00E-2 IRIS 2.6E-2 IRIS D 6.3E-3 HEAST Ethylbenzene 1.0 IRIS 2.90E-1 IRIS D N/A N/A Hexane 7.00E-1 IRIS 2.00E-1 IRIS N/A N/A N/A m/p-Xylene 1.00E-1 IRIS 2.90E-2 IRIS D N/A N/A Methylene Chloride N/A N/A 3.00E-1 IRIS B2 1.6E-3 IRIS Pentane N/A N/A N/A N/A D N/A N/A Propylene N/A N/A N/A N/A D N/A N/A Styrene 1.0 IRIS 2.86E-1 IRIS D N/A N/A Toluene 5.0 IRIS 1.40 IRIS D N/A N/A 2,3,7,8-TCDD N/A N/A N/A N/A N/A 1.5E+5 HEAST Acenaphthene N/A N/A 6.00E-2 Rte-Rte N/A N/A N/A Acenaphthylene N/A N/A N/A N/A N/A N/A N/A Anthracene N/A N/A 3.00E-1 Rte-Rte N/A N/A N/A
Benzo(a)anthracene N/A N/A N/A N/A B2 3.1E-1 EPA-NCEA1
Benzo(a)pyrene N/A N/A N/A N/A B2 3.1 EPA-NCEA
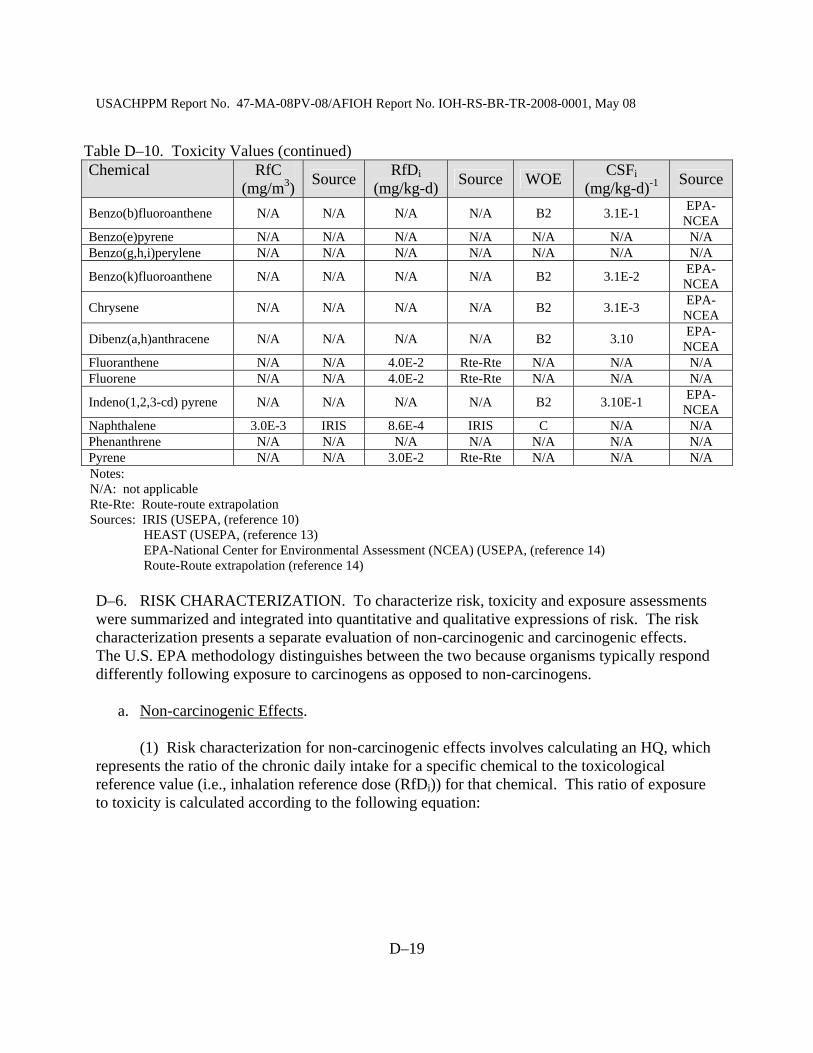
USACHPPM Report No. 47-MA-08PV-08/AFIOH Report No. IOH-RS-BR-TR-2008-0001, May 08
D–19
Table D–10. Toxicity Values (continued) Chemical RfC
(mg/m3) Source RfDi (mg/kg-d) Source WOE CSFi
(mg/kg-d)-1 Source
Benzo(b)fluoroanthene N/A N/A N/A N/A B2 3.1E-1 EPA-NCEA
Benzo(e)pyrene N/A N/A N/A N/A N/A N/A N/A Benzo(g,h,i)perylene N/A N/A N/A N/A N/A N/A N/A
Benzo(k)fluoroanthene N/A N/A N/A N/A B2 3.1E-2 EPA-NCEA
Chrysene N/A N/A N/A N/A B2 3.1E-3 EPA-NCEA
Dibenz(a,h)anthracene N/A N/A N/A N/A B2 3.10 EPA-NCEA
Fluoranthene N/A N/A 4.0E-2 Rte-Rte N/A N/A N/A Fluorene N/A N/A 4.0E-2 Rte-Rte N/A N/A N/A
Indeno(1,2,3-cd) pyrene N/A N/A N/A N/A B2 3.10E-1 EPA-NCEA
Naphthalene 3.0E-3 IRIS 8.6E-4 IRIS C N/A N/A Phenanthrene N/A N/A N/A N/A N/A N/A N/A Pyrene N/A N/A 3.0E-2 Rte-Rte N/A N/A N/A Notes: N/A: not applicable Rte-Rte: Route-route extrapolation Sources: IRIS (USEPA, (reference 10)
HEAST (USEPA, (reference 13) EPA-National Center for Environmental Assessment (NCEA) (USEPA, (reference 14) Route-Route extrapolation (reference 14)
D–6. RISK CHARACTERIZATION. To characterize risk, toxicity and exposure assessments were summarized and integrated into quantitative and qualitative expressions of risk. The risk characterization presents a separate evaluation of non-carcinogenic and carcinogenic effects. The U.S. EPA methodology distinguishes between the two because organisms typically respond differently following exposure to carcinogens as opposed to non-carcinogens. a. Non-carcinogenic Effects. (1) Risk characterization for non-carcinogenic effects involves calculating an HQ, which represents the ratio of the chronic daily intake for a specific chemical to the toxicological reference value (i.e., inhalation reference dose (RfDi)) for that chemical. This ratio of exposure to toxicity is calculated according to the following equation:

USACHPPM Report No. 47-MA-08PV-08/AFIOH Report No. IOH-RS-BR-TR-2008-0001, May 08
D–20
Hazard Quotient = ADI (mg/kg-day) RfDi (mg/kg-day) Where: ADI = Average Daily Intake calculated in the exposure assessment RfDi = Inhalation Reference Dose identified in the Toxicity Assessment (2) The non-cancer HQ assumes that there is a level of exposure (i.e., an RfDi) below which it is unlikely for even sensitive populations to experience adverse health effects. If the HQ does not exceed the threshold of 1.0 (that is, if ADI/RfDi does not exceed unity), there is no concern for potential non-cancer effects. (3) The individual HQs are summed over all chemicals to obtain an overall HI for the site. This approach assumes that simultaneous subthreshold exposures to several exposure pathways could result in an adverse health effect. It also assumes that the magnitude of the adverse effect will be proportional to the sum of the ratios of the subthreshold exposures to respective acceptable exposures. An HI of less than or equal to 1.0 indicates that the occurrence of adverse health effects as a result of the evaluated chemical exposure is unlikely. b. Carcinogenic Effects. (1) Cancer risk is expressed as a probability (for example, 1E-6 or 1 in 1,000,000), which indicates the risk of additional incidences of cancer over a lifetime, above the normal background cancer rate, in an exposed population. Risk estimates represent the additional probability that individuals in a population will develop cancer over a lifetime as a result of exposure to a particular carcinogen. It can generally be assumed that the dose-response relationship will be linear in the low-dose portion of the multistage model dose-response curve. Under this assumption, the slope factor is a constant, and risk will be directly related to intake. The probabilities are derived by multiplying the estimated daily intake by the chemical-specific CSFs. This risk estimate is calculated according to the following equation: Risk = ADI (mg/kg-day) * CSFi (mg/kg-day)-1
Where: ADI = Average Daily Intake from exposure assessment CSFi = Inhalation Cancer Slope Factor from Toxicity Assessment (2) Because the slope factor is often an upper 95th percent confidence limit of the probability of a response and is based on animal data used in the multistage model, the carcinogenic risk will generally be an upper-bound estimate. This means that the "true risk" is not likely to exceed the risk estimate derived through this model and is likely to be less than predicted. Based on U.S. EPA guidance (reference 11), this study considers carcinogenic risks within the 1E-4 to 1E-6 range to be acceptable and protective of human health.

USACHPPM Report No. 47-MA-08PV-08/AFIOH Report No. IOH-RS-BR-TR-2008-0001, May 08
D–21
c. Risk Results. For each exposure point (the overall base, the guard tower/transportation field area, the H6 housing/CASF area, and the mortar pit area), risk was quantified for all compounds detected in those areas for intake through inhalation. The individual compound values were then combined to calculate the pathway risk. This represents the total risk for the site. Non-cancer hazard and cancer risk were calculated using the equations presented above.
(1) Non-Cancer Results. A non-cancer HI was calculated for personnel present at Balad Air Base for 12 months, 4 months, and 1 month in the overall base, the guard tower/ transportation field area, the H6 housing/CASF area, and the mortar pit area. Again, an HI of 1.0 or greater indicates that the levels of emitted substances detected may be of potential concern. Based on this assessment, burn pit emissions will not cause adverse health effects in individuals exposed under the conditions evaluated. The HIs calculated for all of the receptors at all of the exposure location points are all well below 1.0 indicating that no adverse effects would be expected. The HIs are shown in Table D–11. The complete results of the risk assessment can be found in Appendix C. Table D–11. Non-cancer Hazard Indices Receptor Overall
Base Guard Tower/ Transportation Field
H6 Housing/ CASF
Mortar Pit
Personnel present for 12 months
0.47 0.75 0.42 0.25
Personnel present for 4 months
0.15 0.25 0.14 0.08
Personnel present for 1 month
0.04 0.06 0.03 0.02
Note: According to guidelines provided by the U.S. EPA, non-cancer health hazards are assessed as “acceptable” or “safe” if the hazard index is less than 1.0. (2) Carcinogenic Risk Results. Carcinogenic risk was also calculated for the four receptors for each of the sampling schemes. The range for acceptable cancer risk for this assessment is 1x10⁻⁴ to 1x10⁻⁶. Total cancer risks for all receptors at all of the exposure points are within or below the acceptable cancer risk range. Table D–12 lists all of the cumulative cancer risk levels calculated in this assessment. The complete results of the risk assessment can be found in Appendix C.
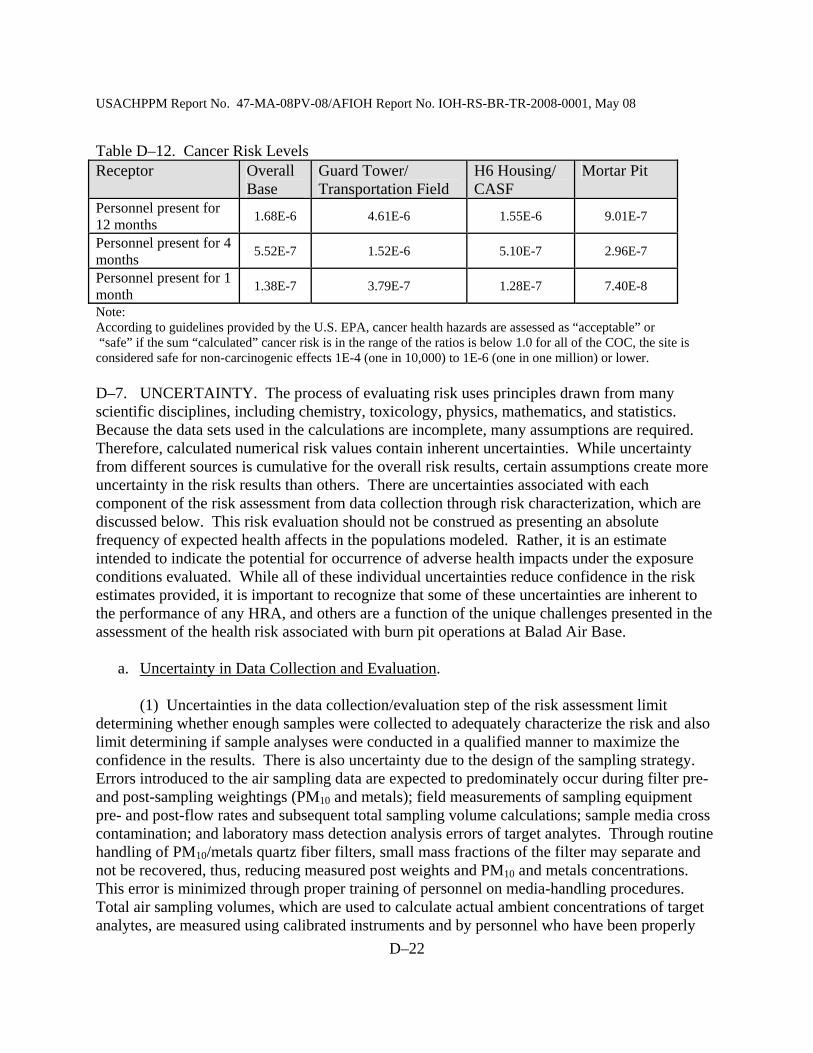
USACHPPM Report No. 47-MA-08PV-08/AFIOH Report No. IOH-RS-BR-TR-2008-0001, May 08
D–22
Table D–12. Cancer Risk Levels Receptor Overall
Base Guard Tower/ Transportation Field
H6 Housing/ CASF
Mortar Pit
Personnel present for 12 months 1.68E-6 4.61E-6 1.55E-6 9.01E-7
Personnel present for 4 months 5.52E-7 1.52E-6 5.10E-7 2.96E-7
Personnel present for 1 month 1.38E-7 3.79E-7 1.28E-7 7.40E-8
Note: According to guidelines provided by the U.S. EPA, cancer health hazards are assessed as “acceptable” or “safe” if the sum “calculated” cancer risk is in the range of the ratios is below 1.0 for all of the COC, the site is considered safe for non-carcinogenic effects 1E-4 (one in 10,000) to 1E-6 (one in one million) or lower. D–7. UNCERTAINTY. The process of evaluating risk uses principles drawn from many scientific disciplines, including chemistry, toxicology, physics, mathematics, and statistics. Because the data sets used in the calculations are incomplete, many assumptions are required. Therefore, calculated numerical risk values contain inherent uncertainties. While uncertainty from different sources is cumulative for the overall risk results, certain assumptions create more uncertainty in the risk results than others. There are uncertainties associated with each component of the risk assessment from data collection through risk characterization, which are discussed below. This risk evaluation should not be construed as presenting an absolute frequency of expected health affects in the populations modeled. Rather, it is an estimate intended to indicate the potential for occurrence of adverse health impacts under the exposure conditions evaluated. While all of these individual uncertainties reduce confidence in the risk estimates provided, it is important to recognize that some of these uncertainties are inherent to the performance of any HRA, and others are a function of the unique challenges presented in the assessment of the health risk associated with burn pit operations at Balad Air Base. a. Uncertainty in Data Collection and Evaluation. (1) Uncertainties in the data collection/evaluation step of the risk assessment limit determining whether enough samples were collected to adequately characterize the risk and also limit determining if sample analyses were conducted in a qualified manner to maximize the confidence in the results. There is also uncertainty due to the design of the sampling strategy. Errors introduced to the air sampling data are expected to predominately occur during filter pre- and post-sampling weightings (PM10 and metals); field measurements of sampling equipment pre- and post-flow rates and subsequent total sampling volume calculations; sample media cross contamination; and laboratory mass detection analysis errors of target analytes. Through routine handling of PM10/metals quartz fiber filters, small mass fractions of the filter may separate and not be recovered, thus, reducing measured post weights and PM10 and metals concentrations. This error is minimized through proper training of personnel on media-handling procedures. Total air sampling volumes, which are used to calculate actual ambient concentrations of target analytes, are measured using calibrated instruments and by personnel who have been properly
USACHPPM Report No. 47-MA-08PV-08/AFIOH Report No. IOH-RS-BR-TR-2008-0001, May 08
D–23
trained to minimize errors. Media cross contamination occasionally occurs when target analytes are accidentally introduced to the sampling media through normal handling and is minimized with proper personnel training. Errors due to volatilization of collected target analytes are monitored through “pre-spiking” media with traceable target compounds, which must then be recovered within methodology-specified percentage values. This volatilization is minimized through proper storage and shipping procedures that include media storage in cool areas and prompt media analysis. Media which do not meet these specified recovery percentages are generally not reported. Other expected laboratory errors are minimized through internal chemical standards, procedures, and laboratory personnel training. (2) When calculating the 95th percentile UCL, there is an uncertainty associated with chemicals that have numerous non-detects because this can cause the 95th percentile UCL to be unreliable, thus, having to default to using the maximum concentration as the 95th percentile UCL value. b. Uncertainty in Exposure Assessment. Once pathways are identified, EPCs must be estimated. There is always some doubt as to how well an exposure model approximates the actual conditions receptors will be exposed to at a given site. Key assumptions in estimating EPCs and exposure assumptions and their potential impact on the assessment are described in the following paragraphs: (1) There are many factors which determine the level of exposure for each exposure pathway. These factors include ingestion rates, EFs, EDs, and BW. The values for these EFs must be selected by the risk assessor to represent each receptor. For the scenarios in this risk assessment, upper-bound values were selected for each exposure factor. These multiple upper-bound exposure factor estimates compound to yield intake, which overestimate likely exposure levels. However, an individual could exceed the values used and would, therefore, represent a higher potential risk than was estimated in the assessment. (2) The EPCs derived from the measured chemical concentrations are assumed to persist without change for the entire duration of each exposure scenario. It is possible that chemical concentrations in the air will change over time. Unfortunately, it is not known whether the quality will improve or degrade. Therefore, this steady-state assumption could tend to under or overestimate exposure levels. c. Uncertainty in the Toxicity Assessment. (1) There is considerable uncertainty inherent in the toxicity values for both carcinogens and non-carcinogens. These include the identification of potential health effects, the derivation of toxicity values, route-to-route extrapolation of toxicity values, and the lack of toxicity values for all COCs. Many of the studies are based on animals and extrapolated to humans; in some cases, subchronic studies must be used to assess chronic effects. Most CSFs are calculated using a model which extrapolates low-dose effects from high-dose animal studies. Because toxicity
USACHPPM Report No. 47-MA-08PV-08/AFIOH Report No. IOH-RS-BR-TR-2008-0001, May 08
D–24
constants are generally based on the upper limit of the 95th percentile confidence interval or incorporate safety factors to compensate for uncertainty, chemical-specific risks may be overestimated. (2) The derivation of toxicity values is a source of uncertainty. Most of the data on health effects comes from animal studies. The U.S. EPA collects and evaluates all known studies for each chemical. It uses the most sensitive animal study available and the adverse effect that occurs at the lowest dose to derive, by the application of uncertainty and modifying factors, the RfD for non-carcinogens. Humans are assumed to be even more sensitive than the most sensitive animal. The health effect in humans may not be the same, so human data are sought to corroborate the animal data. The same data-evaluation process takes place for carcinogens except the data are extrapolated to humans by using the 95th percent UCL of the mean slope from the primary study used to derive the CSF; toxicity constants often incorporate safety factors to compensate for uncertainty. Because of these methods to compensate for uncertainty in the toxicity study, chemical-specific risks may be overestimated. (3) Another source of uncertainty is the route-to-route extrapolation of toxicity values. Toxicity values are route-specific because absorption and metabolism vary with route of entry. Because inhalation toxicity criteria were unavailable for all chemicals evaluated, surrogate values were calculated based on oral values in some cases. This assumption may result in either an underestimation or an overestimation of risk. (4) Uncertainty in the toxicity assessment for dioxins is present due to the U.S. EPA’s reassessment in 2003 of the toxicity of 2,3,7,8-TCDD (reference 15). The reassessment provides a draft CSF, which is six times higher than the CSF that was recommended by the U.S. EPA in 1989 and which was used in this risk assessment. Because the 2003 reassessment, draft CSF is under review and has not been accepted as a final value; the 1989 CSF was used for this assessment. d. Uncertainty in Risk Characterization. Uncertainties in the toxicity assessment are compounded under the assumption of dose additivity for multiple substance/pathway exposure. That assumption ignores possible synergism and antagonisms among chemicals, and assumes similarity in mechanisms of action and metabolism. Overall, these assumptions could tend to under or overestimate risk. Similarly, risks summed for chemicals having different target organs may also tend to overestimate risk. D–8. SUMMARY. a. For this study, a sampling scheme was developed which involved sampling air concentrations near the Balad Air Base burn pits for a large suite of contaminants at five sample locations. Ambient air samples were collected via U.S. EPA methodology guidance and using Hi-Volume PS-1 Samplers, Airmetrics MiniVols, and Summa Canisters (see Appendix B for more detail). The results indicated the presence of particulate matter and a variety of dioxins and

USACHPPM Report No. 47-MA-08PV-08/AFIOH Report No. IOH-RS-BR-TR-2008-0001, May 08
D–25
furans, VOCs and PAHs released from the burn pit. The data were segregated into four data sets (that is, all samples, mortar pit samples, H6 Housing/CASF samples and guard tower/ transportation field samples) and 95th percent UCL of the mean concentrations were calculated for each data set. b. The calculated 95th percentile UCL concentrations were then used as the basis for a human HRA for personnel who were deployed at Balad Air Base for 12 months, 4 months, and 1 month. D–9. CONCLUSION. Three points about a risk assessment should be emphasized— a. First, an estimate of carcinogenic risk or non-carcinogenic hazard is dependent upon the assumptions and numerical values used in the risk characterization, toxicity evaluation, and exposure assessment components. Risk assessment estimates should not be taken as absolute measures of an individual’s probability of an adverse health effect. Rather, the estimates should be viewed as a threshold of concern for the receptor populations. Since most exposure parameters incorporate methods designed to yield a high-end estimate plus some degree of safety factor, the estimate of risk most likely represents an overestimate. b. Second, these estimates do not indicate that an adverse outcome actually will occur; they only indicate the likelihood or probability that such outcomes might occur under very specific exposure conditions. However, the flexibility to adjust exposure assumptions and values allows risk managers to analyze a number of different exposure conditions and reach a more informed decision than if a risk assessment was not conducted. c. Third, a comprehensive risk assessment is only one of several tools that can provide useful information for risk management decisions. Results of a risk assessment only contribute to a final risk management solution; they are not the final solution. When all uncertainties associated with the assumptions and exposure values are identified, however, a comprehensive risk assessment can assist policy developers and risk managers in reaching a more informed risk management decision about available management options.
(1) Non-Carcinogenic Risk. For non-carcinogenic effects, the total hazard indices of all
receptors from inhalation exposures originating from burn pit emissions at Balad Air Base are below the unit 1.0 for all EPCs. These results indicate that exposure to inhaled burn pit emissions pose no unacceptable non-carcinogenic health hazards to personnel present at Balad Air Base for 12 months, 4 months, or 1 month located anywhere at the Airbase.
(2) Carcinogenic Risk. The total cancer risk from inhalation exposures originating from
burn pit emissions at Balad Air Base to personnel present for 12 months, 4 months, and 1 month at all EPCs are within or below the U.S. EPA acceptable cancer risk range of 1x10⁻⁴ to 1x10⁻⁶. This indicates that exposure to inhaled burn pit emissions does not pose a significant cancer

USACHPPM Report No. 47-MA-08PV-08/AFIOH Report No. IOH-RS-BR-TR-2008-0001, May 08
D–26
health risk to personnel present at Balad Air Base for 12 months, 4 months, or 1 month located anywhere at the Air Base.
(3) Because of the limitations and assumptions inherent in risk assessment, this assessment must not be used as an absolute determination of the probability of health effects from the possible exposures at this site. The risk evaluation was focused on estimating potential environmental exposures and may not represent an actual exposure or risk at the site. This assessment should only be used to assist in making decisions regarding health concerns of personnel who were present at Balad Air Base during the use of the burn pits for 12 months, 4 months, or 1 month. D–10. TECHNICAL ASSISTANCE. The USACHPPM risk assessment was conducted by Mr. Adam Deck, Environmental Health Risk Assessment Program. Questions regarding this study should be directed to Mr. Deck at (410) 436-9039, or e-mail: [email protected].
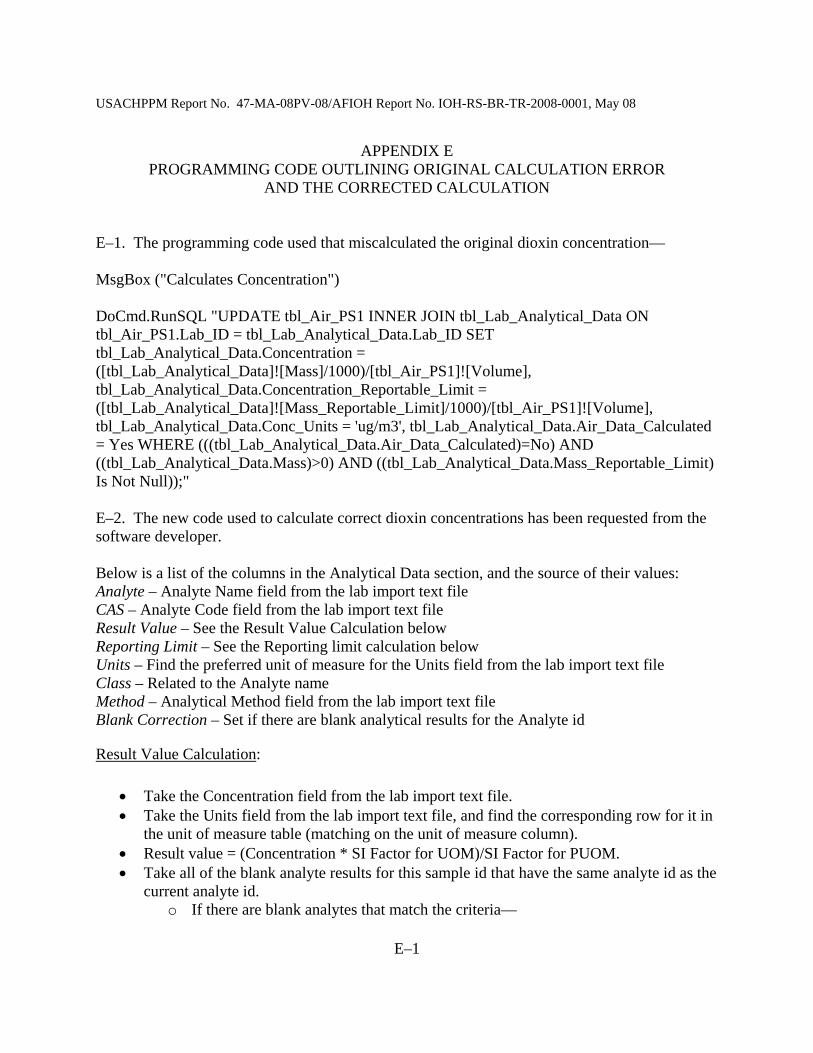
USACHPPM Report No. 47-MA-08PV-08/AFIOH Report No. IOH-RS-BR-TR-2008-0001, May 08
E–1
APPENDIX E PROGRAMMING CODE OUTLINING ORIGINAL CALCULATION ERROR
AND THE CORRECTED CALCULATION E–1. The programming code used that miscalculated the original dioxin concentration— MsgBox ("Calculates Concentration") DoCmd.RunSQL "UPDATE tbl_Air_PS1 INNER JOIN tbl_Lab_Analytical_Data ON tbl_Air_PS1.Lab_ID = tbl_Lab_Analytical_Data.Lab_ID SET tbl_Lab_Analytical_Data.Concentration = ([tbl_Lab_Analytical_Data]![Mass]/1000)/[tbl_Air_PS1]![Volume], tbl_Lab_Analytical_Data.Concentration_Reportable_Limit = ([tbl_Lab_Analytical_Data]![Mass_Reportable_Limit]/1000)/[tbl_Air_PS1]![Volume], tbl_Lab_Analytical_Data.Conc_Units = 'ug/m3', tbl_Lab_Analytical_Data.Air_Data_Calculated = Yes WHERE (((tbl_Lab_Analytical_Data.Air_Data_Calculated)=No) AND ((tbl_Lab_Analytical_Data.Mass)>0) AND ((tbl_Lab_Analytical_Data.Mass_Reportable_Limit) Is Not Null));" E–2. The new code used to calculate correct dioxin concentrations has been requested from the software developer. Below is a list of the columns in the Analytical Data section, and the source of their values: Analyte – Analyte Name field from the lab import text file CAS – Analyte Code field from the lab import text file Result Value – See the Result Value Calculation below Reporting Limit – See the Reporting limit calculation below Units – Find the preferred unit of measure for the Units field from the lab import text file Class – Related to the Analyte name Method – Analytical Method field from the lab import text file Blank Correction – Set if there are blank analytical results for the Analyte id
Result Value Calculation:
• Take the Concentration field from the lab import text file. • Take the Units field from the lab import text file, and find the corresponding row for it in
the unit of measure table (matching on the unit of measure column). • Result value = (Concentration * SI Factor for UOM)/SI Factor for PUOM. • Take all of the blank analyte results for this sample id that have the same analyte id as the
current analyte id. o If there are blank analytes that match the criteria—

USACHPPM Report No. 47-MA-08PV-08/AFIOH Report No. IOH-RS-BR-TR-2008-0001, May 08
E–2
The goal is to get the highest blank analyte result value (after converting to the preferred unit of measure) from this list, and store that value as the blank correction value. Not all of the blank analytes should be included in this calculation, it is only for blank analytes that: • After converting to their preferred units have the same preferred unit of
measure as the main record. • Are not below the reporting limit.
If the overall result value is less than 4 times the blank correction value • Result value is set to -7777.0 • This analyte is set as “below reporting limit”
If the overall result value is not less than 4 times the blank correction value • Result value is set to it’s current value, minus the blank correction value
o If there are zero blank analytes that match the criteria
Blank correction value is set to -9999.0
• Perform Concentration Conversion if necessary (see section below). Example result value calculation, no blank analytes, soil sample (no concentration conversion):
Concentration field: 0.02 Units: mg/L Unit of measure “mg/L” corresponds to UOM ID 34 in the unit of measure table: SI Factor for UOM: 0.001 Preferred UOM: ug/m3
SI Factor for PUOM: 0.000000001 Result value = (0.02 * 0.001) / 0.000000001 Result value = 20000 ug/m3
Reporting Limit Calculation:
• Take the Reporting Limit field from the lab import text file. • Take the Units field from the lab import text file, and find the corresponding row for it in
the unit of measure table (matching on the unit of measure column). • Reporting Limit = (Reporting Limit * SI Factor for UOM) / SI Factor for PUOM. • Perform Concentration Conversion if necessary (see section below).
Example reporting limit calculation (soil sample, no concentration conversion):

USACHPPM Report No. 47-MA-08PV-08/AFIOH Report No. IOH-RS-BR-TR-2008-0001, May 08
E–3
Reporting Limit field: 0.01 Units: mg/L Unit of measure “mg/L” corresponds to UOM ID 34 in the unit of measure table: SI Factor for UOM: 0.001 Preferred UOM: ug/m3
SI Factor for PUOM: 0.000000001 Reporting limit = (0.01 * 0.001) / 0.000000001 Reporting limit = 10000 ug/m3
Calculating Example Results:
Follow these steps to generate the same values as the examples above:
• Create a new soil sample record. • Enter some default data as needed. • Go to Lab Import, import barium.txt, use USCHPPM Main as the Analyte Code
Reference. • Load Soil record, choose Lab Sample Id of from the imported barium.txt. • Values should match the examples above.
Concentration Conversion:
Concentration conversion is only done for the following sample types:
• Air TO-17 • Air TO-14 • Air PM Mini-Vol • Air DPS • Air PS1
The conversionVolume is a value that we need to do the concentration conversion. It is different for different sample types—
• Air TO-17, Air TO-14, or Air DPS: conversionVolume = volumeValue.
• Air PM Mini-Vol:
conversionVolume = volumeAmbientValue. • Air PS1:
conversionVolume = volumeValue. conversionVolume is then converted from cubic meters (m3) to liters (L).
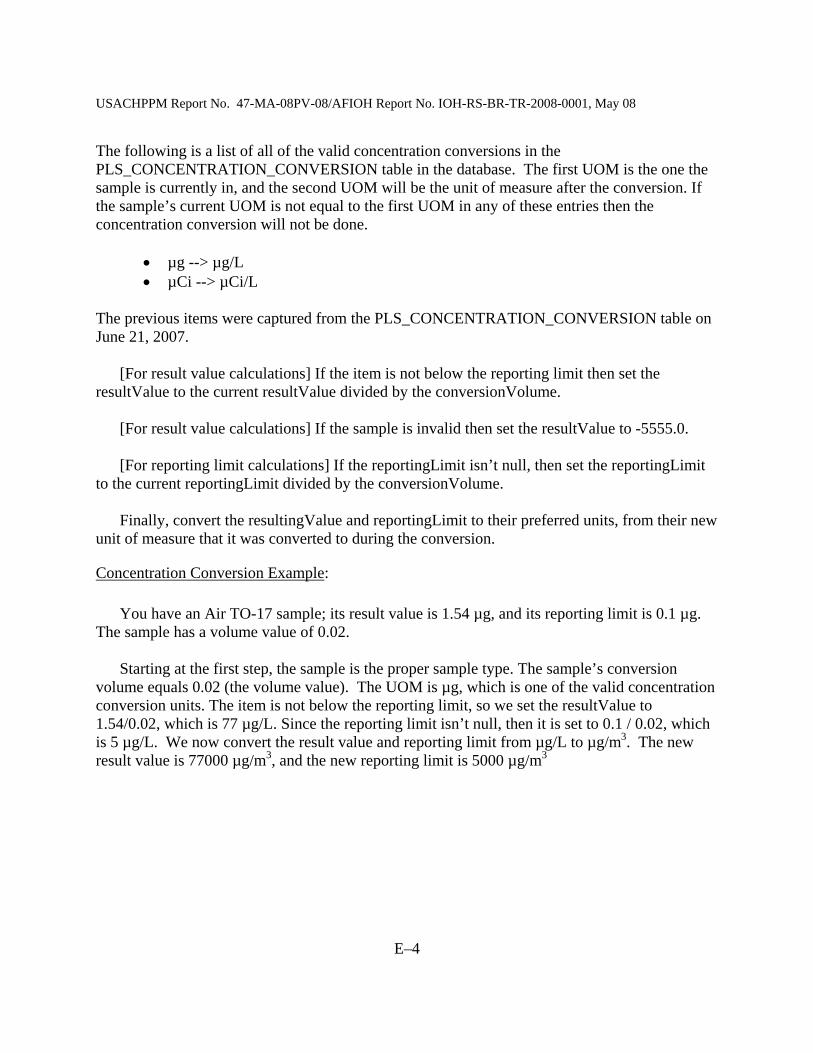
USACHPPM Report No. 47-MA-08PV-08/AFIOH Report No. IOH-RS-BR-TR-2008-0001, May 08
E–4
The following is a list of all of the valid concentration conversions in the PLS_CONCENTRATION_CONVERSION table in the database. The first UOM is the one the sample is currently in, and the second UOM will be the unit of measure after the conversion. If the sample’s current UOM is not equal to the first UOM in any of these entries then the concentration conversion will not be done.
• µg --> µg/L • µCi --> µCi/L
The previous items were captured from the PLS_CONCENTRATION_CONVERSION table on June 21, 2007.
[For result value calculations] If the item is not below the reporting limit then set the resultValue to the current resultValue divided by the conversionVolume.
[For result value calculations] If the sample is invalid then set the resultValue to -5555.0. [For reporting limit calculations] If the reportingLimit isn’t null, then set the reportingLimit
to the current reportingLimit divided by the conversionVolume. Finally, convert the resultingValue and reportingLimit to their preferred units, from their new
unit of measure that it was converted to during the conversion.
Concentration Conversion Example:
You have an Air TO-17 sample; its result value is 1.54 µg, and its reporting limit is 0.1 µg. The sample has a volume value of 0.02.
Starting at the first step, the sample is the proper sample type. The sample’s conversion
volume equals 0.02 (the volume value). The UOM is µg, which is one of the valid concentration conversion units. The item is not below the reporting limit, so we set the resultValue to 1.54/0.02, which is 77 µg/L. Since the reporting limit isn’t null, then it is set to 0.1 / 0.02, which is 5 µg/L. We now convert the result value and reporting limit from µg/L to µg/m3. The new result value is 77000 µg/m3, and the new reporting limit is 5000 µg/m3

USACHPPM Report No. 47-MA-08PV-08/AFIOH Report No. IOH-RS-BR-TR-2008-0001, May 08
F–1
APPENDIX F AIR SAMPLING DATA
Table F–1. Ambient Air TO-9 Methodology Samples
Sample Identification Number
IRQ_BAL_ TO09_06065_P
IRQ_BAL_ TO09_06214_P2
IRQ_BAL_ TO09_06215_P2
IRQ_BAL_ TO09_07002_
IRQ_BAL_ TO09_07002_B
IRQ_BAL_ TO09_07002_A
Collection Date 3/6/2006 8/2/2006 8/3/2006 1/2/2007 1/2/2007 1/2/2007 COPC µg/m3 µg/m3 µg/m3 µg/m3 µg/m3 µg/m3
1,2,3,4,6,7,8-HPCDD 1.70E-06 9.70E-7 4.50E-7 5.70E-8 1.60E-6 6.40E-6 1,2,3,4,6,7,8-HPCDF 1.50E-06 8.60E-7 4.30E-7 9.40E-8 1.50E-6 5.70E-6 1,2,3,4,7,8,9-HPCDF 1.80E-07 1.20E-7 1.10E-7 1.30E-8 8.12E-11a 5.70E-7 1,2,3,4,7,8-HXCDD 1.60E-07 1.10E-7 6.10E-8 3.60E-9 1.70E-7 6.80E-7 1,2,3,4,7,8-HXCDF 1.40E-06 8.10E-7 4.20E-7 6.20E-8 1.30E-6 4.90E-6 1,2,3,6,7,8-HXCDD 3.40E-07 2.30E-7 9.80E-8 9.20E-9 3.00E-7 1.50E-6 1,2,3,6,7,8-HXCDF 4.90E-07 2.70E-7 1.60E-7 2.50E-8 4.40E-7 1.80E-6 1,2,3,7,8,9-HXCDD 4.90E-07 3.30E-7 1.60E-7 1.10E-8 4.20E-7 4.30E-6 1,2,3,7,8,9-HXCDF 4.00E-08 3.69E-8a 3.60E-8 2.36E-12a 4.02E-11a 8.32E-11a 1,2,3,7,8-PECDDb 1.90E-07 1.40E-7 8.40E-8 4.20E-9 2.00E-7 8.60E-7 1,2,3,7,8-PECDF 3.70E-07 2.10E-7 1.20E-7 1.30E-8 2.30E-7 1.30E-6
2,3,4,6,7,8-HXCDF 6.60E-07 4.00E-7 2.10E-7 3.10E-8 6.70E-7 2.70E-6 2,3,4,7,8-PECDF 6.80E-07 3.80E-7 2.20E-7 2.60E-8 5.00E-7 1.80E-6
2,3,7,8-TCDD 5.40E-08 4.70E-8 2.20E-8 6.13E-13a 5.30E-8 3.10E-7 2,3,7,8-TCDF 2.70E-07 8.90E-8 5.90E-8 1.20E-8 2.40E-7 6.60E-7
OCDD 1.30E-06 9.10E-7 5.70E-7 1.70E-7 1.30E-6 5.30E-6 OCDF 4.70E-07 2.70E-7 3.40E-7 7.10E-8 4.30E-7 1.50E-6

USACHPPM Report No. 47-MA-08PV-08/AFIOH Report No. IOH-RS-BR-TR-2008-0001, May 08
F–2
Table F–1. Ambient Air TO-9 Methodology Samples (continued) Sample
Identification Number IRQ_BAL_
TO09_07003_ IRQ_BAL_
TO09_07003_A IRQ_BAL_
TO09_07003_B IRQ_BAL_
TO09_01070_39 IRQ_BAL_
TO09_02070_39 IRQ_BAL_
TO09_03070_39 Collection Date 1/3/2007 1/3/2007 1/3/2007 2/8/2007 2/8/2007 2/8/2007
COPC µg/m3 µg/m3 µg/m3 µg/m3 µg/m3 µg/m3 1,2,3,4,6,7,8-HPCDD 3.00E-8 7.50E-6 5.10E-6 4.10E-8 2.50E-7 6.60E-8 1,2,3,4,6,7,8-HPCDF 7.20E-8 6.10E-6 3.90E-6 7.20E-8 2.20E-7 7.70E-8 1,2,3,4,7,8,9-HPCDF 1.30E-8 6.00E-7 4.20E-7 1.80E-8 2.40E-8a 5.69E-12a 1,2,3,4,7,8-HXCDD 3.70E-9 8.90E-7 4.70E-7 6.03E-12a 3.10E-8 3.43E-12a 1,2,3,4,7,8-HXCDF 5.20E-8 6.00E-6 3.20E-6 6.70E-8 2.00E-7 5.80E-8 1,2,3,6,7,8-HXCDD 6.00E-9 1.80E-6 8.90E-7 5.60E-12a 6.00E-8 1.70E-8 1,2,3,6,7,8-HXCDF 2.40E-8 2.40E-6 1.20E-6 2.90E-8 8.10E-8 2.40E-8 1,2,3,7,8,9-HXCDD 8.40E-9 5.60E-6 1.90E-6 5.55E-12a 6.90E-8 2.00E-8 1,2,3,7,8,9-HXCDF 2.90E-9 1.02E-10a 6.83E-11a 6.89E-12a 5.00E-12a 3.92E-12a 1,2,3,7,8-PECDD 4.60E-9 1.10E-6 5.90E-7 9.95E-12a 1.26E-11a 7.83E-12a 1,2,3,7,8-PECDF 1.60E-8 1.60E-6 8.70E-7 1.16E-11a 4.90E-8 2.50E-8
2,3,4,6,7,8-HXCDF 2.50E-8 3.50E-6 1.90E-6 2.00E-8 9.20E-8 2.30E-8 2,3,4,7,8-PECDF 2.40E-8 2.40E-6 1.30E-6 3.10E-8 9.90E-8 2.70E-8
2,3,7,8-TCDD 5.64E-13a 3.50E-7 1.90E-7 6.40E-12a 7.54E-12a 6.23E-12a 2,3,7,8-TCDF 1.70E-8 1.10E-6 7.70E-7 2.00E-8 5.40E-8 1.80E-8
OCDD 6.00E-8 6.20E-6 5.10E-6 5.80E-8 2.10E-7 7.60E-8 OCDF 4.90E-8 1.50E-6 1.30E-6 3.50E-8 8.00E-8 4.10E-8
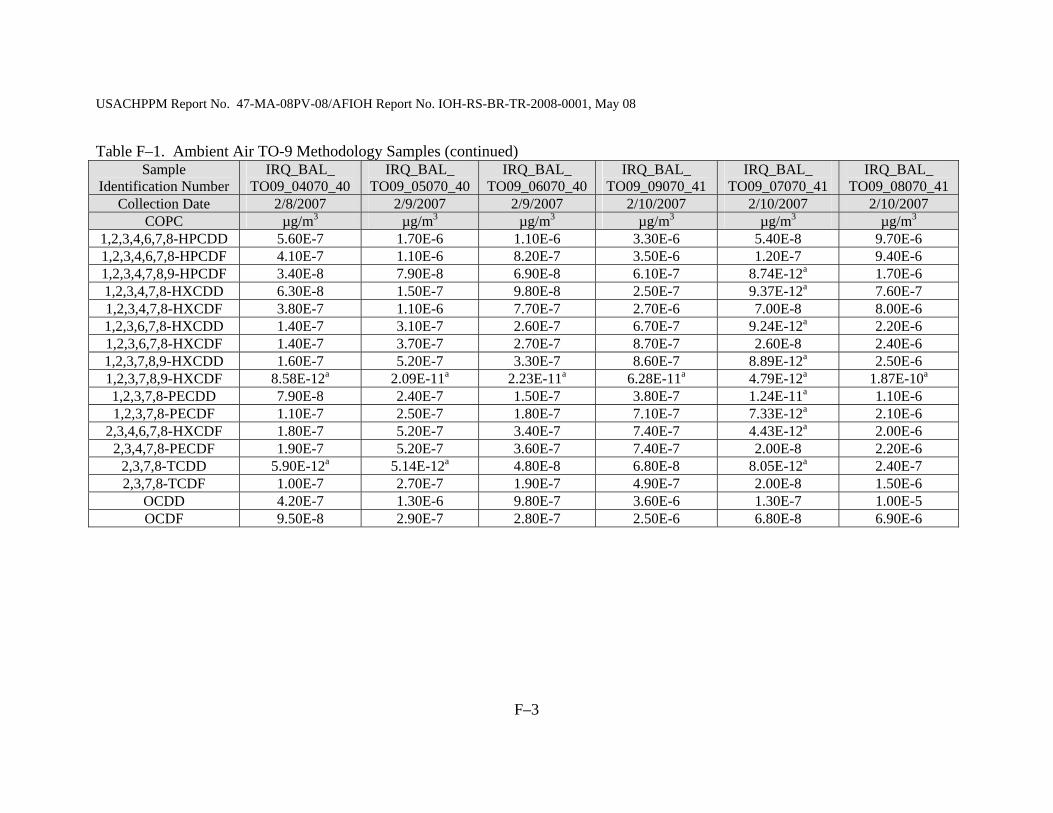
USACHPPM Report No. 47-MA-08PV-08/AFIOH Report No. IOH-RS-BR-TR-2008-0001, May 08
F–3
Table F–1. Ambient Air TO-9 Methodology Samples (continued) Sample
Identification Number IRQ_BAL_
TO09_04070_40 IRQ_BAL_
TO09_05070_40 IRQ_BAL_
TO09_06070_40 IRQ_BAL_
TO09_09070_41 IRQ_BAL_
TO09_07070_41 IRQ_BAL_
TO09_08070_41 Collection Date 2/8/2007 2/9/2007 2/9/2007 2/10/2007 2/10/2007 2/10/2007
COPC µg/m3 µg/m3 µg/m3 µg/m3 µg/m3 µg/m3 1,2,3,4,6,7,8-HPCDD 5.60E-7 1.70E-6 1.10E-6 3.30E-6 5.40E-8 9.70E-6 1,2,3,4,6,7,8-HPCDF 4.10E-7 1.10E-6 8.20E-7 3.50E-6 1.20E-7 9.40E-6 1,2,3,4,7,8,9-HPCDF 3.40E-8 7.90E-8 6.90E-8 6.10E-7 8.74E-12a 1.70E-6 1,2,3,4,7,8-HXCDD 6.30E-8 1.50E-7 9.80E-8 2.50E-7 9.37E-12a 7.60E-7 1,2,3,4,7,8-HXCDF 3.80E-7 1.10E-6 7.70E-7 2.70E-6 7.00E-8 8.00E-6 1,2,3,6,7,8-HXCDD 1.40E-7 3.10E-7 2.60E-7 6.70E-7 9.24E-12a 2.20E-6 1,2,3,6,7,8-HXCDF 1.40E-7 3.70E-7 2.70E-7 8.70E-7 2.60E-8 2.40E-6 1,2,3,7,8,9-HXCDD 1.60E-7 5.20E-7 3.30E-7 8.60E-7 8.89E-12a 2.50E-6 1,2,3,7,8,9-HXCDF 8.58E-12a 2.09E-11a 2.23E-11a 6.28E-11a 4.79E-12a 1.87E-10a 1,2,3,7,8-PECDD 7.90E-8 2.40E-7 1.50E-7 3.80E-7 1.24E-11a 1.10E-6 1,2,3,7,8-PECDF 1.10E-7 2.50E-7 1.80E-7 7.10E-7 7.33E-12a 2.10E-6
2,3,4,6,7,8-HXCDF 1.80E-7 5.20E-7 3.40E-7 7.40E-7 4.43E-12a 2.00E-6 2,3,4,7,8-PECDF 1.90E-7 5.20E-7 3.60E-7 7.40E-7 2.00E-8 2.20E-6
2,3,7,8-TCDD 5.90E-12a 5.14E-12a 4.80E-8 6.80E-8 8.05E-12a 2.40E-7 2,3,7,8-TCDF 1.00E-7 2.70E-7 1.90E-7 4.90E-7 2.00E-8 1.50E-6
OCDD 4.20E-7 1.30E-6 9.80E-7 3.60E-6 1.30E-7 1.00E-5 OCDF 9.50E-8 2.90E-7 2.80E-7 2.50E-6 6.80E-8 6.90E-6

USACHPPM Report No. 47-MA-08PV-08/AFIOH Report No. IOH-RS-BR-TR-2008-0001, May 08
F–4
Table F–1. Ambient Air TO-9 Methodology Samples (continued) Sample
Identification Number IRQ_BAL_
TO09_02070_99 IRQ_BAL_
TO09_03070_99 IRQ_BAL_
TO09_01070_99 IRQ_BAL_
TO09_01071_00 IRQ_BAL_
TO09_03071_00 IRQ_BAL_
TO09_02071_00 Collection Date 4/9/2007 4/9/2007 4/9/2007 4/10/2007 4/10/2007 4/10/2007
COPC µg/m3 µg/m3 µg/m3 µg/m3 µg/m3 µg/m3 1,2,3,4,6,7,8-HPCDD 5.40E-7 4.80E-7 4.90E-7 1.40E-6 3.10E-7 3.40E-7 1,2,3,4,6,7,8-HPCDF 1.10E-6 1.20E-6 1.00E-6 1.50E-6 4.90E-7 8.20E-7 1,2,3,4,7,8,9-HPCDF 1.60E-7 1.80E-7 1.50E-7 2.00E-7 4.10E-8 6.20E-8 1,2,3,4,7,8-HXCDD 9.20E-8 8.70E-8 7.10E-8 1.50E-7 3.30E-8 4.70E-8 1,2,3,4,7,8-HXCDF 1.20E-6 1.20E-6 9.70E-7 1.30E-6 3.80E-7 6.20E-7 1,2,3,6,7,8-HXCDD 1.50E-7 1.20E-7 1.40E-7 3.00E-7 6.20E-8 9.00E-8 1,2,3,6,7,8-HXCDF 5.60E-7 6.00E-7 4.50E-7 4.50E-7 1.70E-7 2.40E-7 1,2,3,7,8,9-HXCDD 2.10E-7 2.10E-7 2.10E-7 4.60E-7 9.30E-8 1.30E-7 1,2,3,7,8,9-HXCDF 2.99E-11a 3.36E-11a 3.30E-8 2.03E-11a 1.18E-11a 5.43E-12a 1,2,3,7,8-PECDD 1.10E-7 1.20E-7 8.90E-8 1.90E-7 3.30E-8 5.01E-12a 1,2,3,7,8-PECDF 4.30E-7 4.90E-7 2.90E-7 2.90E-7 1.30E-7 1.90E-7
2,3,4,6,7,8-HXCDF 4.00E-7 4.00E-7 3.50E-7 5.90E-7 1.70E-7 2.40E-7 2,3,4,7,8-PECDF 6.40E-7 6.50E-7 4.80E-7 5.90E-7 1.90E-7 2.80E-7
2,3,7,8-TCDD 2.30E-8 2.60E-8 1.80E-8 4.40E-8 2.77E-13a 2.59E-12a 2,3,7,8-TCDF 2.30E-7 2.50E-7 1.70E-7 3.10E-7 9.90E-8 1.70E-7
OCDD 4.00E-7 4.00E-7 3.90E-7 1.10E-6 3.00E-7 3.80E-7 OCDF 3.30E-7 3.60E-7 3.00E-7 7.00E-7 1.40E-7 2.30E-7

USACHPPM Report No. 47-MA-08PV-08/AFIOH Report No. IOH-RS-BR-TR-2008-0001, May 08
F–5
Table F–1. Ambient Air TO-9 Methodology Samples (continued) Sample
Identification Number IRQ_BAL_
TO09_02071_01 IRQ_BAL_
TO09_01071_01 IRQ_BAL_
TO09_03071_01 IRQ_BAL_
TO09_02071_03 IRQ_BAL_
TO09_01071_03 IRQ_BAL_
TO09_01070_10 Collection Date 4/11/2007 4/11/2007 4/11/2007 4/13/2007 4/13/2007 4/13/2007
COPC µg/m3 µg/m3 µg/m3 µg/m3 µg/m3 µg/m3 1,2,3,4,6,7,8-HPCDD 2.50E-7 9.70E-7 4.86E-13a 7.70E-7 4.30E-8 1.20E-6 1,2,3,4,6,7,8-HPCDF 2.40E-7 8.90E-7 1.40E-7 7.20E-7 1.10E-7 1.00E-6 1,2,3,4,7,8,9-HPCDF 2.30E-8 1.00E-7 4.99E-12a 6.60E-8 1.06E-12a 1.10E-7 1,2,3,4,7,8-HXCDD 1.80E-8 7.80E-8 1.65E-12a 7.30E-8 1.36E-13a 1.00E-7 1,2,3,4,7,8-HXCDF 1.80E-7 7.80E-7 1.10E-7 6.80E-7 8.60E-8 1.00E-6 1,2,3,6,7,8-HXCDD 4.40E-8 2.20E-7 1.56E-12a 1.60E-7 1.10E-8 2.80E-7 1,2,3,6,7,8-HXCDF 7.00E-8 2.80E-7 2.49E-12a 2.40E-7 3.80E-8 3.70E-7 1,2,3,7,8,9-HXCDD 6.90E-8 2.70E-7 1.56E-12a 2.60E-7 1.31E-13a 3.60E-7 1,2,3,7,8,9-HXCDF 8.56E-12a 2.26E-11a 2.56E-12a 2.94E-11a 5.66E-12a 4.02E-11a 1,2,3,7,8-PECDD 2.40E-8 1.20E-7 1.10E-8 1.10E-7 3.18E-13a 1.40E-7 1,2,3,7,8-PECDF 6.10E-8 2.20E-7 4.00E-8 1.70E-7 4.10E-8 3.10E-7
2,3,4,6,7,8-HXCDF 9.40E-8 3.50E-7 4.60E-8 3.10E-7 3.20E-8 4.80E-7 2,3,4,7,8-PECDF 9.70E-8 3.70E-7 6.80E-8 3.40E-7 5.47E-12a 5.20E-7
2,3,7,8-TCDD 3.18E-13a 3.00E-8 2.10E-13a 4.20E-8 5.55E-13a 3.80E-8 2,3,7,8-TCDF 6.60E-8 1.80E-7 4.10E-8 1.70E-7 2.40E-8 2.80E-7
OCDD 2.90E-7 8.20E-7 1.40E-7 7.60E-7 7.50E-8 1.20E-6 OCDF 1.10E-7 3.10E-7 5.30E-8 1.90E-7 2.40E-8 2.30E-7

USACHPPM Report No. 47-MA-08PV-08/AFIOH Report No. IOH-RS-BR-TR-2008-0001, May 08
F–6
Table F–1. Ambient Air TO-9 Methodology Samples (continued) Sample
Identification Number IRQ_BAL_
TO09_04071_04 IRQ_BAL_
TO09_02071_04 IRQ_BAL_
TO09_03071_04 Collection Date 4/14/2007 4/14/2007 4/14/2007
COPC µg/m3 µg/m3 µg/m3 1,2,3,4,6,7,8-HPCDD 1.00E-6 6.50E-8 1.20E-6 1,2,3,4,6,7,8-HPCDF 8.40E-7 1.00E-7 1.10E-6 1,2,3,4,7,8,9-HPCDF 9.70E-8 2.14E-12a 1.30E-7 1,2,3,4,7,8-HXCDD 6.30E-8 3.13E-13a 9.50E-8 1,2,3,4,7,8-HXCDF 6.50E-7 8.10E-8 9.50E-7 1,2,3,6,7,8-HXCDD 1.90E-7 2.99E-13a 2.60E-7 1,2,3,6,7,8-HXCDF 2.30E-7 2.90E-8 3.20E-7 1,2,3,7,8,9-HXCDD 2.70E-7 2.96E-13a 4.10E-7 1,2,3,7,8,9-HXCDF 1.16E-11a 3.42E-12a 2.30E-8 1,2,3,7,8-PECDD 8.80E-8 5.60E-9 1.40E-7 1,2,3,7,8-PECDF 1.40E-7 2.80E-8 2.10E-7
2,3,4,6,7,8-HXCDF 3.20E-7 3.20E-8 4.80E-7 2,3,4,7,8-PECDF 3.10E-7 3.40E-8 4.00E-7
2,3,7,8-TCDD 3.90E-8 6.27E-13a 3.78E-12a 2,3,7,8-TCDF 1.40E-7 2.30E-8 2.20E-7
OCDD 1.60E-6 7.80E-8 1.40E-6 OCDF 2.90E-7 3.90E-8 4.00E-7
Note: a One-half of sample detection limit due to non-detection b PECDD: pentachlorodibenzo-p-dioxin
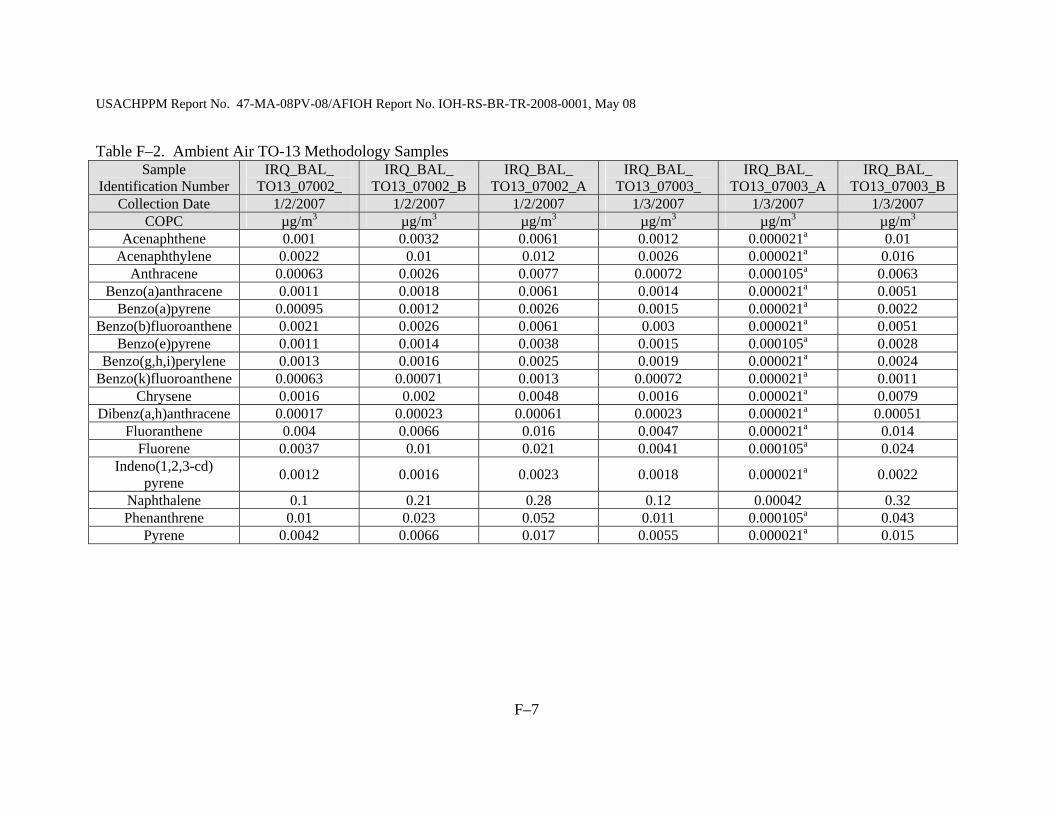
USACHPPM Report No. 47-MA-08PV-08/AFIOH Report No. IOH-RS-BR-TR-2008-0001, May 08
F–7
Table F–2. Ambient Air TO-13 Methodology Samples Sample
Identification Number IRQ_BAL_
TO13_07002_ IRQ_BAL_
TO13_07002_B IRQ_BAL_
TO13_07002_A IRQ_BAL_
TO13_07003_ IRQ_BAL_
TO13_07003_A IRQ_BAL_
TO13_07003_B Collection Date 1/2/2007 1/2/2007 1/2/2007 1/3/2007 1/3/2007 1/3/2007
COPC µg/m3 µg/m3 µg/m3 µg/m3 µg/m3 µg/m3 Acenaphthene 0.001 0.0032 0.0061 0.0012 0.000021a 0.01
Acenaphthylene 0.0022 0.01 0.012 0.0026 0.000021a 0.016 Anthracene 0.00063 0.0026 0.0077 0.00072 0.000105a 0.0063
Benzo(a)anthracene 0.0011 0.0018 0.0061 0.0014 0.000021a 0.0051 Benzo(a)pyrene 0.00095 0.0012 0.0026 0.0015 0.000021a 0.0022
Benzo(b)fluoroanthene 0.0021 0.0026 0.0061 0.003 0.000021a 0.0051 Benzo(e)pyrene 0.0011 0.0014 0.0038 0.0015 0.000105a 0.0028
Benzo(g,h,i)perylene 0.0013 0.0016 0.0025 0.0019 0.000021a 0.0024 Benzo(k)fluoroanthene 0.00063 0.00071 0.0013 0.00072 0.000021a 0.0011
Chrysene 0.0016 0.002 0.0048 0.0016 0.000021a 0.0079 Dibenz(a,h)anthracene 0.00017 0.00023 0.00061 0.00023 0.000021a 0.00051
Fluoranthene 0.004 0.0066 0.016 0.0047 0.000021a 0.014 Fluorene 0.0037 0.01 0.021 0.0041 0.000105a 0.024
Indeno(1,2,3-cd) pyrene 0.0012 0.0016 0.0023 0.0018 0.000021a 0.0022
Naphthalene 0.1 0.21 0.28 0.12 0.00042 0.32 Phenanthrene 0.01 0.023 0.052 0.011 0.000105a 0.043
Pyrene 0.0042 0.0066 0.017 0.0055 0.000021a 0.015
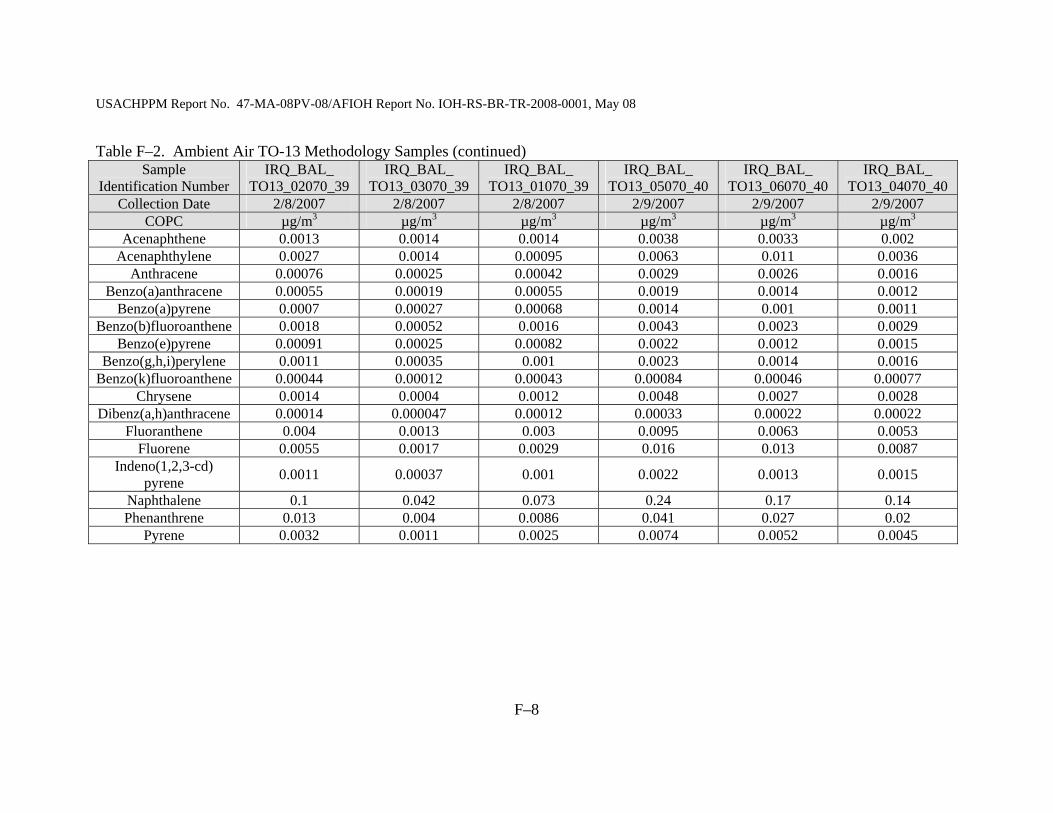
USACHPPM Report No. 47-MA-08PV-08/AFIOH Report No. IOH-RS-BR-TR-2008-0001, May 08
F–8
Table F–2. Ambient Air TO-13 Methodology Samples (continued) Sample
Identification Number IRQ_BAL_
TO13_02070_39 IRQ_BAL_
TO13_03070_39 IRQ_BAL_
TO13_01070_39 IRQ_BAL_
TO13_05070_40 IRQ_BAL_
TO13_06070_40 IRQ_BAL_
TO13_04070_40 Collection Date 2/8/2007 2/8/2007 2/8/2007 2/9/2007 2/9/2007 2/9/2007
COPC µg/m3 µg/m3 µg/m3 µg/m3 µg/m3 µg/m3 Acenaphthene 0.0013 0.0014 0.0014 0.0038 0.0033 0.002
Acenaphthylene 0.0027 0.0014 0.00095 0.0063 0.011 0.0036 Anthracene 0.00076 0.00025 0.00042 0.0029 0.0026 0.0016
Benzo(a)anthracene 0.00055 0.00019 0.00055 0.0019 0.0014 0.0012 Benzo(a)pyrene 0.0007 0.00027 0.00068 0.0014 0.001 0.0011
Benzo(b)fluoroanthene 0.0018 0.00052 0.0016 0.0043 0.0023 0.0029 Benzo(e)pyrene 0.00091 0.00025 0.00082 0.0022 0.0012 0.0015
Benzo(g,h,i)perylene 0.0011 0.00035 0.001 0.0023 0.0014 0.0016 Benzo(k)fluoroanthene 0.00044 0.00012 0.00043 0.00084 0.00046 0.00077
Chrysene 0.0014 0.0004 0.0012 0.0048 0.0027 0.0028 Dibenz(a,h)anthracene 0.00014 0.000047 0.00012 0.00033 0.00022 0.00022
Fluoranthene 0.004 0.0013 0.003 0.0095 0.0063 0.0053 Fluorene 0.0055 0.0017 0.0029 0.016 0.013 0.0087
Indeno(1,2,3-cd) pyrene 0.0011 0.00037 0.001 0.0022 0.0013 0.0015
Naphthalene 0.1 0.042 0.073 0.24 0.17 0.14 Phenanthrene 0.013 0.004 0.0086 0.041 0.027 0.02
Pyrene 0.0032 0.0011 0.0025 0.0074 0.0052 0.0045
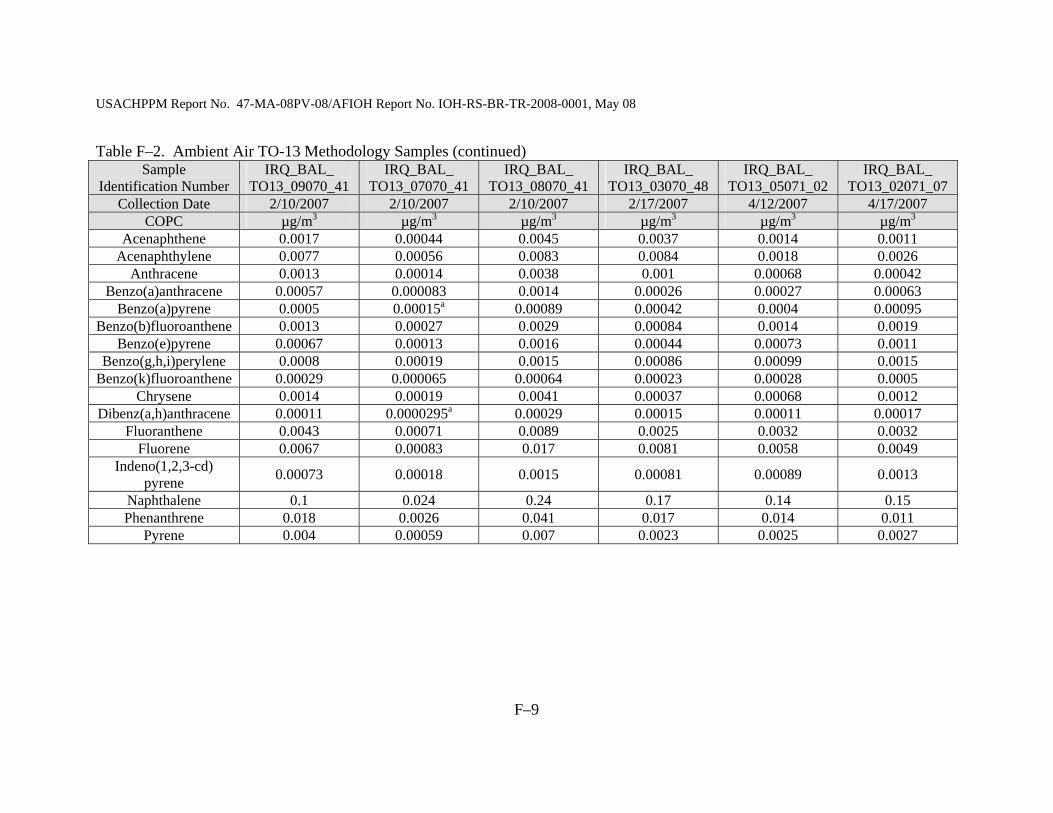
USACHPPM Report No. 47-MA-08PV-08/AFIOH Report No. IOH-RS-BR-TR-2008-0001, May 08
F–9
Table F–2. Ambient Air TO-13 Methodology Samples (continued) Sample
Identification Number IRQ_BAL_
TO13_09070_41 IRQ_BAL_
TO13_07070_41 IRQ_BAL_
TO13_08070_41 IRQ_BAL_
TO13_03070_48 IRQ_BAL_
TO13_05071_02 IRQ_BAL_
TO13_02071_07 Collection Date 2/10/2007 2/10/2007 2/10/2007 2/17/2007 4/12/2007 4/17/2007
COPC µg/m3 µg/m3 µg/m3 µg/m3 µg/m3 µg/m3 Acenaphthene 0.0017 0.00044 0.0045 0.0037 0.0014 0.0011
Acenaphthylene 0.0077 0.00056 0.0083 0.0084 0.0018 0.0026 Anthracene 0.0013 0.00014 0.0038 0.001 0.00068 0.00042
Benzo(a)anthracene 0.00057 0.000083 0.0014 0.00026 0.00027 0.00063 Benzo(a)pyrene 0.0005 0.00015a 0.00089 0.00042 0.0004 0.00095
Benzo(b)fluoroanthene 0.0013 0.00027 0.0029 0.00084 0.0014 0.0019 Benzo(e)pyrene 0.00067 0.00013 0.0016 0.00044 0.00073 0.0011
Benzo(g,h,i)perylene 0.0008 0.00019 0.0015 0.00086 0.00099 0.0015 Benzo(k)fluoroanthene 0.00029 0.000065 0.00064 0.00023 0.00028 0.0005
Chrysene 0.0014 0.00019 0.0041 0.00037 0.00068 0.0012 Dibenz(a,h)anthracene 0.00011 0.0000295a 0.00029 0.00015 0.00011 0.00017
Fluoranthene 0.0043 0.00071 0.0089 0.0025 0.0032 0.0032 Fluorene 0.0067 0.00083 0.017 0.0081 0.0058 0.0049
Indeno(1,2,3-cd) pyrene 0.00073 0.00018 0.0015 0.00081 0.00089 0.0013
Naphthalene 0.1 0.024 0.24 0.17 0.14 0.15 Phenanthrene 0.018 0.0026 0.041 0.017 0.014 0.011
Pyrene 0.004 0.00059 0.007 0.0023 0.0025 0.0027

USACHPPM Report No. 47-MA-08PV-08/AFIOH Report No. IOH-RS-BR-TR-2008-0001, May 08
F–10
Table F–2. Ambient Air TO-13 Methodology Samples (continued) Sample
Identification Number IRQ_BAL_
TO13_01071_07 IRQ_BAL_
TO13_03071_07 IRQ_BAL_
TO13_02071_08 IRQ_BAL_
TO13_07071_08 IRQ_BAL_
TO13_03071_08 IRQ_BAL_
TO13_02071_09 Collection Date 4/17/2007 4/17/2007 4/18/2007 4/18/2007 4/18/2007 4/19/2007
COPC µg/m3 µg/m3 µg/m3 µg/m3 µg/m3 µg/m3 Acenaphthene 0.0046 0.0018 0.00096 0.0012 0.0023 0.0018
Acenaphthylene 0.0094 0.015 0.0023 0.00081 0.0052 0.00096 Anthracene 0.004 0.0043 0.00048 0.00019 0.00076 0.00025
Benzo(a)anthracene 0.0028 0.00076 0.00035 0.00026 0.0000235a 0.0027 Benzo(a)pyrene 0.0016 0.00096 0.00037 0.00033 0.00012a 0.0011
Benzo(b)fluoroanthene 0.0049 0.0019 0.0011 0.00081 0.0000235a 0.0048 Benzo(e)pyrene 0.0029 0.0012 0.00058 0.00043 0.0000235a 0.0027
Benzo(g,h,i)perylene 0.0026 0.0017 0.00058 0.00047 0.0000235a 0.002 Benzo(k)fluoroanthene 0.00099 0.00049 0.00024 0.00016 0.0000235a 0.00096
Chrysene 0.0031 0.0012 0.00067 0.00052 0.00008 0.0031 Dibenz(a,h)anthracene 0.0006 0.00018 0.000081 0.000062 0.0000235a 0.00048
Fluoranthene 0.0064 0.0046 0.0027 0.002 0.0029 0.002 Fluorene 0.016 0.015 0.0042 0.0017 0.0071 0.0018
Indeno(1,2,3-cd) pyrene 0.0025 0.0014 0.00058 0.00048 0.0000235a 0.0016
Naphthalene 0.27 0.41 0.1 0.045 0.18 0.038 Phenanthrene 0.032 0.021 0.011 0.0057 0.016 0.0043
Pyrene 0.0055 0.0046 0.0017 0.0013 0.0016 0.0017
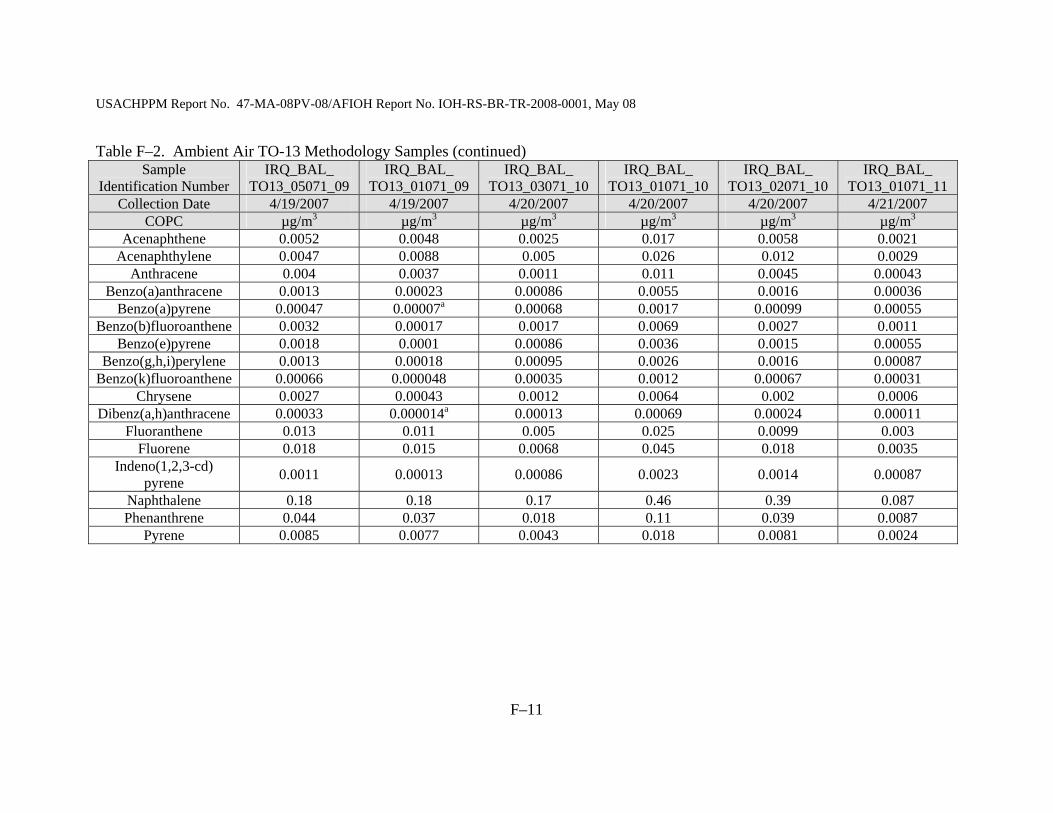
USACHPPM Report No. 47-MA-08PV-08/AFIOH Report No. IOH-RS-BR-TR-2008-0001, May 08
F–11
Table F–2. Ambient Air TO-13 Methodology Samples (continued) Sample
Identification Number IRQ_BAL_
TO13_05071_09 IRQ_BAL_
TO13_01071_09 IRQ_BAL_
TO13_03071_10 IRQ_BAL_
TO13_01071_10 IRQ_BAL_
TO13_02071_10 IRQ_BAL_
TO13_01071_11 Collection Date 4/19/2007 4/19/2007 4/20/2007 4/20/2007 4/20/2007 4/21/2007
COPC µg/m3 µg/m3 µg/m3 µg/m3 µg/m3 µg/m3 Acenaphthene 0.0052 0.0048 0.0025 0.017 0.0058 0.0021
Acenaphthylene 0.0047 0.0088 0.005 0.026 0.012 0.0029 Anthracene 0.004 0.0037 0.0011 0.011 0.0045 0.00043
Benzo(a)anthracene 0.0013 0.00023 0.00086 0.0055 0.0016 0.00036 Benzo(a)pyrene 0.00047 0.00007a 0.00068 0.0017 0.00099 0.00055
Benzo(b)fluoroanthene 0.0032 0.00017 0.0017 0.0069 0.0027 0.0011 Benzo(e)pyrene 0.0018 0.0001 0.00086 0.0036 0.0015 0.00055
Benzo(g,h,i)perylene 0.0013 0.00018 0.00095 0.0026 0.0016 0.00087 Benzo(k)fluoroanthene 0.00066 0.000048 0.00035 0.0012 0.00067 0.00031
Chrysene 0.0027 0.00043 0.0012 0.0064 0.002 0.0006 Dibenz(a,h)anthracene 0.00033 0.000014a 0.00013 0.00069 0.00024 0.00011
Fluoranthene 0.013 0.011 0.005 0.025 0.0099 0.003 Fluorene 0.018 0.015 0.0068 0.045 0.018 0.0035
Indeno(1,2,3-cd) pyrene 0.0011 0.00013 0.00086 0.0023 0.0014 0.00087
Naphthalene 0.18 0.18 0.17 0.46 0.39 0.087 Phenanthrene 0.044 0.037 0.018 0.11 0.039 0.0087
Pyrene 0.0085 0.0077 0.0043 0.018 0.0081 0.0024
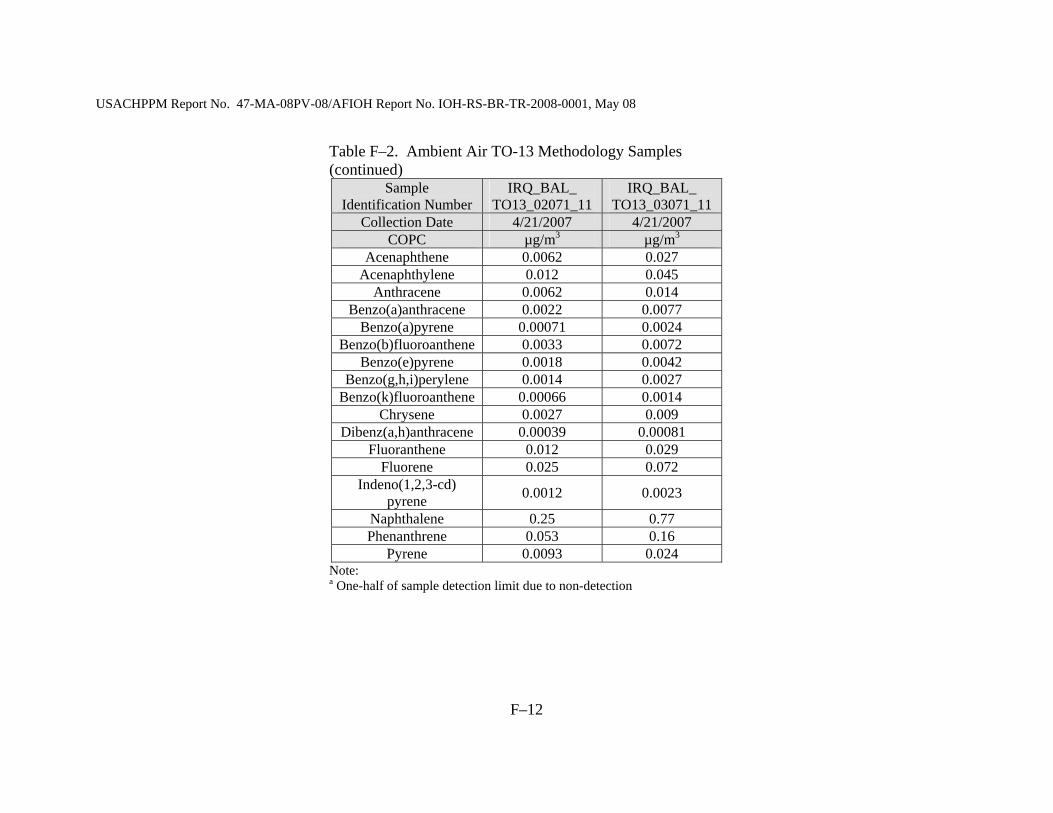
USACHPPM Report No. 47-MA-08PV-08/AFIOH Report No. IOH-RS-BR-TR-2008-0001, May 08
F–12
Table F–2. Ambient Air TO-13 Methodology Samples (continued)
Sample Identification Number
IRQ_BAL_ TO13_02071_11
IRQ_BAL_ TO13_03071_11
Collection Date 4/21/2007 4/21/2007 COPC µg/m3 µg/m3
Acenaphthene 0.0062 0.027 Acenaphthylene 0.012 0.045
Anthracene 0.0062 0.014 Benzo(a)anthracene 0.0022 0.0077
Benzo(a)pyrene 0.00071 0.0024 Benzo(b)fluoroanthene 0.0033 0.0072
Benzo(e)pyrene 0.0018 0.0042 Benzo(g,h,i)perylene 0.0014 0.0027
Benzo(k)fluoroanthene 0.00066 0.0014 Chrysene 0.0027 0.009
Dibenz(a,h)anthracene 0.00039 0.00081 Fluoranthene 0.012 0.029
Fluorene 0.025 0.072 Indeno(1,2,3-cd)
pyrene 0.0012 0.0023 Naphthalene 0.25 0.77 Phenanthrene 0.053 0.16
Pyrene 0.0093 0.024 Note: a One-half of sample detection limit due to non-detection

USACHPPM Report No. 47-MA-08PV-08/AFIOH Report No. IOH-RS-BR-TR-2008-0001, May 08
F–13
Table F–3. Ambient Air TO-14 Methodology Samples Sample
Identification Number IRQ_BAL_
TO14_02007_P1 IRQ_BAL_
TO14_02007_P2 IRQ_BAL_
TO14_02007_P3 IRQ_BAL_
TO14_03007_P4 IRQ_BAL_
TO14_03007_P5 IRQ_BAL_
TO14_03007_ Collection Date 1/2/2007 1/2/2007 1/2/2007 1/3/2007 1/3/2007 1/3/2007
COPC µg/m3 µg/m3 µg/m3 µg/m3 µg/m3 µg/m3 Acetone 13 10 12 22 5.6 8.5 Benzene 16 1.65a 5.9 33 1.65a 9.1
Carbon Disulfide 1.6a 6 3.5 1.6a 1.6a 1.6a Chlorodifluoromethane 1.8a 1.8a 7.9 1.8a 1.8a 13
Chloromethane 1.05a 1.05a 1.05a 3.6 1.05a 1.05a Ethylbenzene 8.4 2.2a 2.2a 17 2.2a 4.9
Hexane 5 1.8a 5 5.4 1.8a 3.6 m/p-Xylene 2.2a 2.2a 6.2 2.2a 2.2a 4.4
Methylene Chloride 6.4 1.75 1.75 1.75 1.75 1.75 Pentane 1.2 0.76 1.1 1.3 0.46 0.84
Propylene 7.2 3.9 4.4 13 1.8 6 Styrene 9.1 2.15a 2.15a 20 2.15a 6.1 Toluene 15 7.9 20 22 2.65a 15

USACHPPM Report No. 47-MA-08PV-08/AFIOH Report No. IOH-RS-BR-TR-2008-0001, May 08
F–14
Table F–3. Ambient Air TO-14 Methodology Samples (continued) Sample
Identification Number BAL_IRA_
TO14_07039_P3 BAL_IRA_
TO14_07039_P2 BAL_IRQ_
TO14_07045_P2 BAL_IRQ_
TO14_07045_P BAL_IRQ_
TO14_07045_P1 BAL_IRQ_
TO14_07046_P2 Collection Date 2/8/2007 2/8/2007 2/14/2007 2/14/2007 2/14/2007 2/15/2007
COPC µg/m3 µg/m3 µg/m3 µg/m3 µg/m3 µg/m3 Acetone 8.5 12 15 23 18 16 Benzene 1.65a 1.65a 1.65a 1.65a 1.65a 4.9
Carbon Disulfide 1.6a 1.6a 1.6a 1.6a 1.6a 1.6a Chlorodifluoromethane 1.8a 1.8a 1.8a 1.8a 1.8a 1.8a
Chloromethane 1.05a 1.05a 1.05a 1.05a 1.05a 1.05a Ethylbenzene 2.2a 2.2a 2.2a 2.2a 2.2a 2.2a
Hexane 1.8a 1.8a 1.8a 1.8a 1.8a 1.8a m/p-Xylene 2.2a 2.2a 2.2a 2.2a 2.2a 5.3
Methylene Chloride 1.75 1.75 1.75 1.75 1.75 1.75 Pentane 0.21a 0.46 0.21a 0.46 0.63 0.76
Propylene 2.1 2.3 0.9a 0.9a 0.9a 0.9a Styrene 2.15a 2.15a 2.15a 2.15a 2.15a 2.15a Toluene 2.65a 2.65a 2.65a 2.65a 7.4 12

USACHPPM Report No. 47-MA-08PV-08/AFIOH Report No. IOH-RS-BR-TR-2008-0001, May 08
F–15
Table F–3. Ambient Air TO-14 Methodology Samples (continued) Sample
Identification Number BAL_IRQ_
TO14_07046_P BAL_IRQ_
TO14_07046_P1 BAL_IRQ_
TO14_07047_P1 BAL_IRQ_
TO14_07047_P2 BAL_IRQ_
TO14_07048_P BAL_IRQ_
TO14_07048_P1 Collection Date 2/15/2007 2/15/2007 2/16/2007 2/16/2007 2/17/2007 2/17/2007
COPC µg/m3 µg/m3 µg/m3 µg/m3 µg/m3 µg/m3 Acetone 41 10 11 7 7.5 5.1 Benzene 1.65a 1.65a 4.9 1.65a 1.65a 1.65a
Carbon Disulfide 1.6a 1.6a 1.6a 1.6a 1.6a 1.6a Chlorodifluoromethane 1.8a 1.8a 1.8a 1.8a 1.8a 1.8a
Chloromethane 1.05a 1.05a 1.05a 1.05a 1.05a 1.05a Ethylbenzene 2.2a 2.2a 2.2a 2.2a 2.2a 2.2a
Hexane 1.8a 1.8a 1.8a 1.8a 1.8a 1.8a m/p-Xylene 2.2a 2.2a 2.2a 2.2a 2.2a 2.2a
Methylene Chloride 1.75 1.75 1.75 1.75 1.75 1.75 Pentane 0.46 0.67 0.5 0.21a 0.21a 0.21a
Propylene 0.9a 0.9a 0.9a 0.9a 0.9a 0.9a Styrene 2.15a 2.15a 2.15a 2.15a 2.15a 2.15a Toluene 5.8 6.9 9 2.65a 2.65a 2.65a

USACHPPM Report No. 47-MA-08PV-08/AFIOH Report No. IOH-RS-BR-TR-2008-0001, May 08
F–16
Table F–3. Ambient Air TO-14 Methodology Samples (continued) Sample
Identification Number BAL_IRQ_
TO14_07048_P2 BAL_IRQ_
TO14_07051_P BAL_IRQ_
TO14_07052_P BAL_IRQ_
TO14_07052_P2 BAL_IRQ_
TO14_07052_P1 BAL_IRQ_
TO14_07053_P1 Collection Date 2/17/2007 2/20/2007 2/21/2007 2/21/2007 2/21/2007 2/22/2007
COPC µg/m3 µg/m3 µg/m3 µg/m3 µg/m3 µg/m3 Acetone 7 12 12 13 10 16 Benzene 1.65a 1.65a 4.2 1.65a 1.65a 13
Carbon Disulfide 1.6a 1.6a 1.6a 1.6a 1.6a 1.6a Chlorodifluoromethane 1.8a 1.8a 1.8a 1.8a 1.8a 1.8a
Chloromethane 1.05a 1.05a 1.05a 1.05a 1.05a 2.1 Ethylbenzene 2.2a 2.2a 2.2a 2.2a 2.2a 6.2
Hexane 1.8a 1.8a 1.8a 1.8a 1.8a 1.8a m/p-Xylene 2.2a 2.2a 2.2a 2.2a 2.2a 4.9
Methylene Chloride 1.75 1.75 1.75 1.75 1.75 6.7 Pentane 0.21a 0.21a 0.67 0.46 0.21a 0.5
Propylene 0.9a 0.9a 0.9a 0.9a 0.9a 0.9a Styrene 2.15a 2.15a 2.15a 2.15a 2.15a 2.15a Toluene 2.65a 2.65a 14 6.3 5.8 14

USACHPPM Report No. 47-MA-08PV-08/AFIOH Report No. IOH-RS-BR-TR-2008-0001, May 08
F–17
Table F–3. Ambient Air TO-14 Methodology Samples (continued) Sample
Identification Number IRQ_BAL_
TO14_07099_P2 IRQ_BAL_
TO14_07099_P1 IRQ_BAL_
TO14_07099_P3 IRQ_BAL_
TO14_07100_P1 IRQ_BAL_
TO14_07100_P3 IRQ_BAL_
TO14_07100_P2 Collection Date 4/9/2007 4/9/2007 4/9/2007 4/10/2007 4/10/2007 4/10/2007
COPC ug/m3 ug/m3 ug/m3 ug/m3 ug/m3 ug/m3 Acetone 14 15 15 53 15 44 Benzene 3.3 1.65a 4.9 1.65a 1.65a 4.2
Carbon Disulfide 1.6a 1.6a 1.6a 1.6a 1.6a 1.6a Chlorodifluoromethane 1.8a 1.8a 6.8 1.8a 4 1.8a
Chloromethane 2.1 2.1 2.3 2.5 1.05a 1.05a Ethylbenzene 2.2a 2.2a 4.9 2.2a 2.2a 2.2a
Hexane 1.8a 1.8a 7.2 1.8a 1.8a 1.8a m/p-Xylene 2.2a 2.2a 11 2.2a 2.2a 2.2a
Methylene Chloride 1.75 5.3 5.3 1.75 1.75 1.75 Pentane 0.84 0.55 1.6 0.42 0.21a 0.21a
Propylene 0.9a 0.9a 0.9a 0.9a 0.9a 0.9a Styrene 2.15a 2.15a 2.15a 2.15a 2.15a 2.15a Toluene 6.3 5.3 18 5.8 5.8 2.65a

USACHPPM Report No. 47-MA-08PV-08/AFIOH Report No. IOH-RS-BR-TR-2008-0001, May 08
F–18
Table F–3. Ambient Air TO-14 Methodology Samples (continued) Sample
Identification Number IRQ_BAL_
TO14_07103_P3 IRQ_BAL_
TO14_07103_P2 IRQ_BAL_
TO14_07103_P1 IRQ_BAL_
TO14_07104_P1 IRQ_BAL_
TO14_07104_P2 IRQ_BAL_
TO14_07104_P3 Collection Date 4/13/2007 4/13/2007 4/13/2007 4/14/2007 4/14/2007 4/14/2007
COPC µg/m3 µg/m3 µg/m3 µg/m3 µg/m3 µg/m3 Acetone 11 11 11 9.2 360 11 Benzene 3.6 3.9 1.65a 1.65a 1.65a 1.65a
Carbon Disulfide 1.6a 1.6a 1.6a 1.6a 230 1.6a Chlorodifluoromethane 26 1.8a 1.8a 1.8a 1.8a 4
Chloromethane 1.05a 1.05a 1.05a 1.05a 1.05a 1.05a Ethylbenzene 2.2a 2.2a 2.2a 2.2a 2.2a 2.2a
Hexane 1.8a 1.8a 1.8a 1.8a 39 1.8a m/p-Xylene 2.2a 2.2a 2.2a 2.2a 2.2a 2.2a
Methylene Chloride 1.75 1.75 1.75 1.75 120 1.75 Pentane 0.88 0.55 0.76 0.21a 13 0.21a
Propylene 0.9a 0.9a 0.9a 0.9a 0.9a 0.9a Styrene 2.15a 2.15a 2.15a 2.15a 2.15a 2.15a Toluene 8.5 2.65a 2.65a 2.65a 79 2.65a

USACHPPM Report No. 47-MA-08PV-08/AFIOH Report No. IOH-RS-BR-TR-2008-0001, May 08
F–19
Table F–3. Ambient Air TO-14 Methodology Samples (continued) Sample
Identification Number IRQ_BAL_
TO14_07107_P1 IRQ_BAL_
TO14_07107_P2 IRQ_BAL_
TO14_07107_P IRQ_BAL_
TO14_07108_P IRQ_BAL_
TO14_07108_P2 IRQ_BAL_
TO14_07108_P1 Collection Date 4/17/2007 4/17/2007 4/17/2007 4/18/2007 4/18/2007 4/18/2007
COPC µg/m3 µg/m3 µg/m3 µg/m3 µg/m3 µg/m3 Acetone 15 12 140 11 12 17 Benzene 1.65a 7.2 4.2 1.65a 1.65a 1.65a
Carbon Disulfide 1.6a 1.6a 1.6a 1.6a 1.6a 1.6a Chlorodifluoromethane 1.8a 1.8a 1.8a 1.8a 1.8a 47
Chloromethane 1.05a 1.05a 1.05a 1.05a 1.05a 1.05a Ethylbenzene 2.2a 2.2a 2.2a 2.2a 2.2a 2.2a
Hexane 1.8a 1.8a 1.8a 1.8a 1.8a 1.8a m/p-Xylene 2.2a 2.2a 4.9 2.2a 2.2a 2.2a
Methylene Chloride 1.75 1.75 1.75 1.75 1.75 1.75 Pentane 0.59 0.55 0.71 0.21a 0.21a 0.21a
Propylene 0.9a 0.9a 0.9a 0.9a 0.9a 0.9a Styrene 2.15a 2.15a 2.15a 2.15a 2.15a 2.15a Toluene 2.65a 7.9 11 2.65a 2.65a 5.8
Note: a One-half of sample detection limit due to non-detection.
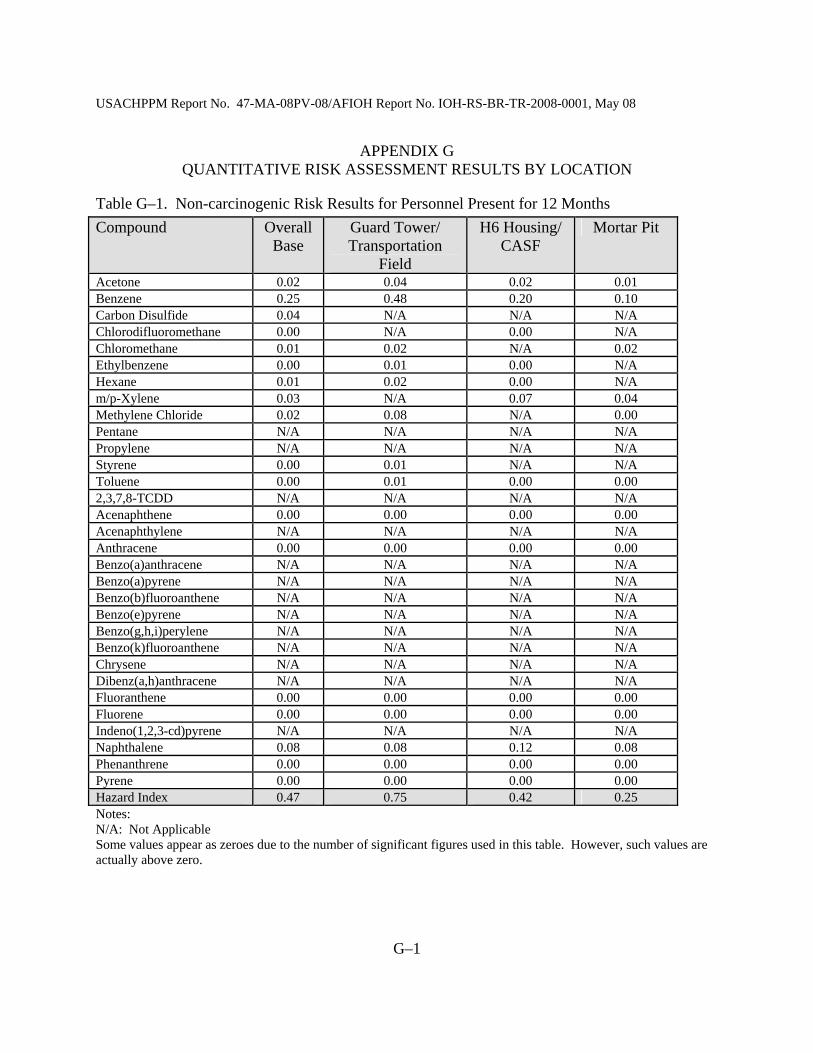
USACHPPM Report No. 47-MA-08PV-08/AFIOH Report No. IOH-RS-BR-TR-2008-0001, May 08
G–1
APPENDIX G QUANTITATIVE RISK ASSESSMENT RESULTS BY LOCATION
Table G–1. Non-carcinogenic Risk Results for Personnel Present for 12 Months Compound Overall
Base Guard Tower/ Transportation
Field
H6 Housing/ CASF
Mortar Pit
Acetone 0.02 0.04 0.02 0.01 Benzene 0.25 0.48 0.20 0.10 Carbon Disulfide 0.04 N/A N/A N/A Chlorodifluoromethane 0.00 N/A 0.00 N/A Chloromethane 0.01 0.02 N/A 0.02 Ethylbenzene 0.00 0.01 0.00 N/A Hexane 0.01 0.02 0.00 N/A m/p-Xylene 0.03 N/A 0.07 0.04 Methylene Chloride 0.02 0.08 N/A 0.00 Pentane N/A N/A N/A N/A Propylene N/A N/A N/A N/A Styrene 0.00 0.01 N/A N/A Toluene 0.00 0.01 0.00 0.00 2,3,7,8-TCDD N/A N/A N/A N/A Acenaphthene 0.00 0.00 0.00 0.00 Acenaphthylene N/A N/A N/A N/A Anthracene 0.00 0.00 0.00 0.00 Benzo(a)anthracene N/A N/A N/A N/A Benzo(a)pyrene N/A N/A N/A N/A Benzo(b)fluoroanthene N/A N/A N/A N/A Benzo(e)pyrene N/A N/A N/A N/A Benzo(g,h,i)perylene N/A N/A N/A N/A Benzo(k)fluoroanthene N/A N/A N/A N/A Chrysene N/A N/A N/A N/A Dibenz(a,h)anthracene N/A N/A N/A N/A Fluoranthene 0.00 0.00 0.00 0.00 Fluorene 0.00 0.00 0.00 0.00 Indeno(1,2,3-cd)pyrene N/A N/A N/A N/A Naphthalene 0.08 0.08 0.12 0.08 Phenanthrene 0.00 0.00 0.00 0.00 Pyrene 0.00 0.00 0.00 0.00 Hazard Index 0.47 0.75 0.42 0.25 Notes: N/A: Not Applicable Some values appear as zeroes due to the number of significant figures used in this table. However, such values are actually above zero.
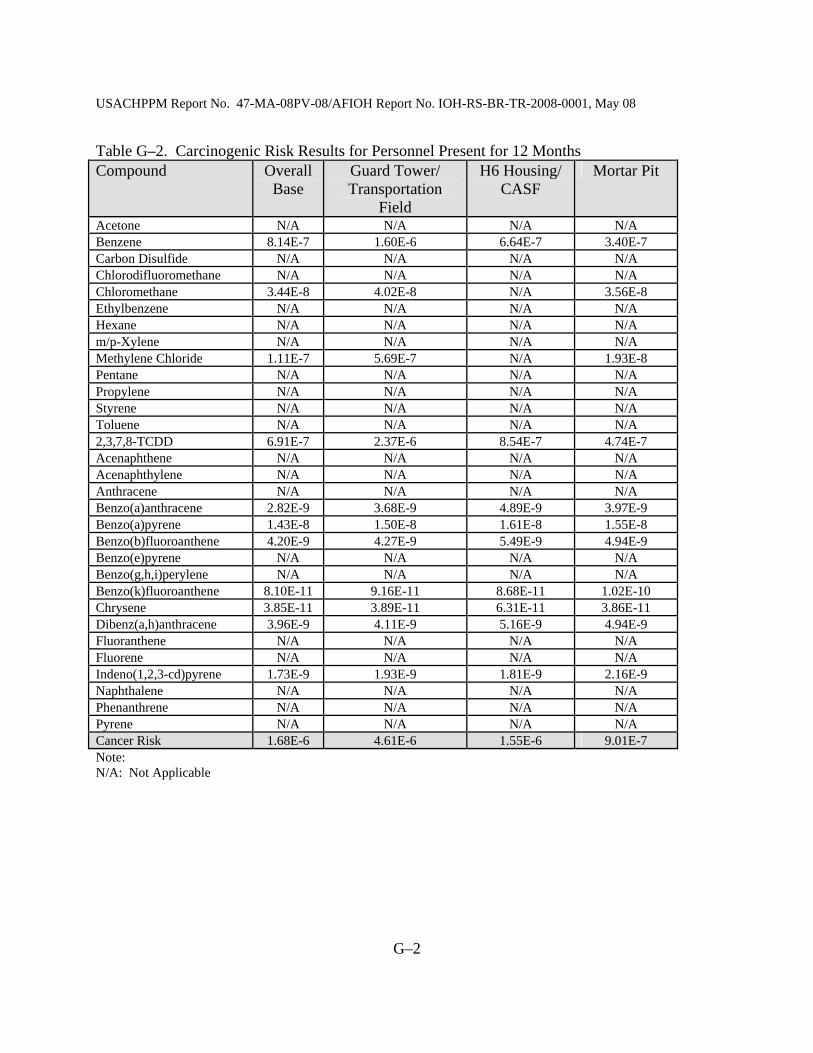
USACHPPM Report No. 47-MA-08PV-08/AFIOH Report No. IOH-RS-BR-TR-2008-0001, May 08
G–2
Table G–2. Carcinogenic Risk Results for Personnel Present for 12 Months Compound Overall
Base Guard Tower/ Transportation
Field
H6 Housing/ CASF
Mortar Pit
Acetone N/A N/A N/A N/A Benzene 8.14E-7 1.60E-6 6.64E-7 3.40E-7 Carbon Disulfide N/A N/A N/A N/A Chlorodifluoromethane N/A N/A N/A N/A Chloromethane 3.44E-8 4.02E-8 N/A 3.56E-8 Ethylbenzene N/A N/A N/A N/A Hexane N/A N/A N/A N/A m/p-Xylene N/A N/A N/A N/A Methylene Chloride 1.11E-7 5.69E-7 N/A 1.93E-8 Pentane N/A N/A N/A N/A Propylene N/A N/A N/A N/A Styrene N/A N/A N/A N/A Toluene N/A N/A N/A N/A 2,3,7,8-TCDD 6.91E-7 2.37E-6 8.54E-7 4.74E-7 Acenaphthene N/A N/A N/A N/A Acenaphthylene N/A N/A N/A N/A Anthracene N/A N/A N/A N/A Benzo(a)anthracene 2.82E-9 3.68E-9 4.89E-9 3.97E-9 Benzo(a)pyrene 1.43E-8 1.50E-8 1.61E-8 1.55E-8 Benzo(b)fluoroanthene 4.20E-9 4.27E-9 5.49E-9 4.94E-9 Benzo(e)pyrene N/A N/A N/A N/A Benzo(g,h,i)perylene N/A N/A N/A N/A Benzo(k)fluoroanthene 8.10E-11 9.16E-11 8.68E-11 1.02E-10 Chrysene 3.85E-11 3.89E-11 6.31E-11 3.86E-11 Dibenz(a,h)anthracene 3.96E-9 4.11E-9 5.16E-9 4.94E-9 Fluoranthene N/A N/A N/A N/A Fluorene N/A N/A N/A N/A Indeno(1,2,3-cd)pyrene 1.73E-9 1.93E-9 1.81E-9 2.16E-9 Naphthalene N/A N/A N/A N/A Phenanthrene N/A N/A N/A N/A Pyrene N/A N/A N/A N/A Cancer Risk 1.68E-6 4.61E-6 1.55E-6 9.01E-7 Note: N/A: Not Applicable

USACHPPM Report No. 47-MA-08PV-08/AFIOH Report No. IOH-RS-BR-TR-2008-0001, May 08
G–3
Table G–3. Non-Carcinogenic Risk Results for Personnel Present for 4 Months Compound Overall
Base Guard Tower/ Transportation
Field
H6 Housing/ CASF
Mortar Pit
Acetone 0.01 0.01 0.01 0.00 Benzene 0.08 0.16 0.07 0.03 Carbon Disulfide 0.01 N/A N/A N/A Chlorodifluoromethane 0.00 N/A 0.00 N/A Chloromethane 0.00 0.01 N/A 0.01 Ethylbenzene 0.00 0.00 0.00 N/A Hexane 0.00 0.01 0.00 N/A m/p-Xylene 0.01 N/A 0.02 0.01 Methylene Chloride 0.01 0.03 N/A 0.00 Pentane N/A N/A N/A N/A Propylene N/A N/A N/A N/A Styrene 0.00 0.00 N/A N/A Toluene 0.00 0.00 0.00 0.00 2,3,7,8-TCDD N/A N/A N/A N/A Acenaphthene 0.00 0.00 0.00 0.00 Acenaphthylene N/A N/A N/A N/A Anthracene 0.00 0.00 0.00 0.00 Benzo(a)anthracene N/A N/A N/A N/A Benzo(a)pyrene N/A N/A N/A N/A Benzo(b)fluoroanthene N/A N/A N/A N/A Benzo(e)pyrene N/A N/A N/A N/A Benzo(g,h,i)perylene N/A N/A N/A N/A Benzo(k)fluoroanthene N/A N/A N/A N/A Chrysene N/A N/A N/A N/A Dibenz(a,h)anthracene N/A N/A N/A N/A Fluoranthene 0.00 0.00 0.00 0.00 Fluorene 0.00 0.00 0.00 0.00 Indeno(1,2,3-cd)pyrene N/A N/A N/A N/A Naphthalene 0.03 0.03 0.04 0.03 Phenanthrene 0.00 0.00 0.00 0.00 Pyrene 0.00 0.00 0.00 0.00 Hazard Index 0.15 0.25 0.14 0.08 Note: N/A: Not Applicable Some values appear as zeroes due to the number of significant figures used in this table. However, such values are actually above zero.
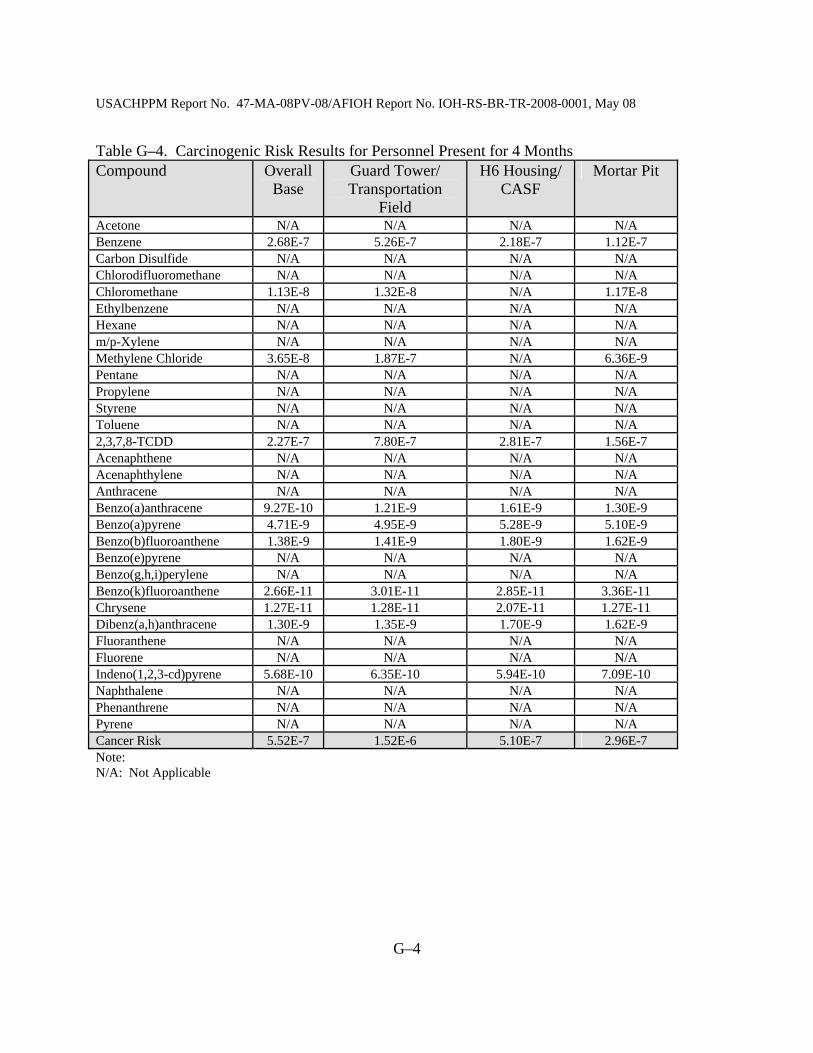
USACHPPM Report No. 47-MA-08PV-08/AFIOH Report No. IOH-RS-BR-TR-2008-0001, May 08
G–4
Table G–4. Carcinogenic Risk Results for Personnel Present for 4 Months Compound Overall
Base Guard Tower/ Transportation
Field
H6 Housing/ CASF
Mortar Pit
Acetone N/A N/A N/A N/A Benzene 2.68E-7 5.26E-7 2.18E-7 1.12E-7 Carbon Disulfide N/A N/A N/A N/A Chlorodifluoromethane N/A N/A N/A N/A Chloromethane 1.13E-8 1.32E-8 N/A 1.17E-8 Ethylbenzene N/A N/A N/A N/A Hexane N/A N/A N/A N/A m/p-Xylene N/A N/A N/A N/A Methylene Chloride 3.65E-8 1.87E-7 N/A 6.36E-9 Pentane N/A N/A N/A N/A Propylene N/A N/A N/A N/A Styrene N/A N/A N/A N/A Toluene N/A N/A N/A N/A 2,3,7,8-TCDD 2.27E-7 7.80E-7 2.81E-7 1.56E-7 Acenaphthene N/A N/A N/A N/A Acenaphthylene N/A N/A N/A N/A Anthracene N/A N/A N/A N/A Benzo(a)anthracene 9.27E-10 1.21E-9 1.61E-9 1.30E-9 Benzo(a)pyrene 4.71E-9 4.95E-9 5.28E-9 5.10E-9 Benzo(b)fluoroanthene 1.38E-9 1.41E-9 1.80E-9 1.62E-9 Benzo(e)pyrene N/A N/A N/A N/A Benzo(g,h,i)perylene N/A N/A N/A N/A Benzo(k)fluoroanthene 2.66E-11 3.01E-11 2.85E-11 3.36E-11 Chrysene 1.27E-11 1.28E-11 2.07E-11 1.27E-11 Dibenz(a,h)anthracene 1.30E-9 1.35E-9 1.70E-9 1.62E-9 Fluoranthene N/A N/A N/A N/A Fluorene N/A N/A N/A N/A Indeno(1,2,3-cd)pyrene 5.68E-10 6.35E-10 5.94E-10 7.09E-10 Naphthalene N/A N/A N/A N/A Phenanthrene N/A N/A N/A N/A Pyrene N/A N/A N/A N/A Cancer Risk 5.52E-7 1.52E-6 5.10E-7 2.96E-7 Note: N/A: Not Applicable

USACHPPM Report No. 47-MA-08PV-08/AFIOH Report No. IOH-RS-BR-TR-2008-0001, May 08
G–5
Table G–5. Non-carcinogenic Risk Results for Personnel Present for 1 Month Compound Overall
Base Guard Tower/ Transportation
Field
H6 Housing/ CASF
Mortar Pit
Acetone 0.00 0.00 0.00 0.00 Benzene 0.02 0.04 0.02 0.01 Carbon Disulfide 0.00 N/A N/A N/A Chlorodifluoromethane 0.00 N/A 0.00 N/A Chloromethane 0.00 0.00 N/A 0.00 Ethylbenzene 0.00 0.00 0.00 N/A Hexane 0.00 0.00 0.00 N/A m/p-Xylene 0.00 N/A 0.01 0.00 Methylene Chloride 0.00 0.01 N/A 0.00 Pentane N/A N/A N/A N/A Propylene N/A N/A N/A N/A Styrene 0.00 0.00 N/A N/A Toluene 0.00 0.00 0.00 0.00 2,3,7,8-TCDD N/A N/A N/A N/A Acenaphthene 0.00 0.00 0.00 0.00 Acenaphthylene N/A N/A N/A N/A Anthracene 0.00 0.00 0.00 0.00 Benzo(a)anthracene N/A N/A N/A N/A Benzo(a)pyrene N/A N/A N/A N/A Benzo(b)fluoroanthene N/A N/A N/A N/A Benzo(e)pyrene N/A N/A N/A N/A Benzo(g,h,i)perylene N/A N/A N/A N/A Benzo(k)fluoroanthene N/A N/A N/A N/A Chrysene N/A N/A N/A N/A Dibenz(a,h)anthracene N/A N/A N/A N/A Fluoranthene 0.00 0.00 0.00 0.00 Fluorene 0.00 0.00 0.00 0.00 Indeno(1,2,3-cd)pyrene N/A N/A N/A N/A Naphthalene 0.01 0.01 0.01 0.01 Phenanthrene 0.00 0.00 0.00 0.00 Pyrene 0.00 0.00 0.00 0.00 Hazard Index 0.04 0.06 0.03 0.02 Notes: N/A: Not Applicable Some values appear as zeroes due to the number of significant figures used in this table. However, such values are actually above zero.

USACHPPM Report No. 47-MA-08PV-08/AFIOH Report No. IOH-RS-BR-TR-2008-0001, May 08
G–6
Table G–6. Carcinogenic Risk Results for Personnel Present for 1 Month Compound Overall
Base Guard Tower/ Transportation
Field
H6 Housing/ CASF
Mortar Pit
Acetone N/A N/A N/A N/A Benzene 6.69E-8 1.31E-7 5.46E-8 2.79E-8 Carbon Disulfide N/A N/A N/A N/A Chlorodifluoromethane N/A N/A N/A N/A Chloromethane 2.83E-9 3.31E-9 N/A 2.93E-9 Ethylbenzene N/A N/A N/A N/A Hexane N/A N/A N/A N/A m/p-Xylene N/A N/A N/A N/A Methylene Chloride 9.12E-9 4.67E-8 N/A 1.59E-9 Pentane N/A N/A N/A N/A Propylene N/A N/A N/A N/A Styrene N/A N/A N/A N/A Toluene N/A N/A N/A N/A 2,3,7,8-TCDD 5.68E-8 1.95E-7 7.02E-8 3.90E-8 Acenaphthene N/A N/A N/A N/A Acenaphthylene N/A N/A N/A N/A Anthracene N/A N/A N/A N/A Benzo(a)anthracene 2.32E-10 3.02E-10 4.02E-10 3.26E-10 Benzo(a)pyrene 1.18E-9 1.24E-9 1.32E-9 1.27E-9 Benzo(b)fluoroanthene 3.45E-10 3.51E-10 4.51E-10 4.06E-10 Benzo(e)pyrene N/A N/A N/A N/A Benzo(g,h,i)perylene N/A N/A N/A N/A Benzo(k)fluoroanthene 6.66E-12 7.53E-12 7.13E-12 8.40E-12 Chrysene 3.16E-12 3.20E-12 5.19E-12 3.18E-12 Dibenz(a,h)anthracene 3.25E-10 3.38E-10 4.24E-10 4.06E-10 Fluoranthene N/A N/A N/A N/A Fluorene N/A N/A N/A N/A Indeno(1,2,3-cd)pyrene 1.42E-10 1.59E-10 1.48E-10 1.77E-10 Naphthalene N/A N/A N/A N/A Phenanthrene N/A N/A N/A N/A Pyrene N/A N/A N/A N/A Cancer Risk 1.38E-7 3.79E-7 1.28E-7 7.40E-8 Note: N/A: Not Applicable
USACHPPM Report No. 47-MA-08PV-08/AFIOH Report No. IOH-RS-BR-TR-2008-0001, May 08
H–1
APPENDIX H REPORT ON DIOXIN BODY BURDEN PREDICTION AND PILOT SERUM STUDY
H–1. GENERAL. a. The dioxin congeners in the air are measured as TEQs to the most potent in the family—tetrachlorodibenzodioxin or TCDD. Though dioxin TEQ can be evaluated for carcinogenic risk by the quantitative HRA methodology used in this document, it cannot be evaluated for potential non-cancer effects due to lack of an appropriate “toxicity value” (RfD) needed for this assessment. However, it is believed that dioxins have non-cancer health effects (summarized below), when enough is accumulated in the body. Therefore, a PBPK model that could convert the conservative EPC and exposure parameters or “dose” into a “body burden” (concentration in fat where dioxin gravitates in the body) was used to estimate the impact on body burden of a year at Balad at 24-hours per day exposure. b. In the United States, background TEQ in fat is usually well below 100 ppt (some older cohorts possibly approached this) and has trended down with the implementation of U.S. EPA clean air standards (reference H–1). A study (M. Lorber; reference H–2) that reviewed body burdens of dioxin toxic equivalents, TEQs, over time, found a range from approximately 50 to 80 ppt lipid during the 1970s, 30–50 ppt lipid during the 1980s, and 10–20 ppt lipid during the 1990s (TEQs comprised of the 17 dioxin and furan congeners only). c. An U.S. EPA contact (M. Lorber, private correspondence; reference H–3), supplied a PBPK model, which was utilized in the World Trade Center U.S. EPA assessment (reference H–4). This was in the form of an excel spreadsheet. In our application, we entered more conservative exposure parameters (those used in this document for the inhalation route) and the EPC of the dioxin TEQ in air used in this document. The outcome showed an incremental increase in fat, after 1 year of exposure, of 1 pg/g (equivalent to ppt) fat. d. Before the database error was discovered, which increased the air concentrations we used by 1000x, our modeling had resulted in predicted incremental serum fat concentrations of around 600–900 pg/g fat. These were based on an EPC of 1400-2100 pg/m3. (As a comparison, the current EPC is 1.2 pg/m3, and current typical urban air is about 0.1 pg/m3 dioxin TEQ). The original levels were of concern for potential non-cancer health effects. In addition, there are uncertainties in modeling and also in that the one route of exposure considered in this HRA was the inhalation route. It is, however, possible to obtain a more certain measure of exposure with testing of dioxin levels in the serum fat, and this was considered as a potential next step. The USACHPPM approached the CDC laboratory at National Center for Environmental Health (NCEH) to discuss testing serum (fat) samples for dioxin congeners. This laboratory is nationally recognized for such testing for the National Health and Nutrition Examination Survey (NHANES) surveys, which periodically determine background levels of various chemicals, including dioxins, in the U.S. population.
USACHPPM Report No. 47-MA-08PV-08/AFIOH Report No. IOH-RS-BR-TR-2008-0001, May 08
H–2
e. It was determined that a pilot study of a few of the most exposed Service members, with a quick turn-around time, would provide immediate feedback of the scope of the concern. It was noted in the laboratory’s experience with most Civilian exposure incidences that the actual amount of chemical taken up by the body was often much less than that suspected by the exposure or calculated by models. In such cases, concerns were immediately allayed in those communities by this kind of pilot study. Therefore the intent of proceeding with this pilot serum study was to determine quickly if our Service members were experiencing the high predicted dioxin body burden levels of our model, as opposed to performing the type of epidemiological study designed with sufficient power to detect very low level differences in before and after body burden to the population as a whole or within the population (of Service members stationed at Balad). H–2. METHODOLOGY. a. The USACHPPM determined that this was an indicated use of the DoDSR, and requested and was granted access to the DoDSR through the Army Medical Surveillance Activity (AMSA). In discussion with AMSA, it was determined that the typical quantity of serum available per specimen for release was 0.5 cubic centimeter (cc). b. In discussion with NCEH, analysis of serum for NHANES background for dioxin congeners requires approximately 7 cc to allow for the lowest possible detection limits. Testing is conducted for 21 dioxin congeners, which include 4–8 chlorine containing dioxins and furans, and some coplanar polychlorinated biphenyls (PCBs). c. The USACHPPM was able to obtain approximately 1 cc of serum per specimen from the DoDSR. This would increase the detection limits by approximately 7–fold or more (and even more the lower the serum amount below 1cc, which happened often). We determined that in order to obtain a quick turn-around time for this pilot study, the higher detection limits would be acceptable, This was based on the assumption and concern that dioxin TEQs in the hundreds might be present; therefore, these would be detectable even with the higher detection limits. d. To determine a highly exposed group of Service members for inclusion in the pilot study, the use of military occupational specialty code was considered. However, it was noted that it would be very difficult to identify the actual location and activities of individual Service members on the base, that the emissions of the burn pit actually go over the whole base, and that meteorological conditions may change who is the most exposed on a given day. Since dioxins accumulate in fat over time and only very slowly leave the body (half life around 7–8 years), it was decided to use length of time on the base as the measure of “dose.” e. A roster was developed from the Defense Theatre Accountability System of all Soldiers who were stationed at Balad for 1 year or greater and who left in the first quarter of 2007 when the air sampling was done. This roster was compiled on 21 November 2007. The assumption was that these individuals had been at Balad for at least a year when conditions were similar to
USACHPPM Report No. 47-MA-08PV-08/AFIOH Report No. IOH-RS-BR-TR-2008-0001, May 08
H–3
that reflected by the sampling. An additional condition was that the Soldiers had at least two nonconsecutive tours to Balad, of which this last deployment was one. A roster of 390 Service members was sent to AMSA, and 25 individuals were chosen randomly and anonymously (de-identified). The AMSA provided 1 cc of serum from before this deployment (most proximate to this deployment) and 1cc from after this deployment to NCEH to test. H–3. FINDINGS AND DISCUSSION. The NCEH results included some standard statistical analyses. However, because many of the results were below the detection limits, it was determined that a formal statistical analysis would not be conclusive or interpretable. Therefore, this section will qualitatively describe the results on the 25 Service members. a. Detection limits varied by specimen and congener. The amount of serum available varied by specimen but was generally between 0.6–0.85 cc, although a few were lower. (The amount available impacts the detection limit). Except for OCDD, the detection limits by congener and specimen tended to be below 20 pg/g fat. This means that if at least 20 pg/g was present, it would be detectable. However, in some specimens for some congeners, (often for coplanar PCBs), the detection limits were higher, requiring more of that congener to be present to be detectable by this analysis. This is important because on occasion the detection limit was higher than the background level (95 percentile) for the U.S. population, and so it could not be determined if that particular result was within U.S. background. b. The OCDD had a much higher detection limit, generally varying in the low hundreds. However, the NHANES 95 percentile in the general population is 758 pg/g, which would indicate that even though the detection limit was higher, it was sufficient to identify background or above background levels. As stated above, for the other congeners it was not unusual to see detection limits greater than the 95 percentile background level for the general U.S. population, but these results were usually seen for either an individual’s pre- or post-deployment serum specimen rather than both. In the instances when a post-deployment specimen had sufficient volume to allow detection to the upper 95th percentile background level, this provides some assurance that body burden did not likely increase substantially. c. Regarding results, most were below detection limits. Out of 21 congeners, only 7 showed up above the detection limits in any specimens. Even among these 7, for the 25 Soldiers, many results were below the detection limit (64 percent). In those instances where congeners were detected above the detection limit, this occurred more often in the pre-deployment specimen, rather than always in the post-deployment specimen, as would be anticipated if exposure led to a rise in congener levels. When both pre- and post- deployment results for a congener were above the detection limit, the pre-deployment specimen results were higher than the post-deployment as
Note: The concentrations discussed in this section are actual concentrations of the congeners and not the TEF equivalents to the TEQ, and so should not be compared to the U.S. background levels discussed above, of 10–20 ppt TEQ.
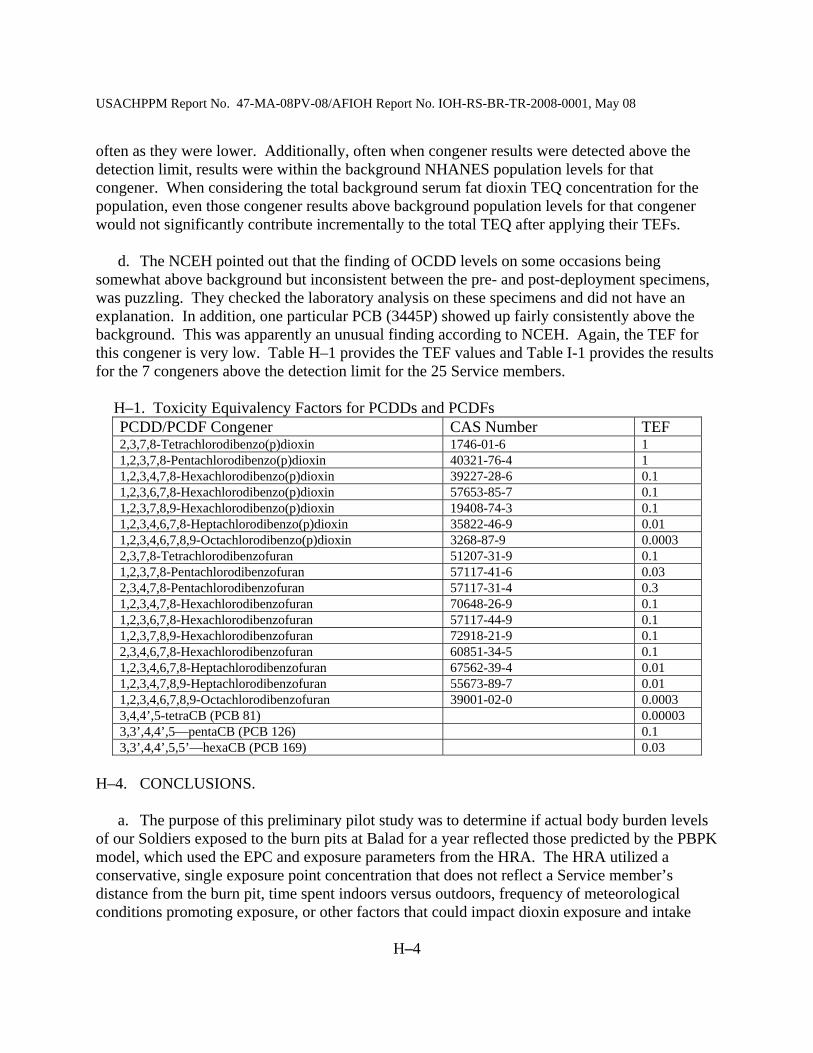
USACHPPM Report No. 47-MA-08PV-08/AFIOH Report No. IOH-RS-BR-TR-2008-0001, May 08
H–4
often as they were lower. Additionally, often when congener results were detected above the detection limit, results were within the background NHANES population levels for that congener. When considering the total background serum fat dioxin TEQ concentration for the population, even those congener results above background population levels for that congener would not significantly contribute incrementally to the total TEQ after applying their TEFs. d. The NCEH pointed out that the finding of OCDD levels on some occasions being somewhat above background but inconsistent between the pre- and post-deployment specimens, was puzzling. They checked the laboratory analysis on these specimens and did not have an explanation. In addition, one particular PCB (3445P) showed up fairly consistently above the background. This was apparently an unusual finding according to NCEH. Again, the TEF for this congener is very low. Table H–1 provides the TEF values and Table I-1 provides the results for the 7 congeners above the detection limit for the 25 Service members.
H–1. Toxicity Equivalency Factors for PCDDs and PCDFs
H–4. CONCLUSIONS. a. The purpose of this preliminary pilot study was to determine if actual body burden levels of our Soldiers exposed to the burn pits at Balad for a year reflected those predicted by the PBPK model, which used the EPC and exposure parameters from the HRA. The HRA utilized a conservative, single exposure point concentration that does not reflect a Service member’s distance from the burn pit, time spent indoors versus outdoors, frequency of meteorological conditions promoting exposure, or other factors that could impact dioxin exposure and intake
PCDD/PCDF Congener CAS Number TEF 2,3,7,8-Tetrachlorodibenzo(p)dioxin 1746-01-6 1 1,2,3,7,8-Pentachlorodibenzo(p)dioxin 40321-76-4 1 1,2,3,4,7,8-Hexachlorodibenzo(p)dioxin 39227-28-6 0.1 1,2,3,6,7,8-Hexachlorodibenzo(p)dioxin 57653-85-7 0.1 1,2,3,7,8,9-Hexachlorodibenzo(p)dioxin 19408-74-3 0.1 1,2,3,4,6,7,8-Heptachlorodibenzo(p)dioxin 35822-46-9 0.01 1,2,3,4,6,7,8,9-Octachlorodibenzo(p)dioxin 3268-87-9 0.0003 2,3,7,8-Tetrachlorodibenzofuran 51207-31-9 0.1 1,2,3,7,8-Pentachlorodibenzofuran 57117-41-6 0.03 2,3,4,7,8-Pentachlorodibenzofuran 57117-31-4 0.3 1,2,3,4,7,8-Hexachlorodibenzofuran 70648-26-9 0.1 1,2,3,6,7,8-Hexachlorodibenzofuran 57117-44-9 0.1 1,2,3,7,8,9-Hexachlorodibenzofuran 72918-21-9 0.1 2,3,4,6,7,8-Hexachlorodibenzofuran 60851-34-5 0.1 1,2,3,4,6,7,8-Heptachlorodibenzofuran 67562-39-4 0.01 1,2,3,4,7,8,9-Heptachlorodibenzofuran 55673-89-7 0.01 1,2,3,4,6,7,8,9-Octachlorodibenzofuran 39001-02-0 0.0003 3,4,4’,5-tetraCB (PCB 81) 0.00003 3,3’,4,4’,5—pentaCB (PCB 126) 0.1 3,3’,4,4’,5,5’—hexaCB (PCB 169) 0.03

USACHPPM Report No. 47-MA-08PV-08/AFIOH Report No. IOH-RS-BR-TR-2008-0001, May 08
H–5
into the body. On the other hand, only the inhalation route of exposure was modeled, so there was a potential gap of knowledge concerning ingestion and dermal routes. Given the availability of pre- and post-deployment serum, the long half life of dioxin and the above-stated uncertainties, it was determined that an assessment of change in body burden would be informative. Considering the levels predicted by the original dioxin EPC, which was in error, it was determined that a screening of a sampling of higher exposed (based on time of exposure, as discussed above) SM’s sera should be accomplished quickly. b. The results of the study appear to show no significant impact (within the constraints of the detection limits) on the dioxin body burden levels after a year of deployment to Balad. This is consistent with the corrected calculations of the dioxin TEQ EPC. c. This pilot study suffers from a small sample size and impacts on detection limits based on available serum. In addition, the actual locations and activities of those Service members tested is not known other than that they were stationed at Balad. It serves as a preliminary assessment of whether Service members stationed at Balad for 1 year while burn pits were in operation appeared to have an increased body burden for dioxin congeners post deployment, and whether measured levels appear to be above the U.S. background levels. While the detection limits posed some difficulty, given that our concerns were that much higher body burdens might be possible, this was considered an acceptable tradeoff for a quick assessment. It was also considered that if a larger study were to be necessary to more formally address the question, this pilot study would provide useful information for determining specimen requirements and sample size. Also troublesome is that the serum used was originally collected for human immunodeficiency virus (or) HIV testing prior to being stored in the DoDSR. Collection procedures may vary, and the potential for contamination or less than optimal handling may exist. The likelihood or impact of these factors is unknown. H–5. REFERENCES. H-1. U.S. EPA. 2004. Clean Air Act. (http://www.epa.gov/air/caa/). H-2. Lorber, M. 2002. “A pharmacokinetic model for estimating exposure of Americans to dioxin-like compounds in the past, present, and future.” The Science of the Total Environment, 288, 81–95. H-3. E-mail, Lorber, M., 6 November 2007, subject: RE: FW: Atsugi Health Study (UNCLASSIFIED). H-4. U.S. EPA. 2002. EPA/600/R-02/002A. Exposure and Human Health Evaluation of Airborne Pollution from the World Trade Center Disaster (External Review Draft). Washington, DC: U.S. Environmental Protection Agency (http://cfpub.epa.gov/ncea/cfm/recordisplay.cfm?deid=51929)
USACHPPM Report No. 47-MA-08PV-08/AFIOH Report No. IOH-RS-BR-TR-2008-0001, May 08
I–1
APPENDIX I SUPPLEMENTAL INFORMATION ON DIOXIN SERUM STUDY AND HEALTH EFFECTS
DIOXIN HEALTH EFFECTS INFORMATION
I–1. GENERAL. a. “Dioxins” are a family of chlorinated chemicals that are structured similarly and act the same way on a particular cellular receptor protein to “activate” it. This receptor is called the “Ah” receptor, and it is found on many different types of cells in the body. It is also found in animals. However, it has been noted that not only do different cell types in the body respond differently to the receptor but different animal species do also. Even within a species, some animals are much more sensitive than others to the effects of dioxin on the receptor. This is why it is more difficult to say what the health effects of dioxins are in humans, based on animal studies, than for many other substances. There have been occasions to study humans who have been accidentally exposed, and this has provided information as well. b. Dioxins can be absorbed through food (ingestion), from the air (inhalation), or through the skin. Humans most often are exposed to dioxins through the food chain. However, they are often formed as products of burning, especially plastics, so high levels in the air can be breathed in. They are fat-soluble and accumulate in the body fat over time but leave only very slowly. Their amount concentrated in the fat is called the “body burden.” This is similar to “dose” and is how we compare the potential health effects between animals and humans, and predict health effects in humans. I–2. MAJOR POINTS. a. There is wide variability in response and health effects both within a species and between species. This can be hundreds or thousands-fold different. The type of health effects seen in one species may not be seen in another. For example, some animals studied after dosing with dioxins lose weight and waste away quickly, but this has not been seen in humans. b. Dioxins have been variously described as the most toxic chemical known (in some animals) to relatively non-toxic in humans. Other than some biochemical changes (such as, enzyme changes), chloracne (a form of acne) is one of the only known human health effects proven. There are major disagreements in the meaning of animal study results to humans. There is no known case of a human dying of an acute poisoning with dioxin. In Seveso, Italy, where an industrial accident spread high levels of dioxin around the town, 25 percent of the animals died in the “inner circle,” but there were no human casualties and, acutely, only temporary changes in some blood tests and chloracne. The president of the Ukraine was highly poisoned, and he is still running the country. c. The possible cancer-causing effects of dioxin have been studied at length. It is considered to be a “promoter,” not an “initiator.” This means, it doesn’t start a new cancer growing but
USACHPPM Report No. 47-MA-08PV-08/AFIOH Report No. IOH-RS-BR-TR-2008-0001, May 08
I–2
appears to promote cancer of various types that are already started. It is considered a relatively weak carcinogen but has been classified by the International Agency for Research on Cancer and the U.S. EPA as a known human carcinogen. d. Non-cancer health effects may be the area of most concern, especially related to dividing and differentiating cells. These are more subtle health effects and not as overt as, for example, chloracne. In animals, developmental health effects on the fetus (such as, lower birth weight or neurological development delays) as well as effects on the immune, reproductive, neurological and hormone systems, etc., have been shown beginning even at relatively low body burdens. Animal studies, for example, have shown possible increased susceptibility to infection or lowered sperm counts. Though not confirmed in humans, such effects as increased susceptibility to diabetes or blood lipid abnormalities (susceptibility to cardiovascular disease) are suggested by studies. In Seveso, it is possible that men with higher dioxin levels have fathered more girls than boys. Some biochemical health effects related to Ah-receptor binding, and induction or inhibition of certain enzymes or factors (such as, Cytochrome P450s, Epidermal Growth Factor) are relatively consistent across species at low body burdens. e. In animals, doses for lethality can vary by 1000-fold across species (there is a great differences in sensitivity). Therefore, there has been an expectation that there would be a wide variation in sensitivity for other health effects, and this is sometimes true. However, for any particular health effect, even though some animals/species may be very sensitive and others very resistant, most species tend to respond relatively similarly (within 10-fold). It is believed that although humans may be resistant to some of the toxic effects of dioxin, it is not likely that humans are resistant to all its effects. f. There is no good agreement as to what health effects of dioxins occur in humans and at what levels of body burden. Because of all the uncertainty, regulatory agencies try to lower dioxin exposure levels in human populations as much as possible. g. Recent research has shown that some natural chemicals in plants (called flavonoids) also act on the Ah-receptor and could potentially block the effects of dioxins. One more reason to eat plenty of vegetables.

USACHPPM Report No. 47-MA-08PV-08/AFIOH Report No. IOH-RS-BR-TR-2008-0001, May 08
I–3
Table. I–1. The NCEH Laboratory Results of the 25 Soldiers’ Pre- and Post-Deployment Serum for 7 Detected Dioxin Congeners Key: 1= pre-deployment; 2=post-deployment AIR = Soldier identifier (pair) NUM=congener number MSANAL = congener (D=dioxin; F=furan; P=pcb) RPT: GND=below detection limit; G=above detection limit PPT: Result in parts per trillion (“0” assigned to GND) LDL: Detection limit SW: (sample weight) Amount of serum available for test P95: background level (NHANES 95 percentile) TL: total lipid
AIR NUM MSANAL RPT_1 RPT_2 PPT_1 PPT_2 LDL_1 LDL_2 SW1 SW2 P95 CI95 TL_1 TL_2 01 4 123678D G GND 28.4 0 23.7 7.6 0.687 0.837 68.5 59.6-74.9 517.5 105501 6 1234678D G G 28.8 15.4 23 8 0.687 0.837 91.3 73.5-117 517.5 105501 7 OCDD GND GND 0 0 369 139.3 0.687 0.837 758 647-874 517.5 105501 15 1234678F G G 30 15.8 15.9 5.4 0.687 0.837 18.7 16.4-24.2 517.5 105501 19 3445P GND G 0 38.6 27.1 9 0.687 0.837 13.4 <13.1-16.3 517.5 105501 20 33445P G G 41 17.3 25.9 8.7 0.687 0.837 68.7 58.1-84.4 517.5 105501 21 334455P GND G 0 10.6 24.5 8.2 0.687 0.837 40.6 36.5-47.3 517.5 105502 4 123678D GND GND 0 0 14.9 19 0.818 0.625 68.5 59.6-74.9 722.2 51502 6 1234678D GND GND 0 0 14.9 19 0.818 0.625 91.3 73.5-117 722.2 51502 7 OCDD GND GND 0 0 254.7 300.7 0.818 0.625 758 647-874 722.2 51502 15 1234678F G G 17.3 20.7 10.2 13.2 0.818 0.625 18.7 16.4-24.2 722.2 51502 19 3445P G G 58.4 26.1 16 25.8 0.818 0.625 13.4 <13.1-16.3 722.2 51502 20 33445P G G 22.4 38.8 15.9 24 0.818 0.625 68.7 58.1-84.4 722.2 515

USACHPPM Report No. 47-MA-08PV-08/AFIOH Report No. IOH-RS-BR-TR-2008-0001, May 08
I–4
AIR NUM MSANAL RPT_1 RPT_2 PPT_1 PPT_2 LDL_1 LDL_2 SW1 SW2 P95 CI95 TL_1 TL_2 02 21 334455P GND GND 0 0 15.6 21.3 0.818 0.625 40.6 36.5-47.3 722.2 51503 4 123678D GND GND 0 0 12.6 16.4 0.765 0.611 68.5 59.6-74.9 815.9 806.403 6 1234678D GND GND 0 0 13.4 17.7 0.765 0.611 91.3 73.5-117 815.9 806.403 7 OCDD GND GND 0 0 219.2 288.4 0.765 0.611 758 647-874 815.9 806.403 15 1234678F G GND 16.1 0 8.8 12.1 0.765 0.611 18.7 16.4-24.2 815.9 806.403 19 3445P G GND 47.2 0 13.2 17.5 0.765 0.611 13.4 <13.1-16.3 815.9 806.403 20 33445P G GND 19.4 0 13.2 17.8 0.765 0.611 68.7 58.1-84.4 815.9 806.403 21 334455P GND GND 0 0 13 18 0.765 0.611 40.6 36.5-47.3 815.9 806.404 4 123678D GND GND 0 0 25 20.7 0.751 0.618 68.5 59.6-74.9 762.4 730.504 6 1234678D G GND 28.2 0 27.1 21.6 0.751 0.618 91.3 73.5-117 762.4 730.504 7 OCDD GND GND 0 0 450.2 350.7 0.751 0.618 758 647-874 762.4 730.504 15 1234678F G G 28.2 19.5 18.2 14.5 0.751 0.618 18.7 16.4-24.2 762.4 730.504 19 3445P GND GND 0 0 25.5 23.5 0.751 0.618 13.4 <13.1-16.3 762.4 730.504 20 33445P GND G 0 35.6 26.3 23.2 0.751 0.618 68.7 58.1-84.4 762.4 730.504 21 334455P GND GND 0 0 27.3 22.5 0.751 0.618 40.6 36.5-47.3 762.4 730.505 4 123678D GND GND 0 0 10.6 10.5 0.723 0.642 68.5 59.6-74.9 712.8 828.805 6 1234678D G GND 40.6 0 13.5 13.2 0.723 0.642 91.3 73.5-117 712.8 828.805 7 OCDD G GND 1980 0 222.7 212.8 0.723 0.642 758 647-874 712.8 828.805 15 1234678F G G 13.1 11.2 9.7 9.1 0.723 0.642 18.7 16.4-24.2 712.8 828.805 19 3445P G G 35.3 36.3 16.6 16.3 0.723 0.642 13.4 <13.1-16.3 712.8 828.805 20 33445P G GND 20.8 0 18.7 18.3 0.723 0.642 68.7 58.1-84.4 712.8 828.805 21 334455P GND GND 0 0 16.4 15.6 0.723 0.642 40.6 36.5-47.3 712.8 828.806 4 123678D GND GND 0 0 17 16.2 0.66 0.792 68.5 59.6-74.9 566.6 47906 6 1234678D GND GND 0 0 21.1 19.3 0.66 0.792 91.3 73.5-117 566.6 47906 7 OCDD GND GND 0 0 340.4 321.2 0.66 0.792 758 647-874 566.6 47906 15 1234678F G G 23.4 30 14.9 14.5 0.66 0.792 18.7 16.4-24.2 566.6 47906 19 3445P GND G 0 48.2 25.2 22.7 0.66 0.792 13.4 <13.1-16.3 566.6 47906 20 33445P GND GND 0 0 29.3 25.2 0.66 0.792 68.7 58.1-84.4 566.6 479
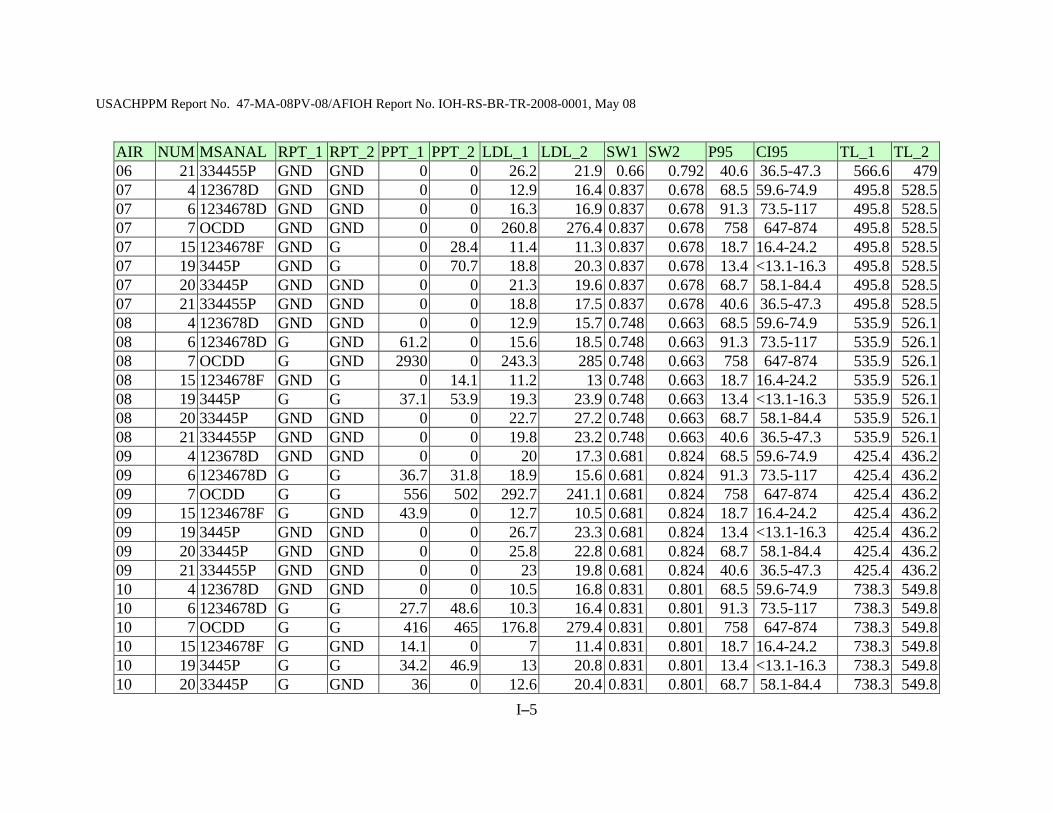
USACHPPM Report No. 47-MA-08PV-08/AFIOH Report No. IOH-RS-BR-TR-2008-0001, May 08
I–5
AIR NUM MSANAL RPT_1 RPT_2 PPT_1 PPT_2 LDL_1 LDL_2 SW1 SW2 P95 CI95 TL_1 TL_2 06 21 334455P GND GND 0 0 26.2 21.9 0.66 0.792 40.6 36.5-47.3 566.6 47907 4 123678D GND GND 0 0 12.9 16.4 0.837 0.678 68.5 59.6-74.9 495.8 528.507 6 1234678D GND GND 0 0 16.3 16.9 0.837 0.678 91.3 73.5-117 495.8 528.507 7 OCDD GND GND 0 0 260.8 276.4 0.837 0.678 758 647-874 495.8 528.507 15 1234678F GND G 0 28.4 11.4 11.3 0.837 0.678 18.7 16.4-24.2 495.8 528.507 19 3445P GND G 0 70.7 18.8 20.3 0.837 0.678 13.4 <13.1-16.3 495.8 528.507 20 33445P GND GND 0 0 21.3 19.6 0.837 0.678 68.7 58.1-84.4 495.8 528.507 21 334455P GND GND 0 0 18.8 17.5 0.837 0.678 40.6 36.5-47.3 495.8 528.508 4 123678D GND GND 0 0 12.9 15.7 0.748 0.663 68.5 59.6-74.9 535.9 526.108 6 1234678D G GND 61.2 0 15.6 18.5 0.748 0.663 91.3 73.5-117 535.9 526.108 7 OCDD G GND 2930 0 243.3 285 0.748 0.663 758 647-874 535.9 526.108 15 1234678F GND G 0 14.1 11.2 13 0.748 0.663 18.7 16.4-24.2 535.9 526.108 19 3445P G G 37.1 53.9 19.3 23.9 0.748 0.663 13.4 <13.1-16.3 535.9 526.108 20 33445P GND GND 0 0 22.7 27.2 0.748 0.663 68.7 58.1-84.4 535.9 526.108 21 334455P GND GND 0 0 19.8 23.2 0.748 0.663 40.6 36.5-47.3 535.9 526.109 4 123678D GND GND 0 0 20 17.3 0.681 0.824 68.5 59.6-74.9 425.4 436.209 6 1234678D G G 36.7 31.8 18.9 15.6 0.681 0.824 91.3 73.5-117 425.4 436.209 7 OCDD G G 556 502 292.7 241.1 0.681 0.824 758 647-874 425.4 436.209 15 1234678F G GND 43.9 0 12.7 10.5 0.681 0.824 18.7 16.4-24.2 425.4 436.209 19 3445P GND GND 0 0 26.7 23.3 0.681 0.824 13.4 <13.1-16.3 425.4 436.209 20 33445P GND GND 0 0 25.8 22.8 0.681 0.824 68.7 58.1-84.4 425.4 436.209 21 334455P GND GND 0 0 23 19.8 0.681 0.824 40.6 36.5-47.3 425.4 436.210 4 123678D GND GND 0 0 10.5 16.8 0.831 0.801 68.5 59.6-74.9 738.3 549.810 6 1234678D G G 27.7 48.6 10.3 16.4 0.831 0.801 91.3 73.5-117 738.3 549.810 7 OCDD G G 416 465 176.8 279.4 0.831 0.801 758 647-874 738.3 549.810 15 1234678F G GND 14.1 0 7 11.4 0.831 0.801 18.7 16.4-24.2 738.3 549.810 19 3445P G G 34.2 46.9 13 20.8 0.831 0.801 13.4 <13.1-16.3 738.3 549.810 20 33445P G GND 36 0 12.6 20.4 0.831 0.801 68.7 58.1-84.4 738.3 549.8
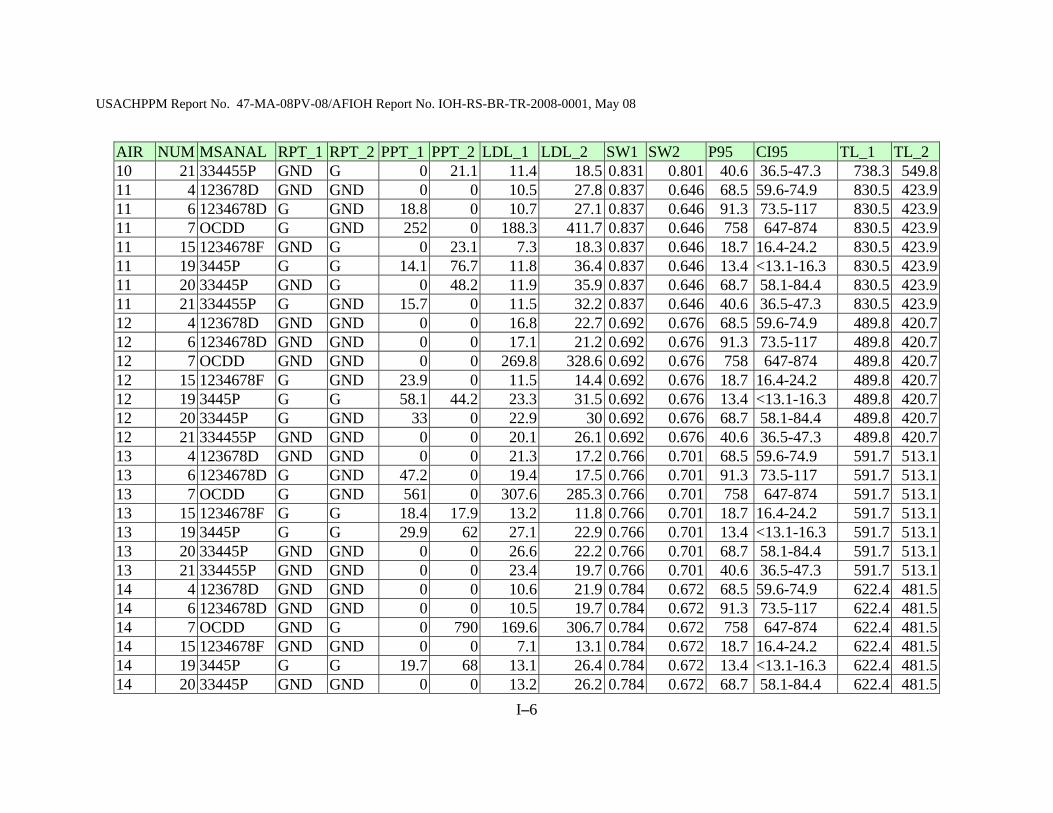
USACHPPM Report No. 47-MA-08PV-08/AFIOH Report No. IOH-RS-BR-TR-2008-0001, May 08
I–6
AIR NUM MSANAL RPT_1 RPT_2 PPT_1 PPT_2 LDL_1 LDL_2 SW1 SW2 P95 CI95 TL_1 TL_2 10 21 334455P GND G 0 21.1 11.4 18.5 0.831 0.801 40.6 36.5-47.3 738.3 549.811 4 123678D GND GND 0 0 10.5 27.8 0.837 0.646 68.5 59.6-74.9 830.5 423.911 6 1234678D G GND 18.8 0 10.7 27.1 0.837 0.646 91.3 73.5-117 830.5 423.911 7 OCDD G GND 252 0 188.3 411.7 0.837 0.646 758 647-874 830.5 423.911 15 1234678F GND G 0 23.1 7.3 18.3 0.837 0.646 18.7 16.4-24.2 830.5 423.911 19 3445P G G 14.1 76.7 11.8 36.4 0.837 0.646 13.4 <13.1-16.3 830.5 423.911 20 33445P GND G 0 48.2 11.9 35.9 0.837 0.646 68.7 58.1-84.4 830.5 423.911 21 334455P G GND 15.7 0 11.5 32.2 0.837 0.646 40.6 36.5-47.3 830.5 423.912 4 123678D GND GND 0 0 16.8 22.7 0.692 0.676 68.5 59.6-74.9 489.8 420.712 6 1234678D GND GND 0 0 17.1 21.2 0.692 0.676 91.3 73.5-117 489.8 420.712 7 OCDD GND GND 0 0 269.8 328.6 0.692 0.676 758 647-874 489.8 420.712 15 1234678F G GND 23.9 0 11.5 14.4 0.692 0.676 18.7 16.4-24.2 489.8 420.712 19 3445P G G 58.1 44.2 23.3 31.5 0.692 0.676 13.4 <13.1-16.3 489.8 420.712 20 33445P G GND 33 0 22.9 30 0.692 0.676 68.7 58.1-84.4 489.8 420.712 21 334455P GND GND 0 0 20.1 26.1 0.692 0.676 40.6 36.5-47.3 489.8 420.713 4 123678D GND GND 0 0 21.3 17.2 0.766 0.701 68.5 59.6-74.9 591.7 513.113 6 1234678D G GND 47.2 0 19.4 17.5 0.766 0.701 91.3 73.5-117 591.7 513.113 7 OCDD G GND 561 0 307.6 285.3 0.766 0.701 758 647-874 591.7 513.113 15 1234678F G G 18.4 17.9 13.2 11.8 0.766 0.701 18.7 16.4-24.2 591.7 513.113 19 3445P G G 29.9 62 27.1 22.9 0.766 0.701 13.4 <13.1-16.3 591.7 513.113 20 33445P GND GND 0 0 26.6 22.2 0.766 0.701 68.7 58.1-84.4 591.7 513.113 21 334455P GND GND 0 0 23.4 19.7 0.766 0.701 40.6 36.5-47.3 591.7 513.114 4 123678D GND GND 0 0 10.6 21.9 0.784 0.672 68.5 59.6-74.9 622.4 481.514 6 1234678D GND GND 0 0 10.5 19.7 0.784 0.672 91.3 73.5-117 622.4 481.514 7 OCDD GND G 0 790 169.6 306.7 0.784 0.672 758 647-874 622.4 481.514 15 1234678F GND GND 0 0 7.1 13.1 0.784 0.672 18.7 16.4-24.2 622.4 481.514 19 3445P G G 19.7 68 13.1 26.4 0.784 0.672 13.4 <13.1-16.3 622.4 481.514 20 33445P GND GND 0 0 13.2 26.2 0.784 0.672 68.7 58.1-84.4 622.4 481.5

USACHPPM Report No. 47-MA-08PV-08/AFIOH Report No. IOH-RS-BR-TR-2008-0001, May 08
I–7
AIR NUM MSANAL RPT_1 RPT_2 PPT_1 PPT_2 LDL_1 LDL_2 SW1 SW2 P95 CI95 TL_1 TL_2 14 21 334455P GND GND 0 0 11.8 23.5 0.784 0.672 40.6 36.5-47.3 622.4 481.515 4 123678D GND GND 0 0 25.9 26.7 0.478 0.68 68.5 59.6-74.9 512.6 448.315 6 1234678D GND G 0 115 24.9 27.7 0.478 0.68 91.3 73.5-117 512.6 448.315 7 OCDD GND G 0 1340 389.9 439.4 0.478 0.68 758 647-874 512.6 448.315 15 1234678F G GND 25.8 0 16.7 19.5 0.478 0.68 18.7 16.4-24.2 512.6 448.315 19 3445P G G 37.1 83.3 34.4 34.6 0.478 0.68 13.4 <13.1-16.3 512.6 448.315 20 33445P GND GND 0 0 33.5 35.9 0.478 0.68 68.7 58.1-84.4 512.6 448.315 21 334455P GND GND 0 0 29.4 31.9 0.478 0.68 40.6 36.5-47.3 512.6 448.316 4 123678D GND GND 0 0 14.9 10.1 0.691 0.825 68.5 59.6-74.9 671 689.116 6 1234678D G G 83.7 26.7 16.5 11.4 0.691 0.825 91.3 73.5-117 671 689.116 7 OCDD G GND 897 0 286.6 194.5 0.691 0.825 758 647-874 671 689.116 15 1234678F G G 39.5 29.8 11 7.9 0.691 0.825 18.7 16.4-24.2 671 689.116 19 3445P G G 44.9 32.8 17.6 13.2 0.691 0.825 13.4 <13.1-16.3 671 689.116 20 33445P GND G 0 20.5 18.9 13.4 0.691 0.825 68.7 58.1-84.4 671 689.116 21 334455P GND GND 0 0 18.1 12.3 0.691 0.825 40.6 36.5-47.3 671 689.117 4 123678D GND GND 0 0 7.7 7.2 0.819 0.732 68.5 59.6-74.9 1032.9 1392.317 6 1234678D GND GND 0 0 10.7 9.7 0.819 0.732 91.3 73.5-117 1032.9 1392.317 7 OCDD GND GND 0 0 189.5 175.4 0.819 0.732 758 647-874 1032.9 1392.317 15 1234678F G GND 10.6 0 7.4 6.8 0.819 0.732 18.7 16.4-24.2 1032.9 1392.317 19 3445P G GND 32 0 9.7 8.2 0.819 0.732 13.4 <13.1-16.3 1032.9 1392.317 20 33445P GND G 0 11.9 12 10.4 0.819 0.732 68.7 58.1-84.4 1032.9 1392.317 21 334455P GND GND 0 0 12.1 11 0.819 0.732 40.6 36.5-47.3 1032.9 1392.318 4 123678D GND GND 0 0 12.3 10.4 0.797 0.582 68.5 59.6-74.9 836.9 931.118 6 1234678D GND GND 0 0 17 13.1 0.797 0.582 91.3 73.5-117 836.9 931.118 7 OCDD GND GND 0 0 295.8 210.8 0.797 0.582 758 647-874 836.9 931.118 15 1234678F GND GND 0 0 11.9 9 0.797 0.582 18.7 16.4-24.2 836.9 931.118 19 3445P GND G 0 50.2 13.8 14.4 0.797 0.582 13.4 <13.1-16.3 836.9 931.118 20 33445P GND GND 0 0 17.4 17.1 0.797 0.582 68.7 58.1-84.4 836.9 931.1
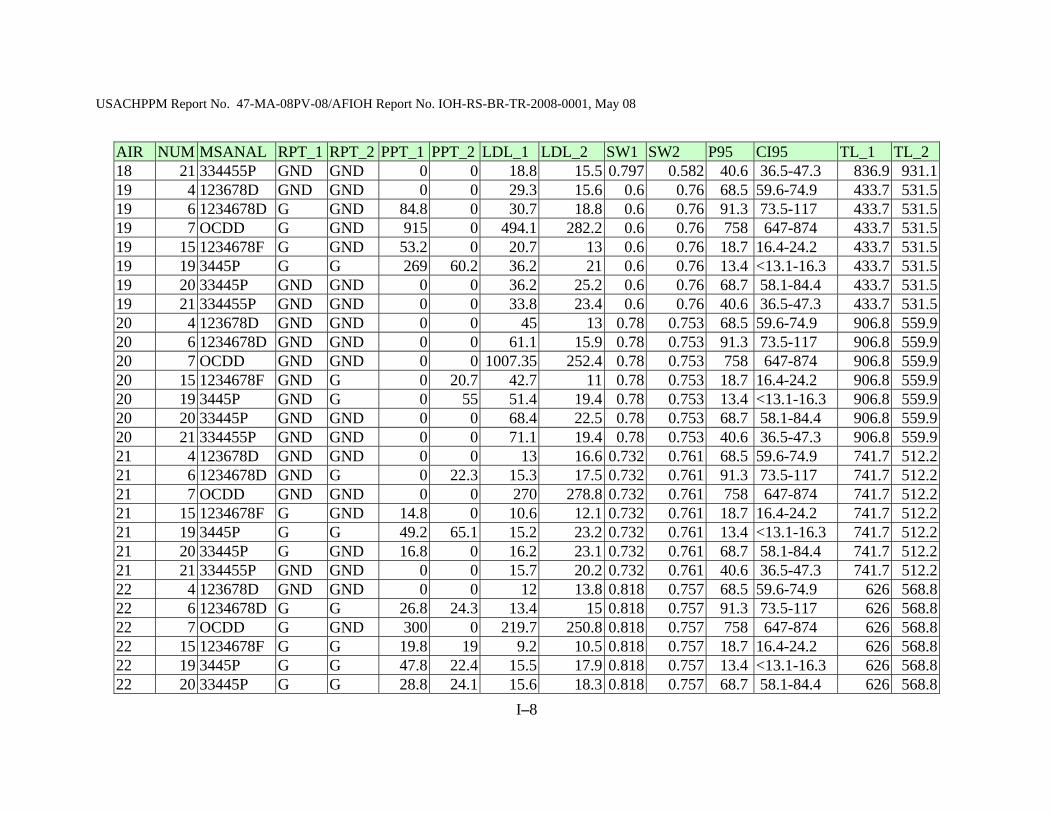
USACHPPM Report No. 47-MA-08PV-08/AFIOH Report No. IOH-RS-BR-TR-2008-0001, May 08
I–8
AIR NUM MSANAL RPT_1 RPT_2 PPT_1 PPT_2 LDL_1 LDL_2 SW1 SW2 P95 CI95 TL_1 TL_2 18 21 334455P GND GND 0 0 18.8 15.5 0.797 0.582 40.6 36.5-47.3 836.9 931.119 4 123678D GND GND 0 0 29.3 15.6 0.6 0.76 68.5 59.6-74.9 433.7 531.519 6 1234678D G GND 84.8 0 30.7 18.8 0.6 0.76 91.3 73.5-117 433.7 531.519 7 OCDD G GND 915 0 494.1 282.2 0.6 0.76 758 647-874 433.7 531.519 15 1234678F G GND 53.2 0 20.7 13 0.6 0.76 18.7 16.4-24.2 433.7 531.519 19 3445P G G 269 60.2 36.2 21 0.6 0.76 13.4 <13.1-16.3 433.7 531.519 20 33445P GND GND 0 0 36.2 25.2 0.6 0.76 68.7 58.1-84.4 433.7 531.519 21 334455P GND GND 0 0 33.8 23.4 0.6 0.76 40.6 36.5-47.3 433.7 531.520 4 123678D GND GND 0 0 45 13 0.78 0.753 68.5 59.6-74.9 906.8 559.920 6 1234678D GND GND 0 0 61.1 15.9 0.78 0.753 91.3 73.5-117 906.8 559.920 7 OCDD GND GND 0 0 1007.35 252.4 0.78 0.753 758 647-874 906.8 559.920 15 1234678F GND G 0 20.7 42.7 11 0.78 0.753 18.7 16.4-24.2 906.8 559.920 19 3445P GND G 0 55 51.4 19.4 0.78 0.753 13.4 <13.1-16.3 906.8 559.920 20 33445P GND GND 0 0 68.4 22.5 0.78 0.753 68.7 58.1-84.4 906.8 559.920 21 334455P GND GND 0 0 71.1 19.4 0.78 0.753 40.6 36.5-47.3 906.8 559.921 4 123678D GND GND 0 0 13 16.6 0.732 0.761 68.5 59.6-74.9 741.7 512.221 6 1234678D GND G 0 22.3 15.3 17.5 0.732 0.761 91.3 73.5-117 741.7 512.221 7 OCDD GND GND 0 0 270 278.8 0.732 0.761 758 647-874 741.7 512.221 15 1234678F G GND 14.8 0 10.6 12.1 0.732 0.761 18.7 16.4-24.2 741.7 512.221 19 3445P G G 49.2 65.1 15.2 23.2 0.732 0.761 13.4 <13.1-16.3 741.7 512.221 20 33445P G GND 16.8 0 16.2 23.1 0.732 0.761 68.7 58.1-84.4 741.7 512.221 21 334455P GND GND 0 0 15.7 20.2 0.732 0.761 40.6 36.5-47.3 741.7 512.222 4 123678D GND GND 0 0 12 13.8 0.818 0.757 68.5 59.6-74.9 626 568.822 6 1234678D G G 26.8 24.3 13.4 15 0.818 0.757 91.3 73.5-117 626 568.822 7 OCDD G GND 300 0 219.7 250.8 0.818 0.757 758 647-874 626 568.822 15 1234678F G G 19.8 19 9.2 10.5 0.818 0.757 18.7 16.4-24.2 626 568.822 19 3445P G G 47.8 22.4 15.5 17.9 0.818 0.757 13.4 <13.1-16.3 626 568.822 20 33445P G G 28.8 24.1 15.6 18.3 0.818 0.757 68.7 58.1-84.4 626 568.8

USACHPPM Report No. 47-MA-08PV-08/AFIOH Report No. IOH-RS-BR-TR-2008-0001, May 08
I–9
AIR NUM MSANAL RPT_1 RPT_2 PPT_1 PPT_2 LDL_1 LDL_2 SW1 SW2 P95 CI95 TL_1 TL_2 22 21 334455P GND GND 0 0 14.2 15.8 0.818 0.757 40.6 36.5-47.3 626 568.823 4 123678D GND GND 0 0 15.5 31.2 0.715 0.789 68.5 59.6-74.9 607.5 419.323 6 1234678D G G 19.6 36.4 16.6 28.8 0.715 0.789 91.3 73.5-117 607.5 419.323 7 OCDD G GND 685 0 270.3 453.4 0.715 0.789 758 647-874 607.5 419.323 15 1234678F G GND 33.8 0 11.4 19.3 0.715 0.789 18.7 16.4-24.2 607.5 419.323 19 3445P G G 78.1 94 18.1 31.8 0.715 0.789 13.4 <13.1-16.3 607.5 419.323 20 33445P G GND 38.2 0 19.7 33.7 0.715 0.789 68.7 58.1-84.4 607.5 419.323 21 334455P GND GND 0 0 18 31.3 0.715 0.789 40.6 36.5-47.3 607.5 419.324 4 123678D GND GND 0 0 16.7 22.8 0.611 0.585 68.5 59.6-74.9 676.1 576.124 6 1234678D GND GND 0 0 19.2 22 0.611 0.585 91.3 73.5-117 676.1 576.124 7 OCDD GND GND 0 0 312.8 351.5 0.611 0.585 758 647-874 676.1 576.124 15 1234678F GND GND 0 0 13.3 15.3 0.611 0.585 18.7 16.4-24.2 676.1 576.124 19 3445P G G 75.5 83.3 19.6 28 0.611 0.585 13.4 <13.1-16.3 676.1 576.124 20 33445P G GND 24.1 0 21.3 28.1 0.611 0.585 68.7 58.1-84.4 676.1 576.124 21 334455P GND GND 0 0 20.5 25.6 0.611 0.585 40.6 36.5-47.3 676.1 576.125 4 123678D GND GND 0 0 17.4 17.3 0.757 0.71 68.5 59.6-74.9 511.9 673.925 6 1234678D GND GND 0 0 19.4 19.1 0.757 0.71 91.3 73.5-117 511.9 673.925 7 OCDD GND GND 0 0 322.9 318.2 0.757 0.71 758 647-874 511.9 673.925 15 1234678F GND G 0 16.4 13.2 13.3 0.757 0.71 18.7 16.4-24.2 511.9 673.925 19 3445P G G 54.9 66.2 20.6 21.4 0.757 0.71 13.4 <13.1-16.3 511.9 673.925 20 33445P G GND 32.2 0 21.7 22.6 0.757 0.71 68.7 58.1-84.4 511.9 673.925 21 334455P GND GND 0 0 20.1 20.9 0.757 0.71 40.6 36.5-47.3 511.9 673.9
USACHPPM Report No. 47-MA-08PV-08/AFIOH Report No. IOH-RS-BR-TR-2008-0001, May 08
Glossary-1
GLOSSARY ACRONYMS
ADI average daily intake AFIOH Air Force Institute for Operational Health AMSA Army Medical Surveillance Activity AT average time BW body weight CA concentration in air CAS No. Chemical Abstract Service Number CASF Contingency Aero-Medical Staging Facility CDC Centers for Disease Control and Prevention COC chemicals of concern COPC chemicals of potential concern CRM composite risk management CSF cancer slope factor
USACHPPM Report No. 47-MA-08PV-08/AFIOH Report No. IOH-RS-BR-TR-2008-0001, May 08
Glossary-2
cc cubic centimeter DNBI disease and non-battle injury DoDSR Department of Defense Serum Repository ED exposure duration EF exposure frequency EPC exposure point concentration ET exposure time EXSUM Executive Summary FHP&R Force Health Protection and Readiness HEAST Health Effects Assessment Summary Table HI hazard index HQ hazard quotient HRA health risk assessment Hrs hours

USACHPPM Report No. 47-MA-08PV-08/AFIOH Report No. IOH-RS-BR-TR-2008-0001, May 08
Glossary-3
ICD International Statistical Classification of Diseases IO Inorganic IR inhalation rate kg kilogram km kilometer L Liter L/min liter per minute m3 cubic meter m3/day cubic meter per day m meters MEG military exposure guideline mg/day milligram per day mL/min milliliter per minute mm millimeter
USACHPPM Report No. 47-MA-08PV-08/AFIOH Report No. IOH-RS-BR-TR-2008-0001, May 08
Glossary-4
ng nanogram NCEA National Center for Environmental Assessment NCEH National Center for Environmental Health NHANES National Health and Nutrition Examination Survey OCDD octachlorodibenzodioxin OCDF octachlorodibenzofuran OEH occupational and environmental health ppt parts per trillion PM10 particulate matter with an aerodynamic diameter of 10 micrometers and less PAHs polycyclic aromatic hydrocarbons PCB polychlorinated biphenyls PCBK physiologically based pharmocokinetic PCDD polychlorinated dibenzo-p-dioxin PCDF polychlorinated dibenzofuran

USACHPPM Report No. 47-MA-08PV-08/AFIOH Report No. IOH-RS-BR-TR-2008-0001, May 08
Glossary-5
PECDD pentachlorodibenzo-p-dioxins PECDF Pentachlorodibenzofuran pg picogram pg/g picogram per gram PUF polyurethane foam RfC reference concentration RfD reference dose RfDi Inhalation reference dose TCDD tetrachlorodibenzo-p-dioxin TEF toxicity equivalency factor TEQ Toxic equivalent TG Technical Guide TO Toxic Organic USACHPPM U.S. Army Center for Health Promotion and Preventive Medicine
USACHPPM Report No. 47-MA-08PV-08/AFIOH Report No. IOH-RS-BR-TR-2008-0001, May 08
Glossary-6
UCL upper-confidence limit USCENTCOM U.S. Central Command USD (AT&L) Under Secretary of Defense (Acquisition, Technology, and Logistics) U.S. EPA U.S. Environmental Protection Agency VOCs volatile organic compounds WD wind direction WHO World Health Organization WOE weight-of-evidence WS wind speed WTC World Trade Center
AFIOH/DOBP (STINFO) 2513 KENNEDY CIRCLE BROOKS CITY-BASE TX 78235-5116 ________________________________________________________ OFFICIAL BUSINESS
![Em Defesa da Força Conjunta Prática Assimilada na Base Balad · ment] 8, em 1985. Formalmente, delegava ao ... de Logística [Logistics Support Area Anaconda] e Base Aérea Balad](https://img.dokumen.tips/doc/110x75/5be6bebe09d3f247448d88f3/em-defesa-da-forca-conjunta-pratica-assimilada-na-base-ment-8-em-1985-formalmente.jpg)

![Telecommunication Products - Trendtek jointing pits.pdf · [01] UG2006 - P6 Pit UG2007 - P7 Pit UG2008 - P8 Pit UG2900 - P9 Pit UG2001 - P1 Pit UG2002 - P2 Pit UG2003 - P3 Pit UG2004](https://img.dokumen.tips/doc/110x75/5a7969077f8b9ab9308d3433/telecommunication-products-jointing-pitspdf01-ug2006-p6-pit-ug2007-p7-pit.jpg)