Embed Size (px)
Citation preview
Baseline Study 7
By
Agung Prasetyo, James Hewitt and Chen Hin Keong
EU FLEGT Facility
Kuala Lumpur January 2012
INDONESIA: Scoping Baseline Information for
Forest Law Enforcement, Governance and Trade

© EU FLEGT Facility, Jakarta: Scoping baseline information for Forest Law Enforcement, Governance and Trade, January 2012. 2
This Action is funded by the European Union and the governments of Finland, France, Germany, the Netherlands and the UK. The views expressed herein can in no way be taken to reflect the official opinion of the European Union. www.euflegt.efi.int
Regional Support Programme for the EU FLEGT Action Plan in Asia
Background The European Commission (EC) published a Forest Law Enforcement, Governance and Trade (FLEGT) Action Plan in 2003. FLEGT aims not simply to reduce illegal deforestation, but in promot-ing good forest governance, aims to contribute to poverty eradication and sustainable management of natural resources. The European Forest Institute (EFI), an international research organisation with its headquarters in Finland, conducts, advocates and facilitates forest research networking at the pan-European level. Under its Policy & Governance programme, the EFI assists in the EU’s implementation of the FLEGT Action Plan. In 2007, the EU FLEGT Facility was established, hosted and managed by the EFI. The Facility (i) supports the bilateral process between the EU and tropical timber-producing countries towards signing and implementing “Voluntary Partnership Agreements” (VPAs) under the FLEGT Action Plan, and (ii) executes the regional support programme for the EU FLEGT Action Plan in Asia. The FLEGT Asia Regional Office (FLEGT Asia) of the EFI’s EU FLEGT Facility was formally estab-lished in October 2009. FLEGT Asia seeks to collaborate and build synergies with existing regional initiatives and partners in Asia. The EU FLEGT Facility is managed and implemented by the EFI in close collaboration with the EU.
Goal of FLEGT Asia The goal of the FLEGT Asia Regional Programme is the promotion of good forest governance, con-tributing to poverty eradication and sustainable management of natural resources in Asia, through direct support of the implementation of the EU’s FLEGT Action Plan. Strategy The strategy to achieve this goal focuses on promoting and facilitating international trade in verified legal timber—both within Asia and exported from Asia to other consumer markets. In particular, it aims to enhance understanding of emerging demands in key timber-consuming markets and pro-mote use of systems that assist buyers and sellers of Asian timber and timber products to meet these demands. Work Programme The work programme to achieve the Programme’s goal has three phases:
Information Collection Baseline information (trade statistics, product flows, future scenarios, stakeholder identifica-tion and engagement strategies), applied to countries in the region. Information on produc-ers, processors, exports and major consumers of exports from this region will be collected and collated. It will then be used to develop training and communication materials; to further define the nature of the capacity-building to be undertaken (who the target beneficiaries and what the training needs are) and form the baseline for monitoring the progress over the three-year duration of the programme.
Capacity-building The second phase is the strengthening of key institutions (companies, trade associations, NGOs, government agencies, Customs organisations, etc.) for improved forest governance in each country and across the region to meet the identified market needs. This will consist of training (at individual level, training of trainers, workshops, pilot studies e.g. on individual
© EU FLEGT Facility, Jakarta: Scoping baseline information for Forest Law Enforcement, Governance and Trade, January 2012. 3
This Action is funded by the European Union and the governments of Finland, France, Germany, the Netherlands and the UK. The views expressed herein can in no way be taken to reflect the official opinion of the European Union. www.euflegt.efi.int
supply chains and for Timber Legality Assurance); information dissemination and communi-cations (roadshows, seminars, communication materials, website, etc).
Customs & Regional Collaboration
The work to support trade regionally and to invest in Customs capacity in accordance with market requirements will be undertaken in collaboration with other programmes in the region. The FLEGT Asia financed this report because it is part of phase 1 and 2 activities.
Address European Forest Institute—FLEGT Asia Regional Office c/o Embassy of Finland 5
th Floor, Wisma Chinese Chamber
258 Jalan Ampang 50450 Kuala Lumpur Tel: +60 3-42511886 Fax: +60 3-42511245 Website: www.efi.int/portal/projects/flegt, www.euflegt.efi.int
© EU FLEGT Facility, Jakarta: Scoping baseline information for Forest Law Enforcement, Governance and Trade, January 2012. 4
This Action is funded by the European Union and the governments of Finland, France, Germany, the Netherlands and the UK. The views expressed herein can in no way be taken to reflect the official opinion of the European Union. www.euflegt.efi.int
The views of the authors expressed in this publication do not necessarily reflect those of the Wild-life Trade Monitoring Network (TRAFFIC), World Wide Fund for Nature (WWF) or International Un-ion for Conservation of Nature (IUCN), or EFI. The designations of geographical entities in this publication, and the presentation of the material, do not imply the expression of any opinion whatsoever on the part of TRAFFIC or its supporting or-ganizations, or EFI, concerning the legal status of any country, territory, or area, or of its authori-ties, or concerning the delimitation of its frontiers or boundaries. The TRAFFIC symbol copyright and Registered Trademark ownership is held by WWF. TRAFFIC is a joint programme of WWF and IUCN.
© EU FLEGT Facility, Jakarta: Scoping baseline information for Forest Law Enforcement, Governance and Trade, January 2012. 5
This Action is funded by the European Union and the governments of Finland, France, Germany, the Netherlands and the UK. The views expressed herein can in no way be taken to reflect the official opinion of the European Union. www.euflegt.efi.int
TABLE OF CONTENTS
Acknowledgements 8
Acronyms 9
EXECUTIVE SUMMARY 12
1. INTRODUCTION 12
2. METHODOLOGY 18
3. POLICY AND LEGISLATION 19
4. FOREST RESOURCES 24
4.1 Certification 30
5. LOGGING, TRADE AND ILLEGALITY 32
6. THE INDUSTRY 35
7. WOOD-BASED PRODUCTS INDUSTRY STAKEHOLDERS 38
8. TRADE IN TIMBER-BASED PRODUCTS 38
8.1 Timber Sector 38 8.2 Paper Sector 43 8.3 Trade in wood-based products - Imports 44 8.4 Trade in wood-based products - Exports 45 8.4.1 Sawn timber 46 8.4.2 Veneer 47 8.4.3 Plywood 48 8.4.4 Mouldings and Joinery 50 8.4.5 Wooden Furniture 52 8.4.6 Wood Chips 54 8.4.7 Wood-based Pulp and Paper 54
9. CROSS BORDER TRADE AND CUSTOMS 55 9.1 Customs and trade statistics 55 9.2 Indonesian supply chain and export procedure 59
10. FUTURE OUTLOOK 62
11. CONCLUSION AND RECOMMENDATIONS 64
REFERENCES 68
© EU FLEGT Facility, Jakarta: Scoping baseline information for Forest Law Enforcement, Governance and Trade, January 2012. 6
This Action is funded by the European Union and the governments of Finland, France, Germany, the Netherlands and the UK. The views expressed herein can in no way be taken to reflect the official opinion of the European Union. www.euflegt.efi.int
LIST OF TABLES
Table 1: Allocation of forest lands in Indonesia 25 Table 2: Progress of Natural Forest Concessions issued in Indonesia
(IUPHHK/HPH)(1991/1992–2009) 26 Table 3: Progress of plantation in forest concessions issued in Indonesia (1995/1996-2009 26 Table 4: Indonesia’s log production based on source of production in 2004–2008 27 Table 5: Deforestation rate in 7 major islands in Indonesia between 2000 and 2005 29 Table 6: Certified FMUs LEI-FSC system scheme in Indonesia as of June 2010 30 Table 7: Certified FMUs with FSC scheme in Indonesia as of October 2010 31 Table 8: Indonesia’s log and wood processes and wood production during 1997-2008 (m
3) 35
Table 9: Indonesia’s installed production capacity of the primary forestry industry (IPHH) in 2008 36
Table 10: Indonesia’s installed capacity of pulp Industry from 1997-2007 (tonnes) 37 Table 11: Realization of industrial raw materials fulfilment plan, Indonesia (Capacity > 6.000
m³/year, during 2006–2008) 37 Table 12: EU share of export of Indonesia’s timber sector between 2000 and 2009 in million
m3 RWE 40
Table 13: A comparison of the export volumes (m3) for HS4403 logs as reported by Indonesia
and its importing partner Japan 56 Table 14: A comparison of the export volumes for HS4403 lumber between Indonesia and
trading partners with huge discrepancies (m3) 56
LIST OF FIGURES
Figure 1: Indonesia’s area of concessions in Production Forests (2008) and the annual per-
mitted cut by regions (2009) 27 Figure 2: Log production (m
3) from 2004-2008 from various sources in Indonesia 28
Figure 3: Export value (USD) and destinations of forest products from Indonesia in 2009 39 Figure 4: Indonesia’s exports of furniture (weight in million kg and % of total national furniture
exports) to selected destination countries in 2009 41 Figure 5: Indonesia’s imports of wood based products from 2000-2009 in million m
3 RWE 44
Figure 6: Indonesia’s exports of wood-based products (by products) from 2000-2009 in mil-lion m
3 RWE 45
Figure 7: Indonesia’s exports of sawn timber by destination country from 2000-2009 in mil-lion m
3 RWE 46
Figure 8: The EU’s imports of tropical sawn timber from 2000-2009 in million m3 RWE 47
Figure 9: Veneer exports from Indonesia, Malaysia, the Philippines and Singapore from 2000-2009 in million m
3 RWE 47
Figure 10: Export of plywood from Indonesia, Malaysia, the Philippines and Singapore from 2000-2009 in million m
3 RWE 48
Figure 11: The EU’s imports of plywood from mainland China, tropical Africa, tropical South America and tropical countries elsewhere from 2000-2009 in million m
3 RWE 49
Figure 12: Exports of moulding and joinery from Indonesia, Malaysia, the Philippines and Sin-gapore from 2000-2009 in million m
3 RWE 50
Figure 13: The EU’s imports of mouldings and joinery from East Asia, tropical Africa and tropi-cal South America from 2000-2009 in million m
3 RWE 51
Figure 14: Furniture export from Indonesia, Malaysia, the Philippines and Singapore from 2000-2009 in million m
3 RWE 52
Figure 15: The EU’s imports of wooden furniture from East Asia, South America and tropical Africa from 2000-2009 in million tonnes 53
Figure 16: The EU’s imports of pulp from Asia, Brazil and Russia from 2000-2009 in million tonnes and USD 54
© EU FLEGT Facility, Jakarta: Scoping baseline information for Forest Law Enforcement, Governance and Trade, January 2012. 7
This Action is funded by the European Union and the governments of Finland, France, Germany, the Netherlands and the UK. The views expressed herein can in no way be taken to reflect the official opinion of the European Union. www.euflegt.efi.int
LIST OF ANNEXES
Annex 1: Indonesia—additional information of interest 74 Annex 2: Indonesia’s imports of wood-based products from 2000-2009 in million m
3 RWE 76
Figure 1: Indonesia’s imports of paper products by supplying countries from 2000-2009 in million m
3 RWE 76
Figure 2: Indonesia’s imports of other timber sector products by supplying coun-tries from 2000-2009 in million m
3 RWE 76
Figure 3: Indonesia’s imports of VPA core products by supplying countries from 2000-2009 in million m
3 RWE 77
Figure 4: Indonesia’s imports of plywood by supplying countries from 2000-2009 in million m
3 RWE 77
Figure 5: Indonesia’s imports of other panels by supplying countries from 2000-2009 in million m
3 RWE 78
Figure 6: Indonesia’s imports of sawn timber by supplying countries from 2000-2009 in million m
3 RWE 78
Figure 7: Indonesia’s imports of logs by supplying countries from 2000-2009 in million m
3 RWE 79
Annex 3: Indonesia’s exports of wood-based products from 2000-2009 in million m3 RWE 80
Figure 8: Indonesia’s exports of VPA core products by destination countries from 2000-2009 in million m
3 RWE 80
Figure 9: Indonesia’s exports of other Timber sector products by destination countries from 2000-2009 in million m
3 RWE 80
Figure 10: Indonesia’s exports of other paper sector products by destination countries from 2000-2009 in million m
3 RWE 81
Figure 11: Indonesia’s exports of veneer products by destination countries from 2000-2009 in million m
3 RWE 81
Figure 12: Indonesia’s exports of plywood products by destination countries from 2000-2009 in million m
3 RWE 82
Figure 13: Indonesia’s exports of mouldings and joinery by destination countries from 2000-2009 in million m
3 RWE 82
Figure 14: Indonesia’s exports of wooden furniture by destination countries from 2000-2009 in million tonnes 83
Figure 15: Indonesia’s exports of wood chips by destination countries from 2000-2009 in million tonnes 83
Figure 16: Indonesia’s exports of pulp by destination countries from 2000-2009 in million tonnes 84
Figure 17: Indonesia’s exports of paper by destination countries from 2000-2009 in million tonnes 84
© EU FLEGT Facility, Jakarta: Scoping baseline information for Forest Law Enforcement, Governance and Trade, January 2012. 8
This Action is funded by the European Union and the governments of Finland, France, Germany, the Netherlands and the UK. The views expressed herein can in no way be taken to reflect the official opinion of the European Union. www.euflegt.efi.int
Acknowledgements
The production of this report was commissioned by European Forest Institute’s EU FLEGT Facility which is funded by EU, Finland, France, Germany, the Netherland and the United Kingdom. Spe-cial thanks go to Vincent van den Berk, Aimi Lee Abdullah, Tiina Joutsenvaara and others for their support, patience and feedback. The authors are grateful for the funding support from EFI for sup-port for this study. The authors would like to thank Hugh Speechly, Flip van Helden, and Thibaut Portevin for review-ing this report. The authors also wish to thank TRAFFIC colleagues for their review of the report, in particular: Roland Melisch, Stephanie von Meibom, William Schaedla, Richard Thomas, Sabri Zain and Julie Gray.
© EU FLEGT Facility, Jakarta: Scoping baseline information for Forest Law Enforcement, Governance and Trade, January 2012. 9
This Action is funded by the European Union and the governments of Finland, France, Germany, the Netherlands and the UK. The views expressed herein can in no way be taken to reflect the official opinion of the European Union. www.euflegt.efi.int
Acronyms
AAC Annual Allowable Cut APFSOS FAO’s Asia Pacific Forest Sector Outlook Study APHI Asosiasi Pengusaha Hutan Indonesia—Indonesian Association for Forest
Concessionaires APKI Asosiasi Pulp dan Kertas Indonesia—Indonesian Association of Pulp and
Paper Industry APKINDO Asosiasi Panel Kayu Indonesia—Indonesian Association of Wood Panel In-
dustry APP Asia Pulp and Paper company ASEAN Association of Southeast Asia Nations ASOF ASEAN Senior Officers on Forestry meeting ASMINDO Asosiasi Industri Permebelan dan Kerajinan Indonesia—Indonesian Associa-
tion of Furniture Producers BATS Tawau Barter Trade Association BPS Badan Pusat Statistik—Indonesian Central Bureau of Statistics BRIK Badan Revitalisasi Industri Kehutanan—Indonesian Forest Industry Revitali-
sation Body CBFM Community-based forestry management CITES Convention on International Trade in Endangered Species of Wild Fauna
and Flora COMTRADE UN’s Commodity Trade Statistics Database CO2 Carbon dioxide CSR Corporate Social Responsibility Dinas Kehutanan Provincial forest service, Indonesia EC European Commission EFI European Forest Institute EIA Environmental Investigation Agency EU European Union EU TR EU’s Timber Regulation Eurostat Directorate-General of the European Commission to provide statistical in-
formation of the EU FAO Food and Agriculture Organisation FAO FRA FAO Forest Resources Assessment report FAOSTAT FAO Statistical Database on agriculture, nutrition, fisheries, forestry, food
aid, land use and population FLEG Forest Law Enforcement and Governance FLEGT Forest Law Enforcement, Governance and Trade FMU Forest management unit FSC Forest Stewardship Council FTZ Free Trade Zone GOI Government of Indonesia HoB Heart of Borneo Initiative HPH Hak Pengusahaan Hutan—Indonesian Forest Concessionaire HS WCO’s Harmonized Commodity Description and Coding System HTI Hutan Tanaman Industri—Indonesian industrial plantation forest) HTR Hutan Tanaman Rakyat—Indonesian community plantation forest IDR Indonesia currency, Rupiah IMF International Monetary Fund IPHH Industri Primer Hasil Hutan— Indonesian primary forestry industry IPHHK Industri Primer Hasil Hutan Kayu—Indonesian primary processing of timber
licence IPK Izin Pemanfaatan Kayu—Indonesian permit to utilise timber
© EU FLEGT Facility, Jakarta: Scoping baseline information for Forest Law Enforcement, Governance and Trade, January 2012. 10
This Action is funded by the European Union and the governments of Finland, France, Germany, the Netherlands and the UK. The views expressed herein can in no way be taken to reflect the official opinion of the European Union. www.euflegt.efi.int
IPK-KBK Izin Pemanfaatan Kayu—Kawasan Budidaya Kehutanan—Indonesian permit to use timber in areas designated for forestry use
IPK-KBNK Izin Pemanfaatan Kayu—Kawasan Budidaya Non Kehutanan—Indonesian permit to use timber in areas designated for non-forestry use
ISWA Indonesia Saw Millers and Wood Product Manufacturers Association ITTO International Tropical Timber Organisation IUCN International Union for Conservation of Nature IUPHHK Izin Usaha Pengelolaan Hasil Hutan Kayu—Indonesian logging licence IUPHHK-HT Izin Usaha Pengelolaan Hasil Hutan Kayu—Hutan tanaman—Indonesian
logging licence for plantation forest JLU Jalur Lintas Utara – Northern Trans Route in Kapuas Province, Indonesia KAIL Konsortium Anti Illegal Logging—Indonesian Consortium against illegal log-
ging LEI Lembaga Ekolabel Indonesia—Indonesian Eco-labeling Institute LHC Laporan Hasil Cruising—Indonesia cruising result report LHP Laporan Hasil Penebangan—Indonesia timber felling report LKPO Indonesia wood processing and storage report LPI Lembaga Penilai Independen—Indonesian Independent Verification Body LVL Laminated veneer lumber MoF Ministry of Forestry, Indonesia MPR Majelis Permusyawaratan Rakyat—Indonesia’s People’s Consultation As-
sembly (highest legislative body) NGOs Non-Governmental Organisations NLPF Indonesia’s National Land Policy Framework NTT Nusa Tenggara Timur, Indonesia P2LHP Pejabat Pengesah Laporan Hasil Penebangan—Indonesia authorised official
to validate log report P2SKSHH Pejabat Penerbit Surat Keterangan Sahnya Hasil Hutan—Indonesia author-
ised official to issue transport permit PEFC Programme for the Endorsement of Forest Certification PHBM Pengelolaan Hutan Berbasis Masyarakat—Indonesian community-based
forest management PHPBM Pengelolaan Hutan Partisipasi Bersama Masyarakat—Indonesian participa-
tive forest management with the community PMDH Pembangunan Masyarakat Desa Hutan—Indonesia Rural Forest-based
Community Development POHM Pengelolaan Hutan oleh Masyarakat—Indonesian forest management by the
community PP Peraturan pemerintah (government regulation) PPATK Pusat Pelaporan dan Analisis Transaksi Keuangan—Indonesian Centre for
reporting and analysis of monetary transactions PT Perseroan Terbuka—Indonesia Limited Liability company REDD Reducing Emissions from Deforestation and Forest Degradation REL Reference emission level RKT Rencana Kerja Tahunan—Indonesia annual cutting plan RWE Roundwood equivalent SEA Southeast Asia SFM Sustainable Forest Management Silin Indonesia’s intensive silviculture system SKAU Surat Keterangan Asal Usul—Indonesian reference letter about source of
origin of timber SKSKB Surat Keterangan Sahnya Kayu Bulat—Indonesian licence to transport logs SKSHH Surat Keterangan Sahnya Hasil Hutan—Indonesian legal forest products
permit
© EU FLEGT Facility, Jakarta: Scoping baseline information for Forest Law Enforcement, Governance and Trade, January 2012. 11
This Action is funded by the European Union and the governments of Finland, France, Germany, the Netherlands and the UK. The views expressed herein can in no way be taken to reflect the official opinion of the European Union. www.euflegt.efi.int
spp. species SVLK Sistem Verifikasi Legalitas Kayu—Indonesian Timber Legality Verification
System TGHK Tata Guna Hutan Kesepakatan—Indonesian Forest-Boundary Setting by
Consensus TLAS EU Timber Legality Assurance Scheme VPA EC’s Voluntary Partnership Agreement UN United Nations UNECE United Nations Economic Commission for Europe UNFCCC United Nations Framework Convention on Climate Change USA United States of America WCO World Customs Organisation WWF World Wide Fund for Nature WWF GFTN WWF Global Forest and Trade Network

© EU FLEGT Facility, Jakarta: Scoping baseline information for Forest Law Enforcement, Governance and Trade, January 2012. 12
This Action is funded by the European Union and the governments of Finland, France, Germany, the Netherlands and the UK. The views expressed herein can in no way be taken to reflect the official opinion of the European Union. www.euflegt.efi.int
EXECUTIVE SUMMARY
A report by Chatham House explained that the illegal logging rate has been significantly re-duced in Indonesia (75%) during the last decade. However, Indonesia has already lost around 33.4 million hectares of forest areas due to high forest conversion rate to other land uses and the estimation has not included the loss from conversion of forests. To combat this, the Gov-ernment of Indonesia, through the Ministry of Forestry (MoF) has established eight policy pri-orities for the forestry sector in order to achieve sustainable forest management (SFM). Unfortunately, the global economic crisis in 1997-1998, and the crisis of 2007-2009 which also affected Indonesia, the changes in national politics, and the initial implementation of regional autonomy through the decentralization process have increased uncertainty in doing business and more destruction of natural forests. Illegal logging has emerged as a serious threat to the quest of Indonesia to manage its forests sustainably. Indonesia has signed MOUs with UK, China, etc. to collaborate on combating illegal logging and associated timber trade. In 2011, Indonesia has entered into a Voluntary Partnership Agreement (VPA) with the EU to ensure only legal timber is exported to the EU. To help improve the credibility of legality of Indonesian timber products in the global market the government developed and implemented a Timber Legality Verification System (SVLK). The Sistem Verifikasi Legalitas Kayu (SVLK) has various components, such as definition of timber legality, control of supply chain, verification system and independent monitoring sys-tems. In addition to the resource base policies, the government also adopted several trade policies relating to forestry industry, e.g. a log export ban policy since 8 October 2001 and a sawn tim-ber export ban and tax policy since 2004. The trade data analysis shows that the log production in Indonesia has decreased over the years. As forests are depleted, production will come from sustainably managed permanent forest and from plantations, as more such areas come on-line. Therefore the source of logs for downstream industry in Indonesia has to be from a combina-tion of sources: natural permanent forests, private forest, community forests, and plantations. The last-mentioned is controversial, partly due to potential for forest land conversion to planta-tions, but plantations also provide the best hope for sustaining the local timber industry. Indo-nesia has aimed for a significant increase in plantation forests, but this will require enabling policies, investment and strong monitoring and enforcement actions by the authorities to miti-gate the issues related to the establishment of plantation forests. However, as the policies have only been recently formulated, and implementation of plantation strategies is still in an early stage, the production from local sources has yet to catch up with the installed capacity of the industry. The installed capacity of IPHH in 2008 was estimated around 23.4 million m
3 of
which the installed capacity for pulp production was approximately 6.4 million tonnes or about 28.8 million m
3 RWE (1 tonne equals to 4.5 m
3 RWE) in 2007. Java has a very extensive area
of long established plantations (primarily of teak but also of mahogany and pine). Acacia spe-cies (primarily Acacia mangium) account for the bulk of the plantation-grown pulpwood. Timber supply from sustainable and legal sources still cannot meet the demand for raw mate-rials for forestry industry. Due to constraints in supply of raw material, the pulp industry had to import about 800 000 m
3/year from various sources and there was still about 200,000 m
3 un-
fulfilled capacity (idle capacity) per year. Several studies showed that there was still 25 to 30 million m³ of timber demand that could not be fulfilled from sustainable and legal sources in the last decade. This gap is expected to be gradually reduced by increasing yield from timber plantations.
© EU FLEGT Facility, Jakarta: Scoping baseline information for Forest Law Enforcement, Governance and Trade, January 2012. 13
This Action is funded by the European Union and the governments of Finland, France, Germany, the Netherlands and the UK. The views expressed herein can in no way be taken to reflect the official opinion of the European Union. www.euflegt.efi.int
Forest land and forest cover classification in Indonesia has been continuously changing due to the changing land use policy. In 2009 total forest size, based on synchronized Indonesian Forest-Boundary Setting by Consensus (TGHK) and Provincial Spatial Plan was 137.09 mil-lion hectares. The data used are from government sources as there are very little other national data from other sources and there are shortcomings in the quality of the data. The total area of Production Forests (Limited and Permanent Production Forests) was about 59 million hectares, which consisted of primary forests (14.98 million ha), secondary forests (23.11 million ha), plantations (2.82 million ha), non-forested land (18.59 million ha), and un-classified areas (989,000 ha) in 2009. However, degraded Production Forest was estimated at about 19.5 million hectares in 2006. In 2008, about 32 million m
3 log had been produced from production natural forests (annual
working plan) and 2.76 million m3 from cleared natural forest land which had been allocated for
other uses (agricultural, mining, infrastructure). These amounts should be reconciled with the actual harvest as there were differences found between the plans and actual logging. Indus-trial plantation forest plantation (HTI) has contributed about 22.4 million m
3 log production.
There were also 2.2 million m3 of logs sourced from other legal sources.
Timber production from natural forests has been decreasing and in 2009 was about 4.6 million m
3. In contrast, timber production from plantation forests increased significantly from 7 million
m3 to 22 million m
3 from 2004 to 2008. Timber production from the clear cutting of natural for-
ests ranged from 1.6 million m3 in year 2004 to 2.7 million m
3 in year 2008.
The total area that has been certified by voluntary certification systems (Forest Stewardship Council (FSC) and Lembaga EkoLabel Indonesia (LEI)) is less than 5% of total Production Forest. The Forest Management Unit (FMU) certification is issued on a voluntary basis; or by the Indonesian Independent Verification Body or Lembaga Penilai Independen (LPI) under the MoF on a mandatory basis. By June 2010, twenty FMUs covering 1,547,551 had been certi-fied under LEI and FSC schemes, a small percentage of the 26.16 million hectares of natural forest concession areas. Sawn timber production was at its peak of 10.4 million m
3 in 1989, then declined sharply to 4.3
million m3 in 2005. Plywood and veneer production also increased sharply from 1 million m
3 in
1980 to its peak of 9.7 million m3 in 1997, and then declined to 4.7 million m
3 in 2005. Pulp
production increased rapidly from 0.5 million tonnes in 1989 and reached 5.4 million tonnes in 2005. Pulp production has increased to 5.97 million tonnes in 2009. In addition, the produc-tion of other forest products such as woodworking, block-board, particleboard and chips was estimated to have reached between 0.1 million m
3 to 2.3 million m
3 during the period 1983-
2005. There was little change last decade in the quantity of wood-based raw material which was im-ported annually into Indonesia. The total value of timber sector export from Indonesia in 2009 was USD3.27 billion and for pulp and paper it was USD4.26 billion. The main destination countries for Indonesia’s timber export are mainland China, Japan, Korea, EU and USA. Plywood comprised 50% of the total export value, followed by pulp (47%), sawn timber (2%) and veneer (1%). In 2009, the main destination country/territory for pulp export from Indonesia was mainland China, with total ex-port value of USD472 million of the total USD740 million of pulp export value. Total export value of the timber sector in 2009 to the EU countries and the USA was USD849 million and

© EU FLEGT Facility, Jakarta: Scoping baseline information for Forest Law Enforcement, Governance and Trade, January 2012. 14
This Action is funded by the European Union and the governments of Finland, France, Germany, the Netherlands and the UK. The views expressed herein can in no way be taken to reflect the official opinion of the European Union. www.euflegt.efi.int
USD557 million (26% and 17% respectively, of the total Indonesian timber export value in 2009). Indonesia has dominated exports in the mouldings and joinery, furniture, pulp and paper sec-tors. It would appear, looking at the production trends, that Indonesia has been successful in promoting further downstream development. Wooden furniture, and mouldings and joinery accounted for more than half of the export value of timber sector products exported from Indonesia during 2009. Plywood accounted for a fur-ther third. The log export ban has greatly facilitated the expansion of Indonesia’s plywood in-dustry, which accounts for most of the RWE volume consumed by the timber sector—and roughly 60% of the RWE volume exported during recent years. The recent financial crisis that hit the EU Member States and the USA has had an impact on the trade from Indonesia leading to a decline of export volumes of sawn timber and veneer from Indonesia to the EU countries and the USA. Export volume and value have significantly declined for sawn timber and veneer. Indonesia has prohibited the export of rough sawn timber products which accounts for much of the HS4407 sawn timber product category since 2004. However, importing countries’ trade statistics indicate that sawn timber continues to be exported in substantial volumes, although these have been declining since 2002. This contrasts with export statistics declared by Indo-nesia—which slumped to near zero during 2004. The difference is unlikely to be attributable to sawn timber being misclassified as mouldings—exports of which have declined gradually since 2003. Although mismatches between Indonesia’s exports and importing countries’ im-ports have repeatedly been shown to be large, effective action to resolve those differences has yet to take place. Overall and by both RWE volume and export value, the EU was the destination for an increas-ing share of the timber sector products which were exported from Indonesia during the last decade, even as Indonesia’s timber sector exports was declining. The cost per cubic metre of the timber sector to the EU has been increasing yearly even as the decline in exports has con-tinued. Furniture exports from Indonesia have been a major foreign exchange earner for the country. The main exports has been to the EU countries and the USA amounting to USD330 million and USD360 million respectively in 2009. These values were greater than values of exports to the Asian countries (mainland China, Japan and Korea) which only came up to USD208 mil-lion in 2009. Since furniture is included in the VPA, this could have significant impacts on In-donesia’s furniture exports. A temporary shock would be expected at the initial stage of the implementation (adjustment phase) due to the high volume and price of the exports to the EU in relation to other markets. The implementation of the legality verification system for raw ma-terials would be expected to help recover from the shock in a relatively short period of time. The first potential major impact of the VPA once implementation begins will be the significant decline in demand of wood products from Indonesia with only the legal ‘portion’ targeted at EU market. This will mean that any alleged mix of illegally sourced wood products that were ex-ported to the EU countries prior to the VPA implementation will shift to other less stringent markets. However, this also depends on how quickly and efficiently the EU member states can begin monitoring and enforcement efforts to signal their resolve to the market place. SVLK as an instrument to determine the legality of VPA could potentially increase production cost that in turn could undermine community forest development, which is currently growing very rap-idly, especially on Java Island. Therefore, SVLK needs to be adjusted for community forests.
© EU FLEGT Facility, Jakarta: Scoping baseline information for Forest Law Enforcement, Governance and Trade, January 2012. 15
This Action is funded by the European Union and the governments of Finland, France, Germany, the Netherlands and the UK. The views expressed herein can in no way be taken to reflect the official opinion of the European Union. www.euflegt.efi.int
The paper sector has increased steadily in exports from 17.82 million m3 RWE in 2000 to
around 26 million m3 RWE in 2006, since when it has remained relatively constant to 2009.
The RWE volume of wood-based products imported into Indonesia is small relative to that which is exported. Pulp and paper account for the bulk of those imports. Timber products im-ports amounted to 1.2 million m
3 RWE in 2009, whereas paper sector imports was 6.9 million
m3 RWE, mostly dominated by wood-based pulp at 4.8 million m
3 RWE and paper at 2.1 mil-
lion m3 RWE. In 2009, most of the pulp was supplied from Brazil, Canada, Chile, New Zea-
land, South Africa, and Sweden; and East Asia (mainland China, Japan, and Taiwan) supplies most of the rapidly increasing quantity of paper. Indonesia’s imports of VPA core products (logs, sawn timber, plywood and veneer) were mostly from China, Malaysia, EU, New Zealand and USA. Although the total RWE volume of wood-based products exported from Indonesia declined slightly over the last decade, the share accounted for by the timber sector declined rapidly from a high of 23.38 million m
3 RWE in 2001 to 8.24 million m
3 RWE in 2009 and this decline
has not been compensated for by the paper sector. Plywood and, to a lesser extent, mould-ings and joinery accounted for most of the decline. The main countries of export of VPA core products by Indonesia was mainly Japan in the last decade, although Japan’s imports has been decreasing dramatically. The total exports of VPA core products have been reducing steadily to 4.7 million m
3 RWE in 2009. The export volume
for all other timber sector products (minus VPA core products) has dropped to 3.52 million m3
RWE in 2009. The main countries of exports have been EU, Australia, China, Japan, South Korea, Taiwan and USA. The exports of the paper sector has been increasing steadily from 17.82 million m
3 RWE in
2000 to around 26 million m3 RWE in the latter half of the last decade. The main countries of
exports have been China, Japan, South Korea, EU, and Malaysia. The Middle East is an important and growing market for timber from the insular SEA sub-region. There are no restrictions or barriers to imports of timber, and Indonesia and Malaysia have been developing trade networks and relations to increase trade flows of timber to the re-gion. In 2009, Indonesia’s export to the Middle East amounted to just over 1 million m
3 RWE.
The decline of forest product exports was mainly caused by the closure of many Industri Primer Hasil Hutan (IPHH) or Indonesian primary forestry industry (capacity <6000 m
3/year)
due to an insufficient supply of raw materials after enforcement of illegal logging, and decreas-ing demand for plywood products from Japan. A very useful tool to help in the monitoring of cross-border trade and to address any potential impact of changing buyer demands and regulations, such as the EU Timber Regulation and Lacey Act, is to have real-time comparative analysis of Customs statistics. The more recent the data, the finer the scale of monitoring. The EC has been stressing that the Timber Regula-tion is not a border measure and hence there is no defined role specifically identified for Cus-toms—at least not when it comes to controlling the external border of the EU. There is an important role for Customs in supporting the implementation of the Timber Regula-tion by contributing important information. Under the VPA, Customs will also have to control imports of VPA-licensed timbers. Directly cross-checking Customs export declaration and Customs import declaration forms can provide very accurate controls and enforcement and monitoring, on volumes, species (where appropriate and required), values, shipper and ex-porter and importer. Comparative analysis of Customs data by HS categories can provide a

© EU FLEGT Facility, Jakarta: Scoping baseline information for Forest Law Enforcement, Governance and Trade, January 2012. 16
This Action is funded by the European Union and the governments of Finland, France, Germany, the Netherlands and the UK. The views expressed herein can in no way be taken to reflect the official opinion of the European Union. www.euflegt.efi.int
simple tool and method to look at the impacts of external factors such as regulatory changes, procurement policies, and control mechanisms. A wood balance model (differences between all production, including imports against domestic consumption and exports) has been tried before with limited success, as data capture at the national and provincial levels varies by country and within country. The use of both the com-parative statistical analysis and wood balance model together may provide some idea of the extent of illegal logging and illegal timber trade within a country and possible gaps and weak-nesses of the governance system. Large discrepancies should be investigated immediately. The EU should consider the following recommendations to assist Indonesia to meet the VPA and EU Timber Regulation requirements:
Enhance the awareness and knowledge of the VPA and the EU Timber Regulation, and their implications, among all the stakeholders in the country. This is particularly important for those industries in the chain supplying EU markets, directly or in-direct via a third country which will need to ensure they have clear evidence of the origin of their raw mate-rial and verification of its legality. It is recommended that more awareness, training and capacity-building among the industry, civil society and government agencies be con-ducted. A particular challenge with the Timber Regulation is that the legal requirements for forestry and timber trade preclude the need to have a full traceability system. Since there is legal requirement for the government to have a traceability system in place, it will be difficult for operators in the EU to obtain legal documents that are fully traceable back to the stump. Hence, the evidence that might be needed for operators and monitoring or-ganisations under the Timber Regulation has to be from a combination of legal documen-tation and company systems, records and procedures.
Continued support to Indonesia to help resolve land tenure disputes in a timely manner; with conflict-resolution mechanisms in place. Also, government administrative efficiency and effectiveness of policy implementation needs to be enhanced; sufficient investment must be made available; and greater engagement by civil society groups in development activities is needed.
Assistance to Indonesia to harmonize the various visions, missions, and priorities among provinces and districts which are reflected in the wide variety of institutions and forest management regulations.
Continued support to Indonesia in good public and corporate governance, to create con-ducive environments for integration and collaborative empowerment of sustainable for-estry development and good governance and transparency in the forestry sector. This in-cludes awareness and capacity-building aimed at the general public, non-governmental organisations (NGOs) and the private sector on ethical consumerism, sustainable devel-opment, climate change, Reducing Emissions from Deforestation and Forest Degradation (REDD), conservation, certification, and other issues that have an impact on the forestry sector and also in encouraging responsible purchasing domestically.
Development of communication on full chain of custody regulation of timber products with other major timber importers (mainland China, Japan Korea and the USA), where part of Indonesia’s timber products is processed in a third country/territory before entering the EU.
Support for more analysis of the re-export of Indonesian timber from mainland China to Western markets. For market demand to influence the implementation of best practice and legality of forest management in Indonesia there must be a critical mass. For this
© EU FLEGT Facility, Jakarta: Scoping baseline information for Forest Law Enforcement, Governance and Trade, January 2012. 17
This Action is funded by the European Union and the governments of Finland, France, Germany, the Netherlands and the UK. The views expressed herein can in no way be taken to reflect the official opinion of the European Union. www.euflegt.efi.int
reason there is a need to continue focusing on the major Asian markets for Indonesian timber products, including mainland China, Malaysia and Japan.
Continued support to Indonesia in the development of social safeguard policies for com-munity forest and small/medium forestry enterprises prior to implementation of interna-tional agreements such as the VPA.
Assistance in developing ways of capturing national data on domestic trade. Govern-ments should develop a system for data collection, compilation and analysis to determine the scale and scope of domestic consumption. This information, coupled with production data, imports and exports, can give a good basis for evaluating and revising national poli-cies, legislation and systems.
Engagement with other countries and territories that import timber from Indonesia but which may not have comparatively stringent import requirements, including the East Asia markets, India and the Middle East. For countries such as China and Japan, which are al-ready in dialogue with the EU, the EU should identify specific areas for collaboration, such as Customs co-operation.
The study recommends the use of national export and import statistics as the most cost effective methodology for periodic monitoring of baseline trade data. A comparative analysis approach should be carried out for each shipment where possible, or on a monthly basis, using specific and corresponding HS codes.
Encourage Indonesia government to request importing country’s Customs verify the tim-ber shipment against the Customs export declaration form of Indonesia. In many coun-tries, no amendment of regulations is needed for this, only the political will to institute the additional request for documentation.
Support further training of Customs agents should be carried out to ensure they are up to date with national legislation on timber trade and forestry, including that in trading coun-tries, as well up to date with international conventions and measures of trading partners that affect trade, such as the Lacey Act, EU Timber Regulation, etc. Such training should be embedded in the national Customs training academy to ensure it is institutionalised, as officers are transferred on a regular basis and new officials have to be re-trained regu-larly.

© EU FLEGT Facility, Jakarta: Scoping baseline information for Forest Law Enforcement, Governance and Trade, January 2012. 18
This Action is funded by the European Union and the governments of Finland, France, Germany, the Netherlands and the UK. The views expressed herein can in no way be taken to reflect the official opinion of the European Union. www.euflegt.efi.int
1. INTRODUCTION This study provides an overview and baseline of information relating to timber trade, industry and forest governance within Indonesia. It draws on existing national and international data and recommends steps for further analysis and monitoring, and proposes an engagement strategy for moving the Asia Regional Programme of the European Union (EU)’s Forest Law Enforcement, Governance and Trade (EU FLEGT) forward in its implementation with key stakeholders in Indonesia. The country is divided into 33 provinces and special areas (urban agglomerations), 10 in Su-matra, 6 in Java, 4 in Kalimantan, 3 in Nusa Tenggara including Bali, 6 in Sulawesi, and 2 each in Maluku and Irian Jaya. Indonesia has the third largest area of tropical forests and the fourth largest population in the world with very diverse ethnicity and cultures. The three largest islands of Sumatra, Kalimantan and Irian Jaya are characterized by exten-sive coastal plain and inland hilly areas of up to about 1,000 m. This amounts to 74% of land area in central and southern Sumatra, 40% in northern Sumatra, 84% in western and central Kalimantan, 50% in eastern Kalimantan and 60% in Irian Jaya. These are where the majority of the timber is harvested. The remaining areas are mountainous, formed by the Barisan range in western Sumatra, the interior ranges of eastern Kalimantan and the Bird’s Head, and northern and central ranges in Irian Jaya. Sulawesi is largely mountainous, with only 40% be-low 1,000 m, mainly in the south and south-east. Java is characterized by a series of 15 vol-canoes and other mountains well spaced with, between them, fertile plains and a broad north-ern coastal plain to the Java Sea, with 63% of the area below 1,000 m. The Maluku and Nusa Tenggara are of similar size, containing volcanoes and mountains while the plains and lower hills of below 1,000 m are limited to 44%. Additional information on Indonesia is found in Annex 1.
2. METHODOLOGY The study uses official Customs statistics of countries and territories for the period 2000–2009 for analysis—this period is frequently referred to as the “last decade” in this report. The rea-son for using the Customs data is elaborated upon in the section on Customs. In terms of the data sets that are the most readily available and accessible, custom statistics are one of the few data sets that are comparable across countries. The official Customs statistics of the study countries and territories are classified according to the Harmonized Commodity Description and Coding System (HS) of the World Customs Organization (WCO), an internationally stan-dardized system of names and numbers for categorizing traded products. The HS codes used by all Customs agencies which are members of the WCO are similar, to the 6 digit level. However, not all the categories of the HS codes are used by each country/territory as it de-pends on the products in trade by that country/territory. The statistics considered were solely those under HS codes for wood products under HS44. Official export statistics in these cate-gories for each country or territory in this study were compiled and analysed where available. The study did not use data from FAO Statistical Database on agriculture, nutrition, fisheries, forestry, food aid, land use and population data (FAOSTAT) as the data are usually two years out of date and are incomplete. The FAOSTAT data also do not include wood products such as furniture, flooring, and moulding. The UN Commodity Trade Statistics Database (UN Com-trade) was used where appropriate but some of its data are based on a constant factor of value and so the various anomalies would need to be revised. For several products, Eurostat no longer requires that weight is declared for intra-EU trade. This makes it difficult to identify the not infrequent anomalies in Eurostat's volume data. Al-
© EU FLEGT Facility, Jakarta: Scoping baseline information for Forest Law Enforcement, Governance and Trade, January 2012. 19
This Action is funded by the European Union and the governments of Finland, France, Germany, the Netherlands and the UK. The views expressed herein can in no way be taken to reflect the official opinion of the European Union. www.euflegt.efi.int
though the statistics published by Eurostat should be identical to those published by each EU Member State, they are not, and judging by the UK's data, Eurostat data are the less reliable of the two. The USA does not declare more than value for several high unit value products (which ac-count for a significant proportion of trade). The statistics data that have been abstracted and processed for Indonesia were from the Badan Pusat Statistik (Department of Statistics)(nine digit HS codes, monthly data), the sum of importing country/territory statistics (for volume or weight), and for the European Union (EU), Eurostat (http://epp.eurostat.ec.europa.eu/newxtweb/ eight digit HS codes, monthly data). Roundwood equivalent (RWE) volume is a measure of the volume of logs used in making a given volume or weight of a wood-based product. For each type of product, the volume of logs used might vary, perhaps substantially, depending on such factors as the type of mill and the diameter and quality of those logs. In this assessment, RWE has been estimated by mul-tiplying source data (revised where anomalous or estimated from trade value) by the following: in cubic metres per cubic metre—1.4 (particleboard), 1.8 (sawn timber and fibre board), 1.9 (veneer and mouldings), 2.3 (plywood); and, in cubic metres per tonne: 1.6 (wood chips), 2.8 (wooden furniture), 3.5 (paper), 4.5 (wood-based pulp), zero (pulp based on waste paper). In order to avoid double counting, it might be appropriate to modify such factors if a substantial proportion of the wood raw material actually used in making a given type of product was al-ready accounted for in the RWE volume of the products from which that raw material was de-rived. It is important to note that the statistics compiled contain some anomalies and inconsistencies and should therefore be taken as indicative of the extent of the trade only. This study will rec-ommend some protocol changes for Customs that could help to narrow and reduce such anomalies and inconsistencies in Customs statistics. “Paper sector products” in this study equate to wood chips and mill residues, wood-based pulp and paper; timber sector products are all wood-based products other than fuel wood and pa-per sector products. The EU’s Voluntary Partnership Agreement (VPA) “core products” com-prises of logs, sawn timber, veneer and plywood; which is the minimum to be covered under the VPA.
3. POLICY AND LEGISLATION Tropical forests in Indonesia have served as the major source of timber and raw materials for forest industries which supply domestic consumption as well as export to places such as Ja-pan, Europe and USA. Indonesia’s forestry sector is facing a challenge of high deforestation rate, particularly between 2003 and 2006 when the rate was reported to have reached 1.09 million hectares annually (Ministry of Forestry, 2009b). Deforestation problems have seriously deteriorated the timber supply for industries. A report by Chatham House (Lawson, S. and MacFaul, L., 2009) explained that the illegal log-ging rate has been significantly reduced in several countries, such as Cameroon (50%), Brazil (50%-75%), and Indonesia (75%) during the last decade. However, Indonesia has already lost around 33.4 million hectares of forest areas due to high forest conversion rate to other land uses (FAO-MoF, 2009) and the estimation has not included the loss from conversion of for-ests.

© EU FLEGT Facility, Jakarta: Scoping baseline information for Forest Law Enforcement, Governance and Trade, January 2012. 20
This Action is funded by the European Union and the governments of Finland, France, Germany, the Netherlands and the UK. The views expressed herein can in no way be taken to reflect the official opinion of the European Union. www.euflegt.efi.int
The Government of Indonesia, through the Ministry of Forestry (MoF) has established eight policy priorities for the forestry sector in order to achieve sustainable forest management (SFM), i.e. (1) Consolidation of Forest Areas, (2) Forest Rehabilitation and Watershed (DAS) Support Improvement, (3) Forest Security and Forest Fire Control, (4) Biodiversity Conserva-tion, (5) Revitalization of Forest Utilization and Forest Industry, (6) Empowerment of Forest-dependent Community, (7) Mitigation and Adaptation to Climate Change in Forestry Sector, (8) Strengthening Forestry Institutions (Ministry of Forestry, 2009d). To implement the fifth and sixth priorities (Revitalization of Forest Utilization and Forest Industry; and Empowerment of Forest-dependent Community) the government has set a target for the development of 5 million hectares of industrial forest plantations by 2009, and an additional 5.4 million hectares of community forest plantations between 2007 and 2016. The main legal references for forest management in Indonesia are Act no. 41/1999 on For-estry and Act no. 5/1990 on Biodiversity Conservation. Through forest concessions, the man-agement of Production Forests is granted to private companies, individuals, co-operatives, communities, or State enterprises. Forest concessions in natural forests are granted for 20 to 55 years and for up to 60 years in Hutan Tanaman Industri (plantation forests)(HTI). Another basic forestry law for managing forest resources in Indonesia is the Indonesian Constitution Article 33 that establishes the basis of State authority over land and natural resources, includ-ing forestlands. Forestry Act No. 41 was issued in 1999 to replace the Basic Forestry Law or Law No. 5 of 1967, which mainly focused on timber management. In principle, the Forestry Act No. 41 stipulates that extraction of forest products must not exceed the forest’s carrying ca-pacity. Furthermore, Act No. 22 of 1999 has also emphasized the decentralization of forest administration to, among others, local governments. This has enabled forest management, in-cluding forest harvesting, to take into account local conditions and hence be more appropriate in practice. As a response to the Earth Summit and the Bali ITTO meeting in 1992, the Government of In-donesia has implemented regulations (Ministerial Decree no. 252/Kpts-II/1993 and no. 576/Kpts-II/1993) on sustainable forest management (SFM). However, the Decrees have not incorporated social measures as one of the SFM criteria. Unfortunately, the global economic crisis in 1997-1998, and the crisis of 2007-2009 which also affected Indonesia, the changes in national politics, and the initial implementation of regional autonomy through the decentralization process have increased uncertainty in doing business and more destruction of natural forests. Illegal logging has emerged as a serious threat to the quest of Indonesia to manage its forests sustainably. In addition, illegal logging activities un-dermine respect for the rule of law and of government, reduce profitability of forest products obtained by more sustainable practices and undervalue Indonesia’s forest resources. Based on a review on forest concessions’ performance in 1998, the Minister of Forestry sus-pended over 200 poor-performing forest concessionaires. In the outer islands, particularly in Sumatra and Kalimantan, the Government often re-grants the open forest land for plantations in a format of community concession, including community plantation forest Hutan Tanaman Rakyat or (HTR). Collaborative plantation management involves local community, co-operatives or collective groups and government at various levels, e.g. provincial or district. This management model has been rapidly expanding since the implementation of decentrali-zation policy in 1998. Since 2007, the government has given priority to plantation development by rural smallholders on 5.4 million hectares of degraded Production Forest areas through its Community-Based Plantations programme (Ministry of Forestry, 2009c) which will be carried on through 2016, especially where there are tenure disputes (Ministry of Forestry, 2009b). As part of the forest concession policy (Hak Pengusahaan Hutan (HPH) Bina Desa) through a Forestry Ministerial Decree (SK Menhut) no. 61/Kpts-II/1991, the government issued a policy
© EU FLEGT Facility, Jakarta: Scoping baseline information for Forest Law Enforcement, Governance and Trade, January 2012. 21
This Action is funded by the European Union and the governments of Finland, France, Germany, the Netherlands and the UK. The views expressed herein can in no way be taken to reflect the official opinion of the European Union. www.euflegt.efi.int
on Community-based Forestry Management (CBFM) known as the Village Development Pro-gramme. This HPH Bina Desa programme was later replaced by the Pembangunan Masyara-kat Desa Hutan (PMDH) or the Indonesia Rural Forest-based Community Development pro-gramme through Forestry Ministerial Decree (SK Menhut) no. 65/Kpts-II/1995. The govern-ment has also launched two regulations regarding CBFM, viz. (i) SK Menhut No. 318/Kpts-II/1999 regarding community participation in forest management, and (ii) SK Menhut No. 31/Kpts-II/1999 for granting the ‘less than 50,000 ha’ forest concessions to the community. Neither regulation can be implemented because they were originally developed as an official response to public reform without attention to requirements for its implementation in the field.
Currently, many CBFM programmes are implemented using slightly different terms such as forest management by the community or Pengelolaan Hutan oleh Masyarakat (POHM), com-munity-based forest management or Pengelolaan Hutan Berbasis Masyarakat (PHBM), and participative forest management with the community or Pengelolaan Hutan Partisipasi Ber-sama Masyarakat (PHPBM). Implementation is in accordance with the government regulation (PP) No. 34/2002.
To halt further deforestation and forest degradation and support efforts towards SFM, the MoF, Indonesia has formulated five priority policies which will be gradually and selectively im-plemented. They are as follows: (i) elimination of illegal logging; (ii) overcoming forest fires through preventive measures; (iii) restructuring of the forestry sector by increasing the efficiency and effectiveness of
forest resource management;
(iv) conservation of forest resources through rehabilitation of degraded forests and land; and
(v) decentralization of the forestry sector. To further combat illegal logging and enhance control of the supply chain, after a long consul-tation with stakeholders since 2003, the Government of Indonesia has also enacted legislation and rules to verify legality of the supply chain. The Sistem Verifikasi Legalitas Kayu (SVLK) or Timber Legality Verification System has various components, such as definition of timber le-gality, control of supply chain, verification system and independent monitoring systems. The SVLK is authorised under the following regulations:
Minister of Forestry Decree Permenhut No. P38/Menhut-II/2009 dated 12 June 2009; (ii) Director General of the Audit Board rules Perdirjen BPK No. P6/VI-Set/2009 dated 15
June 2009; and Perdirjen BPK No. P02/VI-BPPHH dated 10 February 2010. Other legislation and regulations that have also had some influence and impact on forest re-source management, protection and conservation in Indonesia are: (i) Indonesia’s highest legislative body Majelis Permusyawaratan Rakyat or Indonesia’s
People’s Consultation Assembly (MPR) Decree No. IX of 2001 on Agrarian Reform and Natural Resources Management which contains principles and approaches that have some potential to reduce conflict both among the laws and the users of natural resources;
© EU FLEGT Facility, Jakarta: Scoping baseline information for Forest Law Enforcement, Governance and Trade, January 2012. 22
This Action is funded by the European Union and the governments of Finland, France, Germany, the Netherlands and the UK. The views expressed herein can in no way be taken to reflect the official opinion of the European Union. www.euflegt.efi.int
(ii) Law No. 22 of 1999 (amended by Law No. 32 of 2004 on Regional Administration) and Law No. 25 of 1999 (amended by Law No. 33 of 2004 on Fiscal Balance Between the Central Government and Regional Governments) that address decentralization through reallocating the roles and responsibilities for forestland management and revenue sharing between the central, provincial, and district governments;
(iii) the Basic Agrarian Law No. 5 of 1960 which has some influence on the management of land and the process of designating land rights;
(iv) the National Land Policy Framework (NLPF) that was formulated by the government in 2004 and 2005 to review and renew land policy, to improve existing land laws and regulations, including the Basic Agrarian Law, to resolve increasing land problems, and to implement MPR Decree No. IX of 2001;
(v) The Environmental Law of 2009 that requires companies whose operations have an impact on the environment to obtain an environmental licence and undergo an envi-ronmental assessment before starting operations; but regulations are pending and im-plementation will take up to 5 years;
(vi) Law No. 7 of 2004 on Water Resources which integrates responsibilities across minis-tries, with primary responsibility under the Ministry of Public Works, to improve water resource management and allocation at the national level;
(vii) Presidential Instruction No. 4 of 2005 that directs the leaders of 18 government bodies to co-operate and co-ordinate to eradicate illegal logging;
(viii) Law No. 25 on Anti-Money Laundering which includes forestry and environment crimes as predicate offences for prosecution for money laundering; and
(ix) bi-lateral agreements with Norway, mainland China, the UK, USA, S. Korea and Ja-pan, to assist in combating forest crimes and trade of illegal timber products, arising from the call made in the Bali Ministerial Declaration on Forest Law Enforcement and Governance (FLEG) in 2001.
Indonesia’s New Order government had given privileges of logging concessions to the private sector, for which the Government had created many policies about exploitation of forest prod-ucts as outlined above. When the Government implemented the ‘Basic Forestry Law’ Act in 1967, this introduced a new foreign investment law to attract foreign investors and to promote timber exports. The strategy was implemented to boost the growth of the country’s devastated economy at that time. This law was heavily criticised as it no longer recognized customary ownership in the State forests and had even granted the management right to large-scale concessionaires or Hak Pengusahaan Hutan (HPH). The new policy strictly limited local com-munities’ right to access and to use the forests the way they used to. Before 1967, customary right to access the State forests was still acknowledged. Unfortunately, the new policy triggered conflicts between local communities living adjacent to the concession HPH due to unclear boundaries, inadequate compensation payments, or re-strictions to communities’ access to harvest forest products or to build settlements in forest ar-eas which remain until the present although new policies and legislations were enacted to at-tempt to right this injustice. In addition to the resource base policies, the government also adopted several trade policies relating to forestry industry, e.g.:
© EU FLEGT Facility, Jakarta: Scoping baseline information for Forest Law Enforcement, Governance and Trade, January 2012. 23
This Action is funded by the European Union and the governments of Finland, France, Germany, the Netherlands and the UK. The views expressed herein can in no way be taken to reflect the official opinion of the European Union. www.euflegt.efi.int
a log export ban policy: firstly issued in May 1980 and fully enacted in 1985 and re-enacted on 8 October 2001 and still current;
Sawn timber export tax policy: enacted in November 1989, superseded by the undried rough sawn timber export ban in 2004;
The re-enactment of the log export ban policy has improved the development of the plywood and sawn timber industries in Indonesia, but the revenue from plywood and sawn timber ex-port was much lower than the total revenue loss of US$ 6 billion from the banned log export, 1985–1997 (Manurung, 2002). The policy on forestry industry revitalization was aimed at supporting the national policy on "economic triple track strategy". The triple track strategy was designed to meet the demand for pro-growth, pro-job, and pro-poor development. The growth in the forestry industry sector was projected to be 2% per year in order to support national growth plans (Ministry of Forestry, 2009e). Through the ministerial regulation no P.59/Menhut-II/2009, MoF proposed a 5 year-strategic plan for the revitalization of the forestry industry sector. The strategic plan aimed at optimizing the use of forest resources, and included the following activities:
Management of Production Forests to ensure that they do not overlap with other land rights/concessions
Management of natural forest resources use
Development of plantation forests and Community Plantation Forest (HTR)
Restructuring of primary forestry industries
Timber supply from sustainable and legal sources still cannot meet the demand for raw mate-rials for forestry industry. Securing timber supply is crucial for strengthening the forestry sec-tor. Several studies showed that there was still 25 to 30 million m³ of timber demand that could not be fulfilled from sustainable and legal sources in the last decade. This gap is expected to be gradually reduced by increasing yield from timber plantations (Brown et al., 2005). The MoF has issued the ministerial regulations P.20/Menhut- II/2007 jo. and P.60/Menhut-II/2007 as guidelines for granting licences for timber production in Natural Production Forest. These regulations are intended to attract more investment for timber production in areas that do not overlap with other rights/concessions and in secondary forest with relatively good vege-tation, as well as to accelerate ecosystem restoration in Production Forests. In order to boost timber production from plantation forests, MoF has introduced guidelines and procedures for granting licences for timber plantation expansion in Production Forests (P.19/Menhut-II/2007). This expansion is expected to attract more investments for the devel-opment of plantation forests (HTI) on the heavily degraded or unproductive forests. The regu-lations have not yet been implemented yet. The Government Regulation (PP) No 6/2007 on forest planning, which was further elaborated in the Ministerial Regulation no. P.23/Menhut-II/2007 jo and Ministerial Regulation no. P.5/Menhut-II/2008, has contributed to increasing timber supply from community forests to ap-proximately 1.5 million m
3 in 2008.
The regulations have encouraged industry to use small-diameter wood from community for-ests and industrial plantation forests (HTI), and to reduce using wood from natural forests. They also encouraged the re-engineering/retooling of Industri Primer Hasil Hutan Kayu or In-donesian primary processing of timber licence (IPHHK) in order to improve efficiency and pro-ductivity.
© EU FLEGT Facility, Jakarta: Scoping baseline information for Forest Law Enforcement, Governance and Trade, January 2012. 24
This Action is funded by the European Union and the governments of Finland, France, Germany, the Netherlands and the UK. The views expressed herein can in no way be taken to reflect the official opinion of the European Union. www.euflegt.efi.int
In July 2007, the Indonesian parliament passed Law 40/2007 on Limited Liability Companies, introducing mandatory legal requirements for corporate social responsibility. In the forestry sector, Indonesian corporations introduced out-grower schemes in 1999/2000 to resolve long-term land conflicts inside their concessions. Although there are no official statistics on total out-grower areas, there have been a growing number of companies that have been working with out-growers as part of their corporate social responsibility (CSR) program. Forestry com-panies consider this to be an effective approach to ensuring sustainable supply of timber while sharing the benefits (and risks) with local communities, as well as providing smallholder out-growers to manage and create economic option from the idle lands (Nawir, A.A. et al., 2003). In 2002, the Government of Indonesia issued a soft landing policy which was aimed at setting a standard for sustainable log production from natural forests. The policy gradually reduces national Annual Allowable Cut (AAC) volume, which applies to all provinces and concession-aires. Using the policy, the AAC has been gradually reduced from 21 million cubic metres in 2001 to 12 million cubic metres in 2002, to 6.89 million cubic metres in 2003, and to 5.74 mil-lion cubic metres in 2004. Lembaga Ekolabel Indonesia or Indonesian Eco-labelling Institute (LEI) certification-holder companies are exempted from the AAC reduction (Decree of Director General Forest Production no. 02/KPTS/VI-PHA/2003).
4. FOREST RESOURCES Forest land and forest cover classification in Indonesia has been continuously changing due to the changing land use policy. Total forestland area according to Forest Boundary Setting by Consensus (Tata Guna Hutan Kesepakatan-TGHK) by 1991 was about 143.97 million hec-tares. The original TGHK was based only on MoF’s land use jurisdiction and was aimed at providing a basis for land use map and planning in order to solve inter-agency conflicts over land use. Since the implementation of decentralization in 1999, local governments have pro-posed provincial and district spatial planning to also be considered in the classification proc-ess. Current total forest size, based on synchronized TGHK and Provincial Spatial Plan is 137.09 million hectares (Ministry of Forestry, 2009b). The data used are from government sources as there are very little other national data from other sources and there are shortcomings in the quality of the data (Brown, D.W. and Stolle, F., 2009). A proposal has been made to help overcome shortcomings in the quality of Indone-sia’s national statistics concerning forest management, industrial roundwood production and trade in wood-based products (Brown, D.W. and Stolle, F., 2009). If implemented, this should help efforts to combat Illegal timber, manage forest land sustainably, and improve the quality and quantity of funds made available to Indonesia for climate change mitigation.
According to Forestry Act no. 41/1999, forest areas can be categorized as: Conservation For-est, Protection Forest and Production Forest. Conservation Forest is forest area which is des-ignated for the conservation of animal and plant species and their ecosystem. Protection For-est is forest area which is designated for sustaining forest ecological services, such as hydro-logical systems, flood prevention, erosion control, sea water intrusion prevention, and main-taining soil fertility. Production Forest is forest area which is designated mainly for promoting sustainable forest production. Production Forest can be further classified into Permanent Pro-duction Forest, Limited Production Forest, and Convertible Production Forest. Table 1 de-scribes the area of each forest category.

© EU FLEGT Facility, Jakarta: Scoping baseline information for Forest Law Enforcement, Governance and Trade, January 2012. 25
This Action is funded by the European Union and the governments of Finland, France, Germany, the Netherlands and the UK. The views expressed herein can in no way be taken to reflect the official opinion of the European Union. www.euflegt.efi.int
Table 1: Allocation of forest lands in Indonesia
Classification Area (ha) Note
1. Protected Forest 31,604.032.02
2. Production Forest
a) Limited Production Forest *) 22,502,724.26
*) Forest could still be harvested under strict regulation and careful considerations of forest land char-acteristics, such as slope and vegetation type.
b) Permanent Production Forest 36,649,918.43
c) Convertible Production For-est*)
22,795,961.00
*) Could still be allocated for other land uses, such as agriculture, in-frastructure development, mining, etc)
3. Conservation Forest*) 23,537,832.47 Includes area for hunting
Total 137,090,468.18 Source: Forestry Statistic, MoF (2008)
Forest industry in Indonesia has been growing very rapidly and has played a vital role in the country’s economic development and creating job opportunities. Decreasing capacity of natu-ral forests to supply raw materials, low pulpwood production, slow growth of industrial planta-tion forest (HTI), and production inefficiencies have caused severe decline in forest produc-tion, leaving many wood processing companies with financial losses and debts as well as in-creasing unemployment rate. Some forestry companies are suspected to have been engaged in illegal timber extraction from natural forests to sustain their production.
The total area of Production Forests (Limited and Permanent Production Forests) was about 59 million hectares, which consisted of primary forests (14.98 million ha), secondary forests (23.11 million ha), plantations (2.82 million ha), non-forested land (18.59 million ha), and un-classified areas (989,000 ha) in 2009 (Ministry of Forestry, 2009). However, degraded Produc-tion Forest was estimated at about 19.5 million hectares in 2006 (FAO, 2006). In order to im-prove production from natural Production Forests, MoF has implemented intensive silviculture system (Silin) at 25 forest concessions Izin Usaha Pengelolaan Hasil Hutan Kayu — Indone-sian logging licence (IUPHHK) covering a total area of 52 301 hectares. Enrichment planting has also been implemented in 16 792 hectare of logged-over natural Production Forests. Both programmes are expected to contribute to increasing timber supply for the forest industry. By December 2008, about 26.16 million hectares of natural forest had been allocated to 308 forest concession holders throughout 5 major islands in Indonesia (Table 2). In addition to that, Production Forest has been reforested using a system of forest plantation licences (HTI). The licences are available to individuals, co-operatives, private companies, and state/local government-owned enterprises. In 2008, according to the MoF, 277 HTI concessionaires had planted 4.31 million hectares, out of a total 10.04 million hectares area under their conces-sions (Ministry of Forestry, 2008)(Table 3).
© EU FLEGT Facility, Jakarta: Scoping baseline information for Forest Law Enforcement, Governance and Trade, January 2012. 26
This Action is funded by the European Union and the governments of Finland, France, Germany, the Netherlands and the UK. The views expressed herein can in no way be taken to reflect the official opinion of the European Union. www.euflegt.efi.int
Table 2: Progress of Natural Forest Concessions issued in Indonesia (IUPHHK/HPH)(1991/1992–2009)
Year Total Area (Million hectare)
1991/1992 567 60.48
1992/1993 580 61.38
1993/1994 575 61,70
1994/1995 540 61.03
1995/1996 487 56.17
1996/1997 447 54.09
1997/1998 427 52.28
1998/1999 420 51.58
1999/2000 387 41.84
2000 362 39.16
2001 351 36.42
2002 270 28.08
2003 267 27.80
2004 287 27.82
2005 285 27.72
2006 322 28.78
2007 324 28.27
2008 308 26.16
2009*) 308 26.16
Source: Forestry Statistic, MoF, 2009a *) - Data as of February 28, 2009
Table 3: Progress of plantation in forest concessions issued in Indonesia (1995/1996-2009)
Year Total Area (Million hectare)
1995/1990 9 1,13
1996/1997 45 2,83
1997/1998 90 3,93
1998/1999 90 3,93
1999/2000 96 4,34
2000 98 4,44
2001 100 4,52
2002 103 4,55
2003 105 4,63
2004 114 5,80
2005 113 5,73
2006 130 6,19
2007 247 9,88
2008 227 10,03
2009 229 9,97 Source: Forestry Statistic, MoF, 2009a
In 2008, about 32 million m
3 log had been produced from production natural forests (annual
working plan) and 2.76 million m3 from cleared natural forest land which had been allocated for
other uses (agricultural, mining, infrastructure)(Table 4). These amounts should be reconciled with the actual harvest as there were differences found between the plans and logging as shown later. Industrial plantation forest plantation (HTI) has contributed about 22.4 million m
3
log production. There were also 2.2 million m3 of logs sourced from other legal sources.
© EU FLEGT Facility, Jakarta: Scoping baseline information for Forest Law Enforcement, Governance and Trade, January 2012. 27
This Action is funded by the European Union and the governments of Finland, France, Germany, the Netherlands and the UK. The views expressed herein can in no way be taken to reflect the official opinion of the European Union. www.euflegt.efi.int
Table 4: Indonesia’s log production based on source of production in 2004–2008
Source of Production
Natural Forest (cum) Forest Plantation (cum) Total
Year Land Clearing
State Own Company HTI/ Other License (cum)
Annual working plan From Natural Forest (Perhutani) IFP (cum)
2004 3,510,752 1,631,885 923,632 7,329,028 153,640 13,548,938
2005 5,720,515 3,614,347 757,993 12,818,199 1,311,584 4,222,638
2006 5,586,722 3,434,181 337,797 1,451,249 982,195 21,792,144
2007 6,437,685 3,063,607 48,034 20,614,209 1,328,050 31,491,584
2008*) 4,610,077 2,764,015 96,954 22,321,885 2,191,511 31,984,442
Total 25,865,751 14,508,035 2,164,410 74,534,570 5,966,980 123,039,746
Source: Executive data strategy of MoF, 2009. (*) The latest data were taken from the online system realization of Industrial Raw Material Compliance Plan (RPBBI) Year 2008 as of April 7, 2009.
According to Table 4, timber production from natural forests increased significantly from 3.5 million m
3 in 2004 to 6.4 million m
3 in 2007, but then decreased sharply to about 4.6 million m
3
in 2008. In contrast, timber production from plantation forests increased significantly from 7 million m
3 to 22 million m
3 from 2004 to 2008. Timber production from the clear cutting of natu-
ral forests ranged from 1.6 million m3 in year 2004 to 2.7 million m
3 in year 2008.
Figure 1: Indonesia’s area of concessions in Production Forests (2008) and the annual per-
mitted cut by regions (2009)
Kalimantan
Papua
Sumatra
Sulawesi
Maluku
East Kalimantan
Central Kalimantan
Papua
West Papua
Maluku
West Kalimantan
North Maluku
Central Sulawesi
Others
Area of concessions in Production Forest
(2008) (Total: 26 million hectares) Annual permitted cut (2009)
(Total: 11 million cubic metres)
Source: Forestry Statistic, MoF, 2009a.
As the left hand chart in Figure 1 indicates, Kalimantan and Papua accounted for the great majority of concessions in Production Forest which the Ministry of Forests considered valid during 2008 (Ministry of Forestry, 2009b). The right hand chart above shows that Kalimantan and, to a lesser extent, Papua also accounted for the great majority of the annual permitted cut in 2009 (Ministry of Forestry, 2009b). The mix of species actually logged might differ from what is anticipated in the annual permitted cut. The volume actually logged was considerably less than anticipated during 2006 and 2007 (Ministry of Forestry, 2009b). For example in 2007, for West Nusa Tenggara, the target for teak was 17 312 m
3 but the actual logging was
only 1343 m3. Such vast discrepancies occurred for many of the provinces.
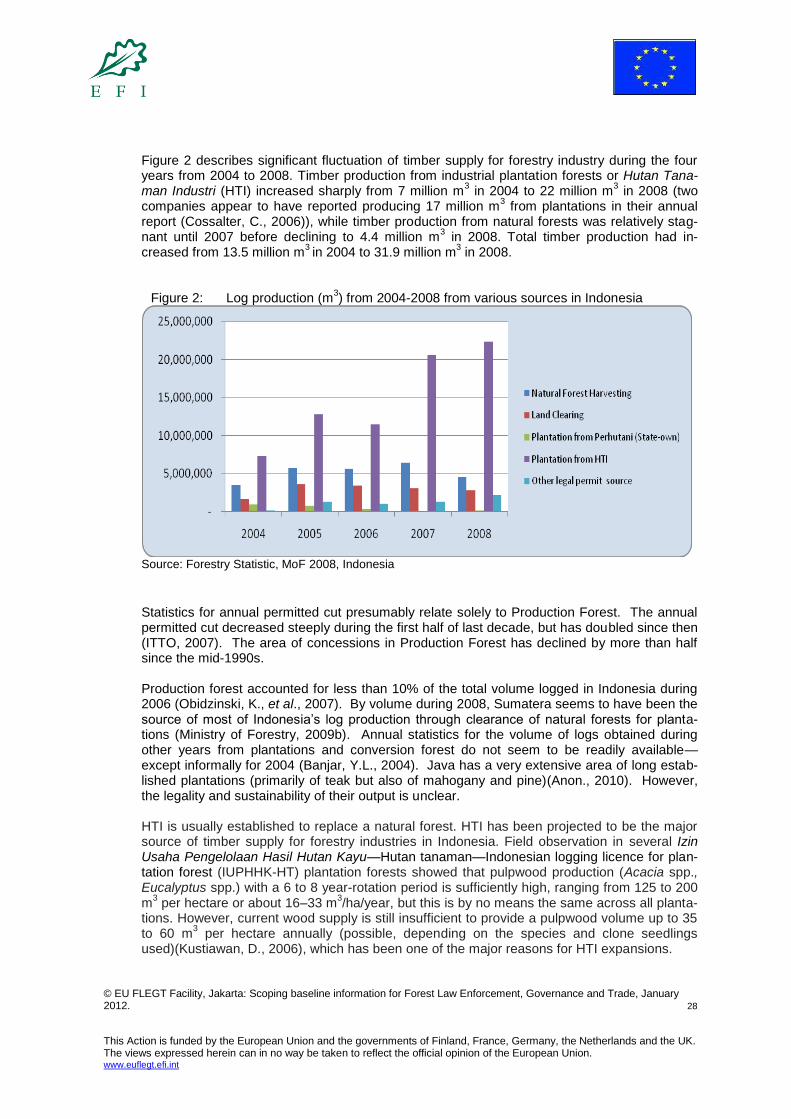
© EU FLEGT Facility, Jakarta: Scoping baseline information for Forest Law Enforcement, Governance and Trade, January 2012. 28
This Action is funded by the European Union and the governments of Finland, France, Germany, the Netherlands and the UK. The views expressed herein can in no way be taken to reflect the official opinion of the European Union. www.euflegt.efi.int
Figure 2 describes significant fluctuation of timber supply for forestry industry during the four years from 2004 to 2008. Timber production from industrial plantation forests or Hutan Tana-man Industri (HTI) increased sharply from 7 million m
3 in 2004 to 22 million m
3 in 2008 (two
companies appear to have reported producing 17 million m3 from plantations in their annual
report (Cossalter, C., 2006)), while timber production from natural forests was relatively stag-nant until 2007 before declining to 4.4 million m
3 in 2008. Total timber production had in-
creased from 13.5 million m3 in 2004 to 31.9 million m
3 in 2008.
Figure 2: Log production (m
3) from 2004-2008 from various sources in Indonesia
Source: Forestry Statistic, MoF 2008, Indonesia
Statistics for annual permitted cut presumably relate solely to Production Forest. The annual permitted cut decreased steeply during the first half of last decade, but has doubled since then (ITTO, 2007). The area of concessions in Production Forest has declined by more than half since the mid-1990s. Production forest accounted for less than 10% of the total volume logged in Indonesia during 2006 (Obidzinski, K., et al., 2007). By volume during 2008, Sumatera seems to have been the source of most of Indonesia’s log production through clearance of natural forests for planta-tions (Ministry of Forestry, 2009b). Annual statistics for the volume of logs obtained during other years from plantations and conversion forest do not seem to be readily available—except informally for 2004 (Banjar, Y.L., 2004). Java has a very extensive area of long estab-lished plantations (primarily of teak but also of mahogany and pine)(Anon., 2010). However, the legality and sustainability of their output is unclear. HTI is usually established to replace a natural forest. HTI has been projected to be the major source of timber supply for forestry industries in Indonesia. Field observation in several Izin Usaha Pengelolaan Hasil Hutan Kayu—Hutan tanaman—Indonesian logging licence for plan-tation forest (IUPHHK-HT) plantation forests showed that pulpwood production (Acacia spp., Eucalyptus spp.) with a 6 to 8 year-rotation period is sufficiently high, ranging from 125 to 200 m
3 per hectare or about 16–33 m
3/ha/year, but this is by no means the same across all planta-
tions. However, current wood supply is still insufficient to provide a pulpwood volume up to 35 to 60 m
3 per hectare annually (possible, depending on the species and clone seedlings
used)(Kustiawan, D., 2006), which has been one of the major reasons for HTI expansions.
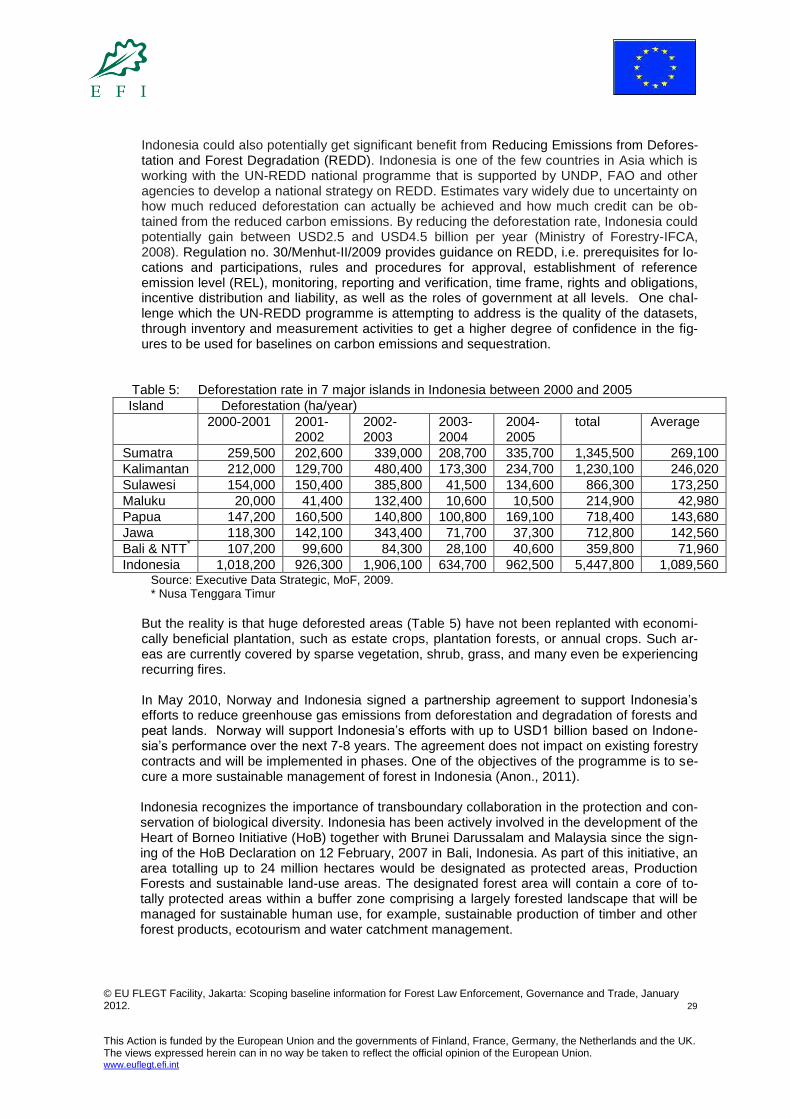
© EU FLEGT Facility, Jakarta: Scoping baseline information for Forest Law Enforcement, Governance and Trade, January 2012. 29
This Action is funded by the European Union and the governments of Finland, France, Germany, the Netherlands and the UK. The views expressed herein can in no way be taken to reflect the official opinion of the European Union. www.euflegt.efi.int
Indonesia could also potentially get significant benefit from Reducing Emissions from Defores-tation and Forest Degradation (REDD). Indonesia is one of the few countries in Asia which is working with the UN-REDD national programme that is supported by UNDP, FAO and other agencies to develop a national strategy on REDD. Estimates vary widely due to uncertainty on how much reduced deforestation can actually be achieved and how much credit can be ob-tained from the reduced carbon emissions. By reducing the deforestation rate, Indonesia could potentially gain between USD2.5 and USD4.5 billion per year (Ministry of Forestry-IFCA, 2008). Regulation no. 30/Menhut-II/2009 provides guidance on REDD, i.e. prerequisites for lo-cations and participations, rules and procedures for approval, establishment of reference emission level (REL), monitoring, reporting and verification, time frame, rights and obligations, incentive distribution and liability, as well as the roles of government at all levels. One chal-lenge which the UN-REDD programme is attempting to address is the quality of the datasets, through inventory and measurement activities to get a higher degree of confidence in the fig-ures to be used for baselines on carbon emissions and sequestration.
Table 5: Deforestation rate in 7 major islands in Indonesia between 2000 and 2005
Island Deforestation (ha/year)
2000-2001 2001-2002
2002-2003
2003-2004
2004-2005
total Average
Sumatra 259,500 202,600 339,000 208,700 335,700 1,345,500 269,100
Kalimantan 212,000 129,700 480,400 173,300 234,700 1,230,100 246,020
Sulawesi 154,000 150,400 385,800 41,500 134,600 866,300 173,250
Maluku 20,000 41,400 132,400 10,600 10,500 214,900 42,980
Papua 147,200 160,500 140,800 100,800 169,100 718,400 143,680
Jawa 118,300 142,100 343,400 71,700 37,300 712,800 142,560
Bali & NTT* 107,200 99,600 84,300 28,100 40,600 359,800 71,960
Indonesia 1,018,200 926,300 1,906,100 634,700 962,500 5,447,800 1,089,560 Source: Executive Data Strategic, MoF, 2009. * Nusa Tenggara Timur
But the reality is that huge deforested areas (Table 5) have not been replanted with economi-cally beneficial plantation, such as estate crops, plantation forests, or annual crops. Such ar-eas are currently covered by sparse vegetation, shrub, grass, and many even be experiencing recurring fires. In May 2010, Norway and Indonesia signed a partnership agreement to support Indonesia’s efforts to reduce greenhouse gas emissions from deforestation and degradation of forests and peat lands. Norway will support Indonesia’s efforts with up to USD1 billion based on Indone-sia’s performance over the next 7-8 years. The agreement does not impact on existing forestry contracts and will be implemented in phases. One of the objectives of the programme is to se-cure a more sustainable management of forest in Indonesia (Anon., 2011). Indonesia recognizes the importance of transboundary collaboration in the protection and con-servation of biological diversity. Indonesia has been actively involved in the development of the Heart of Borneo Initiative (HoB) together with Brunei Darussalam and Malaysia since the sign-ing of the HoB Declaration on 12 February, 2007 in Bali, Indonesia. As part of this initiative, an area totalling up to 24 million hectares would be designated as protected areas, Production Forests and sustainable land-use areas. The designated forest area will contain a core of to-tally protected areas within a buffer zone comprising a largely forested landscape that will be managed for sustainable human use, for example, sustainable production of timber and other forest products, ecotourism and water catchment management.
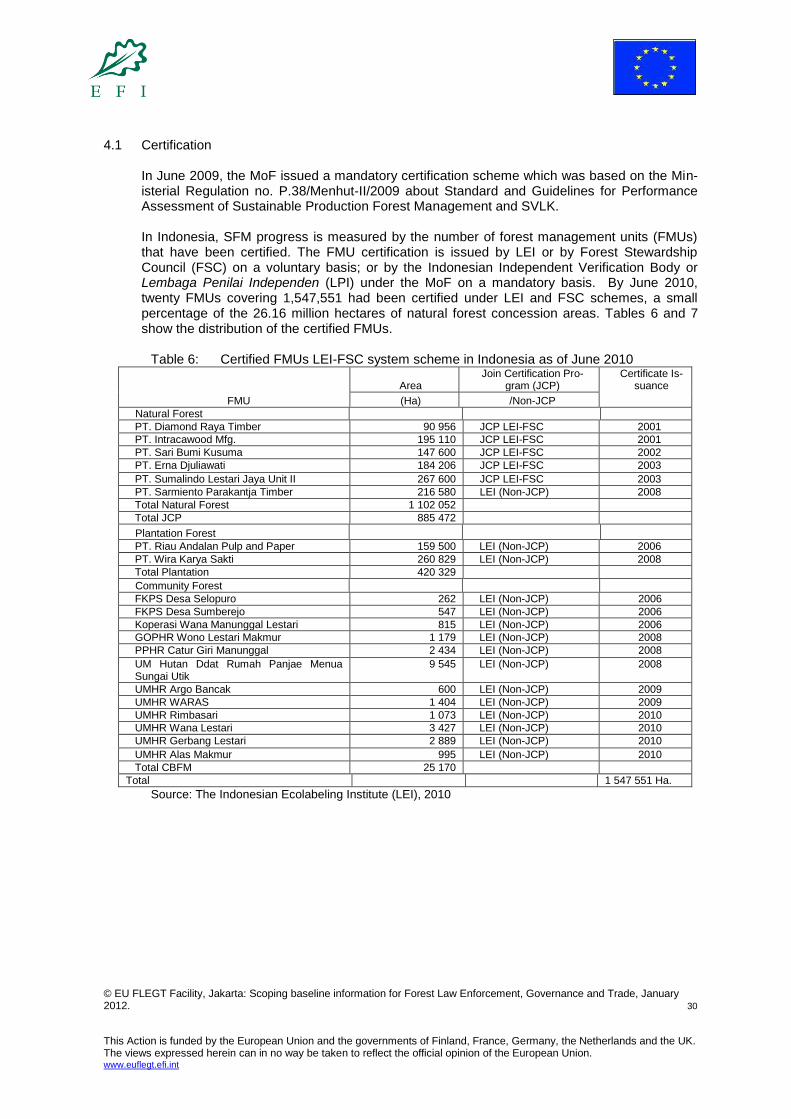
© EU FLEGT Facility, Jakarta: Scoping baseline information for Forest Law Enforcement, Governance and Trade, January 2012. 30
This Action is funded by the European Union and the governments of Finland, France, Germany, the Netherlands and the UK. The views expressed herein can in no way be taken to reflect the official opinion of the European Union. www.euflegt.efi.int
4.1 Certification In June 2009, the MoF issued a mandatory certification scheme which was based on the Min-isterial Regulation no. P.38/Menhut-II/2009 about Standard and Guidelines for Performance Assessment of Sustainable Production Forest Management and SVLK. In Indonesia, SFM progress is measured by the number of forest management units (FMUs) that have been certified. The FMU certification is issued by LEI or by Forest Stewardship Council (FSC) on a voluntary basis; or by the Indonesian Independent Verification Body or Lembaga Penilai Independen (LPI) under the MoF on a mandatory basis. By June 2010, twenty FMUs covering 1,547,551 had been certified under LEI and FSC schemes, a small percentage of the 26.16 million hectares of natural forest concession areas. Tables 6 and 7 show the distribution of the certified FMUs.
Table 6: Certified FMUs LEI-FSC system scheme in Indonesia as of June 2010
FMU
Area Join Certification Pro-
gram (JCP) Certificate Is-
suance
(Ha) /Non-JCP
Natural Forest
PT. Diamond Raya Timber 90 956 JCP LEI-FSC 2001
PT. Intracawood Mfg. 195 110 JCP LEI-FSC 2001
PT. Sari Bumi Kusuma 147 600 JCP LEI-FSC 2002
PT. Erna Djuliawati 184 206 JCP LEI-FSC 2003
PT. Sumalindo Lestari Jaya Unit II 267 600 JCP LEI-FSC 2003
PT. Sarmiento Parakantja Timber 216 580 LEI (Non-JCP) 2008
Total Natural Forest 1 102 052
Total JCP 885 472
Plantation Forest
PT. Riau Andalan Pulp and Paper 159 500 LEI (Non-JCP) 2006
PT. Wira Karya Sakti 260 829 LEI (Non-JCP) 2008
Total Plantation 420 329
Community Forest
FKPS Desa Selopuro 262 LEI (Non-JCP) 2006
FKPS Desa Sumberejo 547 LEI (Non-JCP) 2006
Koperasi Wana Manunggal Lestari 815 LEI (Non-JCP) 2006
GOPHR Wono Lestari Makmur 1 179 LEI (Non-JCP) 2008
PPHR Catur Giri Manunggal 2 434 LEI (Non-JCP) 2008
UM Hutan Ddat Rumah Panjae Menua Sungai Utik
9 545 LEI (Non-JCP) 2008
UMHR Argo Bancak 600 LEI (Non-JCP) 2009
UMHR WARAS 1 404 LEI (Non-JCP) 2009
UMHR Rimbasari 1 073 LEI (Non-JCP) 2010
UMHR Wana Lestari 3 427 LEI (Non-JCP) 2010
UMHR Gerbang Lestari 2 889 LEI (Non-JCP) 2010
UMHR Alas Makmur 995 LEI (Non-JCP) 2010
Total CBFM 25 170
Total 1 547 551 Ha.
Source: The Indonesian Ecolabeling Institute (LEI), 2010

© EU FLEGT Facility, Jakarta: Scoping baseline information for Forest Law Enforcement, Governance and Trade, January 2012. 31
This Action is funded by the European Union and the governments of Finland, France, Germany, the Netherlands and the UK. The views expressed herein can in no way be taken to reflect the official opinion of the European Union. www.euflegt.efi.int
Table 7: Certified FMUs with FSC scheme in Indonesia as of October 2010 Certificate Code
License No.
Organization Name
Issue Date
Expiry Date
SW-FM/COC-004117
FSC-C013892 Koperasi Taman Wijaya Rasa (KOSTAJASA)
2 Jun 2009 1 Jun 2014
SA-FM/COC-002083
FSC-C023796 KSU ALAS MANDIRI KTI (KAM KTI)
22 Dec 2008 21 Dec 2013
SGS-FM/COC-000659
FSC-C008121 PT Diamond Raya Timber 7 Jul 2006 4 Jul 2011
SW-FM/COC-001623
FSC-C018226 PT Erna Djuliawati 6 Sep 2010 5 Sep 2015
SW-FM/COC-001849
FSC-C010789 PT Intracawood Manufacturing 6 Apr 2006 5Apr 2011
SW-FM/COC-002645
FSC-C021870 PT Sari Bumi Kusuma 26 Sep 2007 25 Sep 2012
SW-FM/COC-001735
FSC-C013237 PT Sumalindo Lestari Jaya Tbk 4 Jan 2006 3 Jan 2011
SW-FM/COC-000104
FSC-C003700 PT Xylo Indah Pratama 20 Apr 2007 19 Apr 2012
Source: FSC (2010)
Very little wood production out of the 26 million hectares of production natural forest in Indo-nesia is credibly certified. The competitive advantage which illegalities confer (particularly in relation to price) has contributed to the difficulty which the FSC-certified plywood made in In-donesia has faced in securing export orders (Oliver, R., 2007).
Unsustainable management, illegality and social conflict prompted the withdrawal of all FSC-certificates from Perum (now PT) Perhutani, a State-controlled enterprise which manages a large area of long established plantations (mainly of teak)(Anon., 2010a). A very small area of those plantations is now FSC-certified and, for several years, six rather larger areas have re-ceived technical assistance from The Forest Trust (Anon., 2010b). The Tropical Forest Foun-dation has supported a number of concessionaires and timber enterprises nationwide—three of these have FSC certificates (Anon., 2010c) and the output of some others has been verified for legality (Anon., 2010d). WWF’s Global Forest and Trade Network (GFTN) in Indonesia has also supported a number of concessionaires and timber enterprises to move towards certifica-tion and also to gain chain-of-custody certificates for its supply chain (Anon., 2010e). Known weaknesses in local and international certification schemes have been exploited by a few in Indonesia. While one concession held by a major group might be certified, that group as a whole might have a poor record for illegality and/or unsustainability. Unlike its competi-tors, the FSC prohibits the use of its trademark by any affiliate of the multi-national Asia Pulp and Paper group (Anon., 2010f). Affiliates of that group account for roughly one third of the enterprises which form the Business Chapter of Lembaga Ekolabel Indonesia (Anon., 2010g). General lessons learned about the nature of demand for, and supply of, sustainable and legal verified timber from Indonesia is that market demand for certified and legal forest products is driven by multiple factors including purchasing policies by corporations and regulatory and public purchasing policies by importing governments. For forest certification implementation in Indonesia to have a major impact on natural forest management companies there needs to be a stepwise approach towards certification. Up to now, the total area that has been certified by voluntary systems (FSC and LEI) is less than 5% of total Production Forest. Although progress has been slow and challenges remain, market-based efforts to improve forest management are beginning to pay dividends in Indone-sia. Keeping environmentally sensitive buyers engaged with Indonesian timber producers needs to be prioritized. This may entail identifying more existing buyers of Indonesian timber

© EU FLEGT Facility, Jakarta: Scoping baseline information for Forest Law Enforcement, Governance and Trade, January 2012. 32
This Action is funded by the European Union and the governments of Finland, France, Germany, the Netherlands and the UK. The views expressed herein can in no way be taken to reflect the official opinion of the European Union. www.euflegt.efi.int
products and working closely with them to put pressure on their suppliers to invest in SFM, or to pursue forest certification. In relation to slow progress with certification for forestry in Indonesia, buyers have an impor-tant role and it is recommended that they create new market links that promote investments in SFM and help to meet guaranteed prices and quantities that are high enough to compensate for the investment costs; strike purchasing agreements that are long term; agreements that are backed up by personal relationships or other guarantees acceptable to Indonesian pro-ducers; and agreements that provide an outlet for the whole product line and type. For market demand to influence the implementation of best practice forest management in In-donesia there must be a critical mass. For this reason there is a need to continue focusing on the major Asian markets for Indonesian timber products including mainland China, Malaysia, and Japan. As part of this, more analysis of the re-export of Indonesian timber from mainland China to western markets is needed. At the moment, using trade statistics, it is difficult to know which of the products exported to mainland China are then processed and re-exported to the EU and other western markets. A key barrier to the adoption of certification is Indonesia’s uncertain business climate which discourages long term investment and the uneven playing field which raises the potential op-portunity cost for concessionaires’ certification to be discouraging. The MoF has made clear commitments to reduce illegal logging and improve policy frameworks for SFM. These gov-ernance measures are in large part being driven by market pressures and are likely to reduce the amount of “cut and run” timber on the market.
5. LOGGING, TRADE AND ILLEGALITY To ensure responsible sourcing of timber, Government of Indonesia (GOI) has issued Presi-dential Instruction no. 4/ 2005 that gives instruction to 18 government bodies to co-operate and co-ordinate in eradicating illegal logging. Better co-operation and co-ordination among government bodies has helped to decrease illegal sourcing of raw materials for the forestry in-dustry. Wood-balance analysis indicates that supply of illegal logs from Indonesia has declined by 75% after its peak in 2000, but it still comprises about 40% of the total national timber pro-duction (Lawson, S. and MacFaul, L., 2010). Perhaps the most often quoted percentage of Illegal timber production in Indonesia (73%) seems to relate to a single year (1998) and was simply the unexplained difference between estimates of industrial roundwood production, imports, exports and local end-use (Yuichi, S., 2002). The errors implicit in the assumptions used in making each of those estimates are likely to have been sufficiently large to influence the result. The wood balance model approach has been used by various reports, the most recent by Chatham House (Lawson, S., and MacFaul, L., 2010). The estimate for illegal logging in Indo-nesia in 2006 has reduced to about 40%. In its simpliest form, the method compares the legal supply of timber from both officially permitted logging and legal imports, with the actual con-sumption of domestic and exports. The extent to which real consumption outstrips legal supply can be used as a measure of the volume of illegal timber being cut and of the percentage of logging which is considered illegal. The estimate in 1998 was of the rate of illegal logging of 73% (Scotland, N. et al., 1999). As the World Bank (2006) implies, the ways in which the State manages forest in Indonesia have tended to be unconstitutional and illegal.

© EU FLEGT Facility, Jakarta: Scoping baseline information for Forest Law Enforcement, Governance and Trade, January 2012. 33
This Action is funded by the European Union and the governments of Finland, France, Germany, the Netherlands and the UK. The views expressed herein can in no way be taken to reflect the official opinion of the European Union. www.euflegt.efi.int
Whereas the constitution requires that the “Land and water and the natural riches therein shall be controlled by the State and made use of for the greatest welfare of the people” not only have forest peoples tended to be deprived of their livelihoods but, particularly during the Su-harto era, forest (and land which used to be forest) has tended to be managed primarily for the benefit of well-connected elites. Forest was allocated on generous terms to business associ-ates of the then President. A ban on the export of logs served to maximise the profit of well-connected elites who owned wood processing mills (Barr, C. et al., 2006) –it maximised the rate at which the wealth embodied in the forest was realized, as the livelihoods of forest-dependent peoples diminished. This has increased social tension (Colchester, M., 2004). Decentralisation (and related legal ambiguity) subsequent to the collapse of the Suharto re-gime increased the prevalence and diversity of illegality (Barr, C. et al., 2006). According to MoF, illegal logging cases have decreased significantly from 1,714 cases in 2006 to 107 cases in 2009. The Government of Indonesia has completed verdicts for 304 cases in 2006, 152 cases in 2007, 31 cases in 2008, and 13 cases in 2009 (Anon., 2010h). Act no. 41/1999 on Forestry defines illegal logging as unlawful forestry-related acts done by an indi-vidual/a group of people or legal entities in the form of cutting down or picking up timber from forest areas without permit; and/or receiving or buying illegally collected timber, and/or collect-ing legal forest products without complete letter of valid legal document of timber or Surat Ket-erangan Sahnya Hasil Hutan—Indonesian legal forest products permit (SKSHH). Improve-ment in forest governance and awareness-raising by non-governmental organizations (NGOs) have been the important factors to reducing illegal logging, as well as an increasing supply of legal timber from plantation forests (Lawson, S. and MacFaul, L., 2010).
During 2005, the President issued an instruction requiring greater efforts to implement the law (Anon., 2005)—partly in response to earlier law enforcement operations which tended not to reduce the frequency of exposés. This seems to have had most impact in the timber sector, particularly helping to reduce the smuggling of logs, particularly from Papua (EIA, 2007), and via neighbouring Malaysia (Obidzinski, K. et al., 2007). Malaysia had, a few years earlier, im-posed bans on log imports from Indonesia, reciprocal to the ban on exports of logs from Indo-nesia itself—which remains current (Tacconi, L. et al., 2004). However, Malaysia continues to be vigilant in monitoring smuggling (including through free trade zones in Malaysia) and falsify-ing Customs documentation which remains of concern (Hashim, N., 2004).
In addition to un-
der-declaration, some sawn timber might be mis-declared as mouldings, in order to bypass the ban on sawn timber exports. Mainland China continues to declare as imports from Indonesia a much larger combined quantity of sawn timber and mouldings than Indonesia declares as exports. The Forestry Law, as revised during 1999, requires, amongst other things, that forests be managed equitably and sustainably—accommodating community aspirations (World Bank, 2006). These conditions seem rarely to pertain except for those concessionaires who are moving towards certification or are certified. The great majority of past and current logging concessions were not or have not been gazet-ted—the process by which forest areas are classified, their boundaries surveyed and agreed by interdepartmental teams and then officially registered as State Forests—and, even if gazet-ted, the legal status may be disputed if any of the procedures for setting boundaries such as consultation with local village leaders were rushed and inadequate. Consequently, the great majority of logging in what is left of Indonesia’s “production” forest is likely to be illegal on this basis alone (Colchester, 2004). The Government of Indonesia, through the Secretary General of the MoF Decree no. 99/II-KUM/2008, has formed a Working Group in order to accelerate the finalization of the timber
© EU FLEGT Facility, Jakarta: Scoping baseline information for Forest Law Enforcement, Governance and Trade, January 2012. 34
This Action is funded by the European Union and the governments of Finland, France, Germany, the Netherlands and the UK. The views expressed herein can in no way be taken to reflect the official opinion of the European Union. www.euflegt.efi.int
legality standard and capacity-building, to improve forest governance, and to facilitate imple-mentation of the FLEGT-VPA. To help improve the credibility of legality of Indonesian timber products in the global market the government enacted several pieces of legislation that enabled the development and im-plementation of a Timber Legality Verification System (SVLK). The MoF plans to implement an integrated information system to support a single-window national timber legality mechanism. The SVLK is not specifically intended only to support of the FLEGT VPA, but also to verify le-gality of timber for all other markets as required, including the US Lacey Amendment, future Australia timber regulation, etc. The SVLK differs by type of woodland (Anon., 2010i). It currently focuses on state-owned re-sources, and the scope of legality for private forests and community forests is narrow and only covers the criteria for the demonstration of land ownership. Such research as has been carried out into the legality of forest conversion indicates that most wood-based products which derive from “conversion” forest are likely to be illegal (ITTO, 2001). Indeed, given both the extent to which “permanent” forest in Indonesia is exhausted of commercial value, forest conversion rather than logging in “permanent” forest should now probably be the primary focus of illegality in the supply of wood raw material for industry in In-donesia (Global Forest Watch, 2002). It is unclear whether and how poor performance against criteria and indicators of sustainable management in State-owned Production Forest is deemed illegal. The laundering of wood through concessions which have inappropriate (but officially approved) management plans is widespread (Setiono, B., 2007; Setiono, B., 2008). It seems that concessions are frequently allocated to enterprises which are not appropriately qualified (Anon., 2008). It is expected that new procedures to be developed to implement the SVLK in the near future will clarify many of these issues. The use of fire in clearing forest remains commonplace and the clearance of forest on deep peat soil continues, despite both being illegal (Greenpeace, 2009). The paper sector suffers challenges in respect of its production of pulp and paper made from wood grown in Indonesia. The mills of most of the major pulp producing groups appear to have been financed from various sources (Barr, C., 2001) and the refinancing of the largest (after it defaulted on selected debt repayments) has not been without controversy (Pirard, R. and Rokhim, R., 2006). Further, fire has been widely used to clear land for pulpwood planta-tions and pulpwood plantations are being cultivated on deep peat (Barr, C., 2004). During 2007, three of these groups used timber from natural forest in their pulpwood despite commit-ments otherwise. Two of these have made commitments that their supplies would (by 2005 and 2009) derive only from plantations (Cossalter, 2006). Annual reports published by the leading two pulp producing groups indicate that natural forests account for a declining propor-tion of their pulpwood supplies, and that, during 2007, the volume of logs in their pulpwood was approximately four million m
3 from natural forest and 17 million m
3 from plantations. At
least one of them has been reported to have resorted to violence in order to secure its inter-ests against local communities (Barr, C. et al., 2010). The output of most large plywood mills would likewise probably warrant classification as illegal given that some should have been closed for indebtedness after an audit from the Department of Forestry’s Industrial Working Group which ordered the closure through due process of the law (Brown, 2005). But powerful political support and judicial resistance kept the mills open and continuing to purchase illegal timber.
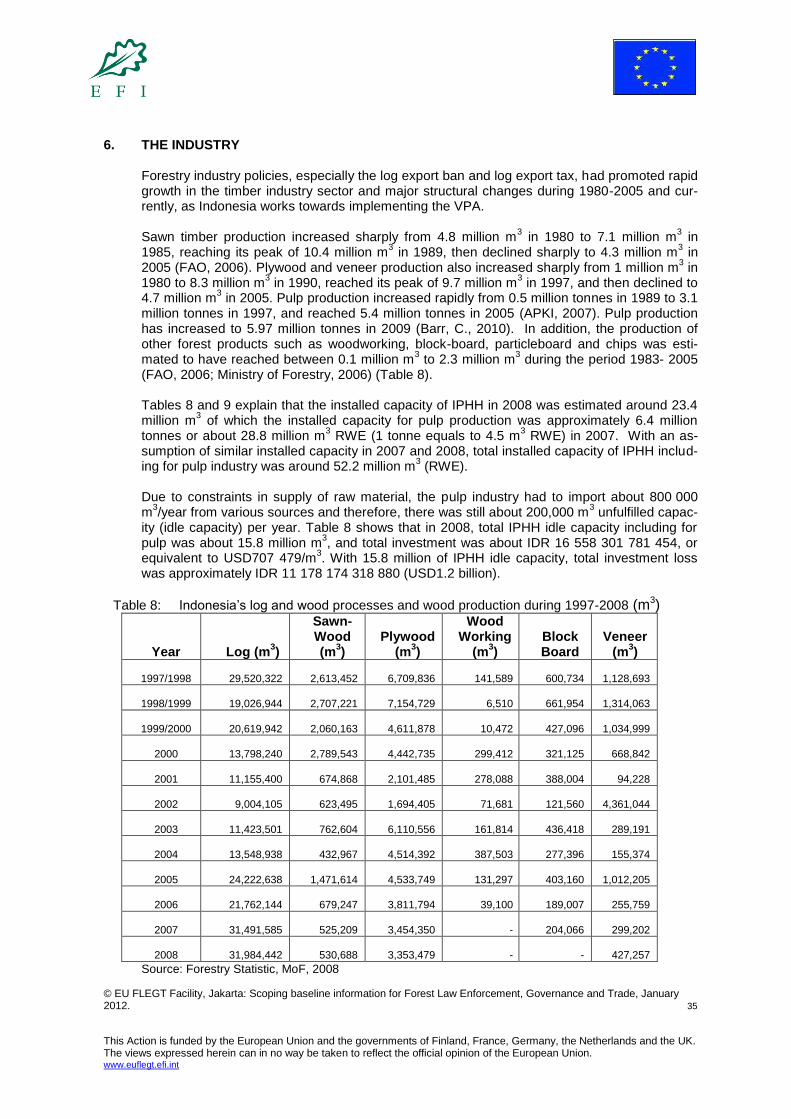
© EU FLEGT Facility, Jakarta: Scoping baseline information for Forest Law Enforcement, Governance and Trade, January 2012. 35
This Action is funded by the European Union and the governments of Finland, France, Germany, the Netherlands and the UK. The views expressed herein can in no way be taken to reflect the official opinion of the European Union. www.euflegt.efi.int
6. THE INDUSTRY Forestry industry policies, especially the log export ban and log export tax, had promoted rapid growth in the timber industry sector and major structural changes during 1980-2005 and cur-rently, as Indonesia works towards implementing the VPA. Sawn timber production increased sharply from 4.8 million m
3 in 1980 to 7.1 million m
3 in
1985, reaching its peak of 10.4 million m3 in 1989, then declined sharply to 4.3 million m
3 in
2005 (FAO, 2006). Plywood and veneer production also increased sharply from 1 million m3 in
1980 to 8.3 million m3 in 1990, reached its peak of 9.7 million m
3 in 1997, and then declined to
4.7 million m3 in 2005. Pulp production increased rapidly from 0.5 million tonnes in 1989 to 3.1
million tonnes in 1997, and reached 5.4 million tonnes in 2005 (APKI, 2007). Pulp production has increased to 5.97 million tonnes in 2009 (Barr, C., 2010). In addition, the production of other forest products such as woodworking, block-board, particleboard and chips was esti-mated to have reached between 0.1 million m
3 to 2.3 million m
3 during the period 1983- 2005
(FAO, 2006; Ministry of Forestry, 2006) (Table 8). Tables 8 and 9 explain that the installed capacity of IPHH in 2008 was estimated around 23.4 million m
3 of which the installed capacity for pulp production was approximately 6.4 million
tonnes or about 28.8 million m3 RWE (1 tonne equals to 4.5 m
3 RWE) in 2007. With an as-
sumption of similar installed capacity in 2007 and 2008, total installed capacity of IPHH includ-ing for pulp industry was around 52.2 million m
3 (RWE).
Due to constraints in supply of raw material, the pulp industry had to import about 800 000 m
3/year from various sources and therefore, there was still about 200,000 m
3 unfulfilled capac-
ity (idle capacity) per year. Table 8 shows that in 2008, total IPHH idle capacity including for pulp was about 15.8 million m
3, and total investment was about IDR 16 558 301 781 454, or
equivalent to USD707 479/m3. With 15.8 million of IPHH idle capacity, total investment loss
was approximately IDR 11 178 174 318 880 (USD1.2 billion).
Table 8: Indonesia’s log and wood processes and wood production during 1997-2008 (m3)
Year Log (m3)
Sawn-Wood (m
3)
Plywood (m
3)
Wood Working
(m3)
Block Board
Veneer (m
3)
1997/1998
29,520,322
2,613,452
6,709,836
141,589
600,734 1,128,693
1998/1999
19,026,944
2,707,221
7,154,729
6,510
661,954 1,314,063
1999/2000
20,619,942
2,060,163
4,611,878
10,472
427,096 1,034,999
2000
13,798,240
2,789,543
4,442,735
299,412
321,125
668,842
2001
11,155,400
674,868
2,101,485
278,088
388,004
94,228
2002
9,004,105
623,495
1,694,405
71,681
121,560 4,361,044
2003
11,423,501
762,604
6,110,556
161,814
436,418
289,191
2004
13,548,938
432,967
4,514,392
387,503
277,396
155,374
2005
24,222,638
1,471,614
4,533,749
131,297
403,160 1,012,205
2006
21,762,144
679,247
3,811,794
39,100
189,007 255,759
2007
31,491,585
525,209
3,454,350 -
204,066 299,202
2008
31,984,442
530,688
3,353,479 - - 427,257
Source: Forestry Statistic, MoF, 2008
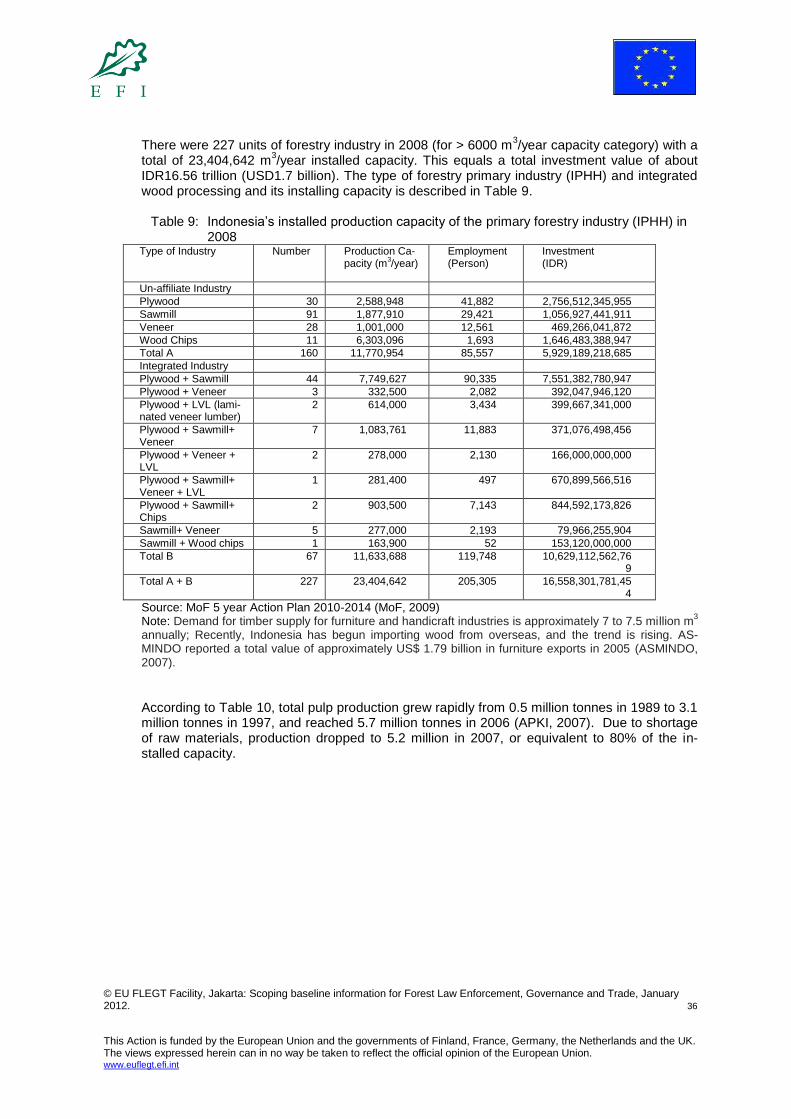
© EU FLEGT Facility, Jakarta: Scoping baseline information for Forest Law Enforcement, Governance and Trade, January 2012. 36
This Action is funded by the European Union and the governments of Finland, France, Germany, the Netherlands and the UK. The views expressed herein can in no way be taken to reflect the official opinion of the European Union. www.euflegt.efi.int
There were 227 units of forestry industry in 2008 (for > 6000 m3/year capacity category) with a
total of 23,404,642 m3/year installed capacity. This equals a total investment value of about
IDR16.56 trillion (USD1.7 billion). The type of forestry primary industry (IPHH) and integrated wood processing and its installing capacity is described in Table 9.
Table 9: Indonesia’s installed production capacity of the primary forestry industry (IPHH) in
2008 Type of Industry Number Production Ca-
pacity (m3/year)
Employment (Person)
Investment (IDR)
Un-affiliate Industry
Plywood 30 2,588,948 41,882 2,756,512,345,955
Sawmill 91 1,877,910 29,421 1,056,927,441,911
Veneer 28 1,001,000 12,561 469,266,041,872
Wood Chips 11 6,303,096 1,693 1,646,483,388,947
Total A 160 11,770,954 85,557 5,929,189,218,685
Integrated Industry
Plywood + Sawmill 44 7,749,627 90,335 7,551,382,780,947
Plywood + Veneer 3 332,500 2,082 392,047,946,120
Plywood + LVL (lami-nated veneer lumber)
2 614,000 3,434 399,667,341,000
Plywood + Sawmill+ Veneer
7 1,083,761 11,883 371,076,498,456
Plywood + Veneer + LVL
2 278,000 2,130 166,000,000,000
Plywood + Sawmill+ Veneer + LVL
1 281,400 497 670,899,566,516
Plywood + Sawmill+ Chips
2 903,500 7,143 844,592,173,826
Sawmill+ Veneer 5 277,000 2,193 79,966,255,904
Sawmill + Wood chips 1 163,900 52 153,120,000,000
Total B 67 11,633,688 119,748 10,629,112,562,769
Total A + B 227 23,404,642 205,305 16,558,301,781,454
Source: MoF 5 year Action Plan 2010-2014 (MoF, 2009) Note: Demand for timber supply for furniture and handicraft industries is approximately 7 to 7.5 million m
3
annually; Recently, Indonesia has begun importing wood from overseas, and the trend is rising. AS-MINDO reported a total value of approximately US$ 1.79 billion in furniture exports in 2005 (ASMINDO, 2007).
According to Table 10, total pulp production grew rapidly from 0.5 million tonnes in 1989 to 3.1 million tonnes in 1997, and reached 5.7 million tonnes in 2006 (APKI, 2007). Due to shortage of raw materials, production dropped to 5.2 million in 2007, or equivalent to 80% of the in-stalled capacity.

© EU FLEGT Facility, Jakarta: Scoping baseline information for Forest Law Enforcement, Governance and Trade, January 2012. 37
This Action is funded by the European Union and the governments of Finland, France, Germany, the Netherlands and the UK. The views expressed herein can in no way be taken to reflect the official opinion of the European Union. www.euflegt.efi.int
Table 10: Indonesia’s installed capacity of pulp Industry from 1997-2007 (tonnes)
Year Capacity Production Import Export Consumption Idle capacity*)
1997 4,266,600 3,058,450 943,970 1,186,020 2,816,400 1,208,150
1998 4,323,600 3,430,000 839,510 1,656,740 2,612,770 893,600
1999 4,543,600 3,694,630 956,960 1,179,400 3,472,190 848,970
2000 5,228,100 4,089,550 768,590 1,329,460 3,528,680 1,138,550
2001 5,587,100 4,665,920 564,130 1,698,580 3,531,470 921,180
2002 6,087,100 4,969,000 825,700 2,245,200 3,549,500 1,118,100
2003 6,287,100 5,194,310 735,560 2,375,250 3,554,620 1,092,790
2004 6,287,100 5,208,680 899,050 2,476,960 3,630,770 1,078,420
2005 6,447,100 5,467,540 885,580 2,562,970 3,790,150 979,560
2006 6,447,100 5,672,210 922,520 2,800,680 3,794,050 774,890
2007 6,483,100 5,200,000**) - - - 1,283,100
Source: Indonesian pulp and paper directory, Indonesia Pulp and Paper Association-APKI, 2007. *) calculated based on gap between installed capacity and actual production; **) data taken from APKI–Business Indonesia, 2008. The capacity of both the timber and paper sector, particularly the former, tends greatly to ex-ceed the quantity of wood raw material that is available from legal and sustainable sources in Indonesia. For example, during 2009, the Barito Pacific group produced less than 60,000 cubic metres of plywood despite its mills having an output capacity of 1.1 million cubic me-tres (Anon., 2010j). Table 11: Realization of industrial raw materials fulfilment plan, Indonesia (Capacity >
6.000 m³/year, during 2006–2008)
Source of Raw material
Year
2006 2007 2008
M3 % M
3 % M
3 %
Initial Stock 3,747,873.10 10.31% 2,382,279.97 6.48% 3,898,618.16 10.71%
HPH/Natural Forest 4,356,492.25 11.98% 6,445,263.40 17.53% 6,437,684.54 17.69%
HTI/Plantation 9,897,079.25 27.21% 21,981,821.99 59.78% 20,614,208.77 56.65%
ILS (other legal source) 16,139,549.45 44.38% 4,456,952.46 12.12% 4,391,657.05 12.07%
Other IPHHK 405,118.97 1.11% 174,873.15 0.48% 154,585.91 0.42%
Community Forest 1,324,898.29 3.64% 1,113,490.22 3.03% 611,990.81 1.68%
Plantation (stated own) 21,539.73 0.06% 28,565.65 0.08% 48,033.60 0.13%
Agriculture plantation 226,166.19 0.62% 66,390.72 0.18% 93,471.34 0.26%
Auction 49,584.78 0.14% 69,365.77 0.19% 32,553.83 0.09%
Import 198,977.58 0.55% 51,407.67 0.14% 104,431.31 0.29%
Total 36,367,279.59 100.00% 36,770,411.00 100.00% 36,387,235.32 100.00%
Source: Executive data Kehutanan, MoF, 2009. *) carried over from previous year.
Table 11 also describes that in 2006, total imported raw materials was 198 977 m3 or com-
prised 0.55% of the total raw materials fulfilment. The amount decreased to 51 407 m3 (0.14%
of total fulfilment) in 2007 and increased again to 104 431 m3 (0.29% of total fulfilment) in

© EU FLEGT Facility, Jakarta: Scoping baseline information for Forest Law Enforcement, Governance and Trade, January 2012. 38
This Action is funded by the European Union and the governments of Finland, France, Germany, the Netherlands and the UK. The views expressed herein can in no way be taken to reflect the official opinion of the European Union. www.euflegt.efi.int
2008. The data suggest that imported raw materials did not comprise a significant proportion of the industrial raw materials fulfilment in Indonesia.
7. WOOD-BASED PRODUCTS INDUSTRY STAKEHOLDERS Entities relevant to production and governance in the wood-based products industry include:
Kementerian Kehutanan or the MoF;
Pusat Pelaporan dan Analisis Transaksi Keuangan (PPATK) or the Indonesian Centre for reporting and analysis of monetary transactions, uses financial analysis to identify those who facilitate forest-related crime;
Multi-stakeholder Forestry Programme—supports forest governance reform particu-larly in connection with the EU’s FLEGT Action Plan
Konsortium Anti Illegal Logging - Indonesian Consortium against illegal logging (KAIL) —monitors illegal logging in West Kalimantan;
Asosiasi Pengusaha Hutan Indonesia (APHI)—a trade association for forest conces-sionaires;
Asosiasi Panel Kayu Indonesia (APKINDO)—the leading association in the timber sector. Managing the plywood sector for the benefit of its members has been its pri-mary focus;
Asosiasi Pulp dan Kertas Indonesia (APKI)—a trade association for pulp and paper producers;
Indonesian Saw Millers and Wood Product Manufacturers Association (ISWA)—an association mainly comprising small- and medium-sized enterprises having no logging concessions;
Asosiasi Industri Permebelan dan Kerajinan (ASMINDO)—an association for furniture producers in a number of regions.
In addition, the NGO community, with numerous organisations from grass-roots level, to na-tional level in Indonesia are vibrant, active and very engaged in the VPA process.
8. TRADE IN TIMBER-BASED PRODUCTS 8.1 Timber Sector
The industry has had very great influence over policy in the timber and paper sectors. Several long established timber groups remain active in the sector. Some of these have di-versified, particularly into palm oil, but also into banking and unrelated sectors. A number have links to Fujian (mainland China), and/or are at least partly foreign-owned, particularly by Chinese,
1 Japanese
2, Korean
3, Malaysian
4 and Singaporean
5 interests. A few are listed on
the Jakarta Stock Exchange6. The police, military and Suharto family still have extensive in-
terests in the industry.7 Their ownership is not always transparent.
1 For example CCT Telecom (including Merdeka)—enterprises listed on the Hong Kong Stock exchange are under-
stood to be subject to Chinese government guidelines concerning logging overseas. 2 For example Marubeni (Tanjung Enim Lestari / Musi Hutan Persada), Sumitomo Forestry (including Kutai Timber
and Rimba Partikel—a joint venture with Kayu Lapis, one of the largest timber groups in Papua) 3 For example Dongwha (as Korindo, its logging affiliates and Aspex Paper, a newsprint producer), Kodeco
4 For example Wapoga Mutiara
5 For example Samko (including Sumalindo Lestari Jaya and Essam Timber) and Royal Golden Eagle “RGE” (for-
merly Raja Garuda Mas (including APRIL, IndoRayon, Pacific Fiber and ITCI Manunggal) 6 Barito Pacific (including Tunggal Agathis Indah and Mongole Timber)
7 For example Kertas Nusantara, Hanurata, Alas Kusuma and Prabu Alaska
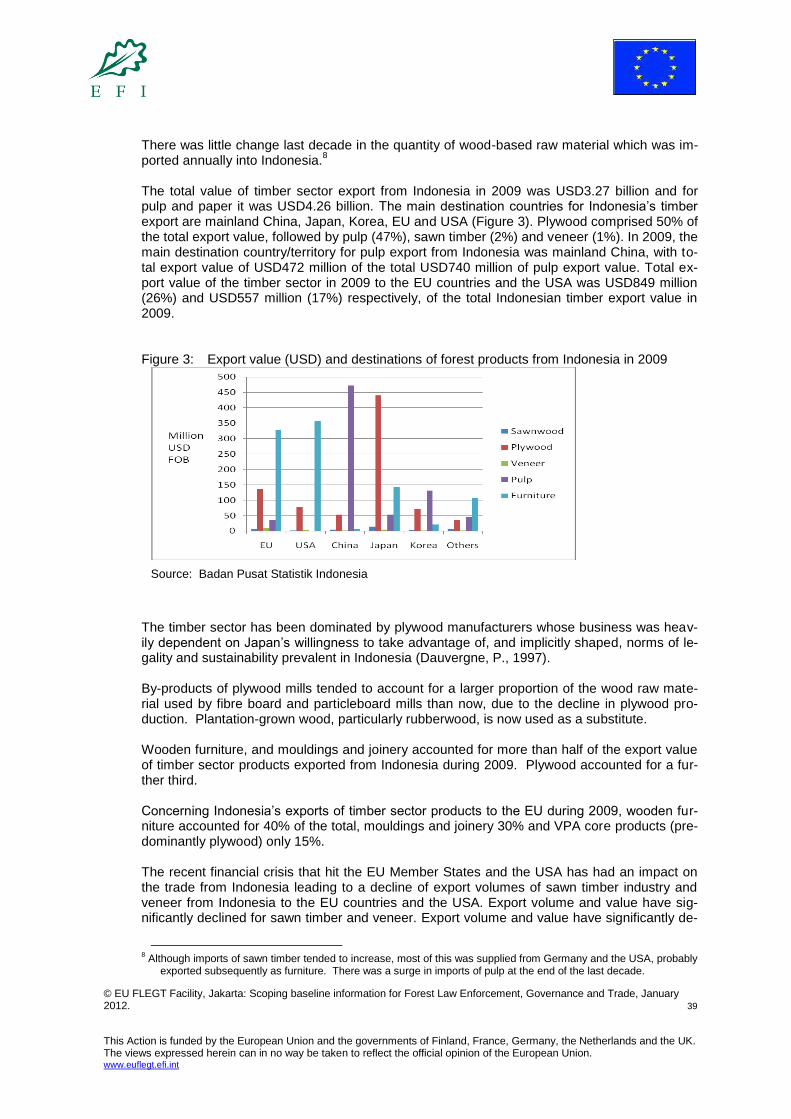
© EU FLEGT Facility, Jakarta: Scoping baseline information for Forest Law Enforcement, Governance and Trade, January 2012. 39
This Action is funded by the European Union and the governments of Finland, France, Germany, the Netherlands and the UK. The views expressed herein can in no way be taken to reflect the official opinion of the European Union. www.euflegt.efi.int
There was little change last decade in the quantity of wood-based raw material which was im-ported annually into Indonesia.
8
The total value of timber sector export from Indonesia in 2009 was USD3.27 billion and for pulp and paper it was USD4.26 billion. The main destination countries for Indonesia’s timber export are mainland China, Japan, Korea, EU and USA (Figure 3). Plywood comprised 50% of the total export value, followed by pulp (47%), sawn timber (2%) and veneer (1%). In 2009, the main destination country/territory for pulp export from Indonesia was mainland China, with to-tal export value of USD472 million of the total USD740 million of pulp export value. Total ex-port value of the timber sector in 2009 to the EU countries and the USA was USD849 million (26%) and USD557 million (17%) respectively, of the total Indonesian timber export value in 2009. Figure 3: Export value (USD) and destinations of forest products from Indonesia in 2009
Source: Badan Pusat Statistik Indonesia
The timber sector has been dominated by plywood manufacturers whose business was heav-ily dependent on Japan’s willingness to take advantage of, and implicitly shaped, norms of le-gality and sustainability prevalent in Indonesia (Dauvergne, P., 1997). By-products of plywood mills tended to account for a larger proportion of the wood raw mate-rial used by fibre board and particleboard mills than now, due to the decline in plywood pro-duction. Plantation-grown wood, particularly rubberwood, is now used as a substitute. Wooden furniture, and mouldings and joinery accounted for more than half of the export value of timber sector products exported from Indonesia during 2009. Plywood accounted for a fur-ther third. Concerning Indonesia’s exports of timber sector products to the EU during 2009, wooden fur-niture accounted for 40% of the total, mouldings and joinery 30% and VPA core products (pre-dominantly plywood) only 15%. The recent financial crisis that hit the EU Member States and the USA has had an impact on the trade from Indonesia leading to a decline of export volumes of sawn timber industry and veneer from Indonesia to the EU countries and the USA. Export volume and value have sig-nificantly declined for sawn timber and veneer. Export volume and value have significantly de-
8 Although imports of sawn timber tended to increase, most of this was supplied from Germany and the USA, probably
exported subsequently as furniture. There was a surge in imports of pulp at the end of the last decade.

© EU FLEGT Facility, Jakarta: Scoping baseline information for Forest Law Enforcement, Governance and Trade, January 2012. 40
This Action is funded by the European Union and the governments of Finland, France, Germany, the Netherlands and the UK. The views expressed herein can in no way be taken to reflect the official opinion of the European Union. www.euflegt.efi.int
clined for sawn timber and veneer. The export volume of sawn timber has decreased by 15% from 20 112 to 17 006 cubic metres, while the export value has decreased by 17% from USD11.65 million to USD9.65 million. The export volume of veneer has decreased by 12% from USD8.711 million to USD7.64 million (Tambunan, E., and Agus, R., 2010). Indonesia has since 2001 prohibited the export of logs. This greatly facilitated the expansion of Indonesia’s plywood industry, which accounts for most of the RWE volume consumed by the timber sec-tor—and roughly 60% of the RWE volume exported during recent years. Indonesia has prohibited the export of rough sawn timber products which accounts for much of the HS4407 sawn timber product category since 2004. However, importing countries’ trade statistics indicate that sawn timber continues to be exported in substantial volumes, although these have been declining since 2002. This contrasts with export statistics declared by Indo-nesia—which slumped to near zero during 2004. The difference is unlikely to be attributable to sawn timber being misclassified as mouldings—exports of which have declined gradually since 2003. Although mismatches between Indonesia’s exports and importing countries’ im-ports have repeatedly been shown to be large, effective action to resolve those differences has yet to take place. There are two possible reasons—undried rough sawn timber is smug-gled out of Indonesia and is imported by trading partners due to lack of appropriate Customs legislation and poor enforcement (see Customs section 9), or Indonesia has managed to in-crease the processing of kilned and planed sawn timber significantly since 2004. This may not have been feasible in such a short period of time due to the investment in equipment and capi-tal that would have been needed. Nevertheless, by July 2010, both the overall volume and value of forestry product exports had increased significantly. The overall export volume had reached 1.5 million m
3 or had increased
by 26% compared to the amount for the same period in 2009, which was only 1.1 million m3.
The overall export value had reached USD805.9 million or had increased by 31% compared to the amount for the same period in 2009, which was only USD556.2 million (Tambunan, E., and Agus, R., 2010). Overall and by both RWE volume and export value, the EU was the destination for an increas-ing share of the timber sector products which were exported from Indonesia during the last decade, even as Indonesia’s timber sector exports was declining. The cost per cubic metre of the timber sector to the EU has been increasing yearly even as the decline in exports has con-tinued (Table 12). Table 12: EU share of export of Indonesia’s timber sector between 2000 and 2009 in million
m3 RWE
Year 2000 2001 2002 2003 2004 2005 2006 2007 2008 2009
World 22.62 23.48 22.68 21.20 18.29 17.35 15.36 12.35 11.26 8.26
EU 2.96 3.22 2.82 2.61 2.55 2.66 2.34 2.13 1.90 1.35
Value USD FOB 839 767 763 791 891 1,050 1,087 1,110 1,092 849
Unit cost USD/m
3 283.6 238.3 270.7 302.6 349.9 394.4 464.9 522.1 575.5 629.1
Source: Badan Pusat Statistik Indonesia
Furniture exports from Indonesia have been a major foreign exchange earner for the country (Figure 4). The main exports has been to the EU countries and the USA which values were USD420 million and USD400 million respectively in 2008, but dropping to USD330 million and USD360 million respectively in 2009. These values were greater than values of exports to the

© EU FLEGT Facility, Jakarta: Scoping baseline information for Forest Law Enforcement, Governance and Trade, January 2012. 41
This Action is funded by the European Union and the governments of Finland, France, Germany, the Netherlands and the UK. The views expressed herein can in no way be taken to reflect the official opinion of the European Union. www.euflegt.efi.int
Asian countries (mainland China, Japan and Korea) which only came up to USD208 million in 2009.
Figure 4: Indonesia’s exports of furniture (weight in million kg and % of total national
furniture exports) to selected destination countries in 2009
Source: Badan Pusat Statistik Indonesia
The impact of the mainland China—ASEAN free trade agreement on production in Indonesia, especially of (indoor) wooden furniture, and on priorities assigned to minimising trade in Illegal timber is as yet uncertain. Much of the wooden furniture which is exported from Indonesia is made of plantation-grown teak, particularly for outdoor use. The share of such furniture in the RWE volume (and particularly the value) of wooden furniture made in Indonesia might be sub-stantial (Roda, J-M. et al., 2007). Greater understanding of the source of the timber used to manufacture furniture would help to determine the impact. A furniture industry dominated by small and medium-sized enterprises (SMEs) plays an impor-tant role in creating employment opportunities for people in Indonesia. The furniture industry creates a huge multiplier effect for players such as craftsmen, who supply intermediate goods, and timber merchants who supply raw material. A study in 2005 reported that the total em-ployment by a furniture industry centre in Central Java, Indonesia was around one million workers (Effendi, R., and Hariyatno., I, B., 2005). Since furniture is included in the VPA, this could have significant impacts on Indonesia’s furni-ture exports. A temporary shock would be expected at the initial stage of the implementation (adjustment phase) due to the high volume and price of the exports to the EU in relation to other markets. The implementation of the legality verification system for raw materials would be expected to help recover from the shock in a relatively short period of time. The first potential major impact of the VPA once implementation begins will be the significant decline in demand of wood products from Indonesia with only the legal ‘portion’ targeted at EU market. This will mean that any alleged mix of illegally sourced wood products that were ex-ported to the EU countries prior to the VPA implementation will shift to other less stringent markets (Lawson, S., and MacFaul, L., 2010). The decline in employment levels can be predicted due to the closure of many timber indus-
© EU FLEGT Facility, Jakarta: Scoping baseline information for Forest Law Enforcement, Governance and Trade, January 2012. 42
This Action is funded by the European Union and the governments of Finland, France, Germany, the Netherlands and the UK. The views expressed herein can in no way be taken to reflect the official opinion of the European Union. www.euflegt.efi.int
tries in relation to implementation of VPA. According to the data, every 113 m3 installed capac-
ity absorbs 1 worker although in reality, as the full installed capacity is not used, this means a lower productivity per actual worker in the industry. Total wood exports from Indonesia to EU countries were about 319 million kg or equivalent to 425 957 m
3 (1 m
3 equals to 750 kg)
9,
which suggest employment of about 3,770 engaged directly in the timber product export sector (excluding furniture). If we assume that 40% of timber industries are still using illegal raw materials (according to Lawson, S., and MacFaul, L., 2010), the country’s wood exports could decline to 255 000 m
3
and about 1,500 IPHH employees could potentially lose their jobs but this is a very rough es-timate as not all products are exported to the EU. The number does not include workers from furniture industries, which are assumed to have a larger number of employees than IPHH. Some companies may undertake short-term solutions to alleviate the impact of legality verifi-cation on the employment problem, by shifting the export destination to non eco-sensitive and non VPA countries although this is expected to change over time as companies work to in-crease the legally verified timber in their supply chain as the EU market pays a higher price for timber products in comparison to many other markets. When the VPA comes into effect, community forest plantations will be in a better position since such forest type is considered as a legal source of timber under the legislation of Indonesia, although there are limited verification systems for these plantations such as by LEI. However Timber Legality Verification System (SVLK) as an instrument to determine the legality of VPA could potentially increase production cost that in turn could undermine community forest de-velopment, which is currently growing very rapidly, especially on Java Island. Therefore, SVLK needs to be adjusted for community forests, especially the ones on private lands. In 2007, MoF issued the Ministerial Regulation no. P.33/Menhut-II/2007 about the sec-ond amendment to the previous Ministerial Regulation no. P.51/Menhut-II/2006 about the need for attaching a Reference Letter on the Source of Origin or Surat Keterangan Asal Usul (SKAU) for forest product transportation from community forest. Community forestry operates on a much simpler system compared to large scale concessions. Therefore, it is suggested that the regulation could be further improved through SVLK adjust-ment, such as by the simplification of SKAU and the Legal Letter of Log or Indonesian licence to transport logs - Surat Keterangan Sahnya Kayu Bulat (SKSKB) to transaction documents, i.e. receipts or other commonly recognized purchasing documents. If the EU can effectively control and prevent illegal timber products from non-VPA countries through the EU Timber Regulation, a gradual increase of Indonesia’s export value from IPHH products (plywood, veneer, sawn timber, and pulp) and furniture could be expected. Legality verification would increase timber production cost, but it is presumed this will not significantly impact on the long-term exports, once the industry finds ways of reducing costs to compen-sate for higher production costs. However, Indonesia’s forest industry players are still con-cerned about a potential "evasion" from other non-VPA countries that will significantly affect the "level playing field" and competitiveness of Indonesia’s wood exports to EU countries, al-though this should disappear once the EU Timber Regulation is enforced in 2013.
9 Conversion factor of timber from (kg to m
3) according to FAO. The weight of timber varies according to the species of
tree. Examples: Opepe weighs about 750 kg/m3; Teak weighs about 640 kg/m
3; Ironbark weighs about 1 120
kg/m3; Greenheart weighs about 1 040 kg/m
3; Red louro weighs about 640 kg/m
3; Blue gum weighs about 830
kg/m3. Conversion from m
3 product to RWE is about Non-conifer (rough-green) m3rw/m3p 1.53 (sawn timber),
Non-conifer for veneer=1.8; for Plywood=2. For this study use 1.8 RWE for IPHH products and conversion rate from Kg to m
3 (use average of those =876 kg/m
3) and from m
3 to RWE use (1.8) conversion factor.

© EU FLEGT Facility, Jakarta: Scoping baseline information for Forest Law Enforcement, Governance and Trade, January 2012. 43
This Action is funded by the European Union and the governments of Finland, France, Germany, the Netherlands and the UK. The views expressed herein can in no way be taken to reflect the official opinion of the European Union. www.euflegt.efi.int
The EU could also support through dialogues with other major importer countries (mainland China, Japan and the USA) in order to promote co-operation in combating illegal logging and its associated trade. Reduced illegal logging is expected to have a long-term positive impact on the environment and biodiversity by discouraging illegally sourced timber industries. In the long run, VPA could have positive impacts on legal certainty in the business, encouraging fair play and good incen-tives for industries that use legal raw materials.
Additional details for the timber sector are in the following sections.
8.2 Paper Sector
That part of Indonesia’s paper sector which is based primarily on virgin wood fibre is dom i-nated by two large groups, Asia Pulp and Paper, part of the Sinar Mas Group and APRIL, part of the RGE (formerly RGM) Group. Although both are controversial mainly because of large scale clearance of natural forest for plantation and land tenure conflicts with indigenous com-munities, APP has had the most attention (Lang, C., 2007; Greenpeace, 2010). Both compa-nies have extensive interests in mainland China and also have a number of businesses in North America. Their exports to the EU include copier paper marketed under their own brands. The paper sector has increased steadily in exports from 17.82 million m
3 RWE in 2000 to
around 26 million m3 RWE in 2006, since when it has remained relatively constant to 2009.
Two other enterprises, the Japanese group Marubeni with Musi Hutan Persada (MHP) and Tanjung Enim Lestari (TEL), and Kiani Kertas (owned by Prabowo Subianto’s group) account for the country’s remaining production of wood-based pulp. Acacia species (primarily Acacia mangium) account for the bulk of the plantation-grown pulp-wood consumed by these four groups. In so far as (i) Indonesia accounts for most of the world’s acacia-based pulp and (ii) it is feasible to identify products made at least partially from such pulp, it would be possible to assess the likelihood that the origin of paper products (printed or plain) which are suspected of being linked to illegality and/or unsustainability and possible source countries of the pulp. A recent report of fibre analysis showed it is feasible to identify species used in paper products. Gonystylus spp. Ramin was found in the paper used to print a children’s book (Nogueron, R., and Hanson, C., 2010). Further plans to expand this part of Indonesia’s paper sector are controversial because of bio-diversity loss, carbon emissions and tenure conflict and displacement of forest communities (Lang, C. 2007). A number of schemes have failed to come to fruition (Minar, T. B., 2006). One challenge has been the increase of social conflict and uncertain land tenure as the Indo-nesian regional autonomy has led to sharp increase in land claims and illegal logging (Barr, C., 2008). In Jambi in 2001, APP lost 70 000 hectares to local claims, and in Riau, APP had 57 000 ha subjected to claims in 2002. Indonesia’s paper sector also includes a number of enterprises which produce paper based primarily on waste-paper. A substantial quantity of this segment’s output is exported—particularly as newsprint.
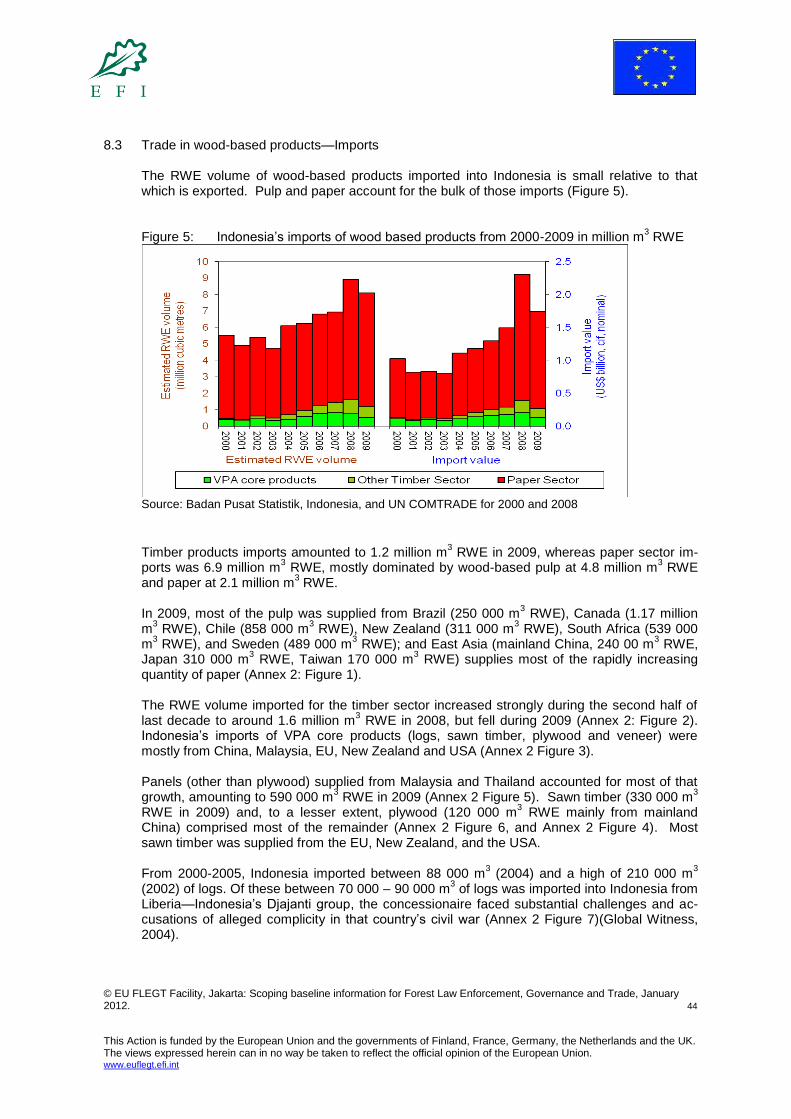
© EU FLEGT Facility, Jakarta: Scoping baseline information for Forest Law Enforcement, Governance and Trade, January 2012. 44
This Action is funded by the European Union and the governments of Finland, France, Germany, the Netherlands and the UK. The views expressed herein can in no way be taken to reflect the official opinion of the European Union. www.euflegt.efi.int
8.3 Trade in wood-based products—Imports The RWE volume of wood-based products imported into Indonesia is small relative to that which is exported. Pulp and paper account for the bulk of those imports (Figure 5). Figure 5: Indonesia’s imports of wood based products from 2000-2009 in million m
3 RWE
Source: Badan Pusat Statistik, Indonesia, and UN COMTRADE for 2000 and 2008
Timber products imports amounted to 1.2 million m
3 RWE in 2009, whereas paper sector im-
ports was 6.9 million m3 RWE, mostly dominated by wood-based pulp at 4.8 million m
3 RWE
and paper at 2.1 million m3 RWE.
In 2009, most of the pulp was supplied from Brazil (250 000 m
3 RWE), Canada (1.17 million
m3 RWE), Chile (858 000 m
3 RWE), New Zealand (311 000 m
3 RWE), South Africa (539 000
m3 RWE), and Sweden (489 000 m
3 RWE); and East Asia (mainland China, 240 00 m
3 RWE,
Japan 310 000 m3 RWE, Taiwan 170 000 m
3 RWE) supplies most of the rapidly increasing
quantity of paper (Annex 2: Figure 1). The RWE volume imported for the timber sector increased strongly during the second half of last decade to around 1.6 million m
3 RWE in 2008, but fell during 2009 (Annex 2: Figure 2).
Indonesia’s imports of VPA core products (logs, sawn timber, plywood and veneer) were mostly from China, Malaysia, EU, New Zealand and USA (Annex 2 Figure 3). Panels (other than plywood) supplied from Malaysia and Thailand accounted for most of that growth, amounting to 590 000 m
3 RWE in 2009 (Annex 2 Figure 5). Sawn timber (330 000 m
3
RWE in 2009) and, to a lesser extent, plywood (120 000 m3 RWE mainly from mainland
China) comprised most of the remainder (Annex 2 Figure 6, and Annex 2 Figure 4). Most sawn timber was supplied from the EU, New Zealand, and the USA. From 2000-2005, Indonesia imported between 88 000 m
3 (2004) and a high of 210 000 m
3
(2002) of logs. Of these between 70 000 – 90 000 m3 of logs was imported into Indonesia from
Liberia—Indonesia’s Djajanti group, the concessionaire faced substantial challenges and ac-cusations of alleged complicity in that country’s civil war (Annex 2 Figure 7)(Global Witness, 2004).

© EU FLEGT Facility, Jakarta: Scoping baseline information for Forest Law Enforcement, Governance and Trade, January 2012. 45
This Action is funded by the European Union and the governments of Finland, France, Germany, the Netherlands and the UK. The views expressed herein can in no way be taken to reflect the official opinion of the European Union. www.euflegt.efi.int
Mainland China supplied most of the small volume of veneer which was imported into Indone-sia.
8.4 Trade in wood-based products—Exports Although the total RWE volume of wood-based products exported from Indonesia declined slightly over the last decade, the share accounted for by the timber sector declined rapidly from a high of 23.38 million m
3 RWE in 2001 to 8.24 million m
3 RWE in 2009 and this decline
has not been compensated for by the paper sector (Figure 6). Plywood and, to a lesser ex-tent, mouldings and joinery accounted for most of the decline. Figure 6: Indonesia’s exports of wood-based products (by products) from 2000-2009 in mil-
lion m3 RWE
Source: Badan Pusat Statistik, Indonesia, and UN COMTRADE for 2000 and 2008
The main country of export of VPA core products by Indonesia in the last decade is Japan, al-though Japan’s imports has been decreasing dramatically from a high of 6.26 million m
3 RWE
in 2001 down to 1.73 million m3 RWE in 2009 (Annex 3 Figure 8). The total exports of VPA
core products has been steadily reducing from 15 million m3 RWE in 2000 down to 4.7 million
m3 RWE in 2009. The export volumes for all other timber sector products (minus VPA core
products) has risen steadily from 7.28 million m3 RWE in 2000, to a high of 8.72 million m
3
RWE in 2005, and since then has been dropping steadily to 3.52 million m3 RWE in 2009. The
main countries of exports have been EU, Australia, China, Japan, South Korea, Taiwan and USA (Annex 3 Figure 9). The exports of the paper sector has been increasing steadily from 17.82 million m
3 RWE in
2000 to around 26 million m3 RWE in the latter half of the last decade (Annex 3 Figure 10).
The main countries of exports have been China, Japan, South Korea, EU, and Malaysia among others. The Middle East is an important and growing market for timber from the insular SEA sub-region. There are no restrictions or barriers to imports of timber, and Indonesia and Malaysia have been developing trade networks and relations to increase trade flows of timber to the re-gion (Malessa, U. and Chen, H.K., 2010). In 2009, Indonesia’s export to the Middle East amounted to just over 1 million m
3 RWE.

© EU FLEGT Facility, Jakarta: Scoping baseline information for Forest Law Enforcement, Governance and Trade, January 2012. 46
This Action is funded by the European Union and the governments of Finland, France, Germany, the Netherlands and the UK. The views expressed herein can in no way be taken to reflect the official opinion of the European Union. www.euflegt.efi.int
The decline of forest product exports was mainly caused by the closure of many Industri Primer Hasil Hutan (IPHH) or Indonesian primary forestry industry (capacity <6000 m
3/year)
due to an insufficient supply of raw materials after enforcement of illegal logging, and decreas-ing demand for plywood products from Japan. Japan conducted re-engineering of its plywood industry which enabled the industry in Japan to process small-diameter logs imported from Si-beria (Ministry of Forestry, 2009b). The main decline in exports has also been due to the log export ban instituted in October 2001 (ITTO, 2003) which was made permanent in 2002, and the rough sawn timber export ban which excludes some categories of planed sawn timber from September 2004. There has been a negligible export of logs from Indonesia from 2002 onwards.
8.4.1 Sawn timber In the insular SEA sub-region, there are four exporters of sawn timber: Indonesia, Malaysia, the Philippines, and Singapore. Intra-regionally in the last decade, following the rough sawn timber export ban, Indonesia declared a small volume (less than 10 000 m
3 RWE) of sawn
timber exported to Malaysia and Singapore and a negligible amount to Singapore in the years from 2004 to 2009. Indonesia has seen a steep decline in exports of sawn timber, in particular after 2004 when the government banned the export of rough sawn timber (Figure 7). The exports of sawn tim-ber have thus shifted to value added products like kiln dry and planed sawn timber. In particu-lar, the exports to the EU and Japan have shown a significant increase in value even though the volumes are low at less than 50 000 m
3 in 2008 and 2009 (Figure 7).
Figure 7: Indonesia’s exports of sawn timber by destination country from 2000-2009 in mil-
lion m3 RWE
Source: Badan Pusat Statistik, Indonesia, and UN COMTRADE for 2000 and 2008
Indonesia accounted for less than 5% of the tropical sawn timber which was imported into the EU during the last decade (i.e. 2000–2009) but this has decreased significantly to only 5 200 m
3 RWE in 2009 although the EU has declared a total import of 42 000 m
3 in 2009 (Figure 8).
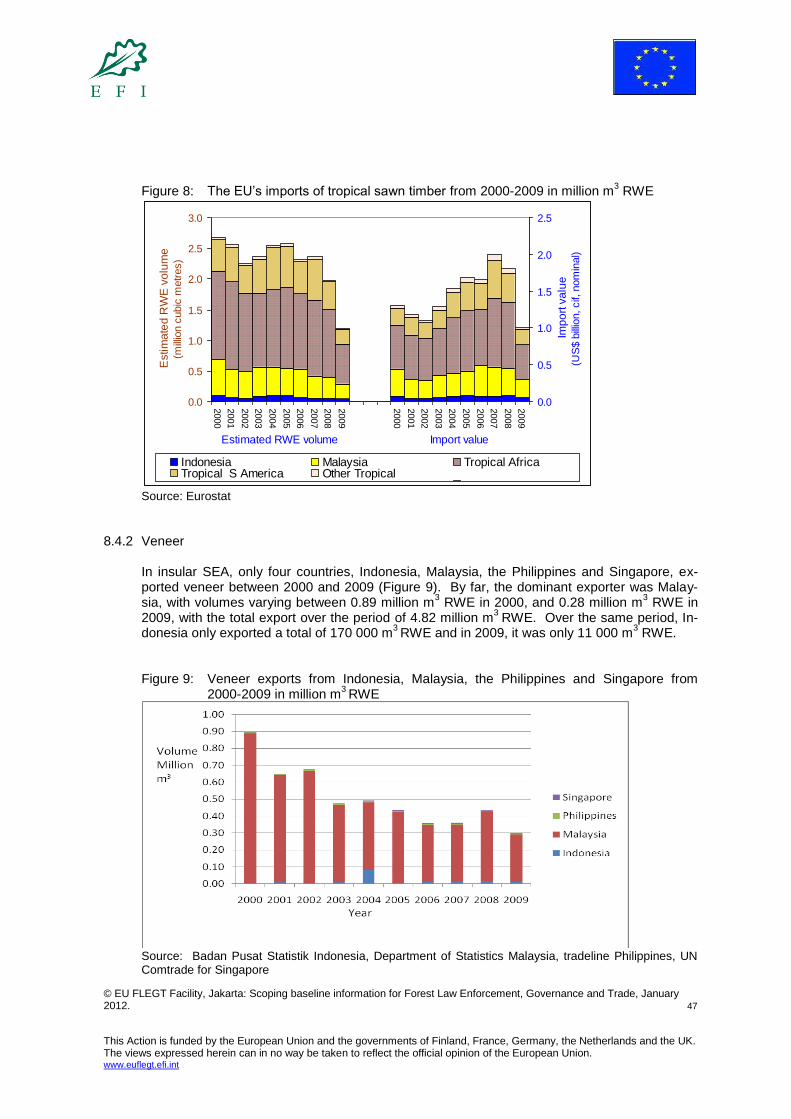
© EU FLEGT Facility, Jakarta: Scoping baseline information for Forest Law Enforcement, Governance and Trade, January 2012. 47
This Action is funded by the European Union and the governments of Finland, France, Germany, the Netherlands and the UK. The views expressed herein can in no way be taken to reflect the official opinion of the European Union. www.euflegt.efi.int
Figure 8: The EU’s imports of tropical sawn timber from 2000-2009 in million m
3 RWE
0.0
0.5
1.0
1.5
2.0
2.5
3.0
2000
2001
2002
2003
2004
2005
2006
2007
2008
2009
2000
2001
2002
2003
2004
2005
2006
2007
2008
2009
Estim
ate
d R
WE
vo
lum
e
(mill
ion c
ubic
metr
es)
0.0
0.5
1.0
1.5
2.0
2.5
Imp
ort
va
lue
(US
$ b
illio
n, cif,
nom
inal)
Indonesia Malaysia Tropical AfricaTropical S America Other Tropical
Indonesia Malaysia Tropical AfricaTropical S America Other Tropical
Import valueEstimated RWE volume
Source: Eurostat
8.4.2 Veneer In insular SEA, only four countries, Indonesia, Malaysia, the Philippines and Singapore, ex-ported veneer between 2000 and 2009 (Figure 9). By far, the dominant exporter was Malay-sia, with volumes varying between 0.89 million m
3 RWE in 2000, and 0.28 million m
3 RWE in
2009, with the total export over the period of 4.82 million m3
RWE. Over the same period, In-donesia only exported a total of 170 000 m
3 RWE and in 2009, it was only 11 000 m
3 RWE.
Figure 9: Veneer exports from Indonesia, Malaysia, the Philippines and Singapore from
2000-2009 in million m3 RWE
Source: Badan Pusat Statistik Indonesia, Department of Statistics Malaysia, tradeline Philippines, UN Comtrade for Singapore

© EU FLEGT Facility, Jakarta: Scoping baseline information for Forest Law Enforcement, Governance and Trade, January 2012. 48
This Action is funded by the European Union and the governments of Finland, France, Germany, the Netherlands and the UK. The views expressed herein can in no way be taken to reflect the official opinion of the European Union. www.euflegt.efi.int
The main countries of export for veneer from Indonesia has been EU, China and USA, al-though the volume is small at less than 3 000 m
3 RWE each (Annex 3 Figure 11).
8.4.3 Plywood
In the insular SEA sub-region, the dominant plywood exporters have been Indonesia and Ma-laysia (Figure 10). The total volumes exported by each of the two countries between 2000 and 2009 have been quite close, with Indonesia’s total being 44.51 million m
3 RWE, and for
Malaysia it is slightly less at 41.79 million m3
RWE. However, while Indonesia’s exports have been decreasing over the period, Malaysia’s has been increasing and from 2005 to 2009 has exceeded Indonesia’s exports significantly, on average by over 1.4 million m
3 RWE annually.
Figure 10: Export of plywood from Indonesia, Malaysia, the Philippines and Singapore from
2000-2009 in million m3 RWE
Source: Badan Pusat Statistik Indonesia, Department of Statistics Malaysia, tradeline Philippines, UN Comtrade for Singapore
There is some intra-regional plywood trade. Indonesia exported around 130 000 m
3 RWE of
plywood to Singapore annually during the first half of the last decade and roughly two thirds less to around 30–50 000 m
3 RWE yearly during the second half. Indonesia exported a small
volume (between 10–50 000 m3 RWE) to Malaysia yearly during most of the last decade.
Malaysia imported less than 20 000 m
3 RWE a year of plywood from Indonesia during the first
half of the last decade and half of that again during the second half with only 10 000 m3 RWE
in 2009. Japan dominates the market for Indonesian plywood (Annex 3 Figure 12) with exports ranging from the highest volume in 2000 of 2.63 million m
3 RWE, to a low of 0.74 million m
3 RWE in
2009. The share of Japan and other substantial export destinations changed remarkably little during the last decade. The three-fold decline in the total volume exported since 2001 might reflect exhaustion of Indonesia’s forests as much as law enforcement efforts in Indonesia or importers’ concerns about legality and sustainability. The next highest export market is mainland China with between 670 000 m
3 RWE achieved in
2000, to a low of 120 000 m3 RWE in 2009. Other large markets are Taiwan with the highest
volume exported of just over 400 000 m3 RWE in 2000, decreasing to 190 000 m
3 RWE in
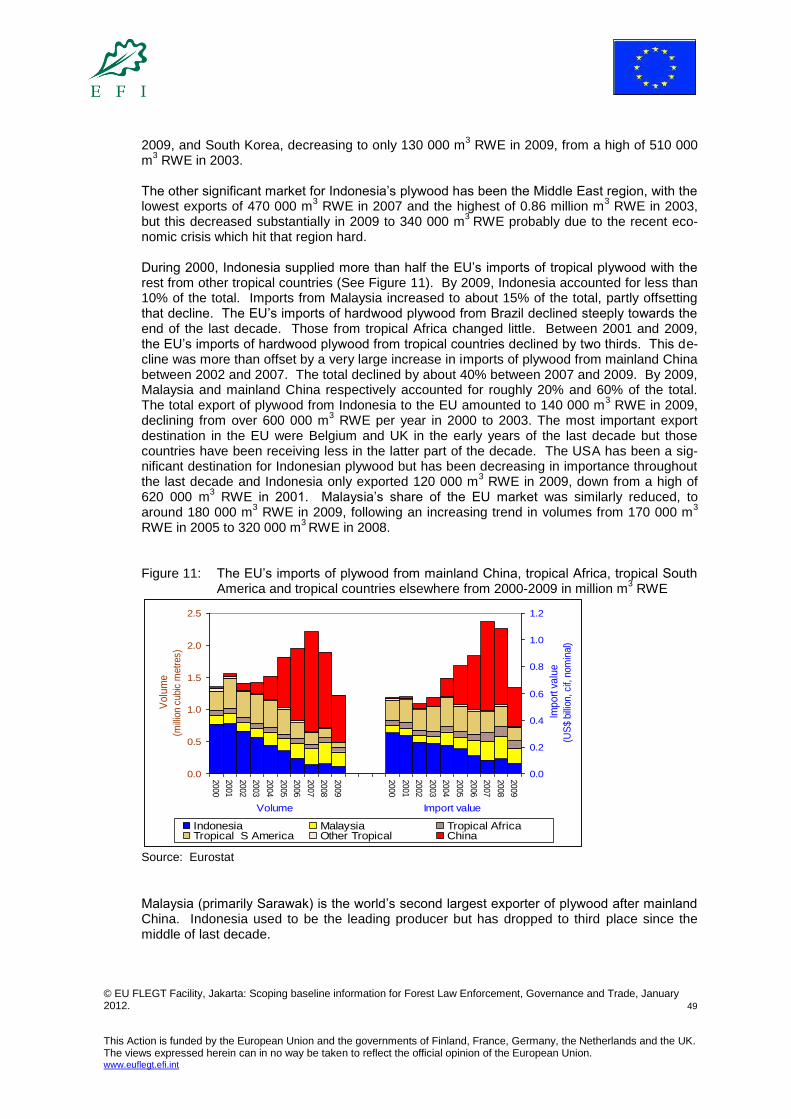
© EU FLEGT Facility, Jakarta: Scoping baseline information for Forest Law Enforcement, Governance and Trade, January 2012. 49
This Action is funded by the European Union and the governments of Finland, France, Germany, the Netherlands and the UK. The views expressed herein can in no way be taken to reflect the official opinion of the European Union. www.euflegt.efi.int
2009, and South Korea, decreasing to only 130 000 m3 RWE in 2009, from a high of 510 000
m3 RWE in 2003.
The other significant market for Indonesia’s plywood has been the Middle East region, with the lowest exports of 470 000 m
3 RWE in 2007 and the highest of 0.86 million m
3 RWE in 2003,
but this decreased substantially in 2009 to 340 000 m3
RWE probably due to the recent eco-nomic crisis which hit that region hard. During 2000, Indonesia supplied more than half the EU’s imports of tropical plywood with the rest from other tropical countries (See Figure 11). By 2009, Indonesia accounted for less than 10% of the total. Imports from Malaysia increased to about 15% of the total, partly offsetting that decline. The EU’s imports of hardwood plywood from Brazil declined steeply towards the end of the last decade. Those from tropical Africa changed little. Between 2001 and 2009, the EU’s imports of hardwood plywood from tropical countries declined by two thirds. This de-cline was more than offset by a very large increase in imports of plywood from mainland China between 2002 and 2007. The total declined by about 40% between 2007 and 2009. By 2009, Malaysia and mainland China respectively accounted for roughly 20% and 60% of the total. The total export of plywood from Indonesia to the EU amounted to 140 000 m
3 RWE in 2009,
declining from over 600 000 m3 RWE per year in 2000 to 2003. The most important export
destination in the EU were Belgium and UK in the early years of the last decade but those countries have been receiving less in the latter part of the decade. The USA has been a sig-nificant destination for Indonesian plywood but has been decreasing in importance throughout the last decade and Indonesia only exported 120 000 m
3 RWE in 2009, down from a high of
620 000 m3 RWE in 2001. Malaysia’s share of the EU market was similarly reduced, to
around 180 000 m3 RWE in 2009, following an increasing trend in volumes from 170 000 m
3
RWE in 2005 to 320 000 m3 RWE in 2008.
Figure 11: The EU’s imports of plywood from mainland China, tropical Africa, tropical South
America and tropical countries elsewhere from 2000-2009 in million m3 RWE
0.0
0.5
1.0
1.5
2.0
2.5
2000
2001
2002
2003
2004
2005
2006
2007
2008
2009
2000
2001
2002
2003
2004
2005
2006
2007
2008
2009
Vo
lum
e
(mill
ion c
ubic
metr
es)
0.0
0.2
0.4
0.6
0.8
1.0
1.2
Imp
ort
va
lue
(US
$ b
illio
n, cif,
nom
inal)
Indonesia Malaysia Tropical AfricaTropical S America Other Tropical China
Indonesia MalaysiaTropical Africa Tropical S America Other TropicalChina
Import valueVolume
Source: Eurostat
Malaysia (primarily Sarawak) is the world’s second largest exporter of plywood after mainland China. Indonesia used to be the leading producer but has dropped to third place since the middle of last decade.

© EU FLEGT Facility, Jakarta: Scoping baseline information for Forest Law Enforcement, Governance and Trade, January 2012. 50
This Action is funded by the European Union and the governments of Finland, France, Germany, the Netherlands and the UK. The views expressed herein can in no way be taken to reflect the official opinion of the European Union. www.euflegt.efi.int
The decline in volume exported to certain EU member states, particularly the UK, was driven by concerns of illegality and deforestation (Timber Trade Federation, 2004). Despite the amended Lacey Act, the volume exported to the USA remains substantial. The USA declared imports of 160,000 m
3 RWE of plywood from Indonesia during 2009 while Indonesia declared
exports of 120,000 m3
RWE to the USA. There could be many reasons for this discrepancy as illustrated in the section on Customs but further study to find out the reasons should be carried out.
8.4.4 Mouldings and Joinery The insular SEA sub-region is a large exporter of mouldings and joinery totalling over 49 mil-lion m
3 RWE between 2000 and 2009. The largest exporter has been Indonesia, followed by
Malaysia, the Philippines, and the smallest exporter, Singapore (See Figure 12). Figure 12: Exports of moulding and joinery from Indonesia, Malaysia, the Philippines and
Singapore from 2000-2009 in million m3 RWE
Source: Badan Pusat Statistik Indonesia, Department of Statistics Malaysia, tradeline Philippines, UN Comtrade for Singapore
Indonesia has been a major exporter, with a steady increase during the years 2000 to 2005, from 3.53 million m
3 RWE to around 4.12 million m
3 RWE, before a gradual decrease after
2006 to a low of 1.37 million m3 RWE in 2009, a decline of over 60% (Annex 3 Figure 13).
Intra-region trade within the insular SEA sub-region is variable. Between 2000 and 2009 In-donesia exported a small volume of mouldings and joinery to Malaysia, ranging from 20 000 to 120 000 m
3 RWE yearly, and between 40 000 to 150 000 m
3 RWE yearly to Singapore in the
same period. Indonesia imports a negligible quantity of mouldings and joinery. Malaysia ex-ported a small volume (primarily joinery) to Indonesia (10–20 000 m
3 RWE yearly from 2005 to
2009). In terms of trade to the rest of Asia, the most important market for Indonesia has been mainland China but at a decreasing volume over the last decade (from a high of 1.65 million m
3 RWE in 2003 down to 190 000 m
3 RWE in 2009. A similar decrease in exports has been
seen in mouldings and joinery exports to Japan and South Korea, with Taiwan showing the most significant decrease from 240 000 m
3 RWE in 2000 down to 20 000 m
3 RWE in 2009.
The volumes exported to Japan have decreased drastically too, from a high of over 400 000

© EU FLEGT Facility, Jakarta: Scoping baseline information for Forest Law Enforcement, Governance and Trade, January 2012. 51
This Action is funded by the European Union and the governments of Finland, France, Germany, the Netherlands and the UK. The views expressed herein can in no way be taken to reflect the official opinion of the European Union. www.euflegt.efi.int
m3 RWE yearly from 2000 to 2005 to 90 000 m
3 RWE in 2009. South Korea showed similar
reductions from a high of 360 000 m3 RWE in 2002 down to 100 000 m
3 RWE in 2009.
Most of the decline was attributable to a decline in exports to mainland China, Japan and Tai-wan, possibly due to a rise in the number of moulding and joinery plants, coupled with de-creased demand during the economic crisis. Judging by mismatches in partner statistics, it seems that mainland China has been recorded as the destination for most of the mouldings which are exported from Indonesia to Taiwan. Indonesia’s exports of mouldings and joinery to Australia have been increasing since 2000 and have been consistent at around 230 000 m
3 RWE yearly in the latter half of the last dec-
ade, and a smaller variable export to USA between 180 000 to 60 000 m3 RWE yearly from
2007 and 2009. The most important market for mouldings and joinery for Indonesia is the EU with around 490 000 m
3 RWE in 2009 or around 30% of the mouldings and joinery exports of
Indonesia, and even higher in the preceding years of the last decade. The key markets in the EU for Indonesia were Netherlands (over 200 000 m
3 RWE per year at least or about a third of
the total imports), followed by Germany and UK (well over 100 000 m3 RWE each except dur-
ing 2008 and 2009), and the smaller markets of Belgium, France and Italy. Although the RWE volume of mouldings and joinery imported into the EU from tropical coun-tries and mainland China rose almost threefold between 2002 and 2007 to nearly four million m
3 RWE, supplies from Indonesia increased only by a little and those from Malaysia scarcely
changed. Imports from mainland China and, to a rather lesser extent, Brazil accounted for most of the change (Figure 13). The total has declined steeply since 2007. Having supplied 50% of the total during the first years of the last decade, the proportion supplied from Indone-sia declined to about 15% by 2009. Malaysia, Brazil and mainland China accounted for ap-proximately 10%, 20% and 40% respectively. The EU imports only a small quantity of mould-ings and joinery (predominantly mouldings) from tropical Africa. Figure 13: The EU’s imports of mouldings and joinery from East Asia, tropical Africa and
tropical South America from 2000-2009 in million m3 RWE
0.0
0.5
1.0
1.5
2.0
2.5
3.0
3.5
4.0
4.5
2000
2001
2002
2003
2004
2005
2006
2007
2008
2009
2000
2001
2002
2003
2004
2005
2006
2007
2008
2009
Est
ima
ted
RW
E v
olu
me
(mill
ion c
ubic
metr
es)
0.0
0.5
1.0
1.5
2.0
2.5
Imp
ort
va
lue
(US
$ b
illio
n, cif,
nom
inal)
Indonesia Malaysia Tropical AfricaTropical S America Other Tropical China
Indonesia MalaysiaTropical Africa Tropical S America Other TropicalChina
Import valueEstimated RWE volume
Source: Eurostat
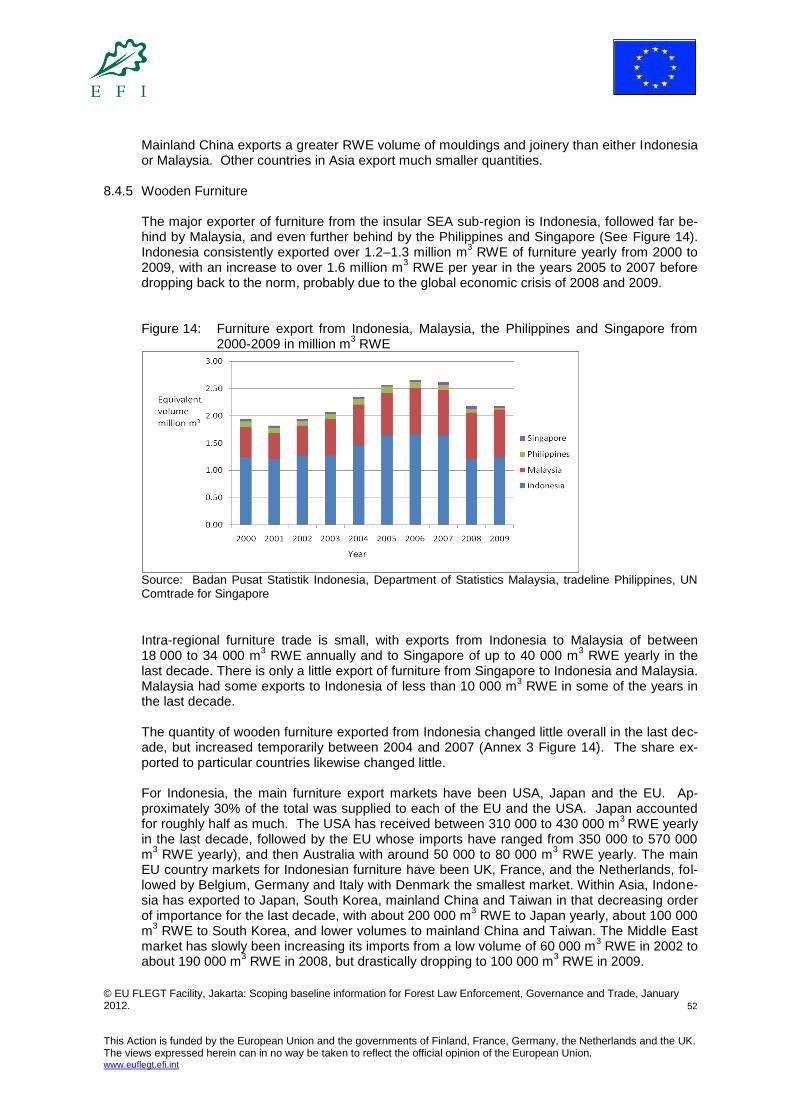
© EU FLEGT Facility, Jakarta: Scoping baseline information for Forest Law Enforcement, Governance and Trade, January 2012. 52
This Action is funded by the European Union and the governments of Finland, France, Germany, the Netherlands and the UK. The views expressed herein can in no way be taken to reflect the official opinion of the European Union. www.euflegt.efi.int
Mainland China exports a greater RWE volume of mouldings and joinery than either Indonesia or Malaysia. Other countries in Asia export much smaller quantities.
8.4.5 Wooden Furniture The major exporter of furniture from the insular SEA sub-region is Indonesia, followed far be-hind by Malaysia, and even further behind by the Philippines and Singapore (See Figure 14). Indonesia consistently exported over 1.2–1.3 million m
3 RWE of furniture yearly from 2000 to
2009, with an increase to over 1.6 million m3 RWE per year in the years 2005 to 2007 before
dropping back to the norm, probably due to the global economic crisis of 2008 and 2009. Figure 14: Furniture export from Indonesia, Malaysia, the Philippines and Singapore from
2000-2009 in million m3 RWE
Source: Badan Pusat Statistik Indonesia, Department of Statistics Malaysia, tradeline Philippines, UN Comtrade for Singapore
Intra-regional furniture trade is small, with exports from Indonesia to Malaysia of between 18 000 to 34 000 m
3 RWE annually and to Singapore of up to 40 000 m
3 RWE yearly in the
last decade. There is only a little export of furniture from Singapore to Indonesia and Malaysia. Malaysia had some exports to Indonesia of less than 10 000 m
3 RWE in some of the years in
the last decade. The quantity of wooden furniture exported from Indonesia changed little overall in the last dec-ade, but increased temporarily between 2004 and 2007 (Annex 3 Figure 14). The share ex-ported to particular countries likewise changed little. For Indonesia, the main furniture export markets have been USA, Japan and the EU. Ap-proximately 30% of the total was supplied to each of the EU and the USA. Japan accounted for roughly half as much. The USA has received between 310 000 to 430 000 m
3 RWE yearly
in the last decade, followed by the EU whose imports have ranged from 350 000 to 570 000 m
3 RWE yearly), and then Australia with around 50 000 to 80 000 m
3 RWE yearly. The main
EU country markets for Indonesian furniture have been UK, France, and the Netherlands, fol-lowed by Belgium, Germany and Italy with Denmark the smallest market. Within Asia, Indone-sia has exported to Japan, South Korea, mainland China and Taiwan in that decreasing order of importance for the last decade, with about 200 000 m
3 RWE to Japan yearly, about 100 000
m3 RWE to South Korea, and lower volumes to mainland China and Taiwan. The Middle East
market has slowly been increasing its imports from a low volume of 60 000 m3 RWE in 2002 to
about 190 000 m3 RWE in 2008, but drastically dropping to 100 000 m
3 RWE in 2009.

© EU FLEGT Facility, Jakarta: Scoping baseline information for Forest Law Enforcement, Governance and Trade, January 2012. 53
This Action is funded by the European Union and the governments of Finland, France, Germany, the Netherlands and the UK. The views expressed herein can in no way be taken to reflect the official opinion of the European Union. www.euflegt.efi.int
The volume of wooden furniture imported into the EU from tropical countries (including Brazil) and mainland China increased threefold between 2002 and 2007, due predominantly to sup-plies from mainland China. The volume supplied by Indonesia changed little during the last decade and was similar to that imported from Malaysia with around half a million m
3 RWE,
though that declined to 350 000 in 2008 for Indonesia. There was a smaller decline for Malay-sia to 470 000 m
3 RWE a year after a steady increase from the year 2000 when Malaysia only
exported 240 000 m3 RWE. The share in the total attributable to Indonesia and Malaysia each
fell from 15% to 5% between 2000 and 2009. Vietnam and, to a rather lesser extent, Thailand accounted for most of the volume supplied from “other tropical” countries. Mainland China supplied almost two thirds of the total during 2009. The EU imports a negligible quantity of wooden furniture from tropical Africa. See Figure 15 for details. Figure 15: The EU’s imports of wooden furniture from East Asia, South America and tropical
Africa from 2000-2009 in million tonnes
0
1
2
3
4
5
6
7
2000
2001
2002
2003
2004
2005
2006
2007
2008
2009
2000
2001
2002
2003
2004
2005
2006
2007
2008
2009
We
igh
t
(mill
ion tonnes)
0
1
2
3
4
5
6
7
8
Imp
ort
va
lue
(US
$ b
illio
n, cif,
nom
inal)
Indonesia Malaysia Tropical AfricaSouth America Other Tropical China
Indonesia MalaysiaTropical Africa South America Other TropicalChina
Import valueWeight
Source: Eurostat Quantities used in text were converted to RWE by using a factor of 2.8
Mainland China dominates the exports of wooden furniture from Asia with 14.8 million m
3
RWE per annum, while Vietnam’s exports are now similar to Malaysia’s—about 880 000 m3
RWE in 2009. Much of the wooden furniture exported from Indonesia and Malaysia is made primarily from particleboard or fibre board. The wood residues of mills supplies a lot of the raw materials used. Revenue from the sale of such wood residues to panel manufacturers (a number of whom have links to the owners of the mills which supply the wood residues) tends to make the mill-ing of the original logs more profitable than if the wood residues were abandoned, thereby making the logging more commercially attractive. If the logs (or the mill) are associated with il-legality, then resulting wood residues would warrant being described as illegal timber. It is likely that a small proportion of the wooden furniture which is exported to the EU from In-donesia and Malaysia comprises indoor furniture made from natural forest-grown wood.
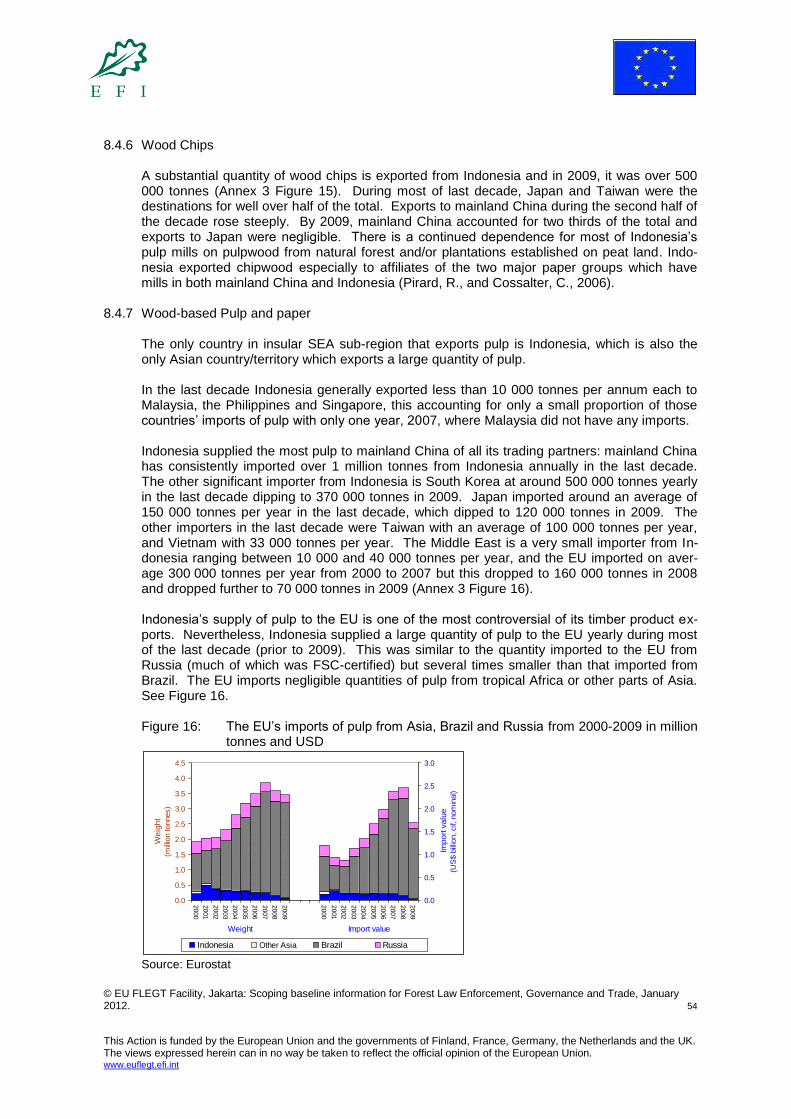
© EU FLEGT Facility, Jakarta: Scoping baseline information for Forest Law Enforcement, Governance and Trade, January 2012. 54
This Action is funded by the European Union and the governments of Finland, France, Germany, the Netherlands and the UK. The views expressed herein can in no way be taken to reflect the official opinion of the European Union. www.euflegt.efi.int
8.4.6 Wood Chips
A substantial quantity of wood chips is exported from Indonesia and in 2009, it was over 500 000 tonnes (Annex 3 Figure 15). During most of last decade, Japan and Taiwan were the destinations for well over half of the total. Exports to mainland China during the second half of the decade rose steeply. By 2009, mainland China accounted for two thirds of the total and exports to Japan were negligible. There is a continued dependence for most of Indonesia’s pulp mills on pulpwood from natural forest and/or plantations established on peat land. Indo-nesia exported chipwood especially to affiliates of the two major paper groups which have mills in both mainland China and Indonesia (Pirard, R., and Cossalter, C., 2006).
8.4.7 Wood-based Pulp and paper The only country in insular SEA sub-region that exports pulp is Indonesia, which is also the only Asian country/territory which exports a large quantity of pulp. In the last decade Indonesia generally exported less than 10 000 tonnes per annum each to Malaysia, the Philippines and Singapore, this accounting for only a small proportion of those countries’ imports of pulp with only one year, 2007, where Malaysia did not have any imports. Indonesia supplied the most pulp to mainland China of all its trading partners: mainland China has consistently imported over 1 million tonnes from Indonesia annually in the last decade. The other significant importer from Indonesia is South Korea at around 500 000 tonnes yearly in the last decade dipping to 370 000 tonnes in 2009. Japan imported around an average of 150 000 tonnes per year in the last decade, which dipped to 120 000 tonnes in 2009. The other importers in the last decade were Taiwan with an average of 100 000 tonnes per year, and Vietnam with 33 000 tonnes per year. The Middle East is a very small importer from In-donesia ranging between 10 000 and 40 000 tonnes per year, and the EU imported on aver-age 300 000 tonnes per year from 2000 to 2007 but this dropped to 160 000 tonnes in 2008 and dropped further to 70 000 tonnes in 2009 (Annex 3 Figure 16). Indonesia’s supply of pulp to the EU is one of the most controversial of its timber product ex-ports. Nevertheless, Indonesia supplied a large quantity of pulp to the EU yearly during most of the last decade (prior to 2009). This was similar to the quantity imported to the EU from Russia (much of which was FSC-certified) but several times smaller than that imported from Brazil. The EU imports negligible quantities of pulp from tropical Africa or other parts of Asia. See Figure 16.
Figure 16: The EU’s imports of pulp from Asia, Brazil and Russia from 2000-2009 in million
tonnes and USD
0.0
0.5
1.0
1.5
2.0
2.5
3.0
3.5
4.0
4.5
2000
2001
2002
2003
2004
2005
2006
2007
2008
2009
2000
2001
2002
2003
2004
2005
2006
2007
2008
2009
We
igh
t
(mill
ion tonnes)
0.0
0.5
1.0
1.5
2.0
2.5
3.0
Imp
ort
va
lue
(US
$ b
illio
n, cif,
nom
inal)
Indonesia Other Asia Brazil Russia
Indonesia Other Asia Brazil Russia
Import valueWeight
Source: Eurostat
© EU FLEGT Facility, Jakarta: Scoping baseline information for Forest Law Enforcement, Governance and Trade, January 2012. 55
This Action is funded by the European Union and the governments of Finland, France, Germany, the Netherlands and the UK. The views expressed herein can in no way be taken to reflect the official opinion of the European Union. www.euflegt.efi.int
The EU’s share of Indonesia’s exports of paper sector products fell by almost half in tonnage terms. However, the decline was due entirely to pulp implying that the customer base for pa-per was less sensitive than that for pulp to media coverage of reports questioning the legality and sustainability of aspects of the supply of pulp from Indonesia. The quantity of paper exported from Indonesia to the global market increased during the last decade—particularly after increases in the capacity of mills in Indonesia. Much of the expan-sion of pulp and paper mills in Indonesia has been facilitated by the supply of plant from EU-based businesses which won the contract to supply the plants and equipment. During 2006, exports of paper increased in a single step—by 30% (Annex 3 Figure 17).
9. CROSS BORDER TRADE AND CUSTOMS
All international trade of countries that are members of the WCO has to go through Customs. All shipments through Customs have to submit information in the official Customs declaration forms, for export and import, according to the requirements of Customs. The goods have to be classified according to the HS (Harmonized System—the internationally standardized sys-tem of names and numbers for categorizing traded products) of the WCO. HS codes comprise a series of six-digit numerical codes. The first two digits represent the chapter of the commod-ity: Chapter 44, for example, is for "wood and articles of wood; wood charcoal". Official statis-tics are then compiled from the Customs declaration forms. These trade statistics, coupled with resource statistics and other information, can inform and provide data and information on the implementation of government policies and regulations. There is a key role to play for Customs in monitoring and controlling international timber trade. Customs agents have the ability to monitor and control the trade through provisions in Cus-toms legislation, and also the extensive enforcement capabilities to enforce Customs regula-tions and to support provisions in other legislation, as appropriate, when it comes to illegality in trade. This section will summarise the Customs protocols, documentation, and other relevant information on how Customs can help in combating illegal timber trade, and ultimately to help stop illegal logging. This will be illustrated using the Indonesia and Malaysia cross-border tim-ber trade.
9.1 Customs and trade statistics
Large discrepancies between the statistics of what Indonesia declares as exports and what partner countries declare as imports have been both known about for several years and as-sessed in numerous studies (Eastin, I., and Perez-Garcia, J., 2004; Goetzl, A., 2005; and Chen, H.K., 2008). The previous sections highlighted some of the discrepancies found for various products in trade. Tables 13 and 14 selectively illustrated the discrepancy in Customs statistics compiled by the statistics departments of the country/territory of export and import and are not meant to single out any particular country/territory. The discrepancies can be found for any two trading partner countries for most any year of trade. It should be noted that, in Table 13, the discrepancies become smaller and smaller over the years, in particular after Indonesia instituted a log export ban in the middle of 2001. The large volume in 2001 was the result of traders shipping to beat the dateline for the policy implementation, and for a little while after, the confusion in implementation by Customs of Indonesia. This table shows that it is possible for importing countries to receive, more or less, a similar volume to that of timber exported. Table 14 shows how large the discrepancies can be, in this case for sawn timber exports from Indonesia. This case illustrates that, even though Indonesia has an export ban on rough sawn timber, as indicated by the small amount of sawn timber recorded as exported by Indonesian Customs, many countries continued to receive substantial volumes of sawn timber from Indonesia. Since Indonesia has an export ban, this effectively means that import-ing countries are laundering illegal sawn timber from Indonesia. However, such known dis-
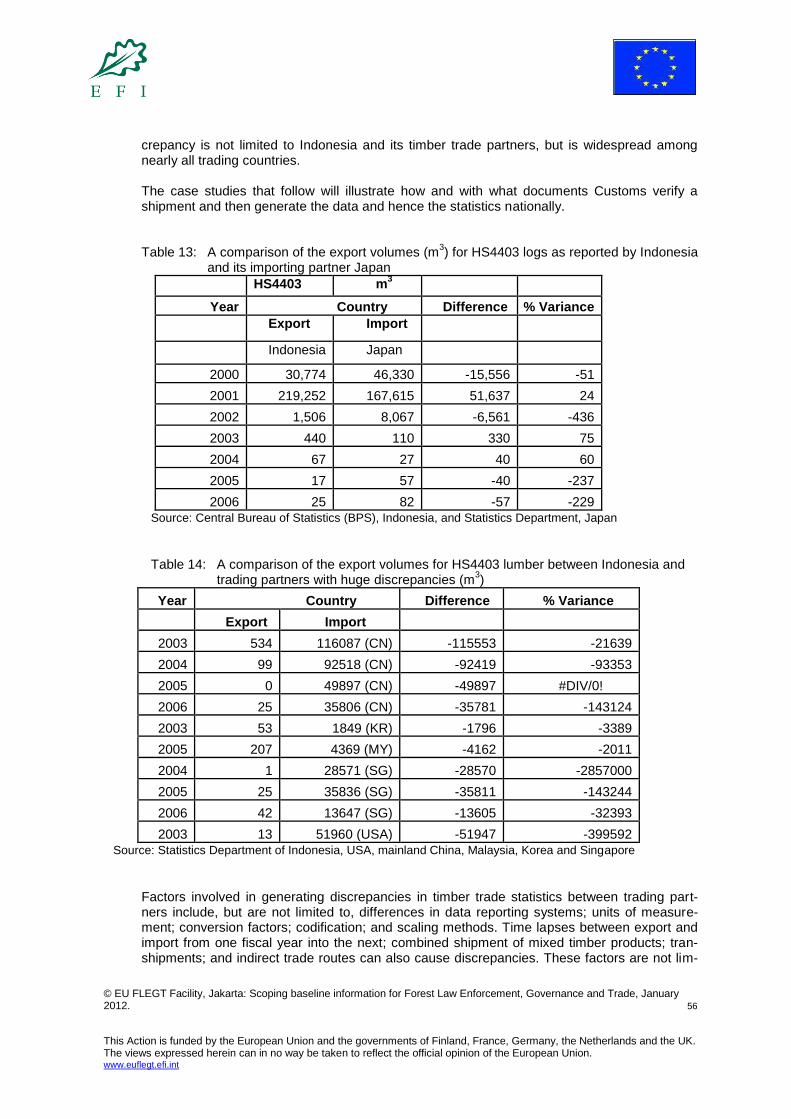
© EU FLEGT Facility, Jakarta: Scoping baseline information for Forest Law Enforcement, Governance and Trade, January 2012. 56
This Action is funded by the European Union and the governments of Finland, France, Germany, the Netherlands and the UK. The views expressed herein can in no way be taken to reflect the official opinion of the European Union. www.euflegt.efi.int
crepancy is not limited to Indonesia and its timber trade partners, but is widespread among nearly all trading countries. The case studies that follow will illustrate how and with what documents Customs verify a shipment and then generate the data and hence the statistics nationally. Table 13: A comparison of the export volumes (m
3) for HS4403 logs as reported by Indonesia
and its importing partner Japan
HS4403 m3
Year Country Difference % Variance
Export Import
Indonesia Japan
2000 30,774 46,330 -15,556 -51
2001 219,252 167,615 51,637 24
2002 1,506 8,067 -6,561 -436
2003 440 110 330 75
2004 67 27 40 60
2005 17 57 -40 -237
2006 25 82 -57 -229 Source: Central Bureau of Statistics (BPS), Indonesia, and Statistics Department, Japan
Table 14: A comparison of the export volumes for HS4403 lumber between Indonesia and
trading partners with huge discrepancies (m3)
Year Country Difference % Variance
Export Import
2003 534 116087 (CN) -115553 -21639
2004 99 92518 (CN) -92419 -93353
2005 0 49897 (CN) -49897 #DIV/0!
2006 25 35806 (CN) -35781 -143124
2003 53 1849 (KR) -1796 -3389
2005 207 4369 (MY) -4162 -2011
2004 1 28571 (SG) -28570 -2857000
2005 25 35836 (SG) -35811 -143244
2006 42 13647 (SG) -13605 -32393
2003 13 51960 (USA) -51947 -399592 Source: Statistics Department of Indonesia, USA, mainland China, Malaysia, Korea and Singapore
Factors involved in generating discrepancies in timber trade statistics between trading part-ners include, but are not limited to, differences in data reporting systems; units of measure-ment; conversion factors; codification; and scaling methods. Time lapses between export and import from one fiscal year into the next; combined shipment of mixed timber products; tran-shipments; and indirect trade routes can also cause discrepancies. These factors are not lim-
© EU FLEGT Facility, Jakarta: Scoping baseline information for Forest Law Enforcement, Governance and Trade, January 2012. 57
This Action is funded by the European Union and the governments of Finland, France, Germany, the Netherlands and the UK. The views expressed herein can in no way be taken to reflect the official opinion of the European Union. www.euflegt.efi.int
ited to timber commodities. Furthermore, many countries may have quite substantial discrep-ancies between sets of statistics published by different government sources and, in turn, be-tween such sources and those used by the Food and Agriculture Organization of the United Nations (FAO) and the International Tropical Timber Organization (ITTO). Of particular interest are factors linked to illegal timber trade that contribute to discrepancies in international timber trade statistics, for example under-invoicing, mis-specification of products, fraudulent trade data and smuggling—by proxy, significant discrepancies between export and import data for the timber trade are a strong indicator of the occurrence of illegal timber trade and, by exten-sion, illegal logging. Illegal logging and illegal timber trade can be further controlled by Customs through changes in information requirements and document verification, control which should then be reflected in the narrowing of bilateral timber trade statistics discrepancies. Customs authorities have the required legislation to impose additional requirements for legality and controls, such as the requirement for forestry departments to verify and certify the legality of a shipment. However, this has to be activated through requests from other government agencies that would like to use Customs controls for additional verification, monitoring and control. The Indonesian Directorate General of Customs and Excise (http://www.beacukai.go.id/) will presumably be obliged to accept as legal all products which are being exported provided that these are accompanied by a valid document asserting compliance with the SVLK. However, checking procedures will need to differ markedly from those which were adopted for the sort of documentation which was presented under the former Badan Revitalisasi Industri Kehutanan (BRIK) (Indonesian Forest Industry Revitalisation Body) system. Indonesia’s trade statistics for a number of timber commodities (primarily logs, sawn timber, veneer and plywood) are published in units of weight whereas their trading partners’ statistics may be published only in units of volume. Unless and until the WCO requires that member countries publish both weight and volume for such products, comparisons between the re-cords of Indonesia and its partner traders are unlikely to be robust. Estimating volume from weight is fraught with potential error, and is dependent on species, water content, the age and growing conditions of the tree, etc. However, if it is just a comparison of weight and volume between the trading partners, the discrepancies would not be as wide as they are, with other factors in play. The current systems in use for handling international timber trade and the basis for trade sta-tistics compilation in each country or territory are similar, in that completion of Customs decla-ration forms (for both exports and imports) is mandatory. In many countries, access to the forms is mainly online and submission to Customs authorities principally electronic. In general, various documents endorsed by relevant government agencies, together with shipping and business documents, are obliged to be submitted to Customs together with the declaration form. Much of this documentation accompanies an exported shipment to its destination, but the official Customs export declaration form does not, yet it is the key official document re-cording export details with actionable information for enforcement authorities and, as such, should be the basis for comparison by importing countries. In addition, remedial measures, for example facilitating real-time information exchange be-tween relevant Customs authorities, do not seem to take place for all commodities, as far as can be ascertained from talking to Customs officials. There appears to be very little cross-referencing between countries and limited exchange, if any, between agencies in-country/territory regarding statistics declared on export and corre-sponding import forms. Cross-referencing of export information for a shipment with that sup-plied on import is sometimes possible if specific concerns arise, but such verification does not

© EU FLEGT Facility, Jakarta: Scoping baseline information for Forest Law Enforcement, Governance and Trade, January 2012. 58
This Action is funded by the European Union and the governments of Finland, France, Germany, the Netherlands and the UK. The views expressed herein can in no way be taken to reflect the official opinion of the European Union. www.euflegt.efi.int
happen routinely. In other words, according to the status quo, Customs export information is not verified on import, except in so far as certain accompanying documentation allows. There is no standard designated documentation to use to double-check information in the Customs declaration forms in either exporting or importing countries. Customs export declarations could contain fraudulent, inaccurate or misleading information which, if not detected at export, are by no means guaranteed to be picked up on import, unless protocols for cross-referencing exist. Customs are not expected to question official clearance from exporting countries but only use this as the basis for checking and to provide feedback to the Customs of exporting countries if the shipment differs from what was im-ported. Shipping protocols and documents thus provide an avenue for falsification of charac-teristics of an export, likewise business documents, although business importers are likely to go to some lengths to check the accuracy of shipment details. However, such checks during imports may show that the products may not be the same as what was officially approved for shipment during export. Customs regulations in Malaysia, Singapore and Indonesia have specific clauses that give au-thority to demand all invoices, bill of lading, certificates of origin or analysis and any other document which Customs may need to test the accuracy of any declaration made by the im-porter or exporter. This presumably is similar for other Customs authorities in other coun-tries/territories although the EU customs regulation does not have such clause. Then it is the decision of Customs whether they will request the Customs export declaration form, to verify the details of the shipment. There is no requirement for any amendment to legislation for this to take place, at least not in the case of those countries whose trade situation has so far been analysed by TRAFFIC. The FLEGT VPA and the EU Timber Regulation (EU TR), which require timber trade to the EU to be transparent and legal, can be further strengthened if Customs declaration forms are also monitored in conjunction with the timber legality licensing system of the VPA and the licensed Timber Regulation’s monitoring organisations. According to the Timber Regulation articles, the operators which first place the timber products in the EU market, have to capture the fol-lowing information: description, including trade name and types of product and, where appli-cable, its full scientific name, country/territory of harvest, quantity, name and address of sup-plier, name and address of trader, documents and other information indicating compliance with applicable legislation. All this information resides with the operators and also independent monitoring organisations. It is not clear in the EU TR if Customs will be one of the competent authorities to assist in monitoring the trade in timber. But much of the information required under the Timber Regulation can be checked by the Customs authorities through their Cus-toms import declaration form. The EC has been stressing that the Timber Regulation is not a border measure and hence there is no defined role for Customs, at least not when it comes to controlling the external border of the EU—however the designation of “competent authorities” is up to individual member States and some Member States might designate Customs, whereas others might designate administrative authorities under the Ministry of Agriculture, etc. There is an important role for Customs in supporting the implementation of the Timber Regulation by contributing important information and, also, under the VPA Customs will have to control imports of VPA-licensed timbers. The VPA and monitoring organisations for the Timber Regulation would generate a lot of data captured from all shipments. The systems that govern and monitor the VPA and Timber Regulation implementation should be regularly monitored and evaluated. Experience with other paper-based permit systems, like Convention on International Trade in Endangered Species of Wild Fauna and Flora (CITES), suggest that it is possible to monitor the trade through comparative analysis of the data captured during export and import, if there are similar datasets (Chen, H.K., 2006). However, this can be most effective if the analysis is carried out
© EU FLEGT Facility, Jakarta: Scoping baseline information for Forest Law Enforcement, Governance and Trade, January 2012. 59
This Action is funded by the European Union and the governments of Finland, France, Germany, the Netherlands and the UK. The views expressed herein can in no way be taken to reflect the official opinion of the European Union. www.euflegt.efi.int
using near real-time data as far as possible. The Customs export declaration form, has the potential to mirror the relevant data in the VPA, and possibly to be used to verify data from the operators under the Timber Regulation. The statistics could be analysed quickly, as the data would be captured by Customs as a matter of course and in real time as well. If the Customs data were to differ from the VPA and Timber Regulation data of the operator, then it would be a cause for further inspection and investigation.
9.2 Indonesian supply chain and export procedure West Kalimantan in Brief
Administratively, West Kalimantan province is divided into eight districts and two cities, these are: Kapuas Hulu, Sintang, Sanggau, Sambas, Landak, Bengkayang, Ketapang and Pontianak and the cities of Singkawang and Pontianak. West Kalimantan borders with East Malaysia (Sarawak) on the north, East Kalimantan on the east, Central Kalimantan Province and the Java Sea on the south; and Natuna Sea and Karimata Sea on the west. It covers 146 807 km
2 of land, equal to 1.13 times the size of Java. According to 2000 statistical data, the
total population of West Kalimantan was 3,954,300 inhabitants (indigenous and new settlers) with an overall population density of 27 people/square km, most of the population inhabiting the main cities such as Pontianak, Sanggau and Sintang. The border area with Sarawak, Ma-laysia, covers 2 035 164 hectares and passes through 5 districts or kabupaten. This vast area has always been very sparsely populated. In 2005, the total population of Kalimantan’s border zone was estimated at about 260,000 people (Obidzinski, K., et al., 2007). Since most of the population lives in villages and small towns near the main communication arteries (rivers), a large portion of the border lands in Kalimantan is effectively uninhabited. The indigenous communities in the area (Dayak, Melayu) have until fairly recently ignored the border alto-gether, moving freely along hundreds of footpaths and waterways connecting the villages on both sides, mainly for trade purposes (Obidzinski, K., et al., 2007). Kapuas River dissects West Kalimantan and stretches from Hulu Kapuas, passing Sintang and Sanggau, and ends in Pontianak district, with a length of 1.086 km. It is the longest river in Indonesia. There is a main government-owned asphalt road to Sarawak via Entikong Post towards Te-bedu (15 km from the border). There are also many small roads strategic for log transporta-tion, i.e. from Badau Post (Kapuas Hulu district) towards Lubuk Antu (Sarawak, 9 km from the border). Beside these roads, other roads with potential for illegal forest product transportation are those found in Sambas (Aruk/Sajingan to Biawak), Sintang (Senaning), and Bengkayang (Jagoi Babang to Serikin) districts. In total, there are approximately 50 small roads that con-nect 55 villages in Indonesia and 32 villages in Sarawak, (Malaysia)(Obidzinski, K., et al., 2007). Other prominent characteristics of West Kalimantan in the context of forestry products include the proximity of sea and the main log landing Sarawak port, Sematan, a point of pool-ing and distribution of wood products from Indonesia. Additionally, Pontianak is also at an ac-cessible distance from other cities in both Sumatra (Riau) and Java (Semarang, Cirebon, and Tegal), and also Singapore. Until 1993, the cross-border trade in Borneo was officially classified as barter trade, whereby traders crossed the border back and forth bringing Indonesian raw materials to Malaysia and “smuggling manufactured articles back home” (Lee 1976:5 in Obdizinski, K. et al. 2007)). In 1993, the cross-border trade between the Indonesian province of East Kalimantan and the Malaysian State of Sabah was placed under the regulatory framework of Tawau Barter Trade Association (BATS). Similarly, in the late 1990s, the cross-border trade between West Kali-mantan and Sarawak was subsumed by the Free Trade Zone (FTZ) chapter in Sarawak (Anon., 2004).
© EU FLEGT Facility, Jakarta: Scoping baseline information for Forest Law Enforcement, Governance and Trade, January 2012. 60
This Action is funded by the European Union and the governments of Finland, France, Germany, the Netherlands and the UK. The views expressed herein can in no way be taken to reflect the official opinion of the European Union. www.euflegt.efi.int
Altogether, there are five legal crossings for timber into Sarawak from Kalimantan through Customs check points on the Malaysian border: Semantan a sea port, Biawak, Serikin, Te-bedu and Lubuk Antu. Two of the main timber crossing points between Kalimantan and Sa-rawak are:
a. Entikong Legal Border Post (Indonesia–Malaysia)
This post is situated in Sanggau district and directly borders with Tebedu, Malaysia,
with good asphalt road on both sides of the border. Truck numbers and capacity in transporting square or sawn timbers are high due to the good road condition, com-pared to other posts along the border. The average load per truck is 10.5 m
3 RWE (or
around 10.5 tonnes). In one year in early 2000s, it was recorded that 64 trucks used this road for 22 days/month and had transported approximately 177 408 m
3 RWE of
processed wood per year, or the equivalent of 354 816 m3 of logs per year (Setyarso,
A., 2003). It should be noted that these figures give a historical perspective and, from observations, volumes are nowhere near what they were in the early part of the last decade—see the trade figures in section 5.
b. Border Post of Badau (Indonesia–Malaysia)
Badau post is a point at the border, on land route that connects the Kapuas Hulu dis-
trict (Indonesia) with Lubuk Antu (Malaysia). The road is a dirt road, and hence the number of trucks passing this point is much smaller than the number using the Entik-ong route. The trucks also use palm oil estate roads around this area to cross the border. Saw mills are found on both sides of the border, as Sarawak has a log import ban from Indonesia.
All wood products passing through are carried by the Northern Trans Route (JLU or Jalur Lin-tas Utara) and the area surrounding the Kapuas Hulu district. These products ware formerly processed at the saw mills owned by Malaysian citizens, constructed in 1998/1999 in the vicin-ity of the border. It is estimated that illegal timber trade between West Kalimantan and Sara-wak through all the crossings, by land and sea, reached approximately 1.2 million m
3 RWE in
2005 (Obdizinski, K. et al. 2007). Timber administration procedures: One of the most serious challenges for forest governance in Indonesia’s Kalimantan region is the illegal logging by licensed forestry operations that engage in gross over-harvesting and violation of shipping regulations (Obdizinski, K., et al. 2007). Indonesia has well defined laws, regulations and procedures to manage its forest sector. Timber administration procedures are instruments to record and report production plans, felling, measuring, collection, transport, processing and distribution of forest products. The aim is to regulate sustainable forestry and earn adequate revenue collection. The Indonesian procedures are also part of the SVLK and have the following components: 1. Production planning
a. Forest inventory, cruising reports b. Annual cutting plan, which has to be in line with the government AAC for that
area. 2. Harvesting. Documented in Laporan Hasil Cruising—Indonesia cruising result report
(LHC) and Laporan Hasil Penebangan (LHP) or the Indonesia timber felling report 3. Marking, Scaling and Grading. Recorded in the wood-processing and storage report
(LKPO).

© EU FLEGT Facility, Jakarta: Scoping baseline information for Forest Law Enforcement, Governance and Trade, January 2012. 61
This Action is funded by the European Union and the governments of Finland, France, Germany, the Netherlands and the UK. The views expressed herein can in no way be taken to reflect the official opinion of the European Union. www.euflegt.efi.int
4. Loading and transporting 5. Processing 6. Reporting
Process from forest to export: 1. Concession Permits awarded by the national government
IUPHHK = Production permit (Izin Usaha Pengelolaan Hasil Hutan Kayu—Indonesian logging licence)
IPHHK = Collection permit, Industri Primer Hasil Hutan Kayu—Indonesian primary processing of timber licence IPK = Use permit (Izin Pemanfaatan Kayu—Indonesian permit to utilise timber) The Concession Permit can be issued by a governor or bupati (based on Peraturan pemerin-tah (PP) or government regulation 6/1999 and SK 538/1998), and should be declared void af-ter UU 41/1999, but this is often not the case.
IPK-KBNK = Timber use in non-forest area (Izin Pemanfaatan Kayu—Kawasan Budidaya
Non Kehutanan—Indonesian permit to use timber in areas designated for non-forestry use)
IPK-KBK = Timber use in forest land (Kawasan Budidaya Kehutanan—Indonesian permit to
use timber in areas designated for forestry use)
Personal use permits (< 20m3/yr)
2. Forest Inventory, LHC
A 100% survey by the concessionaire and a 10% field check by Dinas Kehutanan or District Forest Department. There can be a three-year time lag between forest inventory and approval. It is also impractical for the concessionaire to carry out 100% inventory of their concessionaire. There is a high probability that the inventory figures may not reflect the actual volumes avail-able for harvesting. This can therefore lead to a large difference between LHC-reported vol-ume and LHP, the actual log production report. The changes are mainly because of illegal logging in the concessionaire area and thus leave a lower standing stock. 3. Annual cutting plan or Rencana Kerja Tahunan (RKT)
The logs will be checked by an official called Pejabat Pengesah Laporan Hasil Penebangan (P2LHP) or the Indonesia authorised official to validate log report, who signs the Laporan Hasil Penebangan (LHP)—Indonesia timber felling report. The Surat Keterangan Sahnya Hasil Hu-tan (SKSHH) or Indonesian legal forest products permit are based on this LHP, issued by the Pejabat Penerbit Surat Keterangan Sahnya Hasil Hutan (P2SKSHH)—Indonesia authorised official to issue transport permit.
4. Transport licence, SKSHH This permit is needed from forest to log pond, from log pond to mill, from mill to export har-bour, SKSHHs are issued by an official at the level of P2SKSHH. This person can be Dinas Kehutanan (Provincial forest service) staff or other similar level staff. There are millions of SKSHHs issued each year (Surabaya alone issues 120,000 per year).

© EU FLEGT Facility, Jakarta: Scoping baseline information for Forest Law Enforcement, Governance and Trade, January 2012. 62
This Action is funded by the European Union and the governments of Finland, France, Germany, the Netherlands and the UK. The views expressed herein can in no way be taken to reflect the official opinion of the European Union. www.euflegt.efi.int
Timber traffic across the border is usually the result of collusion of both the Malaysian buyers and people of West Kalimantan, from villagers, to loggers, to district/provincial officials and se-curity officers (Obdizinski, K., et al. 2007). Timber is processed like any other good coming into Malaysia, as outlined in the section previously. Since the round log import ban from Indo-nesia imposed by Malaysia, the movement of round logs across the border has dried up. However, rough sawn timber is still moving across the border although in much smaller quanti-ties. This is possible due to the systemic failure of Indonesia’s forestry supervisory organisa-tions and subversion of the system of controls put in place as outlined above for the timber supply chain (Obdizinski, K., et al. 2007).
10. FUTURE OUTLOOK
The three main objectives identified for managing the forest resources in Indonesia are first, to support economic development; second, to improve rural livelihoods and reduce poverty; and third, to produce environmental services and benefits. These objectives will be achieved through, among other things, forest rehabilitation and forest plantation establishment and de-velopment; improved forest governance; strengthened law enforcement; enhanced capacity-building and institutional strengthening; and community-oriented and participative approaches in managing and developing the forest resources at the local level. Based on the assumptions of effective policy implementation and faster economic growth, which imply greater forest rehabilitation efforts, and that sufficient investment is available, the Indonesia Forestry Outlook Study, 2009 (FAO-MoF, 2009) has projected that under SFM, which is the most likely situation facing Indonesia in 2020, the state of the forest resources in Indonesia will be as follows: (i) for Production Forest, the areas of primary forest will range from 8.5–8.6 million hec-
tares, areas of secondary forest from 31.0–31.2 million hectares, areas under inten-sive silvicultural management from 0.3–0.6 million hectares, pulpwood plantations from 2.6–3.3 million hectares, community timber plantations from 1.6–3.2 million hec-tares, timber plantations from 1.5–1.7 million hectares, and non-forested areas from 10.7–13.2 million ha;
(ii) for Protection Forest, the areas for primary forest, secondary forest, and non-forested areas are 13.3 million hectares, 10.5 million hectares, and 5.6 million hectares respec-tively;
(iii) for Conservation Forest, the areas for primary forest, secondary forest, and non-forested areas are 10.1 million hectares, 5.5 million hectares, and 3.9 million hectares respectively; and
(iv) for Conversion Production Forest, the areas for primary forest, secondary forest, and non-forested areas are 5.3 million hectares, 5.3 million hectares, and 12.2 million hec-tares respectively.
It was further projected that in 2020 legal timber production would drastically increase to be-tween 63 million m
3 RWE and 117 million m
3 RWE mainly from timber being produced from
the Industrial Community Forest Plantation. To achieve this, it is pertinent that land tenure dis-putes be resolved in a timely manner; conflict resolution mechanisms be in place; that there be: improved government administrative efficiency and enhanced effectiveness of policy im-plementation; availability of sufficient investment; more consultative and transparent policy-making processes; and greater engagement by civil society groups in development activities. However, as timber supplies in Sumatra and Kalimantan are depleted, timber harvesting pres-
© EU FLEGT Facility, Jakarta: Scoping baseline information for Forest Law Enforcement, Governance and Trade, January 2012. 63
This Action is funded by the European Union and the governments of Finland, France, Germany, the Netherlands and the UK. The views expressed herein can in no way be taken to reflect the official opinion of the European Union. www.euflegt.efi.int
sure will move from west to east with Papua increasingly becoming a target for commercial exploitation. This will have an impact on civil and human rights issues if the commercial ex-ploitation is not controlled and monitored in a transparent, accountable and equitable manner by the authorities. Based on the state of forest resources projected for 2020, direct employment in the forestry sector is expected to increase to between 675,000 and 836,000 people as compared to be-tween 500,000 and 600,000 in 2006, even though there may be a substantially higher number of people who are ‘forest dependent’ and people who work in small-scale sawmills and other processing wood industries. The numbers of people that might be affected by the VPA is ex-pected to be significant in comparison to total industry direct employment. This is because the most important products that are exported to the EU are furniture with a large employment base, and plywood, although there are not a large number of plants. The rapid change of decentralization and democratization processes has generated various visions, missions, and priorities among provinces and districts which are reflected in their vari-ous institutions and forest management regulations. These institutional arrangements and for-est policies will need to be harmonized for Indonesia to achieve the projected state of forest resources in 2020. Indonesia is now working with the UN-REDD national programme efforts to develop its na-tional strategy and readiness effort. The national strategy will develop a transparent, account-able and participatory process, which will lead to both a reduction of greenhouse gas emis-sions, protection of the unique biodiversity of Indonesia, and improvement of people’s lives, especially potentially affected people and vulnerable groups. The current negotiation of REDD-plus under the United Nations Framework Convention on Climate Change (UNFCCC) could thus offer Indonesia the financial incentives for its people to stay away from illegal log-ging activities, prevent excessive timber production from its natural forests, provide the added impetus for forest plantation development which is a key to the revitalization of the Indonesian forest industries, and enhance its efforts to attain management of its forest resources sustain-ably. The provision of USD1 billion from Norway to the Government of Indonesia will help to incentivise the implementation of the national strategy.
Demand for sustainable forest products does not necessarily translate to a willingness to pay for the additional costs of sustainable production. Companies and forest concessions in Indo-nesia are less likely to respond to demand from companies that they are not trading with since there are significant costs and risks related to switching markets and the benefits are not al-ways clear. Since the VPA in essence only affects those Indonesian companies which have a commercial link to EU companies, companies may shift to less restrictive markets. The EU is an important player, but not dominant, in the global timber market. Therefore it has to develop communication and dialogue with other major timber importers (Japan, Korea and the USA) to promote the EU Timber Regulation widely. The EU already has an MOU with mainland China to combat illegal logging and trade. There is timber products trade between the EU and East Asian countries. It will be important to identify and understand those trades of products whose raw materials originate from Indonesia. This will help the verification of le-gality of Indonesia’s timber along the entire trade chain. However, the EU is an important market for Indonesian furniture. And this will be a powerful sector to support the push for verified legal products, especially to the EU. Social safeguard policy for community forest and small to medium-sized forestry enterprises need to be developed for the implementation of international agreements such as the VPA.
© EU FLEGT Facility, Jakarta: Scoping baseline information for Forest Law Enforcement, Governance and Trade, January 2012. 64
This Action is funded by the European Union and the governments of Finland, France, Germany, the Netherlands and the UK. The views expressed herein can in no way be taken to reflect the official opinion of the European Union. www.euflegt.efi.int
11. CONCLUSION AND RECOMMENDATIONS The trade data analysis shows that the log production in Indonesia has decreased over the years. As forests are depleted, production will come from sustainably managed permanent forest and from plantations, as more such areas come on-line. Therefore the source of logs for downstream industry in Indonesia has to be from a combina-tion of sources: natural permanent forests, private forest, community forests, and plantations. The last-mentioned is controversial, partly due to potential for forest land conversion to planta-tions, but plantations also provide the best hope for sustaining the local timber industry. Indo-nesia has aimed for a significant increase in plantation forests, but this will require enabling policies, investment and strong monitoring and enforcement actions by the authorities to miti-gate the issues related to the establishment of plantation forests. However, as the policies have only been recently formulated, and implementation of plantation strategies is still in an early stage, the production from local sources has yet to catch up with the installed capacity of the industry.
Indonesia has dominated exports in the mouldings and joinery, furniture, pulp and paper sec-
tors. It would appear, looking at the production trends, that Indonesia has been successful in promoting further downstream development.
Imports of timber products play a role in Indonesia, although this has been small in compari-
son to the export of timber products across all the timber categories. Even so, these imported timber products could be used in further-processed timber or directly re-exported to the EU, in which case the EU Timber Regulation would apply. For Indonesia, the VPA products with a mix of imported materials without verified supporting legal documents may face a challenge to enter the EU market.
The push for certified furniture in the EU market has meant that manufacturers in Indonesia
have had to source for sustainably managed timber products. However, the competition for such certified timber products is stiff as there are limited certified forests in the region, and there are more chain-of-custody certificates than sources of the products. The majority of the forest products will not be from certified forests. Hence in the short- to medium-term, the only option for securing market share is to aim for credible legality verification of the country’s for-ests and timber products, through effective, transparent and credible implementation of the regulatory framework. Ambiguous and conflicting regulations should be removed or revised accordingly.
A number of EU countries import from Indonesia including the UK, Germany, the Netherlands,
France, Italy, Belgium, and Denmark. However, the dominant market for timber products from Indonesia is in particular mainland China. For some timber products, Australia and the Middle East featured highly. In Indonesia some of the imports are utilised locally with some portion further processed for re-export, to the EU and USA. This has implications for the EU VPA negotiations and the EU Timber Regulation. The current negotiations for the VPA between EU are with Malaysia and Vietnam, both of which trade with Indonesia. All the countries in Asia, to a large or small extent, export timber products the EU either directly or indirectly via a processing or transit country. This means that once it comes into force in 2013, the EU Timber Regulation will have implications for the whole supply chain, from the country of origin to the processing or transit country and finally to the EU market. In general, it would appear that good forestry governance in Indonesia is still a challenge. However, great strides have been made to improve the situation, with the Indonesian legality verification system (SVLK) building on certification principles and criteria. Transparency of the
© EU FLEGT Facility, Jakarta: Scoping baseline information for Forest Law Enforcement, Governance and Trade, January 2012. 65
This Action is funded by the European Union and the governments of Finland, France, Germany, the Netherlands and the UK. The views expressed herein can in no way be taken to reflect the official opinion of the European Union. www.euflegt.efi.int
management, monitoring and enforcement of the forestry sector could be further improved, as illegally harvested logs are still suspected of entering the supply chain. Further clarification of the legal ownership, access and use rights to forests, and reducing conflicts with indigenous peoples and local communities could help to resolve some of the issues. The VPA with Indonesia is closely tied to its timber legality verification system (SVLK). The Indonesian Government has rolled out the SVLK strategy and implementation plan, including independent auditing, and is promoting the system extensively in the country while conducting discussions with the EU on the acceptance of the SVLK to meet the EU Timber Legality As-surance Scheme (TLAS) for the licensing permit. There are challenges to the implementation and design of the SVLK. Part of this is due to the many sources of logs that enter the supply chain: conversion forests, natural forests, plantation forests, community-based forests; and various permutations of these. Each will need to have clear legal ownership, management and harvesting according to the EU criteria for legality. In addition, tertiary processed timber products such as furniture are dominated by small to medium-sized enterprises (SMEs) in Indonesia. Therefore, clarifying the legality chain from the various sources up the supply chain is very important for Indonesian companies that sup-ply markets in the EU. Obviously, certification would help in this, but only 5% of the log pro-duction in Indonesia is from certified forest concessions. The bulk of the resource will need to depend on the SVLK to prove legality. It is envisaged by the Government of Indonesia that once teething problems with the implementation of the SVLK as an instrument of legality for the VPA are resolved, the demand from the market should increase supply. This would be es-pecially true for the SMEs and community-based forest development, despite the likelihood that the SVLK would increase the production cost.
Cross border timber trade can freely take place without much difficulty as long as proper pro-cedures and documentation are submitted to Customs authorities. There are variations of procedures and documentation depending on location and type of products and category of trade. In the SEA region, there is the informal trade called barter trade for many goods, in-cluding timber. The barter system requires less documentation and the controls are less strin-gent in comparison to official ports. The volumes, values and other information found on the Customs import declaration form are captured in national statistics. Similarly, the data are captured in Customs export declaration forms by the country of origin. However, there is gen-erally no adequate mechanism at present for the importing country to assist the exporting country in controlling illegal logging and illegal timber trade. Malaysia’s reciprocal log and large square and scantlings import ban from Indonesia is the only such arrangement currently in any part of the world, although the VPA will have similar arrangements once it is imple-mented. The efforts to combat illegal logging and illegal timber trade have to start from within the country of harvest. Indonesia has made tremendous efforts in streamlining its forest man-agement systems and procedures and will be seeking to have third-party independent auditors to ensure transparency and legality of its timber. International arrangements could provide the additional measures to assist harvesting countries to ensure that illegal timber smuggling and laundering is not a significant driver of illegal harvest. A very useful tool to help in the monitoring of cross-border trade and to address any potential impact of changing buyer demands and regulations, such as the EU Timber Regulation and Lacey Act, is to have real-time comparative analysis of Customs statistics. The more recent the data, the finer the scale of monitoring. The EC has been stressing that the Timber Regula-tion is not a border measure and hence there is no defined role specifically identified for Cus-toms—at least not when it comes to controlling the external border of the EU. However, the designation of “competent authorities” is up to individual member States and some Member States might designate Customs, whereas others may designate more administrative authori-ties under the Ministry of Agriculture, etc. There is an important role for Customs in supporting

© EU FLEGT Facility, Jakarta: Scoping baseline information for Forest Law Enforcement, Governance and Trade, January 2012. 66
This Action is funded by the European Union and the governments of Finland, France, Germany, the Netherlands and the UK. The views expressed herein can in no way be taken to reflect the official opinion of the European Union. www.euflegt.efi.int
the implementation of the Timber Regulation by contributing important information. Under the VPA, Customs will also have to control imports of VPA-licensed timbers. Directly cross-checking Customs export declaration and Customs import declaration forms can provide very accurate monitoring and controls, on volumes, species (where appropriate and required), val-ues, shipper and exporter and importer. Comparative analysis of Customs data by HS categories can provide a simple tool and method to look at the impacts of external factors such as regulatory changes, procurement policies, and control mechanisms. This can only give an indication of trends. However, it can show changes in consumption, demand, and shifts in markets. A wood balance model (differ-ences between all production, including imports against domestic consumption and exports) has been tried before with limited success, as data capture at the national and provincial lev-els varies by country and within country. The use of both the comparative statistical analysis and wood balance model together may provide some idea of the extent of illegal logging and illegal timber trade within a country and possible gaps and weaknesses of the governance system. Large discrepancies should be investigated immediately. Not all countries are able to provide monthly and recent statistics, so the comparative monitoring for those countries may need to be at six monthly, or even yearly intervals. The longer the time frame, the more diffi-cult it will be to determine the anomalies to the individual shipment level for detailed investiga-tions and control. However, the analysis could still provide information that could be of use, when coupled with other data sets and analysis for monitoring, controls and enforcement. The EU should consider the following recommendations to assist Indonesia to meet the VPA and EU Timber Regulation requirements:
Enhance the awareness and knowledge of the VPA and the EU Timber Regulation, and their implications, among all the stakeholders in the country. This is particularly important for those industries in the chain supplying EU markets, directly or in-direct via a third country which will need to ensure they have clear evidence of the origin of their raw mate-rial and verification of its legality. It is recommended that more awareness, training and capacity-building among the industry, civil society and government agencies be con-ducted. A particular challenge with the Timber Regulation is that the legal requirements for forestry and timber trade preclude the need to have a full traceability system. Since there is legal requirement for the government to have a traceability system in place, it will be difficult for operators in the EU to obtain legal documents that are fully traceable back to the stump. Hence, the evidence that might be needed for operators and monitoring or-ganisations under the Timber Regulation has to be from a combination of legal documen-tation and company systems, records and procedures.
Continued support to Indonesia to help resolve land tenure disputes in a timely manner; with conflict-resolution mechanisms in place. Also, government administrative efficiency and effectiveness of policy implementation needs to be enhanced; sufficient investment must be made available; and greater engagement by civil society groups in development activities is needed.
Assistance to Indonesia to harmonize the various visions, missions, and priorities among provinces and districts which are reflected in the wide variety of institutions and forest management regulations.
Continued support to Indonesia in good public and corporate governance, to create con-ducive environments for integration and collaborative empowerment of sustainable for-estry development and good governance and transparency in the forestry sector. This in-cludes awareness and capacity-building aimed at the general public, non-governmental organisations (NGOs) and the private sector on ethical consumerism, sustainable devel-
© EU FLEGT Facility, Jakarta: Scoping baseline information for Forest Law Enforcement, Governance and Trade, January 2012. 67
This Action is funded by the European Union and the governments of Finland, France, Germany, the Netherlands and the UK. The views expressed herein can in no way be taken to reflect the official opinion of the European Union. www.euflegt.efi.int
opment, climate change, Reducing Emissions from Deforestation and Forest Degradation (REDD), conservation, certification, and other issues that have an impact on the forestry sector and also in encouraging responsible purchasing domestically.
Development of communication on full chain of custody regulation of timber products with other major timber importers (mainland China, Japan Korea and the USA), where part of Indonesia’s timber products is processed in a third country/territory before entering the EU.
Support for more analysis of the re-export of Indonesian timber from mainland China to Western markets. For market demand to influence the implementation of best practice and legality of forest management in Indonesia there must be a critical mass. For this reason there is a need to continue focusing on the major Asian markets for Indonesian timber products, including mainland China, Malaysia and Japan.
Continued support to Indonesia in the development of social safeguard policies for com-munity forest and small/medium forestry enterprises prior to implementation of interna-tional agreements such as the VPA.
Assistance in developing ways of capturing national data on domestic trade. Govern-ments should develop a system for data collection, compilation and analysis to determine the scale and scope of domestic consumption. This information, coupled with production data, imports and exports, can give a good basis for evaluating and revising national poli-cies, legislation and systems.
Engagement with other countries and territories that import timber from Indonesia but which may not have comparatively stringent import requirements, including the East Asia markets, India and the Middle East. For countries such as China and Japan, which are al-ready in dialogue with the EU, the EU should identify specific areas for collaboration, such as Customs co-operation.
The study recommends the use of national export and import statistics as the most cost effective methodology for periodic monitoring of baseline trade data. A comparative analysis approach should be carried out for each shipment where possible, or on a monthly basis, using specific and corresponding HS codes.
Encourage Indonesia government to request importing country’s Customs verify the tim-ber shipment against the Customs export declaration form of Indonesia. In many coun-tries, no amendment of regulations is needed for this, only the political will to institute the additional request for documentation.
Support further training of Customs agents should be carried out to ensure they are up to date with national legislation on timber trade and forestry, including that in trading coun-tries, as well up to date with international conventions and measures of trading partners that affect trade, such as the Lacey Act, EU Timber Regulation, etc. Such training should be embedded in the national Customs training academy to ensure it is institutionalised, as officers are transferred on a regular basis and new officials have to be re-trained regu-larly.
© EU FLEGT Facility, Jakarta: Scoping baseline information for Forest Law Enforcement, Governance and Trade, January 2012. 68
This Action is funded by the European Union and the governments of Finland, France, Germany, the Netherlands and the UK. The views expressed herein can in no way be taken to reflect the official opinion of the European Union. www.euflegt.efi.int
REFERENCES
Anon., (2004). Indonesia Timber passing through Malaysia’s Free Trade Zone (FTZ). MTC press re-lease. Malaysian Timber Council, 14 May 2004.
Anon., (2005). Presidential Instruction of the Republic of Indonesia Number 4 of 2005 Concerning
the Eradication of Illegal Logging in Forest Area and the Circulation Throughout the Territory of the Republic of Indonesia http://www.eu-indonesia-flegt.org/images/reference/law/Inpres%204-2005%20Illog%20Eng.pdf.
Anon., (2008). Firm paid billions for illegal logs: Witness. The Jakarta Post. 14 June 2008.
http://www.thejakartapost.com/news/2008/06/14/firm-paid-billions-illegal-logs-witness.html
Anon., (2010). Plantations in Java island. http://www.perumperhutani.com/index.php?option=com_content&task=view&id=922&Itemid=71. Viewed October 2010.
Anon., (2010a). FSC Perhutani and Woodmark assessment. http://www.fsc-
watch.org/docs/Perhutani_and_Woodmark_SA_Assessment.pdf. Viewed September 2010. Anon., (2010b). TFT project portfolio. http://www.tft-forests.org/project-portfolio.php. Viewed August
2010. Anon., (2010c).Support from Tropical Forest Foundation for certification in Indonesia. http://www.tff-
indonesia.org/index.php/en/map-of-tff-activity/list-of-fsc-certified-forest-in-indonesia. Viewed August 2010.
Anon., (2010d). List of verification of legality. http://www.rainforest-
alliance.org/forestry.cfm?id=verification_clients. Viewed September 2010. Anon., (2010e). Indonesia’s GFTN members.
http://www.wwf.or.id/en/news_facts/publication/?18583/GFTN-Indonesia-Kaleidoskop-2009. Viewed October 2010.
Anon., (2010f). FSC Trademark use by Certificate holders. FSC Canada.
http://www.fsccanada.org/labelandlogostandards.htm. Viewed October 2010. Anon., (2010g). List of members of LEI. http://www.lei.or.id/anggota-lei#2. Viewed January 2010. Anon., (2010h). Jawa Pos Daily News (2010) Illegal Logging Cases. 22 June 2010. Anon., (2010i). EU-Indonesia FLEGT VPA Experts Meeting—Technical Annex of the 2nd meeting
(2010) http://www.dephut.go.id/files/Technical_Report_Expert_Meeting_150110.pdf
Anon., (2010j). Annual Report 2009, PT Barito Pacific TDK. Indonesia. Anon., (2011). Norway-Indonesia REDD+ Partnership – Frequently asked questions.
http://www.norway.or.id/Norway_in_Indonesia/Environment/-FAQ-Norway-Indonesia-REDD-Partnership-/
APKI (2007) Indonesian Pulp & Paper Industry. Directory 2005. Indonesian Pulp & Paper Associa-
tion. Jakarta, Indonesia.
© EU FLEGT Facility, Jakarta: Scoping baseline information for Forest Law Enforcement, Governance and Trade, January 2012. 69
This Action is funded by the European Union and the governments of Finland, France, Germany, the Netherlands and the UK. The views expressed herein can in no way be taken to reflect the official opinion of the European Union. www.euflegt.efi.int
ASMINDO (2007) Road Map for the Development of Indonesia’s Furniture and Handicrafts Indus-tries. Indonesian Furniture and Handicrafts Industries Association (ASMINDO). Jakarta, 18 April 2007.
Banjar, Y. L. (2004). Illegal Logging and Associated Trade. Presentation at the Second Regional
Workshop on Strengthening the Asia Forest Partnership. Yogyakarta, Indonesia, 30 August – 1 September 2004.
Barr, C. (2001). Banking on Sustainability: Structural Adjustment and Forestry Reform in Post-
Suharto Indonesia. CIFOR and WWF, Indonesia. Barr, C. (2004). Risk Analysis and Impact Assessment for Pulp and Plantation Investments: The
Case of Indonesia. CIFOR, Bogor, Indonesia. http://www.forest-trends.org/~foresttr/documents/files/doc_1167.pdf
Barr, C. (2008). Indonesia’s pulp and paper industry: Overview of risks and opportunities. Presenta-
tion at the Roundtable on Indonesia’s Pulp and Paper Industry, New York, NY. 10 April 2008. CIFOR, Bogor, Indonesia.
Barr, C. (2010). Powerpoint on Indonesia’s pulp and paper industry: Trends, risks, opportunities.
Woods & Wayside International. Barr, C., Resosudarmo, I.A.P., Dermawan, A., and McCarthy, J., with Moeliono, M., and Setiono, B.
(2006). Decentralization of Forest Administration in Indonesia—Implications for Forest Sus-tainability, Economic Development and Community Livelihoods. CIFOR, Bogot, Indonesia. http://www.cifor.cgiar.org/publications/pdf_files/Books/BBarr0601.pdf. Viewed October 2010.
Barr, C., Dermawan, A., Purnomo, H., and Komarudin, H. (2010). Financial governance and Indone-
sia’s Reforestation Fund during the Soeharto and post-Soeharto periods, 1989–2009: a po-litical economic analysis of lessons for REDD+. CIFOR, Bogor, Indonesia. http://www.cifor.cgiar.org/Knowledge/Publications/DocumentDownloader?a=d&p=%5Cpublications%5Cpdf_files%5COccPapers%5COP-52.pdf. Viewed October 2010.
Brown, D.W. (2005). Maintaining long term growth in the forest sector: A review of MFP efforts to
combat illegal logging. DFID Multi-stakeholder Forestry Programme (MFP), Jakarta, Indone-sia. http://www.mfp.or.id/dev/doc/02-035.zip.
Brown, D.W., and Stolle, F. (2009). Bridging the Information Gap: Combating Illegal Logging in Indo-
nesia. World Resource Institute, Washington D.C. http://pdf.wri.org/bridging_the_information_gap.pdf
Brown, T. H., Simangunson, B. C. H, Sukadri, D., Brown, D. W., Sumirta, S., Dermawan, A., and Rufi
’ie, A. (2005). Restructuring and Revitalization of Indonesia’s Wood-Based Industry: Synthe-sis of Three Major Studies. MoF-NRM-CIFOR-MFP Forest Trends-ITTO. Jakarta, Indonesia.
Chen, H.K. (2006). The role of CITES in combating illegal logging—Current and potential. TRAFFIC
Online report series No. 13. TRAFFIC International. Cambridge, UK. Chen, H.K. (2008.) Lost in Transit: Export and Import Protocols as Contributors to Discrepancies in
International Timber Trade Data. TRAFFIC International, Cambridge, UK. Colchester, M. (2004). Strengthening the Social Component of a Standard for Legality of Wood Ori-
gin and Production in Indonesia. The Nature Conservancy. http://www.illegal-logging.info/uploads/TNC_final_report.doc. Viewed October 2010.

© EU FLEGT Facility, Jakarta: Scoping baseline information for Forest Law Enforcement, Governance and Trade, January 2012. 70
This Action is funded by the European Union and the governments of Finland, France, Germany, the Netherlands and the UK. The views expressed herein can in no way be taken to reflect the official opinion of the European Union. www.euflegt.efi.int
Cossalter, C. (2006). APP and APRIL’s commitments for Sustainable pulpwood plantations. Where
do we stand? http://environment.yale.edu/tfd/uploads/APP__APRIL_25_November_2006.pdf Dauvergne, P. (1997). Shadows in the Forest—Japan and the Politics of Timber in South East Asia.
MIT Press, Washington D.C. Eastin, I. and Perez-Garcia, J. (2004). Discrepancies in Forest Products Trade Statistic. Cintrafor.
Washington D.C. Effendi, R., and Hariyatno., Indah, B. (2005). The study of barriers and furniture industry Develop-
ment in Central Java. Social Economic Forestry Research Center (Puslitsosekhut). Ministry of Forestry.
EIA (2007). The Thousand Headed Snake—Forest Crimes, Corruption and Injustice in Indonesia.
Environmental Investigation Agency, London, UK. Tambunan, E. and Agus, R. (2010). Deforestasi terencana diterapkan, reported in Business Indone-
sia Daily News, 06 August 2010. FAO (2006). FAOSTAT Database home page (http://www.fao.org/). Food and Agriculture Organiza-
tion of the United Nations, Rome.
FAO-MoF (2009). Asia-pacific forestry sector outlook study II, working paper series working paper no. Apfsos II/wp/2009/13 Indonesia. Forestry Outlook study by Center for Forestry Planning and Statistics, Ministry of Forestry, and FAO, Bangkok, Thailand.
Global Forest Watch (2002). The State of the Forest in Indonesia. Global Forest Watch Indonesia. Global Witness (2004). Liberia: Back to the Future – What is the future of Liberia’s forests and its ef-
fects on regional peace? Global Witness, Washington, D.C. http://www.globalwitness.org/media_library_get.php/190/1278695681/Liberia_Back_To_The_Future.pdf
Goetzl, A. (2005). Why the Numbers Don’t Add Up—Discrepancies in tropical timber trade data high-
light the continuing need to strengthen capacity for data collection and analysis. ITTO, Yokohama, Japan. http://www.itto.int/direct/topics/topics_pdf_download/topics_id=9320000&no=1
Greenpeace (2009). Indonesia’s Rainforests and the Climate Crisis. Greenpeace, Washington D.C.
http://www.greenpeace.org/raw/content/france/presse/dossiers-documents/indonesiekampar.pdf
Greenpeace (2010). How Sinar Mas is pulping the planet. Greenpeace, Washington D.C.
http://www.greenpeace.org/international/en/publications/reports/SinarMas-APP/. Hashim, N. (2004). Timber Trade Enforcement—Malaysia’s Experience. Presentation at the INECE
workshop Increasing International Enforcement Cooperation to Control Transboundary Trade. 18-19 October 2004, Bangkok.
ITTO (2001). Achieving Sustainable Forest Management in Indonesia. Report submitted to the ITTC.
ITTO, Yokohama, Japan. http://www.itto.int/direct/topics/topics_pdf_download/topics_id=2020000&no=1&disp=inline
© EU FLEGT Facility, Jakarta: Scoping baseline information for Forest Law Enforcement, Governance and Trade, January 2012. 71
This Action is funded by the European Union and the governments of Finland, France, Germany, the Netherlands and the UK. The views expressed herein can in no way be taken to reflect the official opinion of the European Union. www.euflegt.efi.int
ITTO (2003). Annual Review and Assessment of the World Timber Situation. ITTO Yokohama. ITTO (2007). Tropical Timber Market Report (1-15 March 2007).
http://www.itto.int/direct/topics/topics_pdf_download/topics_id=32280000&no=11 Kustiawan, D. (2006). Conditions and challenges of HTI development in Indonesia. Paper presented
at a regular In-house Experts Working Group meeting on 8 June 2006, Manggala Wanabakti Building. Jakarta.
Lang, C. (2007). Pulp mill watch factsheet: Country profiles: Indonesia. www.pulpmillwatch.org Lawson, S and MacFaul, L. (2010). Illegal Logging and Related Trade Indicators of the Global Re-
sponse. Country report cards. Chatham House. Malessa, U. and Chen, H.K. (2010). The role of the Gulf Region in a responsible global timber trade.
Paper presented to the First Annual Gulf Research Meeting, 7-10 July 2010, University of Cambridge, UK.
Manurung, E.G. (2002). The impact of log export ban policy in the period 1985-1997 to Indonesian
forestry sector, a critical analysis: Paper for the World Bank, Jakarta. Minar, B.T. (2006). No Chip Mill without Wood—A Study of UFS Projects to Develop Wood Chip and
Paper Pulp Mills in Kalimantan, Indonesia. Down To Earth. http://dte.gn.apc.org/cskal06.pdf Ministry of Forestry (2006). Executive Data Strategic. Ministry of Forestry, Jakarta, Indonesia. Ministry of Forestry (2008). Forestry statistic 2008. Ministry of Forestry, Jakarta, Indonesia. Ministry of Forestry (2009). Executive Data Strategic. Ministry of Forestry, Jakarta, Indonesia. Ministry of Forestry (2009a). Statistik Kehutanan Indonesia 2008.
http://www.dephut.go.id/files/Statistik_Kehutanan_2008_BPK.pdf Minister of Forestry (2009b). Forestry Minister’s Regulation Number: P.8/Menhut-II/2009 Concerning
Second Change to Forestry Minister’s Regulation Number P.55/MENHUT-II/2006 Concern-ing Administration Of Forest Product Originating In State-Owned Forest. Annex II and Annex III
Ministry of Forestry (2009c). Kebijakan revitalisasi sektor kehutanan khususnya industri Kehutanan
dan hasil yang dicapai. Unpublished. WWW. Dephut.go.id. Ministry of Forestry (2009d). Minister Regulation No:P.70/Menhut-II /2009. Forest Policy priorities.
Indonesia. Ministry of Forestry (2009e). MoF 5 year Action Plan 2010-2014. Ministry of Forestry-IFCA (2008). Consolidation report: Reducing Emissions from Deforestation and
Forest Degradation in Indonesia. Publish by Forest Research Agency Development (FORDA) Indonesia.
Nawir, A.A., Santoso, L. and Mudhofar, I. (2003). Towards mutually beneficial company-community
partnerships in timber plantations: lessons learnt from Indonesia. Working Paper No. 26. CI-FOR, Bogor, Indonesia.
© EU FLEGT Facility, Jakarta: Scoping baseline information for Forest Law Enforcement, Governance and Trade, January 2012. 72
This Action is funded by the European Union and the governments of Finland, France, Germany, the Netherlands and the UK. The views expressed herein can in no way be taken to reflect the official opinion of the European Union. www.euflegt.efi.int
Nogueron, R. and Hanson, C. (2010). Risk Free? Paper and the Lacey Act. World Resources Insti-tute, Washington DC.
Obidzinski, K.., Andrianto, A., and Wijaya, C. (2007). Cross-Border Timber Trade in Indonesia: Criti-
cal or Overstated Problem? Forest Governance Lessons from Kalimantan. Commonwealth Forestry Association. http://www.cifor.cgiar.org/Knowledge/Publications/DocumentDownloader?a=d&p=%5Cpublications%5Cpdf_files%5Carticles%5CAObidzinski0701.pdf
Oliver, R. (2007). UK market conditions for “legal” and “legal and sustainable” wood products. Tim-
ber Trade Federation, London, UK. http://www.illegal-logging.info/uploads/TTF_market_report_07.pdf
Pirard, R and Cossalter, C. (2006). The Revival of Industrial Forest Plantations in Indonesia’s Kali-
mantan Provinces—Will they help eliminate fibre shortfalls at Sumatran pulp mills or feed the China market? CIFOR, Bogor, Indonesia. http://www.cifor.cgiar.org/publications/pdf_files/research/governance/foresttrade/Attachment47-The_Revival_of_Industrial_Forest_Lowres.pdf
Pirard, R. and Rokhim, R. (2006). Asia Pulp & Paper Indonesia: The business rationale that led to
forest degradation and financial collapse. CIFOR, Bogor, Indonesia. Roda, J-M., Cadène, P., Guizol, P., Santoso, L., Fauzan. AU. (2007). Atlas of wooden furniture in-
dustry in Jepara, Indonesia. CIRAD and CIFOR. http://www.cifor.cgiar.org/publications/pdf_files/Books/BRoda0701.pdf
Scotland, N., Fraser, A. And Jewell, N. (1999). Roundwood Supply and Demand in the Forest Sector
in Indonesia. ITFMP report no. PFM/EC/99/08. Indonesia-UK Tropical Forest Management Programme. Jakarta, Indonesia.
Setiono, B. (2007). Debt Settlement of Indonesian Forestry Companies—Assessing the Role of
Banking and Financial Policies for Promoting Sustainable Forest Management in Indonesia. CIFOR, Bogor, Indonesia. http://www.cifor.cgiar.org/Knowledge/Publications/DocumentDownloader?a=d&p=%5Cpublications%5Cpdf_files%5CBooks%5CBSetiono0701.pdf
Setiono, B. (2008). Corruption and Forest Revenues in Papua. U4 Anti-Corruption Resource Centre.
Norway.http://www.cmi.no/publications/file/3049-corruption-and-forest-revenues-in-papua.pdf.
Setyarso, A. (2003). Development and implementation of Guidelines to Control Illegal Logging as a
Pre-Condition for Sustainable Forest Management in Indonesia. ITTO PD 74/01 (Rev. 1(M). ITTO, Yokohama.
Tacconi, L., Obidzinski, K., and Agung, F. (2004). Learning Lessons to Promote Forest Certification
and Control Illegal Logging in Indonesia (2004) CIFOR. http://www.cifor.cgiar.org/publications/pdf_files/Books/BTacconi0401.pdf
Tambunan, E., and Agus, R. (2010). Deforestasi terencana diterapkan. Business Indonesia Daily
News, 6 August 2010. Timber Trade Federation (2004). Scoping Study: Sourcing Legal Timber from Indonesia—A Public
Summary Report. TTF, UK. http://pod-208.dolphin-server.co.uk/uploads/Sourcing_Legal_Timber_from_Indonesia.pdf

© EU FLEGT Facility, Jakarta: Scoping baseline information for Forest Law Enforcement, Governance and Trade, January 2012. 73
This Action is funded by the European Union and the governments of Finland, France, Germany, the Netherlands and the UK. The views expressed herein can in no way be taken to reflect the official opinion of the European Union. www.euflegt.efi.int
World Bank (2006). Sustaining Economic Growth, Rural Livelihoods, and Environmental Benefits:
Strategic Options for Forest Assistance in Indone-sia.http://siteresources.worldbank.org/INTINDONESIA/Resources/Publication/280016-1168483675167/IDWBForestOptions.pdf. Viewed October 2010.
Yuichi, S. (2002). Illegal logging – History and lessons from Indonesia. Review Esay, October 2002.
http://kyotoreview.cseas.kyoto-u.ac.jp/issue/issue1/article_164.html., viewed September 2010.
© EU FLEGT Facility, Jakarta: Scoping baseline information for Forest Law Enforcement, Governance and Trade, January 2012. 74
This Action is funded by the European Union and the governments of Finland, France, Germany, the Netherlands and the UK. The views expressed herein can in no way be taken to reflect the official opinion of the European Union. www.euflegt.efi.int
Annex 1: Indonesia—additional information of interest
Background Indonesia is the world’s largest archipelago with some 13,677 islands covering approximately 181.16 million hectares of land and 9.30 million hectares of inland water bodies, totalling 190.46 million hec-tares Common land boundaries are with Malaysia (with the states of Sabah and Sarawak on Borneo island) and with Papua New Guinea and Timor-Leste. Otherwise the archipelago lies between the Indian Ocean to the west and south and the Pacific Ocean to the north-east and is separated from Peninsular Malaysia and Singapore by the Straits of Malacca and the South China Sea, from the Philippines islands by the Sulawesi Sea and from Australia by the Arafura Sea and Timor Sea. The vast distances within the country are illustrated by the straight lengths from the north-western tip of Aceh province in Sumatra to the south-eastern corner of Irian Jaya, 5,300 km approximately, and from Talaud island, close to the Mindanao Island of the Philippines; to Roti island, southeast of Timor island; roughly north-south, covering a distance of approximately 1,775 km. Indonesia is a recognized mega-biodiversity country. It has been reported that there are 515 species of mammals (12% of the world’s mammals); 511 species of reptiles (7.3% of the world’s reptiles); 1,531 species of birds (17% of the world’s birds); 270 species of amphibians, 2,827 species of inver-tebrates; and an estimated 38,000 species of plants of which about 1,260 species are medicinal plants. At the end of 2006, the MoF, Indonesia has managed to protect 127 species of mammals; 382 species of birds; 31 species of reptiles; 9 species of fish; 20 species of insects; 2 species of crustacean; 1 species of anthozoa and 12 species of bivalves. The Ministry has also listed 1,053 species of flora and 1,384 species of fauna in CITES Appendices I and II. Policy and legislation The basic principles and objectives contained in the Forestry Act No. 41, and 22 of the legal frame-works are:
(i) forest resources are controlled and managed to provide multiple uses; (ii) forestry administration be based on sustainability, democracy, equity, togetherness, trans-
parency and integration, as well as be oriented for people’s maximum welfare; (iii) the government is obliged to encourage people’s participation through various effective and
efficient forestry activities and to reflect this participation through assistance from a stake-holder forum, and to this end a National Forestry Council was formed;
(iv) as long as they exist and are recognized customary laws, communities have the rights to col-
lect forest products for their daily needs, undertake forest management under customary laws that do not contradict national laws, and be empowered for improving their welfare;
(v) communities can use forest and forest products and be informed about plans for forest allo-
cation, forest products use and forestry information; (vi) communities have the right to compensation for losing access to their forests due to designa-
tion as forest areas, in accordance with prevailing laws and regulations; and (vii) communities are obliged to participate in maintaining and preventing forest areas from dis-
turbance and damage and can seek assistance and guidance in this task even from third parties.
© EU FLEGT Facility, Jakarta: Scoping baseline information for Forest Law Enforcement, Governance and Trade, January 2012. 75
This Action is funded by the European Union and the governments of Finland, France, Germany, the Netherlands and the UK. The views expressed herein can in no way be taken to reflect the official opinion of the European Union. www.euflegt.efi.int
Hence, it is clear that the Indonesian legal framework for forest management is based on the three broad goals of promoting economic growth, providing widespread and equitable benefits to society, and sustaining environmental services and benefits. In this regard, the basic principles of forestry administration in Indonesia are to:
(i) ensure that forests are sufficient in area and evenly distributed; (ii) optimize the variety of forest functions which cover conservation, protection and production
in order to achieve balanced and sustainable benefits from the forest resources for society, culture and the economy;
(iii) improve the carrying capacity of watersheds; (iv) improve the capacity to develop community potentials and empowerment through participa-
tory, equal and environmentally-friendly ways so as to strengthen endurance against exter-nal changes; and
(v) secure equal and sustainable distribution of benefits.
There has been several policy shifts by the government over the years. In early 1998, following the signing of a Letter of Intent (LoI) between the Government of Indonesia and the International Mone-tary Fund (IMF), the former log export ban policy was removed, and substituted with the new log ex-port tax policy. Tax for log export was originally 40%, and further reduced to 10% before the end of December 2000, and became 0% in 2003. There was lack of clear reasoning for the re-enactment and the log export tax policy should have been based on an accurate calculation of supply and de-mand in order to create an optimal effect (Manurung, E.G., 2002). The government should conduct proper analysis before imposing new policies as such policies may result in severe market failures. All these are now superseded by the log and rough sawn wood export ban.

© EU FLEGT Facility, Jakarta: Scoping baseline information for Forest Law Enforcement, Governance and Trade, January 2012. 76
This Action is funded by the European Union and the governments of Finland, France, Germany, the Netherlands and the UK. The views expressed herein can in no way be taken to reflect the official opinion of the European Union. www.euflegt.efi.int
Annex 2: Indonesia’s imports of wood-based products from 2000-2009 in million m3 RWE
Figure 1: Indonesia’s imports of paper products by supplying countries from 2000-2009 in mil-
lion m3 RWE
Source: Badan Pusat Statistik, Indonesia, and UN COMTRADE for 2000 and 2008
Figure 2: Indonesia’s imports of other timber sector products by supplying countries from 2000-2009 in million m
3 RWE
Source: Badan Pusat Statistik, Indonesia, and UN COMTRADE for 2000 and 2008
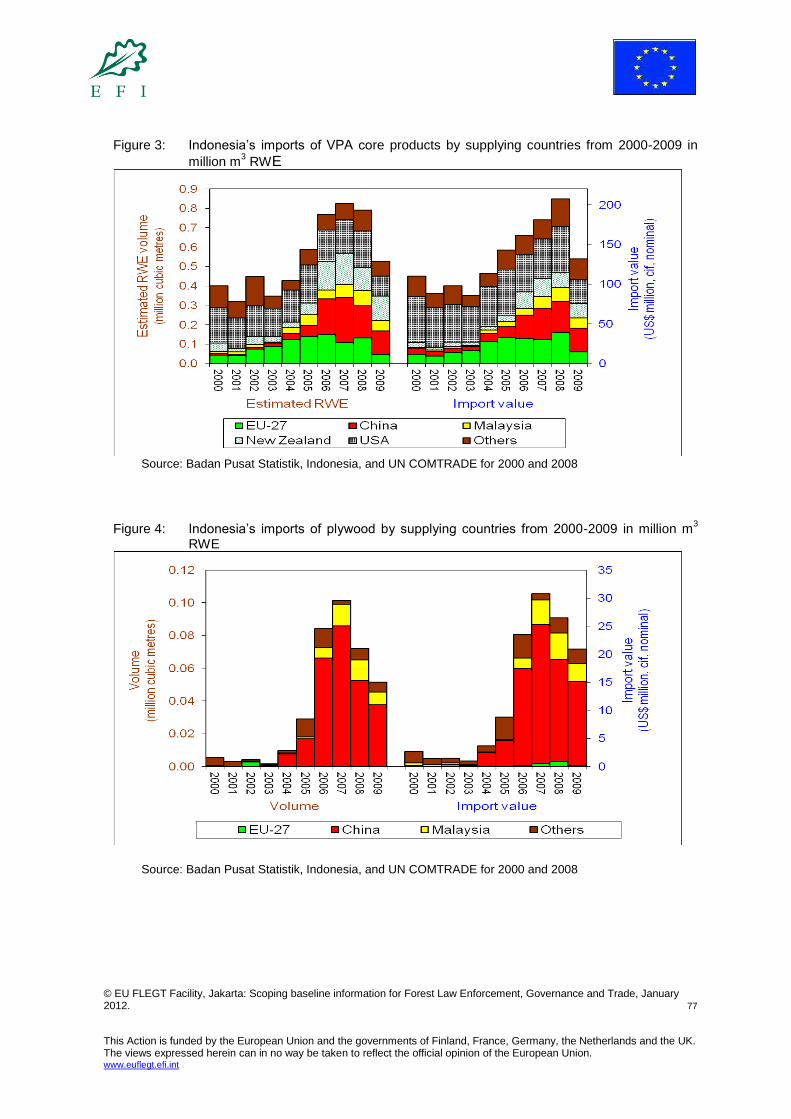
© EU FLEGT Facility, Jakarta: Scoping baseline information for Forest Law Enforcement, Governance and Trade, January 2012. 77
This Action is funded by the European Union and the governments of Finland, France, Germany, the Netherlands and the UK. The views expressed herein can in no way be taken to reflect the official opinion of the European Union. www.euflegt.efi.int
Figure 3: Indonesia’s imports of VPA core products by supplying countries from 2000-2009 in
million m3 RWE
Source: Badan Pusat Statistik, Indonesia, and UN COMTRADE for 2000 and 2008
Figure 4: Indonesia’s imports of plywood by supplying countries from 2000-2009 in million m
3
RWE
Source: Badan Pusat Statistik, Indonesia, and UN COMTRADE for 2000 and 2008
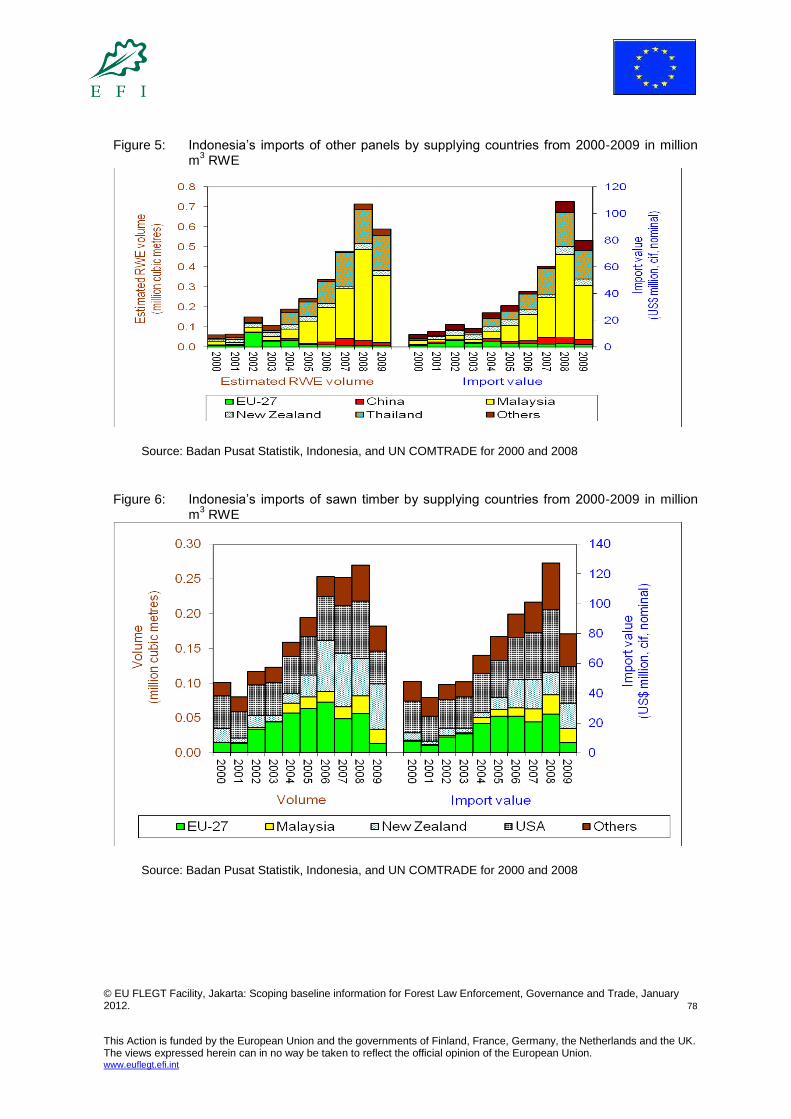
© EU FLEGT Facility, Jakarta: Scoping baseline information for Forest Law Enforcement, Governance and Trade, January 2012. 78
This Action is funded by the European Union and the governments of Finland, France, Germany, the Netherlands and the UK. The views expressed herein can in no way be taken to reflect the official opinion of the European Union. www.euflegt.efi.int
Figure 5: Indonesia’s imports of other panels by supplying countries from 2000-2009 in million m
3 RWE
Source: Badan Pusat Statistik, Indonesia, and UN COMTRADE for 2000 and 2008
Figure 6: Indonesia’s imports of sawn timber by supplying countries from 2000-2009 in million
m3 RWE
Source: Badan Pusat Statistik, Indonesia, and UN COMTRADE for 2000 and 2008

© EU FLEGT Facility, Jakarta: Scoping baseline information for Forest Law Enforcement, Governance and Trade, January 2012. 79
This Action is funded by the European Union and the governments of Finland, France, Germany, the Netherlands and the UK. The views expressed herein can in no way be taken to reflect the official opinion of the European Union. www.euflegt.efi.int
Figure 7: Indonesia’s imports of logs by supplying countries from 2000-2009 in million m3 RWE
Source: Badan Pusat Statistik, Indonesia, and UN COMTRADE for 2000 and 2008
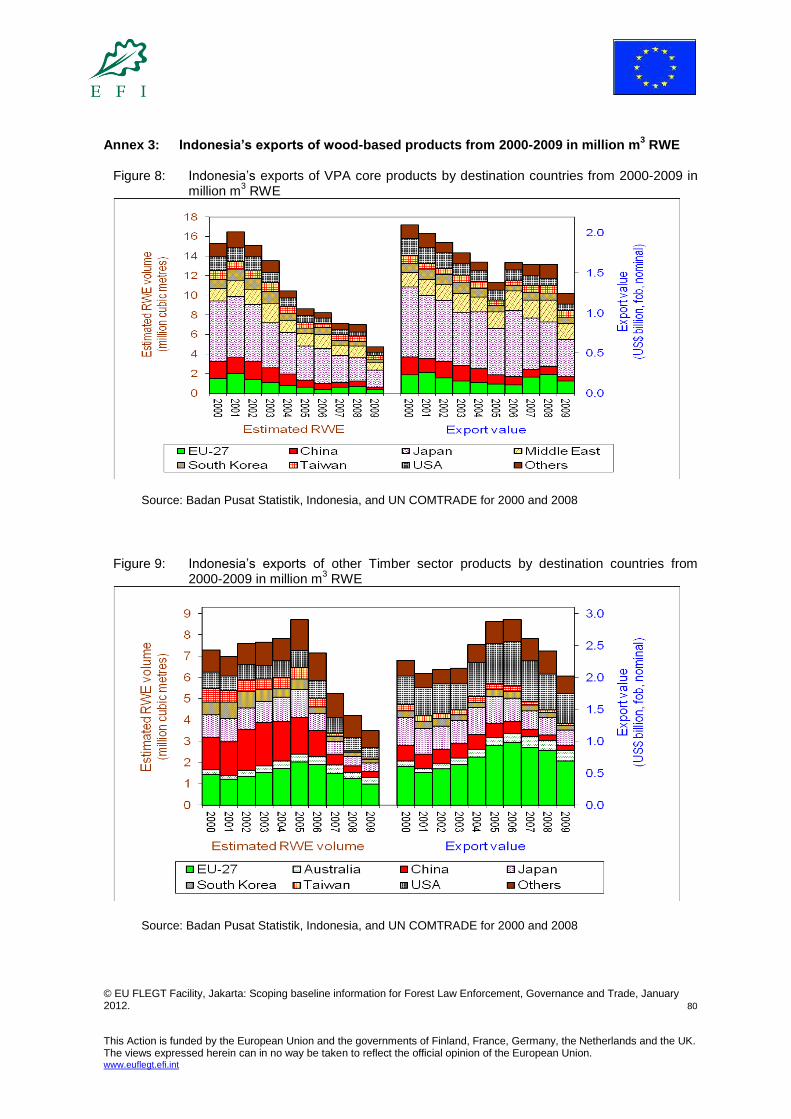
© EU FLEGT Facility, Jakarta: Scoping baseline information for Forest Law Enforcement, Governance and Trade, January 2012. 80
This Action is funded by the European Union and the governments of Finland, France, Germany, the Netherlands and the UK. The views expressed herein can in no way be taken to reflect the official opinion of the European Union. www.euflegt.efi.int
Annex 3: Indonesia’s exports of wood-based products from 2000-2009 in million m3 RWE
Figure 8: Indonesia’s exports of VPA core products by destination countries from 2000-2009 in
million m3 RWE
Source: Badan Pusat Statistik, Indonesia, and UN COMTRADE for 2000 and 2008
Figure 9: Indonesia’s exports of other Timber sector products by destination countries from
2000-2009 in million m3 RWE
Source: Badan Pusat Statistik, Indonesia, and UN COMTRADE for 2000 and 2008

© EU FLEGT Facility, Jakarta: Scoping baseline information for Forest Law Enforcement, Governance and Trade, January 2012. 81
This Action is funded by the European Union and the governments of Finland, France, Germany, the Netherlands and the UK. The views expressed herein can in no way be taken to reflect the official opinion of the European Union. www.euflegt.efi.int
Figure 10: Indonesia’s exports of other paper sector products by destination countries from 2000-2009 in million m
3 RWE
Source: Badan Pusat Statistik, Indonesia, and UN COMTRADE for 2000 and 2008
Figure 11: Indonesia’s exports of veneer products by destination countries from 2000-2009 in mil-
lion m3 RWE
Source: Badan Pusat Statistik, Indonesia, and UN COMTRADE for 2000 and 2008

© EU FLEGT Facility, Jakarta: Scoping baseline information for Forest Law Enforcement, Governance and Trade, January 2012. 82
This Action is funded by the European Union and the governments of Finland, France, Germany, the Netherlands and the UK. The views expressed herein can in no way be taken to reflect the official opinion of the European Union. www.euflegt.efi.int
Figure 12: Indonesia’s exports of plywood products by destination countries from 2000-2009 in million m
3 RWE
Source: Badan Pusat Statistik, Indonesia, and UN COMTRADE for 2000 and 2008
Figure 13: Indonesia’s exports of mouldings and joinery by destination countries from 2000-2009
in million m3 RWE
Source: Badan Pusat Statistik, Indonesia, and UN COMTRADE for 2000 and 2008

© EU FLEGT Facility, Jakarta: Scoping baseline information for Forest Law Enforcement, Governance and Trade, January 2012. 83
This Action is funded by the European Union and the governments of Finland, France, Germany, the Netherlands and the UK. The views expressed herein can in no way be taken to reflect the official opinion of the European Union. www.euflegt.efi.int
Figure 14: Indonesia’s exports of wooden furniture by destination countries from 2000-2009 in million tonnes
Source: Badan Pusat Statistik, Indonesia, and UN COMTRADE for 2000 and 2008
Figure 15: Indonesia’s exports of wood chips by destination countries from 2000-2009 in million
tonnes
Source: Badan Pusat Statistik, Indonesia, and UN COMTRADE for 2000 and 2008
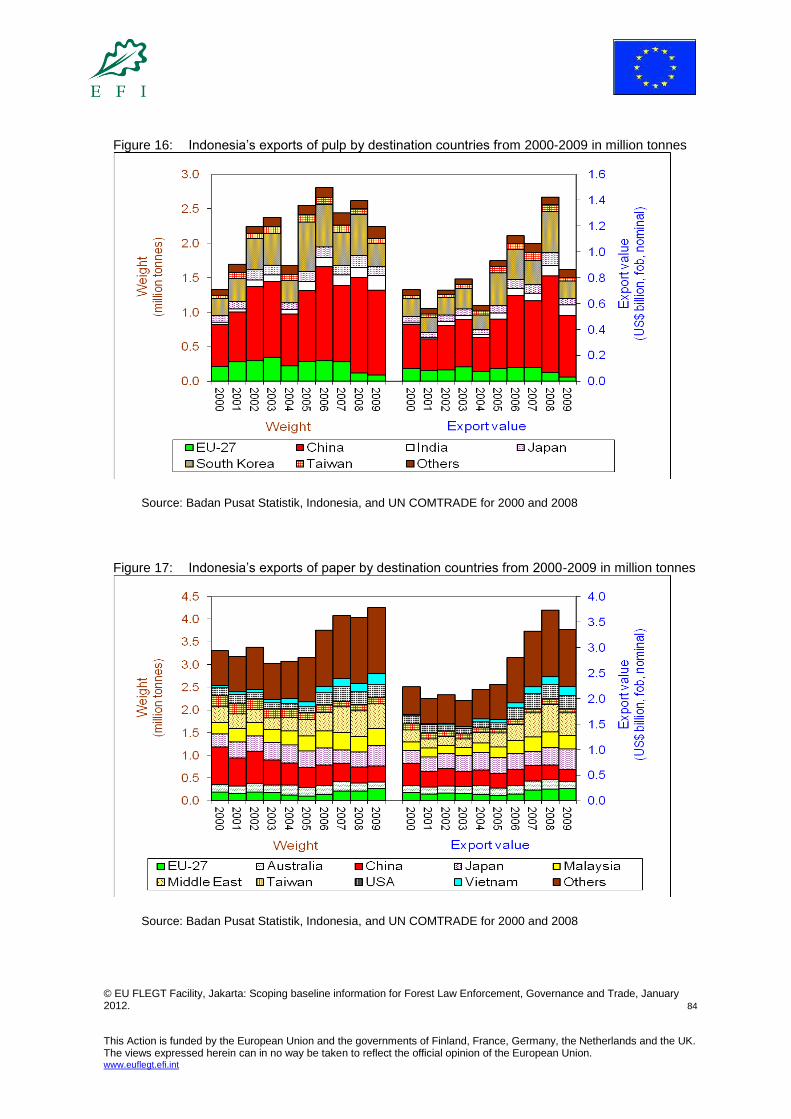
© EU FLEGT Facility, Jakarta: Scoping baseline information for Forest Law Enforcement, Governance and Trade, January 2012. 84
This Action is funded by the European Union and the governments of Finland, France, Germany, the Netherlands and the UK. The views expressed herein can in no way be taken to reflect the official opinion of the European Union. www.euflegt.efi.int
Figure 16: Indonesia’s exports of pulp by destination countries from 2000-2009 in million tonnes
Source: Badan Pusat Statistik, Indonesia, and UN COMTRADE for 2000 and 2008
Figure 17: Indonesia’s exports of paper by destination countries from 2000-2009 in million tonnes
Source: Badan Pusat Statistik, Indonesia, and UN COMTRADE for 2000 and 2008

This document has been produced with the financial assistance of the European Union. The views expressed herein can in no way be taken to reflect the official opinion of the
European Union. www.efi.int/portal/projects/flegt/flegt_asia
/ www.euflegt.efi.int