Embed Size (px)
Citation preview

(1998-2008) 10 Years of Operational Global VEGETATION Monitoring (Brussels Dec. 2008)
SCIENTIFIC DECLENSION OF THE SPOT/VEGETATION TIME SERIES
Philippe Maisongrande
with Agustin Lobo and Benoît Duchemin
(1998-2008) 10 Years of Operational Global VEGETATION Monitoring (Brussels Dec. 2008)
10 years of monitoring to serve various thematic issues
• Some Thematic Aspects : – NDVI as a proxy of LAI
– SWVI as a proxy of Water Stress
– Evapotranspiration and water budget
– Snow
– Land Use Land Cover
Resolution, VGT+other mission

(1998-2008) 10 Years of Operational Global VEGETATION Monitoring (Brussels Dec. 2008)
Precipitation climatology-Australian Bureau of Meteo.-
1998->2006 average NDVI-Spot/VEGETATION data-
NDVI makes sense
(1998-2008) 10 Years of Operational Global VEGETATION Monitoring (Brussels Dec. 2008)
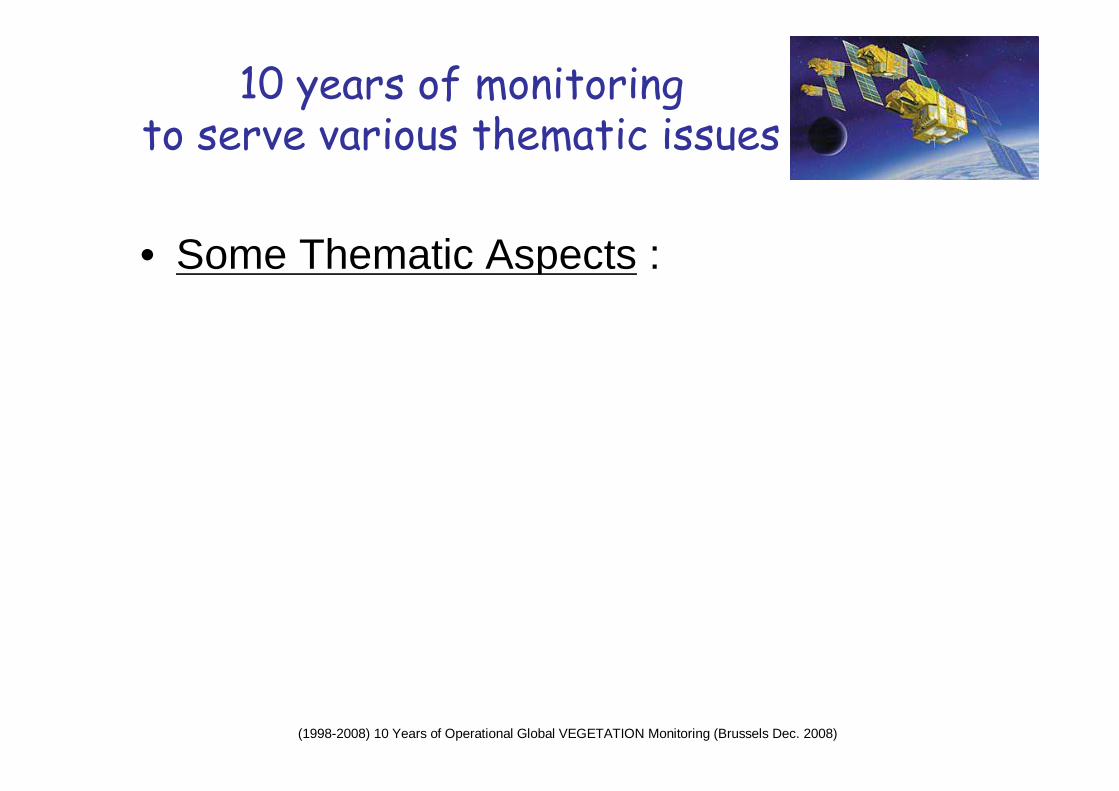
NDVI & SWVI
Maisongrande, Kuhlmann et al.
MODSIM 2007NDVI
SWVI
10 years
ENSO
(1998-2008) 10 Years of Operational Global VEGETATION Monitoring (Brussels Dec. 2008)
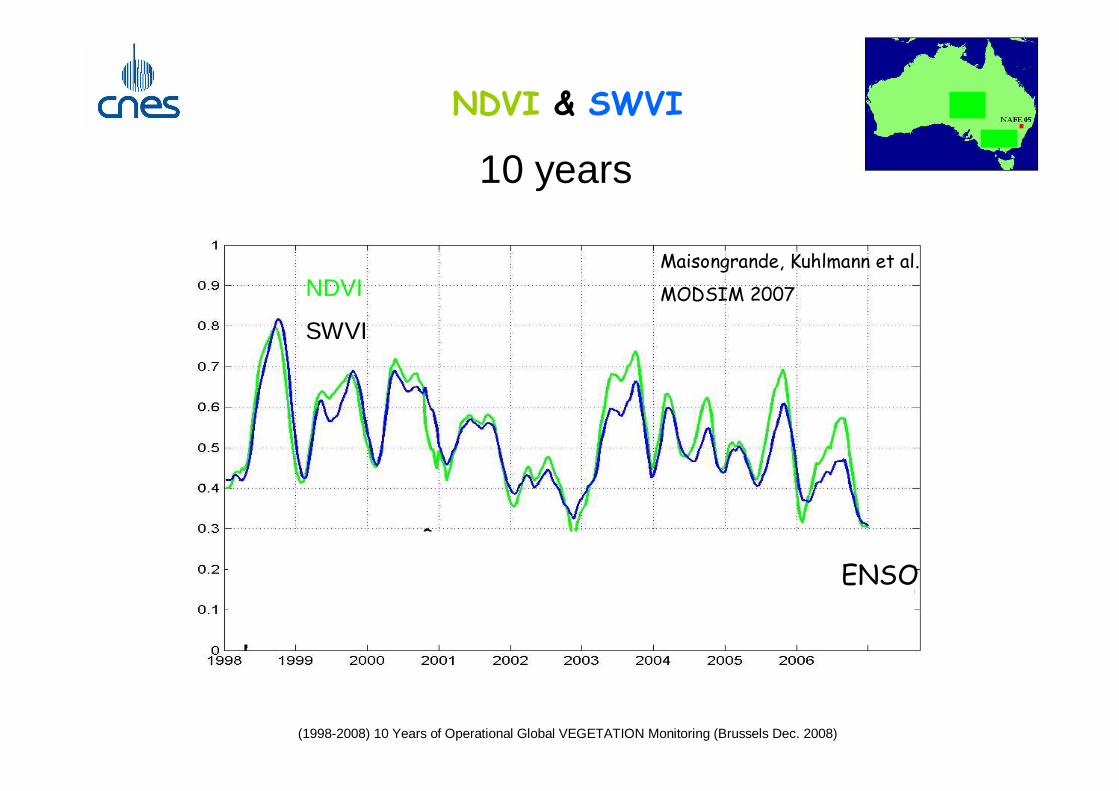
La Niña y El Niño
Maisongrande, Kuhlmann et al.
MODSIM 2007
1998/1999
1999/2000
2000/2001
2004/2005
2006
2002/2003

(1998-2008) 10 Years of Operational Global VEGETATION Monitoring (Brussels Dec. 2008)
NDVI & SWVIvs
Southern Oscillation Index
Maisongrande, Kuhlmann et al.
MODSIM 2007NDVI
SWVI

(1998-2008) 10 Years of Operational Global VEGETATION Monitoring (Brussels Dec. 2008)
1.5*∆-0.75
0.15+SOI/100
Maisongrande, Kuhlmann et al.
MODSIM 2007
∆∆∆∆=NDVI-SWVIvs
Southern Oscillation Index
(1998-2008) 10 Years of Operational Global VEGETATION Monitoring (Brussels Dec. 2008)
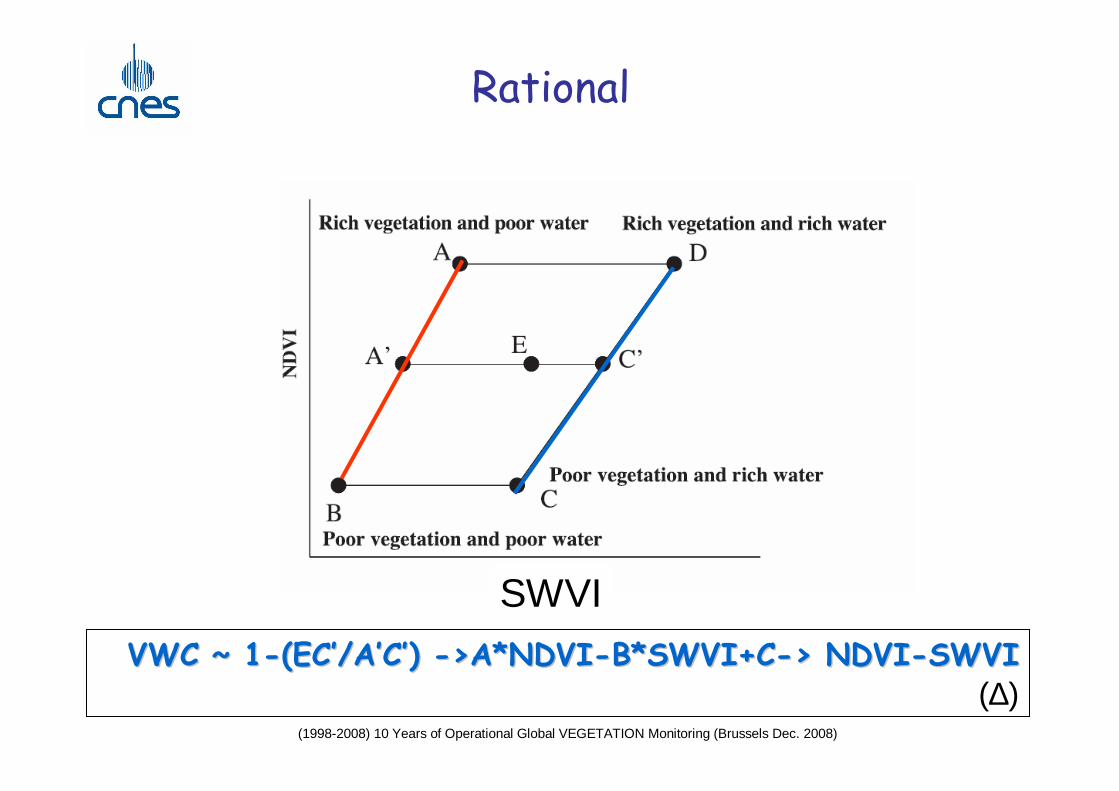
Rational
VWC VWC ~ ~ 11--(EC(EC’’/A/A’’CC’’) ) -->A*NDVI>A*NDVI--B*SWVI+CB*SWVI+C--> NDVI> NDVI--SWVISWVI(∆)
SWVI

(1998-2008) 10 Years of Operational Global VEGETATION Monitoring (Brussels Dec. 2008)
61 92 122 153 183 214 245 2750.02
0.11
0.2
0.29
NDVI & SWVI
SW
VI
Date61 92 122 153 183 214 245 275
0.41
0.49
0.57
0.65
ND
VI
61 92 122 153 183 214 245 2750.3
0.35
0.4
0.45
In-Situ vs Indice-Spectral
Hum
Sol
In-S
itu (
%)
Date61 92 122 153 183 214 245 275
0.17
0.25
0.33
0.41
0.49
ND
VI-
SW
VI
61 92 122 153 183 214 245 275-0.03
0.07
0.17
0.27
0.37NDVI & SWVI
SW
VI
Date61 92 122 153 183 214 245 275
0.38
0.47
0.56
0.65
0.74
ND
VI
61 92 122 153 183 214 245 2750.3
0.35
0.4
0.45
In-Situ vs Indice-SpectralH
umS
ol In
-Situ
(%
)
Date61 92 122 153 183 214 245 275
0.29
0.31
0.33
0.35
0.37
ND
VI-
SW
VI
61 92 122 153 183 214 245 275-0.02
0.04
0.1
0.16
NDVI & SWVI
SW
VI
Date61 92 122 153 183 214 245 275
0.33
0.4
0.47
0.54
0.61
ND
VI
61 92 122 153 183 214 245 2750.19
0.34
0.49
0.64
In-Situ vs Indice-Spectral
Hum
Sol
In-S
itu (
%)
Date61 92 122 153 183 214 245 275
0.14
0.25
0.36
0.47
ND
VI-
SW
VI
Auradé 2004 Auradé 2005 Lamasquère 2005
NDVI, SWVI and Soil Water Content

(1998-2008) 10 Years of Operational Global VEGETATION Monitoring (Brussels Dec. 2008)
Photosynthesis
NPP=Ec.PAR.Ei.Eb.Ks(θ)
Soil Water Content: θ
Evapotranspiration
ETR= Ks(θ).Kc. ETO
Simple SVAT approach
F(swvi)
F(swvi)

(1998-2008) 10 Years of Operational Global VEGETATION Monitoring (Brussels Dec. 2008)
Kc as a function of NDVI
Kc=(a x NDVI) + b

(1998-2008) 10 Years of Operational Global VEGETATION Monitoring (Brussels Dec. 2008)
Photosynthesis
NPP=Ec.PAR.Ei.Eb.Ks(θ)
Soil Water Content: θ
Evapotranspiration
ETR= Ks(θ).Kc. ETO
Simple SVAT approach
F(ndvi)
F(ndvi)

(1998-2008) 10 Years of Operational Global VEGETATION Monitoring (Brussels Dec. 2008)
SNOW Monitoring

(1998-2008) 10 Years of Operational Global VEGETATION Monitoring (Brussels Dec. 2008)
Snow index
MIRBB
MIRBB
NDSI++
−+
=
220
220
(1998-2008) 10 Years of Operational Global VEGETATION Monitoring (Brussels Dec. 2008)
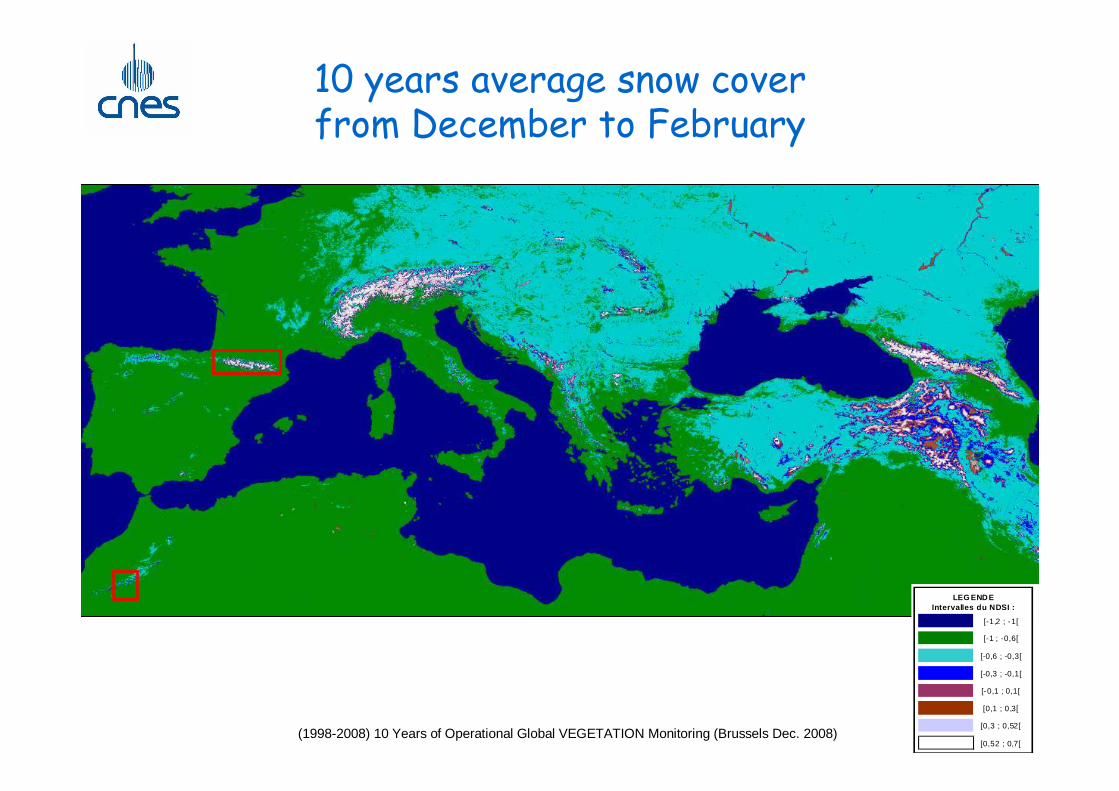
10 years average snow coverfrom December to February
[-1,2 ; -1[
[-1 ; -0,6[
[-0,6 ; -0,3[
[-0,3 ; -0,1[
[-0,1 ; 0,1[
[0,1 ; 0,3[
[0,3 ; 0,52[
[0,52 ; 0,7[
LEG ENDE Intervalles du NDSI :

(1998-2008) 10 Years of Operational Global VEGETATION Monitoring (Brussels Dec. 2008)
Interannual Snow dynamic in the Atlas montains
Boudhar et al. 2007

(1998-2008) 10 Years of Operational Global VEGETATION Monitoring (Brussels Dec. 2008)
LANDSAT vs VGT Snow Cover
High-Atlas mountains (Morocco)
Proportion of snow
cover

(1998-2008) 10 Years of Operational Global VEGETATION Monitoring (Brussels Dec. 2008)
MNDSI
Altitude 2600-4200m
0
200
400
Sno
w s
urfa
ce (
km²)
North South
Space time dynamics of snow covered areas
0
0,5
1
Sno
w c
over
pro
port
ion
1000-1400m1400-1800m1800-2200m2200-2600m2600-3000m3000-3400m3400-3800m3800-4200m
Boudhar et al. Sècheresse 2007. Chaponnière et al. I nternational Journal of Remote Sensing. 2005

(1998-2008) 10 Years of Operational Global VEGETATION Monitoring (Brussels Dec. 2008)
5 0 1 0 0 1 5 0 2 0 0 2 5 0 3 0 0 3 5 0 4 0 0 4 5 0 5 0 0
20
40
60
80
1 00
1 20
1 40 -0 .6
-0 .4
-0 .2
0
0 .2
0 .4
0 .6
0 5 0 0 1 0 0 0 1 5 0 0 2 0 0 0 2 5 0 0 3 0 0 0 3 5 0 0-0 . 8
-0 . 6
-0 . 4
-0 . 2
0
0 . 2
0 . 4
0 . 6
0 . 8
A l t i t u d e e n m è t re s
ND
SI
moy
en
P y ré n é e s
10 years average NDSI in the Pyrenees
SNOW INDEX
ALTITUDE
(1998-2008) 10 Years of Operational Global VEGETATION Monitoring (Brussels Dec. 2008)
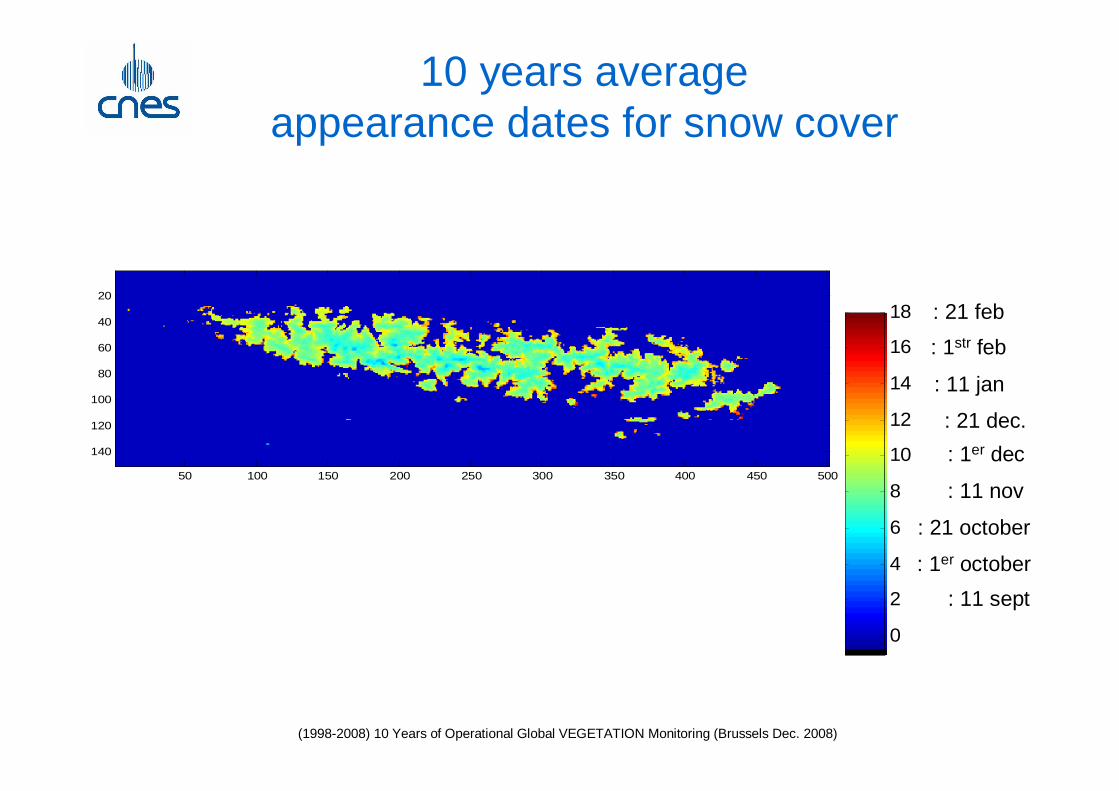
10 years averageappearance dates for snow cover
50 100 150 200 250 300 350 400 450 500
20
40
60
80
100
120
140
0
2
4
6
8
10
12
14
16
18
: 11 sept
: 21 feb
: 1er october
: 11 nov
: 21 october
: 1er dec
: 11 jan
: 21 dec.
: 1str feb
(1998-2008) 10 Years of Operational Global VEGETATION Monitoring (Brussels Dec. 2008)
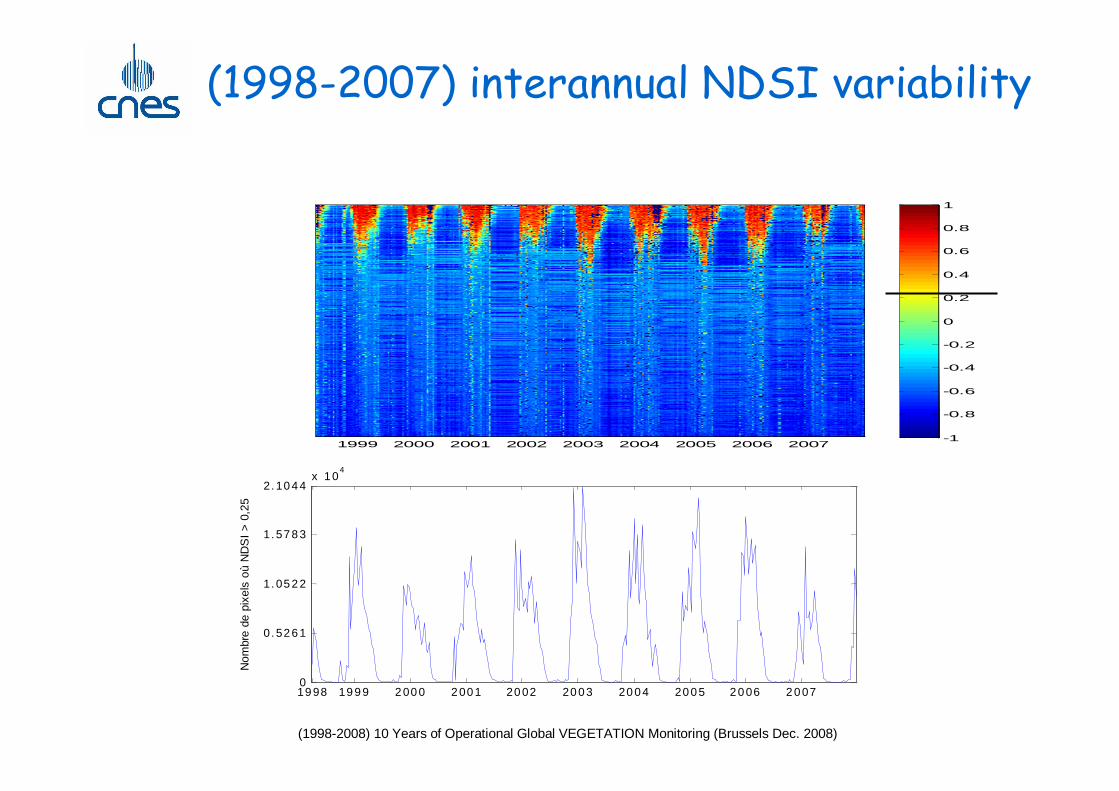
(1998-2007) interannual NDSI variability
19 98 19 9 9 2 00 0 2 00 1 20 02 20 0 3 20 0 4 20 0 5 2 0 06 2 0 070
0. 52 6 1
1. 05 2 2
1. 57 8 3
2. 10 4 4x 1 0
4
Nom
bre
de p
ixel
s où
ND
SI
> 0
,25
1999 2000 2001 2002 2003 2004 2005 2006 2007-1
-0.8
-0.6
-0.4
-0.2
0
0.2
0.4
0.6
0.8
1
(1998-2008) 10 Years of Operational Global VEGETATION Monitoring (Brussels Dec. 2008)
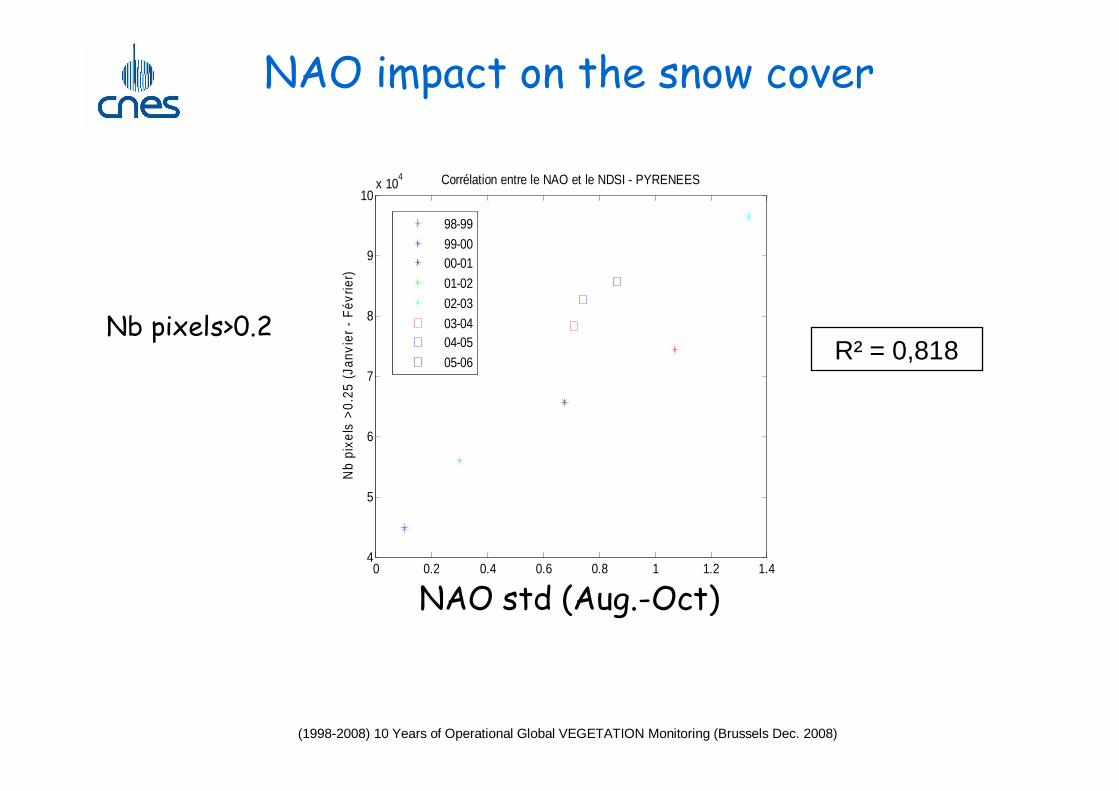
0 0.2 0.4 0.6 0.8 1 1.2 1.44
5
6
7
8
9
10x 10
4
Nb
pixe
ls >
0.25
(Ja
nvie
r -
Fév
rier)
Ecart type NAO (Août - Octobre)
Corrélation entre le NAO et le NDSI - PYRENEES
98-99
99-00 00-01
01-02
02-03
03-04 04-05
05-06 R² = 0,818
NAO impact on the snow cover
NAO std (Aug.-Oct)
Nb pixels>0.2

(1998-2008) 10 Years of Operational Global VEGETATION Monitoring (Brussels Dec. 2008)
Snow cover map f(NOA)
50 100 150 200 250 300 350 400 450 500
20
40
60
80
100
120
140
Pas de neige
σ(NAO de août à octobre) = 1,35
σ(NAO de août à octobre) = 0,7
σ(NAO de août à octobre) = 0,1
0 0.2 0.4 0.6 0.8 1 1.2 1.44
5
6
7
8
9
10x 10
4
Nb
pixe
ls >
0.25
(Ja
nvie
r -
Fév
rier)
Ecart type NAO (Août - Octobre)
Corrélation entre le NAO et le NDSI - PYRENEES
98-99
99-00 00-01
01-02
02-03
03-04 04-05
05-06

(1998-2008) 10 Years of Operational Global VEGETATION Monitoring (Brussels Dec. 2008)
Land Use Land Cover

(1998-2008) 10 Years of Operational Global VEGETATION Monitoring (Brussels Dec. 2008)
Pixel Heterogeneity
1 km 1 km

(1998-2008) 10 Years of Operational Global VEGETATION Monitoring (Brussels Dec. 2008)
Estimating land use fractions πij in a Pixel
( ) ( ) )(3
1
ttytY ij
jiji επ +×=∑=
NDVI Profile knownfrom VGT Data
kownendmembersUnkown land
use fractions
( )[ ]∑=
=T
tii t
TRMSE
1
21 ε
land use fractions are estimated by minimising the RMS E pixel by pixel
0≥ijπ 13
1
=∑=j
ijπWith and
.

(1998-2008) 10 Years of Operational Global VEGETATION Monitoring (Brussels Dec. 2008)
Benhadj et al. 2008( ) ( ) )(3
1
ttytY ij
jiji επ +×=∑=
(1998-2008) 10 Years of Operational Global VEGETATION Monitoring (Brussels Dec. 2008)
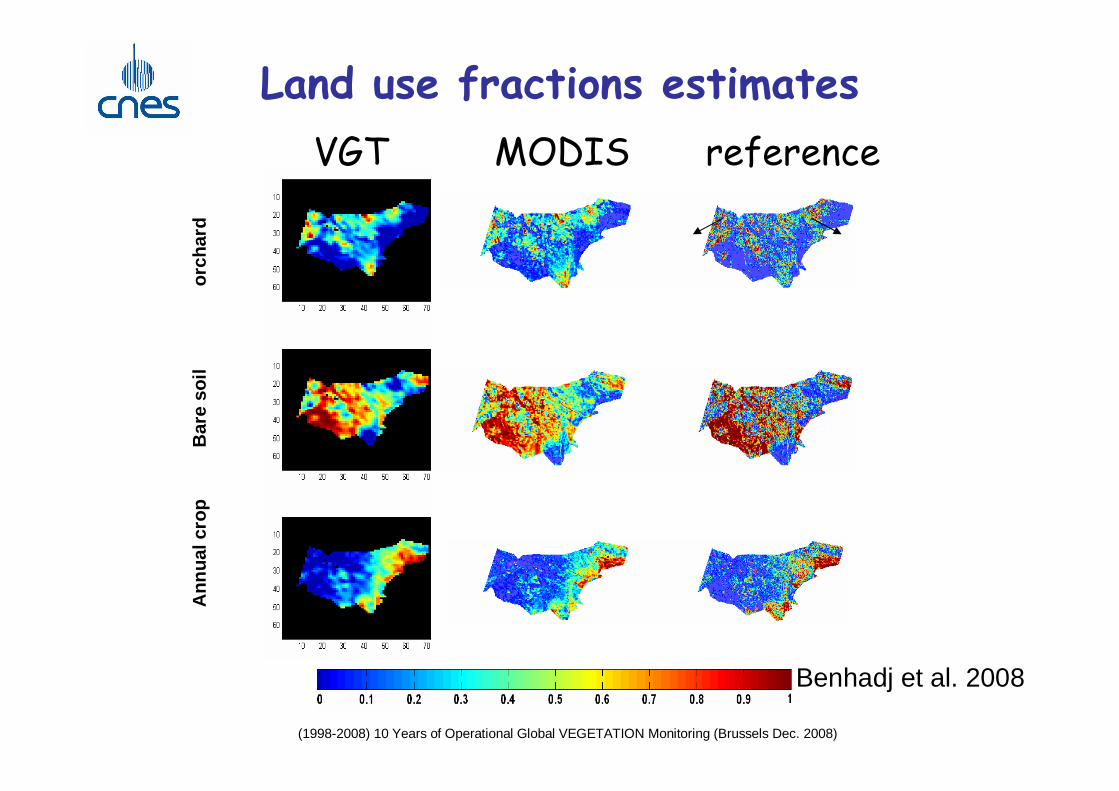
Land use fractions estimates
Ann
ualc
rop
Bar
eso
ilor
char
d
VGT MODIS reference
Benhadj et al. 2008

(1998-2008) 10 Years of Operational Global VEGETATION Monitoring (Brussels Dec. 2008)
(1998-2008) 10 Years of Operational Global VEGETATION Monitoring (Brussels Dec. 2008)
Conclusions•Thank to its qualities (calibration &processing ), the10year archive is a mine for time series analysis withregard to interannual variability: NAO, ENSO, climatechange,…
•SWIR is useful in LULC studies but it does also have interesting applications in snow and water stress monitoring ->VGT3.
•The km2 resolution (VGT1&2) can be a problem for cogeoregistration with other images (TM, HRVIR, MODIS,…) 300m would reduce this problem and makemore efficient the pixel unmixing methodologies thatappear .

(1998-2008) 10 Years of Operational Global VEGETATION Monitoring (Brussels Dec. 2008)
remarks –PROBA-V
•Interdate and interspectral staking: 300m uncertaintyrepresent 100% of the pixel
•Existing strategies for the processing of Directional andatmospheric effects do already exit, they could be takein intoaccount in the next ground segment.
•Synergie VGT+ something (S2, S3, ….other)

(1998-2008) 10 Years of Operational Global VEGETATION Monitoring (Brussels Dec. 2008)
Thank you

(1998-2008) 10 Years of Operational Global VEGETATION Monitoring (Brussels Dec. 2008)
0.740.810.5570.8100.8980.687R²
0.1270.1280.1410.1050.1210.113RMSE
% AnnualVeg.
%B. Soil%Ochard% AnnualVeg.
%B. Soil%Ochard
VEGETATIONMODIS
AND THE WINNER IS….