Embed Size (px)
Citation preview

Schoolnet Report Library
Schoolnet Instructional Management Suite

Released April 30, 2013
Document Owner: Curriculum
This edition applies to Release [14.4] of the Schoolnet software and to all subsequent releases and modifications until otherwise indicated in new editions or updates.
The data and names used to illustrate the reports and screen images may include names of individuals, companies, brands, and products. All of the data and names are fictitious; any similarities to actual names are entirely coincidental.
Schoolnet is a trademark, in the U.S. and/or other countries, of Pearson Education, Inc. or its affiliate(s).
Copyright © 2013 Pearson Education, Inc. or its affiliates. All rights reserved. All trademarks are either owned or licensed by Pearson Education, Inc. or its affiliates. Other brands and names are the property of their respective owners.
Please send comments, suggestions, or requests for this document to [email protected]. Your feedback is appreciated.

Schoolnet Report Library
Contents 3
Contents Introduction ........................................................................................................... 1
Planning ............................................................................................................ 1
Best Practices ..................................................................................................... 2
Published Report Categories ................................................................................. 3
Reporting On One Grade Level Across Schools ......................................................... 4
Enabling Multi-Select ........................................................................................... 4
Understanding the Components of a Report ............................................................ 5
Reports Available at the Classroom Level ................................................................ 6
Item Analysis ................................................................................................ 6
Standards Mastery ......................................................................................... 7
Trends .......................................................................................................... 8
Skills Analysis ................................................................................................ 8
Report Menu ........................................................................................................... 9
Attendance Reports ............................................................................................. 9
Attendance Data in an Analysis Spreadsheet ...................................................... 9
Average Daily Attendance ............................................................................. 10
Chronically Absent Students by Attendance Type .............................................. 11
Absences by Month and Grade Level ............................................................... 11
Benchmark Reports ........................................................................................... 13
Benchmark Dashboard: All Current Year Benchmarks ........................................ 13
Benchmark Key Performance Indicators .......................................................... 14
Benchmark Test Item Analysis ....................................................................... 15
Benchmark Item Analysis: Percent Correct by Item Type ................................... 17
Benchmark Item Analysis: Number of Items per Cognitive Domain ...................... 19
Benchmark Performance by Standard.............................................................. 20
Benchmark Performance by Subject ................................................................ 22
Benchmark Test Standards Analysis by Section Enrollment ................................ 24
Benchmark Test Score Group Analysis by Section ............................................. 26
Benchmark Test Standards Analysis by School Enrollment .................................. 27
Overall Benchmark Performance by School and Administration ........................... 28
Demographic Reports ........................................................................................ 29
Total Enrollment by Grade, Subgroup, or Teacher ............................................. 29
Demographic Overview ................................................................................. 29
Enrollment Per Class ..................................................................................... 34

Schoolnet Report Library
Contents 4
Discipline Reports ............................................................................................. 35
Disciplinary Infractions Report ....................................................................... 35
Disciplinary Response Report ......................................................................... 37
Grade/Mark Reports .......................................................................................... 38
Grade/Mark Analysis by Course Marking Period ................................................ 38
Department Section Marks by Semester .......................................................... 40
Grade/Mark Analysis Report: Section Marks by Teacher and Semester ................. 41
Grades by Student in an Analysis Spreadsheet ................................................. 42
Program Reports ............................................................................................... 43
Currently Enrolled Students in a Program ........................................................ 43
Program Enrollment Analysis Report ............................................................... 44
Standardized Test Reports .................................................................................. 45
Understanding How Test Structure Impacts Reporting Options ............................ 45
Standardized Test KPIs ................................................................................. 46
Standardized Test Performance Pre-Formatted Report Options ............................ 47
Standardized Test Results by Grade Level and Subject ...................................... 51
Subgroup Report - Stoplight .......................................................................... 56
Student Growth by Proficiency ....................................................................... 57
Analyzing Multiple Data Points ............................................................................ 58
Report by Student Across Multiple Data Points: Analysis Spreadsheet .................. 58
Grades for Students Who Performed Poorly on a Standardized Test ..................... 59
Multiple Measure Analysis by Section Enrollment .............................................. 60

Introduction
Copyright © 2013 Pearson Page 1
Introduction This document includes sample reports and planning strategies for building a robust report bank.
Planning Before you begin publishing reports, consider the following.
Topic Notes Collect current reports
To know which reports will be most useful, collect samples of commonly used reports that are currently being created and used offline. How closely can you replicate these reports in Schoolnet?
Report categories
As a system operator, confirm that report categories are set up appropriately (for details, see page 3).
Enable/ disable reports
Review the list of enabled pre-formatted reports. Either disable or set up any reports that are not yet configured or supported by available data, such as the multiple measures or stoplight reports.
Identify report managers
Determine who will be responsible for publishing reports. Will any school-level users have permission to publish reports? Assign user permissions accordingly. Create a custom user management role with the Manage Reports operation and assign all users who will publish reports to this role.
Report bank visibility
Decide if users at the school level can see report banks for other schools. If the “Allow users to see Report Banks for their own institutions” box is unchecked in System > School & District Data > Saved Reports, users will be able to select other institutions from a menu on the Report Bank tab. If this box is checked, that option will not appear, but those with permission to select multiple institutions from the KPI Dashboard tab can navigate to the desired school, then click the Report Bank tab, and they will see that institution’s report bank. Note that all School & District Data users can create and run most reports regardless of this configuration.
Set policies Determine what policies and data protocols should be established to encourage the use of these reports. Should you make using a data protocol an established part of grade-level, department, or principal meetings?
Create generic publishing accounts
If you publish a report, be aware that the name associated with your username will appear at the bottom of the report, both on your screen and in the PDF. Consider creating one generic user account for school reports and another for district reports. By creating generic user accounts, you can organize saved reports to be published more easily, and the “published by” name can be modified in My Accounts.

Introduction
Copyright © 2013 Pearson Page 2
Naming conventions
Develop naming conventions for reports. Document or post the naming conventions and share the information with people who publish reports. Decide if the school year, data type, or test name will appear first, keeping in mind that reports in the banks are listed in alphabetical order.
Create an update schedule
Set up an annual schedule for when the bank should be updated, such as when new test scores come out or when you need end-of-year summaries. Keep the report bank current to encourage users to revisit it throughout the year.
Best Practices Keep the following best practices in mind as you create and publish reports.
Use the Key Reports feature or associate published reports to KPIs, so users can find reports more easily
You can only publish each report once; if you want to attach the same report to both a math and reading KPI, create a separate report for each subject
The report description appears on PDFs; use the description to explain the purpose, cut scores, and so on
When appropriate, create reports using “most recent” rather than a certain school year or date to minimize the need to recreate new reports as time passes
Consider the implications of off-year test takers, if applicable
Include row or column totals when using percentages so users know the size of the student set
Use percentages when comparing the performance of disparate sets (over time, across schools)
Use the Description field to explain important aspects of the report, such as its purpose, the cut scores, and whether the report includes current students at the institution or total enrollment for a particular time period

Introduction
Copyright © 2013 Pearson Page 3
Avoid graphs if the number of standards or other data points makes the results unreadable
Use the school type filter where appropriate to avoid clogging high school banks with empty elementary data reports, and vice versa
Use the paging feature in both pre-formatted and custom reports to make “multiple
reports” in one and reduce the number of reports you have to publish
Published Report Categories By default, reports are grouped by category, so it is important to consider categories. System operators can make changes to the existing categories in System > School & District Data > Saved Reports. Changes apply throughout the site. “Uncategorized” is a system category that cannot be deleted. All reports are listed under Uncategorized unless a user specifies a category. Categories will not appear in the School & District Data report bank until at least one report has been published to the category.
Introduction
Copyright © 2013 Pearson Page 4
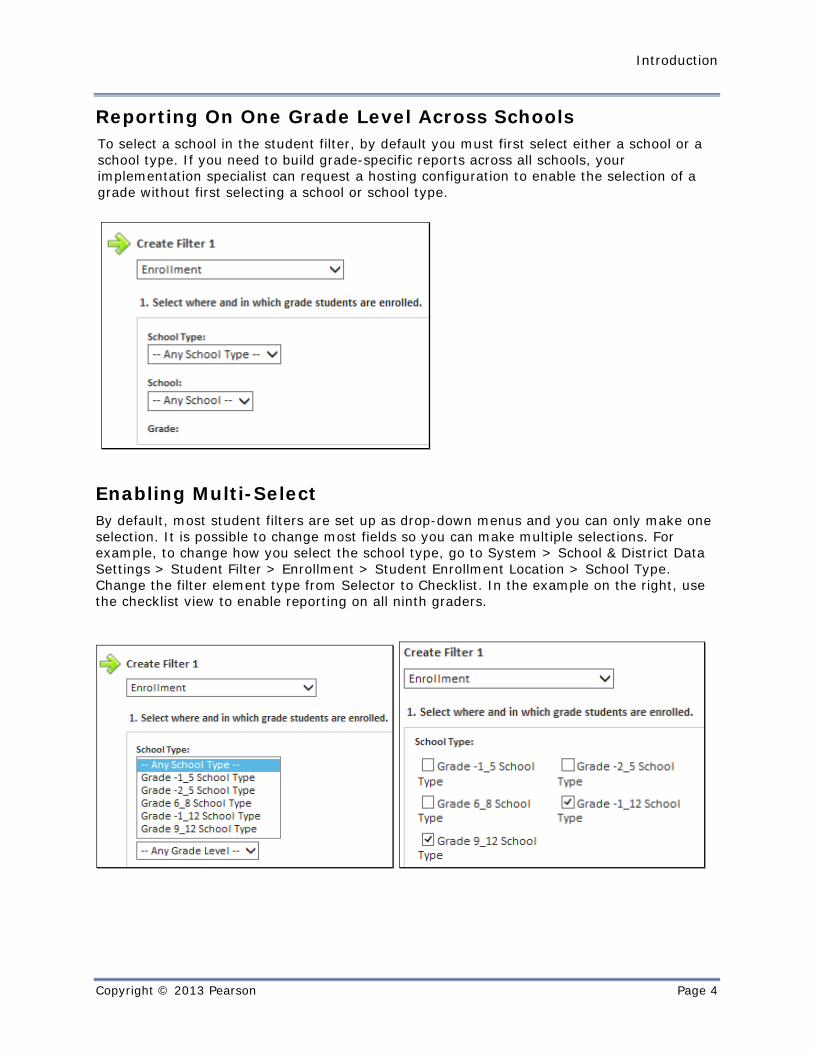
Reporting On One Grade Level Across Schools To select a school in the student filter, by default you must first select either a school or a school type. If you need to build grade-specific reports across all schools, your implementation specialist can request a hosting configuration to enable the selection of a grade without first selecting a school or school type.
Enabling Multi-Select By default, most student filters are set up as drop-down menus and you can only make one selection. It is possible to change most fields so you can make multiple selections. For example, to change how you select the school type, go to System > School & District Data Settings > Student Filter > Enrollment > Student Enrollment Location > School Type. Change the filter element type from Selector to Checklist. In the example on the right, use the checklist view to enable reporting on all ninth graders.

Introduction
Copyright © 2013 Pearson Page 5
Understanding the Components of a Report Two components make up a complete report: the who and the what.
The who is the student set – who do you want to know information about? The what is the data parameters – what data do you want to know?
For example, consider these two reports:
Who = Student Set What = Report Parameters
Report 1 Students who missed many days Performance on a math assessment
Report 2 Students who performed poorly on a math assessment
Attendance
While both of these are “attendance and math” reports, they provide different results. Many of the same students appear in both reports, but they answer different questions.
Student sets can be created and saved individually and paired with a report parameter, and vice versa. Put these two components together to create a complete report.
All pre-formatted reports are complete reports Analysis spreadsheets can be saved as complete reports or as report parameters
only Custom reports can be saved as complete reports or as report parameters only
Student Set + Report Parameters = Complete Report
To run a complete report from the report bank, the report is generated automatically when you click Run Report.
To run a student set or report parameter, you will add the missing component when you click Build Report.

Introduction
Copyright © 2013 Pearson Page 6
Reports Available at the Classroom Level In addition to the wealth of reports in School & District Data, administrators should be aware that there are several reports viewable by section in the Classrooms module that require little or no setup to run.
The easiest way to access benchmark and classroom tests for a teacher section is via the dashboards. They show at a glance how the section compared with the school and district, and access links to other reports.
Item Analysis The Classrooms Item Analysis report shows student-by-student results on a single assessment.

Introduction
Copyright © 2013 Pearson Page 7
Standards Mastery The benchmark and classroom tests Standards Mastery reports show the number of students per score group for each standard on one test.
The standardized test version of the same report is available on the Standards Mastery tab and shows the number of students per score group at the subject level (and at the section level, if available).

Introduction
Copyright © 2013 Pearson Page 8
Trends Use this report to compare up to six tests. It displays the percentage of students who were proficient on a standard.
Skills Analysis The Skills Analysis report can be run for one test or year to date for benchmark or classroom tests. It displays the percentage correct per standard by student.

Report Menu
Copyright © 2013 Pearson Page 9
Report Menu The report menu is organized by the type of date they display. The example reports shown in this document are for demonstration purposes only; your test names, score groups, and other data will vary.
Attendance Reports The following report formats support attendance data:
Attendance KPIs – Average Daily Attendance (two versions are available), Student Chronically Absent, and Attendance Anomaly Index
Analysis spreadsheet
Custom reports – display the number of absences per month, or number of absences for defined student sets (the attendance rate, found in attendance KPIs, is not a metric that is available in custom reporting)
Attendance Data in an Analysis Spreadsheet Format: Analysis spreadsheet (report parameters only or a complete report)
Suggested Student Set: Any
Description: For any list of students, display columns for the attendance rate (or total number of days absent) and the number of absences by type for the most recent student enrollment. To view a year total for a transfer student, click the name on the spreadsheet to view the Student Profile overview.

Report Menu
Copyright © 2013 Pearson Page 10
Average Daily Attendance Format: Average daily attendance KPI detail screen (it is the default report if the KPI is enabled)
Available Student Sets: Currently enrolled students at the district, school, teacher, section, grade level, subgroup, or combination of these filters
Description: Average daily attendance by school, teacher, grade level, or subgroup. There are two average daily attendance KPIs:
Average daily attendance (year to date) - this KPI uses a student’s year-to-date attendance records, including attendance data from another school attended during the current school year
Average daily attendance for currently enrolled students (last enrollment) – this KPI uses attendance data only from the currently enrolled school

Report Menu
Copyright © 2013 Pearson Page 11
Chronically Absent Students by Attendance Type Format: Custom > Number of Attendance Events > Table
Suggested Student Set: Current students at the school
Suggested KPI: Students chronically absent (%)
Description: For students with at least “x” number of total attendance events, view the number of students missing at least one day per attendance type. To see the total number of days absent by student, click the student number to view students in an analysis spreadsheet that includes attendance as a column. In the example below, 145 of currently enrolled 6th graders missed at least five days of school; of those students, 104 had at least one unverified absence.
Absences by Month and Grade Level Format: Custom Report > Dates of Attendance Events > Table
Suggested Student Set: Total enrollment at the district or school
Suggested KPI: Average Daily Attendance
Description: View trends in absence types over time.
Note: There is a field called “School Year Month” in the list of fields available within the “Dates of Attendance Events” custom report type. This field is disabled on many sites. To enable it, ask your system operator to go to System > School & District Data > Reports >

Report Menu
Copyright © 2013 Pearson Page 12
Dates of Attendance Events > School Year Month > Enable. This field also appears in the “Dates of Discipline Events” reports.
When building your report, be sure to select only the event types you want to report on, and choose to view the data as “Number of Attendance Events” rather than “Student Count” (with Student Count, you’ll see the total number of absences per month, counting chronically absent students each time they were absent in the month, rather than just once). There is a useful option to select all school days to date for current school year. Variation Options: Paging by absence type or replacing grade level with gender

Report Menu
Copyright © 2013 Pearson Page 13
Benchmark Reports All benchmark reports can be filtered by test category. Note that the two new items types, matching and inline response, are not currently supported in School & District Data reports.
Benchmark Dashboard: All Current Year Benchmarks Format: Benchmark Dashboard
Available Student Sets: Current students at the district or school
Description: Use to view all current-year benchmark tests. Filter or sort by any column. View the test details to access reports (the list is configurable using the link at the bottom right of the page). Any report that includes one institution and test administration does not need to be published in the report bank because it can be made available from this screen.
Can be configured to Percent Proficient
Link to pre-formatted and custom reports using the Configure Dashboard link

Report Menu
Copyright © 2013 Pearson Page 14
Benchmark Key Performance Indicators Format: Percent proficient on most recent benchmark KPI detail screen
Available Student Sets: Currently enrolled students at the district, school, teacher, section, grade level, subgroup, or combination of these filters
Description: There is one KPI for each core subject. They are calculated as the percentage of students who met or exceeded a district-defined level of proficiency on the most recent district-wide benchmark test. The calculation is (Number of students who scored proficient or above on the most recent math district-wide benchmark test) / (total number of students who took the most recent math district-wide benchmark test during the current school year)
Note: The benchmark start date is an important consideration when there are multiple assessments for the same grade level and topic. For example, if there is both an algebra and geometry benchmark test taken by ninth graders in October, make the start date match so results for both tests will appear in the math KPI. It doesn’t matter if the students actually take the test on that day.

Report Menu
Copyright © 2013 Pearson Page 15
Benchmark Test Item Analysis Format: Pre-Formatted > Benchmark Test Item Analysis
Available Student Sets: Currently enrolled students at an institution. If run from Pre-Formatted Reports instead of the Benchmark Dashboard, total enrollment in a specified date range is also supported.
Description: Use this report to analyze how students answered each question on a benchmark test. Identify individual questions where students struggled. Click the item to see the exact question on the test, if the data is loaded into Schoolnet. You will also see the associated standard.
Note: Do not publish this report because it is already a default report on the Benchmark Dashboard.

Report Menu
Copyright © 2013 Pearson Page 16
Below the report, find the standards aligned to each item.
Click View in the report to see the item details.

Report Menu
Copyright © 2013 Pearson Page 17
Below are additional fields on the Item Detail screen.
Benchmark Item Analysis: Percent Correct by Item Type Format: Custom > Benchmark Item Analysis
Suggested Student Set: Any
Description: When you want an item analysis for a subgroup or item type, use a custom report instead of a pre-formatted report.
Note: The report will not indicate the correct answer; only how many students selected each choice. When viewing custom item analysis reports, be sure to have a copy of the assessment available for reference. For a variation, change the result type to Percent Answering Correctly.
Option #1: Percent Correct By Item Type In this example, the average percentage correct of all items per type is aggregated. Paging on administration provides the opportunity to use the same report for any test. Cognitive domain could replace item type if the questions are tagged with this metadata.

Report Menu
Copyright © 2013 Pearson Page 18
Option #2: Percent Correct by Item, Grouped by Type
In this example, the percentage of row for student count indicates what percentage of students got each item correct (yes). The items are grouped by item type.

Report Menu
Copyright © 2013 Pearson Page 19
Benchmark Item Analysis: Number of Items per Cognitive Domain Format: Custom > Benchmark Item Analysis
Suggested Student Set: Any
Description: For each test, view the number of items per each level of Bloom’s Taxonomy, Gardiner, or other criteria. For a variation on this report, change the result type to Percent Answering Correctly to see how students performed, not counting open response items.

Report Menu
Copyright © 2013 Pearson Page 20
Benchmark Performance by Standard Format: Pre-Formatted > Benchmark Performance by Standard
Available Student Set: Current or total enrollment at the district or school
Suggested KPI: Most recent [subject] benchmark test (%proficient), if reporting across multiple administrations and filtering on one subject
Description: This report displays percentage per score group on benchmark assessments by standard and test administration. In the example below, the student set is current students paged by grade level. The report displays standards and the tests on which each standard was covered. Compare standards across multiple assessments.
Note: Publish a report across all test administrations per subject to tie to the benchmark KPIs. No need to publish a report per administration because you’ll find this report on the Benchmark Dashboard.
Option #1: Table Paged by Grade Level for Current Middle School Students

Report Menu
Copyright © 2013 Pearson Page 21
Option #2: Graph
The number and length of standards determine if the graph view is a viable option.

Report Menu
Copyright © 2013 Pearson Page 22
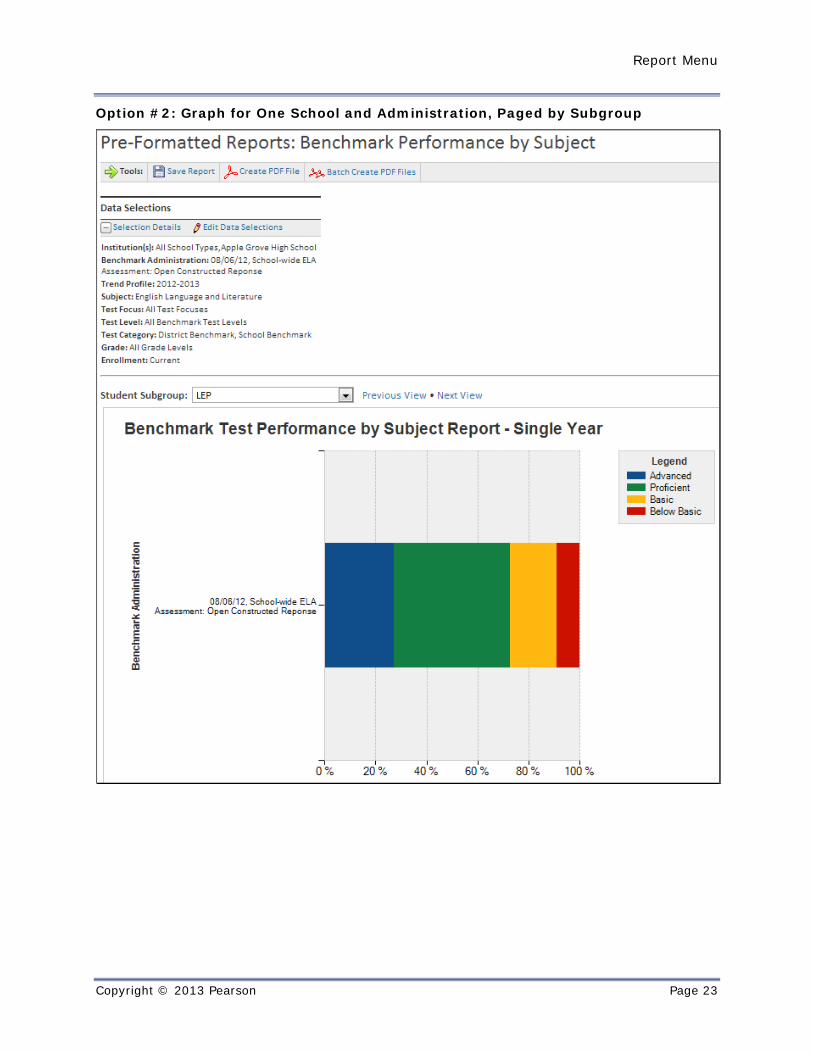
Benchmark Performance by Subject Format: Pre-Formatted > Benchmark Performance by Subject
Available Student Set: Current or total enrollment at the district or school, with the option to split out by student subgroup or grade level with the paging feature
Suggested KPI: Most recent [subject] benchmark test (%proficient), if reporting across multiple administrations and filtering on one subject
Description: Use this report to analyze student performance on benchmark assessments by subject. View results for all subjects in one report, or create a different report for each subject if associating with a KPI.
Option #1: Table Across All Subjects and Administrations at One School
Report Menu
Copyright © 2013 Pearson Page 23
Option #2: Graph for One School and Administration, Paged by Subgroup

Report Menu
Copyright © 2013 Pearson Page 24
Benchmark Test Standards Analysis by Section Enrollment Format: Pre-Formatted > Benchmark Standards Analysis by Section Enrollment
Suggested Student Set: Currently enrolled students at a school
Description: Use this report to see how students performed by standard on a benchmark test. Results are grouped by teacher within a school and also compared with results for the school and district. Use this report to compare the results of one test administration between courses, teachers, and sections. The standards included on the test appear at the bottom of the report.
Note: There is no need to publish this report because it is a default report on the Benchmark Dashboard. Due to the type of data needed, this report is not recommended for OMR or Assessment Partner (Acuity / Scantron / ETL) clients. For all other clients, tests must be correctly assigned to sections for the report to render correctly.
At the top of the report, find parameters and a performance comparison between the district and the school.

Report Menu
Copyright © 2013 Pearson Page 25
The main part of the report displays the percentage correct by course, teacher, and section. Results can be grouped at the standard (topic) or sub-standard (subtopic) level. Below the report, the items aligned to each standard appear and link to test content, if available.

Report Menu
Copyright © 2013 Pearson Page 26
Benchmark Test Score Group Analysis by Section Format: Pre-Formatted > Benchmark Score Group Analysis
Available Student Set: Current or total enrollment in one school or course within a school
Description: This report shows the percentage of students by score group for one benchmark test, as well as the average percentage correct and total percentage proficient. Use this report to compare results between the district, school, teacher, course, and section levels.
Note: Enable in the Benchmark Dashboard rather than publish this report in the report bank.
Report Menu
Copyright © 2013 Pearson Page 27
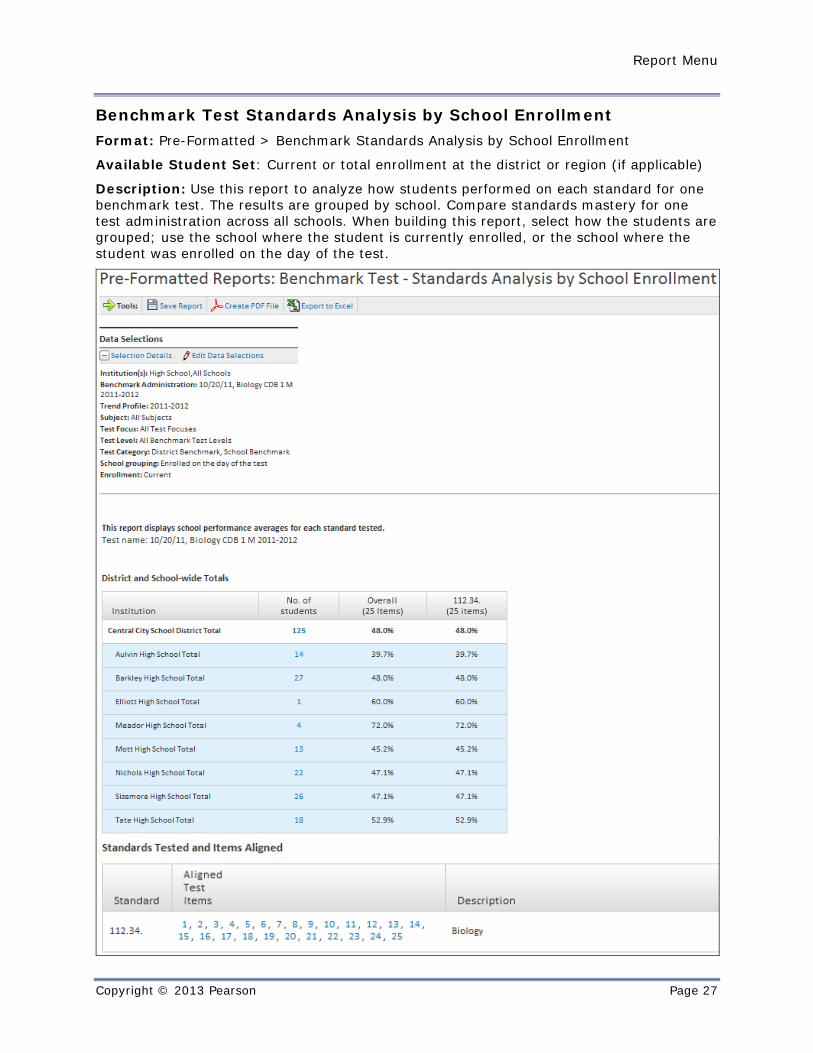
Benchmark Test Standards Analysis by School Enrollment Format: Pre-Formatted > Benchmark Standards Analysis by School Enrollment
Available Student Set: Current or total enrollment at the district or region (if applicable)
Description: Use this report to analyze how students performed on each standard for one benchmark test. The results are grouped by school. Compare standards mastery for one test administration across all schools. When building this report, select how the students are grouped; use the school where the student is currently enrolled, or the school where the student was enrolled on the day of the test.

Report Menu
Copyright © 2013 Pearson Page 28
Overall Benchmark Performance by School and Administration Format: Custom > Benchmark Performance by Subject
Suggested Student Set: Current or total enrollment at the district or region (if applicable)
Description: Use this report to see the percentage by score group per school and test administration. Row and column total would be a useful addition.

Report Menu
Copyright © 2013 Pearson Page 29
Demographic Reports There are a variety of demographic reports available in Schoolnet.
Total Enrollment by Grade, Subgroup, or Teacher Format: Total Enrollment KPI detail screen (it’s the default report if the KPI is enabled)
Available Student Sets: Currently enrolled students at the district, school, teacher, section, grade level, subgroup, or combination of these filters
Description: Currently enrolled students. Filter by teacher, grade level, and subgroup.
Demographic Overview Format: Pre-Formatted > Demographic Overview
Suggested Student Sets: Current students at the district or school (use total enrollment instead if reporting across multiple years)
Suggested KPI: Total Enrollment
Description: On this report, find a summary analysis of current-student demographic data by gender, race, ethnicity, program enrollment, and grade. This report can also be run for all school years to identify enrollment trends.

Report Menu
Copyright © 2013 Pearson Page 30
Option #1: Demographic Overview, Current Enrollment Graph This report includes a set of pie charts and bar charts for a school, school type, region (if applicable), or district.

Report Menu
Copyright © 2013 Pearson Page 31

Report Menu
Copyright © 2013 Pearson Page 32
Report Menu
Copyright © 2013 Pearson Page 33
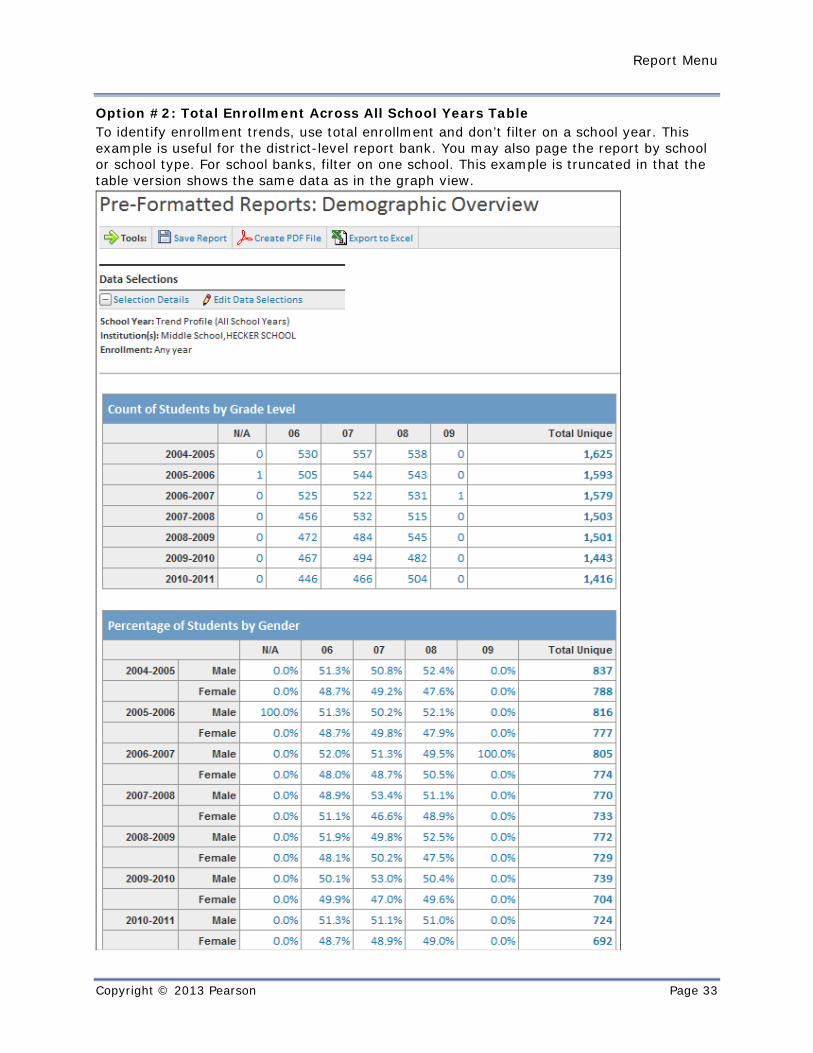
Option #2: Total Enrollment Across All School Years Table To identify enrollment trends, use total enrollment and don’t filter on a school year. This example is useful for the district-level report bank. You may also page the report by school or school type. For school banks, filter on one school. This example is truncated in that the table version shows the same data as in the graph view.

Report Menu
Copyright © 2013 Pearson Page 34
Enrollment Per Class Format: Custom > Section Enrollment Analysis
Suggested Student Set: School or grade level at a school
Description: View the number of students by gender in each class in a school. Filtering or paging on a department or grade level is optional.
Report Menu
Copyright © 2013 Pearson Page 35
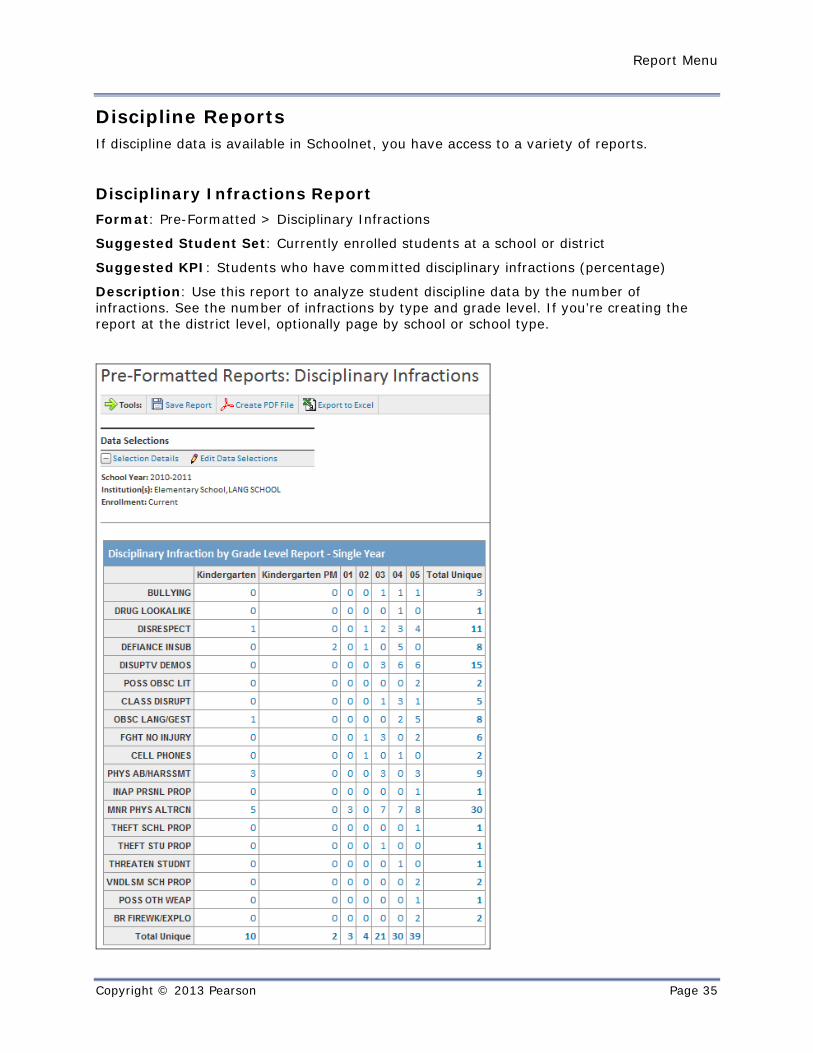
Discipline Reports If discipline data is available in Schoolnet, you have access to a variety of reports.
Disciplinary Infractions Report Format: Pre-Formatted > Disciplinary Infractions
Suggested Student Set: Currently enrolled students at a school or district
Suggested KPI: Students who have committed disciplinary infractions (percentage)
Description: Use this report to analyze student discipline data by the number of infractions. See the number of infractions by type and grade level. If you’re creating the report at the district level, optionally page by school or school type.

Report Menu
Copyright © 2013 Pearson Page 36
Here is the same report in graph format:

Report Menu
Copyright © 2013 Pearson Page 37
Disciplinary Response Report Format: Pre-Formatted > Disciplinary Responses
Suggested Student Set: Currently enrolled students at a school or district
Suggested KPI: Students who have been suspended (%). Keep in mind that only infractions selected in the system configuration are included in the calculation.
Description: Use this report to analyze student discipline data by responses. See the type and number of responses to infractions, by grade level. Choose a table or graph format for this report.

Report Menu
Copyright © 2013 Pearson Page 38
Grade/Mark Reports Run grade/mark reports for any student set, including students in selected courses or sections. Use the Course / Section Lists to select students enrolled in specific courses or sections, such as advanced placement classes, classes taught by first-year teachers, etc.
Grade/Mark Analysis by Course Marking Period Format: Custom > Grade/Mark Analysis
Suggested Student Set: Total enrollment at a school, department, or grade level
Description: Compare how grades are being assigned per marking period by course and teacher.
Tips:
Select section marks (A,B,C,D,F) to avoid N/A column Always display a term (marking period) to avoid grouping marks from more than one
marking period together Page by school type to group like marks together (when reporting for a district)

Report Menu
Copyright © 2013 Pearson Page 39
In this version, use percentage of row to compare teachers with different numbers of students.

Report Menu
Copyright © 2013 Pearson Page 40
Department Section Marks by Semester Format: Custom > Grade/Mark Analysis
Description: View the overall grade distribution for a department, by marking period. You may also page by teacher or course.

Report Menu
Copyright © 2013 Pearson Page 41
Grade/Mark Analysis Report: Section Marks by Teacher and Semester Format: Custom > Grade/Mark Analysis
Description: This report is a custom graph showing overall grade/mark analysis per teacher over time. View the overall grade distribution for a department by teacher and compare grades by grading cycle. In this example, grades are shown as a percentage of the total for that teacher.

Report Menu
Copyright © 2013 Pearson Page 42
Grades by Student in an Analysis Spreadsheet Format: Analysis spreadsheet
Suggested Student Set: Use students in one school and grade level and filter for students who did not perform well on a standardized assessment.
Description: The analysis spreadsheet can contain marks for students within the same school and grade level for any marking period. You may want to pair this column with standardized test performance data for a corresponding subject and timeframe. If you’re filtering by department rather than by course, students who take multiple courses in that department will only show a grade for one course. You can also add the section teacher as another column.

Report Menu
Copyright © 2013 Pearson Page 43
Program Reports If you want to group students for reporting on a filter not currently available in Schoolnet, flag the students in the source data with a program. After the next refresh of data from the SIS to Schoolnet it is possible to filter by program enrollment to report on these students. Examples of programs include retained students, not Special Ed, home language, extended day, bus rider, etc.
Currently Enrolled Students in a Program Format: Custom > Define Student Set
Description: A set of students in a particular program. Make this student set available in the report bank to add to analysis spreadsheets and custom reports published without a student set.
Suggested Filters: Currently enrolled special education, LEP, or a grade level at a school

Report Menu
Copyright © 2013 Pearson Page 44
Program Enrollment Analysis Report Format: Custom > Program Enrollment Analysis
Suggested Student Set: Currently enrolled students at a school or district
Description: See the number of students by program name. This is an easy way to ‘create’ multiple student sets at once. By running this report and clicking a cell, view the names of students in any program, or view those students in analysis spreadsheets saved or published without student sets.

Report Menu
Copyright © 2013 Pearson Page 45
Standardized Test Reports There are a variety of reports available to support the analysis of student performance data on standardized tests.
Understanding How Test Structure Impacts Reporting Options Before creating a standardized test report, understand how the test is structured. The easiest way to determine this is to look at the test details in a student’s profile.
For the test in the first example, aggregate reporting is only possible at the subject level. It is not possible to display the number of students per score group in a custom or pre-formatted report for a section, such as comprehension. As an alternative, you can create an analysis spreadsheet and add percentage correct as a column for the sub-sections. To support aggregate reporting it would be necessary to load a performance level in the source data. If the test results do not provide a score group it is possible to calculate one based on percentage correct, such as quartiles, for example.
For this test, aggregate reporting is available at both the subject and sub-section level.

Report Menu
Copyright © 2013 Pearson Page 46
Standardized Test KPIs Format: KPI detail page
Available Student Sets: Currently enrolled students at the district, school, teacher, section, grade level, subgroup, or combination of these filters
Description: For each subject, you see the percentage of currently enrolled students who met or exceeded a state-defined level of proficiency on a defined assessment. Because test results typically pointing to the prior spring, the teacher view often does not show which teacher the students tested with. Note that all teachers in the school view are listed, not just the ones who teach the KPI subject or who taught the students when they were tested. In the example below, Mr. Norman Bush is the science teacher, and this report says that 78.8% of his students were proficient in math on their latest high-stakes assessment.

Report Menu
Copyright © 2013 Pearson Page 47
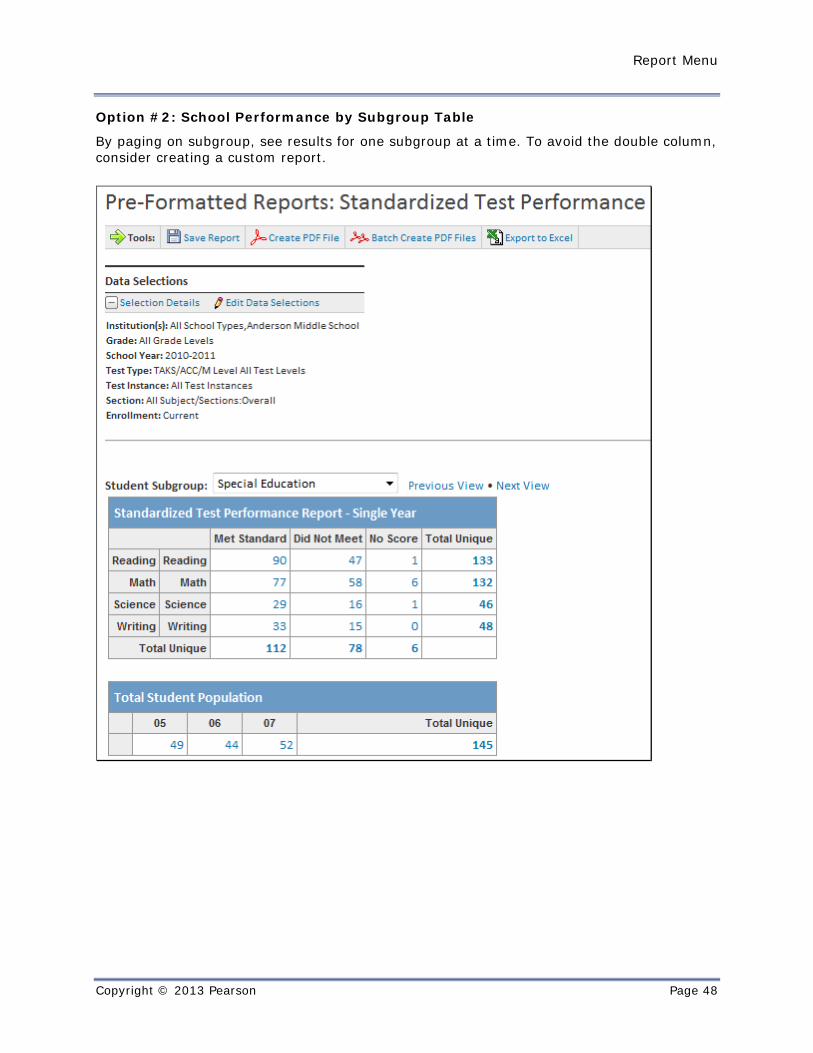
Standardized Test Performance Pre-Formatted Report Options Format: Pre-Formatted > Standardized Test Performance
Available Student Sets: Current or total enrollment at the school, district, or grade level
Description: Use this report to analyze subject- or topic-level student performance on standardized tests. Compare performance results by subject, or by section within a subject. The total student population table below the report provides a way to gauge test participation. The results are for specified students, regardless of where they tested. To view results for students who tested at your school only, change the Enrollment filter to the appropriate test date range.
Note: To attach this report to the Standardized Test KPI, create a separate report for each subject. If students are allowed to retake the test in the same test year, all administrations will be included in this report, so consider using a custom report instead.
Option #1: District Performance Bar Chart
Report Menu
Copyright © 2013 Pearson Page 48
Option #2: School Performance by Subgroup Table
By paging on subgroup, see results for one subgroup at a time. To avoid the double column, consider creating a custom report.

Report Menu
Copyright © 2013 Pearson Page 49
Option #3: School Performance for One Subject by Sub-section
Filter by subject and change “overall” to “all sub-sections,” and the report lists topic-level results. Consider attaching this report to each subject KPI.

Report Menu
Copyright © 2013 Pearson Page 50
Option #4: School Performance for One Subject by Sub-section
In this version, the report shows one subject at the sub-topic level for all students enrolled at a school. The grade level indicates the grade level of the student when he or she took the test.

Report Menu
Copyright © 2013 Pearson Page 51
Standardized Test Results by Grade Level and Subject Format: Custom > Standardized Test Analysis
Suggested Student Set: Current students at a school, region, or district
Description: View most recent test results by test year, grade level, and subject. Identify which subject was most challenging for students at a certain grade level.
Swap the main row and sub-rows to compare grade levels by subject.

Report Menu
Copyright © 2013 Pearson Page 52
Standardized Test Results Over Time
Format: Custom > Standardized Test Analysis
A variety of standardized test custom report options are available to show results over time. Consider the following:
Do you want to compare a specific grade level over time or the performance of a grade cohort of students over past grade levels?
For example, determine how fifth graders performed over time versus how current fifth graders performed compared to when they were third and fourth graders?
How will you deal with results for retained and off-year test takers?
Consider how using the grade level of the student versus the test level will change the results.
To compare more effectively, and assuming “score group” is used for the columns, use percent per row instead of value when row totals vary substantially
For each school report, decide which you prefer: results for all students you have now, or restricting results to only those students who tested at the school
Option #1: Performance Over Time by Grade Level for One Subject
Suggested Student Set: Total student enrollment at the district
Description: Use this report to compare performance over time within a grade level. In this example, the report shows that throughout the district, the percentage of fifth-grade students in the “did not meet” score group has decreased slightly over time.

Report Menu
Copyright © 2013 Pearson Page 53
Option 2: Currently Enrolled Students’ Test Results Over Time
Suggested Student Set: Currently enrolled students at a school
Description: Students who currently attend a school and how they performed over time, regardless of the test school. Use this report to view the results of a grade cohort over time. In this example, of the current eighth graders, 5.4% performed below basic in math on their prior spring assessment, up from 4.3% the year before. Including row totals makes it more obvious that the one result for an eighth grader was most likely retained. You can also restrict the report to students who tested at the school.

Report Menu
Copyright © 2013 Pearson Page 54
Option #3: Line Chart of School Results Over Time
Suggested Student Set: Total enrollment (due to additional report parameters, only students who tested at the school will appear on this report)
Description: Find the percentage per score group by subject for students tested at the school each year. In this example, reading performance at the school has declined over time.

Report Menu
Copyright © 2013 Pearson Page 55
Option #4: Stacked Bar Format
Here is the same report in a stacked bar format.

Report Menu
Copyright © 2013 Pearson Page 56
Subgroup Report - Stoplight Format: Pre-Formatted > Subgroup Report Stoplight
Suggested Student Set: Current students at a school
Description: Using specified test and yearly target goals, the stoplight reports show a visual indicator of which student subgroups met proficiency. Do not enable this report unless test definitions, subgroups, and AYP goals are configured. Yellow areas of concern icons indicate groups that met the goal, but by a narrow, specified margin. Gray cells indicate groups that performed below the minimum threshold for evaluation.
Three other related pre-formatted reports use the same logic and configurations: District Overview – Stoplight School List Report – Stoplight Grade Level Report - Stoplight

Report Menu
Copyright © 2013 Pearson Page 57
Student Growth by Proficiency Format: Pre-Formatted > Student Growth by Proficiency
Suggested Student Set: Current students at a school
Description: Use this report to compare students’ relative proximity to proficiency on their most recent standardized test compared with the prior year. The School Growth by Proficiency report displays schools instead of students. These two growth reports have the same configurations as the stoplight reports described earlier. However, two years of test results and definitions is needed to support the growth reports.

Report Menu
Copyright © 2013 Pearson Page 58
Analyzing Multiple Data Points There are a variety of reports that support analysis of data across multiple types of data.
Report by Student Across Multiple Data Points: Analysis Spreadsheet Format: Analysis spreadsheet, which is available in School & District Data and Classrooms. Publish this report with a student set, or publish as “report parameters only” if a number of student sets are published in the same report bank. Only spreadsheets published as “report parameters only” will appear for teachers in Classrooms.
Suggested Student Sets: For most uses, include no more than about 200 to 300 students per spreadsheet, such as students in a grade level, special education students, LEP students, students with x number of absences, students who performed poorly on an assessment, etc.
Description: Students are listed in the first column with up to 25 additional columns of data. Analysis spreadsheet is the report format to use if individual student names should appear in the report, or if data from multiple categories (such as benchmark, attendance, and grades) should appear together.
Note: Before publishing this report, modify the column names as needed by clicking the pencil (edit) icon.

Report Menu
Copyright © 2013 Pearson Page 59
Grades for Students Who Performed Poorly on a Standardized Test Format: Custom Report > Grade/Mark Analysis
Suggested Student Set: Students who were not proficient on a standardized test subject
Description: Use this report to see which students performed poorly on a test, and to view the grade distribution for classes with the correponding subject and time frame.

Report Menu
Copyright © 2013 Pearson Page 60
Multiple Measure Analysis by Section Enrollment Format: Pre-Formatted > Multiple Measure Analysis by Section Enrollment
Suggested Student Set: Current students at a school, region, or district
Description: Use this report to compare a standardized test, benchmark test, and average classroom grades by course and teacher in a school. Note: Setup is required to enable this report. A system operator sets up marking categories to support the calculation of average grades, and associates courses with a mark category in the Courses table.