Embed Size (px)
Citation preview

An Evaluation of the Effectiveness ofAn Evaluation of the Effectiveness ofSchool Zone FlashersSchool Zone Flashers
Carrie Simpson, PECarrie Simpson, PE
Prepared By:Prepared By:Safety Evaluation GroupSafety Evaluation GroupNCDOT Traffic EngineeringNCDOT Traffic Engineering
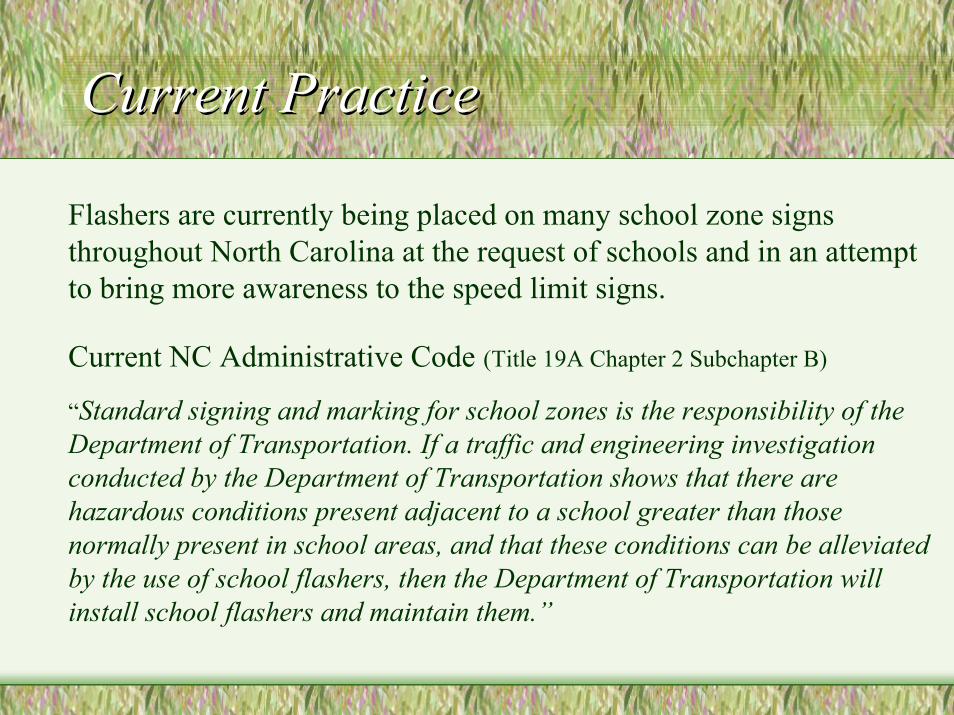
Current PracticeCurrent Practice
Flashers are currently being placed on many school zone signsthroughout North Carolina at the request of schools and in an attemptto bring more awareness to the speed limit signs.
Current NC Administrative Code (Title 19A Chapter 2 Subchapter B)
“Standard signing and marking for school zones is the responsibility of theDepartment of Transportation. If a traffic and engineering investigationconducted by the Department of Transportation shows that there arehazardous conditions present adjacent to a school greater than thosenormally present in school areas, and that these conditions can be alleviatedby the use of school flashers, then the Department of Transportation willinstall school flashers and maintain them.”
Report ObjectivesReport Objectives
This report summarized the effectiveness of placing flashers on schoolzone speed limit signs to improve speed compliance in school zones
Our objectives were to:• Determine if flashers located in reduced speed school zones decrease
speeds and increase speed compliance when compared to reducedspeed school zones without flashers.
• Examine differences in vehicle speeds and compliance rates in schoolzones during reduced speed school zone hours of operation (schooltime) versus hours outside the reduced speed school zone hours ofoperation (non-school time).
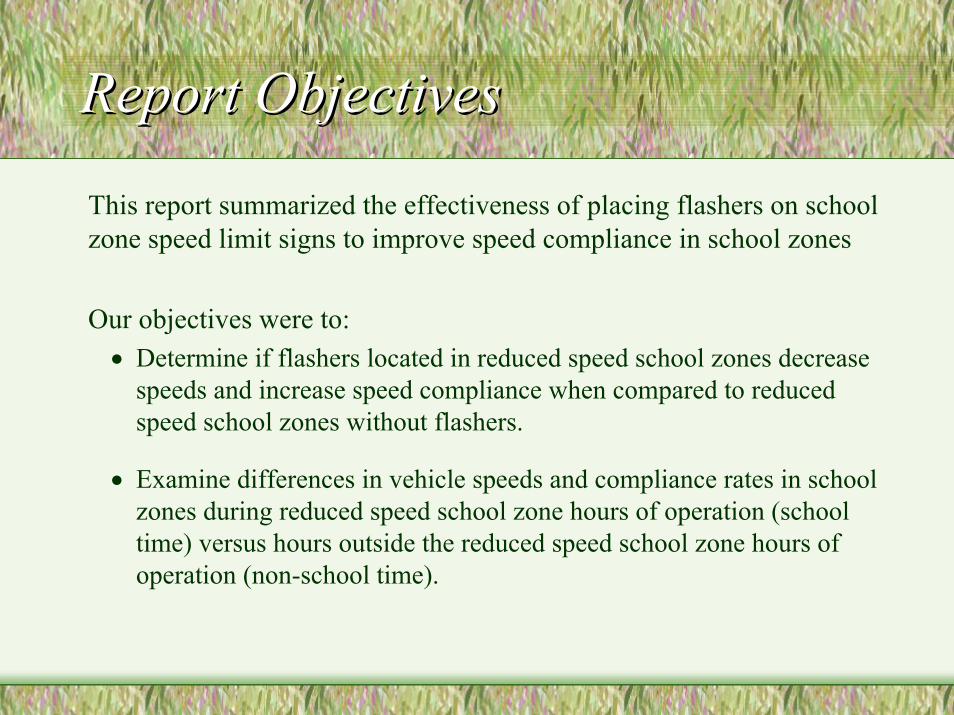
Sign and Flasher AssembliesSign and Flasher Assemblies All treatment sites contained dual flashers that were either mounted on a pole on
the side of the roadway (11 sites) or on span wire above the roadway (4 sites).
Western Alamance High Pleasant Garden Elementary
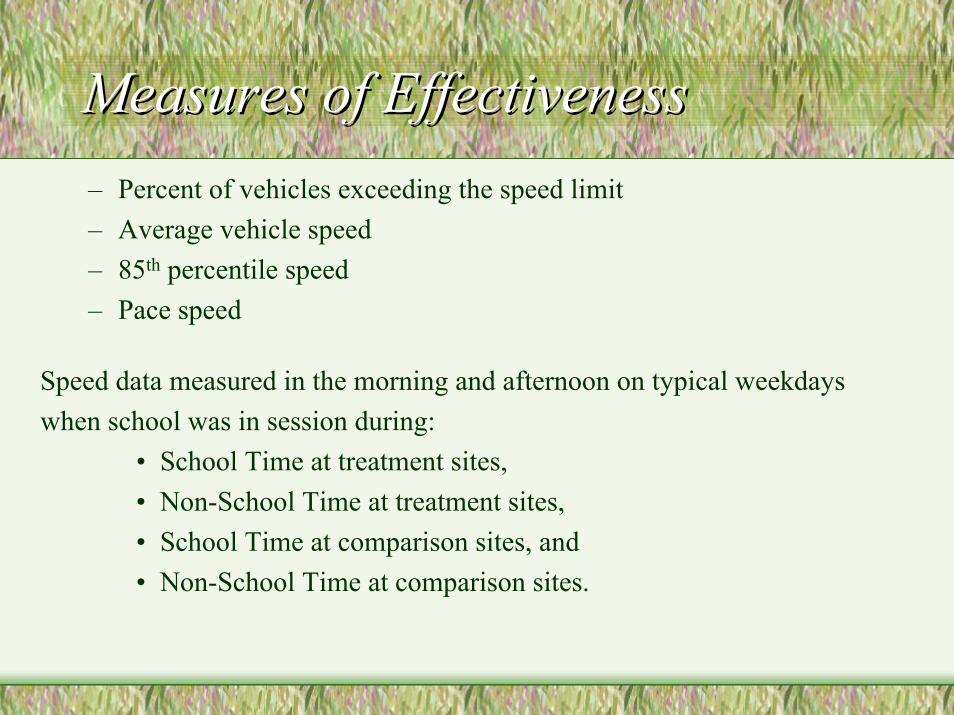
Measures of EffectivenessMeasures of Effectiveness– Percent of vehicles exceeding the speed limit– Average vehicle speed– 85th percentile speed– Pace speed
Speed data measured in the morning and afternoon on typical weekdayswhen school was in session during:
• School Time at treatment sites,• Non-School Time at treatment sites,• School Time at comparison sites, and• Non-School Time at comparison sites.
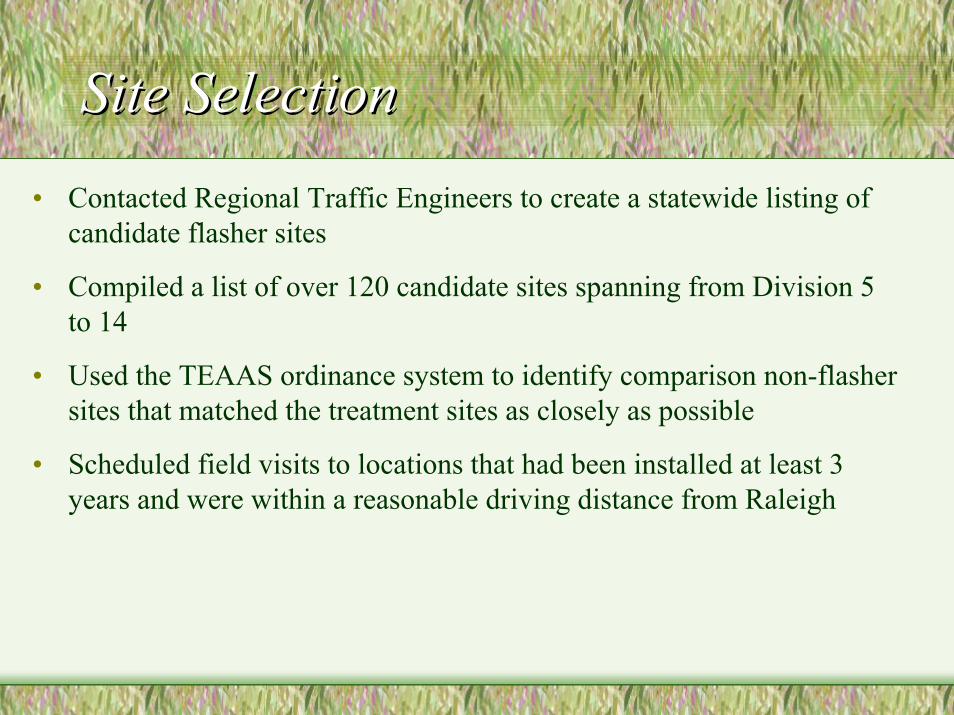
Site SelectionSite Selection• Contacted Regional Traffic Engineers to create a statewide listing of
candidate flasher sites
• Compiled a list of over 120 candidate sites spanning from Division 5to 14
• Used the TEAAS ordinance system to identify comparison non-flashersites that matched the treatment sites as closely as possible
• Scheduled field visits to locations that had been installed at least 3years and were within a reasonable driving distance from Raleigh
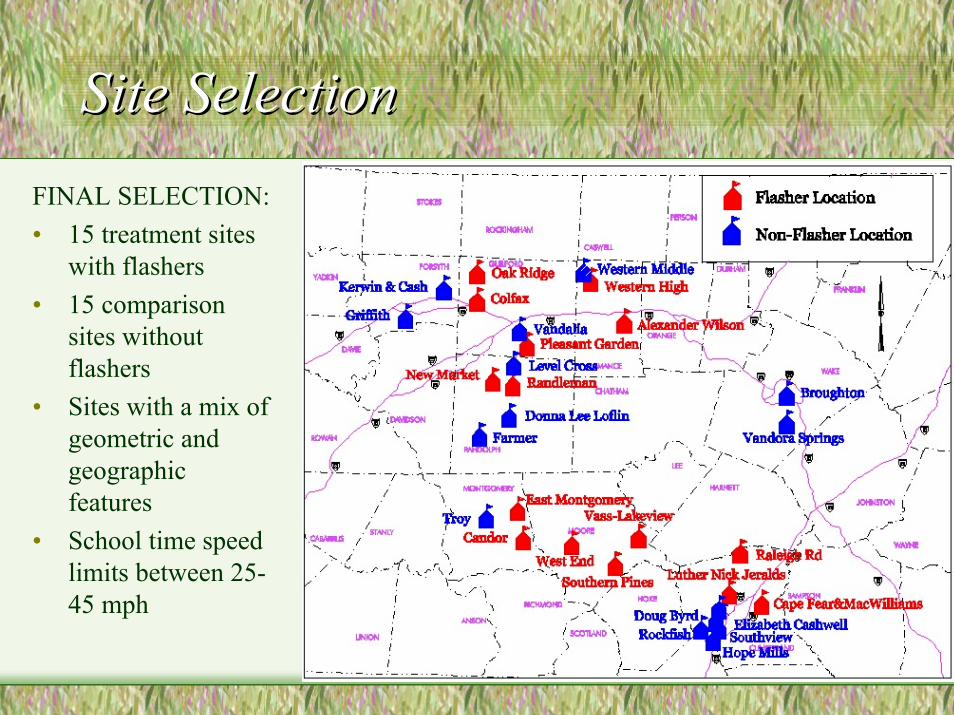
Site SelectionSite SelectionFINAL SELECTION:• 15 treatment sites
with flashers• 15 comparison
sites withoutflashers
• Sites with a mix ofgeometric andgeographicfeatures
• School time speedlimits between 25-45 mph
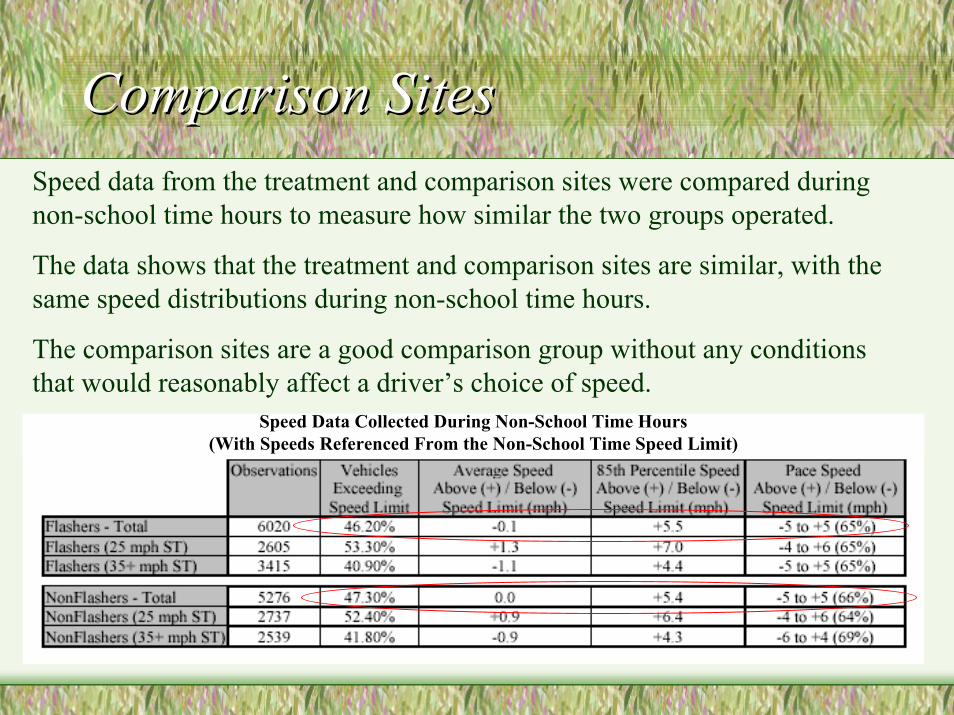
Comparison SitesComparison SitesSpeed data from the treatment and comparison sites were compared duringnon-school time hours to measure how similar the two groups operated.
The data shows that the treatment and comparison sites are similar, with thesame speed distributions during non-school time hours.
The comparison sites are a good comparison group without any conditionsthat would reasonably affect a driver’s choice of speed.
Speed Data Collected During Non-School Time Hours(With Speeds Referenced From the Non-School Time Speed Limit)
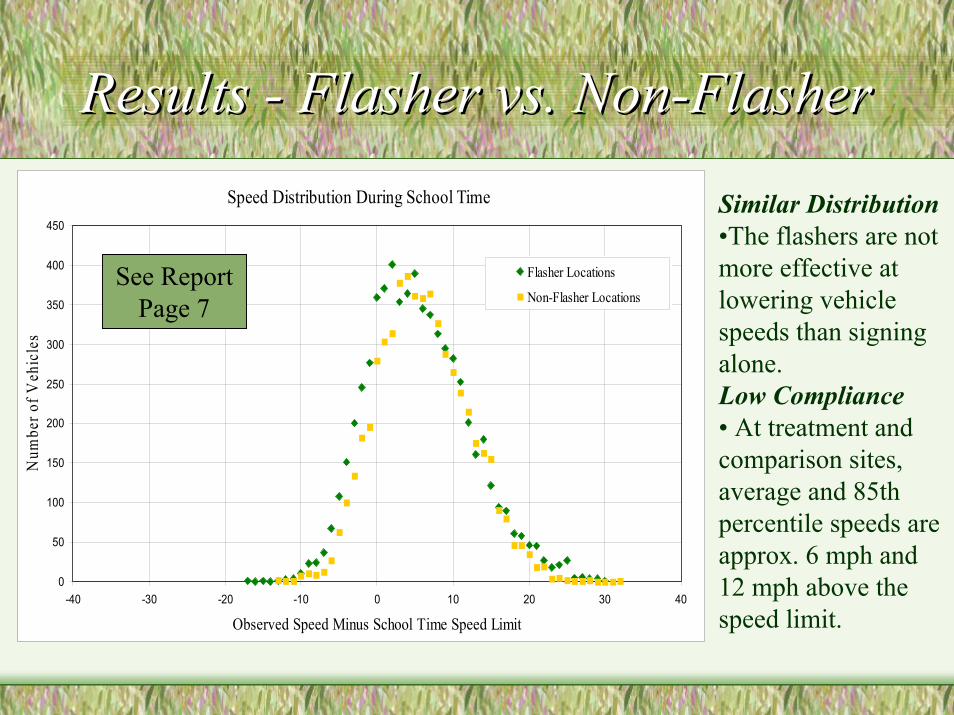
Results - Flasher vs. Non-FlasherResults - Flasher vs. Non-FlasherSpeed Distribution During School Time
0
50
100
150
200
250
300
350
400
450
-40 -30 -20 -10 0 10 20 30 40
Observed Speed Minus School Time Speed Limit
Num
ber o
f Veh
icle
s
Flasher Locations
Non-Flasher Locations
Similar Distribution•The flashers are notmore effective atlowering vehiclespeeds than signingalone.Low Compliance• At treatment andcomparison sites,average and 85thpercentile speeds areapprox. 6 mph and12 mph above thespeed limit.
See ReportPage 7
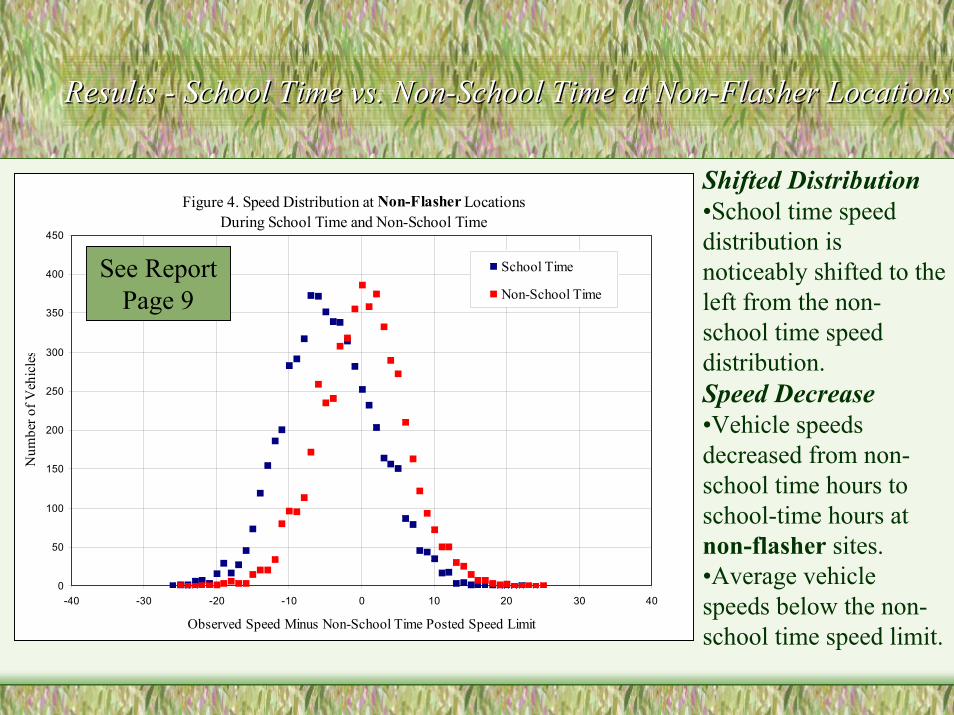
Results - School Time vs. Non-School Time at Non-Flasher LocationsResults - School Time vs. Non-School Time at Non-Flasher Locations
Shifted Distribution•School time speeddistribution isnoticeably shifted to theleft from the non-school time speeddistribution.Speed Decrease•Vehicle speedsdecreased from non-school time hours toschool-time hours atnon-flasher sites.•Average vehiclespeeds below the non-school time speed limit.
Figure 4. Speed Distribution at Non-Flasher LocationsDuring School Time and Non-School Time
0
50
100
150
200
250
300
350
400
450
-40 -30 -20 -10 0 10 20 30 40
Observed Speed Minus Non-School Time Posted Speed Limit
Num
ber o
f Veh
icle
s
School Time
Non-School TimeSee Report
Page 9
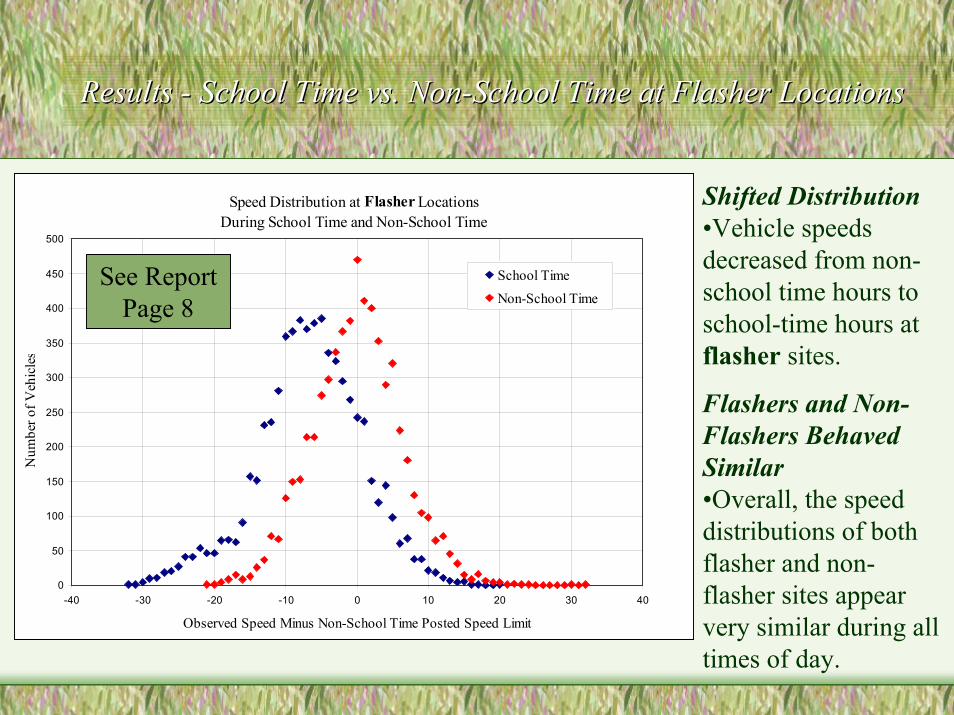
Results - School Time vs. Non-School Time at Flasher LocationsResults - School Time vs. Non-School Time at Flasher Locations
Speed Distribution at Flasher LocationsDuring School Time and Non-School Time
0
50
100
150
200
250
300
350
400
450
500
-40 -30 -20 -10 0 10 20 30 40
Observed Speed Minus Non-School Time Posted Speed Limit
Num
ber o
f Veh
icle
s
School Time Non-School Time
Shifted Distribution•Vehicle speedsdecreased from non-school time hours toschool-time hours atflasher sites.
Flashers and Non-Flashers BehavedSimilar•Overall, the speeddistributions of bothflasher and non-flasher sites appearvery similar during alltimes of day.
See ReportPage 8
Crash AnalysisCrash Analysis
• For completeness, analyzed crash rates at all sites using the mostrecent 3 years of reported crashes
• Due to small sample sizes difficult to draw conclusions from data
FINDINGS:• Crash rates were higher at flasher sites than non-flasher sites
during both school time hours and non-school time hours• At flasher and non-flasher sites, approximately 30 percent of
crashes are occurring during school time hours• No pedestrian crashes occurred during school time hours.
ConclusionsConclusions
• Flashers are not more effective at lowering speeds inschool zones than signing and pavement marking alone.
• Regardless of flasher presence, average speeds duringschool time were above the school time speed limit butbelow the non-school time speed limit. This indicates thatmotorists were making an effort to reduce their speedduring the school time, although the speed reductions werenot enough to bring them into compliance with the schooltime speed limit.

QUESTIONS?QUESTIONS?