Embed Size (px)
Citation preview

SCHOOL BOARD MEETINGAGENDA PACKET
FOR
April 11, 2017
THE SCHOOL BOARD OF HENDRY COUNTY,FLORIDA
Jon Basquin District 5Dwayne E. Brown, Vice Chairman District 1Sally Berg District 2Amanda Nelson District 3Stephanie Busin District 4
Paul K. Puletti, Superintendent

The mission of the Hendry County School District is to provide all students the opportunity to achieve at highacademic levels, equipping them to successfully pursue college or career goals.
Hendry County School BoardRegular Meeting
Tuesday, April 11, 20175.30 p.m.
School Board Sub-office, 475 E. Osceola Ave., Clewiston, FL
AGENDA ITEMS
1. CALL TO ORDER
2. INVOCATION AND PLEDGE
3. RECOGNITION - Jesus Almaraz-Argueta, CHS Student - 2016-17 Sunshine State ScholarAlternate
4. CITIZEN COMMENT ON AGENDA ITEMS
5. ITEMS FOR ACTION
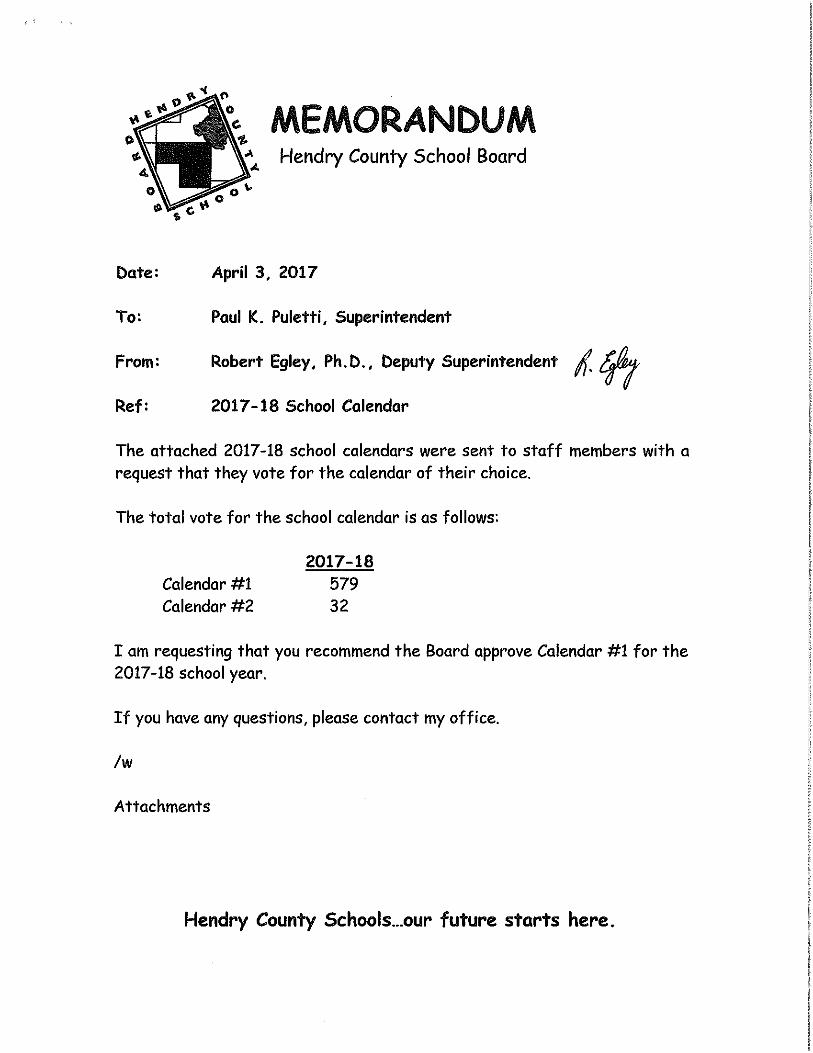
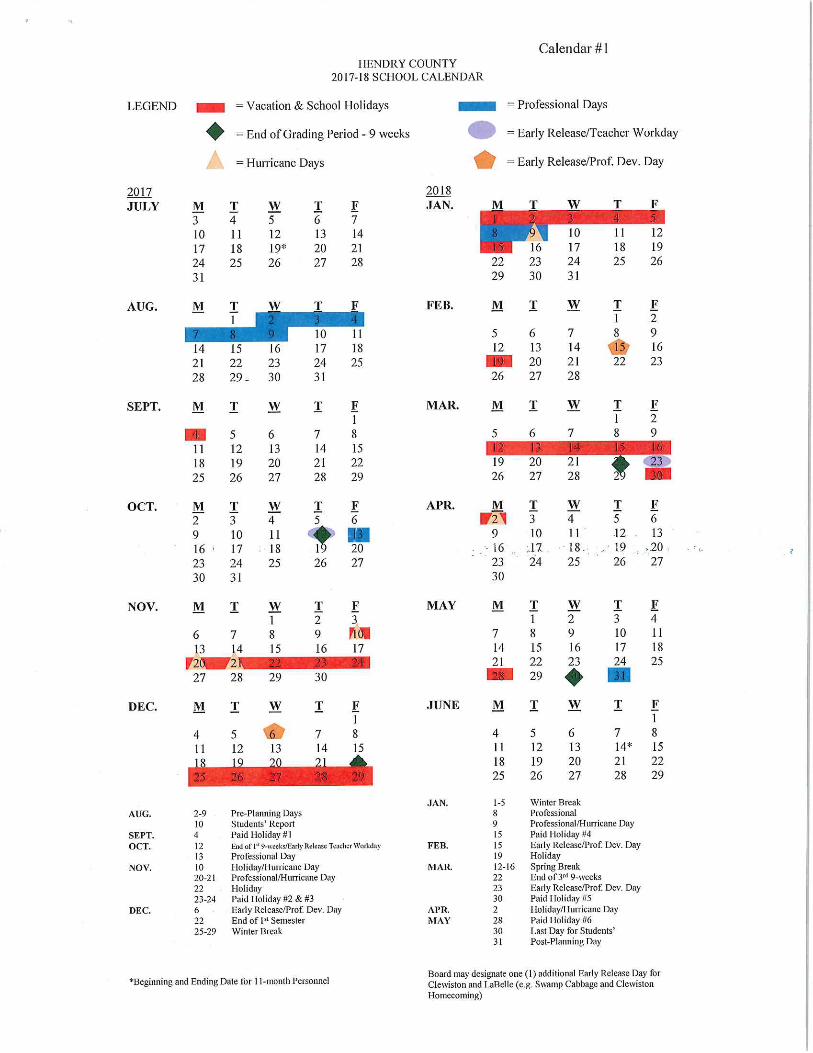
a. 2017-18 School Calendar
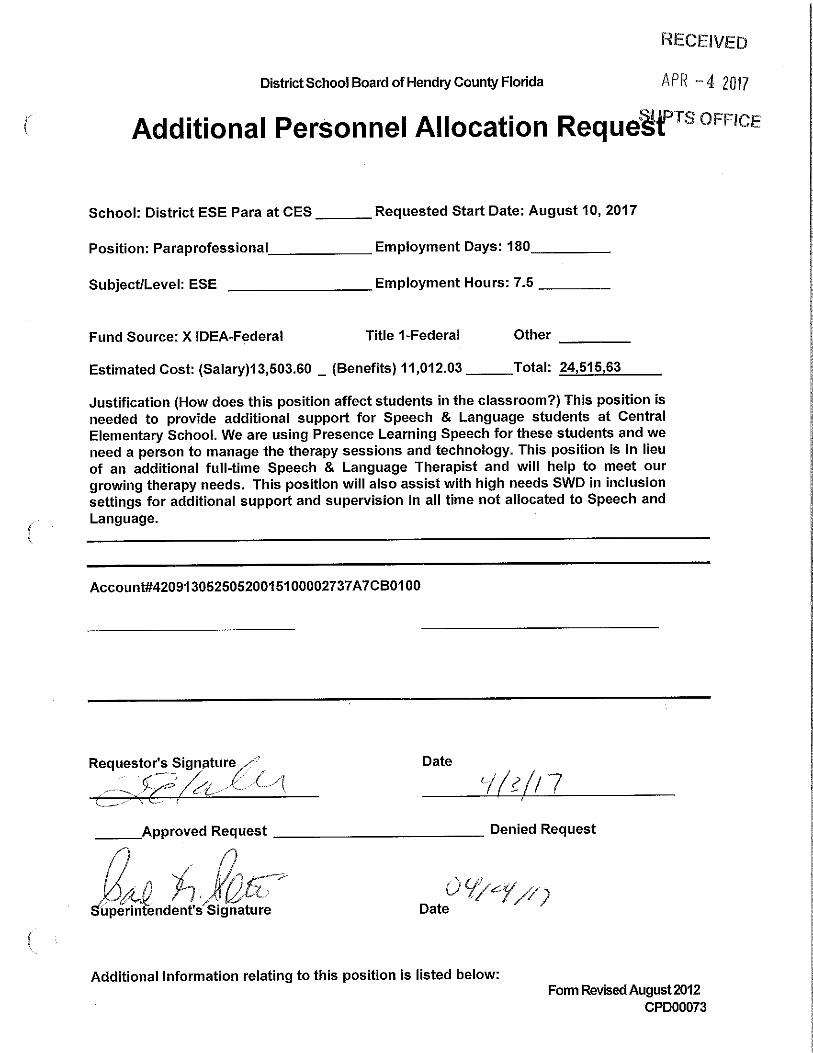
b. New Personnel Allocation Request
6. CONSENT AGENDA
a. Minutes – 3/28/17
b. Agreements –1) Amanda Rutledge - Agreement for Transportation (Aid in lieu) (Revised)2) Sodexo America, LLC - Second Amendment to Proposal Q15-002, Food Service Management
Company
c. Personnel Recommendations
d. Financial Affairs –1) Approval of Purchases2) Bills (4/11/17)3) Internal Account Purchase Request4) Report No. 2017-138 - Hendry County School Board Financial & Federal Single Audit –
FY 6/30/16
7. BOARD MEMBER BUSINESSa. Dues & Feesb. Upcoming Board Meeting/Workshop Location Changes
8. ADJOURNMENT
N O T I C E1. Any person who desires to appeal any decision made by the School Board with respect to any matter considered at the above-noticed meeting will need a record of the proceedings, and for
such purposes may need to ensure that a verbatim record of the proceedings is made, such record includes the testimony and evidence upon which an appeal may be based.
2. This is a formal notification to the public, that written information associated with the meeting is available in alternate formats upon request, i.e., large print, Braille, etc., and auxiliary aids areavailable upon request, i.e., assistive learning device systems, sign language interpreters, etc. All services are available upon a 72 hour advanced notice. Please contact county personnel at 863/902-4244.
RECOGNITION
Jesus Almaraz-Argueta, CHS Student – Selected as the 2016-17 Sunshine StateScholar Alternate


TENTATIVE MINUTESHendry County School Board
Regular MeetingTuesday, March 28, 2017
The Hendry County School Board met in Regular Session beginning at 5:30 p.m. in the SchoolBoard Meeting Room, Hendry Co. Courthouse, 2nd Fl., 25 E. Hickpochee, LaBelle, FL. Those inattendance were: Jon Basquin, Chairman; Dwayne E. Brown, Vice Chairman; Sally Berg,Stephanie Busin and Amanda Nelson, Members; Paul K. Puletti, Superintendent; and Michael R.McKinley, School Board Attorney.
The meeting was called to order by Chairman Basquin.
Pledge & Invocation – Chairman Basquin led the Board and guests in the Lord's Prayer and theSalute to the U. S. Flag.
Moment of Silence - In Memory of Michael Clay – Superintendent Puletti requested that amoment of silence be observed in memory of Michael Clay. Mr. Clay was employed at LaBelleHigh School as a custodian from 2001-2010.
Presentation - Education Innovation Research Team - Mr. James Sealey, Director ofProfessional Development and Personnel Evaluation, introduced Dr. Merewyn Lyons, Proposaland Grant Developer, and Dr. Mary-Lynn Jensen, Director of District Partnerships, of LearningSciences International.
Dr. Lyons and Dr. Jensen reviewed a PowerPoint presentation for the Board and guests thatprovided an introduction to Learning Sciences International and overview regarding the EducationInnovation and Research Grant Project. After the presentation, they answered questions posed byBoard Members.
Public Comments -Chairman Basquin asked if there was anyone in the audience that would liketo address the Board regarding any agenda item. There was no response.
Items for Action –
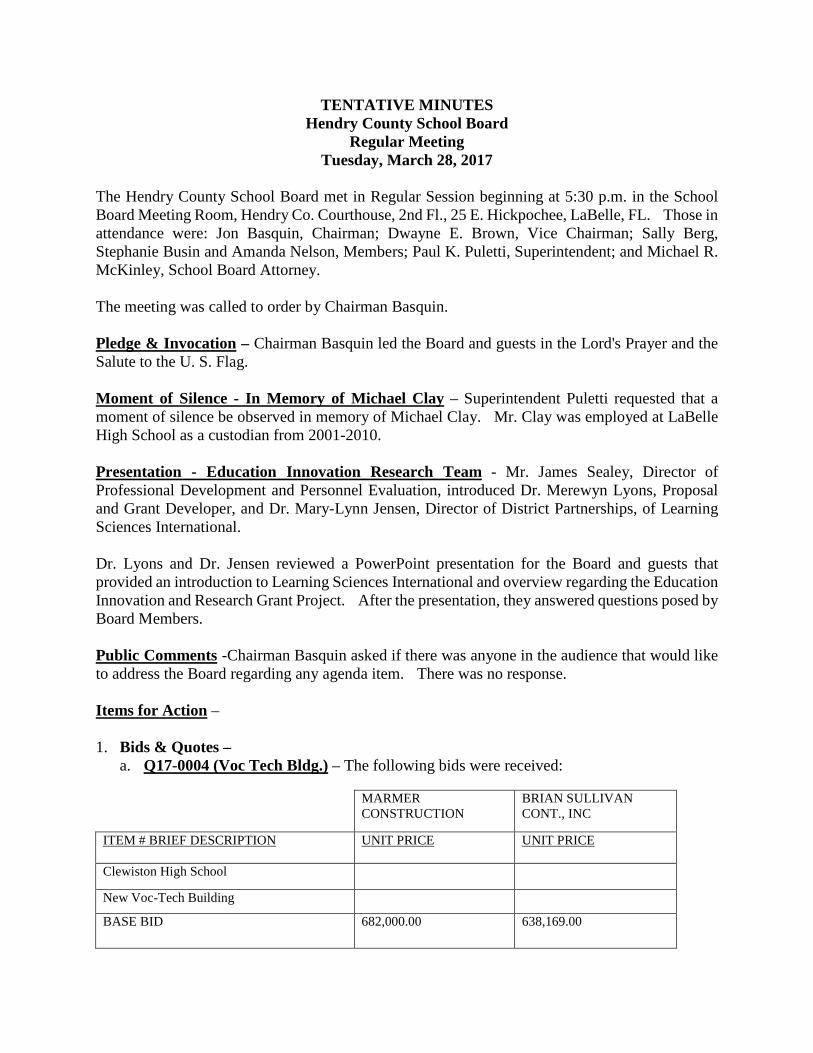
1. Bids & Quotes –a. Q17-0004 (Voc Tech Bldg.) – The following bids were received:
MARMERCONSTRUCTION
BRIAN SULLIVANCONT., INC
ITEM # BRIEF DESCRIPTION UNIT PRICE UNIT PRICE
Clewiston High School
New Voc-Tech Building
BASE BID 682,000.00 638,169.00
March 28, 2017Page 2
On motion by Dwayne E. Brown and second by Amanda Nelson, the Board unanimouslyaccepted the recommendation of the Superintendent that all bids be rejected because it wasover budget and authorizes staff to re-bid with the five contractors that attended themandatory pre-bid meeting. Project will include steel building and concrete slab asmodified by the architect.
b. Renewal of Q97-0008 (Paint) and Q97-0009 (Flooring) for 2017-18 - On motion byDwayne E. Brown and second by Stephanie Busin, the Board unanimously approved therenewal of Q97-0008 (Paint) and Q97-0009 (Flooring) for the 2017-18 school year at thesame terms and prices as recommended by Superintendent Puletti.
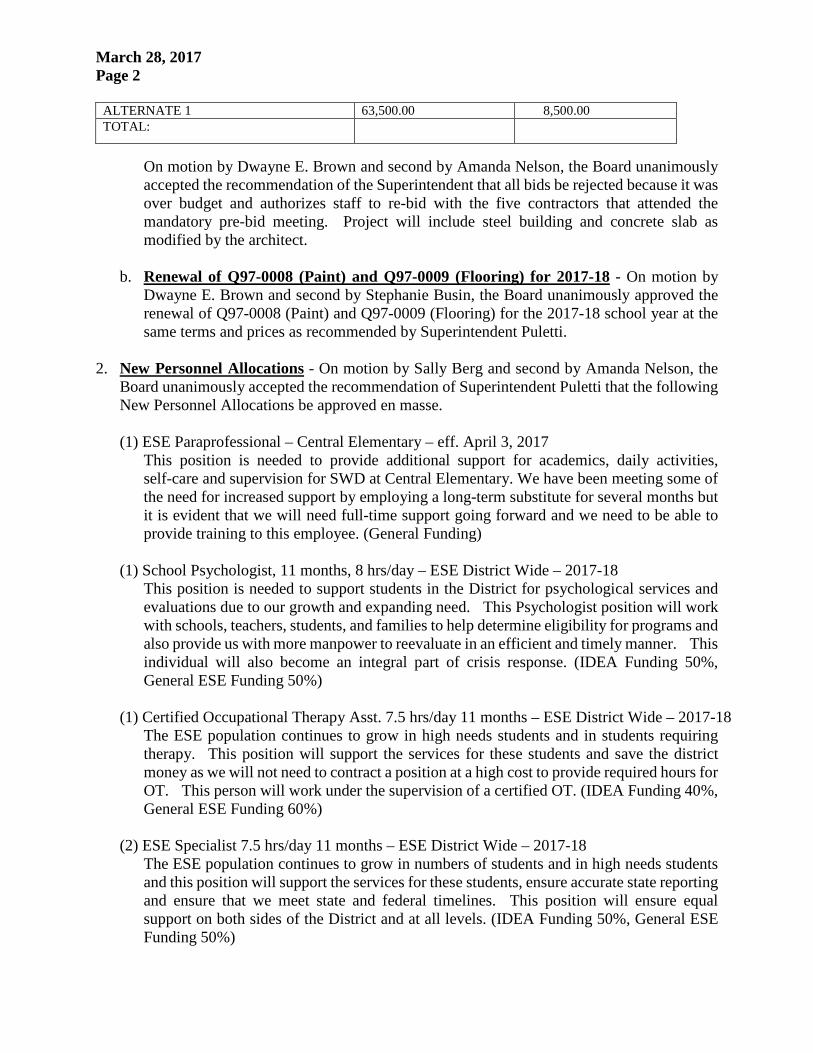
2. New Personnel Allocations - On motion by Sally Berg and second by Amanda Nelson, theBoard unanimously accepted the recommendation of Superintendent Puletti that the followingNew Personnel Allocations be approved en masse.
(1) ESE Paraprofessional – Central Elementary – eff. April 3, 2017This position is needed to provide additional support for academics, daily activities,self-care and supervision for SWD at Central Elementary. We have been meeting some ofthe need for increased support by employing a long-term substitute for several months butit is evident that we will need full-time support going forward and we need to be able toprovide training to this employee. (General Funding)
(1) School Psychologist, 11 months, 8 hrs/day – ESE District Wide – 2017-18This position is needed to support students in the District for psychological services andevaluations due to our growth and expanding need. This Psychologist position will workwith schools, teachers, students, and families to help determine eligibility for programs andalso provide us with more manpower to reevaluate in an efficient and timely manner. Thisindividual will also become an integral part of crisis response. (IDEA Funding 50%,General ESE Funding 50%)
(1) Certified Occupational Therapy Asst. 7.5 hrs/day 11 months – ESE District Wide – 2017-18The ESE population continues to grow in high needs students and in students requiringtherapy. This position will support the services for these students and save the districtmoney as we will not need to contract a position at a high cost to provide required hours forOT. This person will work under the supervision of a certified OT. (IDEA Funding 40%,General ESE Funding 60%)
(2) ESE Specialist 7.5 hrs/day 11 months – ESE District Wide – 2017-18The ESE population continues to grow in numbers of students and in high needs studentsand this position will support the services for these students, ensure accurate state reportingand ensure that we meet state and federal timelines. This position will ensure equalsupport on both sides of the District and at all levels. (IDEA Funding 50%, General ESEFunding 50%)
ALTERNATE 1 63,500.00 8,500.00TOTAL:

March 28, 2017Page 3
(1) VPK Paraprofessional – Montura Site 2017/2018This position will provide teacher and student support for Pre-K in a remote section ofHendry County. This position will allow the district to open a 2nd Pre-K site in Montura.(VPK Funds – Title 1)
(1) VPK Teacher – Montura Site 2017/2018This position will provide quality instruction and will increase access to Pre-K in a remotesection of Hendry County. This position will allow the district to open a 2nd Pre-K site inMontura. (VPK Funds – Title 1)
Consent Agenda - On motion by Dwayne E. Brown and second by Amanda Nelson, the Boardunanimously accepted the recommendation of the Superintendent that the following ConsentAgenda Items be approved en masse.
1. Minutes - 2/14/17 & 2/28/17
2. Agreements & Contracts -a. Presence Learning - Amendment to Master Services Agreement (ESE Dept.)b. Presence Learning - Amendment to Master Services Agreement (ESE Dept.)c. Early Learning Coalition of Southwest Florida - State of Florida Statewide Voluntary
Prekindergarten Provider (2017-18)(Fed. Prog.)d. Victoria Stem - Title 1 Instructional Tutoring Contract (Fed. Prog.)e. Blue Cross and Blue Shield of Florida, Inc. - Accounting & Retention Agreement
3. Hendry County School District Student Acceptable Use Policy (AUP) and TechnologyFee - Removed from Consent Agenda
4. Personnel RecommendationsSuspension with Pay – InstructionalLouisa McLymont – CMS Teacher, eff. 3/9/17
Retirement and Termination of Participation in the FRS Deferred Retirement Option ProgramKathleen Crosby – WES Teacher, eff. 6/1/17 pmHernan Serra – CHS Teacher, eff. 6/1/17 pmFrederick S. Parantha – LES Teacher, eff. 6/1/17 pm
Enrollment for Participation in the FRS Deferred Retirement Option ProgramDebbie Foutch – Media Specialist – UES, eff. 2/1/17Jim Foutch – Teacher – LES, eff. 2/1/17Mary J. Gaskins – Custodian – COES, eff. 2/1/17Bessie Gregory – ESE Paraprofessional – UES, eff. 3/1/17Jovita Williamson – Technology Specialist – IT, eff. 3/1/17
Termination – InstructionalSvetlana Siber – Spch/Lang Pathologist, eff. 3/1/17 (released during probationary period)

March 28, 2017Page 4
Termination – SupportLory J. Ehlers – Food Service Manager, eff. 3/10/17 pm (released during probationary period)
Termination – Non-InstructionalAnna Pereiro – Pre-K Para @ WES eff. 2/16/17 (released during probationary period)
Retirement – InstructionalMegan Greenleaf – LHS Media Specialist, eff. 6/30/17Brent Ringler – LHS Teacher, eff. 6/1/17 pmLynne Pellerin – LHS Teacher, eff. 5/12/17 pmFrederick Parantha – LES Teacher, eff. 6/1/17Joan Basquin – LES Teacher, eff. 6/1/17Steven Hein – LHS Teacher, eff. 6/1/17 pm
Resignation – Instructional -Jessica DuPree – CHS Teacher, eff. 3/17/17Kaleigh Limper – CHS Teacher, eff. 6/1/17 pmJacquelyn Galbraith – CHS Teacher, eff. 6/1/17 pmSaeed Azan – CHS Teacher, eff. 6/1/17 pmTaylor Galarneau – EES Teacher, eff. 6/2/17 pm
Resignation – Non-InstructionalAmber Delorme – LaBelle Van Driver, eff. 2/17/17Rena Bach – LHS, Custodian, eff. 3/24/17Lucille Suchomski – LaBelle Bus Attendant, eff. 3/2/17Samantha Kozinski – EES – Para, eff. 6/2/17 pm
Transfer – Non-InstructionalFaviola Luna – from LMS Clerk Typist to Finance Account Clerk, eff. 4/4/17Ashley Allison – from Finance Account Clerk to Secretary to Deputy Superintendent,
eff. 2/24/17
Change in Designation – AdministrationJohn Klinger – LMS, from Dean to 11 month Assistant Principal, eff. 3/6/17
Change in Designation – InstructionalLaura Lofton – LHS, from Reading Teacher to Media Specialist, eff. 17/18 School Year
Change in Designation – Non-InstructionalTiffany Lara – Clew. Bus Attendant, from 6.25 hrs/day to 4 hrs/day (route time decrease)Jesenia Williams – LaBelle, from full time Van Attendant to full time Van Driver, eff. 3/6/17Idelsis Villatoro – Clew. Bus Attendant, from 6.25 hrs/day to 5.5 hrs/day, eff. 3/6/17
Leave of Absence – InstructionalMelinda Krause – WES Teacher, eff. 2/17/17 through 4/4/17 (Maternity)

March 28, 2017Page 5
Marc Waddell – CHS – Teacher, extended Medical Leave, eff. 5/31/2016 through 6/1/2017(Medical)
Leave of Absence – Non-InstructionalMaria Dominguez – School Nurse – Maternity Leave eff. 12/15/16 through 3/1/17
(requesting Family Medical Leave)Jessica Langs – Clew. Bus Driver – Extension of Maternity Leave eff. 2/27/17 through
3/17/17
Appointment – InstructionalDenisesha Thorpe – WES Pre-K Teacher, eff. 2/21/17
Appointment - Non-InstructionalSkylar Bell – COES ESE Para, eff. 2/13/17 (New Allocation)Krishendath Dookram – LMS Custodian, eff. 2/21/17Victoria Ortiz – WES ESE Pre-K Para, eff. 2/27/17Daion Banks – WES Custodian, eff. 3/20/17Jimesha Smith – WES ESE Pre-K Para, eff. 2/27/17Nathan Snow – LHS Custodian, eff. 3/27/17Ashley Campbell – COES – ESE Para, eff. 2/27/17
Appointment Teacher Temporary Part time for Deaf HHDeborah Finley – ESE – eff. 2/6/17 through 6/30/17
Appointment Substitute Bus DriversTonya Whitehead - eff. 2/23/17Ronnie Rawls – eff. 3/20/17Ronnie Rawls – Trainee, eff. 1/23/17Lydia Maldonado - eff. 3/22/17
Additional days/hoursMeloni Timgren - 31.5 hrs. for driving/after schoolMark Duda - ESE Attendant for After School Program eff. 2/7/17Rene Ibarra – LaBelle Trans. – 6.5 hrs. due to bus driver shortage, eff. PR 19
Supplements 2016/2017Michael Willis – ADD – Football Spring Training, Asst. Coach, 90% - CHSManny Gomez – ADD – Football Spring Training, Head Coach, 10% and Asst. Coach, 10%
each - CHSCharles Roth – ADD – Baseball JV, Asst. Coach – CHSSteve Barnes – DELETE – Baseball JV, Asst. Coach – CHSChris Barraza – ADD – Softball, Head Coach – CHSSamantha Ortiz – DELETE – Softball, Head Coach – CHSManny Gomez – ADD – Softball, Asst. Coach – CHSChris Barraza – DELETE – Softball, Asst. Coach – CHSJenine Hannam – ADD – Softball, Asst. JV Coach – CHS

March 28, 2017Page 6
Melissa Padilla – DELETE – Softball, Asst. JV Coach – CHSNora Ramirez – ADD – Sunshine Club – CHSJoaquin Barbara Llanes – ADD – Tennis, Head Coach – CHSCurtis Midget – ADD – Track, Head Coach Boys and Girls (10% each), Track Asst. Coach
Boys and Girls (10% each) - CHSBrad Garrett – CHANGE – Track, Head Coach, from 100% to 90% - CHSMichael Willis – CHANGE – Track, Asst. Coach, from 100% to 90% - CHSZach Threlkeld – CHANGE – Track, Head Coach, from 100% to 90% - CHSWill Davis – CHANGE – Track, Asst. Coach, from 100% to 90% - CHSTiffany Groves – DELETE – Beta Club, 50% - CHSIan Stone – ADD – Beta Club, 50 % - CHSSteve Barnes – DELETE – Football Spring Training, 90% -CHSDiana Weiss – DELETE – Sunshine Club – CHS
Summer Boot Camp – LHS/CHS 2017Dustin LedfordDavid LeeDavid TippettJoaquin Barbara-Llanes
Writing Boot Camp - SAI Fund – EES, eff. 2/25/17Amanda Howard Ivette PorthMaggie Pennington Tammy MitchellDanielle Dasher Catisia WilliamsKristin Mann
Summer School –CHS- 2017Steven BarnesTameka WebberBrent JohnsonWillie Lee
Summer Driver’s Ed –LHS/CHS 2017Ronald DunbarDave BlakeMichael WillisRyan Petersmark
Science After School – SAI Funding – EES eff. 3/2/17Ivette Porth Danielle DasherCatisia Williams Caitlyn SayersKaren Richardson
4th Grade After School Program - SAI Funds – COES eff. 3/27/17 to 4/27/17Kimberly StittHeidi Dana

March 28, 2017Page 7
Reading Endorsement Bonus (Title II Funds)Blanca Aguirre – COES
After School Tutorial Reading – LHS – SAI FundJohnathan WilliamsChristel Williams
Best and Brightest Teacher Scholarship Program 16-17Kristina Andrews Daphne Arreola Susan BonnoyerEricka Burke Alexandria Collins Kevin FarmerDenise Gibson Megan Greenleaf Tiffany GrovesJessica Hendricks-Pickles Lauren Kinard Taylor LucasJulie McGirt Catherine McVay Ivette PorthRebecca Pratt Magdalene Solomonides Laurie Steinke
HCSB Approval for ECET2 Professional DevelopmentJason AdamsTammy BassJose RoquettTina Wills
5. Correspondence & Reports -a. Donations
1) $50.00 from Liolia Olvera and Gustavo Castro to LaBelle Elementary School to beused for student field trips.
6. Financial Affairs –a. Approval of Purchases
1) 1712616, MCM Paint & Flooring, Clewiston, FL in the amount of $75,000.00 forpainting and flooring district wide.
2) 1712622, Center for Educational Leadership, Seattle, WA in the amount of $62,675.00for Consultant fees for orientation for studio and resident teachers and ILTwalkthroughs and virtual support.
3) 1712642, Learning Sciences International, Blairsville, PA in the amount of $22,000.00for Marzano leadership training.
4) 1712660, Franklin Covey Client Sales, Inc., Salt Lake City, UT in the amount of$22,961.54 for consultation fees and 7 habits signature participant kit and an annualmembership.
5) 1712724, MCM Paint & Flooring, Clewiston, FL in the amount of $47,497.00 forpainting and flooring district wide.
6) 1712891, Howard Technology Solutions, Laurel, MS in the amount of $21,840.00 for84 Chromebook Celerons, 84 White glove services, 84 Console, 84 Belkin mouse, 84headphones and 84 one year warranties.
7) 1712895, Howard Technology Solutions, Laurel, MS in the amount of $37,008.00 for144 ASUS Chromebook Celerons, 144 White Glove services, 144 Google Chrome OS
March 28, 2017Page 8
Management Console – License, 144Belkin Wired Ergonomic Mouse wired USB, 144One year warranties and 144 ThinkWrite Ultra Light Headphones.
8) 1712917, Waterford Institute, Sandy, UT in the amount of $53,983.36 for 50Classroom Advantage single teacher license annual subscription, 1Discount-Classroom Advantage discount. 840 single student licenses: Waterford EarlyLearning Reading, Math and Science or smart Start, 1 single student license- WaterfordEarly Learning discount on annual software subscription.
9) 1712933, Smart Modular Solutions, LLC, Pasadena, FL in the amount of $78,600.00for 1 Modular Classroom for Clewiston High School (VOC TECH) as per quote dated3/21/17 Contract #Q17-0002.
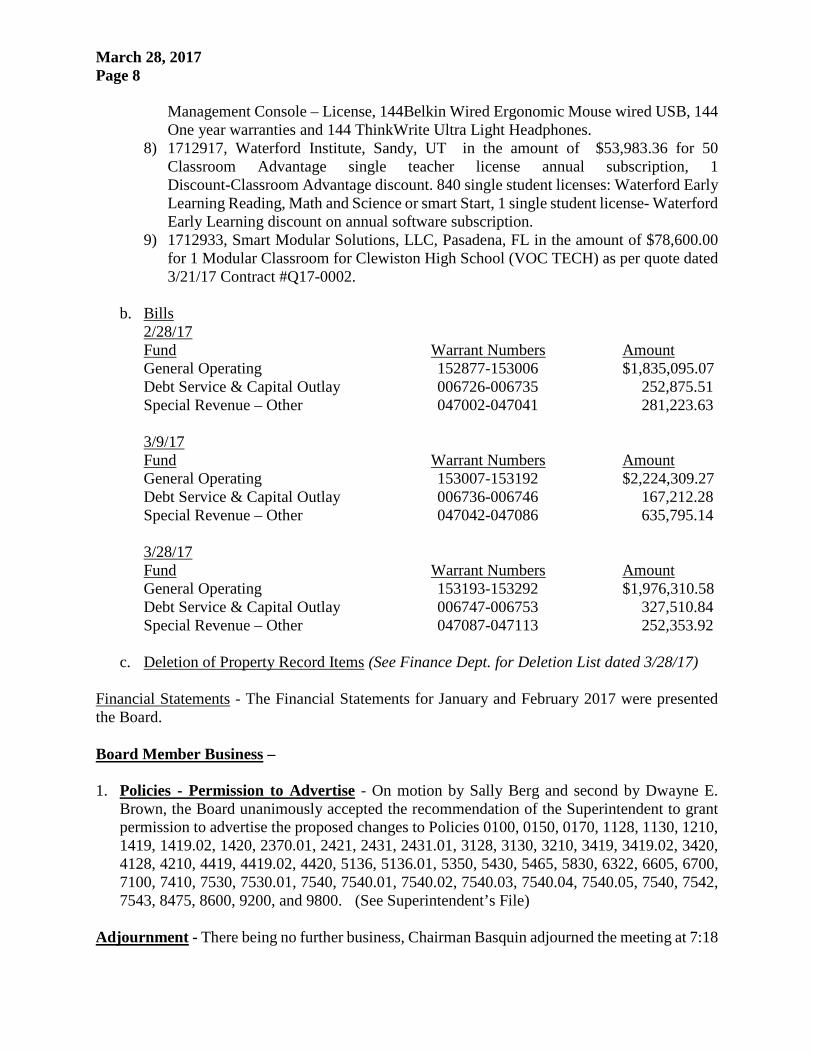
b. Bills2/28/17Fund Warrant Numbers AmountGeneral Operating 152877-153006 $1,835,095.07Debt Service & Capital Outlay 006726-006735 252,875.51Special Revenue – Other 047002-047041 281,223.63
3/9/17Fund Warrant Numbers AmountGeneral Operating 153007-153192 $2,224,309.27Debt Service & Capital Outlay 006736-006746 167,212.28Special Revenue – Other 047042-047086 635,795.14
3/28/17Fund Warrant Numbers AmountGeneral Operating 153193-153292 $1,976,310.58Debt Service & Capital Outlay 006747-006753 327,510.84Special Revenue – Other 047087-047113 252,353.92
c. Deletion of Property Record Items (See Finance Dept. for Deletion List dated 3/28/17)
Financial Statements - The Financial Statements for January and February 2017 were presentedthe Board.
Board Member Business –
1. Policies - Permission to Advertise - On motion by Sally Berg and second by Dwayne E.Brown, the Board unanimously accepted the recommendation of the Superintendent to grantpermission to advertise the proposed changes to Policies 0100, 0150, 0170, 1128, 1130, 1210,1419, 1419.02, 1420, 2370.01, 2421, 2431, 2431.01, 3128, 3130, 3210, 3419, 3419.02, 3420,4128, 4210, 4419, 4419.02, 4420, 5136, 5136.01, 5350, 5430, 5465, 5830, 6322, 6605, 6700,7100, 7410, 7530, 7530.01, 7540, 7540.01, 7540.02, 7540.03, 7540.04, 7540.05, 7540, 7542,7543, 8475, 8600, 9200, and 9800. (See Superintendent’s File)
Adjournment - There being no further business, Chairman Basquin adjourned the meeting at 7:18

March 28, 2017Page 9
p.m.
________________________________ _____________________________Paul K. Puletti, Superintendent Jon Basquinand Secretary to the Board Chairman of the Board


4-11-17 BOARD MEETING PERSONNEL
Retirement – InstructionalBarbara Fricke – WES Teacher, eff. 6/1/2017 pm
Retirement – Non-InstructionalYolanda Placencia – CES, ELL Paraprofessional – 3/1/2017
Resignation – InstructionalKristin DeWeese – CES Teacher, eff. 6/1/2017 pm (Personal)Erin Lavalley – CES Teacher, eff. 6/2/2017 (Personal)Caitlin Sayers – EES Teacher, eff. 6/2/2017 (Relocating)Casie Franzke – COES Teacher, eff. 6/1/2017 pm (Relocating)Chelsey Ramos – LMS Teacher, eff. 6/2/2017 (Personal)Scott McKeon – CES Teacher, eff. 6/2/2017 (Personal)
Resignation – Non–InstructionalDeborah Walker – Finance Account Clerk – eff. 4/13/17 (Personal)
Transfer – InstructionalIsabel Loredo-Marquez – from CES Teacher to VPK Teacher (MEL), eff. 2017-18Kevin Farmer – from CMS Teacher to CHS Music Teacher, eff. 2017-18 (Rep. Dupree)Sindie VanWagner – from WES Teacher to VPK Teacher (MEL), eff. 2017-18
Change in Designation – SupportSanJuanita Perez – from Non-Instructional, Account Clerk to Support, Food Service Manager, eff.
3/27/2017 (Rep. Ehlers)
Change in Designation – InstructionalKayley Prinzi – Teacher, EES to COES, eff. 17/18 School yearJackie Booth – Teacher, EES to CHS, eff. 17/18 School yearKevin Holland – Teacher, LMS to LHS, eff. 17/18 School year
Change in Designation – Non – InstructionalAngela Esquivel – LaBelle Bus Driver to Clewiston Bus Driver, eff. 3/29/2017, from 4.5/hrs/day to5.5/hrs/day (rep. Eddie Gomez)Alfred Griffin – Clewiston Bus Driver, eff. 3/29/2017, from 4/hrs/day to 5.5/hrs/day Route Change (rep.
Herring)
Leave of Absence – InstructionalDaphne Arreola – COE Teacher, eff. 2017-18 School year (Maternity)Melinda Krause – WES Teacher, re-instated from Maternity Leave, eff. 3/27/2017Kristy Hennessey – WES Teacher, eff. 3/22/2017 through 6/1/2017 (Medical)
Appointment – Non-InstructionalBrittaney Orelue – LHS, ESE Paraprofessional eff. 3/20/2017 (rep. M. Daniel)Katherine Timiraus – LaBelle Transp. Bus Aide, eff. 4/4/2017 (rep. Suchomski)Jennifer Carter – VPK Para, Montura Early Learning Center (MEL) – New Allocation, eff. 2017-18
4-11-17 BOARD MEETING PERSONNEL – Page 2
Juliette Cruz – VPK Para, MEL – New Allocation, eff. 2017-18Gabriela Salazar Sanchez – VPK Para, MEL – New Allocation, eff. 2017-18
Appointment – Hospital/Homebound 2016-17Mercedes NunezJacob Walk
Appointment - Substitute Van Driver/Van Attendant/Bus AttendantSandra Cabrera – eff. 4/3/2017Cynthia Biggs – eff. 3/6/2017 (Sub Van/Bus Attendant)
Additional days/hoursRene Ibarra – 6.5 hours driving/bus repair, PR#20Meloni Timgren – 30.25 hours driving/After school, PR#18Melissa Luna – 1.25 hours – for Parent Teacher Conferences, eff. 2/16/2017Cruz Martinez – 1.25 hours – for Parent Teacher Conferences, eff. 2/16/2017Nona Timmons – Bus Driver – LaBelle Migrant Homeless After-School Program, eff. 3/24/2017Deanna Cherry – Bus Driver – Part-time mower, eff. 4/4/2017
Supplements 2016/2017Kevin Farmer – ADD – Band Director, CHSTy Marshall – CHANGE – Baseball, Asst. Coach, from 100% to 25% - LHSRicky Bass – ADD – Baseball, Asst. Coach, 75% - LHSBrent Burnside – ADD – Football Spring Training, Asst. Coach, 50% - LHSCudjoe London – DELETE – Football Spring Training, Asst. Coach - LHS
3rd Grade After-School Program – SAI Funds – COES – Extended through 3/27/17Nicole KusnierzCarrie McKinleyHanna Officer
Avid Tutors – SAI Funds – CHS- eff. 3/30/17Marizel PerezLiliaesther Delgado Lopez
SLP Technology Para Sub – CES – eff. 3/20/17Renee Martin
Professional Development Stipend for SIM Training 2016 – LHS/LMSEusyher Mendoza Taynika ArtacheJoy Bridwell Laura LoftonStuart Friesen Sara ChildersAnn Daniel Alana AndersonCarole Schroeder Haili MarottiJoel Reinking Ashley CorbittLea Burnside Jimmy Norman

4-11-17 BOARD MEETING PERSONNEL- Page 3
Summer School – LHS – 2017Claude Cadet Kristina AndrewsHeidi Lederer Maria Nancy Rodriguez
Math Tutoring – SAI Funds – LMS eff. 3/21/2017Tracie Smith-Murphy Natalia RoseBret Mayo Douglas KnittFaye Reed Veronica Gil
Civics Tutoring Services – SAI Funds - LMS eff. 3/27/2017Ashley CorbittJoel Reinking
Science Boot Camp – SAI Funds – eff. 4/29/2017Maranda Berner Stefanie CurtisKristin DeWeese Meredith KaneSofia Kirstein Claudia LozanoJalyce Morris
Math Boot Camp – SAI Funds – eff. 4/22/2017Alice Bradberry Jessica Cirino-Lan Stefanie CurtisKristin DeWeese Sofia Kirstein Claudia LozanoJalyce Morris Mark vanTol
Summer School – Federal Programs – eff. 06/05/2017Kris Cottrell Sandra Van Wagner Rebecca Caudill LozanoPamela R. Cooper Shannon Angel Jacqueline MorenoBlanca Aguirre Kristen Walker Crystal RobbinsAngela St. John Debbie Foutch Michael MillerSydney Thacker Elvira Garcia-Rodriguez Kim StittStella Luckey Susan Smith Rachel KirklandNicole Kusnierz Theresa Barber Cathy CharneskiWendy O’Ferrell Melanie Holt Kevin LutkenhausRuss Bell Jose Marquez Joel ReinkingBlanca Gongora Chelsa Skipper Laura LoftonDustin Ledford Reyna Garza Margie PulettiIngrid Gutierrez Kathleen Crawford Maggie PenningtonAdam Pennington Kristin Mann Amanda Howard (EES)Shawn Grooms Yesenia Zamora Catisia WilliamsLillian Ramos Sherry Irey Danielle DasherRushie Osby Susana Kettler Maranda BernerDeborah Panton April White Danielle JeanSamuel Thomas Vermell White Kevin FarmerGlenna Shelnut Samantha Ortiz Melissa LunaMarion Willis Richard Talada Tamarra ParrishFlora Talada Hope Escobar George Wedeles

4-11-17 BOARD MEETING PERSONNEL- Page 4
Linda Butler-Mosley Tracy Owens Irma AlanizJanet Hamilton Chasity Poling Isabelle LoredoCindie Van Wagner Judy Morales Lil MendozaErlinda Brown Odalys Burke Nora GarciaMargarita Pruitt Patty Sutton Adriana SotoGracie Garcia Rosa Perez

FINANCIAL AFFAIRS
1) Approval of Purchases (See Attached)
2) Bills (4/11/17) (See Attached)
3) Internal Account Purchase Order (See Attached)
a) EES – Universal Studios, Orlando, FL in the amount of $10,576.00 foradmission/dining cards for 5th grade field trip.
4) Report No. 2017-138 – Hendry County School Board Financial & Federal Single Audit –FY Ended 6/30/16 (See Attached)

BOARD MEETINGApril 11, 2017
2016/2017Purchase Orders
FINANCIAL AFFAIRS-
1. 1712990, Curriculum Associates, North Billerica, MA in the amount of $232,060.00for I-Ready Diagnostic Math and Reading per student license for 8 sites. I-Ready Mathand Reading for K-8 Teacher Toolbox for I-Ready site license for 8 sites. I-Ready Mathand Reading for K-8 for site license for 8 sites. I-Ready Diagnostic and Instruction Prof.Dev. On site practicing with add on leadership sessions. (Federal)
2. 1713031, AVID Center, San Diego, CA in the amount of $17,272.00 for one AVIDweekly subscription for CHS for 2017-18. One AVID membership fees for CHS for2017-18. One AVID weekly subscription for CMS for 2017-18. One AVID membershipfee for CMS for 2017-18. One AVID weekly subscription for LHS for 2017-18. OneAVID membership for LHS for 2017-18. One AVID weekly subscription for LMS for2017-18. One AVID membership fee for LMS for 2017-18.(General)
3. 1713104, CenturyLink, e/mail, LA in the amount of $25,000.00 for Smartnet Support.(General)

CURRICULUM ASSOCIATES 1712990P.O. Box 2001North Billerica, MA 01862-0901
03/29/17420-9141-5-000-5100-6920-000-2127B-7CB01-00420-9141-5-000-6400-3100-000-2127B-7CB01-00
1 I-Ready Diagnostic Math and Reading per student 58,243.00 58,243.00License – 1 Year – 8 sites1 I-Ready Math and Reading K-8 Teacher Toolbox 90,147.00 90,147.00For I-Ready Site License – 1 Year – 8 sites1 I-Ready Math and Reading K-8 Teacher Toolbox 59,670.00 59,670.00For I-Ready Site License – 1Year – 8 Sites1 I-Ready Diagnostic and Instruction Prof. Dev. On Site 24,000.00 24,000.00Practicing (1) and Advanced (7) User Packages. (Allsessions up to 6 hrs.) with Add on Leadership Session (Upto 3 hours)LABELLE MIGRANT - HENDRY COUNTY SCHOOL $****232,060.00
AVID CENTER 17130319246 Lightwave Ave., Suite 200San Diego, CA 92123
04/03/17100-9105-5-000-5100-6920-000-00000-17075-00100-9105-5-000-5100-3100-000-00000-17075-00
1 AVID Weekly Subscription for Clewiston High School 519.00 519.00for 2017-181 AVID Membership Fees Clewiston High School for 3,799.00 3,799.002017-181 AVID Weekly Subscription for Clewiston Middle School 519.00 519.00for 2017-181 AVID Membership fees for Clewiston Middle School 3,799.00 3,799.00for 2017-181 AVID Weekly Subscription for LaBelle High School 519.00 519.00for 2017-181 AVID Membership fees for LaBelle High School for 3,799.00 3,799.002017-181 AVID Weekly Subscription for LaBelle Middle School 519.00 519.00for 2017-181 AVID Membership fees for LaBelle Middle School 3,799.00 3,799.00for 2017-18INSTRUCTION – HENDRY COUNTY SCHOOLS $****17,272.00

CENTURYLINKAcct. Executive/Ed Spece/mail: After Ord., LA 71211-4786
04/06/17100-9350-5-000-8200-3100-000-00000-00000-00
1 Smartnet Support 25,000.00 25,000.00INFORMATION TECHNOLOGY-HENDRY CO. SCHOOLS $****25,000.00

APRIL 11, 2017
FUND BEG. ENDINGCHECK CHECKNUMBER NUMBER AMOUNT
I GENERAL OPERATING 153293 - 153456 $2,033,899.47
II & III DEBT SERV. & CAPT. OUT 6754 - 6764 $ 290,179.22
IV SPECIAL REV. – OTHER 047114 - 047167 $ 280,066.40
TOTAL: $2,604,145.09


Sherrill F. Norman, CPA
Auditor General
Report No. 2017-138
March 2017
HENDRY COUNTY
DISTRICT SCHOOL BOARD
For the Fiscal Year Ended
June 30, 2016
Finan
cial and Fed
eral Single Audit

The Auditor General conducts audits of governmental entities to provide the Legislature, Florida’s citizens, public entity
management, and other stakeholders unbiased, timely, and relevant information for use in promoting government
accountability and stewardship and improving government operations.
The team leader was Cesar A. Mayorga and the audit was supervised by Deirdre F. Waigand, CPA.
Please address inquiries regarding this report to Micah E. Rodgers, CPA, Audit Supervisor, by e-mail at
[email protected] or by telephone at (850) 412-2905.
This report and other reports prepared by the Auditor General are available at:
www.myflorida.com/audgen
Printed copies of our reports may be requested by contacting us at:
State of Florida Auditor General
Claude Pepper Building, Suite G74 ∙ 111 West Madison Street ∙ Tallahassee, FL 32399-1450 ∙ (850) 412-2722
Board Members and Superintendent
During the 2015-16 fiscal year, Paul K. Puletti served as Superintendent of the Hendry County
Schools and the following individuals served as School Board Members:
District No. Dwayne E. Brown, Chair to 11-16-15 1 Dr. Sally Berg, Chair from 11-17-15, Vice Chair to 11-16-15
2
John Benkert 3 Stephanie Busin 4 Jon Basquin, Vice Chair from 11-17-15 5

HENDRY COUNTY DISTRICT SCHOOL BOARD
TABLE OF CONTENTS
Page No.
SUMMARY ........................................................................................................................................ i
INDEPENDENT AUDITOR’S REPORT
Report on the Financial Statements .............................................................................................. 1
Other Reporting Required by Government Auditing Standards .................................................... 3
MANAGEMENT’S DISCUSSION AND ANALYSIS ........................................................................... 4
BASIC FINANCIAL STATEMENTS
Statement of Net Position ............................................................................................................. 13
Statement of Activities ................................................................................................................... 14
Balance Sheet – Governmental Funds ......................................................................................... 16
Reconciliation of the Governmental Funds Balance Sheet to the Statement of Net Position .................................................................................................. 18
Statement of Revenues, Expenditures, and Changes in Fund Balances – Governmental Funds ....................................................................................... 20
Reconciliation of the Governmental Funds Statement of Revenues, Expenditures, and Changes in Fund Balances to the Statement of Activities ....................................................................................................... 22
Statement of Net Position – Proprietary Fund ............................................................................... 23
Statement of Revenues, Expenses, and Changes in Fund Net Position – Proprietary Fund ................................................................................................... 24
Statement of Cash Flows – Proprietary Fund ............................................................................... 25
Statement of Fiduciary Net Position – Fiduciary Funds ................................................................ 26
Statement of Changes in Fiduciary Net Position – Fiduciary Funds ............................................. 27
Notes to Financial Statements ...................................................................................................... 28
OTHER REQUIRED SUPPLEMENTARY INFORMATION
Budgetary Comparison Schedule – General and Major Special Revenue Funds ........................ 58
Schedule of Funding Progress – Other Postemployment Benefits Plan ....................................... 60
Schedule of the District’s Proportionate Share of the Net Pension Liability – Florida Retirement System Pension Plan ................................................................................................ 60
Schedule of District Contributions – Florida Retirement System Pension Plan ............................ 60
Schedule of the District’s Proportionate Share of the Net Pension Liability – Health Insurance Subsidy Pension Plan ................................................................................................. 61
Schedule of District Contributions – Health Insurance Subsidy Pension Plan .............................. 61
Notes to Required Supplementary Information ............................................................................. 61

HENDRY COUNTY DISTRICT SCHOOL BOARD
TABLE OF CONTENTS (CONTINUED)
Page No.
SCHEDULE OF EXPENDITURES OF FEDERAL AWARDS ............................................................ 64
INDEPENDENT AUDITOR’S REPORT ON INTERNAL CONTROL OVER FINANCIAL REPORTING AND ON COMPLIANCE AND OTHER MATTERS BASED ON AN AUDIT OF FINANCIAL STATEMENTS PERFORMED IN ACCORDANCE WITH GOVERNMENT AUDITING STANDARDS ............................................. 66
INDEPENDENT AUDITOR’S REPORT ON COMPLIANCE FOR EACH MAJOR FEDERAL PROGRAM AND REPORT ON INTERNAL CONTROL OVER COMPLIANCE REQUIRED BY THE UNIFORM GUIDANCE .......................................................... 68
SCHEDULE OF FINDINGS AND QUESTIONED COSTS ................................................................ 71
PRIOR AUDIT FOLLOW-UP ............................................................................................................. 72
SUMMARY SCHEDULE OF PRIOR AUDIT FINDINGS .................................................................... 72
Report No. 2017-138 March 2017 Page i
SUMMARY
SUMMARY OF REPORT ON FINANCIAL STATEMENTS
Our audit disclosed that the Hendry County District School Board (District’s) basic financial statements
were presented fairly, in all material respects, in accordance with prescribed financial reporting standards.
SUMMARY OF REPORT ON INTERNAL CONTROL AND COMPLIANCE
Our audit did not identify any deficiencies in internal control over financial reporting that we consider to
be material weaknesses.
The results of our tests disclosed no instances of noncompliance or other matters that are required to be
reported under Government Auditing Standards issued by the Comptroller General of the United States.
SUMMARY OF REPORT ON FEDERAL AWARDS
We audited the District’s compliance with applicable Federal awards requirements. The Title I and
Special Education Cluster programs were audited as major Federal programs. The results of our audit
indicated that the District materially complied with the requirements that could have a direct and material
effect on each of its major Federal programs.
AUDIT OBJECTIVES AND SCOPE
Our audit objectives were to determine whether the School Board and its officers with administrative and
stewardship responsibilities for District operations had:
Presented the District’s basic financial statements in accordance with generally accepted accounting principles;
Established and implemented internal control over financial reporting and compliance with requirements that could have a direct and material effect on the financial statements or on a major Federal program; and
Complied with the various provisions of laws, rules, regulations, contracts, and grant agreements that are material to the financial statements, and those applicable to the District’s major Federal programs.
The scope of this audit included an examination of the District’s basic financial statements and the
accompanying Schedule of Expenditures of Federal Awards as of and for the fiscal year ended
June 30, 2016. We obtained an understanding of the District’s environment, including its internal control,
and assessed the risk of material misstatement necessary to plan the audit of the basic financial
statements and Federal awards. We also examined various transactions to determine whether they were
executed, in both manner and substance, in accordance with governing provisions of laws, rules,
regulations, contracts, and grant agreements.

Report No. 2017-138 Page ii March 2017
AUDIT METHODOLOGY
We conducted our audit in accordance with auditing standards generally accepted in the United States
of America; applicable standards contained in Government Auditing Standards, issued by the Comptroller
General of the United States; and Title 2 U.S. Code of Federal Regulations Part 200, Uniform
Administrative Requirements, Cost Principles, and Audit Requirements for Federal Awards.

Report No. 2017-138 March 2017 Page 1
Phone: (850) 412-2722 Fax: (850) 488-6975
Sherrill F. Norman, CPA Auditor General
AUDITOR GENERAL STATE OF FLORIDA Claude Denson Pepper Building, Suite G74
111 West Madison Street Tallahassee, Florida 32399-1450
The President of the Senate, the Speaker of the House of Representatives, and the Legislative Auditing Committee
INDEPENDENT AUDITOR’S REPORT
Report on the Financial Statements
We have audited the accompanying financial statements of the governmental activities, each major fund,
and the aggregate remaining fund information of the Hendry County District School Board, as of and for
the fiscal year ended June 30, 2016, and the related notes to the financial statements, which collectively
comprise the District’s basic financial statements as listed in the table of contents.
Management’s Responsibility for the Financial Statements
Management is responsible for the preparation and fair presentation of these financial statements in
accordance with accounting principles generally accepted in the United States of America; this includes
the design, implementation, and maintenance of internal control relevant to the preparation and fair
presentation of financial statements that are free from material misstatement, whether due to fraud or
error.
Auditor’s Responsibility
Our responsibility is to express opinions on these financial statements based on our audit. We did not
audit the financial statements of the school internal funds, which represent 17 percent of the assets and
86 percent of the liabilities of the aggregate remaining fund information. In addition, we did not audit the
financial statements of the Hendry Public Schools Foundation, Inc. (Foundation), which represent less
than 1 percent of the assets, 0 percent of the liabilities, 3 percent of the revenues, and 2 percent of the
expenses/expenditures of the aggregate remaining fund information. Those statements were audited by
other auditors whose reports have been furnished to us, and our opinion, insofar as they relate to the
amounts included for the school internal funds and the Foundation, is based solely on the reports of the
other auditors. We conducted our audit in accordance with auditing standards generally accepted in the
United States of America and the standards applicable to financial audits contained in Government
Auditing Standards, issued by the Comptroller General of the United States. Those standards require
Report No. 2017-138 Page 2 March 2017
that we plan and perform the audit to obtain reasonable assurance about whether the financial statements
are free from material misstatement.
An audit involves performing procedures to obtain audit evidence about the amounts and disclosures in
the financial statements. The procedures selected depend on the auditor’s judgment, including the
assessment of the risks of material misstatement of the financial statements, whether due to fraud or
error. In making those risk assessments, the auditor considers internal control relevant to the entity’s
preparation and fair presentation of the financial statements in order to design audit procedures that are
appropriate in the circumstances, but not for the purpose of expressing an opinion on the effectiveness
of the entity’s internal control. Accordingly, we express no such opinion. An audit also includes
evaluating the appropriateness of accounting policies used and the reasonableness of significant
accounting estimates made by management, as well as evaluating the overall presentation of the
financial statements.
We believe that the audit evidence we have obtained is sufficient and appropriate to provide a basis for
our audit opinions.
Opinions
In our opinion, based on our audit and the reports of other auditors, the financial statements referred to
above present fairly, in all material respects, the respective financial position of the governmental
activities, each major fund, and the aggregate remaining fund information of the Hendry County District
School Board, as of June 30, 2016, and the respective changes in financial position and, where
applicable, cash flows thereof for the fiscal year then ended in accordance with accounting principles
generally accepted in the United States of America.
Other Matters
Required Supplementary Information
Accounting principles generally accepted in the United States of America require that MANAGEMENT’S
DISCUSSION AND ANALYSIS, the Budgetary Comparison Schedule – General and Major Special
Revenue Funds, Schedule of Funding Progress – Other Postemployment Benefits Plan, Schedule
of the District’s Proportionate Share of the Net Pension Liability – Florida Retirement System
Pension Plan, Schedule of District Contributions – Florida Retirement System Pension Plan,
Schedule of the District’s Proportionate Share of the Net Pension Liability – Health Insurance
Subsidy Pension Plan, Schedule of District Contributions – Health Insurance Subsidy Pension
Plan, and Notes to Required Supplementary Information, as listed in the table of contents, be
presented to supplement the basic financial statements. Such information, although not a part of the
basic financial statements, is required by the Governmental Accounting Standards Board who considers
it to be an essential part of financial reporting for placing the basic financial statements in an appropriate
operational, economic, or historical context. We have applied certain limited procedures to the required
supplementary information in accordance with auditing standards generally accepted in the United States
of America, which consisted of inquiries of management about the methods of preparing the information
and comparing the information for consistency with management’s responses to our inquiries, the basic
financial statements, and other knowledge we obtained during our audit of the basic financial statements.

Report No. 2017-138 March 2017 Page 3
We do not express an opinion or provide any assurance on the information because the limited
procedures do not provide us with sufficient evidence to express an opinion or provide any assurance.
Supplementary Information
Our audit was conducted for the purpose of forming opinions on the financial statements that collectively
comprise the District’s basic financial statements. The accompanying SCHEDULE OF EXPENDITURES
OF FEDERAL AWARDS, as required by Title 2 U.S. Code of Federal Regulations Part 200, Uniform
Administrative Requirements, Cost Principles, and Audit Requirements for Federal Awards, is presented
for purposes of additional analysis and is not a required part of the basic financial statements.
The accompanying SCHEDULE OF EXPENDITURES OF FEDERAL AWARDS is the responsibility of
management and was derived from and relates directly to the underlying accounting and other records
used to prepare the basic financial statements. Such information has been subjected to the auditing
procedures applied in the audit of the basic financial statements and certain additional procedures,
including comparing and reconciling such information directly to the underlying accounting and other
records used to prepare the basic financial statements or to the basic financial statements themselves,
and other additional procedures in accordance with auditing standards generally accepted in the United
States of America. In our opinion, the accompanying SCHEDULE OF EXPENDITURES OF FEDERAL
AWARDS is fairly stated, in all material respects, in relation to the basic financial statements as a whole.
Other Reporting Required by Government Auditing Standards
In accordance with Government Auditing Standards, we have also issued a report dated March 9, 2017,
on our consideration of the District’s internal control over financial reporting and on our tests of its
compliance with certain provisions of laws, rules, regulations, contracts, and grant agreements and other
matters included under the heading INDEPENDENT AUDITOR’S REPORT ON INTERNAL CONTROL
OVER FINANCIAL REPORTING AND ON COMPLIANCE AND OTHER MATTERS BASED ON AN
AUDIT OF FINANCIAL STATEMENTS PERFORMED IN ACCORDANCE WITH GOVERNMENT
AUDITING STANDARDS. The purpose of that report is to describe the scope of our testing of internal
control over financial reporting and compliance and the results of that testing, and not to provide an
opinion on internal control over financial reporting or on compliance. That report is an integral part of an
audit performed in accordance with Government Auditing Standards in considering the District’s internal
control over financial reporting and compliance.
Respectfully submitted, Sherrill F. Norman, CPA Tallahassee, Florida March 9, 2017

Report No. 2017-138 Page 4 March 2017
MANAGEMENT’S DISCUSSION AND ANALYSIS
The management of the Hendry County District School Board has prepared the following discussion and
analysis to provide an overview of the District’s financial activities for the fiscal year ended June 30, 2016.
The information contained in the Management’s Discussion and Analysis (MD&A) is intended to highlight
significant transactions, events, and conditions and should be considered in conjunction with the District’s
financial statements and notes to financial statements found immediately following the MD&A.
FINANCIAL HIGHLIGHTS
Key financial highlights for the 2015-16 fiscal year are as follows:
As of June 30, 2016, the assets and deferred outflows of resources exceed the liabilities and the deferred inflows of resources by $35.6 million.
In total, net position decreased $3 million, which represents a 7.7 percent decrease over the 2014-15 fiscal year.
General revenues total $62.5 million, or 92.7 percent of all revenues. Program specific revenues in the form of charges for services, operating grants and contributions, and capital grants and contributions total $4.9 million, or 7.3 percent of all revenues.
Expenses total $70.3 million. Only $4.9 million of these expenses was offset by program specific charges, with the remainder paid from general revenues.
At the end of the current fiscal year, the fund balance of the General Fund totals $10.1 million, which is $0.9 million less than the prior fiscal year balance. The General Fund total assigned and unassigned fund balances was $3.8 million, or 7.3 percent of total General Fund revenues.
Total long-term liabilities increased by $9.8 million, or 35.9 percent, mainly because the District’s net pension liability increased.
OVERVIEW OF FINANCIAL STATEMENTS
The basic financial statements consist of three components: (1) government-wide financial statements;
(2) fund financial statements; and (3) notes to financial statements. This report also includes
supplementary information intended to furnish additional details to support the basic financial statements.
Government-wide Financial Statements
The government-wide financial statements provide both short-term and long-term information about the
District’s overall financial condition in a manner similar to those of a private-sector business. The
statements include a statement of net position and a statement of activities that are designed to provide
consolidated financial information about the governmental activities of the District presented on the
accrual basis of accounting. The statement of net position provides information about the District’s
financial position, its assets, liabilities, and deferred inflows/outflows of resources, using an economic
resources measurement focus. Assets plus deferred outflows of resources, less liabilities and deferred
inflows of resources, equals net position, which is a measure of the District’s financial health. The
statement of activities presents information about the change in the District’s net position, the results of
operations, during the fiscal year. An increase or decrease in net position is an indication of whether the
District’s financial health is improving or deteriorating.

Report No. 2017-138 March 2017 Page 5
The government-wide statements present the District’s activities in the following categories:
Governmental activities – This represents most of the District’s services, including its educational programs: basic, vocational, adult, and exceptional education. Support functions such as transportation and administration are also included. Local property taxes and the State’s education finance program provide most of the resources that support these activities.
Blended component units – The District presents two separate legal entities in this report, which are the Hendry Public Schools Foundation, Inc. (Foundation) and the Hendry County School Board Leasing Corporation (Leasing Corporation). The Foundation is a not-for-profit corporation organized and operated as a direct-support organization under Section 1001.453, Florida Statutes. The Leasing Corporation was formed to facilitate financing for the acquisition of facilities and equipment for the District. Based on generally accepted accounting principles, as discussed in the notes to financial statements, these two entities have been included as an integral part of the primary government.
Fund Financial Statements
Fund financial statements are one of the components of the basic financial statements. A fund is a
grouping of related accounts that is used to maintain control over resources that have been segregated
for specific activities or objectives. The District uses fund accounting to ensure and demonstrate
compliance with finance-related legal requirements and prudent fiscal management. Certain funds are
established by law while others are created by legal agreements, such as bond covenants. Fund financial
statements provide more detailed information about the District’s financial activities, focusing on its most
significant or “major” funds rather than fund types. This is in contrast to the entitywide perspective
contained in the government-wide statements. All of the District’s funds may be classified within one of
the broad categories discussed below.
Governmental Funds: Governmental funds are used to account for essentially the same functions
reported as governmental activities in the government-wide financial statements. However, unlike the
government-wide financial statements, governmental fund financial statements focus on near-term
inflows and outflows of spendable resources, as well as on balances of spendable resources available
at the end of the fiscal year. Such information may be useful in assessing a government’s near-term
financing requirements.
Because the focus of governmental funds is narrower than that of the government-wide financial
statements, it is useful to compare the information presented for governmental funds with similar
information presented for governmental activities in the government-wide financial statements. By doing
so, readers may better understand the long-term impact of the government’s near-term financing
decisions. Both the governmental funds balance sheet and the governmental funds statement of
revenues, expenditures, and changes in fund balances provide a reconciliation to facilitate this
comparison between governmental funds and governmental activities.
The governmental funds balance sheet and statement of revenues, expenditures, and changes in fund
balances provide detailed information about the District’s most significant funds. The District’s major
funds are the General Fund, Special Revenue – Food Service Fund, Special Revenue – Other Fund, and
Capital Projects – Local Capital Improvement Fund. Data from the other governmental funds are
combined into a single, aggregated presentation.

Report No. 2017-138 Page 6 March 2017
The District adopts an annual appropriated budget for its governmental funds. A budgetary comparison
schedule has been provided for the General and major Special Revenue Funds to demonstrate
compliance with the budget.
Proprietary Fund: Proprietary funds may be established to account for activities in which a fee is
charged for services. The internal service fund is used to report activities that provide goods and services
to support the District’s other programs and functions through user charges. The District uses the internal
service fund to account for self-insurance activity for dental employee benefits. Since these services
predominantly benefit governmental functions, the internal service fund has been included within
governmental activities in the government-wide financial statements.
Fiduciary Funds: Fiduciary funds are used to report assets held in a trustee or fiduciary capacity for the
benefit of external parties, such as student activity funds. Fiduciary funds are not reflected in the
government-wide statements because the resources are not available to support the District’s own
programs. In its fiduciary capacity, the District is responsible for ensuring that the assets reported in
these funds are used only for their intended purposes.
The District uses a private-purpose trust fund to account for the activities of the Foundation, which is a
separate not-for-profit corporation organized to receive, hold, invest, and administer property and to make
expenditures to or for the benefit of public prekindergarten through postsecondary education.
The District uses agency funds to account for resources held for student activities and groups.
Notes to Financial Statements
The notes provide additional information that is essential for a full understanding of the data provided in
the government-wide and fund financial statements.
Other Information
In addition to the basic financial statements and accompanying notes, this report also presents required
supplementary information concerning the District’s net pension liability and its progress in funding its
obligation to provide other postemployment benefits to its employees.
GOVERNMENT-WIDE FINANCIAL ANALYSIS
As noted earlier, net position over time may serve as a useful indicator of a government’s financial health.
The following is a summary of the District’s net position as of June 30, 2016, compared to net position as
of June 30, 2015:

Report No. 2017-138 March 2017 Page 7
Net Position, End of Year
6-30-16 6-30-15
Current and Other Assets 19,280,874$ 19,062,062$ Capital Assets 50,700,806 51,568,384
Total Assets 69,981,680 70,630,446
Deferred Outflows of Resources 6,773,876 5,349,031
Long-Term Liabilities 37,256,195 27,423,972 Other Liabilities 700,941 348,057
Total Liabilities 37,957,136 27,772,029
Deferred Inflows of Resources 3,162,514 9,614,309
Net Position: Net Investment in Capital Assets 47,433,827 47,799,478 Restricted 7,865,140 6,899,055 Unrestricted (Deficit) (19,663,061) (16,105,394)
Total Net Position 35,635,906$ 38,593,139$
GovernmentalActivities
The largest portion of the District’s net position is investment in capital assets (e.g., land; buildings;
furniture, fixtures, and equipment), less any related debt still outstanding. The District uses these capital
assets to provide services to students; consequently, these assets are not available for future spending.
Although the investment in capital assets is reported net of related debt, the resources used to repay the
debt must be provided from other sources, since the capital assets cannot be used to liquidate these
liabilities.
The restricted portion of the District’s net position represents resources that are subject to external
restrictions on how they may be used. The deficit unrestricted net position was the result, in part, of
accruing $6.2 million in compensated absences payable, $2.8 million in other postemployment benefit
obligations, and $23.5 million in net pension liability.
The key elements of the changes in the District’s net position for the fiscal years ended June 30, 2016,
and June 30, 2015, are as follows:

Report No. 2017-138 Page 8 March 2017
Operating Results for the Fiscal Year Ended
6-30-16 6-30-15
Program Revenues: Charges for Services 275,237$ 635,354$ Operating Grants and Contributions 4,150,258 3,695,251 Capital Grants and Contributions 463,977 291,059 General Revenues: Property Taxes, Levied for Operational Purposes 10,480,934 10,447,529 Property Taxes, Levied for Capital Projects 2,764,034 2,706,244 Grants and Contributions Not Restricted to Specific Programs 48,589,841 46,555,044 Unrestricted Investment Earnings 106,471 83,929 Miscellaneous 521,409 1,061,978
Total Revenues 67,352,161 65,476,388
Functions/Program Expenses: Instruction 37,543,129 35,260,138 Student Support Services 2,662,400 2,320,291 Instructional Media Services 851,255 776,571 Instruction and Curriculum Development Services 1,602,820 1,385,392 Instructional Staff Training Services 945,030 921,441 Instruction-Related Technology 531,623 420,840 Board 666,914 618,452 General Administration 1,397,246 1,088,710 School Administration 4,041,794 3,817,068 Facilities Acquisition and Construction 1,834,567 1,589,649 Fiscal Services 669,461 653,868 Food Services 4,360,555 3,734,391 Central Services 356,352 349,247 Student Transportation Services 2,776,973 2,815,243 Operation of Plant 4,275,891 4,215,172 Maintenance of Plant 1,621,377 1,404,262 Administrative Technology Services 1,250,034 989,723 Unallocated Interest on Long-Term Debt 97,588 49,129 Unallocated Depreciation Expense 2,777,300 2,797,667 Loss on Disposal of Capital Assets 47,085 45,497
Total Functions/Program Expenses 70,309,394 65,252,751
Change in Net Position (2,957,233) 223,637
Net Position - Beginning 38,593,139 60,096,277 Adjustment to Beginning Net Position (1) - (21,726,775)
Net Position - Beginning, as Restated 38,593,139 38,369,502
Net Position - Ending 35,635,906$ 38,593,139$
GovernmentalActivities
Note: (1) The adjustment to beginning net position was due to the implementation of Governmental Accounting Standards Board Statement No. 68, which was a change in accounting principle that required employers participating in cost-sharing multiple-employer defined benefit pension plans to report the employers' proportionate share of the net pension liability of the defined benefit pension plans.

Report No. 2017-138 March 2017 Page 9
The largest revenue source is the State of Florida (61 percent). Revenues from State sources for current
operations are primarily received through the Florida Education Finance Program (FEFP) funding formula
which is accounted for as grants and contributions not restricted. The FEFP formula utilizes student
enrollment data, and is designed to maintain equity in funding across all Florida school districts, taking
into consideration the District’s funding ability based on the local property tax base. Grants and
contributions not restricted increased by $2 million, or 4.4 percent from an increase in State funding per
student and an increase in enrollment. Operating Grants and Contributions increased by $0.5 million, or
12.3 percent due to the first year of participation in the community eligibility provision for food service.
Instruction expenses represent 53.4 percent of total governmental expenses in the 2015-16 fiscal year.
Instruction expenses increased by $2.3 million, or 6.5 percent from the previous year due mainly to an
increase in instructional positions. Instruction-related technology increased by 26.3 percent due to a
large purchase of computers; general administration expenses increased by 28.3 percent resulting from
an increase in terminal leave payments; and administrative technology services increased by
26.3 percent because of an increase in information technology staff.
FINANCIAL ANALYSIS OF THE DISTRICT’S FUNDS
Governmental Funds
The focus of the District’s governmental funds is to provide information on near-term inflows, outflows,
and balances of spendable resources. Such information is useful in assessing the District’s financing
requirements. Specifically, unassigned fund balance may serve as a useful measure of a government’s
net resources available for discretionary use as it represents the portion of fund balance that has not
been limited to a particular purpose by an external party, the District, or a group or individual delegated
authority by the Board to assign resources for particular purposes.
The total fund balances of governmental funds decreased by $0.1 million during the fiscal year to
$17.4 million at June 30, 2016. Approximately 17.9 percent of this amount is unassigned fund balance
($3.1 million), which is available for spending at the District’s discretion. The remainder of the fund
balance is nonspendable, restricted, committed, or assigned to indicate that it is: (1) not in spendable
form ($0.1 million), (2) restricted for particular purposes ($7.9 million), (3) committed for particular
purposes ($5.6 million), or (4) assigned for particular purposes ($0.7 million).
Major Governmental Funds
The General Fund is the District’s chief operating fund. At the end of the current fiscal year, assigned
fund balance is $0.7 million and unassigned fund balance is $3.1 million, while the total fund balance is
$10.1 million. As a measure of the General Fund’s liquidity, it may be useful to compare the total assigned
and unassigned fund balances to General Fund total revenues. The total assigned and unassigned fund
balance is approximately 7.3 percent of the total General Fund revenues, while total fund balance
represents approximately 19.4 percent of total General Fund revenues.
Total fund balance decreased by $0.9 million during the fiscal year. The key factor impacting the change
in fund balance is that total expenditures increased by $2.1 million, or 4.1 percent, due mainly to an
increase in staff and other costs.
Report No. 2017-138 Page 10 March 2017
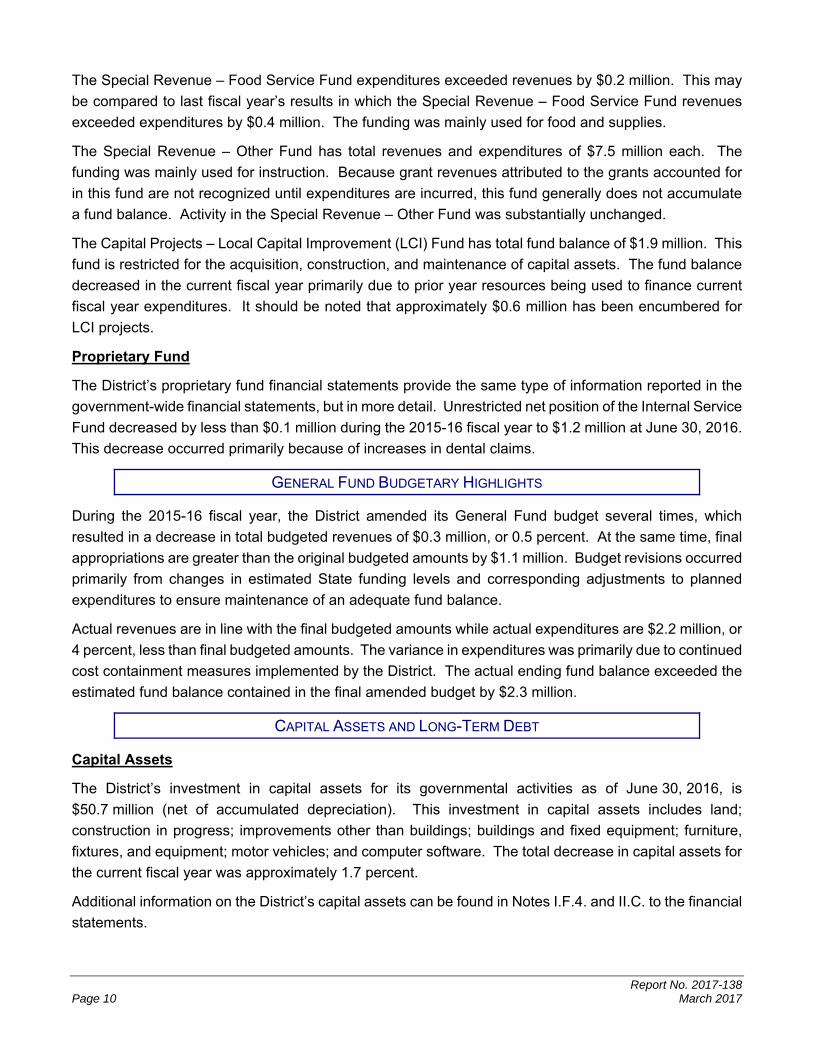
The Special Revenue – Food Service Fund expenditures exceeded revenues by $0.2 million. This may
be compared to last fiscal year’s results in which the Special Revenue – Food Service Fund revenues
exceeded expenditures by $0.4 million. The funding was mainly used for food and supplies.
The Special Revenue – Other Fund has total revenues and expenditures of $7.5 million each. The
funding was mainly used for instruction. Because grant revenues attributed to the grants accounted for
in this fund are not recognized until expenditures are incurred, this fund generally does not accumulate
a fund balance. Activity in the Special Revenue – Other Fund was substantially unchanged.
The Capital Projects – Local Capital Improvement (LCI) Fund has total fund balance of $1.9 million. This
fund is restricted for the acquisition, construction, and maintenance of capital assets. The fund balance
decreased in the current fiscal year primarily due to prior year resources being used to finance current
fiscal year expenditures. It should be noted that approximately $0.6 million has been encumbered for
LCI projects.
Proprietary Fund
The District’s proprietary fund financial statements provide the same type of information reported in the
government-wide financial statements, but in more detail. Unrestricted net position of the Internal Service
Fund decreased by less than $0.1 million during the 2015-16 fiscal year to $1.2 million at June 30, 2016.
This decrease occurred primarily because of increases in dental claims.
GENERAL FUND BUDGETARY HIGHLIGHTS
During the 2015-16 fiscal year, the District amended its General Fund budget several times, which
resulted in a decrease in total budgeted revenues of $0.3 million, or 0.5 percent. At the same time, final
appropriations are greater than the original budgeted amounts by $1.1 million. Budget revisions occurred
primarily from changes in estimated State funding levels and corresponding adjustments to planned
expenditures to ensure maintenance of an adequate fund balance.
Actual revenues are in line with the final budgeted amounts while actual expenditures are $2.2 million, or
4 percent, less than final budgeted amounts. The variance in expenditures was primarily due to continued
cost containment measures implemented by the District. The actual ending fund balance exceeded the
estimated fund balance contained in the final amended budget by $2.3 million.
CAPITAL ASSETS AND LONG-TERM DEBT
Capital Assets
The District’s investment in capital assets for its governmental activities as of June 30, 2016, is
$50.7 million (net of accumulated depreciation). This investment in capital assets includes land;
construction in progress; improvements other than buildings; buildings and fixed equipment; furniture,
fixtures, and equipment; motor vehicles; and computer software. The total decrease in capital assets for
the current fiscal year was approximately 1.7 percent.
Additional information on the District’s capital assets can be found in Notes I.F.4. and II.C. to the financial
statements.

Report No. 2017-138 March 2017 Page 11
Long-Term Debt
At June 30, 2016, the District has total long-term debt outstanding of $4.8 million, composed of
$1.7 million of bonds payable and $3.1 million of certificates of participation payable. During the current
fiscal year, the District issued the Revenue Bond Series 2015 for $1.5 million and refunded the Revenue
Bond Series 1997 for $0.2 million. The retirement of debt was $0.5 million.
State school bonds outstanding at June 30, 2016, totaling $0.2 million, are secured by a pledge of the
District’s portion of the State-assessed motor vehicle license tax. The State’s full faith and credit is also
pledged as security for these bonds. Revenue bonds of $1.5 million are secured by pari-mutuel tax
proceeds. The District’s certificates of participation are not secured by specified revenue sources.
Additional information on the District’s long-term debt can be found in Notes I.F.4. and II.H. to the financial
statements.
OTHER MATTERS OF SIGNIFICANCE
Employer contributions to the Florida Retirement System increased for regular employees from
7.26 percent to 7.52 percent of payroll for the 2016-17 fiscal year.
Housing prices are expected to increase the taxable assessed property value for the 2016-17 fiscal year
resulting in increased property tax revenues.
REQUESTS FOR INFORMATION
This report is designed to provide a general overview of the District’s finances for all those with an interest
in the District’s finances. Questions concerning information provided in the MD&A or other required
supplementary information, and financial statements and notes thereto, or requests for additional
financial information should be addressed to the Superintendent, Hendry County District School Board,
25 East Hickpoochee Avenue, LaBelle, Florida 33935.
Report No. 2017-138 Page 12 March 2017
THIS PAGE INTENTIONALLY LEFT BLANK
Report No. 2017-138 March 2017 Page 13
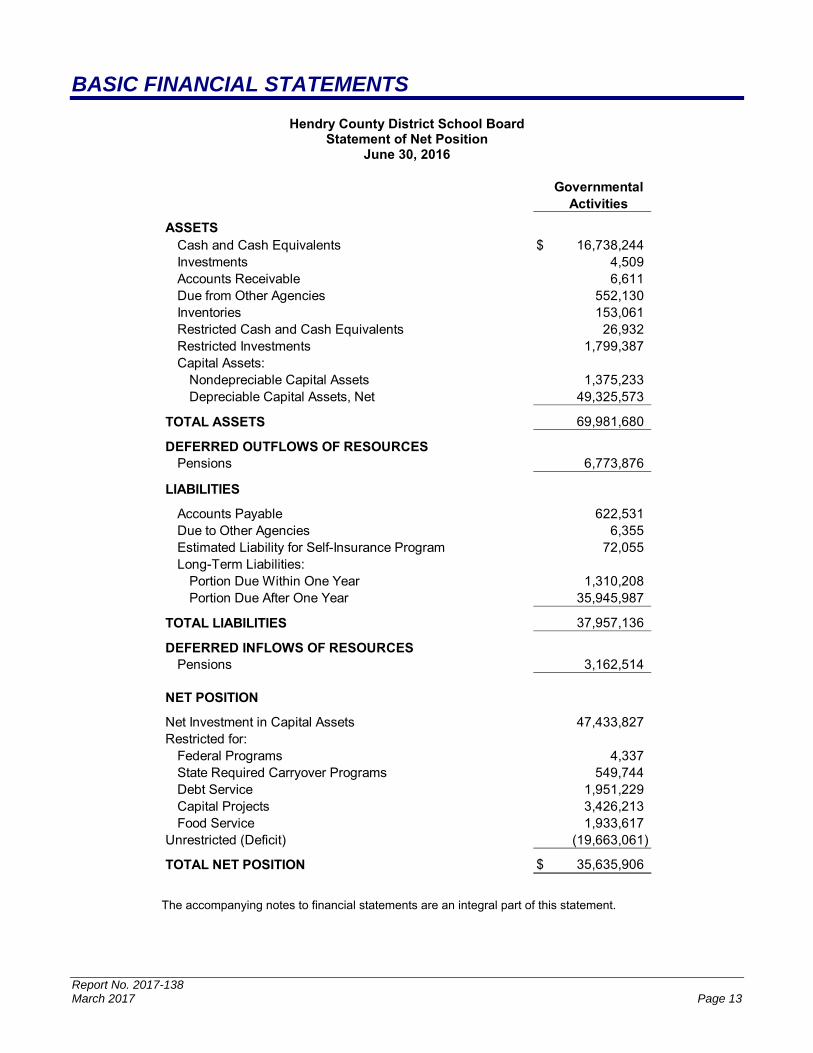
BASIC FINANCIAL STATEMENTS
Hendry County District School Board Statement of Net Position
June 30, 2016
GovernmentalActivities
ASSETSCash and Cash Equivalents $ 16,738,244 Investments 4,509 Accounts Receivable 6,611 Due from Other Agencies 552,130 Inventories 153,061 Restricted Cash and Cash Equivalents 26,932 Restricted Investments 1,799,387 Capital Assets:
Nondepreciable Capital Assets 1,375,233 Depreciable Capital Assets, Net 49,325,573
TOTAL ASSETS 69,981,680
DEFERRED OUTFLOWS OF RESOURCESPensions 6,773,876
LIABILITIES
Accounts Payable 622,531 Due to Other Agencies 6,355 Estimated Liability for Self-Insurance Program 72,055 Long-Term Liabilities:
Portion Due Within One Year 1,310,208 Portion Due After One Year 35,945,987
TOTAL LIABILITIES 37,957,136
DEFERRED INFLOWS OF RESOURCESPensions 3,162,514
NET POSITION
Net Investment in Capital Assets 47,433,827 Restricted for:
Federal Programs 4,337 State Required Carryover Programs 549,744 Debt Service 1,951,229 Capital Projects 3,426,213 Food Service 1,933,617
Unrestricted (Deficit) (19,663,061)
TOTAL NET POSITION $ 35,635,906
The accompanying notes to financial statements are an integral part of this statement.

Report No. 2017-138 Page 14 March 2017
Hendry County District School Board Statement of Activities
For the Fiscal Year Ended June 30, 2016
Charges Operatingfor Grants and
Expenses Services ContributionsFunctions/Programs
Governmental Activities:Instruction $ 37,543,129 $ - $ 8,080 Student Support Services 2,662,400 - - Instructional Media Services 851,255 - - Instruction and Curriculum Development Services 1,602,820 - - Instructional Staff Training Services 945,030 - - Instruction-Related Technology 531,623 - - Board 666,914 - - General Administration 1,397,246 - - School Administration 4,041,794 - - Facilities Acquisition and Construction 1,834,567 - - Fiscal Services 669,461 - - Food Services 4,360,555 152,901 4,142,178 Central Services 356,352 - - Student Transportation Services 2,776,973 122,336 - Operation of Plant 4,275,891 - - Maintenance of Plant 1,621,377 - - Administrative Technology Services 1,250,034 - - Unallocated Interest on Long-Term Debt 97,588 - - Unallocated Depreciation Expense 2,777,300 - - Loss on Disposal of Capital Assets 47,085 - -
Total Governmental Activities $ 70,309,394 $ 275,237 $ 4,150,258
General Revenues:Taxes: Property Taxes, Levied for Operational Purposes Property Taxes, Levied for Capital ProjectsGrants and Contributions Not Restricted to Specific ProgramsUnrestricted Investment EarningsMiscellaneous
Total General Revenues
Change in Net Position
Net Position - Beginning
Net Position - Ending
Program Revenues
The accompanying notes to financial statements are an integral part of this statement.
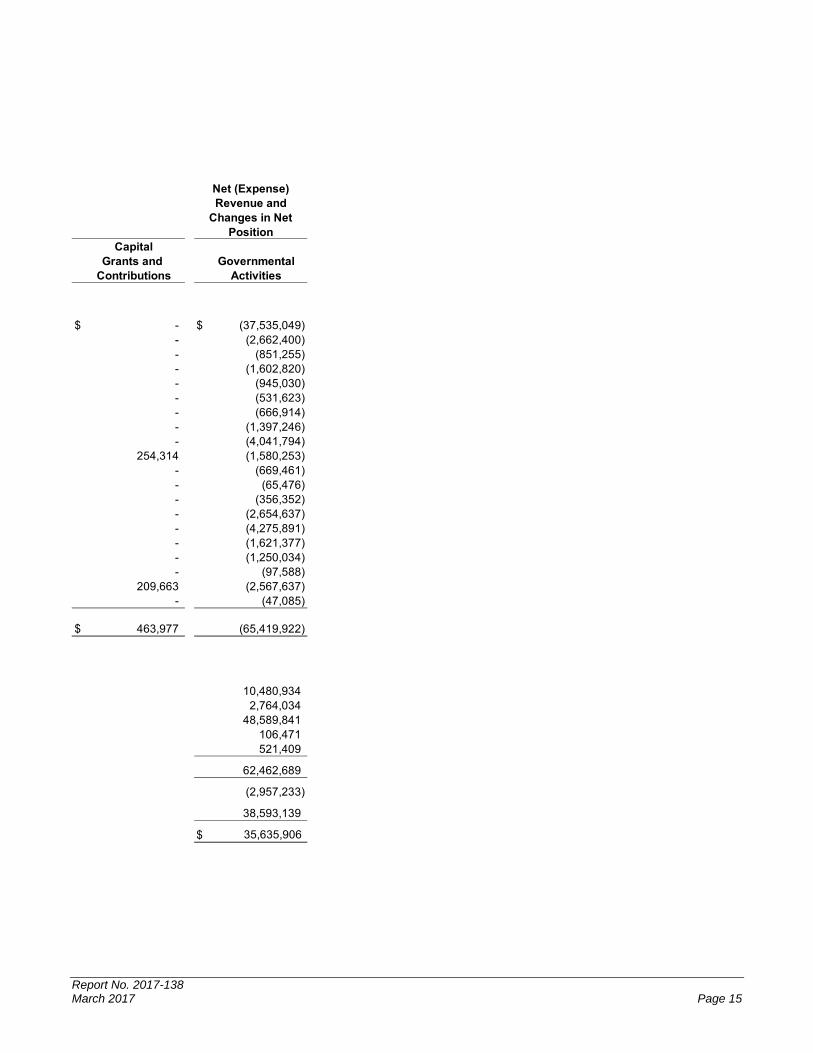
Report No. 2017-138 March 2017 Page 15
CapitalGrants and Governmental
Contributions Activities
$ - $ (37,535,049) - (2,662,400) - (851,255) - (1,602,820) - (945,030) - (531,623) - (666,914) - (1,397,246) - (4,041,794)
254,314 (1,580,253) - (669,461) - (65,476) - (356,352) - (2,654,637) - (4,275,891) - (1,621,377) - (1,250,034) - (97,588)
209,663 (2,567,637) - (47,085)
$ 463,977 (65,419,922)
10,480,934 2,764,034
48,589,841 106,471 521,409
62,462,689
(2,957,233)
38,593,139
$ 35,635,906
Net (Expense) Revenue and
Changes in Net Position

Report No. 2017-138 Page 16 March 2017
Hendry County District School Board Balance Sheet – Governmental Funds
June 30, 2016
Special Revenue - Special Revenue -General Food Service Other
Fund Fund Fund
ASSETS Cash and Cash Equivalents $ 9,862,158 $ 1,791,154 $ 5,042 Investments - - - Accounts Receivable 6,611 - - Due from Other Funds 265,866 129,897 29 Due from Other Agencies 12,268 93,810 444,187 Inventories 153,061 - - Restricted Cash and Cash Equivalents - - - Restricted Investments - - -
TOTAL ASSETS $ 10,299,964 $ 2,014,861 $ 449,258
LIABILITIES, DEFERRED INFLOWS OF RESOURCES, AND FUND BALANCESLiabilities:
Accounts Payable $ 210,828 $ 75,317 $ 55,085 Due to Other Funds 29 5,927 389,836 Due to Other Agencies 6,355 - -
Total Liabilities 217,212 81,244 444,921
Deferred Inflows of Resources:Unavailable Revenue - Capital Outlay and Debt Service - - -
Fund Balances:Nonspendable:
Inventories 153,061 - - Restricted for:
Federal Programs - - 4,337 State Required Carryover Programs 549,744 - - Debt Service - - - Capital Projects - - - Food Service - 1,933,617 -
Total Restricted Fund Balance 549,744 1,933,617 4,337 Committed for:
Economic Stabilization 5,570,090 - - Assigned for:
Emergency Fund 518,876 - - Purchases on Order 177,727 - -
Total Assigned Fund Balance 696,603 - - Unassigned Fund Balance 3,113,254 - -
Total Fund Balances 10,082,752 1,933,617 4,337
TOTAL LIABILITIES, DEFERRED INFLOWS OF RESOURCES,AND FUND BALANCES $ 10,299,964 $ 2,014,861 $ 449,258
The accompanying notes to financial statements are an integral part of this statement.

Report No. 2017-138 March 2017 Page 17
Capital Projects - Other TotalLocal Capital Governmental Governmental
Improvement Fund Funds Funds
$ 2,043,619 $ 1,784,296 $ 15,486,269 - 4,509 4,509 - - 6,611 - - 395,792 - 1,865 552,130 - - 153,061 - 26,932 26,932 - 1,799,387 1,799,387
$ 2,043,619 $ 3,616,989 $ 18,424,691
$ 188,240 $ 93,061 $ 622,531 - - 395,792 - - 6,355
188,240 93,061 1,024,678
- 1,865 1,865
- - 153,061
- - 4,337 - - 549,744 - 1,951,229 1,951,229
1,855,379 1,570,834 3,426,213 - - 1,933,617
1,855,379 3,522,063 7,865,140 -
- - 5,570,090 -
- - 518,876 - - 177,727 - - 696,603 - - 3,113,254
1,855,379 3,522,063 17,398,148
$ 2,043,619 $ 3,616,989 $ 18,424,691

Report No. 2017-138 Page 18 March 2017
Hendry County District School Board Reconciliation of the Governmental Funds Balance Sheet
to the Statement of Net Position June 30, 2016
Total Fund Balances - Governmental Funds $ 17,398,148
50,700,806
1,179,920
Deferred Outflows Related to Pensions $ 6,773,876
Deferred Inflows Related to Pensions (3,162,514) 3,611,362
1,865
Certificates of Participation Payable $ (3,068,200) Bonds Payable (1,698,779) Other Postemployment Benefits Payable (2,808,621) Compensated Absences Payable (6,185,889) Net Pension Liability (23,494,706) (37,256,195)
Net Position - Governmental Activities $ 35,635,906
Amounts reported for governmental activities in the statement of net position are different because:
Internal service funds are used by management to charge the costs of certain activities, such asinsurance, to individual funds. The assets and liabilities of the internal service funds are includedin governmental activities in the statement of net position.
Long-term liabilities are not due and payable in the fiscal year and, therefore, are not reported asliabilities in the governmental funds. Long-term liabilities at year-end consist of:
Capital assets, net of accumulated depreciation, used in governmental activities are not financialresources and, therefore, are not reported as assets in the governmental funds.
The deferred outflows of resources and deferred inflows of resources related to pensions areapplicable to future periods and, therefore, are not reported in the governmental funds.
A portion of capital outlay and debt service revenue is not available to pay current periodexpenditures and, therefore, is reported as unavailable revenue in the governmental fund
The accompanying notes to financial statements are an integral part of this statement.
Report No. 2017-138 March 2017 Page 19
THIS PAGE INTENTIONALLY LEFT BLANK

Report No. 2017-138 Page 20 March 2017
Hendry County District School Board Statement of Revenues, Expenditures, and Changes in
Fund Balances – Governmental Funds For the Fiscal Year Ended June 30, 2016
Revenues
Intergovernmental:Federal Through State and Local $ 394,502 $ 4,088,162 $ 7,462,613 State 40,402,912 54,016 -
Local:Property Taxes 10,480,934 - - Charges for Services - Food Service - 152,901 - Miscellaneous 609,224 44,410 - Total Local Revenues 11,090,158 197,311 -
Total Revenues 51,887,572 4,339,489 7,462,613
Expenditures
Current - Education:Instruction 32,014,536 - 4,863,654 Student Support Services 2,050,689 - 570,310 Instructional Media Services 820,690 - 12,639 Instruction and Curriculum Development Services 715,577 - 876,525 Instructional Staff Training Services 86,426 - 852,443 Instruction-Related Technology 345,866 - - Board 662,714 - - General Administration 1,214,982 - 164,617 School Administration 3,956,693 - - Facilities Acquisition and Construction 13,100 - 350 Fiscal Services 658,474 - - Food Services - 4,360,555 - Central Services 350,321 - - Student Transportation Services 2,651,257 - 83,869 Operation of Plant 4,241,866 - - Maintenance of Plant 1,595,793 - - Administrative Technology Services 1,235,613 - -
Fixed Capital Outlay:Facilities Acquisition and Construction - - - Other Capital Outlay 151,683 134,501 41,965
Debt Service:Principal - - - Interest and Fiscal Charges - - -
Total Expenditures 52,766,280 4,495,056 7,466,372
Excess (Deficiency) of Revenues Over Expenditures (878,708) (155,567) (3,759)
Other Financing Sources (Uses)
Transfers In - - - Issuance of Bonds - - - Payment to Bond AgentLoss Recoveries 1,442 - - Transfers Out - - -
Total Other Financing Sources (Uses) 1,442 - -
Net Change in Fund Balances (877,266) (155,567) (3,759) Fund Balances, Beginning 10,960,018 2,089,184 8,096
Fund Balances, Ending $ 10,082,752 $ 1,933,617 $ 4,337
GeneralFund
Special Revenue -Food Service
Fund
Special Revenue -OtherFund
The accompanying notes to financial statements are an integral part of this statement.

Report No. 2017-138 March 2017 Page 21
$ - $ 190,720 $ 12,135,997 - 603,071 41,059,999
2,764,034 - 13,244,968 - - 152,901
6,300 47,970 707,904 2,770,334 47,970 14,105,773
2,770,334 841,761 67,301,769
- - 36,878,190 - - 2,620,999 - - 833,329 - - 1,592,102 - 4,790 943,659 - 185,757 531,623 - - 662,714 - 173 1,379,772 - - 3,956,693
1,509,777 264,255 1,787,482 - - 658,474 - - 4,360,555 - - 350,321 - - 2,735,126 - - 4,241,866 - - 1,595,793 - - 1,235,613
1,541,658 87,000 1,628,658 - - 328,149
- 291,000 291,000 - 102,028 102,028
3,051,435 935,003 68,714,146
(281,101) (93,242) (1,412,377)
- 186,663 186,663 - 1,500,000 1,500,000 - (205,000) (205,000) - - 1,442
(161,231) (25,432) (186,663)
(161,231) 1,456,231 1,296,442
(442,332) 1,362,989 (115,935) 2,297,711 2,159,074 17,514,083
$ 1,855,379 $ 3,522,063 $ 17,398,148
TotalGovernmental
Funds
Capital Projects -Local Capital
Improvement Fund
OtherGovernmental
Funds

Report No. 2017-138 Page 22 March 2017
Hendry County District School Board Reconciliation of the Governmental Funds Statement of Revenues, Expenditures,
and Changes in Fund Balances to the Statement of Activities For the Fiscal Year Ended June 30, 2016
Net Change in Fund Balances - Governmental Funds $ (115,935)
(820,493)
(47,085)
Bonds Issued $ (1,500,000) Bonds Refunded 205,000 Bond Repayments 291,000 Amortization of Premiums 5,926 (998,074)
Deferred Inflows - Current Year $ 1,865 Deferred Inflows - Prior Year (7,227) (5,362)
(1,180,976)
(463,060)
$ 2,078,325 573,226
(1,067,306) (897,718) 686,527
(12,775)
Change in Net Position - Governmental Activities $ (2,957,233)
Amounts reported for governmental activities in the statement of activities are different because:
The loss on the disposal of capital assets during the current fiscal year is reported in the statement ofactivities. In the governmental funds, the cost of these assets was recognized as an expenditure in the fiscalyear purchased. Thus, the change in net position differs from the change in fund balance by theundepreciated cost of the disposed assets.
Long-term debt proceeds provide current financial resources to the governmental funds, but issuing debtincreases long-term liabilities in the statement of net position. Repayment of long-term debt is anexpenditure in the governmental funds, but the repayment reduces long-term liabilities in the statement ofnet position. This is the amount by which proceeds exceed repayments and amortization of premiums in the current fiscal year.
The government funds reported deferred inflows of resources related to unavailable capital outlay and debtservice revenue. This amount is accrued and reported as revenue on the statement of activities.
Internal service funds are used by management to charge the cost of certain activities, such as insurance, toindividual funds. The net expense of internal service funds is reported with governmental activities.
Capital outlays are reported in the governmental funds as expenditures. However, in the statement ofactivities, the cost of those assets is allocated over their estimated useful lives as depreciation expense.This is the amount of depreciation expense in excess of capital outlays in the current fiscal year.
In the statement of activities, the cost of compensated absences is measured by the amounts earned duringthe year, while in the governmental funds, expenditures are recognized based on the amounts actually paidfor compensated absences. This is the net amount of compensated absences earned in excess of theamount paid in the current fiscal year.
Other postemployment benefits costs are recorded in the statement of activities under the full accrual basisof accounting, but are not recorded in the governmental funds until paid. This is the net increase in theother postemployment benefits liability for the current fiscal year.
Governmental funds report District pension contributions as expenditures. However, in the statement ofactivities, the cost of pension benefits earned net of employee contributions is reported as a pensionexpense.
FRS Pension ContributionHIS Pension ContributionFRS Pension ExpenseHIS Pension Expense
The accompanying notes to financial statements are an integral part of this statement.

Report No. 2017-138 March 2017 Page 23
Hendry County District School Board Statement of Net Position – Proprietary Fund
June 30, 2016
ASSETS
Current Assets: Cash and Cash Equivalents $ 1,251,975
LIABILITIES
Current Liabilities: Estimated Liability for Self-Insurance Program 72,055
NET POSITION
Unrestricted $ 1,179,920
Governmental Activities -
Internal ServiceFund
The accompanying notes to financial statements are an integral part of this statement.

Report No. 2017-138 Page 24 March 2017
Hendry County District School Board Statement of Revenues, Expenses, and Changes in Fund
Net Position – Proprietary Fund For the Fiscal Year Ended June 30, 2016
OPERATING REVENUES Premium Revenue from Board and Participant's Funds $ 519,021
OPERATING EXPENSES Insurance Claims 463,709 Other 68,087
Total Operating Expenses 531,796
Operating Loss (12,775)
Change in Net Position (12,775) Total Net Position - Beginning 1,192,695
Total Net Position - Ending $ 1,179,920
FundInternal Service
Activities -Governmental
The accompanying notes to financial statements are an integral part of this statement.
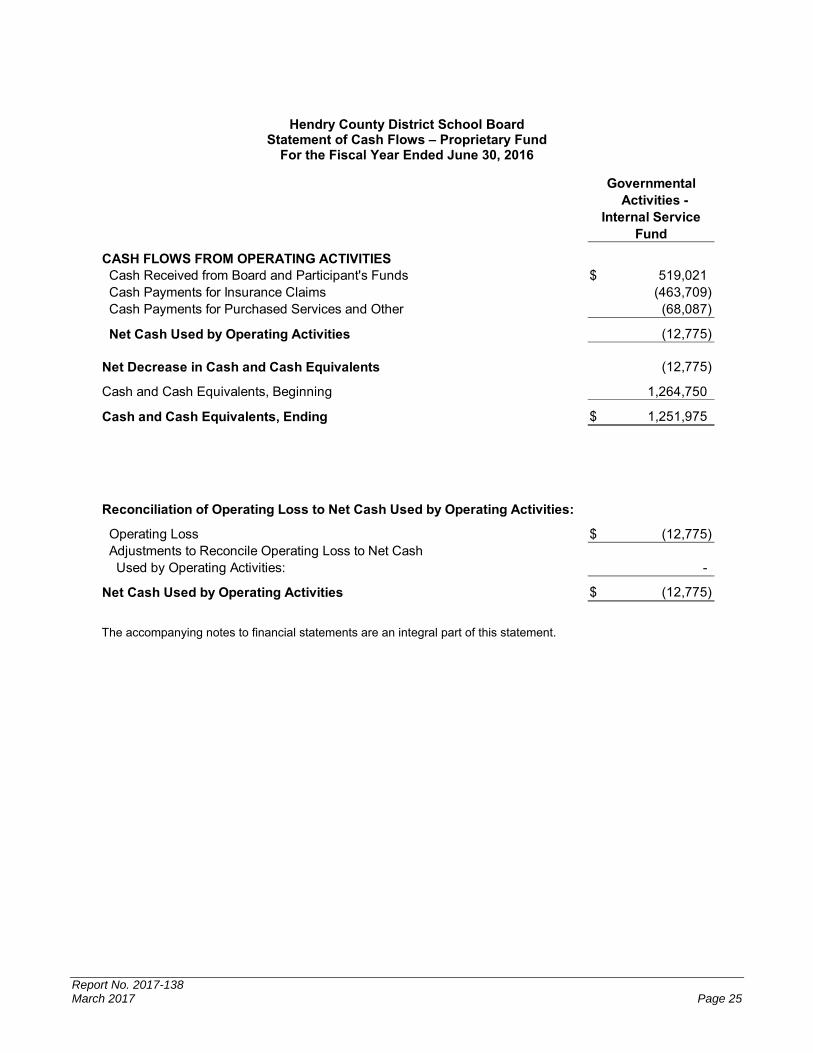
Report No. 2017-138 March 2017 Page 25
Hendry County District School Board Statement of Cash Flows – Proprietary Fund
For the Fiscal Year Ended June 30, 2016
CASH FLOWS FROM OPERATING ACTIVITIES Cash Received from Board and Participant's Funds $ 519,021 Cash Payments for Insurance Claims (463,709) Cash Payments for Purchased Services and Other (68,087)
Net Cash Used by Operating Activities (12,775)
Net Decrease in Cash and Cash Equivalents (12,775)
Cash and Cash Equivalents, Beginning 1,264,750
Cash and Cash Equivalents, Ending $ 1,251,975
Reconciliation of Operating Loss to Net Cash Used by Operating Activities:
Operating Loss $ (12,775) Adjustments to Reconcile Operating Loss to Net Cash Used by Operating Activities: -
Net Cash Used by Operating Activities $ (12,775)
Governmental Activities -
Internal ServiceFund
The accompanying notes to financial statements are an integral part of this statement.

Report No. 2017-138 Page 26 March 2017
Hendry County District School Board Statement of Fiduciary Net Position – Fiduciary Funds
June 30, 2016
ASSETS
Cash and Cash Equivalents $ 9,406 $ 939,625 Investments - 59,677
TOTAL ASSETS $ 9,406 $ 999,302
LIABILITIES
Internal Accounts Payable $ - $ 999,302
NET POSITION
Held in Trust for Scholarships and Other Purposes $ 9,406
Private-Purpose Trust Fund
AgencyFunds
The accompanying notes to financial statements are an integral part of this statement.

Report No. 2017-138 March 2017 Page 27
Hendry County District School Board Statement of Changes in Fiduciary Net Position – Fiduciary Funds
For the Fiscal Year Ended June 30, 2016
ADDITIONS
Contributions: Gifts, Grants, Endowments, and Bequests $ 36,570
Investment Income: Interest, Dividends, and Other 32
Total Additions 36,602
DEDUCTIONS
Program Services - Mini-Grants for School Programs 23,081 Program Services - Other 10,899 Administrative Expenses 1,497
Total Deductions 35,477
Change in Net Position 1,125 Net Position - Beginning 8,281
Net Position - Ending $ 9,406
Private-PurposeTrust Fund
The accompanying notes to financial statements are an integral part of this statement.

Report No. 2017-138 Page 28 March 2017
NOTES TO FINANCIAL STATEMENTS
SUMMARY OF SIGNIFICANT ACCOUNTING POLICIES
A. Description of Government-wide Financial Statements
The government-wide financial statements (i.e., the statement of net position and the statement of
activities) report information on all of the nonfiduciary activities of the primary government and its
component units. All fiduciary activities are reported only in the fund financial statements.
Governmental activities are normally supported by taxes, intergovernmental revenues, and other
nonexchange transactions.
The statement of activities presents a comparison between direct expenses and program revenues
for each function or program of the Hendry County School District’s (District) governmental activities.
Direct expenses are those that are specifically associated with a service, program, or department and
are thereby clearly identifiable to a particular function. Depreciation expense is not readily associated
with a particular function and is reported as unallocated.
B. Reporting Entity
The Hendry County District School Board (Board) has direct responsibility for operation, control, and
supervision of District schools and is considered a primary government for financial reporting. The
District is considered part of the Florida system of public education, operates under the general
direction of the Florida Department of Education (FDOE), and is governed by State law and State
Board of Education (SBE) rules. The governing body of the District is the Board, which is typically
composed of five elected members. Due to a Board member position vacancy during the
2014-15 fiscal year, the Governor appointed one of the five Board members. The elected
Superintendent of Schools is the executive officer of the Board. Geographic boundaries of the District
correspond with those of Hendry County.
Criteria for determining if other entities are potential component units that should be reported within
the District’s basic financial statements are identified and described in the Governmental Accounting
Standards Board’s (GASB) Codification of Governmental Accounting and Financial Reporting
Standards, Sections 2100 and 2600. The application of these criteria provides for identification of
any legally separate entities for which the Board is financially accountable and other organizations
for which the nature and significance of their relationship with the Board are such that exclusion would
cause the District’s basic financial statements to be misleading. Based on these criteria, the following
blended component units are included within the District’s reporting entity:
The Hendry County School Board Leasing Corporation (Leasing Corporation) was formed to facilitate financing for the acquisition of facilities and equipment as further discussed in Note II.H. Due to the substantive economic relationship between the District and the Leasing Corporation, the financial activities of the Leasing Corporation are included in the accompanying basic financial statements. Separate financial statements for the Leasing Corporation are not published.
The Hendry Public Schools Foundation, Inc. (Foundation) is a separate not-for-profit corporation organized and operated as a direct-support organization to receive, hold, invest, and administer property and to make expenditures to and for the benefit of public prekindergarten through

Report No. 2017-138 March 2017 Page 29
postsecondary education in the State in the form of money and other forms of property and services to the Board. Since the Foundation’s governing body is substantively the same as Board, the financial activities of the Foundation are included in the accompanying basic financial statements. An annual audit of the Foundation’s financial statements is conducted by an independent certified public accountant and is filed in the District’s administrative office at 25 E. Hickpoochee Avenue, LaBelle, Florida 33935.
C. Basis of Presentation: Government-wide Financial Statements
While separate government-wide and fund financial statements are presented, they are interrelated.
The governmental activities column incorporates data from governmental funds and an internal
service fund. Separate financial statements are provided for governmental funds, proprietary fund,
and fiduciary funds, even though the latter are excluded from the government-wide financial
statements.
The effects of interfund activity have been eliminated from the government-wide financial statements
except for interfund services provided and used.
D. Basis of Presentation: Fund Financial Statements
The fund financial statements provide information about the District’s funds, including the fiduciary
funds and blended component units. Separate statements for each fund category – governmental,
proprietary, and fiduciary – are presented. The emphasis of fund financial statements is on major
governmental funds, each displayed in a separate column. All remaining governmental funds are
aggregated and reported as nonmajor funds.
The District reports the following major governmental funds:
General Fund – to account for all financial resources not required to be accounted for in another fund, and for certain revenues from the State that are legally restricted to be expended for specific current operating purposes.
Special Revenue – Food Service Fund – to account for food service revenues and expenditures.
Special Revenue – Other Fund – to account for certain Federal grant program resources.
Capital Projects – Local Capital Improvement Fund – to account for the financial resources generated by the local capital improvement tax levy to be used for educational capital outlay needs, including new construction, renovation and remodeling projects and debt service payments on certain bonds.
Additionally, the District reports the following proprietary and fiduciary fund types:
Internal Service Fund – to account for the District’s employee dental benefit program.
Private-Purpose Trust Fund – to account for resources of the Foundation.
Agency Funds – to account for resources of the school internal funds, which are used to administer moneys collected at several schools in connection with school, student athletic, class, and club activities.
During the course of operations the District has activity between funds for various purposes. Any
residual balances outstanding at fiscal year-end are reported as due from/to other funds. While these
balances are reported in fund financial statements, certain eliminations are made in the preparation
of the government-wide financial statements. Balances between the funds included in governmental

Report No. 2017-138 Page 30 March 2017
activities (i.e., the governmental and internal service funds) are eliminated so that only the net amount
is included as internal balances in the governmental activities column. Further, certain activity occurs
during the year involving transfers of resources between funds. In fund financial statements, these
amounts are reported at gross amounts as transfers in and out. While reported in fund financial
statements, transfers between funds are eliminated in the preparation of the government-wide
financial statements.
E. Measurement Focus and Basis of Accounting
The accounting and financial reporting treatment is determined by the applicable measurement focus
and basis of accounting. Measurement focus indicates the type of resources being measured such
as current financial resources or economic resources. The basis of accounting indicates the timing
of transactions or events for recognition in the financial statements.
The government-wide financial statements are reported using the economic resources measurement
focus and the accrual basis of accounting. Revenues are recognized when earned and expenses
are recognized when a liability is incurred, regardless of the timing of the related cash flows. Property
taxes are recognized in the year for which they are levied. Revenues from grants, entitlements, and
donations are recognized in the fiscal year in which all eligibility requirements imposed by the provider
have been satisfied.
The governmental fund financial statements are reported using the current financial resources
measurement focus and the modified accrual basis of accounting. Revenues, except for certain grant
revenues, are recognized when they become measurable and available. Revenues are considered
to be available when they are collectible within the current period or soon enough thereafter to pay
liabilities of the current period. The District considers revenues to be available if they are collected
within 60 days of the end of the current fiscal year. When grant terms provide that the expenditure
of resources is the prime factor for determining eligibility for Federal, State, and other grant resources,
revenue is recognized at the time the expenditure is made. Entitlements are recorded as revenues
when all eligibility requirements are met, including any time requirements, and the amount is received
during the period or within the availability period for this revenue source (within 60 days of year-end).
Expenditures are generally recognized when the related fund liability is incurred, as under accrual
accounting. However, debt service expenditures, claims and judgments, pension benefits, other
postemployment benefits, and compensated absences, are only recorded when payment is due.
General capital asset acquisitions are reported as expenditures in governmental funds. Issuance of
long-term debt are reported as other financing sources. Allocations of cost, such as depreciation, are
not recognized in governmental funds.
The proprietary fund is reported using the economic resources measurement focus and the accrual
basis of accounting. Fiduciary funds include a trust fund and agency funds. The trust fund uses the
economic resources measurement focus and accrual basis of accounting. Agency funds are unlike
all other types of funds and report only assets and liabilities. The agency funds do not have a
measurement focus, but do use an accrual basis of accounting to recognize assets and liabilities.
Report No. 2017-138 March 2017 Page 31
F. Assets, Liabilities, Deferred Outflows/Inflows of Resources, and Net Position/Fund
Balance
Cash and Cash Equivalents
The District’s cash and cash equivalents are considered to be cash on hand, demand deposits,
and short-term, liquid investments with original maturities of 3 months or less from the date of
acquisition. Investments classified as cash equivalents include amounts placed with the State
Board of Administration (SBA) in Florida PRIME.
Cash deposits are held by banks qualified as public depositories under Florida law. All deposits
are insured by Federal depository insurance, up to specified limits, or collateralized with securities
held in Florida's multiple financial institution collateral pool as required by Chapter 280, Florida
Statutes.
Investments
Investments consist of amounts placed in the SBA debt service accounts for investment of debt
service moneys, amounts placed with the SBA for participation in the Florida PRIME investment
pool created by Section 218.405, Florida Statutes, and those made locally. The investment pool
operates under investment guidelines established by Section 215.47, Florida Statutes.
The District’s investments in Florida PRIME, which the SBA indicates is a Securities and
Exchange Commission Rule 2a7-like external investment pool, are similar to money market funds
in which shares are owned in the fund rather than the underlying investments. These investments
are reported at fair value, which is amortized cost.
Investments made locally consist of Federal National Mortgage Association (FNMA) discount note
held by a trustee under a paying agent agreement in connection with the Qualified Zone Academy
Bonds (QZABs) financing arrangement (see Note II.H.1.). Types and amounts of investments
held at fiscal year-end are described in a subsequent note.
Inventories
Inventories consist of expendable supplies held for consumption in the course of District
operations. Central warehouse, maintenance, and transportation inventories are stated at cost
on a moving-average basis. Purchased food and cafeteria supplies are stated at actual cost.
United States Department of Agriculture donated foods are stated at their fair value as determined
at the time of donation to the District's food service program by the Florida Department of
Agriculture and Consumer Services, Bureau of Food Distribution. The costs of inventories are
recorded as expenditures when used rather than purchased.
Capital Assets
Expenditures for capital assets acquired or constructed for general District purposes are reported
in the governmental fund that financed the acquisition or construction. The capital assets so
acquired are reported at cost in the government-wide statement of net position but are not
reported in the governmental fund financial statements. Capital assets are defined by the District
as those costing $1,000 or more. Such assets are recorded at historical cost or estimated

Report No. 2017-138 Page 32 March 2017
historical cost if purchased or constructed. Donated assets are recorded at acquisition value at
the date of donation.
Capital assets are depreciated using the straight-line method over the following estimated useful
lives:
Description Estimated Useful Lives
Improvements Other Than Buildings 10 and 20 years
Buildings and Fixed Equipment 20 - 50 years
Furniture, Fixtures, and Equipment 5 and 10 years
Motor Vehicles 4 and 10 years
Computer Software 3 years
Current year information relative to changes in capital assets is described in a subsequent note.
Pensions
In the government-wide statement of net position, liabilities are recognized for the District’s
proportionate share of each pension plan’s net pension liability. For purposes of measuring the
net pension liability, deferred outflows of resources and deferred inflows of resources related to
pensions, and pension expense, information about the fiduciary net position of the Florida
Retirement System (FRS) defined benefit plan and the Health Insurance Subsidy (HIS) defined
benefit plan and additions to/deductions from the FRS and the HIS fiduciary net position have
been determined on the same basis as they are reported by the FRS and the HIS plans. For this
purpose, benefit payments (including refunds of employee contributions) are recognized when
due and payable in accordance with benefit terms. Investments are reported at fair value.
The District’s retirement plans and related amounts are described in a subsequent note.
Long-Term Liabilities
Long-term obligations that will be financed from resources to be received in the future by
governmental funds are reported as liabilities in the government-wide statement of net position.
Debt premiums and discounts are deferred and amortized over the life of the bonds using the
effective interest method. Bonds payable are reported net of the applicable premium or discount.
In the governmental fund financial statements, bonds and other long-term obligations are not
recognized as liabilities until due. The face amount of debt issued is reported as other financing
sources.
Changes in long-term liabilities for the current year are reported in a subsequent note.
Deferred Outflows/Inflows of Resources
In addition to assets, the statement of net position reports a separate section for deferred outflows
of resources. This separate financial statement element, deferred outflows of resources,
represents a consumption of net position that applies to future periods and so will not be
recognized as an outflow of resources (expense) until then. The District only has one item that
qualifies for reporting in this category. The item, deferred outflows of resources related to
pensions, is discussed in a subsequent note.
Report No. 2017-138 March 2017 Page 33
In addition to liabilities, the statement of net position and the governmental funds balance sheet
report a separate section for deferred inflows of resources. This separate financial statement
element, deferred inflows of resources, represents an acquisition of net position that applies to
future periods and so will not be recognized as an inflow of resources (revenue) until that time.
The District has two types of items that qualify for reporting in this category. The first is the
deferred amount on pension reported only in the government-wide statement of net position. A
deferred amount on pension results from the difference in the expected and actual amounts of
experience, earnings, and contributions. This amount is deferred and amortized over the service
life of all employees that are provided with pensions through the pension plan except earnings
which are amortized over 5 years. The second item, which arises only under a modified accrual
basis of accounting, is unavailable revenue from the State of Florida for capital outlay and debt
service. This amounts are deferred and recognized as an inflow of resources in the period that
the amounts become available on the governmental funds balance sheet.
Net Position Flow Assumption
The District occasionally funds outlays for a particular purpose from both restricted (e.g., restricted
bond or grant proceeds) and unrestricted resources. To calculate the amounts to report as
restricted – net position and unrestricted – net position in the government-wide and proprietary
fund financial statements, a flow assumption must be made about the order in which the resources
are considered to be applied. Consequently, it is the District’s policy to consider restricted – net
position to have been depleted before unrestricted – net position is applied.
Fund Balance Flow Assumptions
The District may fund outlays for a particular purpose from both restricted and unrestricted
resources (the total of committed, assigned, and unassigned fund balance). To calculate the
amounts to report as restricted, committed, assigned, and unassigned fund balance in the
governmental fund financial statements, a flow assumption must be made about the order in
which the resources are considered to be applied. It is the District’s policy to consider restricted
fund balance to have been depleted before using any of the components of unrestricted fund
balance. Further, when components of unrestricted fund balance can be used for the same
purpose, committed fund balance is depleted first, followed by assigned fund balance.
Unassigned fund balance is applied last.
Fund Balance Policies
Fund balance of governmental funds is reported in various categories based on the nature of any
limitations requiring the use of resources for specific purposes. The District itself can establish
limitations on the use of resources through either a commitment (committed fund balance) or an
assignment (assigned fund balance).
The committed fund balance classification includes amounts that can be used only for the specific
purposes determined by a formal action of the District’s highest level of decision-making authority.
The Board is the highest level of decision-making authority for the District that can, by adoption
of a resolution prior to the end of the fiscal year, commit fund balance. Once adopted, the

Report No. 2017-138 Page 34 March 2017
limitation imposed by the resolution remains in place until a similar action is taken (the adoption
of another resolution) to remove or revise the limitation.
Amounts in the assigned fund balance classification are intended to be used by the District for
specific purposes but do not meet the criteria to be classified as committed. The Board has by
resolution authorized the Finance Director to assign fund balance. The Board may also assign
fund balance as it does when appropriating fund balance to cover a gap between estimated
revenue and appropriations in the subsequent year’s appropriated budget. Unlike commitments,
assignments generally only exist temporarily. In other words, an additional action does not
normally have to be taken for the removal of an assignment. Conversely, as discussed above,
an additional action is essential to either remove or revise a commitment.
On July 9, 2013, the Board adopted Board Policy No. 548, which established a stabilization
arrangement. The stabilization arrangement reserves 7 percent of General Fund annual
revenues to be used for economic stabilization. The policy further subdivides the 7 percent
amount into a 6 percent strategic reserve (unassigned fund balance), a 1 percent contingency
reserve (assigned - emergency fund), and the remainder fund balance to be committed for
economic stabilization. The policy grants the Superintendent authority to utilize the 1 percent
contingency reserve and requires the Superintendent to advise the Board in the next subsequent
meeting in the event of such utilization. At June 30, 2016, committed General Fund balance was
$5,570,090 for economic stabilization and assigned fund balance was $518,876 for an emergency
fund.
G. Revenues and Expenditures/Expenses
Program Revenues
Amounts reported as program revenues include charges paid by the recipient of the goods or
services offered by the program, and grants and contributions that are restricted to meeting the
operational or capital requirements of a particular program. All taxes, including those dedicated
for specific purposes, and other internally dedicated resources are reported as general revenues
rather than program revenues. Revenues that are not classified as program revenues are
presented as general revenues. The comparison of direct expenses with program revenues
identifies the extent to which each governmental function is self-financing or draws from the
general revenues of the District.
State Revenue Sources
Significant revenues from State sources for current operations include the Florida Education
Finance Program administered by the FDOE under the provisions of Section 1011.62, Florida
Statutes. In accordance with this law, the District determines and reports the number of full-time
equivalent (FTE) students and related data to the FDOE. The FDOE performs certain edit checks
on the reported number of FTE and related data and calculates the allocation of funds to the
District. The District is permitted to amend its original reporting for a period of 5 months following
the date of the original reporting. Such amendments may impact funding allocations for
subsequent fiscal years. The FDOE may also adjust subsequent fiscal period allocations based

Report No. 2017-138 March 2017 Page 35
upon an audit of the District's compliance in determining and reporting FTE and related data.
Normally, such adjustments are treated as reductions or additions of revenue in the fiscal year
when the adjustments are made.
The State provides financial assistance to administer certain educational programs. SBE rules
require that revenue earmarked for certain programs be expended only for the program for which
the money is provided, and require that the money not expended as of the close of the fiscal year
be carried forward into the following fiscal year to be expended for the same educational
programs. The FDOE generally requires that these educational program revenues be accounted
for in the General Fund. A portion of the fund balance of the General Fund is restricted in the
governmental fund financial statements for the balance of categorical and earmarked educational
program resources.
The State allocates gross receipts taxes, generally known as Public Education Capital Outlay
money, to the District on an annual basis. The District is authorized to expend these funds only
upon applying for and receiving an encumbrance authorization from the FDOE. Accordingly, the
District recognizes the allocation of Public Education Capital Outlay funds as unearned revenue
until such time as an encumbrance authorization in received.
A schedule of revenue from State sources for the current year is presented in a subsequent note.
District Property Taxes
The Board is authorized by State law to levy property taxes for district school operations, capital
improvements, and debt service.
Property taxes consist of ad valorem taxes on real and personal property within the District.
Property values are determined by the Hendry County Property Appraiser, and property taxes are
collected by the Hendry County Tax Collector.
The Board adopted the 2015 tax levy on September 8, 2015. Tax bills are mailed in October and
taxes are payable between November 1 of the year assessed and March 31 of the following year
at discounts of up to 4 percent for early payment.
Taxes become a lien on the property on January 1, and are delinquent on April 1, of the year
following the year of assessment. State law provides for enforcement of collection of personal
property taxes by seizure of the property to satisfy unpaid taxes, and for enforcement of collection
of real property taxes by the sale of interest-bearing tax certificates to satisfy unpaid taxes. The
procedures result in the collection of essentially all taxes prior to June 30 of the year following the
year of assessment.
Property tax revenues are recognized in the government-wide financial statements when the
Board adopts the tax levy. Property tax revenues are recognized in the governmental fund
financial statements when taxes are received by the District, except that revenue is accrued for
taxes collected by the Hendry County Tax Collector at fiscal year-end but not yet remitted to the
District.
Millages and taxes levied for the current year are presented in a subsequent note.
Report No. 2017-138 Page 36 March 2017
Federal Revenue Sources
The District receives Federal awards for the enhancement of various educational programs.
Federal awards are generally received based on applications submitted to, and approved by,
various granting agencies. For Federal awards in which a claim to these grant proceeds is based
on incurring eligible expenditures, revenue is recognized to the extent that eligible expenditures
have been incurred.
Compensated Absences
In the government-wide financial statements, compensated absences (i.e., paid absences for
employee vacation leave and sick leave) are accrued as liabilities to the extent that it is probable
that the benefits will result in termination payments. A liability for these amounts is reported in
the governmental fund financial statements only if it has matured, such as for occurrences of
employee resignations and retirements. The liability for compensated absences includes
salary-related benefits, where applicable.
Proprietary Fund Operating and Nonoperating Revenues and Expenses
Proprietary funds distinguish operating revenues and expenses from nonoperating items.
Operating revenues and expenses generally result from providing services and producing and
delivering goods in connection with the proprietary fund’s principal ongoing operations. The
principal operating revenues of the District’s internal service fund are Board contributions for
dental insurance premiums. Operating expenses include insurance claims and administrative
expenses. All revenues and expenses not meeting this definition are reported as nonoperating
revenues and expenses.
DETAILED NOTES ON ALL ACTIVITIES AND FUNDS
A. Cash Deposits with Financial Institutions
Custodial Credit Risk-Deposits. In the case of deposits, this is the risk that in the event of a bank
failure, the District’s deposits may not be returned to the District. The District does not have a policy
for custodial credit risk. All bank balances of the District are fully insured or collateralized as required
by Chapter 280, Florida Statutes.

Report No. 2017-138 March 2017 Page 37
B. Investments
As of June 30, 2016, the District had the following investments:
Maturities Fair Value
SBA: Florida PRIME (1) 39 Day Average 10,048,988$ Debt Service Accounts 6 Months 4,509 United States Government Instrumentality Obligations:
FNMA Discount Note (2) November 15, 2016 1,799,387
Total Investments 11,852,884$
Investments
Notes: (1) This investment is reported as a cash equivalent for financial statement reporting purposes.
(2) This investment is held by a trustee under a paying agent agreement in connection with the QZAB financing arrangement (see Note II.H.1.).
Fair Value Measurement
The District categorizes its fair value measurements within the fair value hierarchy established by
generally accepted accounting principles. The hierarchy is based on the valuation inputs used to
measure the fair value of the asset. Level 1 inputs are quoted prices in active markets for identical
assets; Level 2 inputs are significant other observable inputs; Level 3 inputs are significant
unobservable inputs. The SBA debt service accounts and the FNMA discount note are valued using
Level 1 inputs.
Interest Rate Risk
Interest rate risk is the risk that changes in interest rates will adversely affect the fair value of an
investment. Section 218.415(17), Florida Statutes, limits investment maturities to provide sufficient
liquidity to pay obligations as they come due. The District does not have a formal investment policy
that limits investment maturities as a means of managing its exposure to fair value losses from
increasing interest rates.
Florida PRIME uses a weighted average days to maturity (WAM). A portfolio’s WAM reflects the
average maturity in days based on final maturity or reset date, in the case of floating rate instruments.
WAM measures the sensitivity of the portfolio to interest rate changes.
For Florida PRIME, Section 218.409(8)(a), Florida Statutes, states that “the principal, and any part
thereof, of each account constituting the trust fund is subject to payment at any time from the moneys
in the trust fund. However, the executive director may, in good faith, on the occurrence of an event
that has a material impact on liquidity or operations of the trust fund, for 48 hours limit contributions
to or withdrawals from the trust fund to ensure that the Board [State Board of Administration] can
invest moneys entrusted to it in exercising its fiduciary responsibility. Such action must be
immediately disclosed to all participants, the trustees, the Joint Legislative Auditing Committee, the
Investment Advisory Council, and the Participant Local Government Advisory Council. The trustees
shall convene an emergency meeting as soon as practicable from the time the executive director has
instituted such measures and review the necessity of those measures. If the trustees are unable to
convene an emergency meeting before the expiration of the 48-hour moratorium on contributions and
withdrawals, the moratorium may be extended by the executive director until the trustees are able to

Report No. 2017-138 Page 38 March 2017
meet to review the necessity for the moratorium. If the trustees agree with such measures, the
trustees shall vote to continue the measures for up to an additional 15 days. The trustees must
convene and vote to continue any such measures before the expiration of the time limit set, but in no
case may the time limit set by the trustees exceed 15 days.” As of June 30, 2016, there were no
redemption fees or maximum transaction amounts, or any other requirements that serve to limit a
participant’s daily access to 100 percent of their account value.
Credit Risk
Credit risk is the risk that an issuer or other counterparty to an investment will not fulfill its obligations.
Section 218.415(17), Florida Statutes, limits investments to the SBA’s Florida PRIME, or any other
intergovernmental investment pool authorized pursuant to the Florida Interlocal Cooperation Act as
provided in Section 163.01, Florida Statutes; Securities and Exchange Commission registered money
market funds with the highest credit quality rating from a nationally recognized rating agency;
interest-bearing time deposits in qualified public depositories, as defined in Section 280.02, Florida
Statutes; and direct obligations of the United States Treasury. The District does not have a formal
investment policy that limits its investment choices.
The District’s investments in the SBA debt service accounts are to provide for debt service payments
on bond debt issued by the SBE for the benefit of the District. The District relies on policies developed
by the SBA for managing interest rate risk and credit risk for this account. Disclosures for the debt
service accounts are included in the notes to financial statements of the State’s Comprehensive
Annual Financial Report.
The District’s investment in Florida PRIME is rated AAAm by Standard & Poor’s.
The District’s investment in United States government instrumentality obligations is authorized under
a forward delivery agreement with the QZAB paying agent. The investment must have a maturity
date on or before November 15, 2016. The District’s investment in the FNMA discount note was not
rated.
Custodial Credit Risk
Custodial credit risk for investments is the risk that, in the event of the failure of the counterparty to a
transaction, the District will not be able to recover the value of investment or collateral securities that
are in the possession of an outside party. Section 218.415(18), Florida Statutes, requires the District
to earmark all investments and (1) if registered with the issuer or its agents, the investment must be
immediately placed for safekeeping in a location that protects the governing body’s interest in the
security; (2) if in book-entry form, the investment must be held for the credit of the governing body by
a depository chartered by the Federal Government, the State, or any other state or territory of the
United States which has a branch or principal place of business in this State, or by a national
association organized and existing under the laws of the United States which is authorized to accept
and execute trusts and which is doing business in this State, and must be kept by the depository in
an account separate and apart from the assets of the financial institution; or (3) if physically issued to
the holder but not registered with the issuer or its agents, the investment must be immediately placed
for safekeeping in a secured vault. The District does not have a formal investment policy that
addresses custodial credit risk.
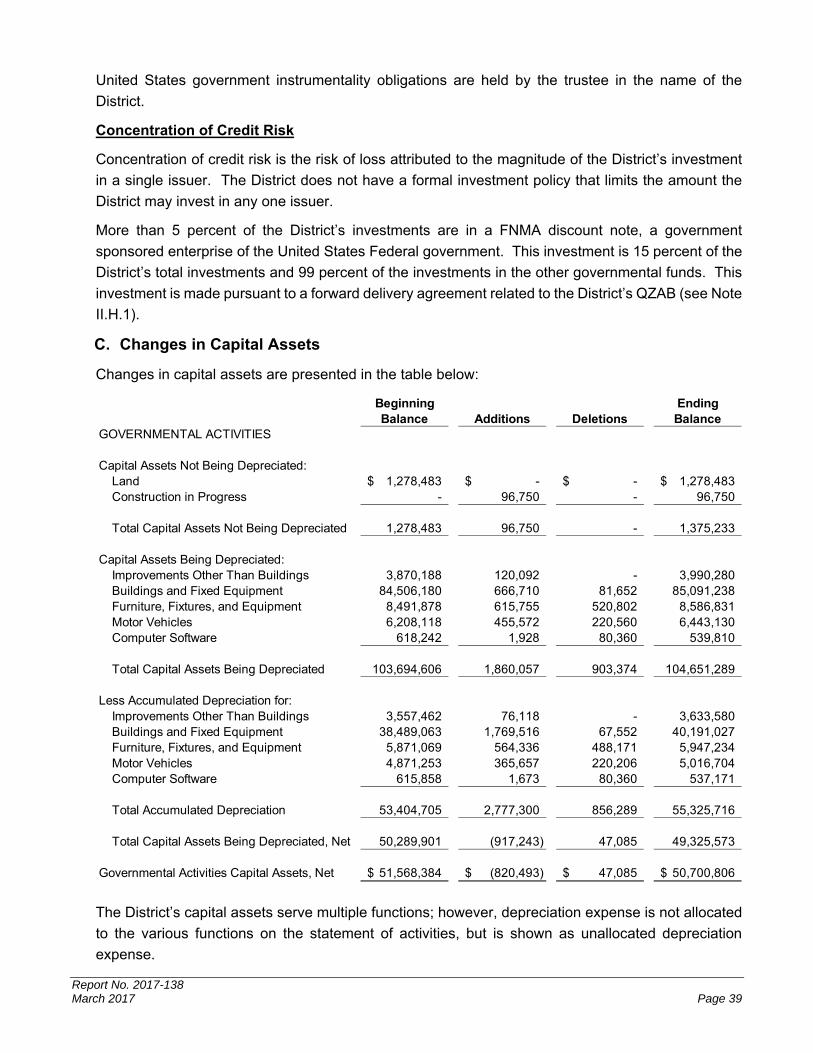
Report No. 2017-138 March 2017 Page 39
United States government instrumentality obligations are held by the trustee in the name of the
District.
Concentration of Credit Risk
Concentration of credit risk is the risk of loss attributed to the magnitude of the District’s investment
in a single issuer. The District does not have a formal investment policy that limits the amount the
District may invest in any one issuer.
More than 5 percent of the District’s investments are in a FNMA discount note, a government
sponsored enterprise of the United States Federal government. This investment is 15 percent of the
District’s total investments and 99 percent of the investments in the other governmental funds. This
investment is made pursuant to a forward delivery agreement related to the District’s QZAB (see Note
II.H.1).
C. Changes in Capital Assets
Changes in capital assets are presented in the table below:
Beginning EndingBalance Additions Deletions Balance
GOVERNMENTAL ACTIVITIES
Capital Assets Not Being Depreciated:Land 1,278,483$ -$ -$ 1,278,483$ Construction in Progress - 96,750 - 96,750
Total Capital Assets Not Being Depreciated 1,278,483 96,750 - 1,375,233
Capital Assets Being Depreciated:Improvements Other Than Buildings 3,870,188 120,092 - 3,990,280 Buildings and Fixed Equipment 84,506,180 666,710 81,652 85,091,238 Furniture, Fixtures, and Equipment 8,491,878 615,755 520,802 8,586,831 Motor Vehicles 6,208,118 455,572 220,560 6,443,130 Computer Software 618,242 1,928 80,360 539,810
Total Capital Assets Being Depreciated 103,694,606 1,860,057 903,374 104,651,289
Less Accumulated Depreciation for:Improvements Other Than Buildings 3,557,462 76,118 - 3,633,580 Buildings and Fixed Equipment 38,489,063 1,769,516 67,552 40,191,027 Furniture, Fixtures, and Equipment 5,871,069 564,336 488,171 5,947,234 Motor Vehicles 4,871,253 365,657 220,206 5,016,704 Computer Software 615,858 1,673 80,360 537,171
Total Accumulated Depreciation 53,404,705 2,777,300 856,289 55,325,716
Total Capital Assets Being Depreciated, Net 50,289,901 (917,243) 47,085 49,325,573
Governmental Activities Capital Assets, Net 51,568,384$ (820,493)$ 47,085$ 50,700,806$
The District’s capital assets serve multiple functions; however, depreciation expense is not allocated
to the various functions on the statement of activities, but is shown as unallocated depreciation
expense.

Report No. 2017-138 Page 40 March 2017
D. Retirement Plans
FRS – Defined Benefit Pension Plans
General Information about the FRS
The FRS was created in Chapter 121, Florida Statutes, to provide a defined benefit pension plan
for participating public employees. The FRS was amended in 1998 to add the Deferred
Retirement Option Program (DROP) under the defined benefit plan and amended in 2000 to
provide a defined contribution plan alternative to the defined benefit plan for FRS members
effective July 1, 2002. This integrated defined contribution pension plan is the FRS Investment
Plan. Chapter 112, Florida Statutes, established the Retiree HIS Program, a cost-sharing
multiple-employer defined benefit pension plan, to assist retired members of any
State-administered retirement system in paying the costs of health insurance.
Essentially all regular employees of the District are eligible to enroll as members of the
State-administered FRS. Provisions relating to the FRS are established by Chapters 121 and
122, Florida Statutes; Chapter 112, Part IV, Florida Statutes; Chapter 238, Florida Statutes; and
FRS Rules, Chapter 60S, Florida Administrative Code; wherein eligibility, contributions, and
benefits are defined and described in detail. Such provisions may be amended at any time by
further action from the Florida Legislature. The FRS is a single retirement system administered
by the Florida Department of Management Services, Division of Retirement, and consists of the
two cost-sharing multiple-employer defined benefit plans and other nonintegrated programs.
A comprehensive annual financial report of the FRS, which includes its financial statements,
required supplementary information, actuarial report, and other relevant information, is available
from the Florida Department of Management Services’ Web site (www.dms.myflorida.com).
The District’s FRS and HIS pension expense totaled $1,965,024 for the fiscal year ended
June 30, 2016.
FRS Pension Plan
Plan Description. The FRS Pension Plan (Plan) is a cost-sharing multiple-employer defined
benefit pension plan, with a DROP for eligible employees. The general classes of membership
are as follows:
Regular – Members of the FRS who do not qualify for membership in the other classes.
Elected County Officers – Members who hold specified elective offices in local government.
Senior Management Service – Members in senior management level positions.
Employees enrolled in the Plan prior to July 1, 2011, vest at 6 years of creditable service and
employees enrolled in the Plan on or after July 1, 2011, vest at 8 years of creditable service. All
vested members, enrolled prior to July 1, 2011, are eligible for normal retirement benefits at age
62 or at any age after 30 years of service. All members enrolled in the Plan on or after
July 1, 2011, once vested, are eligible for normal retirement benefits at age 65 or any time after
33 years of creditable service. Employees enrolled in the Plan may include up to 4 years of credit

Report No. 2017-138 March 2017 Page 41
for military service toward creditable service. The Plan also includes an early retirement provision;
however, there is a benefit reduction for each year a member retires before his or her normal
retirement date. The Plan provides retirement, disability, death benefits, and annual cost-of-living
adjustments to eligible participants.
DROP, subject to provisions of Section 121.091, Florida Statutes, permits employees eligible for
normal retirement under the Plan to defer receipt of monthly benefit payments while continuing
employment with an FRS participating employer. An employee may participate in DROP for a
period not to exceed 60 months after electing to participate, except that certain instructional
personnel may participate for up to 96 months. During the period of DROP participation, deferred
monthly benefits are held in the FRS Trust Fund and accrue interest. The net pension liability
does not include amounts for DROP participants, as these members are considered retired and
are not accruing additional pension benefits.
Benefits Provided. Benefits under the Plan are computed on the basis of age and/or years of
service, average final compensation, and service credit. Credit for each year of service is
expressed as a percentage of the average final compensation. For members initially enrolled
before July 1, 2011, the average final compensation is the average of the 5 highest fiscal years’
earnings; for members initially enrolled on or after July 1, 2011, the average final compensation
is the average of the 8 highest fiscal years’ earnings. The total percentage value of the benefit
received is determined by calculating the total value of all service, which is based on the
retirement class to which the member belonged when the service credit was earned. Members
are eligible for in-line-of-duty or regular disability and survivors’ benefits. The following chart
shows the percentage value for each year of service credit earned:
Class, Initial Enrollment, and Retirement Age/Years of Service Percent Value
Regular members initially enrolled before July 1, 2011 Retirement up to age 62 or up to 30 years of service 1.60 Retirement at age 63 or with 31 years of service 1.63 Retirement at age 64 or with 32 years of service 1.65 Retirement at age 65 or with 33 or more years of service 1.68
Regular members initially enrolled on or after July 1, 2011 Retirement up to age 65 or up to 33 years of service 1.60 Retirement at age 66 or with 34 years of service 1.63 Retirement at age 67 or with 35 years of service 1.65 Retirement at age 68 or with 36 or more years of service 1.68
Elected County Officers 3.00
Senior Management Service 2.00
As provided in Section 121.101, Florida Statutes, if the member is initially enrolled in the FRS
before July 1, 2011, and all service credit was accrued before July 1, 2011, the annual
cost-of-living adjustment is 3 percent per year. If the member is initially enrolled before
July 1, 2011, and has service credit on or after July 1, 2011, there is an individually calculated
cost-of-living adjustment. The annual cost-of-living adjustment is a proportion of 3 percent
determined by dividing the sum of the pre-July 2011 service credit by the total service credit at
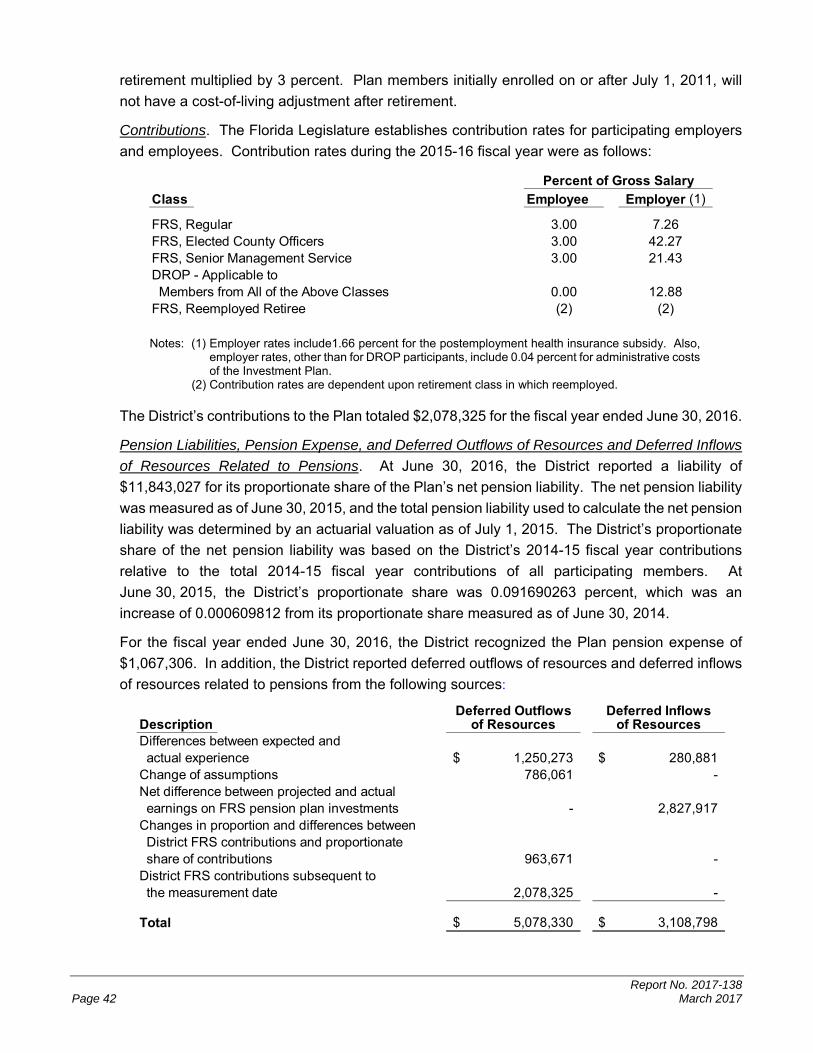
Report No. 2017-138 Page 42 March 2017
retirement multiplied by 3 percent. Plan members initially enrolled on or after July 1, 2011, will
not have a cost-of-living adjustment after retirement.
Contributions. The Florida Legislature establishes contribution rates for participating employers
and employees. Contribution rates during the 2015-16 fiscal year were as follows:
Class Employee Employer (1)
FRS, Regular 3.00 7.26FRS, Elected County Officers 3.00 42.27FRS, Senior Management Service 3.00 21.43DROP - Applicable to Members from All of the Above Classes 0.00 12.88FRS, Reemployed Retiree (2) (2)
Percent of Gross Salary
Notes: (1) Employer rates include1.66 percent for the postemployment health insurance subsidy. Also, employer rates, other than for DROP participants, include 0.04 percent for administrative costs of the Investment Plan.
(2) Contribution rates are dependent upon retirement class in which reemployed.
The District’s contributions to the Plan totaled $2,078,325 for the fiscal year ended June 30, 2016.
Pension Liabilities, Pension Expense, and Deferred Outflows of Resources and Deferred Inflows
of Resources Related to Pensions. At June 30, 2016, the District reported a liability of
$11,843,027 for its proportionate share of the Plan’s net pension liability. The net pension liability
was measured as of June 30, 2015, and the total pension liability used to calculate the net pension
liability was determined by an actuarial valuation as of July 1, 2015. The District’s proportionate
share of the net pension liability was based on the District’s 2014-15 fiscal year contributions
relative to the total 2014-15 fiscal year contributions of all participating members. At
June 30, 2015, the District’s proportionate share was 0.091690263 percent, which was an
increase of 0.000609812 from its proportionate share measured as of June 30, 2014.
For the fiscal year ended June 30, 2016, the District recognized the Plan pension expense of
$1,067,306. In addition, the District reported deferred outflows of resources and deferred inflows
of resources related to pensions from the following sources:
DescriptionDifferences between expected and actual experience $ 1,250,273 $ 280,881 Change of assumptions 786,061 - Net difference between projected and actual earnings on FRS pension plan investments - 2,827,917 Changes in proportion and differences between District FRS contributions and proportionate share of contributions 963,671 - District FRS contributions subsequent to the measurement date 2,078,325 -
Total $ 5,078,330 $ 3,108,798
Deferred Outflowsof Resources
Deferred Inflowsof Resources

Report No. 2017-138 March 2017 Page 43
The deferred outflows of resources related to pensions resulting from District contributions to the
Plan subsequent to the measurement date, totaling $2,078,325, will be recognized as a reduction
of the net pension liability in the fiscal year ending June 30, 2017. Other amounts reported as
deferred outflows of resources and deferred inflows of resources related to pensions will be
recognized in pension expense as follows:
Fiscal Year Ending June 30
2017 $ (712,765) 2018 (712,765) 2019 (712,765) 2020 1,620,355 2021 338,379 Thereafter 70,768
Total $ (108,793)
Amount
Actuarial Assumptions. The total pension liability in the July 1, 2015, actuarial valuation was
determined using the following actuarial assumptions, applied to all periods included in the
measurement:
Inflation 2.60 percentSalary increases 3.25 percent, average, including inflationInvestment rate of return 7.65 percent, net of pension plan investment expense,
including inflation
Mortality rates were based on the Generational RP-2000 with Projection Scale BB.
The actuarial assumptions used in the July 1, 2015, valuation were based on the results of an
actuarial experience study for the period July 1, 2008, through June 30, 2013.
The long-term expected rate of return on pension plan investments was not based on historical
returns, but instead is based on a forward-looking capital market economic model. The allocation
policy’s description of each asset class was used to map the target allocation to the asset classes
shown below. Each asset class assumption is based on a consistent set of underlying
assumptions, and includes an adjustment for the inflation assumption. The target allocation and
best estimates of arithmetic and geometric real rates of return for each major asset class are
summarized in the following table:
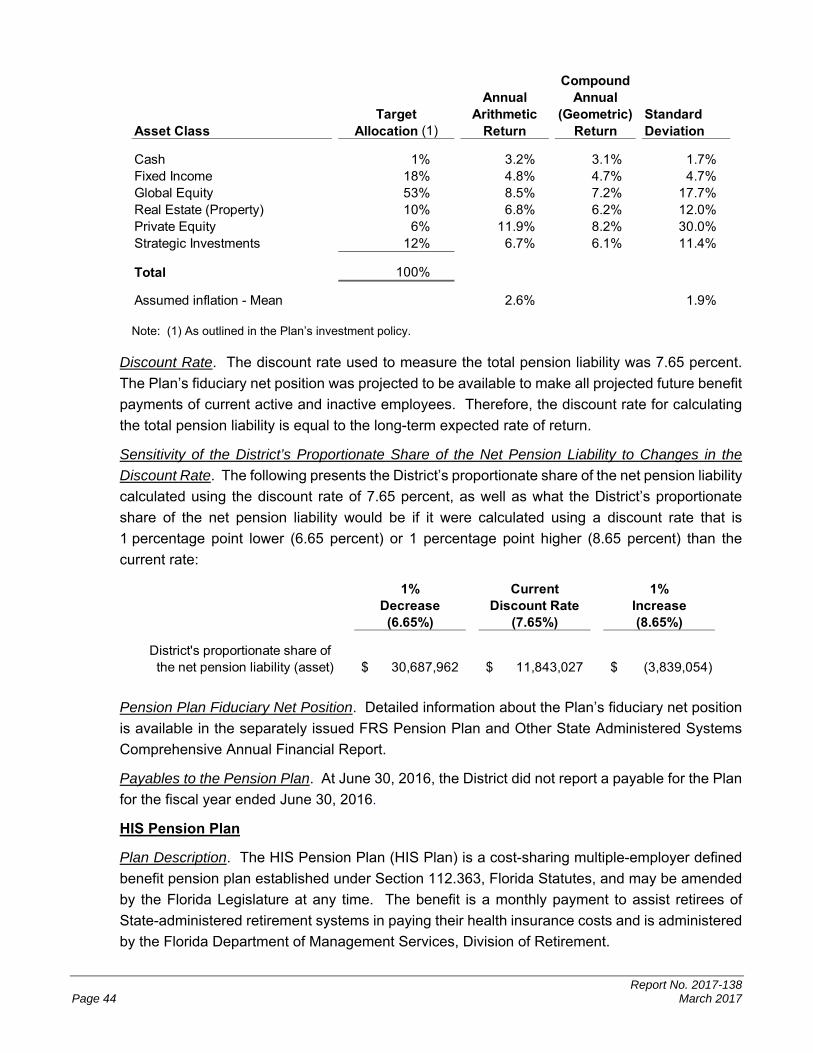
Report No. 2017-138 Page 44 March 2017
CompoundAnnual Annual
Target Arithmetic (Geometric) StandardAsset Class Allocation (1) Return Return Deviation
Cash 1% 3.2% 3.1% 1.7%Fixed Income 18% 4.8% 4.7% 4.7%Global Equity 53% 8.5% 7.2% 17.7%Real Estate (Property) 10% 6.8% 6.2% 12.0%Private Equity 6% 11.9% 8.2% 30.0%Strategic Investments 12% 6.7% 6.1% 11.4%
Total 100%
Assumed inflation - Mean 2.6% 1.9%
Note: (1) As outlined in the Plan’s investment policy.
Discount Rate. The discount rate used to measure the total pension liability was 7.65 percent.
The Plan’s fiduciary net position was projected to be available to make all projected future benefit
payments of current active and inactive employees. Therefore, the discount rate for calculating
the total pension liability is equal to the long-term expected rate of return.
Sensitivity of the District’s Proportionate Share of the Net Pension Liability to Changes in the
Discount Rate. The following presents the District’s proportionate share of the net pension liability
calculated using the discount rate of 7.65 percent, as well as what the District’s proportionate
share of the net pension liability would be if it were calculated using a discount rate that is
1 percentage point lower (6.65 percent) or 1 percentage point higher (8.65 percent) than the
current rate:
1% Current 1%Decrease Discount Rate Increase(6.65%) (7.65%) (8.65%)
District's proportionate share of the net pension liability (asset) 30,687,962$ 11,843,027$ (3,839,054)$
Pension Plan Fiduciary Net Position. Detailed information about the Plan’s fiduciary net position
is available in the separately issued FRS Pension Plan and Other State Administered Systems
Comprehensive Annual Financial Report.
Payables to the Pension Plan. At June 30, 2016, the District did not report a payable for the Plan
for the fiscal year ended June 30, 2016.
HIS Pension Plan
Plan Description. The HIS Pension Plan (HIS Plan) is a cost-sharing multiple-employer defined
benefit pension plan established under Section 112.363, Florida Statutes, and may be amended
by the Florida Legislature at any time. The benefit is a monthly payment to assist retirees of
State-administered retirement systems in paying their health insurance costs and is administered
by the Florida Department of Management Services, Division of Retirement.
Report No. 2017-138 March 2017 Page 45
Benefits Provided. For the fiscal year ended June 30, 2016, eligible retirees and beneficiaries
received a monthly HIS payment of $5 for each year of creditable service completed at the time
of retirement, with a minimum HIS payment of $30 and a maximum HIS payment of $150 per
month, pursuant to Section 112.363, Florida Statutes. To be eligible to receive a HIS Plan benefit,
a retiree under a State-administered retirement system must provide proof of health insurance
coverage, which may include Federal Medicare.
Contributions. The HIS Plan is funded by required contributions from FRS participating employers
as set by the Florida Legislature. Employer contributions are a percentage of gross compensation
for all active FRS members. For the fiscal year ended June 30, 2016, the contribution rate was
1.66 percent of payroll pursuant to Section 112.363, Florida Statutes. The District contributed
100 percent of its statutorily required contributions for the current and preceding 3 years. HIS
Plan contributions are deposited in a separate trust fund from which payments are authorized.
HIS Plan benefits are not guaranteed and are subject to annual legislative appropriation. In the
event the legislative appropriation or available funds fail to provide full subsidy benefits to all
participants, benefits may be reduced or canceled.
The District’s contributions to the HIS Plan totaled $573,226 for the fiscal year ended
June 30, 2016.
Pension Liabilities, Pension Expense, and Deferred Outflows of Resources and Deferred Inflows
of Resources Related to Pensions. At June 30, 2016, the District reported a net pension liability
of $11,651,679 for its proportionate share of the HIS Plan’s net pension liability. The current
portion of the net pension liability is the District’s proportionate share of benefit payments
expected to be paid within 1 year, net of the District’s proportionate share of the pension plan’s
fiduciary net position available to pay that amount. The net pension liability was measured as of
June 30, 2015, and the total pension liability used to calculate the net pension liability was
determined by an actuarial valuation as of July 1, 2014, and update procedures were used to
determine liabilities as of July 1, 2015. The District’s proportionate share of the net pension
liability was based on the District’s 2014-15 fiscal year contributions relative to the total
2014-15 fiscal year contributions of all participating members. At June 30, 2015, the District’s
proportionate share was 0.114249769 percent, which was a decrease of 0.000692095 from its
proportionate share measured as of June 30, 2014.
For the fiscal year ended June 30, 2016, the District recognized the HIS Plan pension expense of
$897,718. In addition, the District reported deferred outflows of resources and deferred inflows
of resources related to pensions from the following sources:
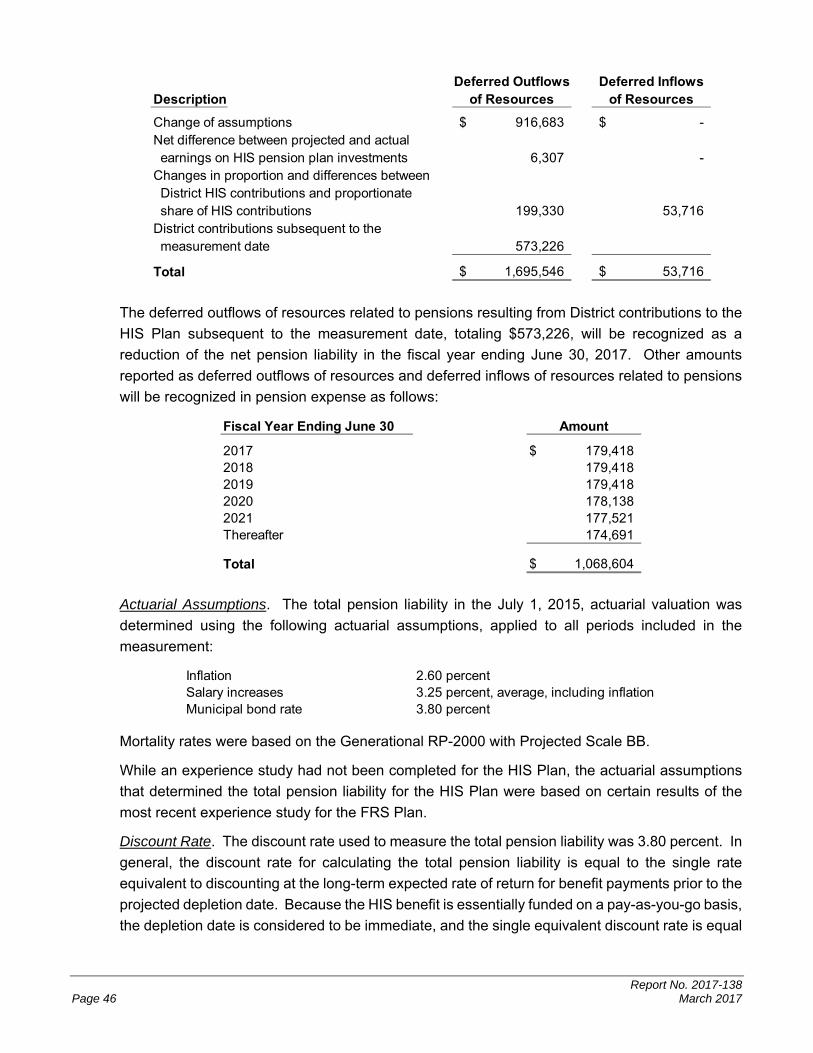
Report No. 2017-138 Page 46 March 2017
Deferred Outflows Deferred InflowsDescription of Resources of Resources
Change of assumptions 916,683$ -$ Net difference between projected and actual earnings on HIS pension plan investments 6,307 - Changes in proportion and differences between District HIS contributions and proportionate share of HIS contributions 199,330 53,716 District contributions subsequent to the measurement date 573,226
Total 1,695,546$ 53,716$
The deferred outflows of resources related to pensions resulting from District contributions to the
HIS Plan subsequent to the measurement date, totaling $573,226, will be recognized as a
reduction of the net pension liability in the fiscal year ending June 30, 2017. Other amounts
reported as deferred outflows of resources and deferred inflows of resources related to pensions
will be recognized in pension expense as follows:
Fiscal Year Ending June 30
2017 $ 179,418 2018 179,418 2019 179,418 2020 178,138 2021 177,521 Thereafter 174,691
Total $ 1,068,604
Amount
Actuarial Assumptions. The total pension liability in the July 1, 2015, actuarial valuation was
determined using the following actuarial assumptions, applied to all periods included in the
measurement:
Inflation 2.60 percentSalary increases 3.25 percent, average, including inflationMunicipal bond rate 3.80 percent
Mortality rates were based on the Generational RP-2000 with Projected Scale BB.
While an experience study had not been completed for the HIS Plan, the actuarial assumptions
that determined the total pension liability for the HIS Plan were based on certain results of the
most recent experience study for the FRS Plan.
Discount Rate. The discount rate used to measure the total pension liability was 3.80 percent. In
general, the discount rate for calculating the total pension liability is equal to the single rate
equivalent to discounting at the long-term expected rate of return for benefit payments prior to the
projected depletion date. Because the HIS benefit is essentially funded on a pay-as-you-go basis,
the depletion date is considered to be immediate, and the single equivalent discount rate is equal
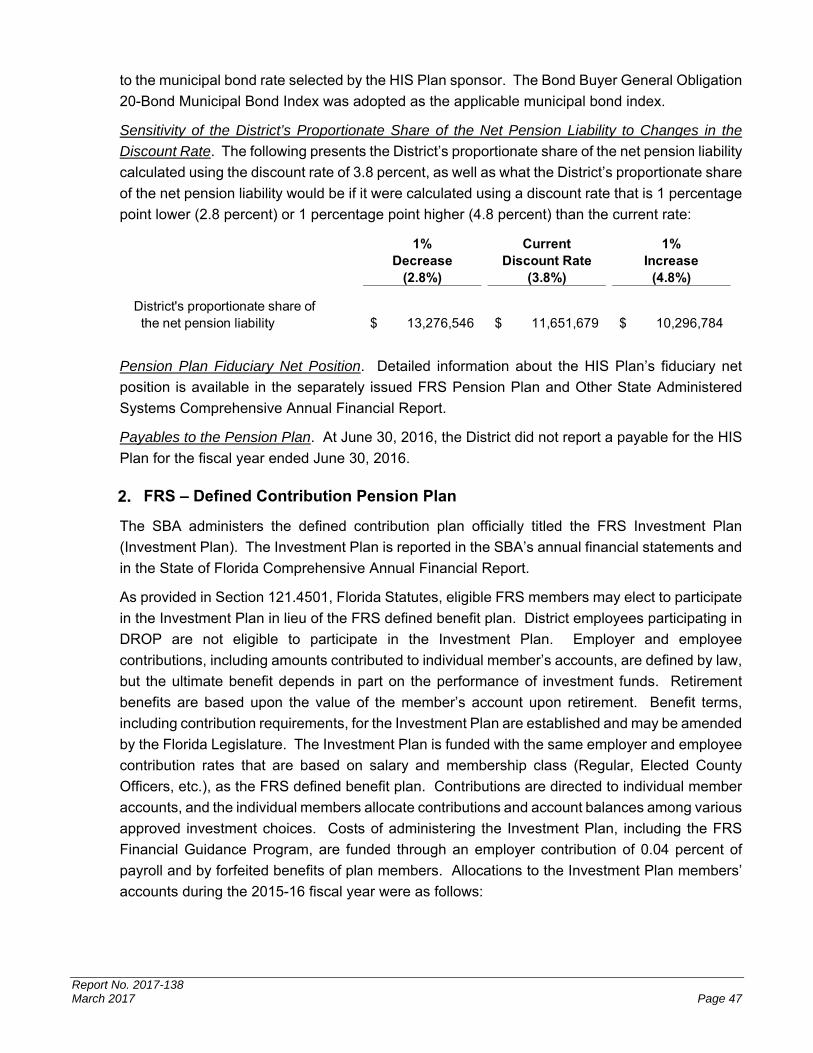
Report No. 2017-138 March 2017 Page 47
to the municipal bond rate selected by the HIS Plan sponsor. The Bond Buyer General Obligation
20-Bond Municipal Bond Index was adopted as the applicable municipal bond index.
Sensitivity of the District’s Proportionate Share of the Net Pension Liability to Changes in the
Discount Rate. The following presents the District’s proportionate share of the net pension liability
calculated using the discount rate of 3.8 percent, as well as what the District’s proportionate share
of the net pension liability would be if it were calculated using a discount rate that is 1 percentage
point lower (2.8 percent) or 1 percentage point higher (4.8 percent) than the current rate:
1% Current 1%Decrease Discount Rate Increase
(2.8%) (3.8%) (4.8%)
District's proportionate share of the net pension liability 13,276,546$ 11,651,679$ 10,296,784$
Pension Plan Fiduciary Net Position. Detailed information about the HIS Plan’s fiduciary net
position is available in the separately issued FRS Pension Plan and Other State Administered
Systems Comprehensive Annual Financial Report.
Payables to the Pension Plan. At June 30, 2016, the District did not report a payable for the HIS
Plan for the fiscal year ended June 30, 2016.
FRS – Defined Contribution Pension Plan
The SBA administers the defined contribution plan officially titled the FRS Investment Plan
(Investment Plan). The Investment Plan is reported in the SBA’s annual financial statements and
in the State of Florida Comprehensive Annual Financial Report.
As provided in Section 121.4501, Florida Statutes, eligible FRS members may elect to participate
in the Investment Plan in lieu of the FRS defined benefit plan. District employees participating in
DROP are not eligible to participate in the Investment Plan. Employer and employee
contributions, including amounts contributed to individual member’s accounts, are defined by law,
but the ultimate benefit depends in part on the performance of investment funds. Retirement
benefits are based upon the value of the member’s account upon retirement. Benefit terms,
including contribution requirements, for the Investment Plan are established and may be amended
by the Florida Legislature. The Investment Plan is funded with the same employer and employee
contribution rates that are based on salary and membership class (Regular, Elected County
Officers, etc.), as the FRS defined benefit plan. Contributions are directed to individual member
accounts, and the individual members allocate contributions and account balances among various
approved investment choices. Costs of administering the Investment Plan, including the FRS
Financial Guidance Program, are funded through an employer contribution of 0.04 percent of
payroll and by forfeited benefits of plan members. Allocations to the Investment Plan members’
accounts during the 2015-16 fiscal year were as follows:

Report No. 2017-138 Page 48 March 2017
Percent ofGross
Class Compensation
FRS, Regular 6.30FRS, Elected County Officers 11.34FRS, Senior Management Service 7.67
For all membership classes, employees are immediately vested in their own contributions and are
vested after 1 year of service for employer contributions and investment earnings, regardless of
membership class. If an accumulated benefit obligation for service credit originally earned under
the FRS Pension Plan is transferred to the Investment Plan, the member must have the years of
service required for FRS Pension Plan vesting (including the service credit represented by the
transferred funds) to be vested for these funds and the earnings on the funds. Nonvested
employer contributions are placed in a suspense account for up to 5 years. If the employee
returns to FRS-covered employment within the 5-year period, the employee will regain control
over their account. If the employee does not return within the 5-year period, the employee will
forfeit the accumulated account balance. For the fiscal year ended June 30, 2016, the information
for the amount of forfeitures was unavailable from the SBA; however, management believes that
these amounts, if any, would be immaterial to the District.
After termination and applying to receive benefits, the member may rollover vested funds to
another qualified plan, structure a periodic payment under the Investment Plan, receive a
lump-sum distribution, leave the funds invested for future distribution, or any combination of these
options. Disability coverage is provided; the member may either transfer the account balance to
the FRS Pension Plan when approved for disability retirement to receive guaranteed lifetime
monthly benefits under the FRS Pension Plan, or remain in the Investment Plan and rely upon
that account balance for retirement income.
The District’s Investment Plan pension expense totaled $527,146 for the fiscal year ended
June 30, 2016.
E. Other Postemployment Benefit Obligations
Plan Description. The Other Postemployment Benefits Plan (OPEB Plan) is a single-employer
defined benefit plan administered by the District. Pursuant to the provisions of Section 112.0801,
Florida Statutes, employees who retire from the District are eligible to participate in the District’s four
health and hospitalization plans as well as its self-insured dental plan. The District subsidizes the
premium rates paid by retirees by allowing them to participate in the OPEB Plan at reduced or blended
group (implicitly subsidized) premium rates for both active and retired employees. These rates
provide an implicit subsidy for retirees because, on an actuarial basis, their current and future claims
are expected to result in higher costs to the OPEB Plan on average than those of active employees.
In addition, the Board contributes $40 per month for dental insurance premiums. Retirees are
required to enroll in the Federal Medicare program for their primary coverage as soon as they are
eligible. The OPEB Plan does not issue a stand-alone report, and is not included in the report of a
public employee retirement system or other entity.

Report No. 2017-138 March 2017 Page 49
Funding Policy. Plan contribution requirements of the District and OPEB Plan members are
established and may be amended through recommendations of the Insurance Committee and action
from the Board. The District has not advance-funded or established a funding methodology for the
annual OPEB costs or the net OPEB obligation, and the OPEB Plan is financed on a pay-as-you-go
basis. For the 2015-16 fiscal year, 44 retirees received other postemployment benefits. The District
provided required contributions of $360,088 toward the annual OPEB cost, net of retiree contributions
totaling $410,563, which represents 1.34 percent of covered payroll.
Annual OPEB Cost and Net OPEB Obligation. The District’s annual OPEB cost (expense) is
calculated based on the annual required contribution (ARC), an amount actuarially determined in
accordance with parameters of GASB Statement No. 45, Accounting and Financial Reporting by
Employers for Postemployment Benefits Other Than Pensions. The ARC represents a level of
funding that if paid on an ongoing basis, is projected to cover normal cost each year and amortize
any unfunded actuarial liabilities over a period not to exceed 30 years. The following table shows the
District's annual OPEB cost for the fiscal year, the amount actually contributed to the OPEB Plan,
and changes in the District's net OPEB obligation:
Description Amount
Normal Cost (service cost for 1 year) 370,704$ Amortization of Unfunded Actuarial Accrued Liability 577,540
Annual Required Contribution 948,244 Interest on Net OPEB Obligation 70,367 Adjustment to Annual Required Contribution (195,463)
Annual OPEB Cost (Expense) 823,148 Contribution Toward the OPEB Cost (360,088)
Increase in Net OPEB Obligation 463,060 Net OPEB Obligation, Beginning of Year 2,345,561
Net OPEB Obligation, End of Year 2,808,621$
The District’s annual OPEB cost, the percentage of annual OPEB cost contributed to the OPEB Plan,
and the net OPEB obligation as of June 30, 2016, and the 2 preceding fiscal years, were as follows:
Percentage ofAnnual
Annual OPEB Cost Net OPEBFiscal Year OPEB Cost Contributed Obligation
2013-14 562,258$ 49.6% 2,085,137$ 2014-15 548,019 52.5% 2,345,561 2015-16 823,148 43.7% 2,808,621
Funded Status and Funding Progress. As of January 1, 2016, the most recent valuation date, the
actuarial accrued liability for benefits was $6,828,808, and the actuarial value of assets was
$0, resulting in an unfunded actuarial accrued liability of $6,828,808 and a funded ratio of 0 percent.
Report No. 2017-138 Page 50 March 2017
The covered payroll (annual payroll of active participating employees) was $30,647,770, and the ratio
of the unfunded actuarial accrued liability to the covered payroll was 22.3 percent.
Actuarial valuations of an ongoing OPEB Plan involve estimates of the value of reported amounts
and assumptions about the probability of occurrence of events far into the future. Examples include
assumptions about future employment and termination, mortality, and healthcare cost trends.
Amounts determined regarding the funded status of the OPEB Plan and the annual required
contributions of the employer are subject to continual revision as actual results are compared with
past expectations and new estimates are made about the future. The Schedule of Funding Progress
immediately following the notes to financial statements as required supplementary information,
presents multiyear trend information about whether the actuarial value of OPEB Plan assets is
increasing or decreasing over time relative to the actuarial accrued liability for benefits.
Actuarial Methods and Assumptions. Projections of benefits for financial reporting purposes are
based on the substantive OPEB Plan provisions, as understood by the employer and participating
members, and include the types of benefits provided at the time of each valuation and the historical
pattern of sharing of benefit costs between the employer and participating members. The actuarial
calculations of the OPEB Plan reflect a long-term perspective. Consistent with this perspective, the
actuarial valuations used actuarial methods and assumptions that include techniques that are
designed to reduce the effects of short-term volatility in actuarial accrued liabilities and the actuarial
value of assets.
The District’s OPEB actuarial valuation as of January 1, 2016, used the entry age normal cost
actuarial method to estimate the unfunded actuarial liability as of June 30, 2016, and to estimate the
District’s 2015-16 fiscal year ARC. Because the OPEB liability is currently unfunded, the actuarial
assumptions included a 3 percent rate of return on invested assets, which is the District’s long-term
expectation of investment returns under its investment policy. The actuarial assumptions also
included a payroll growth rate of 3 percent per year and an annual healthcare cost trend rate of
6.5 percent initially beginning in January 2016, to 6.25 percent in January 2017, reduced to an
ultimate rate of 4.63 percent in January 2040. The investment rate of return and projected salary
increase include a general price inflation of 2.5 percent. The unfunded actuarial accrued liability is
being amortized as a level percentage of projected payroll on a closed basis over a 14-year period.
The remaining amortization period at June 30, 2016, was 12 years.
F. Other Significant Commitments
Encumbrances. Appropriations in governmental funds are encumbered upon issuance of purchase
orders for goods and services. Even though appropriations lapse at the end of the fiscal year, unfilled
purchase orders of the current year are carried forward and the next fiscal year's appropriations are
likewise encumbered.
The following is a schedule of encumbrances at June 30, 2016:
Report No. 2017-138 March 2017 Page 51
General
Special Revenue -
Food Service
Special Revenue -
Other
Capital Projects -
Local CapitalImprovement
177,727$ 29,203$ 146,463$ 550,115$ 271,737$ 1,175,245$
Major Funds
Nonmajor Governmental
Funds
Total Governmental
Funds
G. Risk Management Programs
The District is exposed to various risks of loss related to torts; theft of, damage to, and destruction of
assets; errors and omissions; injuries to employees; third party injuries and/or property damage and
natural disasters. The District is a member of the South Central Educational Risk Management
Program (SCERMP), a consortium under which seven district school boards have established a
public entity risk sharing pool for property, general liability, automobile liability, workers'
compensation, governmental crime, and other coverage deemed necessary by the members of the
SCERMP. Section 1001.42(12)(k), Florida Statutes, provides the authority for the District to enter
into such a risk management program. The interlocal agreement and bylaws of SCERMP provide
that risk of loss is transferred to the consortium. SCERMP is self-sustaining through member
contributions (premiums), and purchases insurance coverage through commercial companies for
claims in excess of specified amounts. Member school boards are also subject to supplemental
contributions in the event of a deficiency, except to the extent that the deficiency results from a specific
claim against a member school board in excess of the coverage available, then such deficiency is
solely the responsibility of that member school board.
The Board of Directors for SCERMP is composed of superintendents and finance directors or an
authorized representative of all participating districts. Employers’ Mutual d.b.a. Ascension
Benefits & Insurance Solutions of Florida, serves as the third-party administrator, insurance broker,
and fiscal agent for SCERMP.
Property damage coverage is managed by SCERMP by purchase of excess property coverage
through commercial insurance carriers for property loss claims in excess of $100,000 (except
wind/hail/flood). The named wind/hail/hurricane deductible is 5 percent of replacement cost value
with a minimum of $100,000 per occurrence and a maximum of $25 million per occurrence. The
deductibles for all other wind events is $100,000. Special hazard flood area deductibles are
$500,000 per building and $500,000 contents plus $100,000 time element per occurrence. The flood
deductible outside a special flood hazard area is $100,000. SCERMP’s purchased excess property
loss limit during the 2015-16 fiscal year was $100 million.
Workers’ compensation claims are limited based on a per claim self-insured retention. The
self-insured retention for the 2015-16 fiscal year was $1 million. SCERMP purchases excess liability
coverage through a commercial insurance carrier, which covers workers’ compensation losses in
excess of the self-insured retention. Employer’s liability is included subject to $2 million per
occurrence.
Report No. 2017-138 Page 52 March 2017
The District is protected by Section 768.28, Florida Statutes, under the Doctrine of Sovereign
Immunity, as it is now written, as it may be amended by the Legislature in the future, which effectively
limits the amount of liability of governmental entities for tort claims to $200,000 per claim and
$300,000 per occurrence.
The District provides dental coverage on a self-insurance basis for eligible employees. Based on
records, maintained by the fiscal agent, of premiums received for and claims (and other expenses)
paid on behalf of Board employees and their dependents, the District reports this activity in an internal
service fund, including an estimated incurred, but not reported, insurance claims payable at
June 30, 2016.
The following schedule represents the changes in claims liability for the past 2 fiscal years for the
District’s self-insurance program:
Current-yearBeginning-of- Claims and Balance at
Fiscal-year Changes In Claims FiscalFiscal Year Liability Estimates Payments Year-End
2014-15 72,288$ 462,081$ (462,314)$ 72,055$ 2015-16 72,055 463,709 (463,709) 72,055
Health and hospitalization coverage is being provided by purchased commercial insurance through a
minimum premium plan. The minimum premiums to be earned for all types of coverage are set forth
in the contract. Premiums are payable monthly based on the total number of eligible employees.
When earned premiums are greater than the sum of the incurred claims and a specified retention,
the loss shall be paid to the plan up to the maximum due as set forth in the contract. Life insurance
is purchased by the District for eligible employees. These transactions are accounted for in the
governmental funds rather than the internal service fund.
Settled claims resulting from the risks described above have not exceeded commercial insurance
coverage in the past 3 fiscal years.
H. Long-Term Liabilities
Certificates of Participation
On December 15, 2005, the District issued Certificates of Participation, Series 2005-QZAB, under
a special program whereby the certificates will mature in full on December 15, 2021, for the
original issue of $3,068,200. There is no interest cost for borrowing moneys under this program.
The financing proceeds were used to acquire improvements at several designated schools, which
are leased by the District from the Leasing Corporation. The District entered into a forward
delivery agreement under which mandatory deposits (rent payments) of $158,133 for
16 consecutive years began December 16, 2006. The forward delivery agreement provides a
guaranteed investment return whereby the required deposits, along with the accrued interest, will
be sufficient to redeem the certificates at maturity. The invested assets accumulated pursuant to
the forward delivery agreement are held under a trust agreement in the event of cancellation or
default.
Report No. 2017-138 March 2017 Page 53
The schools designated for technology-related equipment and improvements under the
Series 2005-QZAB certificates include: Eastside Elementary School, Westside Elementary
School, Central Elementary School, and LaBelle High School.
The following is a schedule by years of future minimum lease payments for the Series 2005-QZAB
certificates with the present value of minimum lease payments as of June 30:
Fiscal Year Ending June 30 Total Principal Interest
2022 3,068,200$ 3,068,200$ 0$
Bonds Payable
Bonds payable at June 30, 2016, are as follows:
Interest AnnualAmount Rates Maturity
Bond Type Outstanding (Percent) To
State School Bonds: Series 2014B, Refunding 181,000$ 2.0 - 5.0 2020District Revenue Bonds: Series 2015 1,500,000 3.06 2025
Total Minimum Bond Payments 1,681,000 Plus: Unamortized Premiums 17,779
Total Bonds Payable 1,698,779$
The various bonds were issued to finance capital outlay projects of the District. The following is
a description of the bonded debt issues:
State School Bonds
These bonds are issued by the State Board of Education (SBE) on behalf of the District. The
bonds mature serially, and are secured by a pledge of the District’s portion of the State-assessed
motor vehicle license tax. The State’s full faith and credit is also pledged as security for these
bonds. Principal and interest payments, investment of debt service fund resources, and
compliance with reserve requirements are administered by the SBE and the SBA.
District Revenue Bonds
These bonds are authorized by Chapter 69-1094, Laws of Florida, which provides that the bonds
be secured from the pari-mutuel tax proceeds distributed annually to Hendry County from the
State’s Pari-mutuel Tax Collection Trust Fund pursuant to Chapter 550, Florida Statutes (effective
July 1, 2000, tax proceeds are distributed pursuant to Section 212.20(6)(d)7.a., Florida Statutes
(2001), now Section 212.20(6)(d)6.a., Florida Statutes). The annual distribution is remitted by the
Florida Department of Financial Services to the District. As required by the bond resolution, the
District has established the sinking fund and reserve account and has accumulated and
maintained adequate resources in the sinking fund and reserve account.

Report No. 2017-138 Page 54 March 2017
The District has pledged a total of $1,854,093, of pari-mutuel tax revenues in connection with the
District Revenue Bonds of 2015, described above. During the 2015-16 fiscal year, the District
recognized pari-mutuel tax revenues totaling $143,300 and expended these revenues for debt
service directly collateralized by these revenues. The pledged pari-mutuel tax revenues are
committed until final maturity of the debt on November 2026. Assuming a normal growth rate of
0 percent in the collection of pari-mutuel tax funds, 72.1 percent of this revenue stream has been
pledged in connection with debt service on the revenue bonds. A balloon payment of
$955,075.45 is due on November 1, 2025.
Annual requirements to amortize all bonded debt outstanding as of June 30, 2016, are as follows:
Defeased Debt
On November 1, 2015, the Board issued $1,500,000 in District Revenue Bonds, Series 2015, with
an interest rate of 3.06 percent, to advance-refund a portion of the District Revenue Bonds,
Series 1997 and to fund certain capital improvements. The refunding bonds are being issued to
advance-refund the $205,000 principal payment of the District Revenue Bonds, Series 1997, that
mature on or after January 2017 and provide $1,244,250 for capital projects. A portion of the net
proceeds of $205,000 (after payment of $50,750 in underwriting fees, insurance and other costs),
were placed in an irrevocable trust to provide for a portion of future debt service payments on the
Series 1997 bonds. As a result, $205,000 of the Series 1997 bonds are considered to be
in-substance defeased and the liability for these bonds has been removed from the
government-wide financial statements. The Series 1997 bonds were refunded to reduce the
District’s total debt service payments over the next 2 years by approximately $16,496. There was
no economic gain.
Fiscal Year Ending June 30 Total Principal Interest
State School Bonds:2017 116,840$ 108,000$ 8,840$ 2018 62,440 59,000 3,440 2019 7,490 7,000 490 2020 7,140 7,000 140
Total State School Bonds 193,910 181,000 12,910
District Revenue Bonds:2017 99,615 54,550 45,065 2018 99,679 56,310 43,369 2019 99,745 58,127 41,618 2020 99,813 60,002 39,811 2021 99,883 61,938 37,945 2022-2026 1,355,358 1,209,073 146,285
Total District Revenue Bonds 1,854,093 1,500,000 354,093
Total 2,048,003$ 1,681,000$ 367,003$

Report No. 2017-138 March 2017 Page 55
Changes in Long-Term Liabilities
The following is a summary of changes in long-term liabilities:
Beginning Ending Due InDescription Balance Additions Deductions Balance One Year
GOVERNMENTAL ACTIVITIES
Certificates of Participation Payable 3,068,200$ -$ -$ 3,068,200$ -$ Bonds Payable 700,706 1,500,000 501,927 1,698,779 162,550 Other Postemployment Benefits Payable 2,345,561 823,148 360,088 2,808,621 - Compensated Absences Payable 5,004,913 1,900,984 720,008 6,185,889 720,008 Net Pension Liability 16,304,592 15,701,707 8,511,593 23,494,706 427,650
Total Governmental Activities 27,423,972$ 19,925,839$ 10,093,616$ 37,256,195$ 1,310,208$
For the governmental activities, compensated absences, pensions, and other postemployment
benefits are generally liquidated with resources of the General Fund.
I. Fund Balance Reporting
In addition to committed and assigned fund balance categories discussed in the Fund Balance
Policies note disclosure, fund balances may be classified as follows:
Nonspendable Fund Balance. Nonspendable fund balance is the net current financial resources that cannot be spent because they are either not in spendable form or are legally or contractually required to be maintained intact. Generally, not in spendable form means that an item is not expected to be converted to cash.
Restricted Fund Balance. Restricted fund balance is the portion of fund balance on which constraints have been placed by creditors, grantors, contributors, laws or regulations of other governments, constitutional provisions, or enabling legislation. Restricted fund balance places the most binding level of constraint on the use of fund balance.
Unassigned Fund Balance. The unassigned fund balance is the portion of fund balance that is the residual classification for the General Fund. This balance represents amounts that have not been assigned to other funds and that have not been restricted, committed, or assigned for specific purposes.
J. Interfund Receivables and Payables
The following is a summary of interfund receivables and payables reported in the fund financial
statements:
Funds Receivables Payables
Major: General 265,866$ 29$ Special Revenue:
Food Service 129,897 5,927
Other 29 389,836
Total 395,792$ 395,792$
Interfund

Report No. 2017-138 Page 56 March 2017
The interfund receivables and payables represent the payment of expenditures by one fund for
another fund and will be repaid within 12 months.
K. Revenues
Schedule of State Revenue Sources
The following is a schedule of the District’s State revenue sources for the 2015-16 fiscal year:
Source Amount
Florida Education Finance Program 31,834,256$ Categorical Educational Program - Class Size Reduction 7,597,927 Voluntary Prekindergarten Program 400,363 Motor Vehicle License Tax (Capital Outlay and Debt Service) 279,925 Workforce Performance Initiative 205,960 Gross Receipts Tax (Public Education Capital Outlay) 184,052 School Recognition 118,574 Florida's Best and Brightest Teachers Scholarship Program 99,075 Food Service Supplement 54,016 Mobile Home License Tax 35,255 Miscellaneous 250,596
Total 41,059,999$
Accounting policies relating to certain State revenue sources are described in Note I.G.2.
Property Taxes
The following is a summary of millages and taxes levied on the 2015 tax roll for the 2015-16 fiscal
year:
Millages Taxes LeviedGeneral Fund
Nonvoted School Tax: Required Local Effort 4.933 9,401,908$ Basic Discretionary Local Effort 0.748 1,425,628
Capital Projects - Local Capital Improvement Fund
Nonvoted Tax: Local Capital Improvements 1.500 2,858,880
Total 7.181 13,686,416$

Report No. 2017-138 March 2017 Page 57
L. Interfund Transfers
The following is a summary of interfund transfers reported in the fund financial statements:
Funds Transfers In Transfers Out
Major: Capital Projects: Local Capital Improvement -$ 161,231$ Nonmajor Governmental: 186,663 25,432
Total 186,663$ 186,663$
Interfund
Capital outlay ad valorem tax moneys were transferred from the Capital Projects – Local Capital
Improvement Fund to the nonmajor Debt Service – QZAB Fund for debt service sinking fund deposits.
District revenue bonds moneys were transferred from the nonmajor Capital Projects – Special Act
Bonds to the nonmajor Debt Service – Special Act Bonds for debt service payments.

Report No. 2017-138 Page 58 March 2017
OTHER REQUIRED SUPPLEMENTARY INFORMATION
Budgetary Comparison Schedule General and Major Special Revenue Funds
For the Fiscal Year Ended June 30, 2016
Revenues
Intergovernmental:Federal Through State and Local $ 250,000 $ 394,502 $ 394,502 $ - State 40,785,978 40,368,992 40,402,912 33,920
Local:Property Taxes 10,477,424 10,480,934 10,480,934 - Charges for Services - Food Service - - - - Miscellaneous 522,775 540,748 609,224 68,476 Total Local Revenues 11,000,199 11,021,682 11,090,158 68,476
Total Revenues 52,036,177 51,785,176 51,887,572 102,396
Expenditures
Current - Education:Instruction 33,305,024 32,921,502 32,014,536 906,966 Student Support Services 1,867,351 2,083,126 2,050,689 32,437 Instructional Media Services 760,933 822,883 820,690 2,193 Instruction and Curriculum Development Services 626,238 774,197 715,577 58,620 Instructional Staff Training Services 66,517 135,122 86,426 48,696 Instruction-Related Technology 508,375 508,375 345,866 162,509 Board 808,071 777,141 662,714 114,427 General Administration 990,587 1,274,264 1,214,982 59,282 School Administration 3,898,105 3,963,967 3,956,693 7,274 Facilities Acquisition and Construction 8,300 13,100 13,100 - Fiscal Services 778,386 774,885 658,474 116,411 Food Services - - - - Central Services 350,586 366,406 350,321 16,085 Student Transportation Services 2,946,166 3,024,603 2,651,257 373,346 Operation of Plant 4,279,598 4,424,959 4,241,866 183,093 Maintenance of Plant 1,320,322 1,675,290 1,595,793 79,497 Administrative Technology Services 1,347,399 1,280,819 1,235,613 45,206
Fixed Capital Outlay:Other Capital Outlay - 151,683 151,683 -
Total Expenditures 53,861,958 54,972,322 52,766,280 2,206,042
Excess (Deficiency) of Revenues Over Expenditures (1,825,781) (3,187,146) (878,708) 2,308,438
Other Financing Sources
Loss Recoveries - 1,442 1,442 -
Net Change in Fund Balances (1,825,781) (3,185,704) (877,266) 2,308,438 Fund Balances, Beginning 10,960,018 10,960,018 10,960,018 -
Fund Balances, Ending $ 9,134,237 $ 7,774,314 $ 10,082,752 $ 2,308,438
General Fund
OriginalBudget Budget
FinalActual (Negative)
PositiveFinal Budget -Variance with

Report No. 2017-138 March 2017 Page 59
$ 3,581,000 $ 3,581,000 $ 4,088,162 $ 507,162 $ 6,875,597 $ 9,322,917 $ 7,462,613 $ (1,860,304) 56,876 56,876 54,016 (2,860) - - - -
- - - - - - - - 497,000 497,000 152,901 (344,099) - - - -
2,000 2,000 44,410 42,410 - - - - 499,000 499,000 197,311 (301,689) - - - -
4,136,876 4,136,876 4,339,489 202,613 6,875,597 9,322,917 7,462,613 (1,860,304)
- - - - 4,100,212 6,069,083 4,863,654 1,205,429 - - - - 656,870 668,708 570,310 98,398 - - - - 101,745 59,377 12,639 46,738 - - - - 599,494 937,765 876,525 61,240 - - - - 1,130,537 1,253,872 852,443 401,429 - - - - - - - - - - - - - - - - - - - - 194,829 212,241 164,617 47,624 - - - - 10,000 - - - - - - - 500 350 350 - - - - - - - - -
4,006,512 4,509,215 4,360,555 148,660 - - - - - - - - 78,809 - - - - - - - 2,601 86,283 83,869 2,414 - - - - - 29 - 29 - - - - - - - - - - - - - - - -
- 134,501 134,501 - - 41,965 41,965 -
4,006,512 4,643,716 4,495,056 148,660 6,875,597 9,329,673 7,466,372 1,863,301
130,364 (506,840) (155,567) 351,273 - (6,756) (3,759) 2,997
- - - - - - - -
130,364 (506,840) (155,567) 351,273 - (6,756) (3,759) 2,997 2,089,184 2,089,184 2,089,184 - 8,096 8,096 8,096 -
$ 2,219,548 $ 1,582,344 $ 1,933,617 $ 351,273 $ 8,096 $ 1,340 $ 4,337 $ 2,997
Final Budget -Variance with
Special Revenue - Other Fund
(Negative)ActualBudgetBudgetPositiveFinalOriginal
Special Revenue - Food Service Fund
PositiveBudget Budget Actual (Negative)
Variance withFinal Budget -
Original Final

Report No. 2017-138 Page 60 March 2017
Schedule of Funding Progress – Other Postemployment Benefits Plan
Actuarial UAAL as a Accrued Unfunded Percentage of
Actuarial Liability (AAL) AAL Funded Covered Covered Valuation (1) (UAAL) Ratio Payroll Payroll
Date (b) (b-a) (a/b) (c) [(b-a)/c]
01/01/12 $ - 4,134,396$ 4,134,396$ 0.0% 26,473,426$ 15.6%01/01/14 - 4,715,203 4,715,203 0.0% 31,121,488 15.2%01/01/16 - 6,828,808 6,828,808 0.0% 30,647,770 22.3%
ActuarialValue ofAssets
(a)
Note: (1) The District’s OPEB actuarial valuation used the entry age normal cost actuarial method to estimate the actuarial accrued liability.
Schedule of the District’s Proportionate Share of the Net Pension Liability –
Florida Retirement System Pension Plan (1)
2015 2014 2013District's proportion of the FRS net pension liability 0.091690263% 0.091080451% 0.083559847%
District's proportionate share of the FRS net pension liability 11,843,027$ 5,557,247$ 14,384,369$
District's covered-employee payroll 28,822,118$ 28,758,181$ 27,840,222$
District's proportionate share of the FRS net pension liability as a percentage of its covered-employee payroll 41.09% 19.32% 51.67%
FRS Plan fiduciary net position as a percentage of the total pension liability 92.00% 96.09% 88.54%
Note: (1) The amounts presented for each fiscal year were determined as of June 30.
Schedule of District Contributions – Florida Retirement System Pension Plan (1)
2016 2015 2014Contractually required FRS contribution $ 2,078,325 $ 2,235,486 $ 1,995,048
FRS contributions in relation to the contractually required contribution (2,078,325) (2,235,486) (1,995,048)
FRS contribution deficiency (excess) -$ -$ -$
District's covered-employee payroll 28,433,874$ 28,822,118$ 28,758,181$
FRS contributions as a percentage of covered-employee payroll 7.31% 7.76% 6.94%
Note: (1) The amounts presented for each fiscal year were determined as of June 30.

Report No. 2017-138 March 2017 Page 61
Schedule of the District’s Proportionate Share of the Net Pension Liability –
Health Insurance Subsidy Pension Plan (1)
2015 2014 2013District's proportion of the HIS net pension liability 0.114249769% 0.114941864% 0.111771811%
District's proportionate share of the HIS net pension liability 11,651,679$ 10,747,345$ 9,731,206$
District's covered-employee payroll 34,662,040$ 34,152,530$ 32,430,669$
District's proportionate share of the HIS net pension liability as a percentage of its covered-employee payroll 33.62% 31.47% 30.01%
HIS Plan fiduciary net position as a percentage of the total pension liability 0.50% 0.99% 1.78%
Note: (1) The amounts presented for each fiscal year were determined as of June 30.
Schedule of District Contributions – Health Insurance Subsidy Pension Plan (1)
2016 2015 2014Contractually required HIS contribution $ 573,226 $ 436,734 $ 393,752
HIS contributions in relation to the contractually required contribution (573,226) (436,734) (393,752)
HIS contribution deficiency (excess) -$ -$ -$
District's covered-employee payroll 34,525,827$ 34,662,040$ 34,152,530$
HIS contributions as a percentage of covered-employee payroll 1.66% 1.26% 1.15%
Note: (1) The amounts presented for each fiscal year were determined as of June 30.
NOTES TO REQUIRED SUPPLEMENTARY INFORMATION
1. Budgetary Basis of Accounting
The Board follows procedures established by State statutes and State Board of Education (SBE) rules in
establishing budget balances for governmental funds, as described below:
Budgets are prepared, public hearings are held, and original budgets are adopted annually for all governmental fund types in accordance with procedures and time intervals prescribed by law and SBE rules.
Appropriations are controlled at the object level (e.g., salaries, purchased services, and capital outlay) within each activity (e.g., instruction, student transportation services, and school administration) and may be amended by resolution at any Board meeting prior to the due date for the annual financial report.
Budgets are prepared using the same modified accrual basis as is used to account for governmental funds.
Budgetary information is integrated into the accounting system and, to facilitate budget control, budget balances are encumbered when purchase orders are issued. Appropriations lapse at

Report No. 2017-138 Page 62 March 2017
fiscal year-end and encumbrances outstanding are honored from the subsequent year’s appropriations.
2. Schedule of Funding Progress – Other Postemployment Benefits Plan
The January 1, 2016, unfunded actuarial accrued liability of $6,828,808 increased from the
January 1, 2014, liability of $4,715,203 as a result of benefit changes and other changes in liabilities and
costs as discussed below:
Inclusion of Dental Benefits – The previous valuation was performed assuming that dental benefits would be extended only to retirees electing medical coverage. However, retirees may, and do, continue to participate in the District’s dental program paying subsidized premiums. This change had a very significant increasing effect on the cost and liability compared to the last valuation.
Initial Cost of Coverage – The average cost of coverage for all subscribers (employees and retirees) increased from $736 per subscriber per month (as expected for year beginning January 1, 2014) to $764 per employee per month for the year beginning January 1, 2016. This is lower than the $847 per employee per month previously projected for this year. This change had an effect of slowing down increases in the costs and liabilities.
Population Changes – The number of retirees currently receiving post-employment health benefits increased from 42 in the previous valuation to 44 in this valuation. At the same time, the number of active employees eligible for future post-employment health benefits decreased from 846 to 825. These population changes had a decreasing impact on the cost and liability resulting from this valuation.
Long Term Medical Trend Assumption – Beginning with this valuation, long-term health trend assumptions are developed using a forecasting model sponsored by the Society of Actuaries and built and published in Modeling Long-Term Health Care Cost Trends (December 2007, as updated July 31, 2014) by professor Thomas E. Getzen. Under this model, assumed trend rates for costs decline over a 25-year period from 6.5 percent assumed for the year beginning January 1, 2017, to the ultimate level of 4.24 percent. These changes had a decreasing effect on the costs and liabilities.
Demographic Assumptions – Certain demographic assumptions, including mortality rates and the mortality improvement scale, have been revised to match changes adopted by the Florida Retirement System. These assumptions have been developed in a 2014 experience study and as such are appropriate for this valuation. These assumptions changes had an increasing effect on the result of this valuation.
3. Schedule of Net Pension Liability and Schedule of Contributions – Health Insurance Subsidy Pension Plan
Changes of Assumptions: The municipal bond rate used to determine total pension liability was
decreased from 4.29 percent to 3.8 percent.

Report No. 2017-138 March 2017 Page 63
THIS PAGE INTENTIONALLY LEFT BLANK

Report No. 2017-138 Page 64 March 2017
SCHEDULE OF EXPENDITURES OF FEDERAL AWARDS
Hendry County District School Board Schedule of Expenditures of Federal Awards
For the Fiscal Year Ended June 30, 2016
Catalog of Pass -Federal Domestic Through
Assistance Grantor Amount ofFederal Grantor/Pass-Through Grantor/Program Title Number Number Expenditures
United States Department of Agriculture:Indirect:
Child Nutrition Cluster:Florida Department of Agriculture and Consumer Services:
School Breakfast Program 10.553 15002 $ 714,788 National School Lunch Program 10.555 15001, 15003 3,249,818 Summer Food Service Program for Children 10.559 14006, 14007, 15006, 15007 131,465
Total United States Department of Agriculture 4,096,071
United States Department of Justice:Indirect:
Hendry County Board of County Commissioners:Edward Byrne Memorial Justice Assistance Grant Program 16.738 2011-JAGC-HEND-2-B2-254 12,023
Total United States Department of Justice 12,023
United States Department of Education:Indirect:
Special Education Cluster:Special Education - Grants to States: 84.027
Florida Department of Education 262, 263 1,772,443 Highlands County District School Board None 84,819 Uinversity of South Florida None 5,232
Total Special Education - Grants to States 84.027 1,862,494 Special Education - Preschool Grants: 84.173
Florida Department of Education 267 33,763 Highlands County District School Board None 18,158 Total Special Education - Preschool Grants 84.173 51,921
Total Special Education Cluster 1,914,415
Florida Department of Education:Adult Education - Basic Grants to States 84.002 191 75,999 Title I Grants to Local Educational Agencies 84.010 212, 226 3,215,148 Migrant Education State Grant Program 84.011 217 1,344,756 Career and Technical Education - Basic Grants to States 84.048 161 151,709 Education for Homeless Children and Youth 84.196 127 43,143 Charter Schools 84.358 110 187,185 English Language Acquisition State Grants 84.365 102 135,212 Improving Teacher Quality State Grants 84.367 224 334,539 ARRA - State Fiscal Stabilization Fund (SFSF) -
Race-to-the-Top Incentive Grants, Recovery Act 84.395 RA111 190,720 Florida Gulf Coast University:
Special Education - State Personnel Development 84.323 None 72,845
Total United States Department of Education 7,665,671
Total Expenditures of Federal Awards $ 11,846,610
The accompanying notes are an integral part of this schedule.

Report No. 2017-138 March 2017 Page 65
Notes: (1) Basis of Presentation. The accompanying Schedule of Expenditures of Federal Awards (Schedule) includes the Federal award activity of the Hendry County District School Board under programs of the Federal government for the fiscal year ended June 30, 2016. The information in this Schedule is presented in accordance with the requirements of Title 2 U.S. Code of Federal Regulations Part 200, Uniform Administrative Requirements, Cost Principles, and Audit Requirements for Federal Awards (Uniform Guidance). Because the Schedule presents only a selected portion of the operations of the District, it is not intended to and does not present the financial position or changes in net position of the District.
(2) Summary of Significant Accounting Policies. Expenditures are reported on the modified accrual basis of accounting. Such expenditures are recognized following, as applicable, the cost principles contained in the Uniform Guidance, wherein certain types of expenditures are not allowable or are limited as to reimbursement.
(3) Indirect Cost Rate. The District has not elected to use the 10 percent de minimis cost rate allowed under the Uniform Guidance.
(4) Noncash Assistance – National School Lunch Program. Includes $208,366 of donated food used during the fiscal year. Donated foods are valued at fair value as determined at the time of donation.

Report No. 2017-138 Page 66 March 2017
Phone: (850) 412-2722 Fax: (850) 488-6975
Sherrill F. Norman, CPA Auditor General
AUDITOR GENERAL STATE OF FLORIDA Claude Denson Pepper Building, Suite G74
111 West Madison Street Tallahassee, Florida 32399-1450
The President of the Senate, the Speaker of the House of Representatives, and the Legislative Auditing Committee
INDEPENDENT AUDITOR’S REPORT ON INTERNAL CONTROL OVER
FINANCIAL REPORTING AND ON COMPLIANCE AND OTHER MATTERS
BASED ON AN AUDIT OF FINANCIAL STATEMENTS PERFORMED
IN ACCORDANCE WITH GOVERNMENT AUDITING STANDARDS
We have audited, in accordance with auditing standards generally accepted in the United States of
America and the standards applicable to financial audits contained in Government Auditing Standards
issued by the Comptroller General of the United States, the financial statements of the governmental
activities, each major fund, and the aggregate remaining fund information of the Hendry County District
School Board, as of and for the fiscal year ended June 30, 2016, and the related notes to the financial
statements, which collectively comprise the District’s basic financial statements, and have issued our
report thereon dated March 9, 2017, included under the heading INDEPENDENT AUDITOR’S REPORT.
Our report includes a reference to other auditors who audited the financial statements of the school
internal funds and the Hendry Public Schools Foundation, Inc. as described in our report on the District’s
financial statements. This report does not include the results of the other auditors’ testing of internal
control over financial reporting or compliance and other matters that are reported on separately by those
auditors.
Internal Control Over Financial Reporting
In planning and performing our audit of the financial statements, we considered the District’s internal
control over financial reporting (internal control) to determine audit procedures that are appropriate in the
circumstances for the purpose of expressing our opinions on the financial statements, but not for the
purpose of expressing an opinion on the effectiveness of the District’s internal control. Accordingly, we
do not express an opinion on the effectiveness of the District’s internal control.
A deficiency in internal control exists when the design or operation of a control does not allow
management or employees, in the normal course of performing their assigned functions, to prevent, or
detect and correct, misstatements on a timely basis. A material weakness is a deficiency, or a
combination of deficiencies, in internal control such that there is a reasonable possibility that a material

Report No. 2017-138 March 2017 Page 67
misstatement of the District’s financial statements will not be prevented, or detected and corrected on a
timely basis. A significant deficiency is a deficiency, or a combination of deficiencies, in internal control
that is less severe than a material weakness, yet important enough to merit attention by those charged
with governance.
Our consideration of internal control was for the limited purpose described in the first paragraph of this
section and was not designed to identify all deficiencies in internal control that might be material
weaknesses or significant deficiencies. Given these limitations, during our audit we did not identify any
deficiencies in internal control that we consider to be material weaknesses. However, material
weaknesses may exist that have not been identified.
Compliance and Other Matters
As part of obtaining reasonable assurance about whether the District’s financial statements are free from
material misstatement, we performed tests of its compliance with certain provisions of laws, rules,
regulations, contracts, and grant agreements, noncompliance with which could have a direct and material
effect on the determination of financial statement amounts. However, providing an opinion on compliance
with those provisions was not an objective of our audit and, accordingly, we do not express such an
opinion. The results of our tests disclosed no instances of noncompliance or other matters that are
required to be reported under Government Auditing Standards.
Purpose of this Report
The purpose of this report is solely to describe the scope of our testing of internal control and compliance
and the results of that testing, and not to provide an opinion on the effectiveness of the District’s internal
control or on compliance. This report is an integral part of an audit performed in accordance with
Government Auditing Standards in considering the District’s internal control and compliance.
Accordingly, this communication is not suitable for any other purpose.
Respectfully submitted, Sherrill F. Norman, CPA Tallahassee, Florida March 9, 2017

Report No. 2017-138 Page 68 March 2017
Phone: (850) 412-2722 Fax: (850) 488-6975
Sherrill F. Norman, CPA Auditor General
AUDITOR GENERAL STATE OF FLORIDA Claude Denson Pepper Building, Suite G74
111 West Madison Street Tallahassee, Florida 32399-1450
The President of the Senate, the Speaker of the House of Representatives, and the Legislative Auditing Committee
INDEPENDENT AUDITOR’S REPORT ON COMPLIANCE FOR EACH MAJOR
FEDERAL PROGRAM AND REPORT ON INTERNAL CONTROL OVER COMPLIANCE
REQUIRED BY THE UNIFORM GUIDANCE
Report on Compliance for Each Major Federal Program
We have audited the Hendry County District School Board’s compliance with the types of compliance
requirements described in the OMB Compliance Supplement that could have a direct and material effect
on each of the District’s major Federal programs for the fiscal year ended June 30, 2016. The District’s
major Federal programs are identified in the SUMMARY OF AUDITOR’S RESULTS section of the
accompanying SCHEDULE OF FINDINGS AND QUESTIONED COSTS.
Management’s Responsibility
Management is responsible for compliance with Federal statutes, regulations, and the terms and
conditions of its Federal awards applicable to its Federal programs.
Auditor’s Responsibility
Our responsibility is to express an opinion on compliance for each of the District’s major Federal programs
based on our audit of the types of compliance requirements referred to above. We conducted our audit
of compliance in accordance with auditing standards generally accepted in the United States of America;
the standards applicable to financial audits contained in Government Auditing Standards, issued by the
Comptroller General of the United States; and the audit requirements of Title 2 U.S. Code of Federal
Regulations Part 200, Uniform Administrative Requirements, Cost Principles, and Audit Requirements
for Federal Awards (Uniform Guidance). Those standards and the Uniform Guidance require that we
plan and perform the audit to obtain reasonable assurance about whether noncompliance with the types
of compliance requirements referred to above that could have a direct and material effect on a major
Federal program occurred. An audit includes examining, on a test basis, evidence about the District’s
compliance with those requirements and performing such other procedures as we considered necessary
in the circumstances.

Report No. 2017-138 March 2017 Page 69
We believe that our audit provides a reasonable basis for our opinion on compliance for each major
Federal program. However, our audit does not provide a legal determination of the District’s compliance.
Opinion on Each Major Federal Program
In our opinion, the District complied, in all material respects, with the types of compliance requirements
referred to above that could have a direct and material effect on each of its major Federal programs for
the fiscal year ended June 30, 2016.
Report on Internal Control Over Compliance
District management is responsible for establishing and maintaining effective internal control over
compliance with the types of compliance requirements referred to above. In planning and performing our
audit of compliance, we considered the District’s internal control over compliance with the types of
requirements that could have a direct and material effect on each major Federal program to determine
the auditing procedures that are appropriate in the circumstances for the purpose of expressing an
opinion on compliance for each major Federal program and to test and report on internal control over
compliance in accordance with the Uniform Guidance, but not for the purpose of expressing an opinion
on the effectiveness of internal control over compliance. Accordingly, we do not express an opinion on
the effectiveness of the District’s internal control over compliance.
A deficiency in internal control over compliance exists when the design or operation of a control over
compliance does not allow management or employees, in the normal course of performing their assigned
functions, to prevent, or detect and correct, noncompliance with a type of compliance requirement of a
Federal program on a timely basis. A material weakness in internal control over compliance is a
deficiency, or a combination of deficiencies, in internal control over compliance, such that there is a
reasonable possibility that material noncompliance with a type of compliance requirement of a Federal
program will not be prevented, or detected and corrected, on a timely basis. A significant deficiency in
internal control over compliance is a deficiency, or a combination of deficiencies, in internal control over
compliance with a type of compliance requirement of a Federal program that is less severe than a material
weakness in internal control over compliance, yet important enough to merit attention by those charged
with governance.
Our consideration of internal control over compliance was for the limited purpose described in the first
paragraph of this section and was not designed to identify all deficiencies in internal control over
compliance that might be material weaknesses or significant deficiencies. We did not identify any
deficiencies in internal control over compliance that we consider to be material weaknesses. However,
material weaknesses may exist that have not been identified.

Report No. 2017-138 Page 70 March 2017
The purpose of this report on internal control over compliance is solely to describe the scope of our testing
of internal control over compliance and the results of that testing based on the requirements of the
Uniform Guidance. Accordingly, this report is not suitable for any other purpose.
Respectfully submitted, Sherrill F. Norman, CPA Tallahassee, Florida March 9, 2017

Report No. 2017-138 March 2017 Page 71
SCHEDULE OF FINDINGS AND QUESTIONED COSTS
SUMMARY OF AUDITOR’S RESULTS
Financial Statements
Type of auditor’s report issued on whether the financial statements audited were prepared in accordance with GAAP: Unmodified
Internal control over financial reporting:
Material weakness(es) identified? No
Significant deficiency(ies) identified? None reported
Noncompliance material to financial statements noted? No Federal Awards
Internal control over major Federal programs:
Material weakness(es) identified? No
Significant deficiency(ies) identified? None reported
Type of auditor’s report issued on compliance for major Federal programs: Unmodified
Any audit findings disclosed that are required to be reported in accordance with 2 CFR 200.516(a)? No
Identification of major programs:
CFDA Numbers: Name of Federal Program or Cluster: 84.010 Title I Grants to Local Educational
Agencies 84.027 and 84.173 Special Education Cluster
Dollar threshold used to distinguish between type A and type B programs: $750,000
Auditee qualified as low risk auditee? Yes
Report No. 2017-138 Page 72 March 2017
PRIOR AUDIT FOLLOW-UP
There were no prior financial statement findings requiring follow-up.
SUMMARY SCHEDULE OF PRIOR AUDIT FINDINGS
The District did not have prior audit findings required to be reported under 2 CFR 200.511.

BOARD MEMBER BUSINESS
a. Dues & Fees –
1. Florida School Labor Relations Service/Florida Education Negotiators (FSLRS/FEN)Membership Dues – Permission to pay the FSLRS/FEN Membership Dues for 2017-18 in theamount of $3,100.00 (See Attached)
2. Florida School Boards Association (FSBA) Membership Dues – Permission to pay the FSBAMembership Dues for 2017-18 in the amount of $11,053.00. (See Attached)
b. Upcoming Board Meeting/Workshop Location Changes –
April 25, 2017 Board Workshop – Change location to LaBelle High School Media Center
May 9, 2017 School Board Meeting – Change location to LaBelle Elementary School Media Center