Embed Size (px)
Citation preview

Produced by: For important disclosure information, please refer to the disclaimer page of this report.
All ESN research is available on Bloomberg, “ESNR”, Thomson-Reuters, S&P Capital IQ, FactSet
Distributed by the Members of ESN (see last page of this report)
Company Flash Note Reason: Company newsflow 11 October 2018
Movin’ in the right direction
The overall restructuring process of Schaltbau is on track in our view. The
sale of Schaltbau Sepsa seems to be more difficult than expected and is not
yet finalised. Based on the reported H1 2018 results the group will reach its
own financial targets for the full year in our view. We believe the main share
price catalysts are likely to be: Reaching further milestones of the overall
restructuring concept like e.g. cost savings, financial debt reductions and the
completion of loss-making projects. According to our assessment the latest
share price decline of nearly 22% since end of August is not justified. Our new
target price slightly increased to EUR 32.90 from 32.70 per share. Schaltbau
remains as one of our small cap top picks in our Industrials investment
universe.
Innovations at InnoTrans: Nearly all exhibitors presented “smart railway”
solutions and thus showing where markets seem to develop over the next
years. This trend was also visible at Schaltbau’s booth. Some of the highlights
presented are “IntelliDesk”, an innovative new driver desk concept or integrated
train door systems fitted with sensor technology.
Financial targets ‘18e will be reached: H1 ’18 results and the favourable order
book of EUR 533m end of June ‘18 are a solid basis to achieve the planned full-
year targets. Group sales should reach EUR 480-500m and compare with our
estimate of EUR 492m. Schaltbau plans to reach an EBIT-margin of
approximately 3%, while we are estimating 3.2%. We also stay optimistic for
FY2019e with a further improvement to 5.6%.
Segment performance: We expect for both segments Mobile and Stationary
Transportation Technology (MTT; STT) to achieve the turnaround (Exhibit 5) on
EBIT level for 2018e. MTT is expected to reach an EBIT of EUR 3.5m (FY ’16:
EUR -26.4m), while our EBIT forecast for STT amounted to EUR 0.5m (FY ’16:
EUR -5.5m). The Components segment will remain a solid earnings contributor
with an estimated EBIT of EUR 24.1m (FY ’16: EUR 21.4m).
Valuation update: We continue to value the Schaltbau shares with our DCF-
model. Our base input parameters have not changed: Beta at 1.1, terminal
growth rate at 2% and sustainable margin at 7%. Our equity value amounted to
EUR 290.9m or EUR 32.90 per share. That currently offers an upside potential
of ~44%.
Key risks comprise e.g. 1) The expected growth of the global railway markets
will not meet Schaltbau’s expectations with regard to their own targets. 2) The
company will not meet all milestones fixed in the general restructuring plan, e.g.
profitability improvement or working capital reduction targets. 3) Reduction of
the group’s financial debt might take longer than expected. 4) General inherent
risks of the project business could lead to cost overruns or other burdening
factors. 5) Further impairment risks in the group’s company portfolio.
9M/Q3 results: 08 November 2018
Schaltbau Holding AG
Sponsored Research
Investment Research Germany | Industrial Engineering
Analyst(s)
Winfried Becker
+49 69 58997-416
Buy
22.80closing price as of 10/10/2018
32.9032.70
44.3%Upside/Downside Potential
from Target Price: EUR
Recommendation unchanged
Target price: EUR
Share price: EUR
Reuters/Bloomberg SLTG.DE/SLT GY
Market capitalisation (EURm) 202
Current N° of shares (m) 9
Free float 33%
Daily avg. no. trad. sh. 12 mth 6
Daily avg. trad. vol. 12 mth (m) 54.69
Price high/low 12 months 22.80 / 29.65
Abs Perfs 1/3/12 mths (%) -18.28/-8.43/-23.10
Key financials (EUR) 12/17 12/18e 12/19e
Sales (m) 517 492 502
EBITDA (m) 20 27 37
EBITDA margin 3.9% 5.6% 7.5%
EBIT (m) (23) 16 28
EBIT margin nm 3.2% 5.6%
Net Profit (adj.)(m) (34) 3 13
ROCE 0.6% 3.7% 7.9%
Net debt/(cash) (m) 159 92 81
Net Debt Equity 2.2 0.7 0.6
Net Debt/EBITDA 7.9 3.4 2.2
Int. cover(EBITDA/Fin.int) 1.8 4.1 5.8
EV/Sales 0.8 0.8 0.7
EV/EBITDA 20.7 13.9 9.9
EV/EBITDA (adj.) 9.1 15.5 9.9
EV/EBIT nm 24.0 13.2
P/E (adj.) nm nm 15.3
P/BV 4.3 2.2 1.9
OpFCF yield -7.4% -0.3% 8.8%
Dividend yield 0.0% 0.0% 0.0%
EPS (adj.) (5.13) 0.29 1.49
BVPS 5.94 10.52 12.01
DPS 0.00 0.00 0.00
Shareholders
AiC (Luxunion, Monolith, Others) 29%; AOC / AOF 10%;
22
23
24
25
26
27
28
29
30
31
32
Sep 17 Okt 17 Nov 17 Dez 17 Jan 18 Feb 18 Mrz 18 Apr 18 Mai 18 Jun 18 Jul 18 Aug 18 Sep 18 Okt 18
vvdsvdvsdy
SCHALTBAU HOLDING AG SDAX (Rebased)
Source: Factset

Schaltbau Holding AG
Page 2
Exhibit 1: Schaltbau Holding at a glance
Source: Company data, equinet Research
Business Units
Guidance (FY 2018e) equinet Estimates
Revenue: Revenue:y/y y/y
EBIT- EBIT rep.
CEO Dr. Albrecht Köhler CFO Thomas Dippold CRO Dr. Martin Kleinschmitt Volker Kregelin
Board member as of Dec. 2018
Year-end number of
employees: FY 2017
Board member (speaker) since 2018
• Studies in mechnical engineering
• Management positions at Knorr-
Bremse
• Over three decades Dr. Köhler
gained
a wealth of strategic and operational
expertise in the railway and automotive
industries
CRO (since 2017)
• Lawyer and partner of Noerr LLP and
member of the board of Noerr
Consulting AG
• Since 2002 Dr. Kleinschmitt
functioned as interim CFO of various
firms in distress
• Responsible for the restructuring of
Schaltbau AG
Board memeber since 2017
• Background in Reporting and
Consulting
• Expatriate Management position in
Singapur with Schott AG
• From 2014 to 2017 CFO of Faber-
Castell
Mobile Transportation Technology (MTT) Stationary Transportation Technology (STT) Components (COM)
n.a.
Door systems: IFE (Knorr-Bremse), Kangni, Faiveley (WABTEC Corp.), Ventura, Masats,
IWN, Snop, Rollmech, Edscha. Sanitary systems: EVAC, BFG, SEMVAC
Level crossing technology: Scheidt & Bachmann, Siemens. Signalling equipment:
Frauscher, Siemens, Bombardier, Thales. Other: Ansaldo STS SpA, Construcciones y
Auxiliar de Ferrocarriles SA, Westinghouse Air Brake Technologies Corporation
Driver desks: Alfa Union (Czech Republic), Gessmann (GER), Kaitan (Dhina);
Electromechanical components: Sècheron (CH), Microelettrica Scientifica S.p.A. (Italy);
Other: Crouzet, FreightCar America Inc.
Public and private rail infrastructure operators
Broad customer base
EBITDA (EURm) EBIT adj. (EURm)20.1
Products/ applications
Covers the entire value chain of door and boarding systems for trains, buses and
commercial vehicles. Provides complete sanitary systems, interior fittings and air
conditioning units and tanks for rolling stock
Level crossing systems (such as computer-controlled RBUET and RBUEP technologies),
control and safety systems for trains, point heating systems, platform screen doors,
signalling equipment, tunnel safety lighting equipment
Develops, manufactures and sells connectors, snap-action switches and contactors for
mulitple applications in the rail and other sectors; supplies master controllers and
integrated driver's desks for the operation of rolling stock
Customers
Public and private rail infrastructure operators, such as Deutsche Bahn AG and rail systems
suppliers
Olygopolistic market structure with increasing pricing power of customersConcentrated customer base of several train operators and OEMs
Rail train and public transport operators, OEMs
Market share/
positioning
With the exception of refurbishment activities Schaltbau companies rank among the four
leading players in its relevant marketsLeading position in Germany Leading position in Germany and selected European countries
Entry barriers/
competitive advantage
The company has developed a long-lasting expertise and stable customer relationships with leading providers of rail transportation services and OEMs. High technological know-how is necessary to meet customer needs. Schaltbau is able to offer complete system solutions
including MRO services and overall is a reliable partner
Drivers
Macroeconomic developments and especially economic growth of the relevant markets of
Germany and EU. Regulatory legislation of rail transportation, e.g. LuFV II and of
environment pollution (fostering public transportation).
More specifically, the company benefits from such trends as urbanisation and demand for
safety and convenience in public transportation. Similarly, digitalization of transportation
services and higher awereness of environment polution have a positive effect on the
company's operations.
Digitalisation and autonomous driving
Main competitors
Strategy & Guidance
Consensus (FactSet)
EUR 480 - 500m EUR 492m EUR 496.2m -7.1% - 3.2% -4.7% -3.9%
EUR 15.8m EUR 17.5mcirca 3.0%
Strategy
(I) Securing and improving the global market position and competitiveness
(II) Concentration on profitable business areas with growth perspectives
(III) Exploitation of new business areas
Sales (EURm) 516.5
Margin2017
3,370
Shareholder structure
& management
Sales & EBIT Split
Sales split by region (average 2014 - 2016) Sales split by division (average 2014 - 2016) EBIT split by division (average 2014 - 2016) Group financial development
2.4 Sales 5Y hist. CAGR 7.3%
0.5% Organic growth y/y
Shareholder structure (rough estimation)
y/y 1.4% Margin 3.9%
Germany35%
EU35%
Other countries
30%Mobile
Transportati
on
Technology
(MTT)44%
Stationary Transportati
on
Technology
(STT)30%
Components (COM)
26%
20%
120%
220%
320%
420%
520%
620%
0
40
80
120
160
2015 2016 2017 2018e 2019e 2020e
Equity, EUR m Gearing, %
AiC (Luxunion,
Monolith,
Others)
29%
AOC / AOF9%
Sharehold. Value Mgt.
AG
9%
Other Inst. Inv estors
20%
Free f loat32%
Divisional EBIT Split Average 15 - 17
Mobile Transportation Technology (MTT) -1.8
Stationary Transportation Technology (STT) -10.8
Components (COM) 20.7
Total amount segments 8.1

Schaltbau Holding AG
Page 3
Investment Case in Charts
Exhibit 2: Average market size 2009 - 2021 Exhibit 3: Market development by segment
Source: UNIFE, Roland Berger Source: Alstom, UNIFE
Exhibit 4: Schaltbau: Restructuring Roadmap Exhibit 5: Reported EBIT-margin recovery by segment
Source: Company data Source: Company data, equinet Research
Exhibit 6: EBIT-margin recovery after failed M&A-policy Exhibit 7: Financial recovery – gearing will normalise
Source: Company data, equinet Research Source: Company data, equinet Research
0
50
100
150
200
2009-2011 2011-2013 2013-2015 2017-2019 2019-2021
EU
R b
n
Market size: Railway technology
-25.0%
-20.0%
-15.0%
-10.0%
-5.0%
0.0%
5.0%
10.0%
15.0%
20.0%
2014 2015 2016 2017 2018e 2019e 2020e 2021e
M T T S T T C O M
-8%
-4%
0%
4%
8%
12%
0
100
200
300
400
500
600
EU
R m
Revenues EBIT Margin
0%
100%
200%
300%
400%
500%
0
50
100
150
200
250
EU
R m
Net Debt + Pension Provisions Gearing, %
Schaltbau Holding AG
Page 4
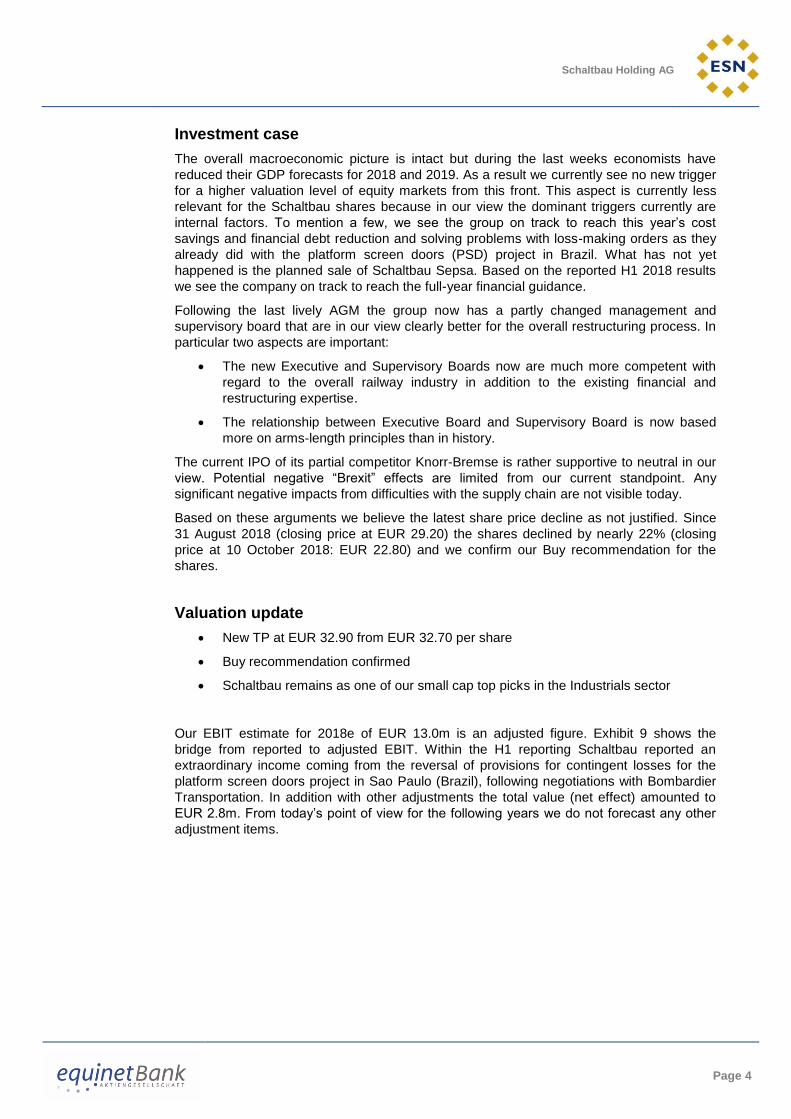
Investment case
The overall macroeconomic picture is intact but during the last weeks economists have
reduced their GDP forecasts for 2018 and 2019. As a result we currently see no new trigger
for a higher valuation level of equity markets from this front. This aspect is currently less
relevant for the Schaltbau shares because in our view the dominant triggers currently are
internal factors. To mention a few, we see the group on track to reach this year’s cost
savings and financial debt reduction and solving problems with loss-making orders as they
already did with the platform screen doors (PSD) project in Brazil. What has not yet
happened is the planned sale of Schaltbau Sepsa. Based on the reported H1 2018 results
we see the company on track to reach the full-year financial guidance.
Following the last lively AGM the group now has a partly changed management and
supervisory board that are in our view clearly better for the overall restructuring process. In
particular two aspects are important:
The new Executive and Supervisory Boards now are much more competent with
regard to the overall railway industry in addition to the existing financial and
restructuring expertise.
The relationship between Executive Board and Supervisory Board is now based
more on arms-length principles than in history.
The current IPO of its partial competitor Knorr-Bremse is rather supportive to neutral in our
view. Potential negative “Brexit” effects are limited from our current standpoint. Any
significant negative impacts from difficulties with the supply chain are not visible today.
Based on these arguments we believe the latest share price decline as not justified. Since
31 August 2018 (closing price at EUR 29.20) the shares declined by nearly 22% (closing
price at 10 October 2018: EUR 22.80) and we confirm our Buy recommendation for the
shares.
Valuation update
New TP at EUR 32.90 from EUR 32.70 per share
Buy recommendation confirmed
Schaltbau remains as one of our small cap top picks in the Industrials sector
Our EBIT estimate for 2018e of EUR 13.0m is an adjusted figure. Exhibit 9 shows the
bridge from reported to adjusted EBIT. Within the H1 reporting Schaltbau reported an
extraordinary income coming from the reversal of provisions for contingent losses for the
platform screen doors project in Sao Paulo (Brazil), following negotiations with Bombardier
Transportation. In addition with other adjustments the total value (net effect) amounted to
EUR 2.8m. From today’s point of view for the following years we do not forecast any other
adjustment items.

Schaltbau Holding AG
Page 5
Exhibit 8: Schaltbau Holding: DCF - model
Source: equinet Research
Exhibit 9: Schaltbau Holding: EBIT- bridge
Source: Company data, equinet Research
Phase III
EUR m 2018e 2019e 2020e 2021e 2022e 2023e 2024e 2025e 2026e 2027e
Revenues 492.0 502.0 519.5 539.0 558.5 577.2 595.0 611.7 627.2 641.4
growth rate -4.7% 2.0% 3.5% 3.8% 3.6% 3.3% 3.1% 2.8% 2.5% 2.3%
EBIT 13.0 28.0 33.2 37.4 40.8 41.8 42.8 43.7 44.4 45.1
EBIT margin 2.6% 5.6% 6.4% 6.9% 7.3% 7.2% 7.2% 7.1% 7.1% 7.0%
Tax -3.9 -8.4 -10.0 -11.2 -12.2 -12.5 -12.8 -13.1 -13.3 -13.5
Tax rate 30% 30% 30% 30% 30% 30% 30% 30% 30% 30%
Depr. & Amort. 11.5 9.5 9.0 9.0 9.0 10.1 10.9 11.4 11.8 12.2
% of sales 2.3% 1.9% 1.7% 1.7% 1.6% 1.8% 1.8% 1.9% 1.9% 1.9%
Capex -9.0 -9.0 -11.3 -11.6 -11.4 -11.7 -12.0 -12.3 -12.6 -12.8
% of sales 1.8% 1.8% 2.2% 2.2% 2.0% 2.0% 2.0% 2.0% 2.0% 2.0%
Change in WC & P -2.3 -2.0 -2.2 -1.7 -1.6 -1.7 -1.8 -1.8 -1.9 -1.9
% of sales 0.5% 0.4% 0.4% 0.3% 0.3% 0.3% 0.3% 0.3% 0.3% 0.3%
Free Cash Flow 9.3 18.1 18.7 21.8 24.5 26.1 27.1 27.9 28.5 29.1 563.3
growth rate nm 95.7% 3.2% 16.7% 12.1% 6.4% 4.1% 2.9% 2.2% 1.9% 2.0%
Present Value FCF 9.1 16.6 16.0 17.4 18.2 18.1 17.5 16.8 16.0 15.2 295.1
PV Phase I 77.4 Risk free rate 3.50% Targ. equity ratio 65%
PV Phase II 83.7 Premium Equity 5.00% Beta 1.1
PV Phase III 295.1 Premium Debt 2.00% WACC 7.3%
Enterprise value 456.2 Sensitivity
- Net Debt (Cash) 96.5 1.0% 1.5% 2.0% 2.5% 3.0%
- Pension Provisions 37.5 6.54% 33.6 37.0 41.3 46.6 53.5
- Minorities & Peripherals 31.3 6.90% 30.2 33.2 36.8 41.2 46.7
+ MV of financial assets WACC 7.26% 27.3 29.8 32.9 36.5 41.1
- Paid-out dividends for last FY 0.0 7.63% 24.6 26.9 29.5 32.6 36.4
+/- Other EV items 7.99% 22.3 24.2 26.5 29.1 32.3
Equity value 290.9
Number of shares 8.85
Value per share (€) 32.86
Current Price (€) 22.80
Upside 44.1%
Phase I Phase II
Growth in phase III
EUR m 2015 2016 2017 2018e 2019e 2020e 2021e 2022e
EBIT reported 33.4 -14.5 -23.0 15.8 28.0 33.2 37.4 40.8
one-off / extraordinary income (-)
Revaluation of Albatros S.L.U. (Spain) "Sepsa" -7.0
Revaluation RDS (Poland) -2.5
Income related to prior periods -3.5 -3.4 -7.1
one-off / extraordinary expenses (+)
Revaluation: Schaltbau Sepsa 24.2
Revaluation: Pintsch Bubenzer 1.1
Expenses related to prior periods 0.6 0.6 0.1 4.3
Operating EBIT 28.0 -24.3 2.4 13.0 28.0 33.2 37.4 40.8
Schaltbau Holding AG
Page 6
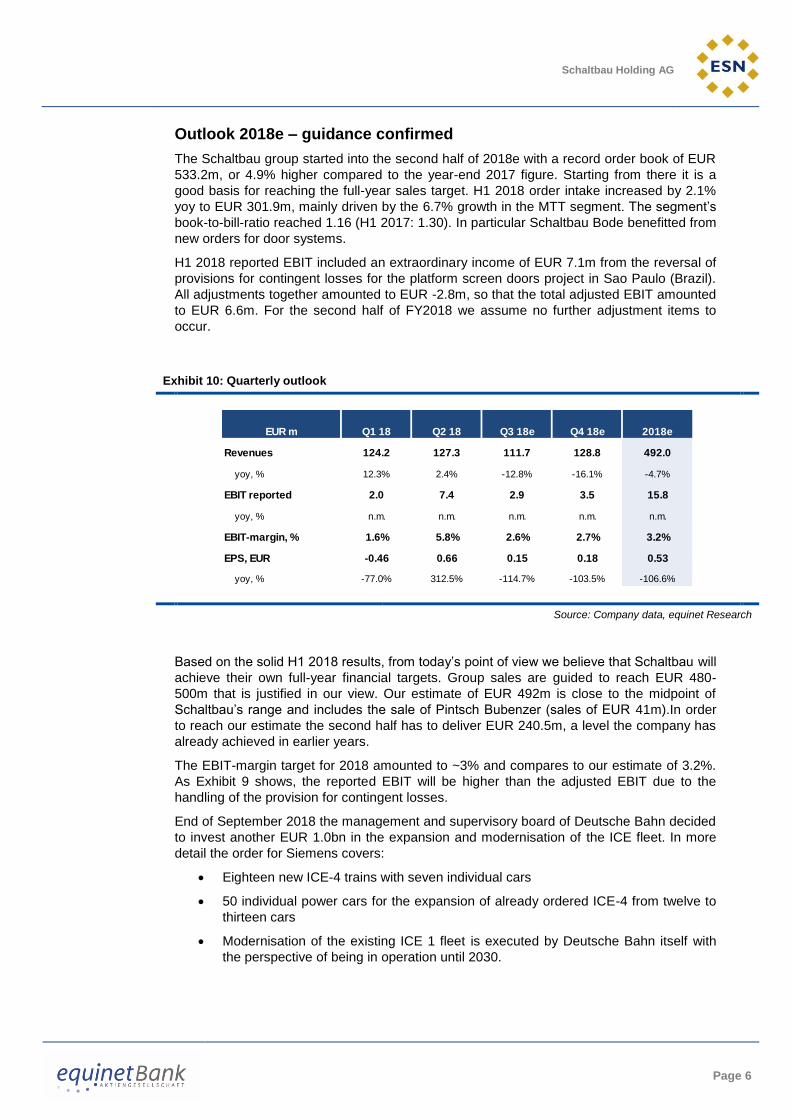
Outlook 2018e – guidance confirmed
The Schaltbau group started into the second half of 2018e with a record order book of EUR
533.2m, or 4.9% higher compared to the year-end 2017 figure. Starting from there it is a
good basis for reaching the full-year sales target. H1 2018 order intake increased by 2.1%
yoy to EUR 301.9m, mainly driven by the 6.7% growth in the MTT segment. The segment’s
book-to-bill-ratio reached 1.16 (H1 2017: 1.30). In particular Schaltbau Bode benefitted from
new orders for door systems.
H1 2018 reported EBIT included an extraordinary income of EUR 7.1m from the reversal of
provisions for contingent losses for the platform screen doors project in Sao Paulo (Brazil).
All adjustments together amounted to EUR -2.8m, so that the total adjusted EBIT amounted
to EUR 6.6m. For the second half of FY2018 we assume no further adjustment items to
occur.
Exhibit 10: Quarterly outlook
Source: Company data, equinet Research
Based on the solid H1 2018 results, from today’s point of view we believe that Schaltbau will
achieve their own full-year financial targets. Group sales are guided to reach EUR 480-
500m that is justified in our view. Our estimate of EUR 492m is close to the midpoint of
Schaltbau’s range and includes the sale of Pintsch Bubenzer (sales of EUR 41m).In order
to reach our estimate the second half has to deliver EUR 240.5m, a level the company has
already achieved in earlier years.
The EBIT-margin target for 2018 amounted to ~3% and compares to our estimate of 3.2%.
As Exhibit 9 shows, the reported EBIT will be higher than the adjusted EBIT due to the
handling of the provision for contingent losses.
End of September 2018 the management and supervisory board of Deutsche Bahn decided
to invest another EUR 1.0bn in the expansion and modernisation of the ICE fleet. In more
detail the order for Siemens covers:
Eighteen new ICE-4 trains with seven individual cars
50 individual power cars for the expansion of already ordered ICE-4 from twelve to
thirteen cars
Modernisation of the existing ICE 1 fleet is executed by Deutsche Bahn itself with
the perspective of being in operation until 2030.
EUR m Q1 18 Q2 18 Q3 18e Q4 18e 2018e
Revenues 124.2 127.3 111.7 128.8 492.0
yoy, % 12.3% 2.4% -12.8% -16.1% -4.7%
EBIT reported 2.0 7.4 2.9 3.5 15.8
yoy, % n.m. n.m. n.m. n.m. n.m.
EBIT-margin, % 1.6% 5.8% 2.6% 2.7% 3.2%
EPS, EUR -0.46 0.66 0.15 0.18 0.53
yoy, % -77.0% 312.5% -114.7% -103.5% -106.6%

Schaltbau Holding AG
Page 7
The twelve cars ICE-4 is equipped with 22 toilets and 22 doors on each side of the train.
Both Deutsche Bahn and Siemens are customers of the Schaltbau group and so far the
company could benefit from these new projects.
Innotrans highlights – innovations from Schaltbau
Smart railway the dominating topic
Schaltbau with several innovative products
The overall dominating topic of this year’s InnoTrans fair was digitalisation (“smart
railway”).This is one pillar in the long-term, global need for efficient and environmentally-
friendly public transport both for long distance, high-speed traffic as well as for metro
solutions in megacities. This trend was clearly reflected at Schaltbau’s booth, represented
by the company’s slogan “The Smart Evolution of Technology”. As we have seen during a
visit of Schaltbau’s booth some selected interesting “new” products/solutions are:
“IntelliDesk”: Schaltbau subsidiary SPII presented this innovative and wiring
concept for the system integration inside a driver’s desk according to UIC 612 norm.
The modular construction concept allows customized solutions. First interest was
shown from a Russian client and in approximately three years from now a broad
market introduction could take place
Sepsa presented an integrated passenger information and control system with e.g.
video surveillance and the analysis of train operating data
Alte initially presented a new vacuum toilet module (“Easy Compact”)
Bode presented new, single-leaf train door systems with a new sensor technology
with more optimised maintenance costs
Other selective highlights:
The German coalition government has given a clear commitment in the latest
coalition agreement to double the number of rail customers by 2030. In order to
reach this goal substantial infrastructure investments are necessary.
The Swiss Stadler Rail AG decided to develop a new own business segment for
signalling and automation systems, according to the company. Stadler sees itself
under pressure, having in mind the merger of Siemens and Alstom in the area of
signalling.
The booth of Knorr-Bremse was highly frequented by visitors having in mind their
planned IPO. In the meantime more details were published by the company. The
bookbuilding price range was fixed at EUR 72 – 87 per share and would give the
company a value at the upper end of EUR 14bn. First trading day should be 12
October 2018. Knorr-Bremse is a competitor for Schaltbau (subsidiary Bode GmbH)
e.g. in the market segment for entrance systems. According to Knorr-Bremse’s
information they are the leading provider with a global market share of ~25% for this
business.
Schaltbau Holding AG
Page 8
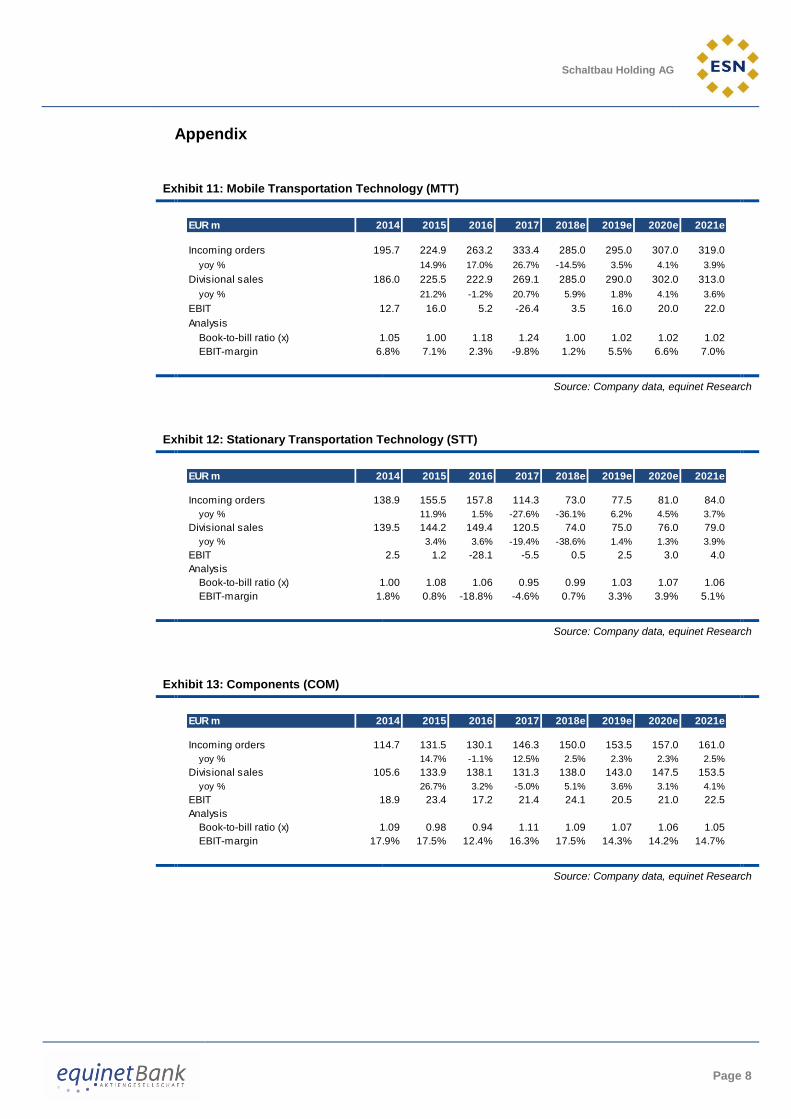
Appendix
Exhibit 11: Mobile Transportation Technology (MTT)
Source: Company data, equinet Research
Exhibit 12: Stationary Transportation Technology (STT)
Source: Company data, equinet Research
Exhibit 13: Components (COM)
Source: Company data, equinet Research
EUR m 2014 2015 2016 2017 2018e 2019e 2020e 2021e
Incoming orders 195.7 224.9 263.2 333.4 285.0 295.0 307.0 319.0
yoy % 14.9% 17.0% 26.7% -14.5% 3.5% 4.1% 3.9%
Divisional sales 186.0 225.5 222.9 269.1 285.0 290.0 302.0 313.0
yoy % 21.2% -1.2% 20.7% 5.9% 1.8% 4.1% 3.6%
EBIT 12.7 16.0 5.2 -26.4 3.5 16.0 20.0 22.0
Analysis
Book-to-bill ratio (x) 1.05 1.00 1.18 1.24 1.00 1.02 1.02 1.02
EBIT-margin 6.8% 7.1% 2.3% -9.8% 1.2% 5.5% 6.6% 7.0%
EUR m 2014 2015 2016 2017 2018e 2019e 2020e 2021e
Incoming orders 138.9 155.5 157.8 114.3 73.0 77.5 81.0 84.0
yoy % 11.9% 1.5% -27.6% -36.1% 6.2% 4.5% 3.7%
Divisional sales 139.5 144.2 149.4 120.5 74.0 75.0 76.0 79.0
yoy % 3.4% 3.6% -19.4% -38.6% 1.4% 1.3% 3.9%
EBIT 2.5 1.2 -28.1 -5.5 0.5 2.5 3.0 4.0
Analysis
Book-to-bill ratio (x) 1.00 1.08 1.06 0.95 0.99 1.03 1.07 1.06
EBIT-margin 1.8% 0.8% -18.8% -4.6% 0.7% 3.3% 3.9% 5.1%
EUR m 2014 2015 2016 2017 2018e 2019e 2020e 2021e
Incoming orders 114.7 131.5 130.1 146.3 150.0 153.5 157.0 161.0
yoy % 14.7% -1.1% 12.5% 2.5% 2.3% 2.3% 2.5%
Divisional sales 105.6 133.9 138.1 131.3 138.0 143.0 147.5 153.5
yoy % 26.7% 3.2% -5.0% 5.1% 3.6% 3.1% 4.1%
EBIT 18.9 23.4 17.2 21.4 24.1 20.5 21.0 22.5
Analysis
Book-to-bill ratio (x) 1.09 0.98 0.94 1.11 1.09 1.07 1.06 1.05
EBIT-margin 17.9% 17.5% 12.4% 16.3% 17.5% 14.3% 14.2% 14.7%

Schaltbau Holding AG
Page 9
Schaltbau Holding AG : Summary tables
PROFIT & LOSS (EURm) 12/2014 12/2015 12/2016 12/2017 12/2018e 12/2019e
Sales 430 502 509 517 492 502
Cost of Sales & Operating Costs -391 -461 -503 -471 -467 -465
Non Recurrent Expenses/Income 0.0 5.4 9.8 -25.4 2.8 0.0
EBITDA 38.3 46.5 16.3 20.1 27.3 37.5
EBITDA (adj.)* 38.3 41.1 6.5 45.5 24.5 37.5
Depreciation -11.0 -13.1 -30.8 -43.1 -11.5 -9.5
EBITA 27.3 33.4 -14.5 -23.0 15.8 28.0
EBITA (adj)* 27.3 28.0 -24.3 2.4 13.0 28.0
Amortisations and Write Downs 0.0 0.0 0.0 0.0 0.0 0.0
of which PPA amortisation 0.0 0.0 0.0 0.0 0.0 0.0
EBIT 27.3 33.4 -14.5 -23.0 15.8 28.0
EBIT (adj.)* 27.3 28.0 -24.3 2.4 13.0 28.0
Net Financial Interest -4.3 -5.4 -5.2 -10.9 -6.7 -6.5
Other Financials 0.0 0.0 0.0 0.0 0.0 0.0
Associates 12.2 2.1 3.9 -1.8 0.2 0.2
Other Non Recurrent Items 0.0 0.0 0.0 0.0 0.0 0.0
Earnings Before Tax (EBT) 35.2 30.1 -15.8 -35.7 9.3 21.7
Tax -6.1 -7.7 3.8 -13.9 -2.8 -6.5
Tax rate 17.3% 25.6% 24.0% n.m. 30.0% 30.0%
Discontinued Operations 0.0 0.0 0.0 0.0 0.0 0.0
Minorities -4.3 -5.6 -3.8 -2.1 -2.0 -2.0
Net Profit (reported) 24.8 16.8 -15.8 -51.7 4.5 13.2
Net Profit (adj.) 24.8 13.0 -22.7 -33.9 2.6 13.2
CASH FLOW (EURm) 12/2014 12/2015 12/2016 12/2017 12/2018e 12/2019e
Cash Flow from Operations before change in NWC 41.6 58.7 36.7 -24.3 10.7 28.7
Change in Net Working Capital -15.1 -29.3 -10.9 34.8 -2.3 -2.0
Cash Flow from Operations 26.5 29.4 25.8 10.5 8.4 26.8
Capex -29.0 -35.7 -20.0 -23.0 -9.0 -9.0
Net Financial Investments -9.4 -13.3 1.8 -11.3 26.0 -0.9
Free Cash Flow -11.9 -19.6 7.6 -23.8 25.4 16.9
Dividends -4.4 -5.9 -6.0 -6.0 0.0 0.0
Other (incl. Capital Increase & share buy backs) 0.0 0.0 0.0 0.0 0.0 0.0
Change in Net Debt -16.3 -25.5 1.6 -29.8 25.4 16.9
NOPLAT 19.1 19.6 -17.0 1.7 9.1 19.6
BALANCE SHEET & OTHER ITEMS (EURm) 12/2014 12/2015 12/2016 12/2017 12/2018e 12/2019e
Net Tangible Assets 68.7 77.3 88.4 72.3 38.0 36.0
Net Intangible Assets (incl.Goodwill) 52.4 82.9 83.7 67.5 68.0 69.0
Net Financial Assets & Other 28.0 30.2 22.6 14.9 20.2 21.6
Total Fixed Assets 149 190 195 155 126 127
Inventories 85.6 91.3 101 94.3 96.2 98.4
Trade receivables 80.3 111 115 91.9 93.7 94.7
Other current assets 20.5 20.5 17.8 85.8 97.4 98.0
Cash (-) -25.7 -32.4 -30.0 -25.3 -35.2 -47.7
Total Current Assets 212 255 264 297 322 339
Total Assets 361 446 459 452 449 465
Shareholders Equity 93.3 91.4 73.7 39.3 93.1 106
Minority 19.2 33.4 33.4 31.3 31.3 31.3
Total Equity 113 125 107 70.6 124 138
Long term interest bearing debt 96.4 152 167 172 114 115
Provisions 43.5 41.8 59.7 51.7 49.2 49.5
Other long term liabilities 9.0 15.1 8.1 6.0 6.1 6.2
Total Long Term Liabilities 149 209 235 230 169 171
Short term interest bearing debt 9.0 10.0 11.0 12.0 13.0 14.0
Trade payables 31.5 38.8 42.0 46.4 47.8 49.0
Other current liabilities 59.3 63.2 64.2 93.5 94.3 93.9
Total Current Liabilities 99.8 112 117 152 155 157
Total Liabilities and Shareholders' Equity 361 446 459 452 449 465
Net Capital Employed 245 311 323 287 271 275
Net Working Capital 134 164 175 140 142 144
GROWTH & MARGINS 12/2014 12/2015 12/2016 12/2017 12/2018e 12/2019e
Sales growth 10.0% 16.9% 1.4% 1.5% -4.7% 2.0%
EBITDA (adj.)* growth -14.2% 7.2% -84.2% 600.3% -46.1% 52.8%
EBITA (adj.)* growth -24.1% 2.4% n.m. n.m. 443.1% 114.7%
EBIT (adj)*growth -24.1% 2.4% n.m. n.m. 443.1% 114.7%
Schaltbau Holding AG
Page 10
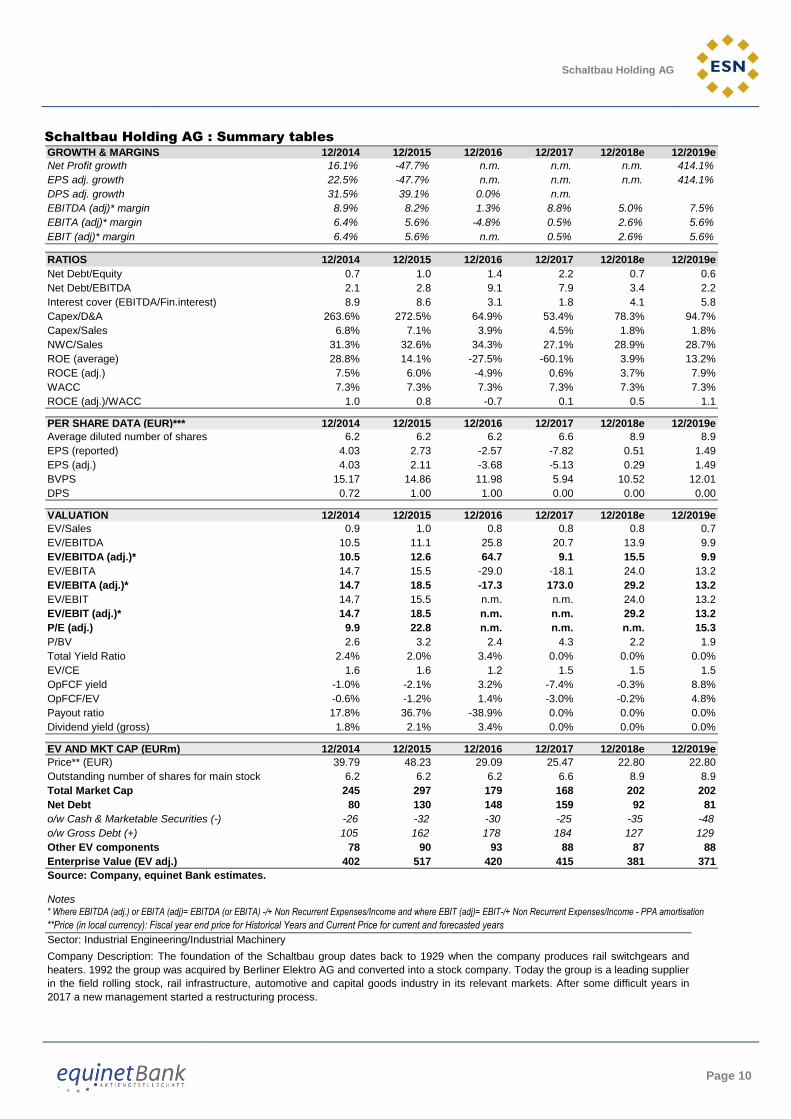
Schaltbau Holding AG : Summary tables
GROWTH & MARGINS 12/2014 12/2015 12/2016 12/2017 12/2018e 12/2019e
Net Profit growth 16.1% -47.7% n.m. n.m. n.m. 414.1%
EPS adj. growth 22.5% -47.7% n.m. n.m. n.m. 414.1%
DPS adj. growth 31.5% 39.1% 0.0% n.m.
EBITDA (adj)* margin 8.9% 8.2% 1.3% 8.8% 5.0% 7.5%
EBITA (adj)* margin 6.4% 5.6% -4.8% 0.5% 2.6% 5.6%
EBIT (adj)* margin 6.4% 5.6% n.m. 0.5% 2.6% 5.6%
RATIOS 12/2014 12/2015 12/2016 12/2017 12/2018e 12/2019e
Net Debt/Equity 0.7 1.0 1.4 2.2 0.7 0.6
Net Debt/EBITDA 2.1 2.8 9.1 7.9 3.4 2.2
Interest cover (EBITDA/Fin.interest) 8.9 8.6 3.1 1.8 4.1 5.8
Capex/D&A 263.6% 272.5% 64.9% 53.4% 78.3% 94.7%
Capex/Sales 6.8% 7.1% 3.9% 4.5% 1.8% 1.8%
NWC/Sales 31.3% 32.6% 34.3% 27.1% 28.9% 28.7%
ROE (average) 28.8% 14.1% -27.5% -60.1% 3.9% 13.2%
ROCE (adj.) 7.5% 6.0% -4.9% 0.6% 3.7% 7.9%
WACC 7.3% 7.3% 7.3% 7.3% 7.3% 7.3%
ROCE (adj.)/WACC 1.0 0.8 -0.7 0.1 0.5 1.1
PER SHARE DATA (EUR)*** 12/2014 12/2015 12/2016 12/2017 12/2018e 12/2019e
Average diluted number of shares 6.2 6.2 6.2 6.6 8.9 8.9
EPS (reported) 4.03 2.73 -2.57 -7.82 0.51 1.49
EPS (adj.) 4.03 2.11 -3.68 -5.13 0.29 1.49
BVPS 15.17 14.86 11.98 5.94 10.52 12.01
DPS 0.72 1.00 1.00 0.00 0.00 0.00
VALUATION 12/2014 12/2015 12/2016 12/2017 12/2018e 12/2019e
EV/Sales 0.9 1.0 0.8 0.8 0.8 0.7
EV/EBITDA 10.5 11.1 25.8 20.7 13.9 9.9
EV/EBITDA (adj.)* 10.5 12.6 64.7 9.1 15.5 9.9
EV/EBITA 14.7 15.5 -29.0 -18.1 24.0 13.2
EV/EBITA (adj.)* 14.7 18.5 -17.3 173.0 29.2 13.2
EV/EBIT 14.7 15.5 n.m. n.m. 24.0 13.2
EV/EBIT (adj.)* 14.7 18.5 n.m. n.m. 29.2 13.2
P/E (adj.) 9.9 22.8 n.m. n.m. n.m. 15.3
P/BV 2.6 3.2 2.4 4.3 2.2 1.9
Total Yield Ratio 2.4% 2.0% 3.4% 0.0% 0.0% 0.0%
EV/CE 1.6 1.6 1.2 1.5 1.5 1.5
OpFCF yield -1.0% -2.1% 3.2% -7.4% -0.3% 8.8%
OpFCF/EV -0.6% -1.2% 1.4% -3.0% -0.2% 4.8%
Payout ratio 17.8% 36.7% -38.9% 0.0% 0.0% 0.0%
Dividend yield (gross) 1.8% 2.1% 3.4% 0.0% 0.0% 0.0%
EV AND MKT CAP (EURm) 12/2014 12/2015 12/2016 12/2017 12/2018e 12/2019e
Price** (EUR) 39.79 48.23 29.09 25.47 22.80 22.80
Outstanding number of shares for main stock 6.2 6.2 6.2 6.6 8.9 8.9
Total Market Cap 245 297 179 168 202 202
Net Debt 80 130 148 159 92 81
o/w Cash & Marketable Securities (-) -26 -32 -30 -25 -35 -48
o/w Gross Debt (+) 105 162 178 184 127 129
Other EV components 78 90 93 88 87 88
Enterprise Value (EV adj.) 402 517 420 415 381 371
Source: Company, equinet Bank estimates.
Notes* Where EBITDA (adj.) or EBITA (adj)= EBITDA (or EBITA) -/+ Non Recurrent Expenses/Income and where EBIT (adj)= EBIT-/+ Non Recurrent Expenses/Income - PPA amortisation
**Price (in local currency): Fiscal year end price for Historical Years and Current Price for current and forecasted years
Sector: Industrial Engineering/Industrial Machinery
Company Description: The foundation of the Schaltbau group dates back to 1929 when the company produces rail switchgears and
heaters. 1992 the group was acquired by Berliner Elektro AG and converted into a stock company. Today the group is a leading supplier
in the field rolling stock, rail infrastructure, automotive and capital goods industry in its relevant markets. After some difficult years in
2017 a new management started a restructuring process.

Schaltbau Holding AG
Page 11
Recommendation and Disclosures
Coverage Analyst Target Rating Disc. Coverage Analyst Target Rating Disc.1&1 DRILLISCH AG Sen 66.00 Buy Logwin Mildner 165.00 Accumulat e 2/ 3
2G Energy Rüzgar 23.50 Accumulat e 2/ 3/ 5 Manz AG Rüzgar 37.00 Neut ral 2/ 3
Aareal Bank Häßler 41.00 Buy MAX Aut omat ion SE Becker 6.70 Buy 2/ 3
adidas Josef son 228.00 Accumulat e Merck Berzhanin 112.00 Buy
Adler Modemaerkt e Josef son 6.35 Buy 7 Merkur Bank Häßler 10.00 Buy 2/ 7
ADLER Real Est at e Mayer 20.00 Buy Met ro AG Bruns 17.00 Buy
Aixt ron Sen 14.00 Buy 2/ 3 MLP Häßler 7.50 Buy 2/ 3
Allianz Häßler 220.00 Buy MTU Aero Engines Rüzgar 148.00 Reduce 2
Axel Springer Josef son 67.00 Accumulat e Munich Re Häßler 210.00 Accumulat e
Bayer Berzhanin 96.00 Buy Nemet schek SE Mildner 47.00 Reduce 5
Baywa Bruns 33.00 Buy 2/ 7 Norma Group Schuldt 54.00 Neut ral
BB Biot ech Berzhanin 73.00 Buy 7 OHB SE Rüzgar 40.00 Buy 7
Biot est Berzhanin 24.10 Neut ral 2/ 3 OVB Holding AG Häßler 20.00 Buy 2/ 5/ 7
BMW Schuldt 91.00 Buy Pat r izia Mayer 20.00 Accumulat e
Brennt ag Hinkel 59.80 Buy 2 Pf eif f er Vacuum Sen 162.00 Buy 5
Ceconomy AG Bruns 5.00 Neut ral Procredit Holding Häßler 15.00 Buy 2/ 3/ 5
comdirect Häßler 13.50 Buy 7 PSI SOFTWARE AG Mildner 20.00 Buy 2/ 3
Commerzbank Häßler 9.20 Neut ral Puma Josef son 565.00 Buy
Cont inent al Schuldt 230.00 Buy PWO Schuldt 50.00 Buy 2/ 3
CORESTATE Capit al Holding S.A. Mayer 66.00 Buy 2/ 5 Rheinmet all Rüzgar 103.00 Neut ral
CTS Event im Heilmann 37.50 Reduce RIB Sof t ware Mildner 25.00 Buy 2/ 3
Daimler AG Schuldt 71.00 Buy RTL Group Josef son 72.00 Accumulat e
Daldrup & Soehne Becker 13.20 Buy 2/ 3/ 5 S&T AG Sen 27.00 Buy 2/ 3
Demire Mayer 4.80 Accumulat e 2/ 5 SAF-Holland Schuldt 17.00 Neut ral
Deut sche Bank Häßler 14.00 Buy Schaef f ler Tanzer 14.30 Buy
Deut sche EuroShop Mayer 30.00 Neut ral Schalt bau Holding AG Becker 32.90 Buy 2/ 7
Deut sche Pf andbrief bank Häßler 14.50 Accumulat e SCOUT24 Heilmann 44.00 Neut ral 2
Deut sche Telekom Sen 13.30 Neut ral Siegf r ied Holding AG Berzhanin 399.00 Neut ral 7
Duerr August in 43.00 Accumulat e Siemens Healt hineers AG Rüzgar 39.00 Neut ral 2
DWS Häßler 34.00 Buy SLM Solut ions Sen 15.00 Sell
Elr ingKlinger Schuldt 7.00 Sell SMT Scharf AG Rüzgar 18.00 Neut ral 2/ 3
elumeo SE Josef son 10.90 Accumulat e Sof t ware AG Mildner 30.00 Sell
Epigenomics AG Berzhanin 3.70 Buy 2/ 3 St abilus Tanzer 91.00 Buy
Euromicron AG Becker 11.40 Buy 2/ 3/ 5 Suedzucker Bruns 11.70 Reduce
Evonik Hinkel 41.00 Buy Suess MicroTec Sen 13.80 Accumulat e
Eyemaxx Real Est at e Mayer 18.00 Buy 2/ 5/ 7 Surt eco Group Mildner 26.50 Buy 2/ 3
Ferrat um Häßler 23.00 Buy Symrise AG Hinkel 67.00 Neut ral
Fielmann Heilmann 55.00 Neut ral Syzygy AG Heilmann 11.50 Accumulat e 2/ 3
First Sensor AG Becker 27.40 Buy 7 TAKKT AG Bruns 18.50 Neut ral 2
Freenet Sen 36.00 Buy 2 Talanx Group Häßler 39.00 Buy
Fuchs Pet rolub Hinkel 48.00 Neut ral Technot rans Becker 43.00 Accumulat e 2/ 3
Gea Group August in 33.00 Neut ral TELE COLUMBUS Sen 4.80 Buy
Gerresheimer AG Rüzgar 69.00 Neut ral Telef onica Deut schland Sen 3.40 Sell
Gerry Weber Josef son 3.80 Reduce Unit ed Int ernet Sen 63.00 Buy
Gesco Becker 35.60 Buy 2/ 3 Vapiano Bruns 20.00 Buy 2/ 7
GFT Technologies Mildner 15.50 Buy 2/ 3 va-Q-t ec Sen 12.00 Buy 2/ 3
Gigaset Sen 0.85 Accumulat e 2/ 3 Viscom Rüzgar 28.00 Buy 2/ 3
Grenke Häßler 90.00 Neut ral Volkswagen Schuldt 154.00 Neut ral
Hannover Re Häßler 110.00 Neut ral Wacker Neuson SE Becker 24.10 Neut ral
Heidelberg Pharma Berzhanin 3.50 Accumulat e 2/ 3 windeln.de Josef son 3.10 Buy 2
Heidelberger Druck August in 3.60 Buy XING SE Heilmann 305.00 Accumulat e
HELLA GmbH & Co. KGaA Tanzer 51.00 Accumulat e Zalando Josef son 44.50 Neut ral
Hornbach Holding Bruns 89.00 Buy
Hugo Boss Josef son 80.00 Buy
Hypoport AG Häßler 190.00 Neut ral 2/ 7
INDUS Holding AG Becker 55.70 Neut ral
Int ershop Communicat ions AG Mildner 1.85 Accumulat e 2/ 7
K+S AG Hinkel 24.00 Buy
Koenig & Bauer August in 73.00 Accumulat e
Krones AG August in 118.00 Accumulat e
KWS SAAT Hinkel 348.00 Buy
Lanxess Hinkel 83.00 Buy
LEG Immobilien AG Mayer 104.00 Accumulat e
Leoni Schuldt 41.00 Neut ral
Linde Hinkel 176.00 Neut ral
* = Coverage suspended Source: equinet Recommendat ions
Schaltbau Holding AG
Page 12
Notice according to § 34 b (German) Securities Trading Act (“Wertpapierhandelsgesetz”) This document is issued by Equinet Bank AG (“Equinet Bank”). It has been prepared by its authors independently of the Company, and none of Equinet Bank, the Company or its shareholders has independently verified any of the information given in this document. Equinet Bank possesses relations to the covered companies as detailed in the table on the previous page. Additional information and disclosures will be made available upon request and/or can be looked up on our website http://www.Equinet Bank-ag.de 1 - Equinet Bank and/or its affiliate(s) hold(s) more than 5% of the share capital of this company calculated under computational methods required by German law. 2 - Equinet Bank acts as a designated sponsor for this company, including the provision of bid and ask offers. Therefore, we regularly possess shares of the company in our proprietary trading books. Equinet Bank receives a commission from the company for the provision of the designated sponsor services. 3 – The designated sponsor services include a contractually agreed provision of research services. 4 – Within the last twelve months, Equinet Bank was involved as a lead or co-lead manager in the public offering of securities which are/whose issuer is the subject of this report. 5 – Within the last twelve months, Equinet Bank and/or its affiliate(s) provided investment banking- and/or other consultancy services for this company and/or it’s shareholders. 6 - Equinet Bank and/or its affiliate(s) has/have other substantial financial interests in relation to this issuer. 7 – Equinet Bank has entered into an agreement with this company about the preparation of research reports and – in return - receives a compensation. Companies of the Equinet Bank group and/or its directors, officers and employees or clients may take positions in, and may make purchases and/or sales as principal or agent in the securities or related financial instruments discussed in our reports. The Equinet Bank group may provide investment banking and other services to and/or serve as directors of the companies referred to in our reports. In compliance with Para 5 Sec. 4 of the Ordinance on the Analysis of Financial Instruments (FinAnV) Equinet Bank has realized additional internal and organizational measures, such as specific research guidelines, to prevent or manage conflicts of interest. Neither the company nor its employees are allowed to receive donations from third parties with a special interest in the content of the analysis. The salary of the research analysts of Equinet Bank AG does not depend on the investment banking transactions of the company. Nevertheless, this does not rule out the payment of a bonus which depends on the overall financial performance of the bank. Particular care is taken that the individual performance of each research analyst of Equinet Bank AG is not being assessed by a manager of another business division with similar or same interests. To assure a highest degree of transparency Equinet Bank AG regularly provides - on a quarterly basis – a summary according to Para 5 Sec. 4 No. 3 of the Ordinance on the Analysis of Financial Instruments (FinAnV). It informs about the overall analysts recommendations and sets them in a relationship to those companies, for which Equinet Bank provided investment banking services within the last twelve months. This summary is published via our website http://www.Equinet Bank-ag.de. Furthermore, we refer to our conflict of interest policy as well as the German Securities Trading Act (WpHG) and the Ordinance on the Analysis of Financial Instruments (FinAnV) provided in the download area of our website http://www.Equinet Bank-ag.de.
Remarks
Recommendation System Buy - The stock is expected to generate a total return of over 20% during the next 12 months time horizon. Accumulate - The stock is expected to generate a total return of 10% to 20% during the next 12 months time horizon. Hold - The stock is expected to generate a total return of 0% to 10% during the next 12 months time horizon Reduce - The stock is expected to generate a total return of 0 to -10% during the next 12 months time horizon Sell - The stock is expected to generate a total return below -10% during the next 12 months time horizon Basis of Valuation
Equinet Bank uses for valuation purposes primarily DCF-Valuations and Sum-Of-The-Parts-Valuations as well as peer group comparisons. Share prices
Share prices in this analysis are the German closing prices of the last trading day before the publication. Sources Equinet Bank has made any effort to carefully research all information contained in the analysis. The information on which the analysis is based has been obtained from sources which we believe to be reliable such as, for example, Reuters, Bloomberg and the relevant press as well as the company which is the subject of the analysis. Only that part of the research note is made available to the issuer, who is the subject of the analysis, which is necessary to properly reconcile with the facts. Should this result in considerable changes a reference is made in the research note. Actualizations Opinions expressed in this analysis are our current opinions as of the issuing date indicated on this document. We do not commit ourselves in advance to whether and in which intervals updates are made.

Schaltbau Holding AG
Page 13
DISCLAIMER
THE PREPARATION OF THIS DOCUMENT IS SUBJECT TO REGULATION BY GERMAN LAW. THIS DOCUMENT IS BEING SUPPLIED TO YOU SOLELY IN YOUR CAPACITY AS A PROFESSIONAL INSTITUTIONAL INVESTOR FOR YOUR INFORMATION AND MAY NOT BE REPRODUCED OR PASSED ON, DIRECTLY OR INDIRECTLY, TO ANY OTHER PERSON OR PUBLISHED, IN WHOLE OR IN PART, FOR ANY PURPOSE. NEITHER THIS DOCUMENT NOR ANY COPY OF IT MAY BE TAKEN OR TRANSMITTED INTO AUSTRALIA, CANADA OR JAPAN OR DISTRIBUTED, DIRECTLY OR INDIRECTLY, IN AUSTRALIA, CANADA OR JAPAN OR TO ANY RESIDENT THEREOF. THE DELIVERY OF THIS RESEARCH REPORT TO U.S. PERSONS IN THE UNITED STATES OF AMERICA IS MADE BY AND UNDER THE RESPONSIBILITY OF GSN NA, INC. (REGISTERED WITH THE SEC). THIS RESEARCH REPORT IS ONLY INTENDED FOR PERSONS WHO QUALIFY AS MAJOR U.S. INSTITUTIONAL INVESTORS, AS DEFINED IN SECURITIES EXCHANGE ACT RULE 15A-6, AND DEAL WITH GSN NA, INC. HOWEVER, THE DELIVERY OF THIS RESEARCH REPORT OR SUMMARY TO ANY U.S. PERSON SHALL NOT BE DEEMED A RECOMMENDATION OF GSN NA, INC. TO EFFECT ANY TRANSACTIONS IN THE SECURITIES DISCUSSED HEREIN OR AN ENDORSEMENT OF ANYOPINION EXPRESSED HEREIN. GSN NA, INC. MAY FURNISH UPON REQUEST ALL INVESTMENT INFORMATION AVAILABLE TO IT SUPPORTING ANY RECOMMENDATIONS MADE IN THIS RESEARCH REPORT. ALL TRADES WITH U.S. RECIPIENTS OF THIS RESEARCH SHALL BE EXECUTED THROUGH GSN NA, INC. THIS DOCUMENT IS FOR DISTRIBUTION IN THE U.K. ONLY TO PERSONS WHO HAVE PROFESSSIONAL EXPERIENCE IN MATTERS RELATING TO INVESTMENTS AND FALL WITHIN ARTICLE 19(5) OF THE FINANCIAL SERVICES AND MARKETS ACT 2000 (FINANCIAL PROMOTION) ORDER 2005 (THE “ORDER”) OR (ii) ARE PERSONS FALLING WITHIN ARTICLE 49(2)(A) TO (D) OF THE ORDER, NAMELY HIGH NET WORTH COMPANIES, UNINCORPORATED ASSOCIATIONS ETC (ALL SUCH PERSONS TOGETHER BEING REFERRED TO AS “RELEVANT PERSONS”). THIS DOCUMENT MUST NOT BE ACTED ON OR RELIED UPON BY PERSONS WHO ARE NOT RELEVANT PERSONS. ANY INVESTMENT OR INVESTMENT ACTIVITY TO WHICH THIS DOCUMENT RELATES IS AVAILABLE ONLY TO RELEVANT PERSONS AND WILL BE ENGAGED IN ONLY WITH RELEVANT PERSONS. THE DISTRIBUTION OF THIS DOCUMENT IN OTHER JURISDICTIONS OR TO RESIDENTS OF OTHER JURISDICTIONS MAY ALSO BE RESTRICTED BY LAW, AND PERSONS INTO WHOSE POSSESSION THIS DOCUMENT COMES SHOULD INFORM THEMSELVES ABOUT, AND OBSERVE, ANY SUCH RESTRICTIONS. BY ACCEPTING THIS REPORT YOU AGREE TO BE BOUND BY THE FOREGOING INSTRUCTIONS. YOU SHALL INDEMNIFY EQUINET BANK AGAINST ANY DAMAGES, CLAIMS, LOSSES, AND DETRIMENTS RESULTING FROM OR IN CONNECTION WITH THE UNAUTHORIZED USE OF THIS DOCUMENT. This report is for informational purposes only and has no regard to the specific investment objectives, financial situation or particular needs of any specific recipient. This publication is intended to provide information to assist institutional investors in making their own investment decisions, not to provide investment advice to any specific investor. Therefore, investments discussed and recommendations made herein may not be suitable for all investors: readers must exercise their own inde-pendent judgment as to the suitability of such investments and recommendations in the light of their own investment objectives, experience, taxation status and financial position. The information herein is believed by Equinet Bank to be reliable and has been obtained from sources believed to be reliable, but Equinet Bank makes no representation as to the accuracy or completeness of such information. The information given in this report is subject to change without notice; it may be incomplete or condensed and it may not contain all material information concerning the Company. Opinions expressed herein may differ or be contrary to opinions expressed by other business areas of the Equinet Bank group as a result of using different assumptions and criteria. Equinet Bank is under no obligation to update or keep the information current. Equinet Bank provides data concerning the future development of securities in the context of its usual research activity. However, if a financial instrument is denominated in a currency other than an investor’s currency, a change in exchange rates may adversely affect the price or value of, or the income derived from, the financial instrument, and such investor effectively assumes currency risk. In addition, income from an investment may fluctuate and the price or value of financial instruments de-scribed in this report, either directly or indirectly, may rise or fall. Furthermore, past performance is not necessarily indicative of future results. Neither the author nor Equinet Bank accepts any liability whatsoever for any loss howsoever arising from any use of this publication or its contents or otherwise arising in connection herewith, except as provided for under applicable regulations. Equinet Bank shall only be liable for any damages intentionally caused or which result from any gross negligence of Equinet Bank. Further Equinet Bank shall be liable for the breach of a material obligation of Equinet Bank, however, limited to the amount of the typical foreseeable which shall in no event exceed the amount of EUR 10,000. German law shall be applicable and court of jurisdiction for all disputes shall be Frankfurt/Main (Germany).
Competent Supervisory Authority: Bundesanstalt für Finanzdienstleistungsaufsicht -BaFin- (Federal Financial Supervisory Authority) Graurheindorfer Straße 108, 53117 Bonn and
Marie-Curie-Str. 24-28, 60439 Frankfurt am Main
Schaltbau Holding AG
Page 14
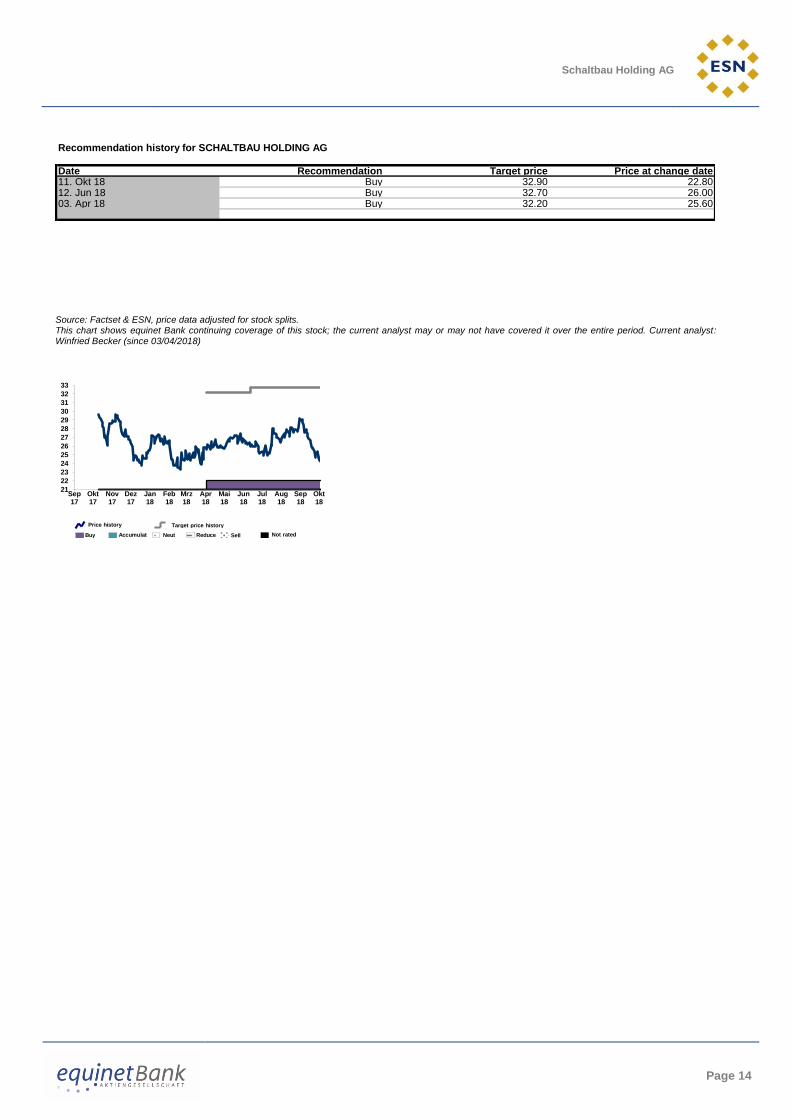
Source: Factset & ESN, price data adjusted for stock splits. This chart shows equinet Bank continuing coverage of this stock; the current analyst may or may not have covered it over the entire period. Current analyst: Winfried Becker (since 03/04/2018)
Recommendation history for SCHALTBAU HOLDING AG
Date Recommendation Target price Price at change date11. Okt 18 Buy 32.90 22.8012. Jun 18 Buy 32.70 26.0003. Apr 18 Buy 32.20 25.60
21
22
23
24
25
26
27
28
29
30
31
32
33
Sep17
Okt17
Nov17
Dez17
Jan18
Feb18
Mrz18
Apr18
Mai18
Jun18
Jul18
Aug18
Sep18
Okt18
Buy Accumulat Neut Reduce Sell Not rated
Price history Target price history
Schaltbau Holding AG
Page 15
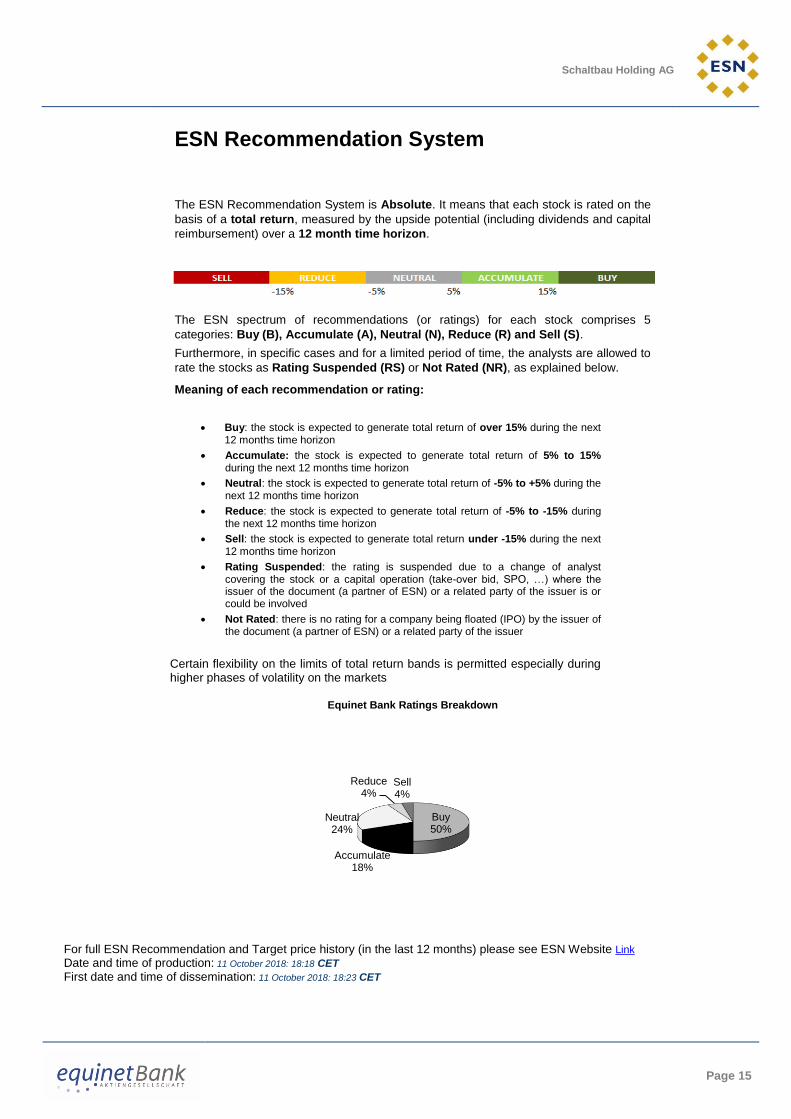
ESN Recommendation System
The ESN Recommendation System is Absolute. It means that each stock is rated on the
basis of a total return, measured by the upside potential (including dividends and capital
reimbursement) over a 12 month time horizon.
The ESN spectrum of recommendations (or ratings) for each stock comprises 5
categories: Buy (B), Accumulate (A), Neutral (N), Reduce (R) and Sell (S).
Furthermore, in specific cases and for a limited period of time, the analysts are allowed to
rate the stocks as Rating Suspended (RS) or Not Rated (NR), as explained below.
Meaning of each recommendation or rating:
Buy: the stock is expected to generate total return of over 15% during the next 12 months time horizon
Accumulate: the stock is expected to generate total return of 5% to 15% during the next 12 months time horizon
Neutral: the stock is expected to generate total return of -5% to +5% during the next 12 months time horizon
Reduce: the stock is expected to generate total return of -5% to -15% during the next 12 months time horizon
Sell: the stock is expected to generate total return under -15% during the next 12 months time horizon
Rating Suspended: the rating is suspended due to a change of analyst covering the stock or a capital operation (take-over bid, SPO, …) where the issuer of the document (a partner of ESN) or a related party of the issuer is or could be involved
Not Rated: there is no rating for a company being floated (IPO) by the issuer of the document (a partner of ESN) or a related party of the issuer
Certain flexibility on the limits of total return bands is permitted especially during higher phases of volatility on the markets
Equinet Bank Ratings Breakdown
For full ESN Recommendation and Target price history (in the last 12 months) please see ESN Website Link
Date and time of production: 11 October 2018: 18:18 CET First date and time of dissemination: 11 October 2018: 18:23 CET
Buy50%
Accumulate18%
Neutral24%
Reduce4%
Sell4%

Schaltbau Holding AG
Page 16
Disclaimer: These reports have been prepared and issued by the Members of European Securities Network LLP (‘ESN’). ESN, its Members and their affiliates (and any director, officer or employee thereof), are neither liable for the proper and complete transmission of these reports nor for any delay in their receipt. Any unauthorised use, disclosure, copying, distribution, or taking of any action in reliance on these reports is strictly prohibited. The views and expressions in the reports are expressions of opinion and are given in good faith, but are subject to change without notice. These reports may not be reproduced in whole or in part or passed to third parties without permission. The information herein was obtained from various sources. ESN, its Members and their affiliates (and any director, officer or employee thereof) do not guarantee their accuracy or completeness, and neither ESN, nor its Members, nor its Members’ affiliates (nor any director, officer or employee thereof) shall be liable in respect of any errors or omissions or for any losses or consequential losses arising from such errors or omissions. Neither the information contained in these reports nor any opinion expressed constitutes an offer, or an invitation to make an offer, to buy or sell any securities or any options, futures or other derivatives related to such securities (‘related investments’). These reports are prepared for the clients of the Members of ESN only. They do not have regard to the specific investment objectives, financial situation and the particular needs of any specific person who may receive any of these reports. Investors should seek financial advice regarding the appropriateness of investing in any securities or investment strategies discussed or recommended in these reports and should understand that statements regarding future prospects may not be realised. Investors should note that income from such securities, if any, may fluctuate and that each security’s price or value may rise or fall. Accordingly, investors may receive back less than originally invested. Past performance is not necessarily a guide to future performance. Foreign currency rates of exchange may adversely affect the value, price or income of any security or related investment mentioned in these reports. In addition, investors in securities such as ADRs, whose value are influenced by the currency of the underlying security, effectively assume currency risk. ESN, its Members and their affiliates may submit a pre-publication draft (without mentioning neither the recommendation nor the target price/fair value) of its reports for review to the Investor Relations Department of the issuer forming the subject of the report, solely for the purpose of correcting any inadvertent material inaccuracies. Like all members employees, analysts receive compensation that is impacted by overall firm profitability For further details about the analyst certification, the specific risks of the company and about the valuation methods used to determine the price targets included in this report/note, please refer to the specific disclaimer pages prepared by the ESN Members. In the case of a short note please refer to the latest relevant published research on single stock or contact the analyst named on the front of the report/note for detailed information on the valuation methods, earning estimates and risks. A full description of all the organisational and administrative measures taken by the Members of ESN to manage interest and conflicts of interest are available on the website of the Members or in the local disclaimer of the Members or contacting directly the Members. Research is available through the ESN Members sales representative. ESN will provide periodic updates on companies or sectors based on company-specific developments or announcements, market conditions or any other publicly available information. Unless agreed in writing with an ESN Member, this research is intended solely for internal use by the recipient. Neither this document nor any copy of it may be taken or transmitted into Australia, Canada or Japan or distributed, directly or indirectly, in Australia, Canada or Japan or to any resident thereof. This document is for distribution in the U.K. Only to persons who have professional experience in matters relating to investments and fall within article 19(5) of the financial services and markets act 2000 (financial promotion) order 2005 (the “order”) or (ii) are persons falling within article 49(2)(a) to (d) of the order, namely high net worth companies, unincorporated associations etc. (all such persons together being referred to as “relevant persons”). This document must not be acted on or relied upon by persons who are not relevant persons. Any investment or investment activity to which this document relates is available only to relevant persons and will be engaged in only with relevant persons. The distribution of this document in other jurisdictions or to residents of other jurisdictions may also be restricted by law, and persons into whose possession this document comes should inform themselves about, and observe, any such restrictions. By accepting this report you agree to be bound by the foregoing instructions. You shall indemnify ESN, its Members and their affiliates (and any director, officer or employee thereof) against any damages, claims, losses, and detriments resulting from or in connection with the unauthorized use of this document. For disclosure upon “conflicts of interest” on the companies under coverage by all the ESN Members, on the “interests” and “conflicts” of the analysts and on each “company recommendation history”, please visit the ESN website (http://www.esnpartnership.eu/research_and_database_access/insite), or refer to the local disclaimer of the Members, or contact directly the Members:
www.bancaakros.it regulated by the CONSOB - Commissione Nazionale per le Società e la Borsa
www.caixabi.pt regulated by the CMVM - Comissão do Mercado de Valores Mobiliários
www.cmcicms.com regulated by the AMF - Autorité des marchés financiers
www.equinet-ag.de regulated by the BaFin - Bundesanstalt für Finanzdienstleistungsaufsicht
www.ibg.gr regulated by the HCMC - Hellenic Capital Market Commission
www.nibc.com regulated by the AFM - Autoriteit Financiële Markten
www.op.fi regulated by the Financial Supervision Authority
www.valores.gvcgaesco.es regulated by CNMV - Comisión Nacional del Mercado de Valores
Members of ESN (European Securities Network LLP)
Banca Akros S.p.A. Viale Eginardo, 29 20149 MILANO Italy Phone: +39 02 43 444 389
Fax: +39 02 43 444 302
GVC Gaesco Beka, SV, SA C/ Marques de Villamagna 3 28001 Madrid Spain
Phone: +34 91 436 7813
Caixa-Banco de Investimento Avenida João XXI, 63 1000-300 Lisboa Portugal Phone: +351 21 313 73 00 Fax: +351 21 389 68 98
CM - CIC Market Solutions
6, avenue de Provence 75441 Paris Cedex 09 France
Phone: +33 1 53 48 81 93
equinet Bank AG Gräfstraße 97 60487 Frankfurt am Main Germany Phone:+49 69 – 58997 – 212 Fax:+49 69 – 58997 – 299
OP Corporate Bank plc P.O.Box 308 Teollisuuskatu 1, 00013 Helsinki Finland Phone: +358 10 252 011 Fax: +358 10 252 2703
NIBC Bank N.V. Gustav Mahlerlaan 348 P.O.Box 235 1082 ME Amsterdam The Netherlands Phone: +31 20 550 8500 Fax: +31 20 626 8064
Investment Bank of Greece 32 Aigialeias Str & Paradissou, 151 25 Maroussi, Greece
Phone: +30 210 81 73 383