Embed Size (px)
Citation preview

Produced by: For important disclosure information, please refer to the disclaimer page of this report.
All ESN research is available on Bloomberg, “ESNR”, Thomson-Reuters, S&P Capital IQ, FactSet
Distributed by the Members of ESN (see last page of this report)
Full Company Report Reason: Initiation of coverage 3 April 2018
Traffic lights are again green
Schaltbau is currently going through an existential restructuring process of
which the start towards recovery has become feasible. In terms of solvency,
the short-term liquidity squeeze is solved while long-term the financial debt
will be reduced, with practically no near term maturities for the group. Rail
markets are moderately growing and Schaltbau will participate based on its
highly diversified product portfolio and its leading market position in a variety
of segments. We are confident with regard to the successful turnaround and
initiate our coverage for the Schaltbau Holding shares with a Buy rating and a
target price of EUR 32.20 per share.
Schaltbau is remediable: After an in-depth analysis an external restructuring
consultant confirmed that the group is remediable. A detailed plan has been
created and first steps are already set in place.
Long-term concentration on Mobile Transportation Technology (MTT)?: As
carefully indicated by the management, over long-term there could be an option
to concentrate purely on MTT and sell the smaller Stationary Transport
Technology (STT) division. Due to its excellent margin level, we hope that
Components (COM) will remain a core activity.
Successful capital increase: Following the capital increase in May 2017 with a
cash inflow of EUR 15.6m another increase was successfully placed in
February 2018 in the amount of net EUR 46.1m. The full number of 2.24m new
shares was placed at a price of EUR 22.00 what is a success in our view. The
equity ratio (equinet) 2018e is expected to reach ~22% while the book value per
share reached more than EU 12.00 per share.
Cash inflow through sale of Pintsch Bubenzer: At the end of February the
sale of Pintsch Bubenzer was closed and resulted in the expected cash inflow of
EUR 30.3m. With a total fresh liquidity of EUR 92m, the group was able to pay
back financial debt of EUR 32.5m end of February and is still able to continue
reducing financial debt, or maintaining a sizeable cash cushion.
Recovery of profitability: Each of Schaltbau’s three divisions have a detailed
plan for improving the profitability. MTT is expected to reach 2019e to an EBIT-
margin of 5.5% (‘17e: -9.3%), while STT will swing to 3.4% (‘17e: -7.7%). The
COM division reported sound EBIT-margins of up to 17% also in the “crisis
years”. Long-term EBIT-margins for the group of more than 8% are possible
while in our DCF-model we use a sustainable margin of 7.0% (all equinet).
Key risks comprise e.g.: 1) The expected growth of the global railway markets
will not meet Schaltbau’s expectations with regard to their own growth targets.
2) The company will not meet all milestones fixed in the general restructuring
plan, e.g. profitability improvement or working capital reduction targets. 3)
Reduction of the group’s financial debt might take longer than expected. 4)
General inherent risks of the project business could lead to cost overruns or
other burdening factors. 5) Further impairment risks in the group’s company
portfolio.
Schaltbau Holding AG
Germany | Industrial Engineering Investment Research
Analyst(s)
Winfried Becker
+49 69 58997-416
Buy
25.80closing price as of 02/04/2018
32.20
24.8%Upside/Downside Potential
from
Target price: EUR
Share price: EUR
Reuters/Bloomberg SLTG.DE/SLT GY
Market capitalisation (EURm) 228
Current N° of shares (m) 9
Free float 32%
Daily avg. no. trad. sh. 12 mth
Daily avg. trad. vol. 12 mth (m)
Price high/low 12 months 23.30 / 38.40
Abs Perfs 1/3/12 mths (%) 5.74/-0.07/-17.38
Key financials (EUR) 12/16 12/17e 12/18e
Sales (m) 509 518 486
EBITDA (m) 16 16 26
EBITDA margin 3.2% 3.1% 5.5%
EBIT (m) (15) (22) 15
EBIT margin nm nm 3.1%
Net Profit (adj.)(m) (16) (24) 4
ROCE -2.9% 0.6% 3.7%
Net debt/(cash) (m) 148 156 86
Net Debt Equity 1.4 1.9 0.6
Net Debt/EBITDA 9.1 9.9 3.2
Int. cover(EBITDA/Fin.int) 3.1 2.0 3.7
EV/Sales 0.8 0.8 0.8
EV/EBITDA 25.6 26.1 15.2
EV/EBITDA (adj.) 25.6 10.1 15.2
EV/EBIT nm nm 26.8
P/E (adj.) nm nm nm
P/BV 2.4 3.5 2.3
OpFCF yield 3.2% -13.9% 0.2%
Dividend yield 0.0% 0.0% 0.0%
EPS (adj.) (2.57) (3.59) 0.41
BVPS 11.98 7.27 11.41
DPS 0.00 0.00 0.00
Shareholders
"Acting in concert"-group (Zimmermann, Luxempart,Monolith,
Coleano, Elrena) 29%; Active Ownership 20%;
22
24
26
28
30
32
34
36
38
40
Mrz 17 Apr 17 Mai 17 Jun 17 Jul 17 Aug 17 Sep 17 Okt 17 Nov 17 Dez 17 Jan 18 Feb 18 Mrz 18
vvdsvdvsdy
SCHALTBAU HOLDING AG SDAX (Rebased)
Source: Factset

Schaltbau Holding AG
Page 2
Content
Schaltbau Holding at a glance 3
Investment case in charts 4
Investment case and SWOT analysis 5
Valuation 6
DCF valuation 6
Peer group analysis 7
Company profile 10
Company overview 10
Schaltbau's company strategy for recovery 11
Mobile Transportation Technology (MTT) 12
Stationary Transportation Technology (STT) 13
Components (COM) 14
Market environment 16
Financials 19
Earnings analysis 19
Financial analysis 21
Events Calendar 23
Schaltbau Holding AG
Page 3
Exhibit 1: Schaltbau Holding at a glance
Source: Schaltbau Holding, equinet Research
Schaltbau Holding AG
Page 4
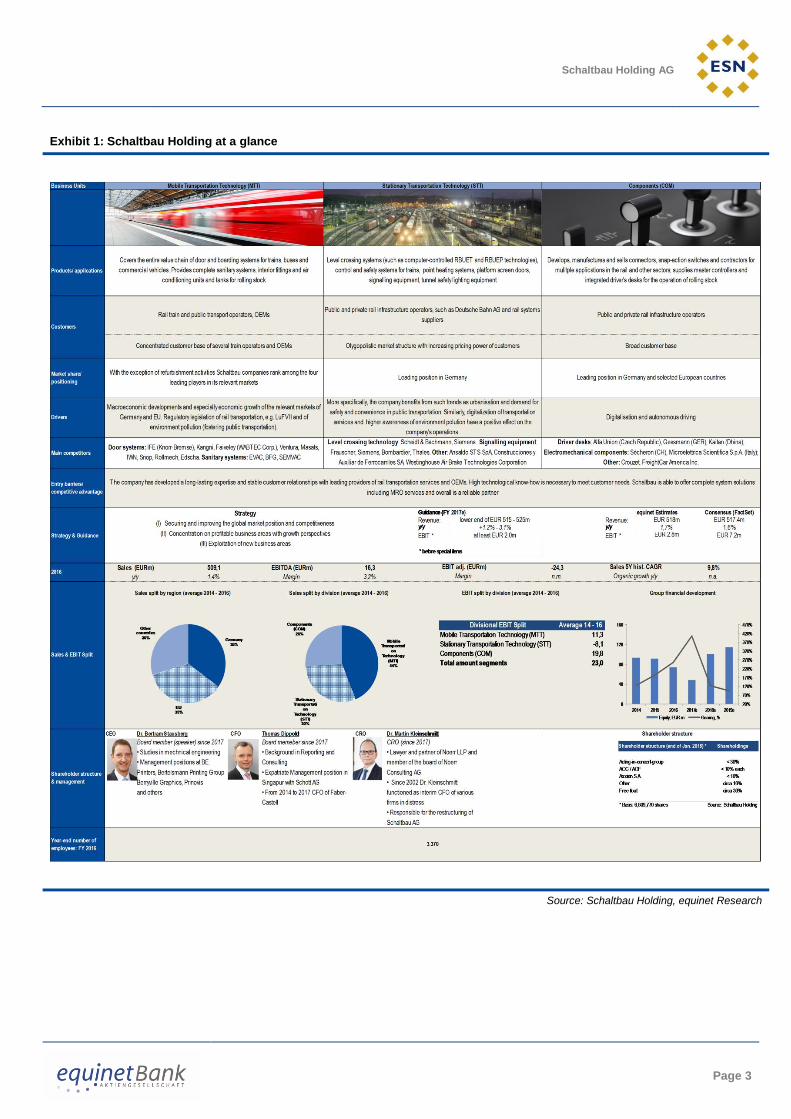
Investment Case in Charts
Exhibit 2: Av. market size: Railway techn. 2009 - 2021 Exhibit 3: Market development
Source: UNIFE, Roland Berger Source: UNIFE, Roland Berger
Exhibit 4: Schaltbau: Restructuring roadmap Exhibit 5: Reported EBIT-margin recovery by segment
Source: Schaltbau Holding Source: Schaltbau Holding, equinet Research
Exhibit 6: EBIT-margin recovery after failed M&A-policy Exhibit 7: Financial recovery – gearing will normalise
Source: Schaltbau Holding, equinet Research Source: Schaltbau Holding, equinet Research
0
50
100
150
200
2009-2011 2011-2013 2013-2015 2017-2019 2019-2021
EU
R b
n
Market size
-20%
-10%
0%
10%
20%
2013 2017e 2019e
M T T S T T C O M
-8%
-4%
0%
4%
8%
12%
0
100
200
300
400
500
600
EU
R m
Revenues EBIT Margin
0%
100%
200%
300%
400%
500%
0
50
100
150
200
250
EU
R m
Net Debt + Pension Provisions Gearing, %
Schaltbau Holding AG
Page 5
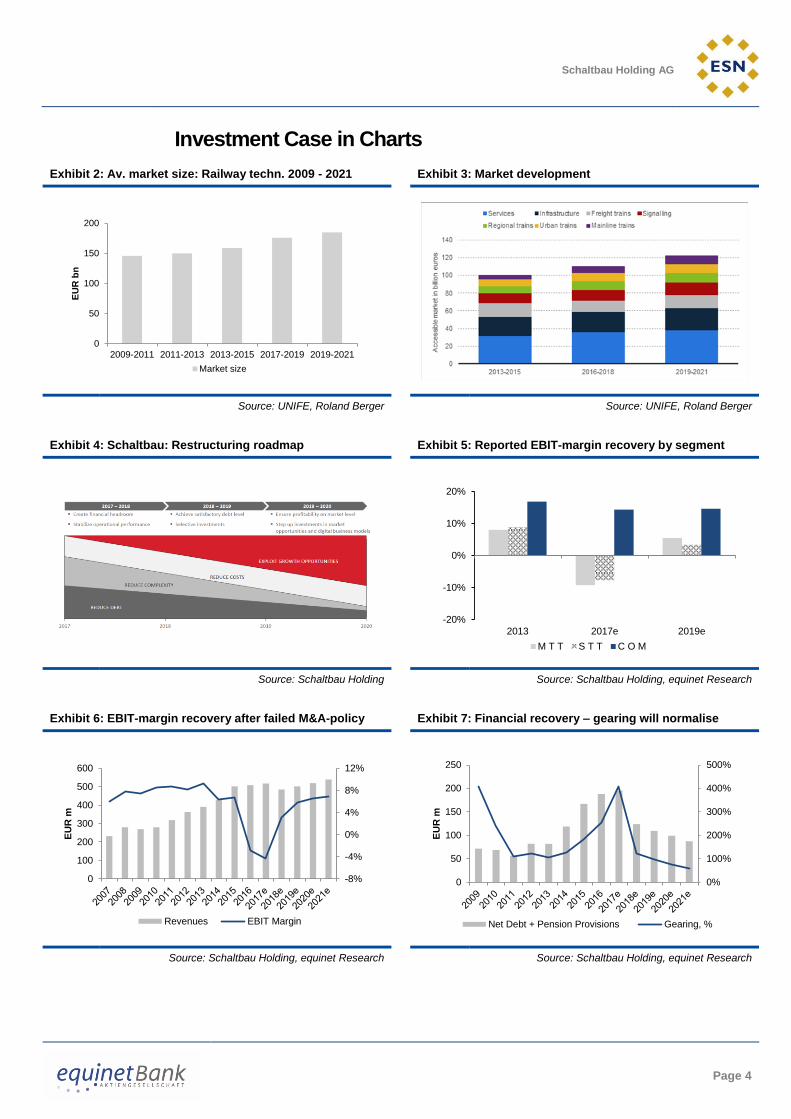
Investment case and SWOT analysis Until 2013 the development of Schaltbau Holding can be qualified as a growth story in line
with a significant margin expansion. Since 2013 an erosion in profitability took place and
culminated in negative reported EBIT-figures for 2016 and 2017e. This negative
development goes in line with a revaluation of the Schaltbau shares. It seems that not all
acquisitions which were made during the last years were integrated successfully.
Today, the company is undergoing a substantial restructuring process. The shares will offer
a significant upside potential in our view, if all milestones of the restructuring program will be
met in time. One serious point of concern in this context is Schaltbau’s financial burden,
becoming visible in a gearing of 407% for FY2017e (equinet estimate). These financial
constraints are limiting the growth potential in a rapidly changing industrial environment.
With regard to these limitations it is no surprise that in the future the group will concentrate
mainly on organic growth. With regard to the restructuring program we have identified a
number of measures which are directed to revive profitability and we estimate clearly higher
EBIT-margins from 2018e onwards. This is the main driver for the future performance of the
Schaltbau shares in our view. Keeping in mind a seven to eight years economic upswing in
Germany and Europe, mid- to long-term it will be a question if Schaltbau has become more
resilient against a possible economic turnaround or if they can ride the wave of a company
individual economic driven by for instance new, innovative products. The leading market
positions in several areas give us some confidence for the latter scenario.
The market itself is going to change and some megatrends like E-mobility and digitalization
will offer interesting growth opportunities.
Exhibit 8: Schaltbau Holding: SWOT - analysis
Source: equinet Research
STRENGTHS WEAKNESSES
Components business is highly profitable In many areas Schaltbau ranks among
the leading four players Strong focus on system solutions rather
than on parts or components Strong relationship to some key
customers like e.g. Deutsche Bahn in Germany
Burdened financial situation is limiting the group’s growth targets
No dividend payments until FY2019e expected
Weak profitability in Stationary Transportation Technology
OPPORTUNITIES THREATS
Outlook for global rail markets signals moderate growth
Liberalization and deregulation of rail traffic will offer new business opportunities
Portfolio optimization will support the recovery of profitability (strengthening the profitable business)
Main competitors could use Schaltbau’s current weakness to capture market share
Schaltbau will miss all milestones fixed in the restructuring program or incur delays

Schaltbau Holding AG
Page 6
Valuation We value the Schaltbau shares and derive the target price from our DCF-model. Using
peer-group multiples in our view currently does not cope with Schaltbau’s turnaround
situation.
DCF valuation
To calculate the equity value for Schaltbau Holding we use our three-stage DCF-model to
determine future cash flows. In our first stage, we calculate a detailed P&L, Balance Sheet
and Cash Flow statement for the period up to 2021e based on information provided by the
company and our own market assessment. In stage two, we switch over to a trend analysis
until 2026e for some key drivers like e.g. sales growth, EBIT-margin and investments. In the
third stage, we analyse and calculate the terminal value on the basis of a going-concern
assumption. In addition to the listed base input factors, currently we use a terminal growth
rate of 2% and a sustainable EBIT-margin of 7.0%.
Exhibit 9: Schaltbau Holding: DCF model
Source: equinet Research
Phase III
EUR m 2017e 2018e 2019e 2020e 2021e 2022e 2023e 2024e 2025e 2026e
Revenues 517.5 485.6 502.0 519.5 539.0 557.7 575.3 591.9 607.2 621.1
growth rate 1.7% -6.2% 3.4% 3.5% 3.8% 3.5% 3.2% 2.9% 2.6% 2.3%
EBIT -22.2 15.0 29.0 33.7 37.4 38.8 40.1 41.3 42.4 43.5
EBIT margin -4.3% 3.1% 5.8% 6.5% 6.9% 7.0% 7.0% 7.0% 7.0% 7.0%
Tax -6.6 -4.5 -8.7 -10.1 -11.2 -11.6 -12.0 -12.4 -12.7 -13.0
Tax rate -30% 30% 30% 30% 30% 30% 30% 30% 30% 30%
Depr. & Amort. 38.0 11.5 9.5 9.0 9.0 10.4 11.2 11.9 12.3 12.7
% of sales 7.3% 2.4% 1.9% 1.7% 1.7% 1.9% 2.0% 2.0% 2.0% 2.0%
Capex -14.5 -9.0 -9.0 -11.3 -11.6 -12.0 -12.4 -12.7 -13.1 -13.4
% of sales 2.8% 1.9% 1.8% 2.2% 2.2% 2.2% 2.2% 2.2% 2.2% 2.2%
Change in WC & P 4.5 -3.0 -2.2 -2.4 -0.8 -0.9 -0.9 -0.9 -0.9 -1.0
% of sales -0.9% 0.6% 0.4% 0.5% 0.2% 0.2% 0.2% 0.2% 0.2% 0.2%
Free Cash Flow -0.8 10.0 18.6 18.9 22.8 24.7 26.0 27.1 28.0 28.8 559.1
growth rate nm nm 85.7% 1.4% 20.5% 8.3% 5.6% 4.1% 3.3% 3.0% 2.0%
Present Value FCF -0.8 9.5 16.5 15.6 17.5 17.7 17.4 16.9 16.3 15.6 302.8
PV Phase I 58.3 Risk free rate 3.50% Targ. equity ratio 65%
PV Phase II 83.9 Premium Equity 5.00% Beta 1.1
PV Phase III 302.8 Premium Debt 2.00% WACC 7.3%
Enterprise value 445.0 Sensitivity
- Net Debt (Cash) 86.0 1.0% 1.5% 2.0% 2.5% 3.0%
- Pension Provisions 40.2 6.54% 32.8 36.3 40.7 46.1 53.1
- Minorities & Peripherals 33.4 6.90% 29.4 32.5 36.2 40.7 46.3
+ MV of financial assets WACC 7.26% 26.5 29.1 32.2 36.0 40.7
- Paid-out dividends for last FY 0.0 7.63% 23.9 26.2 28.8 32.0 35.9
+/- Other EV items 7.99% 21.5 23.5 25.8 28.6 31.9
Equity value 285.4
Number of shares 8.85
Value per share (€) 32.24
Current Price (€) 25.80
Upside 25.0%
Phase I Phase II
Growth in phase III

Schaltbau Holding AG
Page 7
Taken into account the detailed restructuring plan of the company and the already achieved
milestones we see a significant upside potential for the profitability of the group. With the
successful divestment of Pintsch Bubenzer and the recent capital increase, the overall
liquidity situation has improved. On this basis, we calculate an enterprise value of EUR
445.0m. Including financial debt, pensions and other items we calculate the equity value at
currently EUR 285.4m or rounded EUR 32.20 per share. That gives the shares a significant
upside potential of 26% from today’s level and we initiate our coverage with a Buy rating.
Peer group analysis
Exhibit 10: Schaltbau Holding: Peer-group comparison
Source: FactSet, equinet Research
Profile of listed peer-group companies
Ansaldo STS
Italian-based Ansaldo STS designs, implements and sells systems and services for
signalling and supervision of railway and urban traffic. The company also provides lead
contractor, system integrator and turnkey services for large railway and subway mass
transit projects, all under a single business segment, Signalling and Transportation
Solutions. In FY 2016 Ansaldo STS recorded revenues of EUR 1.327bn and operating
income of EUR 127m (margin of 9.6%) while employing 3,950 people. The majority of
revenues come from Europe (53%), with smaller contributions from the Americas (19%),
Asia/Pacific (19%) and Africa/Middle East (9%). Currently, main shareholders are Hitachi
Rail Italy Investments with 50.8% and Elliott (P. Singer) with 25.7% according to the
company. Our ESN partner, Banco Acros, currently rates the shares at Neutral with a TP of
EUR 10.50.
Construcciones y Auxiliar de Ferrocarriles
Construcciones y Auxiliar de Ferrocarriles, headquartered in Spain, engages in the
production of rail system products and solutions. In FY 2016, the company achieved
revenues of about EUR 1,318m and an operating income of EUR 119m (margin at 9.0%)
The vast majority of revenues were generated with Rolling stock (95%), with the rest
attributed to Wheel sets and Components. The Rolling Stock segment consists of high
Company PE PE EV/EBIT EV/EBIT
2018e 2019e 2018e 2019e
Vossloh AG 21.2 16.7 13.0 11.1
Ansaldo STS SpA 30.4 27.2 18.2 16.1
Construcciones y Auxiliar de Ferrocarriles, S.A. 17.1 14.2 10.1 9.1
Talgo SA 16.0 11.2 10.9 8.0
Westinghouse Air Brake Technologies Corporation 20.8 18.4 16.3 14.4
Greenbrier Companies, Inc. 11.8 12.2 5.4 5.9
Median 18.9 15.5 12.0 10.1
Schaltbau Holding AG 60.0 16.9 24.3 12.0
Schaltbau Holding AG
Page 8
speed, regional & commuter trains, metros, tram-trains, tram and light metros as well as
locomotives. The Wheel Sets and Components segment includes wheel sets and axles,
gear units and couplers for the rail market. At the end of December 2017, the company
signed a contract exceeding EUR 100m to supply 18 URBOS trams to Larsen & Toubro Ltd.
(India) in the Republic of Mauritius.
Greenbrier Companies
Greenbrier, headquartered in the US, designs, manufactures and distributes railroad freight
car equipment. For the annual period ending in August 31, 2017, the company achieved
sales of converted EUR 1,818m and an operating income of EUR 218m (margin of 12%).
Most of the business is in the Manufacturing segment (80% of 2017 revenues) while a
remaining part of 14% is Wheels and Parts as well as Leasing and Service (6%). The
Manufacturing segment includes double stack intermodal railcars, tank cars and marine
vessels. The Wheel and Parts segment produces railroad accessories and provide wheel
and axle maintenance and services. The majority of revenues (77%) comes from the US
home market.
Talgo S.A.
Talgo, based in Spain, focuses on designing, manufacturing and servicing technologically
differentiated fast, lightweight trains. The company specializes in the production of very high
speed (>350 km/h), high speed (> 250 km/h) and natural tilting passenger coaches (180-
250 km/h). Given this profile it is not a direct competitor to Schaltbau. In FY 2016 the
company achieved group sales of EUR 580m and an operating income of EUR 88m
(margin of 15.2%) with a headcount of 2,030 people. In 2016 the Los Angeles County
Metropolitan Transportation Authority has selected Talgo to refurbish 38 rapid transit trains
given a contract value of US$ 55m with an option for a further US$ 17m for additional 36
trains.
Vossloh AG
German-based Vossloh AG operates in the global rail technology markets with a strong
focus in rail infrastructure, especially rail fastening and switch systems. In FY 2016 the
company achieved sales of about EUR 930m and an operating income of EUR 50m (margin
of 5.4%) while employing 4,000 people. The company’s segments are Customized Modules
(sales share of 53%), Core Components (sales share of 28%), Transportation (12%) and
Life Cycle Solutions being responsible for the remainder. Vossloh is somewhat diversified
geographically, with a bulk of revenues coming from Europe (61%), as well as smaller
contributions from Asia (21%), the Americas (11%) and Africa (5%). The biggest single
shareholder of Vossloh currently is Heinz-Hermann Thiele (Knorr-Bremse) with 44.73%,
according to Vossloh.
Wabtec/Faively
The foundation of the original Westinghouse Air Brake Co. dates back to 1869.
Westinghouse Air Brake Company (WABCO) was formed in 1990 when it acquired certain
assets and operations from American Standard Inc. The company went public in 1995. Four
years later WABCO merged with Motive Power Industries, Inc. and adopted the name of
Wabtec. In 2017 the acquisition of Faiveley Transport S.A. (France), a leading provider of
value-added, integrated systems and services, primarily for the transit rail market, for a
purchase price of US$ 1.5bn was completed. Today Wabtec sees itself as one of the largest
providers of value-added, technology-based equipment, systems and services for the global

Schaltbau Holding AG
Page 9
passenger transit and freight rail industries. Based on reported figures, 2017 the group
achieved sales of US$ 3,882m and an income from operations of US$ 421m (non-GAAP:
US$ 508m) resulting in a margin of 10.8% (non-GAAP: 13.1%).
Profile of non-listed peer-group companies
Knorr-Bremse AG
German-based, Knorr-Bremse, develops, manufactures and distributes braking systems for
rail and commercial vehicles. Furthermore the company offers electronic control devices, air
treatment systems and torsional vibration dampers for commercial vehicles. It also supplies,
among other products, intelligent entrance systems, HVAC systems, auxiliary power supply
systems, control components, windscreen wipers, platform screen doors (PSD). The group
already reported 2017 sales of EUR 6.24m (+13.6%) including EUR 250m sales acquired
from Vossloh. Operating margin reached a stable level of 17%. The majority of its revenues
come from Europe/Africa at about 50%, smaller contributions from Asia/Australia (28%) and
Americas (22%). Market observers speculate about a planned IPO of the group but the time
frame so far remains unclear.
Scheidt & Bachmann
The German non-listed Scheidt & Bachmann GmbH was founded in 1872. Over time the
company developed to a diversified group with five business segments: Parking Systems,
Access Systems, Fare Collection Systems, Fuel Retail Solutions and Signalling Systems.
Activities in this last segment are directed to rail markets. Scheidt & Bachmann offers
among others interlocking systems, level crossing solutions operations control and
simulation systems. Today the group acts on a global basis with 25 subsidiaries and 3,000
employees. Sales in 2015 reached EUR ~350m.

Schaltbau Holding AG
Page 10
Company profile
Company overview
The foundation of the group dates back to 1929 when Schaltbau GmbH started to produce
rail switchgears and heaters with a total of 12 employees. After a long period of success, in
1992 the group was acquired by Berliner Elektro AG and converted into a stock company.
Two years later Schaltbau shares were launched on the regulated market. In 2000 the
company’s name was changed into Schaltbau Holding AG. Beyond the name change, at
that time the operating business was carved out into Schaltbau GmbH (the parent company
of the COM segment).
Today the group is organised in a holding structure with 38 operating companies in 17
countries and is a leading supplier in the field of rolling stock, rail infrastructure, automotive
and capital goods industry. The activities were separated into the three segments Mobile
Transportation Technology, Stationary Transportation Technology and Components. End
customer groups are the global railway industry with 65% followed by industrial clients with
22% and automotive customers with 13%.
The CAGR 2006 – 2016 came out at +9.1% and within this period only 2009 was a year
with sales declining by 3.7%. For the same period EBIT-margins rank between 9.2% (2013)
and -2.8% (2016). Last year the group went into serious financial trouble and various
measures were undertaken to stabilise the company as e.g. the divestment of subsidiaries,
general cost savings and most recently a capital increase in early 2018. Gone forward the
whole industry could capitalize on the change towards digitalisation of the railway industry.
Exhibit 11 comprises the fully consolidated entities only.
Exhibit 11: Company Structure as of February 2018
Source: Schaltbau Holding, equinet Research
Schaltbau Holding AG
Page 11
Schaltbau’s company strategy for recovery
FY 2016 marked the height of the fundamental crisis of the Schaltbau Holding group, but in
our view the trouble started already two years earlier. In particular two acquired companies,
Schaltbau Alte and the Schaltbau Sepsa group did not perform as expected and were loss-
making. During 2016 the symptoms of the crisis intensified and the group had to publish
three profit warnings and the major topics of concern comprised:
Operational problems with some projects like e.g. platform screen doors in Brazil
(total volume of EUR 17.5m) and level crossing projects in Egypt (total volume of
EUR 3.4m) and Denmark (total volume of EUR 18.8m) with accumulated losses of
EUR 30m. Furthermore there was an impairment of EUR 1.6m at Schaltbau Pintsch
Bamag
Extra costs related to quality issues
Extra costs for restructuring measures and dismissal wages
Operational: Declining demand in China and Poland
With the external help from a restructuring consultant the new management fixed a
roadmap for the financial and operational recovery for the years until 2020. Key measures
are directed to secure short- and long-term financial stability, to reduce the cost base and
identify measures for a sales increase. The relevant restructuring measures for the three
segments are outlined in more detail in the segments discussion. Total expenses for the
restructuring amounted to EUR 7.0m while the consultant fees are expected to reach EUR
3.3m and will incur in 2017 and 2018e.
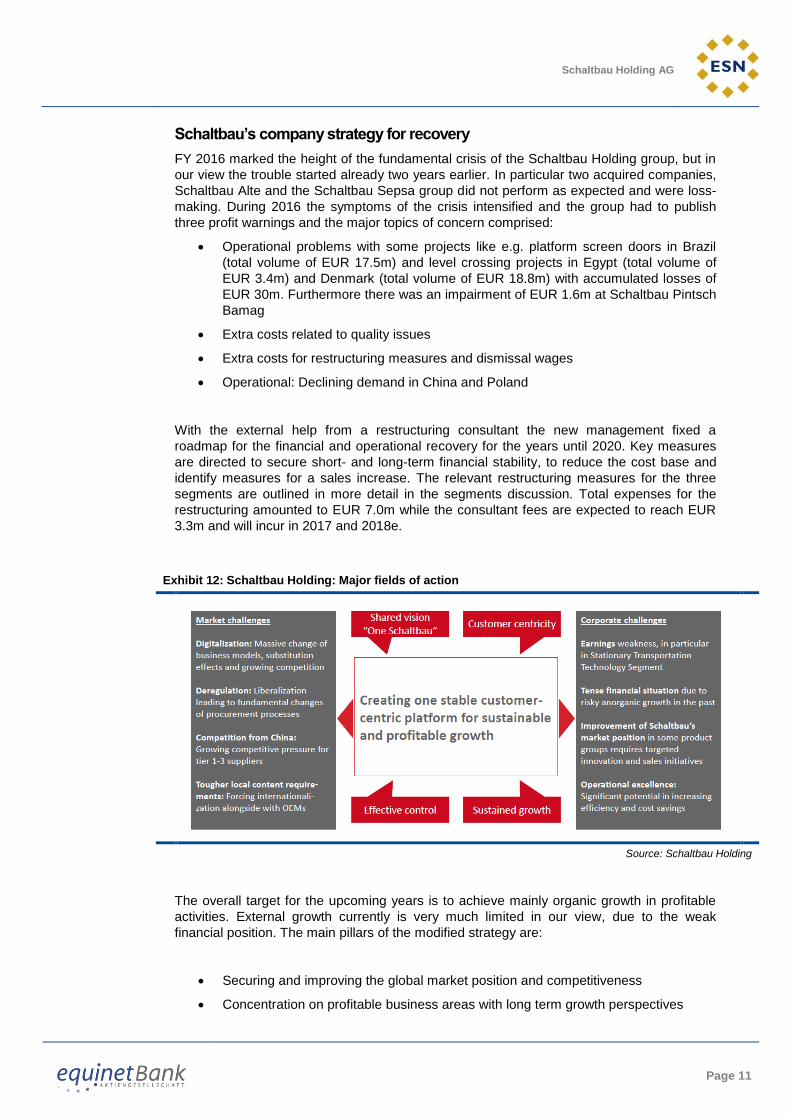
Exhibit 12: Schaltbau Holding: Major fields of action
Source: Schaltbau Holding
The overall target for the upcoming years is to achieve mainly organic growth in profitable
activities. External growth currently is very much limited in our view, due to the weak
financial position. The main pillars of the modified strategy are:
Securing and improving the global market position and competitiveness
Concentration on profitable business areas with long term growth perspectives
Schaltbau Holding AG
Page 12
Exploitation of new business areas
Better focus on customer needs and closer relationship to customers
In order to secure the global market position, the plan is to strengthen foreign production
and distribution facilities so that Schaltbau companies would better meet increased local
content needs demanded by customers. Overall R&D efforts should make the group’s
product portfolio more “digital” and “smart”. The management aims to reduce the overall
cost base and to intensify the after sales and service business due to its healthy margin
level. Over long-term, we would not rule out that the group will purely concentrate on the
Mobile Transportation Technology segment. In FY 2016 this segment generated sales of
EUR 223m or 44% of the group’s total. In our view it would make sense to shift the product
portfolio away from parts and components towards a systems approach. The refurbishment
activities currently concentrate mainly on door systems and can be expanded to other areas
like for instance interior. A better use of synergies between the group companies should
help to generate cost synergies and shorten development times.
Mobile Transportation Technology (MTT)
With a sales share of 53% (Q3 2017) MTT is the biggest single division of Schaltbau. The
main operating companies in this division are Schaltbau Bode, Schaltbau Alte, Schaltbau
Refurbishment and Schaltbau Rawag (Poland). Schaltbau Sepsa is planned to be sold but
this transaction is not yet finalised. Sepsa represents sales of some EUR 35-40m per year.
The division has its strengths with a focus on door systems and exteriors for trains, busses
and trucks. Furthermore interiors for trains, sanitary systems and air conditioning systems
were offered. Main competitors with regard to door systems are IFE (Knorr-Bremse group),
Kangni and Faiveley (WABTEC group). For sanitary systems, the main rivals are EVAC,
BFG and SEMVAC.
According to the company, Schaltbau ranks among the leading four players in the market in
the sub-segment of door systems for various types of trains. For busses and trucks,
measured by sales, Schaltbau is the biggest player. With regard to sanitary systems,
Schaltbau is the second biggest player in the market.
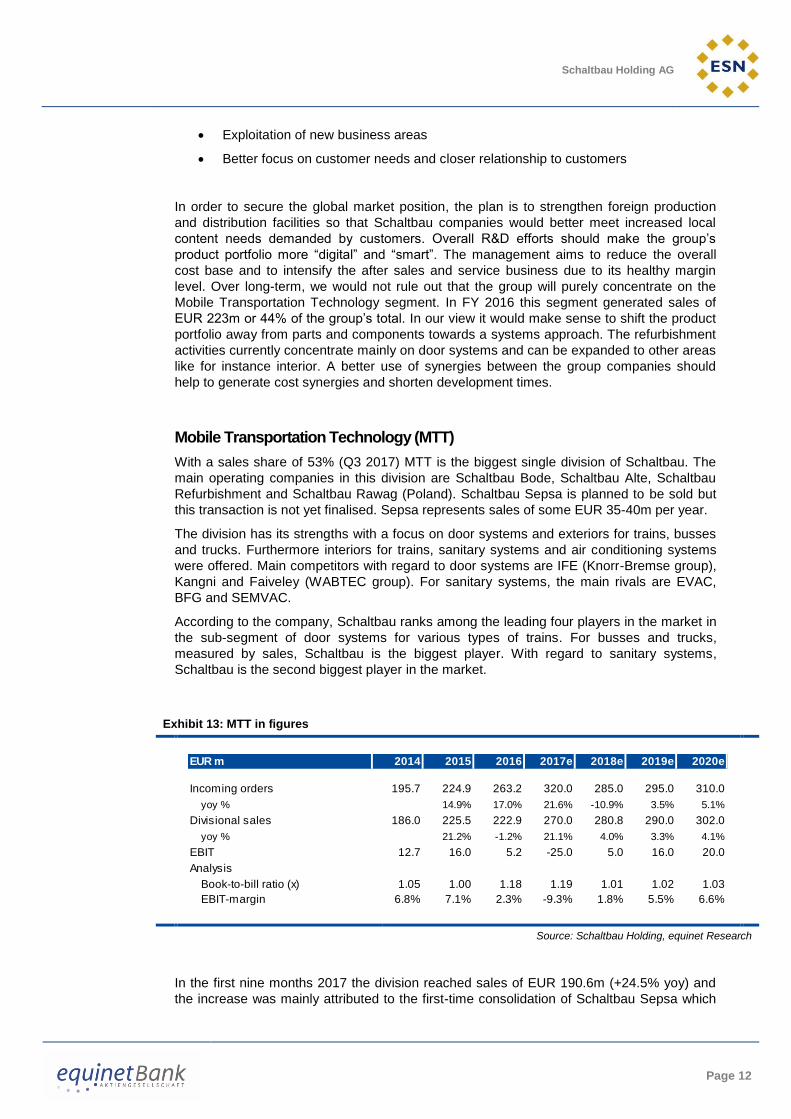
Exhibit 13: MTT in figures
Source: Schaltbau Holding, equinet Research
In the first nine months 2017 the division reached sales of EUR 190.6m (+24.5% yoy) and
the increase was mainly attributed to the first-time consolidation of Schaltbau Sepsa which
EUR m 2014 2015 2016 2017e 2018e 2019e 2020e
Incoming orders 195.7 224.9 263.2 320.0 285.0 295.0 310.0
yoy % 14.9% 17.0% 21.6% -10.9% 3.5% 5.1%
Divisional sales 186.0 225.5 222.9 270.0 280.8 290.0 302.0
yoy % 21.2% -1.2% 21.1% 4.0% 3.3% 4.1%
EBIT 12.7 16.0 5.2 -25.0 5.0 16.0 20.0
Analysis
Book-to-bill ratio (x) 1.05 1.00 1.18 1.19 1.01 1.02 1.03
EBIT-margin 6.8% 7.1% 2.3% -9.3% 1.8% 5.5% 6.6%
Schaltbau Holding AG
Page 13
is identified to be sold again, with the transaction not yet being executed. For 2018e we
estimate a moderate sales increase of 4.0% to EUR 280.8m. Thanks to a sound order
intake there is a realistic chance that the division will return 2019e to a growth path again
with estimated sales of EUR 290.0m (+3.3%).
The segment’s reported 9M EBIT amounted to EUR -16.2m (from EUR 4.1m) and is
negatively impacted by an impairment of EUR -12.0m so that the adjusted EBIT came out at
EUR -4.2m. For the full year 2017e we forecast a reported EBIT of EUR -25m; the figure
includes EUR -24m of extraordinary expenses related to the planned divestment of
Schaltbau Sepsa. Due to the shortfall of this one-off item we expect the division 2018e to
manage the turnaround and reach an EBIT of EUR 5.0m resulting in an EBIT-margin of
1.8%. The group’s restructuring concept had identified several areas to manage the
turnaround:
Realisation of productivity gains
Intensifying the after-sales business
Procurement: Reduction of prices
Reduction of personnel costs
Increase of number of modular product platforms
Stationary Transportation Technology (STT)
The division’s sales amounted to around 26% of the group’s total in Q3 2017. The division
is active in the two business areas Infrastructure Technology and Brake Systems. The main
operating companies are Pintsch Bamag, Pintsch Tiefenbach and Pintsch Aben. As of 21
January 2018 a contract between the Swedish Dellner Brakes AB (Dellner Group) and
Pintsch Bamag was signed to sell Pintsch Bubenzer (brake systems) for a planned
purchase price of gross EUR 30.3m. In early March, Schaltbau announced the finalisation
of the transaction and received from Dellner a cash inflow of EUR 30.3m.
Main activities of this segment are level crossing systems, platform screen doors (PSD),
switch systems or tunnel safety lighting systems. According to Schaltbau’s own information
the segment ranks number two, based on sales figures, at level crossing technology. Here
the main competitors are the German players Scheidt & Bachmann and Siemens.
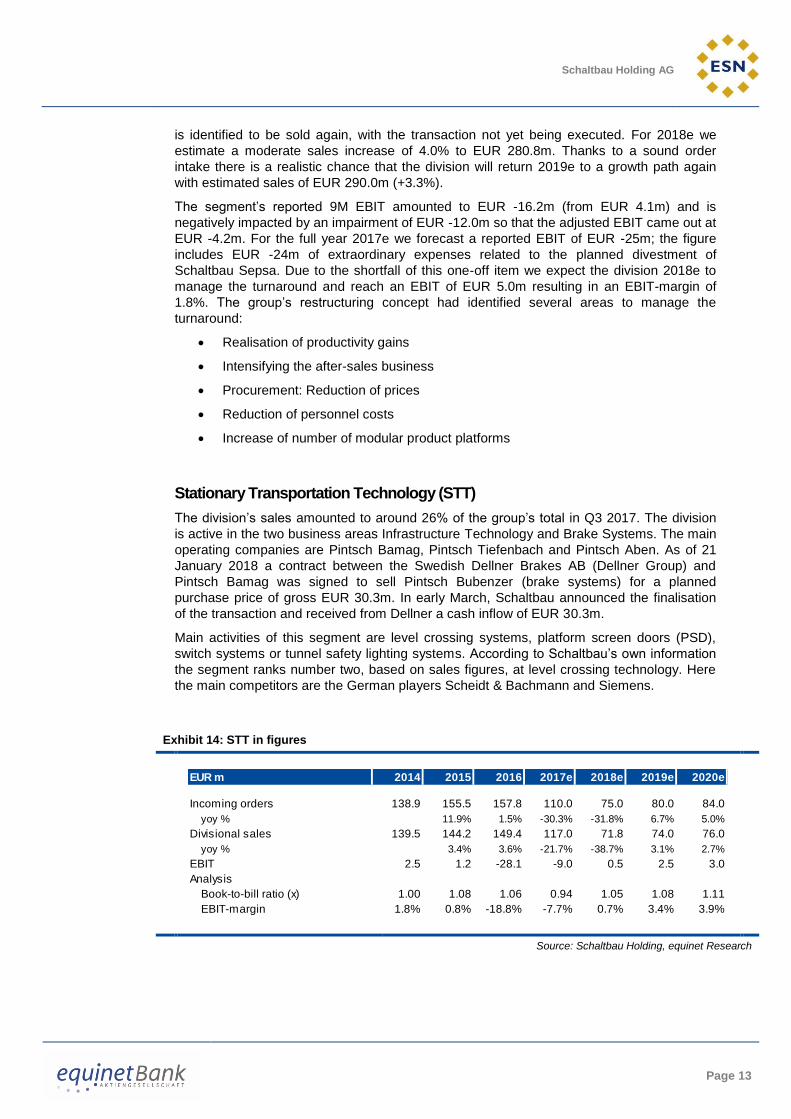
Exhibit 14: STT in figures
Source: Schaltbau Holding, equinet Research
EUR m 2014 2015 2016 2017e 2018e 2019e 2020e
Incoming orders 138.9 155.5 157.8 110.0 75.0 80.0 84.0
yoy % 11.9% 1.5% -30.3% -31.8% 6.7% 5.0%
Divisional sales 139.5 144.2 149.4 117.0 71.8 74.0 76.0
yoy % 3.4% 3.6% -21.7% -38.7% 3.1% 2.7%
EBIT 2.5 1.2 -28.1 -9.0 0.5 2.5 3.0
Analysis
Book-to-bill ratio (x) 1.00 1.08 1.06 0.94 1.05 1.08 1.11
EBIT-margin 1.8% 0.8% -18.8% -7.7% 0.7% 3.4% 3.9%
Schaltbau Holding AG
Page 14
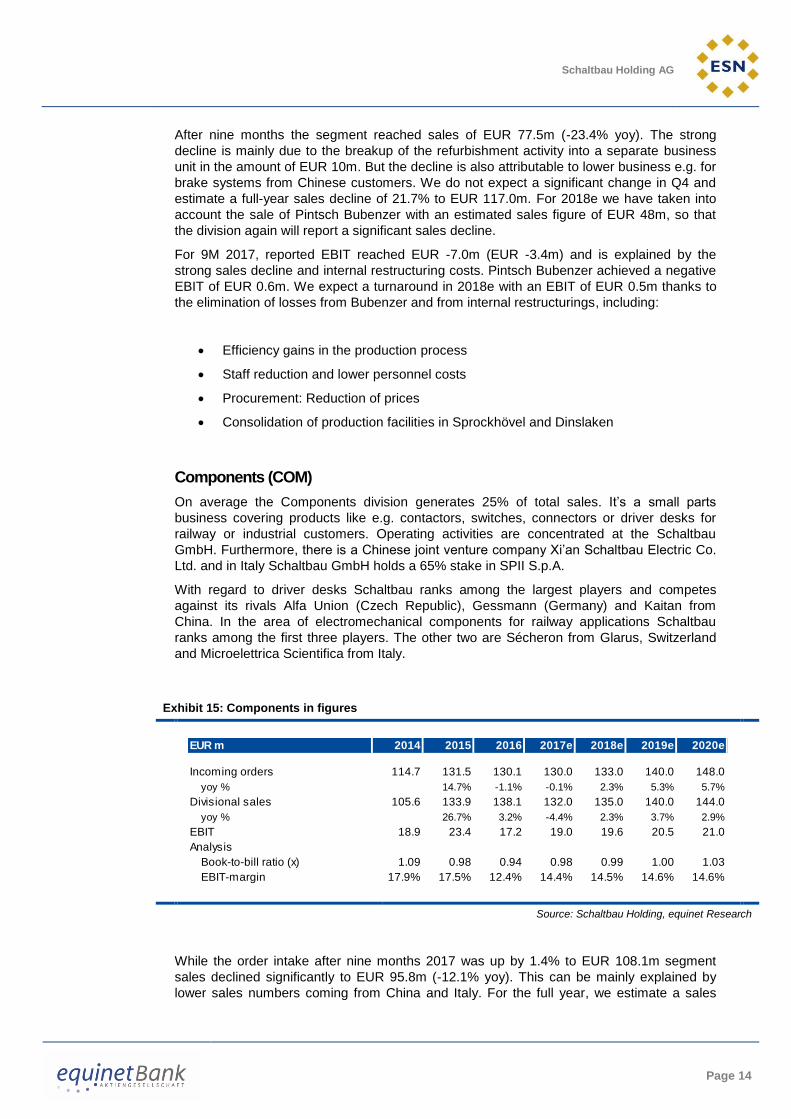
After nine months the segment reached sales of EUR 77.5m (-23.4% yoy). The strong
decline is mainly due to the breakup of the refurbishment activity into a separate business
unit in the amount of EUR 10m. But the decline is also attributable to lower business e.g. for
brake systems from Chinese customers. We do not expect a significant change in Q4 and
estimate a full-year sales decline of 21.7% to EUR 117.0m. For 2018e we have taken into
account the sale of Pintsch Bubenzer with an estimated sales figure of EUR 48m, so that
the division again will report a significant sales decline.
For 9M 2017, reported EBIT reached EUR -7.0m (EUR -3.4m) and is explained by the
strong sales decline and internal restructuring costs. Pintsch Bubenzer achieved a negative
EBIT of EUR 0.6m. We expect a turnaround in 2018e with an EBIT of EUR 0.5m thanks to
the elimination of losses from Bubenzer and from internal restructurings, including:
Efficiency gains in the production process
Staff reduction and lower personnel costs
Procurement: Reduction of prices
Consolidation of production facilities in Sprockhövel and Dinslaken
Components (COM)
On average the Components division generates 25% of total sales. It’s a small parts
business covering products like e.g. contactors, switches, connectors or driver desks for
railway or industrial customers. Operating activities are concentrated at the Schaltbau
GmbH. Furthermore, there is a Chinese joint venture company Xi’an Schaltbau Electric Co.
Ltd. and in Italy Schaltbau GmbH holds a 65% stake in SPII S.p.A.
With regard to driver desks Schaltbau ranks among the largest players and competes
against its rivals Alfa Union (Czech Republic), Gessmann (Germany) and Kaitan from
China. In the area of electromechanical components for railway applications Schaltbau
ranks among the first three players. The other two are Sécheron from Glarus, Switzerland
and Microelettrica Scientifica from Italy.
Exhibit 15: Components in figures
Source: Schaltbau Holding, equinet Research
While the order intake after nine months 2017 was up by 1.4% to EUR 108.1m segment
sales declined significantly to EUR 95.8m (-12.1% yoy). This can be mainly explained by
lower sales numbers coming from China and Italy. For the full year, we estimate a sales
EUR m 2014 2015 2016 2017e 2018e 2019e 2020e
Incoming orders 114.7 131.5 130.1 130.0 133.0 140.0 148.0
yoy % 14.7% -1.1% -0.1% 2.3% 5.3% 5.7%
Divisional sales 105.6 133.9 138.1 132.0 135.0 140.0 144.0
yoy % 26.7% 3.2% -4.4% 2.3% 3.7% 2.9%
EBIT 18.9 23.4 17.2 19.0 19.6 20.5 21.0
Analysis
Book-to-bill ratio (x) 1.09 0.98 0.94 0.98 0.99 1.00 1.03
EBIT-margin 17.9% 17.5% 12.4% 14.4% 14.5% 14.6% 14.6%

Schaltbau Holding AG
Page 15
decline of 4.4% to EUR 132m. Looking forward we expect a moderate organic growth
between 2% and slightly more than 4%.
The Components segment by far is the most profitable segment of the group. The 9M EBIT
declined with nearly the same magnitude as sales and resulted in a stable EBIT-margin of
16.6% (9M 2016: 16.5%). In line with the other two segments management has identified
some areas of improvement:
Increase of productivity in production
Optimisations in the Service and spare parts business
Expansion of refurbishment business in China
Better use of the Schaltbau distribution network for products from the Italian SPII

Schaltbau Holding AG
Page 16
Market environment The Schaltbau Holding group serves three main end-markets: Railway, Automotive and
Capital Goods. Due to the fact that the railway industry with 65% of sales in 2016 by far is
the most important end-market, we concentrate our analysis on this market.
Schaltbau’s biggest individual end-customer is Deutsche Bahn but there are also big OEMs,
for example Siemens, Alstom, Thales and many others as well as bus manufactures.
Access to some attractive foreign markets is limited or Schaltbau is faced with high entry
barriers due to protectionism with China as a good example for this policy. In contrast,
China’s biggest railway giant China Railway Rolling Stock Corporation (CRRC), with
increasing efforts, shows more presence in international markets.
According to the German Verband der Bahnindustrie in Deutschland e.V. (VDB) the global
railway market 2015 amounted to EUR 100.9bn of which Western Europe holds a share of
32.2% and is the biggest single region. The German rail market 2016 declined by 4% to
EUR 11.8bn, while in the first half 2017 a sales volume of EUR 5.0bn was reached.
Exhibit 16: Av. size of the global market for railway technology between 2009 - 2021
Source: UNIFE, Roland Berger
Using a broader market definition as seen in a UNIFE, Roland Berger study the rail supply
market is robust with an average size of the total market value in 2013-2015 of EUR 159bn.
During this period the industry grew at 3% CAGR, with over half of the gains in the Rolling
Stock segment. The major cause of the growth of the Rolling Stock segment was the
record-high purchases of locomotives and freight waggons and from several large-scale
orders in other product segments, such as metros, commuter trains and (very) high speed
trains. Going forward, the rail supply market is forecasted to grow at 2.6% CAGR until 2021,
propelled by urbanisation and an expanding population, according to UNIFE.
0
50
100
150
200
2009-2011 2011-2013 2013-2015 2017-2019 2019-2021
EUR
bn
Market size
Schaltbau Holding AG
Page 17
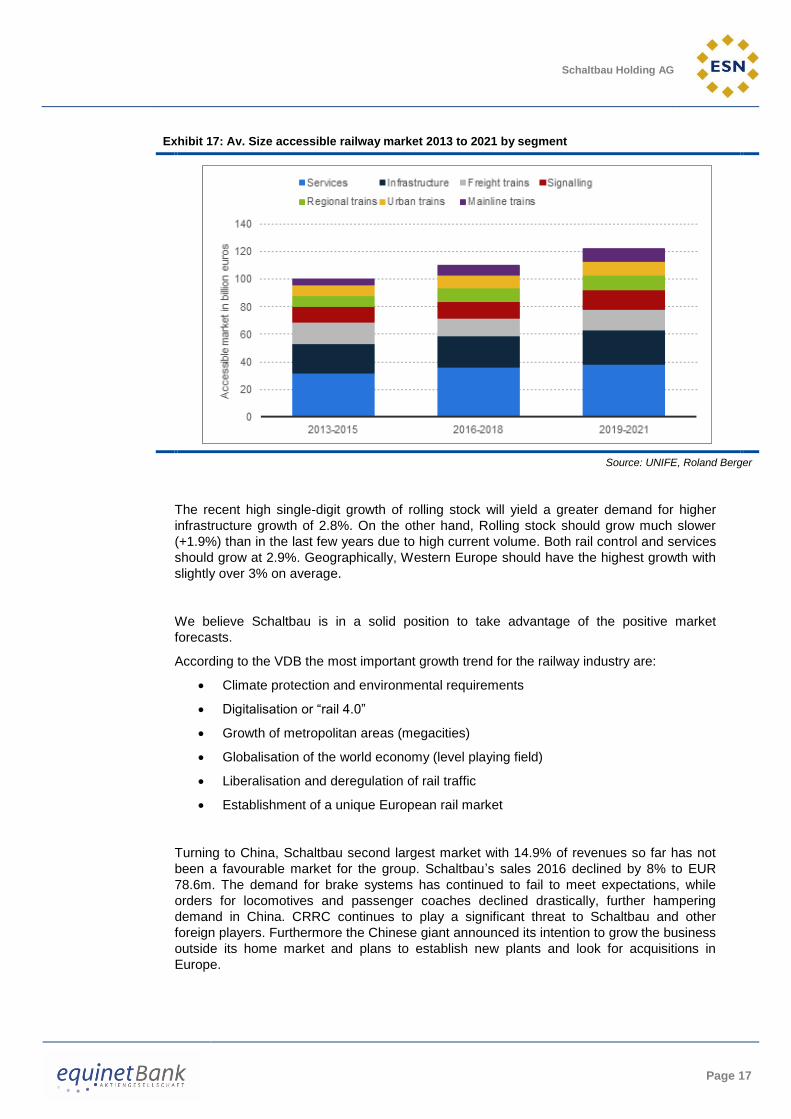
Exhibit 17: Av. Size accessible railway market 2013 to 2021 by segment
Source: UNIFE, Roland Berger
The recent high single-digit growth of rolling stock will yield a greater demand for higher
infrastructure growth of 2.8%. On the other hand, Rolling stock should grow much slower
(+1.9%) than in the last few years due to high current volume. Both rail control and services
should grow at 2.9%. Geographically, Western Europe should have the highest growth with
slightly over 3% on average.
We believe Schaltbau is in a solid position to take advantage of the positive market
forecasts.
According to the VDB the most important growth trend for the railway industry are:
Climate protection and environmental requirements
Digitalisation or “rail 4.0”
Growth of metropolitan areas (megacities)
Globalisation of the world economy (level playing field)
Liberalisation and deregulation of rail traffic
Establishment of a unique European rail market
Turning to China, Schaltbau second largest market with 14.9% of revenues so far has not
been a favourable market for the group. Schaltbau’s sales 2016 declined by 8% to EUR
78.6m. The demand for brake systems has continued to fail to meet expectations, while
orders for locomotives and passenger coaches declined drastically, further hampering
demand in China. CRRC continues to play a significant threat to Schaltbau and other
foreign players. Furthermore the Chinese giant announced its intention to grow the business
outside its home market and plans to establish new plants and look for acquisitions in
Europe.
Schaltbau Holding AG
Page 18
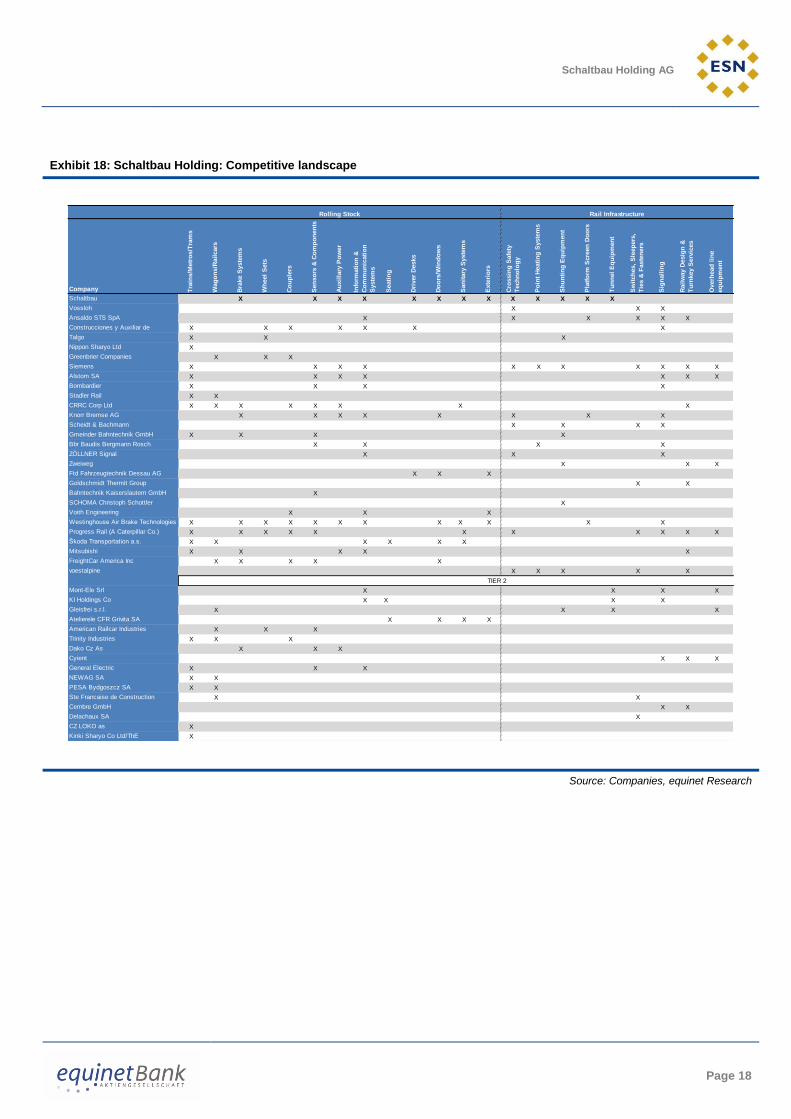
Exhibit 18: Schaltbau Holding: Competitive landscape
Source: Companies, equinet Research
Rolling Stock Rail Infrastructure
Company Tra
ins/M
etr
os/T
ram
s
Wag
on
s/R
ail
cars
Bra
ke S
yste
ms
Wh
eel
Sets
Co
up
lers
Sen
so
rs &
Co
mp
on
en
ts
Au
xil
lary
Po
wer
Info
rmati
on
&
Co
mm
un
icati
on
Syste
ms
Seati
ng
Dri
ver
Desks
Do
ors
/Win
do
ws
San
itary
Syste
ms
Exte
rio
rs
Cro
ssin
g S
afe
ty
Tech
no
log
y
Po
int
Heati
ng
Syste
ms
Sh
un
tin
g E
qu
ipm
en
t
Pla
tfo
rm S
cre
en
Do
ors
Tu
nn
el
Eq
uip
men
t
Sw
itch
es,
Sle
ep
ers
,
Tie
s &
Faste
ners
Sig
nall
ing
Rail
way D
esig
n &
Tu
rnkey S
erv
ices
Overh
ead
lin
e
eq
uip
men
t
Schaltbau X X X X X X X X X X X X X
Vossloh X X X
Ansaldo STS SpA X X X X X X
Construcciones y Auxiliar de
Ferrocarriles
X X X X X X X
Talgo X X X
Nippon Sharyo Ltd X
Greenbrier Companies X X X
Siemens X X X X X X X X X X X
Alstom SA X X X X X X X
Bombardier X X X X
Stadler Rail X X
CRRC Corp Ltd X X X X X X X X
Knorr Bremse AG X X X X X X X X
Scheidt & Bachmann X X X X
Gmeinder Bahntechnik GmbH X X X X
Bbr Baudis Bergmann Rosch
Verkehrstechnik Gmbh
X X X X
ZÖLLNER Signal X X X
Zweiweg X X X
Ftd Fahrzeugtechnik Dessau AG X X X
Goldschmidt Thermit Group X X
Bahntechnik Kaiserslautern GmbH X
SCHOMA Christoph Schottler
Maschinenfabrik GmbH
X
Voith Engineering X X X
Westinghouse Air Brake Technologies
Corp
X X X X X X X X X X X X
Progress Rail (A Caterpillar Co.) X X X X X X X X X X X
Škoda Transportation a.s. X X X X X X
Mitsubishi X X X X X
FreightCar America Inc X X X X X
voestalpine X X X X X
TIER 2
Mont-Ele Srl X X X X
KI Holdings Co X X X X
Gleisfrei s.r.l. X X X X
Atelierele CFR Grivita SA X X X X
American Railcar Industries X X X
Trinity Industries X X X
Dako Cz As X X X
Cyient X X X
General Electric X X X
NEWAG SA X X
PESA Bydgoszcz SA X X
Ste Francaise de Construction
Materiel Ferroviaire
X X
Cembre GmbH X X
Delachaux SA X
CZ LOKO as X
Kinki Sharyo Co Ltd/ThE X
Schaltbau Holding AG
Page 19
Financials Schaltbau group is currently going through an existential restructuring process. In the
financials area, in short-term the liquidity squeeze is already solved. Moreover, long-term
the financial debt has to be reduced in order to meet again all covenants from their partner
banks. The second pillar of the planned restructuring is the need of a recovery of the
profitability, so that long-term the going-concern assumption will be secured.
Earnings analysis
The main reasons for the overall crisis are already outlined in paragraph “Schaltbau’s
company strategy for recovery”. The margin erosion already started in 2014 and has sped
up in 2016 and 2017e. With regard to the serious difficulties the company made use of an
external recovery consultant, which is Roland Berger, and it was confirmed by them that
Schaltbau Holding group is remediable.
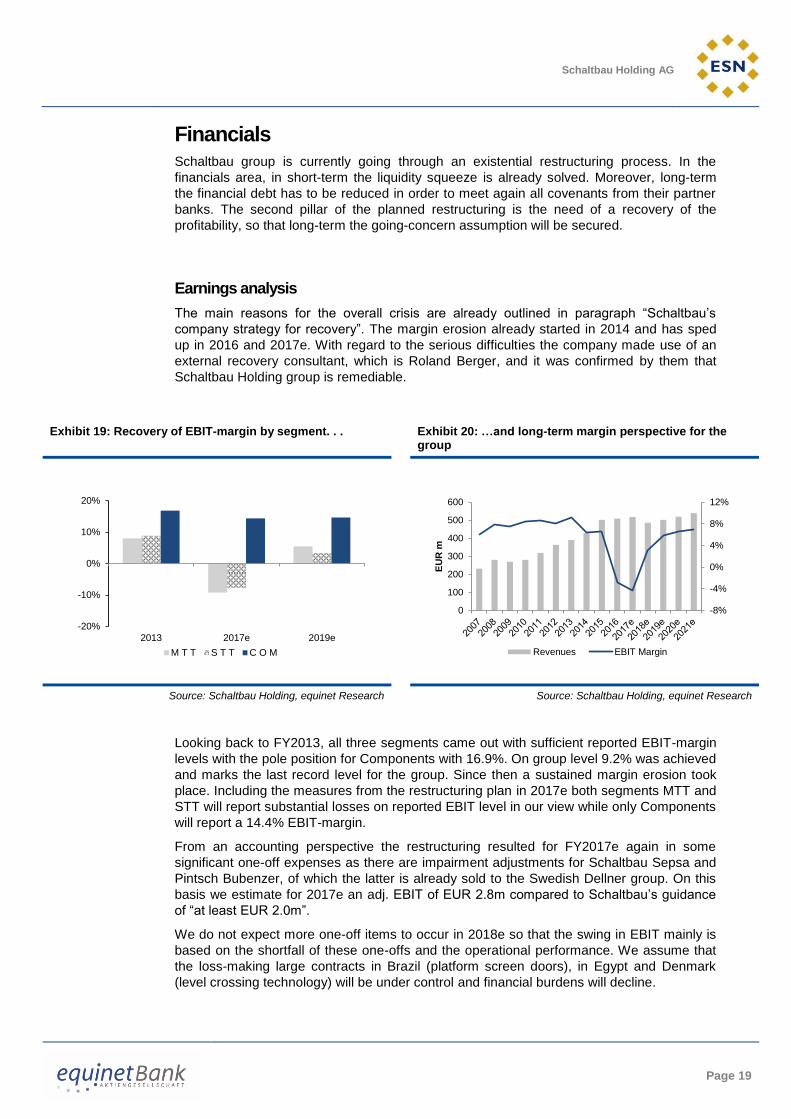
Exhibit 19: Recovery of EBIT-margin by segment. . . Exhibit 20: …and long-term margin perspective for the group
Source: Schaltbau Holding, equinet Research Source: Schaltbau Holding, equinet Research
Looking back to FY2013, all three segments came out with sufficient reported EBIT-margin
levels with the pole position for Components with 16.9%. On group level 9.2% was achieved
and marks the last record level for the group. Since then a sustained margin erosion took
place. Including the measures from the restructuring plan in 2017e both segments MTT and
STT will report substantial losses on reported EBIT level in our view while only Components
will report a 14.4% EBIT-margin.
From an accounting perspective the restructuring resulted for FY2017e again in some
significant one-off expenses as there are impairment adjustments for Schaltbau Sepsa and
Pintsch Bubenzer, of which the latter is already sold to the Swedish Dellner group. On this
basis we estimate for 2017e an adj. EBIT of EUR 2.8m compared to Schaltbau’s guidance
of “at least EUR 2.0m”.
We do not expect more one-off items to occur in 2018e so that the swing in EBIT mainly is
based on the shortfall of these one-offs and the operational performance. We assume that
the loss-making large contracts in Brazil (platform screen doors), in Egypt and Denmark
(level crossing technology) will be under control and financial burdens will decline.
-20%
-10%
0%
10%
20%
2013 2017e 2019e
M T T S T T C O M
-8%
-4%
0%
4%
8%
12%
0
100
200
300
400
500
600
EU
R m
Revenues EBIT Margin

Schaltbau Holding AG
Page 20
Exhibit 21: Schaltbau Holding: EBIT bridge
Source: Schaltbau Holding, equinet Research
In line with the sale of companies the sales base will be reduced significantly in 2018e in
our view. We estimate for 2018e a decline of 6.2% to EUR 485.6m. This includes the sale of
Pintsch Bubenzer with an estimated sales volume of EUR 48m (9M 2017: EUR
35.9m/9*12).
Exhibit 22: Schaltbau Holding: Sales bridge 2017e to 2018e
Source: equinet Research
Looking more forward we expect for the overall railway market a moderate growth in the
range of 3-5% p.a. In particular the MTT segment is in a good position to participate from
that market growth. Other areas of growth are larger volumes for box bodies for the “Street
Scooter” for Deutsche Post DHL group and from a planned growth for refurbishment
activities. According to the management, over long-term there could be an option purely to
concentrate on MTT. We hope that Components will remain a core activity as well due to its
excellent margin level.
EUR m 2014 2015 2016 2017e 2018e 2019e 2020e 2021e
EBIT reported 27.3 33.4 -14.5 -22.2 15.0 29.0 33.7 37.4
one-off / extraordinary income (-)
Revaluation of Albatros S.L.U. (Spain) "Sepsa" -7.0
Revaluation RDS (Poland) -2.5
Income related to prior periods -3.5 -3.4
one-off / extraordinary expenses (+)
Revaluation: Schaltbau Sepsa 24.0
Revaluation: Pintsch Bubenzer 1.0
Expenses related to prior periods 0.6 0.6
EBIT adjusted 27.3 28.0 -24.3 2.8 15.0 29.0 33.7 37.4
EUR m 2018e Comment
Group Sales estimate 2017e 517.5
Sale of P. Bubenzer -48.0 realised end of Feb. 2018
Sale of Schaltbau Sepsa 0.0 transaction not yet closed
Group Sales adjusted (equinet) 469.5
Expected organic growth: 3.4% 16.1
Group Sales estimate 2018e 485.6

Schaltbau Holding AG
Page 21
Financial analysis
All operational difficulties of the last years culminated in FY2017 and lead to a serious
liquidity squeeze for Schaltbau. In line with the overall restructuring of the group the master
plan also should bring back financials to „normality“. The short-term liquidity squeeze at this
point in time is under control in our view. End of February 2018, the company paid back
EUR 32.5m in loans due. This was secured by raising liquidity from three sources as can be
seen in Exhibit 23 and 24.
Exhibit 23: Sources of liquidity for financial debt reduction
Source: Schaltbau Holding, equinet Research
Exhibit 24: Cash inflow from external sources
Source: Schaltbau Holding, equinet Research
Also mid- to long-term the financial situation will remain strained in our view. The maturity
profile shows a peak in FY2019e when a syndicated credit line of EUR 100m has to be paid
back. End of November 2017 Schaltbau used these lines in an amount of EUR 81.4m. A
bonded loan in an amount of EUR 28.5m will mature at 30 June 2022. Syndicate members
will have an explicit right of termination as of 31 December 2019, if fixed conditions like e.g.
EUR m End of Feb. 2018 May 2017 to March 2018
Cash outflow:
Repayment of credit line (bridge financing) 25.0
Repayment of additional financial debt due 7.5
Cash inflow:
Capital increase: May 2017, net 15.6
Capital increase February 2018, net 46.1
Sale of Pintsch Bubenzer 30.3
Source: Schaltbau Holding, equinet Research
Total amount 32.5 92.0
Bridge Financing Cap.increase May 17
Additional financial debt
Capital increaseFeb 18
Sale P. Bubenzer
0.0
20.0
40.0
60.0
80.0
100.0
Cash out: Feb. 18 Cash in: May '17 - Feb '18
EU
R m

Schaltbau Holding AG
Page 22
repayment of credit, violation against covenants or other conditions will not be realised. The
second bonded loan in an amount of EUR 41.5m will mature at 30 June 2025. Also for this
tranche syndicate members will have an explicit right of termination too.
Exhibit 25: Credit lines and bonded loans maturity profile
Source: Schaltbau Holding, equinet Research
Given the new sources of liquidity of EUR 92m and the measures of the overall
restructuring plan there is a good chance in our view that the net financial debt (in our
definition incl. Pensions) will be reduced significantly.
Exhibit 26: Net financial debt and gearing recovery expected
Source: Schaltbau Holding, equinet Research
0
20
40
60
80
100
120
2018 2019e 2022e 2025e
EU
R m
Financial debt maturity
0%
100%
200%
300%
400%
500%
0
50
100
150
200
250
2009 2010 2011 2012 2013 2014 2015 2016 2017e 2018e 2019e 2020e 2021e
EU
R m
Net Debt + Pension Provisions Gearing, %

Schaltbau Holding AG
Page 23
Upcoming Corporate Events Calendar
16 April 2018: Annual Report Publication FY 2017
08 May 2018: Q1 18 report
07 June 2018: AGM FY 2017
08 August 2018: H1/Q2 18 report
18 – 21 September 2018: InnoTrans fair, Berlin
08 November 2018: 9M/Q3 18 report
Source: Company data
Date Event Type Description Period

Schaltbau Holding AG
Page 24
Schaltbau Holding AG : Summary tables
PROFIT & LOSS (EURm) 12/2014 12/2015 12/2016 12/2017e 12/2018e 12/2019e
Sales 430 502 509 518 486 502
Cost of Sales & Operating Costs -391 -456 -493 -477 -459 -464
Non Recurrent Expenses/Income 0.0 0.0 0.0 -25.0 0.0 0.0
EBITDA 38.3 46.5 16.3 15.8 26.5 38.5
EBITDA (adj.)* 38.3 46.5 16.3 40.8 26.5 38.5
Depreciation -11.0 -13.1 -30.8 -38.0 -11.5 -9.5
EBITA 27.3 33.4 -14.5 -22.2 15.0 29.0
EBITA (adj)* 27.3 33.4 -14.5 2.8 15.0 29.0
Amortisations and Write Downs 0.0 0.0 0.0 0.0 0.0 0.0
of which PPA amortisation 0.0 0.0 0.0 0.0 0.0 0.0
EBIT 27.3 33.4 -14.5 -22.2 15.0 29.0
EBIT (adj.)* 27.3 33.4 -14.5 2.8 15.0 29.0
Net Financial Interest -4.3 -5.4 -5.2 -7.9 -7.1 -7.0
Other Financials 0.0 0.0 0.0 0.0 0.0 0.0
Associates 12.2 2.1 3.9 -0.1 0.2 0.2
Other Non Recurrent Items 0.0 0.0 0.0 0.0 0.0 0.0
Earnings Before Tax (EBT) 35.2 30.1 -15.8 -30.2 8.1 22.2
Tax -6.1 -7.7 3.8 -9.1 -2.4 -6.7
Tax rate 17.3% 25.6% 24.0% n.m. 30.0% 30.0%
Discontinued Operations 0.0 0.0 0.0 0.0 0.0 0.0
Minorities -4.3 -5.6 -3.8 -2.0 -2.0 -2.0
Net Profit (reported) 24.8 16.8 -15.8 -41.2 3.6 13.5
Net Profit (adj.) 24.8 16.8 -15.8 -23.7 3.6 13.5
CASH FLOW (EURm) 12/2014 12/2015 12/2016 12/2017e 12/2018e 12/2019e
Cash Flow from Operations before change in NWC 47.2 58.7 36.7 -13.4 12.4 33.9
Change in Net Working Capital -20.7 -29.3 -10.9 4.5 -3.0 -2.2
Cash Flow from Operations 26.5 29.4 25.8 -8.9 9.4 31.7
Capex -29.0 -35.7 -20.0 -14.5 -9.0 -9.0
Net Financial Investments -9.4 -13.3 1.8 7.7 28.4 -1.3
Free Cash Flow -11.9 -19.6 7.6 -15.7 28.8 21.4
Dividends -5.9 -6.0 -6.0 0.0 0.0 0.0
Other (incl. Capital Increase & share buy backs) 0.0 0.0 0.0 0.0 0.0 0.0
Change in Net Debt -17.8 -25.6 1.6 -15.7 28.8 21.4
NOPLAT 19.1 23.4 -10.2 2.0 10.5 20.3
BALANCE SHEET & OTHER ITEMS (EURm) 12/2014 12/2015 12/2016 12/2017e 12/2018e 12/2019e
Net Tangible Assets 68.7 77.3 88.4 86.9 52.6 50.6
Net Intangible Assets (incl.Goodwill) 52.4 82.9 83.7 58.7 59.2 60.2
Net Financial Assets & Other 28.0 30.2 22.6 17.9 20.8 22.6
Total Fixed Assets 149 190 195 164 133 133
Inventories 85.6 91.3 101 111 113 115
Trade receivables 80.3 111 115 104 106 107
Other current assets 20.5 20.5 17.8 20.9 29.1 29.5
Cash (-) -25.7 -32.4 -30.0 -15.8 -33.5 -46.9
Total Current Assets 212 255 264 251 281 298
Total Assets 361 446 459 414 414 432
Shareholders Equity 93.3 91.4 73.7 48.0 101 115
Minority 19.2 33.4 33.4 33.4 33.4 33.4
Total Equity 113 125 107 81.4 134 148
Long term interest bearing debt 95.4 151 166 159 106 103
Provisions 43.5 41.8 59.7 58.5 55.4 55.8
Other long term liabilities 9.0 15.1 8.1 6.3 6.4 6.5
Total Long Term Liabilities 148 208 234 224 167 166
Short term interest bearing debt 10.0 11.0 12.0 13.0 14.0 15.0
Trade payables 31.5 38.8 42.0 44.1 45.4 46.6
Other current liabilities 59.3 63.2 64.2 52.0 52.5 56.3
Total Current Liabilities 101 113 118 109 112 118
Total Liabilities and Shareholders' Equity 361 446 459 414 414 432
Net Capital Employed 245 311 323 303 282 282
Net Working Capital 134 164 175 170 173 175
GROWTH & MARGINS 12/2014 12/2015 12/2016 12/2017e 12/2018e 12/2019e
Sales growth 10.0% 16.9% 1.4% 1.7% -6.2% 3.4%
EBITDA (adj.)* growth -13.3% 21.3% -64.9% 150.6% -35.2% 45.4%
EBITA (adj.)* growth -24.1% 22.2% n.m. n.m. 427.3% 93.5%
EBIT (adj)*growth -24.1% 22.2% n.m. n.m. 427.3% 93.5%

Schaltbau Holding AG
Page 25
Schaltbau Holding AG : Summary tables
GROWTH & MARGINS 12/2014 12/2015 12/2016 12/2017e 12/2018e 12/2019e
Net Profit growth 16.1% -32.4% n.m. n.m. n.m. 271.3%
EPS adj. growth 22.5% -32.4% n.m. n.m. n.m. 271.3%
DPS adj. growth 134.1% 0.0% n.m.
EBITDA (adj)* margin 8.9% 9.3% 3.2% 7.9% 5.5% 7.7%
EBITA (adj)* margin 6.4% 6.6% -2.8% 0.5% 3.1% 5.8%
EBIT (adj)* margin 6.4% 6.6% n.m. 0.5% 3.1% 5.8%
RATIOS 12/2014 12/2015 12/2016 12/2017e 12/2018e 12/2019e
Net Debt/Equity 0.7 1.0 1.4 1.9 0.6 0.5
Net Debt/EBITDA 2.1 2.8 9.1 9.9 3.2 1.9
Interest cover (EBITDA/Fin.interest) 8.9 8.6 3.1 2.0 3.7 5.5
Capex/D&A 263.6% 272.5% 64.9% 38.2% 78.3% 94.7%
Capex/Sales 6.8% 7.1% 3.9% 2.8% 1.9% 1.8%
NWC/Sales 31.3% 32.6% 34.3% 32.9% 35.6% 34.9%
ROE (average) 28.8% 18.2% -19.1% -39.0% 4.9% 12.6%
ROCE (adj.) 7.5% 7.2% -2.9% 0.6% 3.7% 7.1%
WACC 7.3% 7.3% 7.3% 7.3% 7.3% 7.3%
ROCE (adj.)/WACC 1.0 1.0 -0.4 0.1 0.5 1.0
PER SHARE DATA (EUR)*** 12/2014 12/2015 12/2016 12/2017e 12/2018e 12/2019e
Average diluted number of shares 6.2 6.2 6.2 6.6 8.9 8.9
EPS (reported) 4.03 2.73 -2.57 -6.24 0.41 1.53
EPS (adj.) 4.03 2.73 -2.57 -3.59 0.41 1.53
BVPS 15.17 14.86 11.98 7.27 11.41 12.94
DPS 1.00 1.00 0.00 0.00 0.00 0.00
VALUATION 12/2014 12/2015 12/2016 12/2017e 12/2018e 12/2019e
EV/Sales 0.9 1.0 0.8 0.8 0.8 0.8
EV/EBITDA 10.4 11.0 25.6 26.1 15.2 10.1
EV/EBITDA (adj.)* 10.4 11.0 25.6 10.1 15.2 10.1
EV/EBITA 14.6 15.4 -28.7 -18.6 26.8 13.4
EV/EBITA (adj.)* 14.6 15.4 -28.7 145.3 26.8 13.4
EV/EBIT 14.6 15.4 n.m. n.m. 26.8 13.4
EV/EBIT (adj.)* 14.6 15.4 n.m. n.m. 26.8 13.4
P/E (adj.) 9.9 17.7 n.m. n.m. n.m. 16.9
P/BV 2.6 3.2 2.4 3.5 2.3 2.0
Total Yield Ratio 2.5% 2.0% 0.0% 0.0% 0.0% 0.0%
EV/CE 1.6 1.6 1.2 1.3 1.4 1.4
OpFCF yield -1.0% -2.1% 3.2% -13.9% 0.2% 9.9%
OpFCF/EV -0.6% -1.2% 1.4% -5.7% 0.1% 5.9%
Payout ratio 24.8% 36.7% 0.0% 0.0% 0.0% 0.0%
Dividend yield (gross) 2.5% 2.1% 0.0% 0.0% 0.0% 0.0%
EV AND MKT CAP (EURm) 12/2014 12/2015 12/2016 12/2017e 12/2018e 12/2019e
Price** (EUR) 39.79 48.23 29.09 25.47 25.80 25.80
Outstanding number of shares for main stock 6.2 6.2 6.2 6.6 8.9 8.9
Total Market Cap 245 297 179 168 228 228
Net Debt 80 130 148 156 86 72
o/w Cash & Marketable Securities (-) -26 -32 -30 -16 -34 -47
o/w Gross Debt (+) 105 162 178 172 120 118
Other EV components 74 87 90 88 87 88
Enterprise Value (EV adj.) 399 513 417 413 402 388
Source: Company, equinet Bank estimates.
Notes* Where EBITDA (adj.) or EBITA (adj)= EBITDA (or EBITA) -/+ Non Recurrent Expenses/Income and where EBIT (adj)= EBIT-/+ Non Recurrent Expenses/Income - PPA amortisation
**Price (in local currency): Fiscal year end price for Historical Years and Current Price for current and forecasted years
Sector: Industrial Engineering/Industrial Machinery
Company Description: The foundation of the Schaltbau group dates back to 1929 when the company produces rail switchgears and
heaters. 1992 the group was acquired by Berliner Elektro AG and converted into a stock company. Today the group is a leading supplier
in the field rolling stock, rail infrastructure, automotive and capital goods industry in its relevant markets. After some difficult years in
2017 a new management started a restructuring process.
Schaltbau Holding AG
Page 26
European Coverage of the Members of ESN
A ero space & D efense M em(*) Banco Sabadell GVC Air Liquide CIC Wendel CIC
Airbus Se CIC Banco Santander GVC Avantium NIBC F o o d & B everage M em(*)
Dassault Aviation CIC Bankia GVC Brenntag EQB Acomo NIBC
Latecoere CIC Bankinter GVC Fuchs Petro lub EQB Atria OPG
Leonardo BAK Bbva GVC Holland Colours NIBC Bonduelle CIC
Lisi CIC Bcp CBI K+S Ag EQB Campari BAK
M tu Aero Engines EQB Bnp Paribas CIC Kemira OPG Coca Cola Hbc Ag IBG
Ohb Se EQB Bper BAK Kws Saat EQB Corbion NIBC
Rheinmetall EQB Bpi CBI Linde EQB Danone CIC
Safran CIC Caixabank GVC Siegfried Holding Ag EQB Ebro Foods GVC
Thales CIC Commerzbank EQB Symrise Ag EQB Enervit BAK
Zodiac Aerospace CIC Credem BAK Tikkurila OPG Fleury M ichon CIC
A lternat ive Energy M em(*) Credit Agrico le Sa CICElectro nic & Electrical
EquipmentM em(*) Forfarmers NIBC
Daldrup & Soehne EQB Creval BAK Euromicron Ag EQB Heineken NIBC
Siemens Gamesa Re GVC Deutsche Bank EQB Neways Electronics NIBC Hkscan OPG
Sif Group NIBC Deutsche Pfandbriefbank EQB Pkc Group OPG La Doria BAK
Solaria GVC Eurobank IBG Rexel CIC Lanson-Bcc CIC
A uto mo biles & P arts M em(*) Intesa Sanpaolo BAK Vaisala OPG Laurent Perrier CIC
Bittium Corporation OPG Liberbank GVC Viscom EQB Ldc CIC
Bmw EQB M ediobanca BAK F inancial Services M em(*) Lucas Bols NIBC
Brembo BAK M erkur Bank EQB Amundi CIC M assimo Zanetti BAK
Continental EQB National Bank Of Greece IBG Anima BAK Naturex CIC
Daimler Ag EQB Natixis CIC Athex Group IBG Olvi OPG
Elringklinger EQB Nordea OPG Azimut BAK Orsero BAK
Faurecia CIC Piraeus Bank IBG Banca Farmafactoring BAK Pernod Ricard CIC
Ferrari BAK Poste Italiane BAK Banca Generali BAK Raisio OPG
Fiat Chrysler Automobiles BAK Procredit Holding EQB Banca Ifis BAK Refresco Group NIBC
Groupe Psa CIC Rothschild & Co CIC Banca Sistema BAK Remy Cointreau CIC
Hella Gmbh & Co. Kgaa EQB Societe Generale CIC Bb Biotech EQB Suedzucker EQB
Indelb BAK Ubi Banca BAK Bolsas Y M ercados Espanoles Sa GVC Telepizza GVC
Kamux OPG Unicredit BAK Capman OPG Vapiano EQB
Landi Renzo BAK B asic R eso urces M em(*) Cir BAK Vidrala GVC
Leoni EQB Acerinox GVC Comdirect EQB Vilmorin CIC
M ichelin CIC Altri CBI Corestate Capital Holding S.A. EQB Viscofan GVC
Nokian Tyres OPG Arcelormittal GVC Corp. Financiera Alba GVC Vranken Pommery M onopole CIC
Norma Group EQB Corticeira Amorim CBI Digital M agics BAK Wessanen NIBC
Piaggio BAK Ence GVC Dobank BAK F o o d & D rug R etailers M em(*)
Plastic Omnium CIC Europac GVC Eq OPG Ahold Delhaize NIBC
Pwo EQB M etka IBG Eurazeo CIC Carrefour CIC
Sogefi BAK M etsä Board OPG Ferratum EQB Casino Guichard-Perrachon CIC
Stabilus EQB M ytilineos IBG Ffp CIC Ceconomy Ag EQB
Stern Groep NIBC Outokumpu OPG Finecobank BAK Dia GVC
Valeo CIC Semapa CBI Grenke EQB Jeronimo M artins CBI
Volkswagen EQB Ssab OPG Hypoport Ag EQB Kesko OPG
B anks M em(*) Stora Enso OPG M lp EQB M arr BAK
Aareal Bank EQB Surteco EQB Ovb Holding Ag EQB M etro Ag EQB
Aktia OPG The Navigator Company CBI Patrizia EQB Sligro NIBC
Alpha Bank IBG Tubacex GVC Rallye CIC Sonae CBI
Banca Carige BAK Upm-Kymmene OPG Tip Tamburi Investment Partners BAK
Banca M ps BAK C hemicals M em(*) Unipol Gruppo Finanziario BAK

Schaltbau Holding AG
Page 27
General Industria ls M em(*) Orpea CIC Wärtsilä OPG Srv OPG
2G Energy EQB Pihlajalinna OPG Zardoya Otis GVC Tarkett CIC
Aalberts NIBC Recordati BAK Industria l T ranspo rtat io n M em(*) Thermador Groupe CIC
Accell Group NIBC Silmaasema OPG Bollore CIC Titan Cement IBG
Ahlstrom OPG Terveystalo OPG Ctt CBI Trevi BAK
Arcadis NIBC H o useho ld Go o ds M em(*) Logwin EQB Uponor OPG
Aspo OPG De Longhi BAK Insurance M em(*) Vicat CIC
Cembre BAK Elica BAK Allianz EQB Vinci CIC
Huhtamäki OPG Fila BAK Axa CIC Yit OPG
Kendrion NIBC M aisons Du M onde CIC Banca M edio lanum BAK M edia M em(*)
Nedap NIBC Philips Lighting NIBC Catto lica Assicurazioni BAK Alma M edia OPG
Pöyry OPG Industria l Engineering M em(*) Generali BAK Arnoldo M ondadori Editore BAK
Prelios BAK Accsys Technologies NIBC Hannover Re EQB Atresmedia GVC
Saf-Holland EQB Aixtron EQB M apfre Sa GVC Axel Springer EQB
Serge Ferrari Group CIC Alstom CIC M unich Re EQB Brill NIBC
Tkh Group NIBC Ansaldo Sts BAK Sampo OPG Cairo Communication BAK
General R etailers M em(*) Biesse BAK Talanx Group EQB Cofina CBI
Beter Bed Holding NIBC Caf GVC Unipolsai BAK Cts Eventim EQB
Elumeo Se EQB Cargotec Corp OPGM aterials, C o nstruct io n &
InfrastructureM em(*) Digital Bros BAK
Fielmann EQB Carraro BAK Abertis GVC Gedi Gruppo Editoriale BAK
Fnac Darty CIC Cnh Industrial BAK Acs GVC Gl Events CIC
Folli Fo llie Group IBG Danieli BAK Aena GVC Havas CIC
Fourlis Holdings IBG Datalogic BAK Aeroports De Paris CIC Impresa CBI
Hornbach Holding EQB Deutz Ag EQB Astaldi BAK Io l BAK
Inditex GVC Duro Felguera GVC Atlantia BAK Ipsos CIC
Jumbo IBG Emak BAK Boskalis Westminster NIBC Jcdecaux CIC
Ovs BAK Envipco NIBC Buzzi Unicem BAK Lagardere CIC
Rapala OPG Exel Composites OPG Caverion OPG M 6-M etropole Television CIC
Stockmann OPG Fincantieri BAK Cramo OPG M ediaset BAK
Takkt Ag EQB Gesco EQB Eiffage CIC M ediaset Espana GVC
Tokmanni OPG Heidelberger Druck EQB Ellaktor IBG Notorious Pictures BAK
Unieuro BAK Ima BAK Eltel OPG Nrj Group CIC
Windeln.De EQB Indus Holding Ag EQB Ezentis GVC Publicis CIC
Yoox Net-A-Porter BAK Interpump BAK Fcc GVC Rcs M ediagroup BAK
Zalando EQB Kone OPG Ferrovial GVC Relx NIBC
H ealthcare M em(*) Konecranes OPG Heidelberg Cement Ag CIC Rtl Group EQB
4Sc EQB M anitou CIC Heijmans NIBC Sanoma OPG
Amplifon BAK M anz Ag EQB Imerys CIC Solocal Group CIC
Bayer EQB M ax Automation Ag EQB Lafargeholcim CIC Spir Communication CIC
Biotest EQB M etso Corporation OPG Lehto OPG Syzygy Ag EQB
Diasorin BAK Outotec OPG Lemminkäinen OPG Telegraaf M edia Groep NIBC
El.En. BAK Pfeiffer Vacuum EQB M aire Tecnimont BAK Teleperformance CIC
Epigenomics Ag EQB Ponsse OPG M ota Engil CBI Tf1 CIC
Genfit CIC Prima Industrie BAK Obrascon Huarte Lain GVC Ubisoft CIC
Guerbet CIC Prysmian BAK Ramirent OPG Vivendi CIC
Heidelberg Pharma EQB Smt Scharf Ag EQB Royal Bam Group NIBC Wolters Kluwer NIBC
Korian CIC Talgo GVC Sacyr GVC Xing Ag EQB
M erck EQB Technotrans EQB Saint Gobain CIC
Orio la-Kd OPG Valmet OPG Salini Impregilo BAK
Orion OPG Wacker Neuson Se EQB Sias BAK

Schaltbau Holding AG
Page 28
Oil & Gas P ro ducers M em(*) Realia GVC Asml NIBC Intralo t IBG
Eni BAK Sponda OPG Besi NIBC Kotipizza OPG
Galp Energia CBI Technopolis OPG Ericsson OPG M elia Hotels International GVC
Gas Plus BAK Wcm Ag EQB Gigaset EQB Nh Hotel Group GVC
Hellenic Petro leum IBG So ftware & C o mputer Services M em(*) Nokia OPG Opap IBG
M aurel Et Prom CIC Affecto OPG Roodmicrotec NIBC Snaitech BAK
M otor Oil IBG Akka Technologies CIC S&T Ag EQB Snowworld NIBC
Neste Corporation OPG Alten CIC Slm Solutions EQB Sodexo CIC
Qgep CBI Altran CIC Stmicroelectronics BAK Sonae Capital CBI
Repsol GVC Assystem CIC Suess M icrotec EQB Trigano CIC
Total CIC Atos CIC Teleste OPG Utilit ies M em(*)
Oil Services M em(*) Basware OPG Va-Q-Tec EQB A2A BAK
Bourbon CIC Comptel OPG T eleco mmunicat io ns M em(*) Acciona GVC
Cgg CIC Ctac NIBC Acotel BAK Acea BAK
Fugro NIBC Digia Plc OPG Bouygues CIC Albioma CIC
Rubis CIC Econocom CIC Deutsche Telekom EQB Direct Energie CIC
Saipem BAK Esi Group CIC Dna OPG Edp CBI
Sbm Offshore NIBC Exprivia BAK Drillisch EQB Edp Renováveis CBI
Technipfmc Plc CIC F-Secure OPG Elisa OPG Enagas GVC
Tecnicas Reunidas GVC Gft Technologies EQB Euskaltel GVC Endesa GVC
Tenaris BAK Ict Group NIBC Freenet EQB Enel BAK
Vallourec CIC Indra Sistemas GVC Iliad CIC Erg BAK
Vopak NIBC Nemetschek Se EQB Kpn Telecom NIBC Eydap IBG
P erso nal Go o ds M em(*) Neurones CIC M asmovil GVC Falck Renewables BAK
Adidas EQB Nexus Ag EQB Nos CBI Fortum OPG
Adler M odemaerkte EQB Novabase CBI Oi CBI Gas Natural Fenosa GVC
Amer Sports OPG Ordina NIBC Orange CIC Hera BAK
Basic Net BAK Psi Software Ag EQB Ote IBG Iberdro la GVC
Geox BAK Reply BAK Retelit BAK Iren BAK
Gerry Weber EQB Rib Software EQB Tele Columbus EQB Italgas BAK
Hugo Boss EQB Rovio Entertainment OPG Telecom Italia BAK Public Power Corp IBG
Luxottica BAK Seven Principles Ag EQB Telefonica GVC Red Electrica De Espana GVC
M arimekko OPG Software Ag EQB Telefonica Deutschland EQB Ren CBI
M oncler BAK Sopra Steria Group CIC Telia OPG Snam BAK
Puma EQB Tie Kinetix NIBC Tiscali BAK Terna BAK
Safilo BAK Tieto OPG United Internet EQB
Salvatore Ferragamo BAK Tomtom NIBC Vodafone BAK
Sarantis IBG Suppo rt Services M em(*) T ravel & Leisure M em(*)
Technogym BAK Amadeus GVC Accor CIC
Tod'S BAK Asiakastieto Group OPG Aegean Airlines IBG
R eal Estate M em(*) Batenburg NIBC Air France Klm CIC
Adler Real Estate EQB Cellnex Telecom GVC Autogrill BAK
Beni Stabili BAK Dpa NIBC Beneteau CIC
Citycon OPG Ei Towers BAK Compagnie Des Alpes CIC
Demire EQB Enav BAK Elior CIC
Deutsche Euroshop EQB Fiera M ilano BAK Europcar CIC
Hispania Activos Inmobiliarios GVC Lassila & Tikanoja OPG Finnair OPG
Igd BAK Openjobmetis BAK I Grandi Viaggi BAK
Lar España GVCT echno lo gy H ardware &
EquipmentM em(*) Iberso l CBI
M erlin Properties GVC Asm International NIBC Int. A irlines Group GVC
LEGEND: BAK: Banca Akros; CIC: CM CIC Market Solutions; CBI: Caixa-Banco de Investimento; GVC: GVC Gaesco Beksa, SV, SA; EQB: equinet bank; IBG: Investment Bank of Greece, NIBC: NIBC Bank N.V: OPG: OP Corporate Bank:;as of 1
st December 2017

Schaltbau Holding AG
Page 29
List of ESN Analysts (**)
Artur Amaro CBI +351 213 89 6822 [email protected] Jean-Christophe Lefèvre-Moulenq CIC +33 1 53 48 80 65 [email protected]
Stefan Augustin EQB +49-69-58997-430 [email protected] Konstantinos Manolopoulos IBG +30 210 817 3388 [email protected]
Helena Barbosa CBI +351 21 389 6831 [email protected] Katharina Mayer EQB +49 69 58997-432 [email protected]
Winfried Becker EQB +49 69 58997-416 [email protected] Fanny Meindre, PhD CIC +33 1 53 48 80 84 [email protected]
Jav ier Bernat GVC +34 91 436 7816 jav [email protected] Dario Michi BAK +39 02 4344 4237 [email protected]
Dimitris Birbos IBG +30 210 81 73 392 [email protected] Marietta Miemietz CFA EQB +49-69-58997-439 [email protected]
Agnès Blazy CIC +33 1 53 48 80 67 [email protected] Henri Parkkinen OPG +358 10 252 4409 [email protected]
Charles Edouard Boissy CIC +33 01 53 48 80 81 [email protected] Victor Peiro Pérez GVC +34 91 436 7812 [email protected]
Rafael Bonardell GVC +34 91 436 78 71 [email protected] Alexandre Plaud CIC +33 1 53 48 80 90 [email protected]
Andrea Bonfà BAK +39 02 4344 4269 [email protected] Francis Prêtre CIC +33 4 78 92 02 30 [email protected]
Jean-Baptiste Bouchet CIC +33 1 53 48 80 69 [email protected] Francesco Previtera BAK +39 02 4344 4033 francesco.prev [email protected]
Louise Boyer CIC +33 1 53 48 80 68 [email protected] Jari Raisanen OPG +358 10 252 4504 [email protected]
Christian Bruns EQB +49 69 58997 415 [email protected] Hannu Rauhala OPG +358 10 252 4392 [email protected]
Giada Cabrino, CIIA BAK +39 02 4344 4092 [email protected] Matias Rautionmaa OPG +358 10 252 4408 [email protected]
Niclas Catani OPG +358 10 252 8780 [email protected] Eric Ravary CIC +33 1 53 48 80 71 [email protected]
Pierre Chedeville CIC +33 1 53 48 80 97 [email protected] Iñigo Recio Pascual GVC +34 91 436 7814 [email protected]
Emmanuel Chevalier CIC +33 1 53 48 80 72 [email protected] André Rodrigues CBI +351 21 389 68 39 [email protected]
David Consalvo CIC +33 1 53 48 80 64 [email protected] John David Roeg NIBC +31 (0)20 550 86 46 [email protected]
Edwin de Jong NIBC +312 0 5508569 [email protected] Jean-Luc Romain CIC +33 1 53 48 80 66 [email protected]
Martijn den Drijver NIBC +312 0 5508636 [email protected] Vassilis Roumantzis IBG +30 2108173394 [email protected]
Christian Devismes CIC +33 1 53 48 80 85 [email protected] Zafer Rüzgar EQB +49 69 58 99 74 12 [email protected]
Andrea Devita, CFA BAK +39 02 4344 4031 [email protected] Antti Saari OPG +358 10 252 4359 [email protected]
Sebastian Droste EQB +49 69 58 99 74 34 [email protected] Paola Saglietti BAK +39 02 4344 4287 [email protected]
Enrico Esposti, CIIA BAK +39 02 4344 4022 [email protected] Francesco Sala BAK +39 02 4344 4240 [email protected]
Rafael Fernández de Heredia GVC +34 91 436 78 08 [email protected] Tim Schuldt, CFA EQB +49 69 5899 7433 [email protected]
Gabriele Gambarova BAK +39 02 43 444 289 [email protected] Cengiz Sen EQB +4969 58997 435 [email protected]
Eduardo Garcia Arguelles GVC +34 914 367 810 [email protected] Pekka Spolander OPG +358 10 252 4351 [email protected]
Philipp Häßler, CFA EQB +49 69 58997 414 [email protected] Kimmo Stenvall OPG +358 10 252 4561 [email protected]
Simon Heilmann EQB +49 69 58 997 413 [email protected] Natalia Svyrou-Svyriadi IBG +30 210 81 73 384 [email protected]
Dr. Knud Hinkel, CFA EQB + 49 69 58997 419 [email protected] Manuel Tanzer EQB +49 69 58997-418 [email protected]
Carlos Jesus CBI +351 21 389 6812 [email protected] Luigi Tramontana BAK +39 02 4344 4239 [email protected]
Mark Josefson EQB +4969-58997-437 [email protected] Johan van den Hooven NIBC +312 0 5508518 [email protected]
Thomas Landemaine, PhD CIC +33 1 53 48 80 26 [email protected] Dylan van Haaften NIBC +312 0 611915485 [email protected]
(**) excluding: strategists, macroeconomists, heads of research not covering specific stocks, credit analysts, technical analysts
Schaltbau Holding AG
Page 30
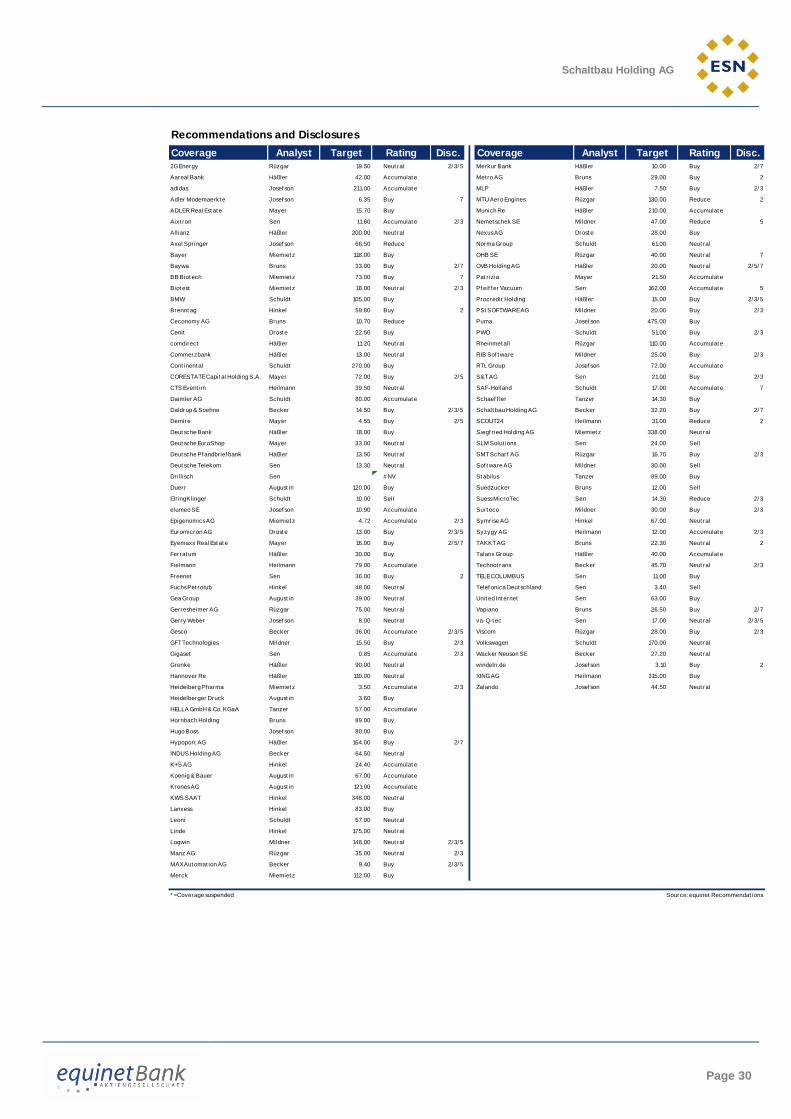
Recommendations and Disclosures
Coverage Analyst Target Rating Disc. Coverage Analyst Target Rating Disc.2G Energy Rüzgar 19.50 Neut ral 2/ 3/ 5 Merkur Bank Häßler 10.00 Buy 2/ 7
Aareal Bank Häßler 42.00 Accumulat e Met ro AG Bruns 29.00 Buy 2
adidas Josef son 211.00 Accumulat e MLP Häßler 7.50 Buy 2/ 3
Adler Modemaerkt e Josef son 6.35 Buy 7 MTU Aero Engines Rüzgar 130.00 Reduce 2
ADLER Real Est at e Mayer 15.70 Buy Munich Re Häßler 210.00 Accumulat e
Aixt ron Sen 11.60 Accumulat e 2/ 3 Nemet schek SE Mildner 47.00 Reduce 5
Allianz Häßler 200.00 Neut ral Nexus AG Drost e 28.00 Buy
Axel Springer Josef son 66.50 Reduce Norma Group Schuldt 61.00 Neut ral
Bayer Miemiet z 118.00 Buy OHB SE Rüzgar 40.00 Neut ral 7
Baywa Bruns 33.00 Buy 2/ 7 OVB Holding AG Häßler 20.00 Neut ral 2/ 5/ 7
BB Biot ech Miemiet z 73.00 Buy 7 Pat r izia Mayer 21.50 Accumulat e
Biot est Miemiet z 18.00 Neut ral 2/ 3 Pf eif f er Vacuum Sen 162.00 Accumulat e 5
BMW Schuldt 105.00 Buy Procredit Holding Häßler 15.00 Buy 2/ 3/ 5
Brennt ag Hinkel 59.80 Buy 2 PSI SOFTWARE AG Mildner 20.00 Buy 2/ 3
Ceconomy AG Bruns 10.70 Reduce Puma Josef son 475.00 Buy
Cenit Drost e 22.50 Buy PWO Schuldt 51.00 Buy 2/ 3
comdirect Häßler 11.20 Neut ral Rheinmet all Rüzgar 110.00 Accumulat e
Commerzbank Häßler 13.00 Neut ral RIB Sof t ware Mildner 25.00 Buy 2/ 3
Cont inent al Schuldt 270.00 Buy RTL Group Josef son 72.00 Accumulat e
CORESTATE Capit al Holding S.A. Mayer 72.00 Buy 2/ 5 S&T AG Sen 21.00 Buy 2/ 3
CTS Event im Heilmann 39.50 Neut ral SAF-Holland Schuldt 17.00 Accumulat e 7
Daimler AG Schuldt 80.00 Accumulat e Schaef f ler Tanzer 14.30 Buy
Daldrup & Soehne Becker 14.50 Buy 2/ 3/ 5 Schalt bau Holding AG Becker 32.20 Buy 2/ 7
Demire Mayer 4.55 Buy 2/ 5 SCOUT24 Heilmann 31.00 Reduce 2
Deut sche Bank Häßler 18.00 Buy Siegf r ied Holding AG Miemiet z 338.00 Neut ral
Deut sche EuroShop Mayer 33.00 Neut ral SLM Solut ions Sen 24.00 Sell
Deut sche Pf andbrief bank Häßler 13.50 Neut ral SMT Scharf AG Rüzgar 16.70 Buy 2/ 3
Deut sche Telekom Sen 13.30 Neut ral Sof t ware AG Mildner 30.00 Sell
Drillisch Sen # NV St abilus Tanzer 89.00 Buy
Duerr August in 120.00 Buy Suedzucker Bruns 12.00 Sell
Elr ingKlinger Schuldt 10.00 Sell Suess MicroTec Sen 14.30 Reduce 2/ 3
elumeo SE Josef son 10.90 Accumulat e Surt eco Mildner 30.00 Buy 2/ 3
Epigenomics AG Miemiet z 4.72 Accumulat e 2/ 3 Symrise AG Hinkel 67.00 Neut ral
Euromicron AG Drost e 13.00 Buy 2/ 3/ 5 Syzygy AG Heilmann 12.00 Accumulat e 2/ 3
Eyemaxx Real Est at e Mayer 16.00 Buy 2/ 5/ 7 TAKKT AG Bruns 22.30 Neut ral 2
Ferrat um Häßler 30.00 Buy Talanx Group Häßler 40.00 Accumulat e
Fielmann Heilmann 79.00 Accumulat e Technot rans Becker 45.70 Neut ral 2/ 3
Freenet Sen 36.00 Buy 2 TELE COLUMBUS Sen 11.00 Buy
Fuchs Pet rolub Hinkel 48.00 Neut ral Telef onica Deut schland Sen 3.40 Sell
Gea Group August in 39.00 Neut ral Unit ed Int ernet Sen 63.00 Buy
Gerresheimer AG Rüzgar 75.00 Neut ral Vapiano Bruns 26.50 Buy 2/ 7
Gerry Weber Josef son 8.00 Neut ral va-Q-t ec Sen 17.00 Neut ral 2/ 3/ 5
Gesco Becker 36.00 Accumulat e 2/ 3/ 5 Viscom Rüzgar 28.00 Buy 2/ 3
GFT Technologies Mildner 15.50 Buy 2/ 3 Volkswagen Schuldt 170.00 Neut ral
Gigaset Sen 0.85 Accumulat e 2/ 3 Wacker Neuson SE Becker 27.20 Neut ral
Grenke Häßler 90.00 Neut ral windeln.de Josef son 3.10 Buy 2
Hannover Re Häßler 110.00 Neut ral XING AG Heilmann 315.00 Buy
Heidelberg Pharma Miemiet z 3.50 Accumulat e 2/ 3 Zalando Josef son 44.50 Neut ral
Heidelberger Druck August in 3.60 Buy
HELLA GmbH & Co. KGaA Tanzer 57.00 Accumulat e
Hornbach Holding Bruns 89.00 Buy
Hugo Boss Josef son 80.00 Buy
Hypoport AG Häßler 164.00 Buy 2/ 7
INDUS Holding AG Becker 64.50 Neut ral
K+S AG Hinkel 24.40 Accumulat e
Koenig & Bauer August in 67.00 Accumulat e
Krones AG August in 121.00 Accumulat e
KWS SAAT Hinkel 348.00 Neut ral
Lanxess Hinkel 83.00 Buy
Leoni Schuldt 57.00 Neut ral
Linde Hinkel 175.00 Neut ral
Logwin Mildner 148.00 Neut ral 2/ 3/ 5
Manz AG Rüzgar 35.00 Neut ral 2/ 3
MAX Aut omat ion AG Becker 9.40 Buy 2/ 3/ 5
Merck Miemiet z 112.00 Buy
* = Coverage suspended Source: equinet Recommendat ions
Schaltbau Holding AG
Page 31
Notice according to § 34 b (German) Securities Trading Act (“Wertpapierhandelsgesetz”) This document is issued by Equinet Bank AG (“Equinet Bank”). It has been prepared by its authors independently of the Company, and none of Equinet Bank, the Company or its shareholders has independently verified any of the information given in this document. Equinet Bank possesses relations to the covered companies as detailed in the table on the previous page. Additional information and disclosures will be made available upon request and/or can be looked up on our website http://www.Equinet Bank-ag.de 1 - Equinet Bank and/or its affiliate(s) hold(s) more than 5% of the share capital of this company calculated under computational methods required by German law. 2 - Equinet Bank acts as a designated sponsor for this company, including the provision of bid and ask offers. Therefore, we regularly possess shares of the company in our proprietary trading books. Equinet Bank receives a commission from the company for the provision of the designated sponsor services. 3 – The designated sponsor services include a contractually agreed provision of research services. 4 – Within the last twelve months, Equinet Bank was involved as a lead or co-lead manager in the public offering of securities which are/whose issuer is the subject of this report. 5 – Within the last twelve months, Equinet Bank and/or its affiliate(s) provided investment banking- and/or other consultancy services for this company and/or it’s shareholders. 6 - Equinet Bank and/or its affiliate(s) has/have other substantial financial interests in relation to this issuer. 7 – Equinet Bank has entered into an agreement with this company about the preparation of research reports and – in return - receives a compensation. Companies of the Equinet Bank group and/or its directors, officers and employees or clients may take positions in, and may make purchases and/or sales as principal or agent in the securities or related financial instruments discussed in our reports. The Equinet Bank group may provide investment banking and other services to and/or serve as directors of the companies referred to in our reports. In compliance with Para 5 Sec. 4 of the Ordinance on the Analysis of Financial Instruments (FinAnV) Equinet Bank has realized additional internal and organizational measures, such as specific research guidelines, to prevent or manage conflicts of interest. Neither the company nor its employees are allowed to receive donations from third parties with a special interest in the content of the analysis. The salary of the research analysts of Equinet Bank AG does not depend on the investment banking transactions of the company. Nevertheless, this does not rule out the payment of a bonus which depends on the overall financial performance of the bank. Particular care is taken that the individual performance of each research analyst of Equinet Bank AG is not being assessed by a manager of another business division with similar or same interests. To assure a highest degree of transparency Equinet Bank AG regularly provides - on a quarterly basis – a summary according to Para 5 Sec. 4 No. 3 of the Ordinance on the Analysis of Financial Instruments (FinAnV). It informs about the overall analysts recommendations and sets them in a relationship to those companies, for which Equinet Bank provided investment banking services within the last twelve months. This summary is published via our website http://www.Equinet Bank-ag.de. Furthermore, we refer to our conflict of interest policy as well as the German Securities Trading Act (WpHG) and the Ordinance on the Analysis of Financial Instruments (FinAnV) provided in the download area of our website http://www.Equinet Bank-ag.de.
Remarks
Recommendation System Buy - The stock is expected to generate a total return of over 20% during the next 12 months time horizon. Accumulate - The stock is expected to generate a total return of 10% to 20% during the next 12 months time horizon. Hold - The stock is expected to generate a total return of 0% to 10% during the next 12 months time horizon Reduce - The stock is expected to generate a total return of 0 to -10% during the next 12 months time horizon Sell - The stock is expected to generate a total return below -10% during the next 12 months time horizon Basis of Valuation
Equinet Bank uses for valuation purposes primarily DCF-Valuations and Sum-Of-The-Parts-Valuations as well as peer group comparisons. Share prices
Share prices in this analysis are the German closing prices of the last trading day before the publication. Sources Equinet Bank has made any effort to carefully research all information contained in the analysis. The information on which the analysis is based has been obtained from sources which we believe to be reliable such as, for example, Reuters, Bloomberg and the relevant press as well as the company which is the subject of the analysis. Only that part of the research note is made available to the issuer, who is the subject of the analysis, which is necessary to properly reconcile with the facts. Should this result in considerable changes a reference is made in the research note. Actualizations Opinions expressed in this analysis are our current opinions as of the issuing date indicated on this document. We do not commit ourselves in advance to whether and in which intervals updates are made.

Schaltbau Holding AG
Page 32
DISCLAIMER
THE PREPARATION OF THIS DOCUMENT IS SUBJECT TO REGULATION BY GERMAN LAW. THIS DOCUMENT IS BEING SUPPLIED TO YOU SOLELY IN YOUR CAPACITY AS A PROFESSIONAL INSTITUTIONAL INVESTOR FOR YOUR INFORMATION AND MAY NOT BE REPRODUCED OR PASSED ON, DIRECTLY OR INDIRECTLY, TO ANY OTHER PERSON OR PUBLISHED, IN WHOLE OR IN PART, FOR ANY PURPOSE. NEITHER THIS DOCUMENT NOR ANY COPY OF IT MAY BE TAKEN OR TRANSMITTED INTO AUSTRALIA, CANADA OR JAPAN OR DISTRIBUTED, DIRECTLY OR INDIRECTLY, IN AUSTRALIA, CANADA OR JAPAN OR TO ANY RESIDENT THEREOF. THE DELIVERY OF THIS RESEARCH REPORT TO U.S. PERSONS IN THE UNITED STATES OF AMERICA IS MADE BY AND UNDER THE RESPONSIBILITY OF GSN NA, INC. (REGISTERED WITH THE SEC). THIS RESEARCH REPORT IS ONLY INTENDED FOR PERSONS WHO QUALIFY AS MAJOR U.S. INSTITUTIONAL INVESTORS, AS DEFINED IN SECURITIES EXCHANGE ACT RULE 15A-6, AND DEAL WITH GSN NA, INC. HOWEVER, THE DELIVERY OF THIS RESEARCH REPORT OR SUMMARY TO ANY U.S. PERSON SHALL NOT BE DEEMED A RECOMMENDATION OF GSN NA, INC. TO EFFECT ANY TRANSACTIONS IN THE SECURITIES DISCUSSED HEREIN OR AN ENDORSEMENT OF ANYOPINION EXPRESSED HEREIN. GSN NA, INC. MAY FURNISH UPON REQUEST ALL INVESTMENT INFORMATION AVAILABLE TO IT SUPPORTING ANY RECOMMENDATIONS MADE IN THIS RESEARCH REPORT. ALL TRADES WITH U.S. RECIPIENTS OF THIS RESEARCH SHALL BE EXECUTED THROUGH GSN NA, INC. THIS DOCUMENT IS FOR DISTRIBUTION IN THE U.K. ONLY TO PERSONS WHO HAVE PROFESSSIONAL EXPERIENCE IN MATTERS RELATING TO INVESTMENTS AND FALL WITHIN ARTICLE 19(5) OF THE FINANCIAL SERVICES AND MARKETS ACT 2000 (FINANCIAL PROMOTION) ORDER 2005 (THE “ORDER”) OR (ii) ARE PERSONS FALLING WITHIN ARTICLE 49(2)(A) TO (D) OF THE ORDER, NAMELY HIGH NET WORTH COMPANIES, UNINCORPORATED ASSOCIATIONS ETC (ALL SUCH PERSONS TOGETHER BEING REFERRED TO AS “RELEVANT PERSONS”). THIS DOCUMENT MUST NOT BE ACTED ON OR RELIED UPON BY PERSONS WHO ARE NOT RELEVANT PERSONS. ANY INVESTMENT OR INVESTMENT ACTIVITY TO WHICH THIS DOCUMENT RELATES IS AVAILABLE ONLY TO RELEVANT PERSONS AND WILL BE ENGAGED IN ONLY WITH RELEVANT PERSONS. THE DISTRIBUTION OF THIS DOCUMENT IN OTHER JURISDICTIONS OR TO RESIDENTS OF OTHER JURISDICTIONS MAY ALSO BE RESTRICTED BY LAW, AND PERSONS INTO WHOSE POSSESSION THIS DOCUMENT COMES SHOULD INFORM THEMSELVES ABOUT, AND OBSERVE, ANY SUCH RESTRICTIONS. BY ACCEPTING THIS REPORT YOU AGREE TO BE BOUND BY THE FOREGOING INSTRUCTIONS. YOU SHALL INDEMNIFY EQUINET BANK AGAINST ANY DAMAGES, CLAIMS, LOSSES, AND DETRIMENTS RESULTING FROM OR IN CONNECTION WITH THE UNAUTHORIZED USE OF THIS DOCUMENT. This report is for informational purposes only and has no regard to the specific investment objectives, financial situation or particular needs of any specific recipient. This publication is intended to provide information to assist institutional investors in making their own investment decisions, not to provide investment advice to any specific investor. Therefore, investments discussed and recommendations made herein may not be suitable for all investors: readers must exercise their own inde-pendent judgment as to the suitability of such investments and recommendations in the light of their own investment objectives, experience, taxation status and financial position. The information herein is believed by Equinet Bank to be reliable and has been obtained from sources believed to be reliable, but Equinet Bank makes no representation as to the accuracy or completeness of such information. The information given in this report is subject to change without notice; it may be incomplete or condensed and it may not contain all material information concerning the Company. Opinions expressed herein may differ or be contrary to opinions expressed by other business areas of the Equinet Bank group as a result of using different assumptions and criteria. Equinet Bank is under no obligation to update or keep the information current. Equinet Bank provides data concerning the future development of securities in the context of its usual research activity. However, if a financial instrument is denominated in a currency other than an investor’s currency, a change in exchange rates may adversely affect the price or value of, or the income derived from, the financial instrument, and such investor effectively assumes currency risk. In addition, income from an investment may fluctuate and the price or value of financial instruments de-scribed in this report, either directly or indirectly, may rise or fall. Furthermore, past performance is not necessarily indicative of future results. Neither the author nor Equinet Bank accepts any liability whatsoever for any loss howsoever arising from any use of this publication or its contents or otherwise arising in connection herewith, except as provided for under applicable regulations. Equinet Bank shall only be liable for any damages intentionally caused or which result from any gross negligence of Equinet Bank. Further Equinet Bank shall be liable for the breach of a material obligation of Equinet Bank, however, limited to the amount of the typical foreseeable which shall in no event exceed the amount of EUR 10,000. German law shall be applicable and court of jurisdiction for all disputes shall be Frankfurt/Main (Germany).
Competent Supervisory Authority: Bundesanstalt für Finanzdienstleistungsaufsicht -BaFin- (Federal Financial Supervisory Authority) Graurheindorfer Straße 108, 53117 Bonn and
Marie-Curie-Str. 24-28, 60439 Frankfurt am Main

Schaltbau Holding AG
Page 33
Source: Factset & ESN, price data adjusted for stock splits. This chart shows equinet Bank continuing coverage of this stock; the current analyst may or may not have covered it over the entire period. Current analyst: Winfried Becker (since 03/04/2018)
Recommendation history for SCHALTBAU HOLDING AG
Date Recommendation Target price Price at change date03. Apr 18 Buy 32.20 25.80
20
22
24
26
28
30
32
34
36
38
40
Feb17
Mrz17
Apr17
Mai17
Jun17
Jul17
Aug17
Sep17
Okt17
Nov17
Dez17
Jan18
Feb18
Mrz18
Buy Accumulat Neut Reduce Sell Not rated
Price history Target price history

Schaltbau Holding AG
Page 34
ESN Recommendation System
The ESN Recommendation System is Absolute. It means that each stock is rated on the
basis of a total return, measured by the upside potential (including dividends and capital
reimbursement) over a 12 month time horizon.
The ESN spectrum of recommendations (or ratings) for each stock comprises 5
categories: Buy (B), Accumulate (A), Neutral (N), Reduce (R) and Sell (S).
Furthermore, in specific cases and for a limited period of time, the analysts are allowed to
rate the stocks as Rating Suspended (RS) or Not Rated (NR), as explained below.
Meaning of each recommendation or rating:
Buy: the stock is expected to generate total return of over 15% during the next 12 months time horizon
Accumulate: the stock is expected to generate total return of 5% to 15% during the next 12 months time horizon
Neutral: the stock is expected to generate total return of -5% to +5% during the next 12 months time horizon
Reduce: the stock is expected to generate total return of -5% to -15% during the next 12 months time horizon
Sell: the stock is expected to generate total return under -15% during the next 12 months time horizon
Rating Suspended: the rating is suspended due to a change of analyst covering the stock or a capital operation (take-over bid, SPO, …) where the issuer of the document (a partner of ESN) or a related party of the issuer is or could be involved
Not Rated: there is no rating for a company being floated (IPO) by the issuer of the document (a partner of ESN) or a related party of the issuer
Certain flexibility on the limits of total return bands is permitted especially during higher phases of volatility on the markets
Equinet Bank Ratings Breakdown
For full ESN Recommendation and Target price history (in the last 12 months) please see ESN Website Link
Date and time of production: 3 April 2018: 20:06 CET First date and time of dissemination: 3 April 2018: 20:11 CET
Buy42%
Accumulate19%
Neutral29%
Reduce5%
Sell5%
Schaltbau Holding AG
Page 35
Disclaimer: These reports have been prepared and issued by the Members of European Securities Network LLP (‘ESN’). ESN, its Members and their affiliates (and any director, officer or employee thereof), are neither liable for the proper and complete transmission of these reports nor for any delay in their receipt. Any unauthorised use, disclosure, copying, distribution, or taking of any action in reliance on these reports is strictly prohibited. The views and expressions in the reports are expressions of opinion and are given in good faith, but are subject to change without notice. These reports may not be reproduced in whole or in part or passed to third parties without permission. The information herein was obtained from various sources. ESN, its Members and their affiliates (and any director, officer or employee thereof) do not guarantee their accuracy or completeness, and neither ESN, nor its Members, nor its Members’ affiliates (nor any director, officer or employee thereof) shall be liable in respect of any errors or omissions or for any losses or consequential losses arising from such errors or omissions. Neither the information contained in these reports nor any opinion expressed constitutes an offer, or an invitation to make an offer, to buy or sell any securities or any options, futures or other derivatives related to such securities (‘related investments’). These reports are prepared for the clients of the Members of ESN only. They do not have regard to the specific investment objectives, financial situation and the particular needs of any specific person who may receive any of these reports. Investors should seek financial advice regarding the appropriateness of investing in any securities or investment strategies discussed or recommended in these reports and should understand that statements regarding future prospects may not be realised. Investors should note that income from such securities, if any, may fluctuate and that each security’s price or value may rise or fall. Accordingly, investors may receive back less than originally invested. Past performance is not necessarily a guide to future performance. Foreign currency rates of exchange may adversely affect the value, price or income of any security or related investment mentioned in these reports. In addition, investors in securities such as ADRs, whose value are influenced by the currency of the underlying security, effectively assume currency risk. ESN, its Members and their affiliates may submit a pre-publication draft (without mentioning neither the recommendation nor the target price/fair value) of its reports for review to the Investor Relations Department of the issuer forming the subject of the report, solely for the purpose of correcting any inadvertent material inaccuracies. Like all members employees, analysts receive compensation that is impacted by overall firm profitability For further details about the analyst certification, the specific risks of the company and about the valuation methods used to determine the price targets included in this report/note, please refer to the specific disclaimer pages prepared by the ESN Members. In the case of a short note please refer to the latest relevant published research on single stock or contact the analyst named on the front of the report/note for detailed information on the valuation methods, earning estimates and risks. A full description of all the organisational and administrative measures taken by the Members of ESN to manage interest and conflicts of interest are available on the website of the Members or in the local disclaimer of the Members or contacting directly the Members. Research is available through the ESN Members sales representative. ESN will provide periodic updates on companies or sectors based on company-specific developments or announcements, market conditions or any other publicly available information. Unless agreed in writing with an ESN Member, this research is intended solely for internal use by the recipient. Neither this document nor any copy of it may be taken or transmitted into Australia, Canada or Japan or distributed, directly or indirectly, in Australia, Canada or Japan or to any resident thereof. This document is for distribution in the U.K. Only to persons who have professional experience in matters relating to investments and fall within article 19(5) of the financial services and markets act 2000 (financial promotion) order 2005 (the “order”) or (ii) are persons falling within article 49(2)(a) to (d) of the order, namely high net worth companies, unincorporated associations etc. (all such persons together being referred to as “relevant persons”). This document must not be acted on or relied upon by persons who are not relevant persons. Any investment or investment activity to which this document relates is available only to relevant persons and will be engaged in only with relevant persons. The distribution of this document in other jurisdictions or to residents of other jurisdictions may also be restricted by law, and persons into whose possession this document comes should inform themselves about, and observe, any such restrictions. By accepting this report you agree to be bound by the foregoing instructions. You shall indemnify ESN, its Members and their affiliates (and any director, officer or employee thereof) against any damages, claims, losses, and detriments resulting from or in connection with the unauthorized use of this document. For disclosure upon “conflicts of interest” on the companies under coverage by all the ESN Members, on the “interests” and “conflicts” of the analysts and on each “company recommendation history”, please visit the ESN website (http://www.esnpartnership.eu/research_and_database_access/insite)
or refer to the local disclaimer of the Members, or contact directly the
Memberwww.bancaakros.it regulated by the CONSOB - Commissione Nazionale per le Società e la
Borsa
www.caixabi.pt regulated by the CMVM - Comissão do Mercado de Valores Mobiliários
www.cmcicms.com regulated by the AMF - Autorité des marchés financiers
www.equinet-ag.de regulated by the BaFin - Bundesanstalt für Finanzdienstleistungsaufsicht
www.ibg.gr regulated by the HCMC - Hellenic Capital Market Commission
www.nibc.com regulated by the AFM - Autoriteit Financiële Markten
www.op.fi regulated by the Financial Supervision Authority
www.valores.gvcgaesco.es regulated by CNMV - Comisión Nacional del Mercado de Valores
Members of ESN (European Securities Network LLP)
Banca Akros S.p.A. Viale Eginardo, 29 20149 MILANO Italy Phone: +39 02 43 444 389 Fax: +39 02 43 444 302
GVC Gaesco Beka, SV, SA
C/ Marques de Villamagna 3 28001 Madrid Spain Phone: +34 91 436 7813
Caixa-Banco de Investimento Avenida João XXI, 63 1000-300 Lisboa Portugal Phone: +351 21 313 73 00
Fax: +351 21 389 68 98
CM - CIC Market Solutions 6, avenue de Provence 75441 Paris Cedex 09 France Phone: +33 1 53 48 81 93
equinet Bank AG
Gräfstraße 97 60487 Frankfurt am Main Germany Phone:+49 69 – 58997 – 212 Fax:+49 69 – 58997 – 299
OP Corporate Bank plc
P.O.Box 308 Teollisuuskatu 1, 00013 Helsinki Finland Phone: +358 10 252 011 Fax: +358 10 252 2703
NIBC Bank N.V.
Gustav Mahlerlaan 348 P.O.Box 235 1082 ME Amsterdam The Netherlands Phone: +31 20 550 8500 Fax: +31 20 626 8064
Investment Bank of Greece
32 Aigialeias Str & Paradissou, 151 25 Maroussi, Greece Phone: +30 210 81 73 383