Embed Size (px)
Citation preview
Schaltbau Holding AG
Sponsored Research Update 20 February 2019
Please refer to important disclosures on the last 5 pages of this document
Restructuring process on track
Forecast changes
Source: Pareto
Performance
Source: Factset
Pareto Securities AS has been paid by the issuer to produce this research report. This material is considered by Pareto Securities to qualify as an acceptable minor non-monetary benefit according to the EU MIFID 2 directive. Analysts
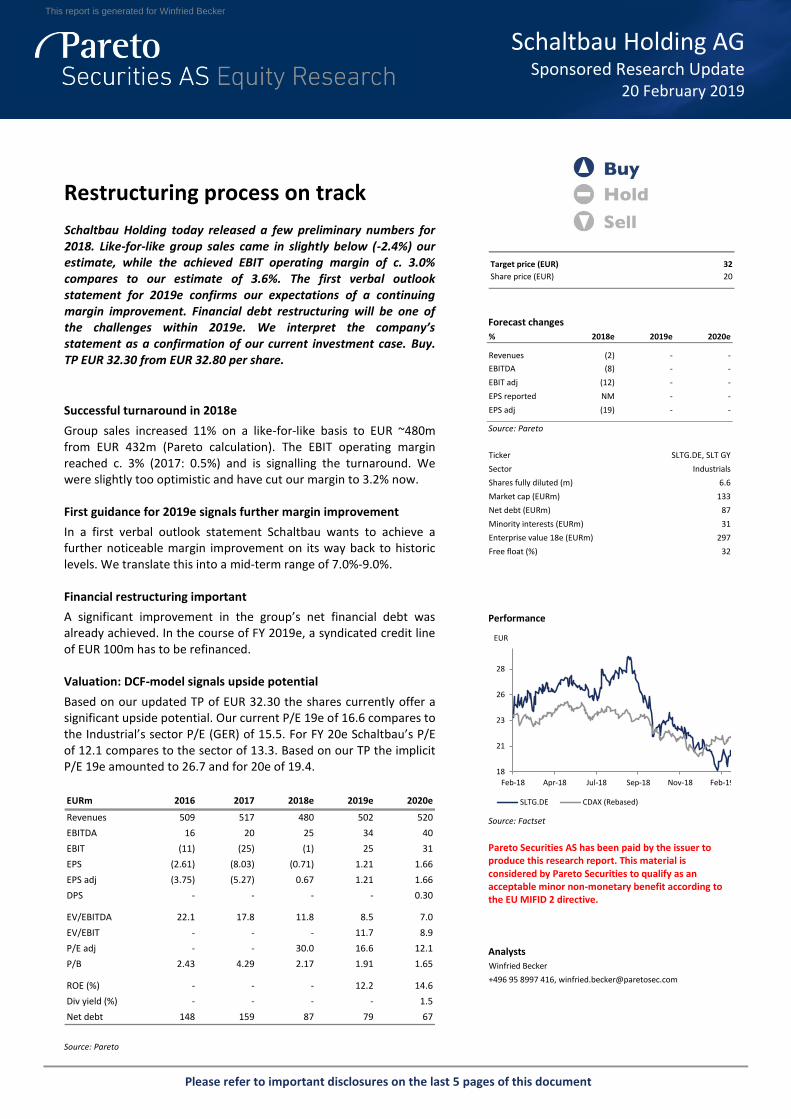
Schaltbau Holding today released a few preliminary numbers for 2018. Like-for-like group sales came in slightly below (-2.4%) our estimate, while the achieved EBIT operating margin of c. 3.0% compares to our estimate of 3.6%. The first verbal outlook statement for 2019e confirms our expectations of a continuing margin improvement. Financial debt restructuring will be one of the challenges within 2019e. We interpret the company’s statement as a confirmation of our current investment case. Buy. TP EUR 32.30 from EUR 32.80 per share.
Successful turnaround in 2018e
Group sales increased 11% on a like-for-like basis to EUR ~480m from EUR 432m (Pareto calculation). The EBIT operating margin reached c. 3% (2017: 0.5%) and is signalling the turnaround. We were slightly too optimistic and have cut our margin to 3.2% now.
First guidance for 2019e signals further margin improvement
In a first verbal outlook statement Schaltbau wants to achieve a further noticeable margin improvement on its way back to historic levels. We translate this into a mid-term range of 7.0%-9.0%.
Financial restructuring important
A significant improvement in the group’s net financial debt was already achieved. In the course of FY 2019e, a syndicated credit line of EUR 100m has to be refinanced.
Valuation: DCF-model signals upside potential
Based on our updated TP of EUR 32.30 the shares currently offer a significant upside potential. Our current P/E 19e of 16.6 compares to the Industrial’s sector P/E (GER) of 15.5. For FY 20e Schaltbau’s P/E of 12.1 compares to the sector of 13.3. Based on our TP the implicit P/E 19e amounted to 26.7 and for 20e of 19.4.
Source: Pareto
Schaltbau H oldi ng AG
Sponsored Research Update
Target price (EUR) 32
Share price (EUR) 20
% 2018e 2019e 2020e
Revenues (2) - -
EBITDA (8) - -
EBIT adj (12) - -
EPS reported NM - -
EPS adj (19) - -
Ticker SLTG.DE, SLT GY
Sector Industrials
Shares fully diluted (m) 6.6
Market cap (EURm) 133
Net debt (EURm) 87
Minority interests (EURm) 31
Enterprise value 18e (EURm) 297
Free float (%) 32
18
21
23
26
28
Feb-18 Apr-18 Jul-18 Sep-18 Nov-18 Feb-19
EUR
SLTG.DE CDAX (Rebased)
Winfried Becker
+496 95 8997 416, [email protected]
EURm 2016 2017 2018e 2019e 2020e
Revenues 509 517 480 502 520
EBITDA 16 20 25 34 40
EBIT (11) (25) (1) 25 31
EPS (2.61) (8.03) (0.71) 1.21 1.66
EPS adj (3.75) (5.27) 0.67 1.21 1.66
DPS - - - - 0.30
EV/EBITDA 22.1 17.8 11.8 8.5 7.0
EV/EBIT - - - 11.7 8.9
P/E adj - - 30.0 16.6 12.1
P/B 2.43 4.29 2.17 1.91 1.65
ROE (%) - - - 12.2 14.6
Div yield (%) - - - - 1.5
Net debt 148 159 87 79 67
This report is generated for Winfried Becker
Schaltbau Holding AG Sponsored Research Update
20 Feb 2019 Pareto Securities Research 2(13)
Investment case
The overall macroeconomic picture became worse during the last months and a lot of economists have revised their GDP forecasts down. The IMF now expects for the Euro area for 2019 a GDP growth of only +1.6% yoy versus their former forecast from October last year of +1.9% yoy. For Schaltbau, on average of the last three reported fiscal years, Germany and Europe account for 71% of the group total sales. As a result we currently see no new trigger for a higher valuation level from this front. It is also worth to mention that investments in rail infrastructure and rolling stock are less volatile than it is in other industries. For Schaltbau this aspect is currently less relevant in our view, because the dominant triggers are internal factors. To mention a few, we see the group on track to reach this year’s cost savings, financial debt reduction and solving problems with loss-making orders as they already did with the platform screen doors (PSD) project in Brazil. Since the last AGM in summer 2018 the group has a partly changed management and supervisory board that are in our view clearly better for the overall restructuring process. In particular two aspects are important: The new Executive and Supervisory Boards now are much more competent
with regard to the overall railway industry in addition to the existing financial and restructuring expertise.
The relationship between Executive and Supervisory Board is now based more on arms-length principles than in history.
Looking forward, we expect a new and conservative new financial guidance for FY 2019e; our sales forecast currently assumes a growth rate of only 2% yoy to EUR 502m while the EBIT operating-margin is expected to rise to 4.9% from 3.2% a year earlier. Continuing reductions in the company’s financial debt position also could become a positive share price trigger as well as a possible finalisation of the sale of Schaltbau Sepsa that is not an easy task.
Risks to the investment case
The expected growth of the global railway markets will not meet Schaltbau’s expectations with regard to their own targets
The company will not meet all milestones fixed in the general restructuring plan, e.g. profitability improvement or working capital reduction targets
Reduction of the group’s financial debt might take longer than expected General inherent risks of the project business could lead to cost overruns or
other burdening factors Further impairment risks in the group’s company portfolio
Valuation Update
Buy recommendation confirmed
TP marginally down to EUR 32.30 from EUR 32.80 per share
Current upside potential ~61% We value the Schaltbau shares and derive our target price from our DCF-model. Using peer group multiples in our view currently do not cope with Schaltbau’s turnaround situation. Based on the first preliminary figures for FY 2018 Schaltbau group reached their own targets. Moreover and looking forward the margin improvement should continue, that is in line with our expectations. In addition, and as outlined several times, our recommendation is not free of risks, in particular when looking to the stretched financial debt situation.
A long-term restructuring investment idea
This report is generated for Winfried Becker
Schaltbau Holding AG Sponsored Research Update
20 Feb 2019 Pareto Securities Research 3(13)
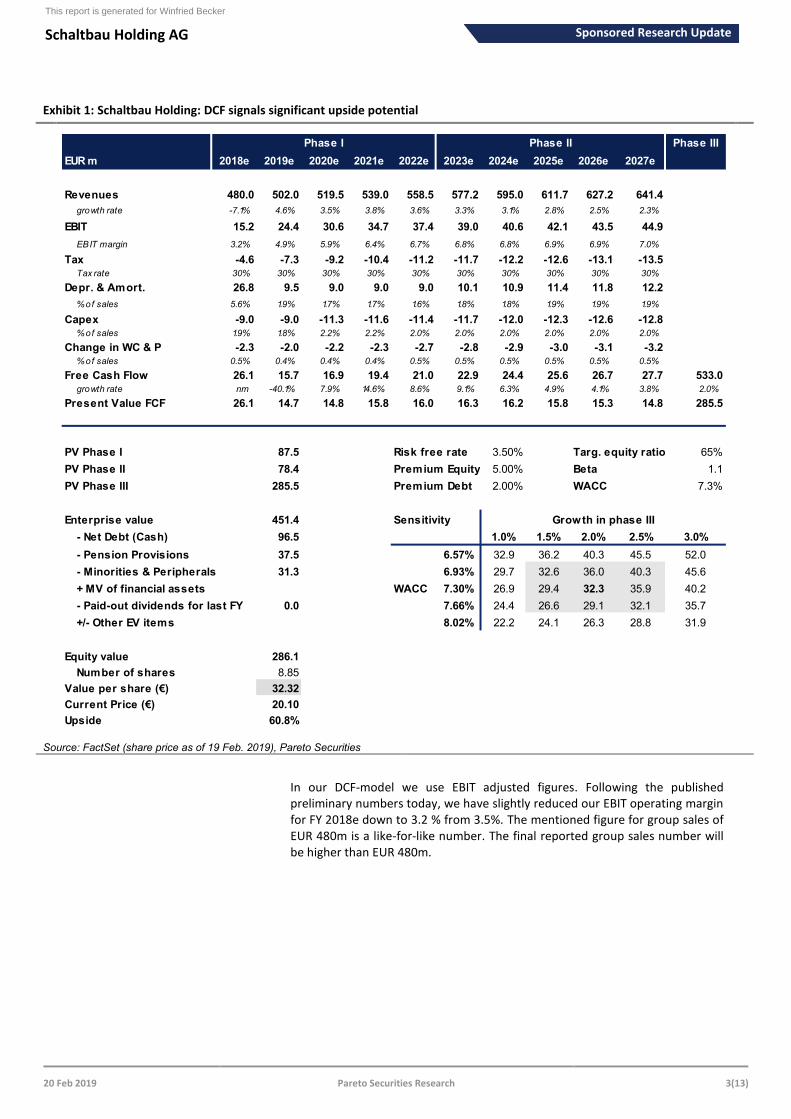
Exhibit 1: Schaltbau Holding: DCF signals significant upside potential
Source: FactSet (share price as of 19 Feb. 2019), Pareto Securities
In our DCF-model we use EBIT adjusted figures. Following the published preliminary numbers today, we have slightly reduced our EBIT operating margin for FY 2018e down to 3.2 % from 3.5%. The mentioned figure for group sales of EUR 480m is a like-for-like number. The final reported group sales number will be higher than EUR 480m.
Phase III
EUR m 2018e 2019e 2020e 2021e 2022e 2023e 2024e 2025e 2026e 2027e
Revenues 480.0 502.0 519.5 539.0 558.5 577.2 595.0 611.7 627.2 641.4
growth rate -7.1% 4.6% 3.5% 3.8% 3.6% 3.3% 3.1% 2.8% 2.5% 2.3%
EBIT 15.2 24.4 30.6 34.7 37.4 39.0 40.6 42.1 43.5 44.9
EBIT margin 3.2% 4.9% 5.9% 6.4% 6.7% 6.8% 6.8% 6.9% 6.9% 7.0%
Tax -4.6 -7.3 -9.2 -10.4 -11.2 -11.7 -12.2 -12.6 -13.1 -13.5
Tax rate 30% 30% 30% 30% 30% 30% 30% 30% 30% 30%
Depr. & Amort. 26.8 9.5 9.0 9.0 9.0 10.1 10.9 11.4 11.8 12.2
% of sales 5.6% 1.9% 1.7% 1.7% 1.6% 1.8% 1.8% 1.9% 1.9% 1.9%
Capex -9.0 -9.0 -11.3 -11.6 -11.4 -11.7 -12.0 -12.3 -12.6 -12.8
% of sales 1.9% 1.8% 2.2% 2.2% 2.0% 2.0% 2.0% 2.0% 2.0% 2.0%
Change in WC & P -2.3 -2.0 -2.2 -2.3 -2.7 -2.8 -2.9 -3.0 -3.1 -3.2
% of sales 0.5% 0.4% 0.4% 0.4% 0.5% 0.5% 0.5% 0.5% 0.5% 0.5%
Free Cash Flow 26.1 15.7 16.9 19.4 21.0 22.9 24.4 25.6 26.7 27.7 533.0
growth rate nm -40.1% 7.9% 14.6% 8.6% 9.1% 6.3% 4.9% 4.1% 3.8% 2.0%
Present Value FCF 26.1 14.7 14.8 15.8 16.0 16.3 16.2 15.8 15.3 14.8 285.5
PV Phase I 87.5 Risk free rate 3.50% Targ. equity ratio 65%
PV Phase II 78.4 Premium Equity 5.00% Beta 1.1
PV Phase III 285.5 Premium Debt 2.00% WACC 7.3%
Enterprise value 451.4 Sensitivity
- Net Debt (Cash) 96.5 1.0% 1.5% 2.0% 2.5% 3.0%
- Pension Provisions 37.5 6.57% 32.9 36.2 40.3 45.5 52.0
- Minorities & Peripherals 31.3 6.93% 29.7 32.6 36.0 40.3 45.6
+ MV of financial assets WACC 7.30% 26.9 29.4 32.3 35.9 40.2
- Paid-out dividends for last FY 0.0 7.66% 24.4 26.6 29.1 32.1 35.7
+/- Other EV items 8.02% 22.2 24.1 26.3 28.8 31.9
Equity value 286.1
Number of shares 8.85
Value per share (€) 32.32
Current Price (€) 20.10
Upside 60.8%
Phase I Phase II
Growth in phase III
This report is generated for Winfried Becker
Schaltbau Holding AG Sponsored Research Update
20 Feb 2019 Pareto Securities Research 4(13)
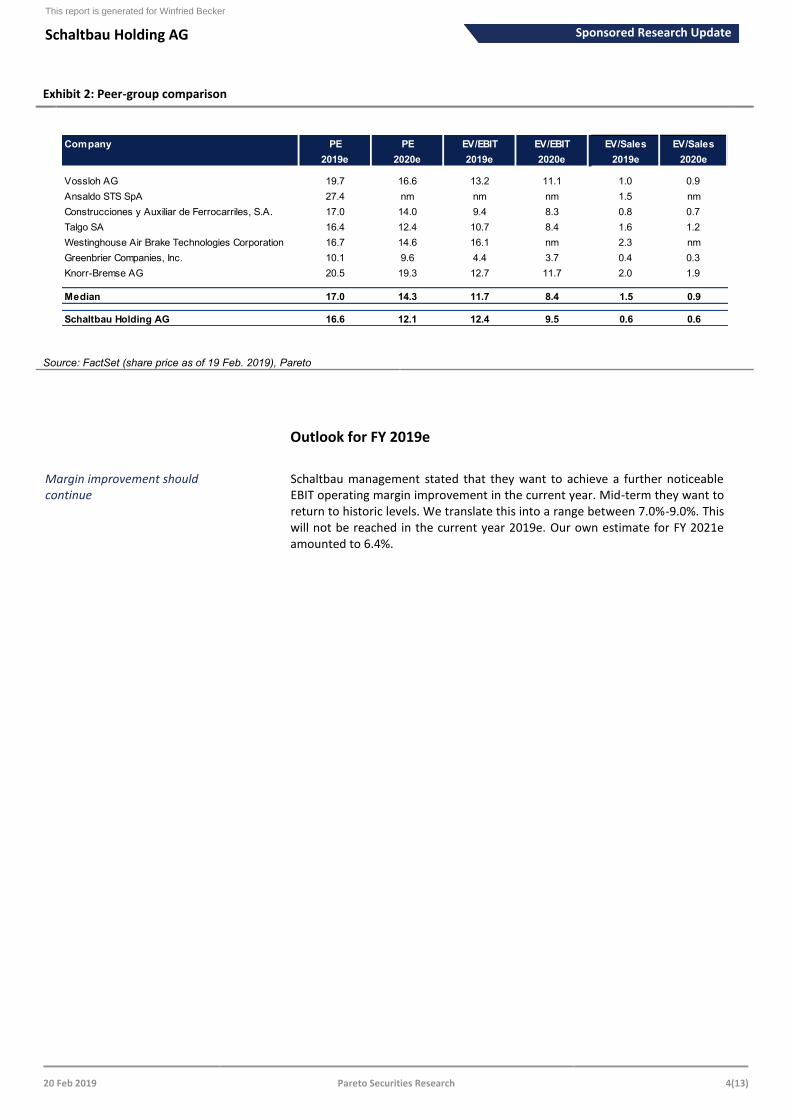
Exhibit 2: Peer-group comparison
Source: FactSet (share price as of 19 Feb. 2019), Pareto
Outlook for FY 2019e
Schaltbau management stated that they want to achieve a further noticeable EBIT operating margin improvement in the current year. Mid-term they want to return to historic levels. We translate this into a range between 7.0%-9.0%. This will not be reached in the current year 2019e. Our own estimate for FY 2021e amounted to 6.4%.
Company PE PE EV/EBIT EV/EBIT EV/Sales EV/Sales
2019e 2020e 2019e 2020e 2019e 2020e
Vossloh AG 19.7 16.6 13.2 11.1 1.0 0.9
Ansaldo STS SpA 27.4 nm nm nm 1.5 nm
Construcciones y Auxiliar de Ferrocarriles, S.A. 17.0 14.0 9.4 8.3 0.8 0.7
Talgo SA 16.4 12.4 10.7 8.4 1.6 1.2
Westinghouse Air Brake Technologies Corporation 16.7 14.6 16.1 nm 2.3 nm
Greenbrier Companies, Inc. 10.1 9.6 4.4 3.7 0.4 0.3
Knorr-Bremse AG 20.5 19.3 12.7 11.7 2.0 1.9
Median 17.0 14.3 11.7 8.4 1.5 0.9
Schaltbau Holding AG 16.6 12.1 12.4 9.5 0.6 0.6
Margin improvement should continue
This report is generated for Winfried Becker
Schaltbau Holding AG Sponsored Research Update
20 Feb 2019 Pareto Securities Research 5(13)
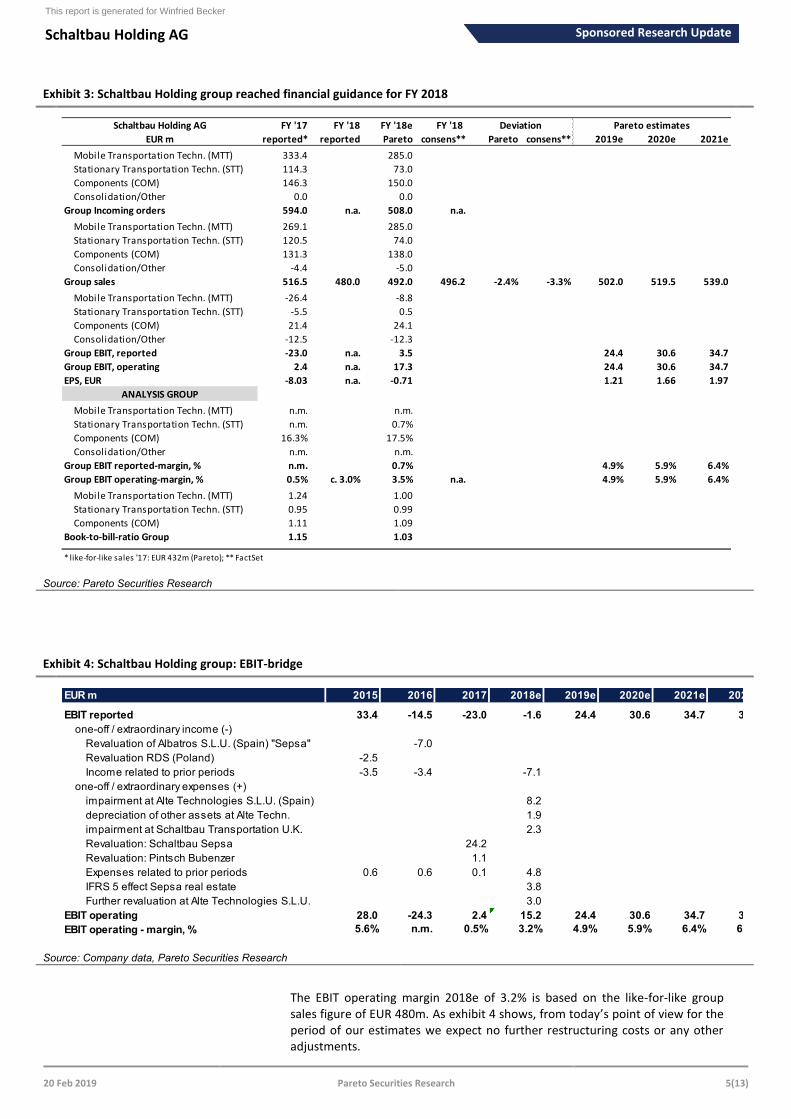
Exhibit 3: Schaltbau Holding group reached financial guidance for FY 2018
Source: Pareto Securities Research
Exhibit 4: Schaltbau Holding group: EBIT-bridge
Source: Company data, Pareto Securities Research
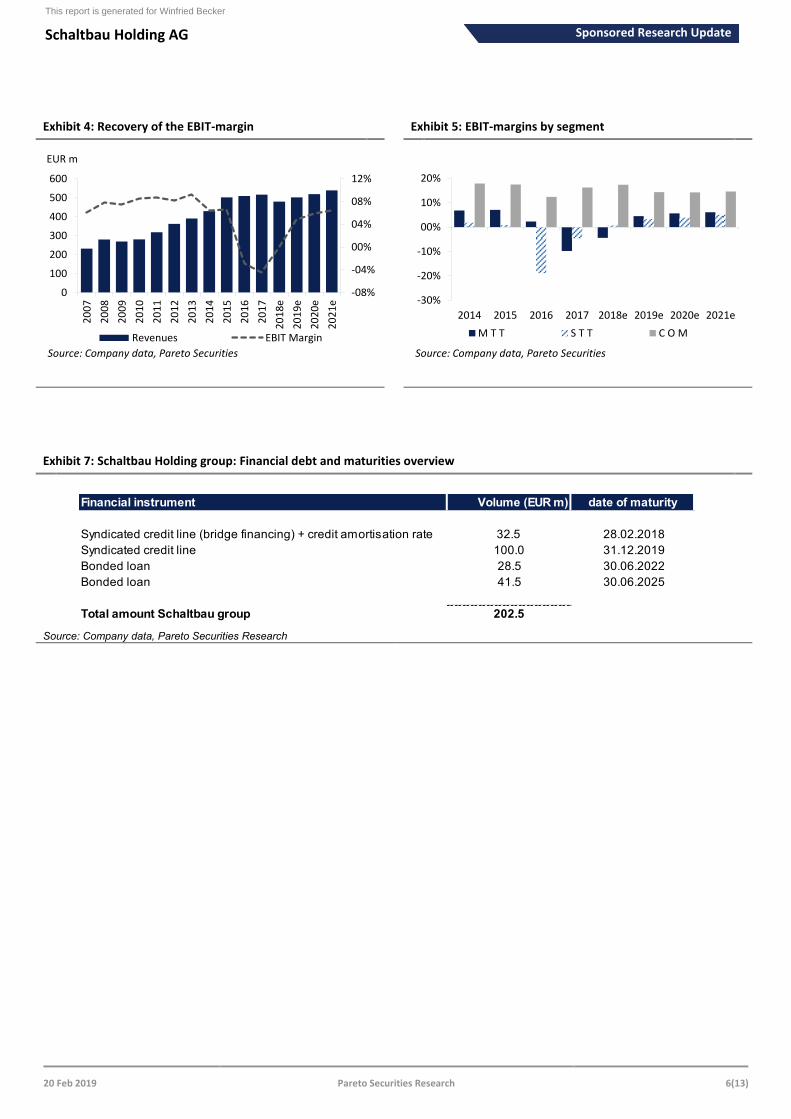
The EBIT operating margin 2018e of 3.2% is based on the like-for-like group sales figure of EUR 480m. As exhibit 4 shows, from today’s point of view for the period of our estimates we expect no further restructuring costs or any other adjustments.
Schaltbau Holding AG FY '17 FY '18 FY '18e FY '18
EUR m reported* reported Pareto consens** Pareto consens** 2019e 2020e 2021e
Mobile Transportation Techn. (MTT) 333.4 285.0
Stationary Transportation Techn. (STT) 114.3 73.0
Components (COM) 146.3 150.0
Consolidation/Other 0.0 0.0
Group Incoming orders 594.0 n.a. 508.0 n.a.
Mobile Transportation Techn. (MTT) 269.1 285.0
Stationary Transportation Techn. (STT) 120.5 74.0
Components (COM) 131.3 138.0
Consolidation/Other -4.4 -5.0
Group sales 516.5 480.0 492.0 496.2 -2.4% -3.3% 502.0 519.5 539.0
Mobile Transportation Techn. (MTT) -26.4 -8.8
Stationary Transportation Techn. (STT) -5.5 0.5
Components (COM) 21.4 24.1
Consolidation/Other -12.5 -12.3
Group EBIT, reported -23.0 n.a. 3.5 24.4 30.6 34.7
Group EBIT, operating 2.4 n.a. 17.3 24.4 30.6 34.7
EPS, EUR -8.03 n.a. -0.71 1.21 1.66 1.97
ANALYSIS GROUP
Mobile Transportation Techn. (MTT) n.m. n.m.
Stationary Transportation Techn. (STT) n.m. 0.7%
Components (COM) 16.3% 17.5%
Consolidation/Other n.m. n.m.
Group EBIT reported-margin, % n.m. 0.7% 4.9% 5.9% 6.4%
Group EBIT operating-margin, % 0.5% c. 3.0% 3.5% n.a. 4.9% 5.9% 6.4%
Mobile Transportation Techn. (MTT) 1.24 1.00
Stationary Transportation Techn. (STT) 0.95 0.99
Components (COM) 1.11 1.09
Book-to-bill-ratio Group 1.15 1.03
* like-for-like sales '17: EUR 432m (Pareto); ** FactSet
Pareto estimatesDeviation
EUR m 2015 2016 2017 2018e 2019e 2020e 2021e 2022e
EBIT reported 33.4 -14.5 -23.0 -1.6 24.4 30.6 34.7 37.4
one-off / extraordinary income (-)
Revaluation of Albatros S.L.U. (Spain) "Sepsa" -7.0
Revaluation RDS (Poland) -2.5
Income related to prior periods -3.5 -3.4 -7.1
one-off / extraordinary expenses (+)
impairment at Alte Technologies S.L.U. (Spain) 8.2
depreciation of other assets at Alte Techn. 1.9
impairment at Schaltbau Transportation U.K. 2.3
Revaluation: Schaltbau Sepsa 24.2
Revaluation: Pintsch Bubenzer 1.1
Expenses related to prior periods 0.6 0.6 0.1 4.8
IFRS 5 effect Sepsa real estate 3.8
Further revaluation at Alte Technologies S.L.U. 3.0
EBIT operating 28.0 -24.3 2.4 15.2 24.4 30.6 34.7 37.4
EBIT operating - margin, % 5.6% n.m. 0.5% 3.2% 4.9% 5.9% 6.4% 6.7%
This report is generated for Winfried Becker
Schaltbau Holding AG Sponsored Research Update
20 Feb 2019 Pareto Securities Research 6(13)
Exhibit 4: Recovery of the EBIT-margin Exhibit 5: EBIT-margins by segment
Exhibit 7: Schaltbau Holding group: Financial debt and maturities overview
Source: Company data, Pareto Securities Research
-08%
-04%
00%
04%
08%
12%
0
100
200
300
400
500
600
20
07
20
08
20
09
20
10
20
11
20
12
20
13
20
14
20
15
20
16
20
17
20
18
e
20
19
e
20
20
e
20
21
e
EUR m
Revenues EBIT Margin
Source: Company data, Pareto Securities
-30%
-20%
-10%
00%
10%
20%
2014 2015 2016 2017 2018e 2019e 2020e 2021e
M T T S T T C O M
Source: Company data, Pareto Securities
Financial instrument Volume (EUR m) date of maturity
Syndicated credit line (bridge financing) + credit amortisation rate 32.5 28.02.2018
Syndicated credit line 100.0 31.12.2019
Bonded loan 28.5 30.06.2022
Bonded loan 41.5 30.06.2025
Total amount Schaltbau group 202.5
This report is generated for Winfried Becker
Schaltbau Holding AG Sponsored Research Update
20 Feb 2019 Pareto Securities Research 7(13)
Appendix
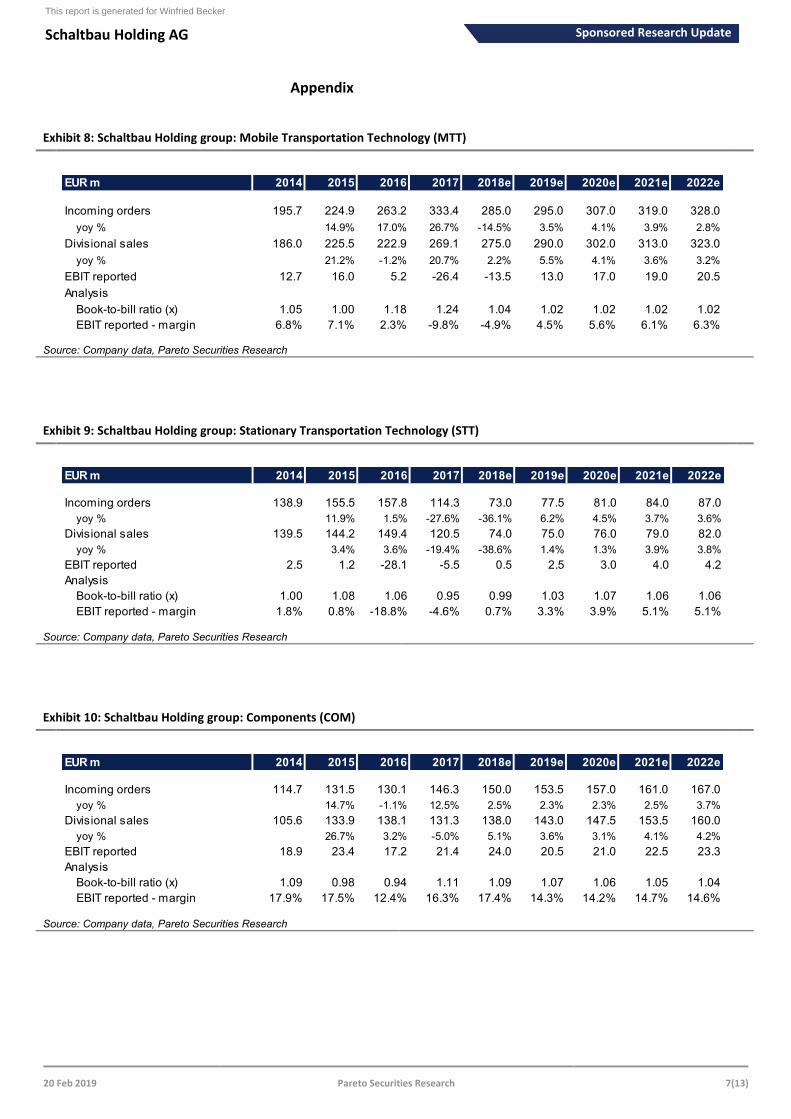
Exhibit 8: Schaltbau Holding group: Mobile Transportation Technology (MTT)
Source: Company data, Pareto Securities Research
Exhibit 9: Schaltbau Holding group: Stationary Transportation Technology (STT)
Source: Company data, Pareto Securities Research
Exhibit 10: Schaltbau Holding group: Components (COM)
Source: Company data, Pareto Securities Research
EUR m 2014 2015 2016 2017 2018e 2019e 2020e 2021e 2022e
Incoming orders 195.7 224.9 263.2 333.4 285.0 295.0 307.0 319.0 328.0
yoy % 14.9% 17.0% 26.7% -14.5% 3.5% 4.1% 3.9% 2.8%
Divisional sales 186.0 225.5 222.9 269.1 275.0 290.0 302.0 313.0 323.0
yoy % 21.2% -1.2% 20.7% 2.2% 5.5% 4.1% 3.6% 3.2%
EBIT reported 12.7 16.0 5.2 -26.4 -13.5 13.0 17.0 19.0 20.5
Analysis
Book-to-bill ratio (x) 1.05 1.00 1.18 1.24 1.04 1.02 1.02 1.02 1.02
EBIT reported - margin 6.8% 7.1% 2.3% -9.8% -4.9% 4.5% 5.6% 6.1% 6.3%
EUR m 2014 2015 2016 2017 2018e 2019e 2020e 2021e 2022e
Incoming orders 138.9 155.5 157.8 114.3 73.0 77.5 81.0 84.0 87.0
yoy % 11.9% 1.5% -27.6% -36.1% 6.2% 4.5% 3.7% 3.6%
Divisional sales 139.5 144.2 149.4 120.5 74.0 75.0 76.0 79.0 82.0
yoy % 3.4% 3.6% -19.4% -38.6% 1.4% 1.3% 3.9% 3.8%
EBIT reported 2.5 1.2 -28.1 -5.5 0.5 2.5 3.0 4.0 4.2
Analysis
Book-to-bill ratio (x) 1.00 1.08 1.06 0.95 0.99 1.03 1.07 1.06 1.06
EBIT reported - margin 1.8% 0.8% -18.8% -4.6% 0.7% 3.3% 3.9% 5.1% 5.1%
EUR m 2014 2015 2016 2017 2018e 2019e 2020e 2021e 2022e
Incoming orders 114.7 131.5 130.1 146.3 150.0 153.5 157.0 161.0 167.0
yoy % 14.7% -1.1% 12.5% 2.5% 2.3% 2.3% 2.5% 3.7%
Divisional sales 105.6 133.9 138.1 131.3 138.0 143.0 147.5 153.5 160.0
yoy % 26.7% 3.2% -5.0% 5.1% 3.6% 3.1% 4.1% 4.2%
EBIT reported 18.9 23.4 17.2 21.4 24.0 20.5 21.0 22.5 23.3
Analysis
Book-to-bill ratio (x) 1.09 0.98 0.94 1.11 1.09 1.07 1.06 1.05 1.04
EBIT reported - margin 17.9% 17.5% 12.4% 16.3% 17.4% 14.3% 14.2% 14.7% 14.6%
This report is generated for Winfried Becker
Schaltbau Holding AG Sponsored Research Update
20 Feb 2019 Pareto Securities Research 8(13)
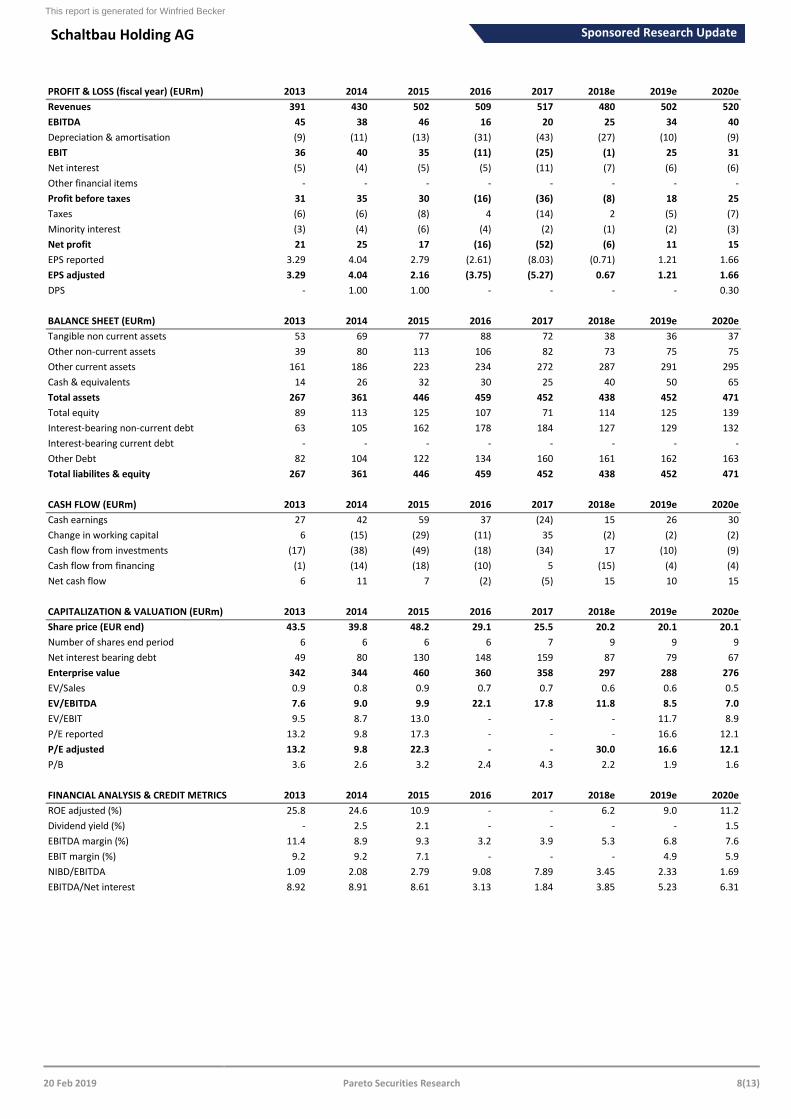
PROFIT & LOSS (fiscal year) (EURm) 2013 2014 2015 2016 2017 2018e 2019e 2020e
Revenues 391 430 502 509 517 480 502 520
EBITDA 45 38 46 16 20 25 34 40
Depreciation & amortisation (9) (11) (13) (31) (43) (27) (10) (9)
EBIT 36 40 35 (11) (25) (1) 25 31
Net interest (5) (4) (5) (5) (11) (7) (6) (6)
Other financial items - - - - - - - -
Profit before taxes 31 35 30 (16) (36) (8) 18 25
Taxes (6) (6) (8) 4 (14) 2 (5) (7)
Minority interest (3) (4) (6) (4) (2) (1) (2) (3)
Net profit 21 25 17 (16) (52) (6) 11 15
EPS reported 3.29 4.04 2.79 (2.61) (8.03) (0.71) 1.21 1.66
EPS adjusted 3.29 4.04 2.16 (3.75) (5.27) 0.67 1.21 1.66
DPS - 1.00 1.00 - - - - 0.30
BALANCE SHEET (EURm) 2013 2014 2015 2016 2017 2018e 2019e 2020e
Tangible non current assets 53 69 77 88 72 38 36 37
Other non-current assets 39 80 113 106 82 73 75 75
Other current assets 161 186 223 234 272 287 291 295
Cash & equivalents 14 26 32 30 25 40 50 65
Total assets 267 361 446 459 452 438 452 471
Total equity 89 113 125 107 71 114 125 139
Interest-bearing non-current debt 63 105 162 178 184 127 129 132
Interest-bearing current debt - - - - - - - -
Other Debt 82 104 122 134 160 161 162 163
Total liabilites & equity 267 361 446 459 452 438 452 471
CASH FLOW (EURm) 2013 2014 2015 2016 2017 2018e 2019e 2020e
Cash earnings 27 42 59 37 (24) 15 26 30
Change in working capital 6 (15) (29) (11) 35 (2) (2) (2)
Cash flow from investments (17) (38) (49) (18) (34) 17 (10) (9)
Cash flow from financing (1) (14) (18) (10) 5 (15) (4) (4)
Net cash flow 6 11 7 (2) (5) 15 10 15
CAPITALIZATION & VALUATION (EURm) 2013 2014 2015 2016 2017 2018e 2019e 2020e
Share price (EUR end) 43.5 39.8 48.2 29.1 25.5 20.2 20.1 20.1
Number of shares end period 6 6 6 6 7 9 9 9
Net interest bearing debt 49 80 130 148 159 87 79 67
Enterprise value 342 344 460 360 358 297 288 276
EV/Sales 0.9 0.8 0.9 0.7 0.7 0.6 0.6 0.5
EV/EBITDA 7.6 9.0 9.9 22.1 17.8 11.8 8.5 7.0
EV/EBIT 9.5 8.7 13.0 - - - 11.7 8.9
P/E reported 13.2 9.8 17.3 - - - 16.6 12.1
P/E adjusted 13.2 9.8 22.3 - - 30.0 16.6 12.1
P/B 3.6 2.6 3.2 2.4 4.3 2.2 1.9 1.6
FINANCIAL ANALYSIS & CREDIT METRICS 2013 2014 2015 2016 2017 2018e 2019e 2020e
ROE adjusted (%) 25.8 24.6 10.9 - - 6.2 9.0 11.2
Dividend yield (%) - 2.5 2.1 - - - - 1.5
EBITDA margin (%) 11.4 8.9 9.3 3.2 3.9 5.3 6.8 7.6
EBIT margin (%) 9.2 9.2 7.1 - - - 4.9 5.9
NIBD/EBITDA 1.09 2.08 2.79 9.08 7.89 3.45 2.33 1.69
EBITDA/Net interest 8.92 8.91 8.61 3.13 1.84 3.85 5.23 6.31
This report is generated for Winfried Becker
Schaltbau Holding AG Sponsored Research Update
20 Feb 2019 Pareto Securities Research 9(13)
Disclaimer and legal disclosures
Origin of the publication or report This publication or report originates from Pareto Securities AS (“Pareto Securities”), reg. no. 956 632 374 (Norway), Pareto Securities AB, reg. no. 556206-8956 (Sweden) or Pareto Securities Limited, reg. no. 3994976, (United Kingdom) (together the Group Companies or the “Pareto Securities Group”) acting through their common un it Pareto Securities Research. The Group Companies are supervised by the Financial Supervisory Authority of their respective home countries.
Content of the publication or reportThis publication or report has been prepared solely by Pareto Securities Research.
Opinions or suggestions from Pareto Securities Research may deviate from recommendations or opinions presented by other departments or companies in the Pareto Securities Group. The reason may typically be the result of differing time horizons, methodologies, contexts or other factors.
Sponsored researchPlease note that if this report is labelled as “sponsored research” on the front page, Pareto Securities has entered into an agreement with the company about the preparation of research reports and receives compensation from the company for this service. Sponsored research is prepared by the Research Department of Pareto Securities without any instruction rights by the company. Sponsored research is however commissioned for and paid by the company and such material is considered by Pareto Securities to qualify as an acceptable minor non-monetary benefit according to the EU MiFID II Directive.
Basis and methods for assessmentOpinions and price targets are based on one or more methods of valuation, for instance cash flow analysis, use of multiples, behavioral technical analyses of underlying market movements in combination with considerations of the market situation and the time horizon. Key assumptions of forecasts, price targets and projections in research cited or reproduced appear in the research material from the named sources. The date of publication appears from the research material cited or reproduced. Opinions and estimates may be updated in subsequent versions of the publication or report, provided that the relevant company/issuer is treated anew in such later versions of the publication or report.
Pareto Securities Research may provide credit research with more specific price targets based on different valuation methods, including the analysis of key credit ratios and other factors describing the securities creditworthiness, peer group analysis of securities with similar creditworthiness and different DCF-valuations. All descriptions of loan agreement structures and loan agreement features are obtained from sources which Pareto Securities Research believes to be reliable, but Pareto Securities Research does not represent or warrant their accuracy. Be aware that investors should go through the specific complete loan agreement before investing in any bonds and not base an investment decision based solely on information contained in this publication or report.
Pareto Securities Research has no fixed schedule for updating publications or reports.
Unless otherwise stated on the first page, the publication or report has not been reviewed by the issuer before dissemination. In instances where all or part of a report is presented to the issuer prior to publication, the purpose is to ensure that facts are correct.
Validity of the publication or reportAll opinions and estimates in this publication or report are, regardless of source, given in good faith and may only be valid as of the stated date of this publication or report and are subject to change without notice.
No individual investment or tax adviceThe publication or report is intended only to provide general and preliminary information to investors and shall not be const rued as the basis for any investment decision. This publication or report has been prepared by Pareto Securities Research as general information for private use of investors to whom the publication or report has been distributed, but it is not intended as a personal recommendation of particular financial instruments or strategies and thus it does not provide individually tailored investmen t advice, and does not take into account the individual investor’s particular financial situation, existing holdings or liabilities, investment knowledge and experience, investment objective and horizon or risk profile and preferences. The investor must particularly ensure the suitability of an investment as regards his/her financial and fiscal situation and investment objectives. The investor bears the risk of losses in connection with an investment.
Before acting on any information in this publication or report, we recommend consulting your financial advisor.
The information contained in this publication or report does not constitute advice on the tax consequences of making any part icular investment decision. Each investor shall make his/her own appraisal of the tax and other financial merits of his/her investment.
SourcesThis publication or report may be based on or contain information, such as opinions, recommendations, estimates, price targets and valuations which emanate from Pareto Securities Research’ analysts or representatives, publicly available information, information from other units or companies in the Group Companies, or other n amed sources.
To the extent this publication or report is based on or contains information emanating from other sources (“Other Sources”) t han Pareto Securities Research (“External Information”), Pareto Securities Research has deemed the Other Sources to be reliable but neither the companies in the Pareto Securities Group, others associated or affiliated with said companies nor any other person, guarantee the accuracy, adequacy or completeness of the External Information.
RatingsEquity ratings: “Buy” Pareto Securities Research expects this financial instrument’s total return to exceed 10% over the next 1 2 months
“Hold” Pareto Securities Research expects this financial instrument’s total return to be between -10% and 10% over the next 12 months“Sell” Pareto Securities Research expects this financial instrument’s total return to be negative by more than 10% over the next 12 months
Analysts CertificationThe research analyst(s) whose name(s) appear on research reports prepared by Pareto Securities Research certify that: (i) all of the views expressed in the research report accurately reflect their personal views about the subject security or issuer, and (ii) no part of the research analysts’ compensation was, is, or will be direc tly or indirectly related to the specific recommendations or views expressed by the research analysts in research reports that are prepared by Pareto Securities Research.
The research analysts whose names appears on research reports prepared by Pareto Securities Research received compensation that is based upon various factors including Pareto Securities’ total revenues, a portion of which are generated by Pareto Securities’ investment banking activities.
Limitation of liabilityPareto Securities Group or other associated and affiliated companies assume no liability as regards to any investment, divest ment or retention decision taken by the investor on the basis of this publication or report. In no event will entities of the Pareto Securities Group or other associated and affiliated companies be liable for direct, indirect or incidental, special or consequential damages resulting from the
This report is generated for Winfried Becker
Schaltbau Holding AG Sponsored Research Update
20 Feb 2019 Pareto Securities Research 10(13)
Risk informationThe risk of investing in certain financial instruments, including those mentioned in this document, is generally high, as their market value is exposed to a lot of different factors such as the operational and financial conditions of the relevant company, growth prospects, change in interest rates, the economic and political environment, foreign exchange rates, shifts in market sentiments etc. Where an investment or security is denominated in a different currency to the investor’s currency of reference, changes in rates of exchange may have an adverse effect on the value, price or income of or from that investment to the investor. Past performance is not a guide to future performance. Estimates of future performance are based on assumptions that may not be realized. When investing in individual shares, the investor may lose all or part of the investments.
Conflicts of interestCompanies in the Pareto Securities Group, affiliates or staff of companies in the Pareto Securities Group, may perform services for, solicit business from, make a market in, hold long or short positions in, or otherwise be interested in the investments (including derivatives) of any company mentioned in the publication or report.In addition Pareto Securities Group, or affiliates, may from time to time have a broking, advisory or other relationship with a company which is the subject of or referred to in the relevant Research, including acting as that company’s official or sponsoring broker and providing investment banking or other financial services. It is t he policy of Pareto to seek to act as corporate adviser or broker to some of the companies which are covered by Pareto Securities Research. Accordingly companies covered in any Research may be the subject o f marketing initiatives by the Investment Banking Department.
To limit possible conflicts of interest and counter the abuse of inside knowledge, the analysts of Pareto Securities Research are subject to internal rules on sound ethical conduct, the management of inside information, handling of unpublished research material, contact with other units of the Group Companies and personal account dealing. The internal rules have been prepared in accordance with applicable legislation and relevant industry standards. The object of the internal rules is for example to ensure that no analyst will abuse or cause others to abuse confidential information. It is the policy of Pareto Securities Research that no link exists between revenues from capital markets activities and individual analyst remuneration. The Group Companies are members of national stockbrokers’ associations in each of the countries in which the Group Companies have their head offices. Internal rules have been developed in accordance with recommendations issued by the stockbrokers associations. This material has been prepared following the Pareto Securities Conflict of Interest Policy.
The guidelines in the policy include rules and measures aimed at achieving a sufficient degree of independence between variou s departments, business areas and sub-business areas within the Pareto Securities Group in order to, as far as possible, avoid conflicts of interest from arising between such departments, business areas and sub-business areas as well as their customers. One purpose of such measures is to restrict the flow of information between certain business areas and sub-business areas within the Pareto Securities Group, where conflicts of interest may arise and to safeguard the impartialness of the employees. For example, the Investment Banking departments and certain other departments included in the Pareto Securities Group are surrounded by arrangements, so-called Chinese Walls, to restrict the flows of sensitive information from such departments. The internal guidelines also include, without limitation, rules aimed at securing the impartialness of, e.g., analysts working in the Pareto Securities Research departments, restrictions with regard to the remuneration paid to such analysts, requirements with respect to the independence of analysts from other departments within the Pareto Securities Group rules concerning contacts with covered companies and rules concerning personal account trading carried out by analysts.
Distribution restrictionThe securities referred to in this publication or report may not be eligible for sale in some jurisdictions and persons into whose possession this document comes should inform themselves about and observe any such restrictions. This publication or report is not intended for and must not be distributed to private customers in the US, or retail clients in the United Kingdom, as defined by the Financial Conduct Authority (FCA).
This research is only intended for and may only be distributed to institutional investors in the United States and U.S entities seeking more information about any of the issuers or securities discussed in this report should contact Pareto Securities Inc. at 150 East 52nd Street, New York, NY 10022, Tel. 212 829 4200.
Pareto Securities Inc. is a broker-dealer registered with the U.S. Securities and Exchange Commission and is a member of FINRA &SIPC. U.S. To the extent required by applicable U.S. laws and regulations, Pareto Securities Inc. accepts responsibility for the contents of this publication. Investment products provided by or through Pareto Securities Inc. or Pareto Securities Research are not FDIC insured, may lose value and are not guaranteed by Pareto Securities Inc. or Pareto Securities Research. Investing in non-U.S. securities may entail certain risks. This document does not constitute or form part of any offer for sale or subscription, nor shall it or any part of it form the basis of or be relied on in connection with any contract or commitment whatsoever. The securities of non-U.S. issuers may not be registered with or subject to SEC reporting and other requirements. The information available about non-U.S. companies may be limited, and non-U.S. companies are generally not subject to the same uniform auditing and reporting standards as U.S. companies. Market rules, conventions and practices may differ from U.S. markets, adding to transaction costs or causing delays in the purchase or sale of securities. Securities of some non-U.S. companies may not be as liquid as securities of comparable U.S. companies. Fluctuations in the values of national currencies, as well as the potential for governmental restrictions on currency movements, can significantly erode principal and investment returns.
Pareto Securities Research may have material conflicts of interest related to the production or distribution of this research report which, with regard to Pareto Securities Research, are disclosed herein.
Distribution in SingaporePareto Securities Pte Ltd holds a Capital Markets Services License is an exempt financial advisor under Financial Advisers Ac t, Chapter 110 (“FAA”) of Singapore and a subsidiary of Pareto Securities AS.
This report is directed solely to persons who qualify as "accredited investors", "expert investors" and "institutional investors" as defined in section 4A(1) Securities and Futures Act, Chapter 289 (“SFA”) of Singapore. This report is intended for general circulation amongst such investors and does not take into account the specifi c investment objectives, financial situation or particular needs of any particular person. You should seek advice from a financial adviser regarding the suitability of any product referred to in this report, taking into account your specific financial objectives, financial situation or particular needs before making a commitment to purchase any such product. Please contact Pareto Securities Pte Ltd, 16 Collyer Quay, # 2 7-02 Income at Raffles, Singapore 049318, at +65 6408 9800 in matters arising from, or in connection with this report.
Additional provisions on Recommendations distributed in the CanadaCanadian recipients of this research report are advised that this research report is not, and under no circumstances is it to be construed as an offer to sell or a solicitation of or an offer to buy any securities that may be described herein. This research report is not, and under no circumstances is it to be construed as, a prospectus, offering memorandum, advertisement or a public offering in Canada of such securities. No securities commission or similar regulatory authority in Canada has reviewed or in any way passed upon this research report or the merits of any securities described or discussed herein and any representation to the contrary is an offence. Any securities described or discussed within this research report may only be distributed in Canada in accordance with applicable provincial and territorial securities laws. Any offer or sale in Canada of the securities described or discussed herein will be made only under an exemption from the requirements to file a prospectus with the relevant Canadian securities regulators and only by a dealer properly registered under applicable securities laws or, alternatively, pursuant to an exemption from the dealer registration requirement in the relevant province or territory of Canada in which such offer or sale is made. Under no circumstances is the information contained herein to be con strued as investment advice in any province or territory of Canada nor should it be construed as being tailored to the needs of the recipient. Canadian recipients are advised that Pareto Securities AS, its affiliates and its authorized agents are not responsible for, nor do they accept, any liability whatsoever for any direct or consequential loss arising from any use of this research report or the information contained herein.
Distribution in United KingdomThis publication is produced in accordance with COBS 12.3 as Non-Independent Research and approved under part IV article 19 of The Financial Services and Markets Act 2000 (Financial Promotion) Order 2005 (the “FPO”) by Pareto Securities Limited for communication in the United Kingdom only to investment professionals as that term is defined in article 19(5) of the FPO. This publication is issued for the benefit of persons who qualify as eligible counterparties or professional clients and should be made available only to such persons and is exempt from the restriction on financial promotion in s21 of the Financial Services and Markets Act 2000 in reliance on provision in the FPO.
CopyrightThis publication or report may not be mechanically duplicated, photocopied or otherwise reproduced, in full or in part, under applicable copyright laws. Any infringement of Pareto Securities Research s copyright can be pursued legally whereby the infringer will be held liable for any and all losses and expenses incurred by the infringement.
This report is generated for Winfried Becker
Schaltbau Holding AG Sponsored Research Update
20 Feb 2019 Pareto Securities Research 11(13)
C o mpanies N o . o f shares H o ldings in % C o mpanies N o . o f shares H o ldings in %
Helgeland Sparebank 2,008,203 9.62% SpareBank 1 Østfo ld Akershus 1,139,560 9.20%
Pareto Bank ASA 10,842,964 18.50% Sparebanken Vest 4,506,060 7.63%
C o mpanies N o . o f shares H o ldings in % C o mpanies N o . o f shares H o ldings in %
Helgeland Sparebank 2,008,203 9.62% SpareBank 1 SM N 1,879,292 1.45%
NHST M edia Group AS 21,475 1.85% SpareBank 1 Østfo ld Akershus 1,139,560 9.20%
Pareto Bank ASA 10,842,964 18.50% Sparebanken M øre 311,739 3.15%
Selvaag Bolig ASA 2,174,147 2.32% Sparebanken Sør 460,589 2.94%
SpareBank 1 BV 1,557,140 2.48% Sparebanken Vest 4,506,060 7.63%
SpareBank 1 Nord-Norge 1,045,659 1.04%
A nalyst T o tal A nalyst T o tal A nalyst T o tal
C o mpany ho ldings* ho ldings C o mpany ho ldings* ho ldings C o mpany ho ldings* ho ldings
AF Gruppen 0 1,675 Helgeland Sparebank 0 1,700 Protector Forsikring 0 14,685
Aker 0 682 Höegh LNG 0 7,203 REC Silicon 0 157,742
Aker BP 0 5,050 Jæren Sparebank 0 500 SalM ar 0 130
Aker Solutions 0 1,825 Komplett Bank 0 99,934 Sandnes Sparebank 0 17,282
AKVA Group 0 1,500 Kongsberg Gruppen 0 5,901 Scatec Solar 0 35,635
Archer 0 72,770 KWS Saat 15 15 Seadrill 0 8,661
Atea 0 450 Lerøy Seafood 0 33,795 Selvaag Bolig 0 5,000
Austevoll Seafood 0 5,780 M agseis Fairfield 0 12,879 SpareBank 1 BV 0 17,700
Avance Gas 0 4,595 M onobank 0 1,355,000 SpareBank 1 Nord-Norge 0 30,000
Axactor 0 15,933 M owi 0 1,864 SpareBank 1 SM N 0 16,590
Bonheur 0 46,709 Nordic Semiconductor 0 6,000 SpareBank 1 SR-Bank 0 34,187
Borr Drilling 0 4,415 Norsk Hydro 0 113,795 SpareBank 1 Østlandet 0 4,041
BW LPG 0 5,569 Northern Drilling 0 6,060 Sparebanken M øre 0 6,550
DNB 0 35,072 Norwegian Air Shuttle 0 6,536 Sparebanken Sør 0 43,280
DNO 0 29,377 Norwegian Property 0 150,000 Sparebanken Øst 0 3,000
Entra 0 14,362 Ocean Yield 0 32,967 Storebrand 0 5,005
Equinor 0 10,101 Odfjell Drilling 0 8,649 Subsea 7 0 7,484
Europris 0 12,150 Orkla 0 24,026 Telenor 0 2,075
Flex LNG 0 11,825 Panoro Energy 0 5,670 TGS-NOPEC 0 2,050
Frontline 0 13,793 Pareto Bank 0 967,091 XXL 0 10,696
Gjensidige Forsikring 0 8,623 Petro leum Geo-Services 0 60,134 Yara International 0 19,786
Golden Ocean Group 0 1,824 Prosafe 0 5,984 Zenterio 0 78,865
Grieg Seafood 0 770
This overview is updated monthly (last updated 19.02.2019).
*Analyst holdings ref ers t o posit ions held by t he Paret o Securit ies AS analyst covering t he company.
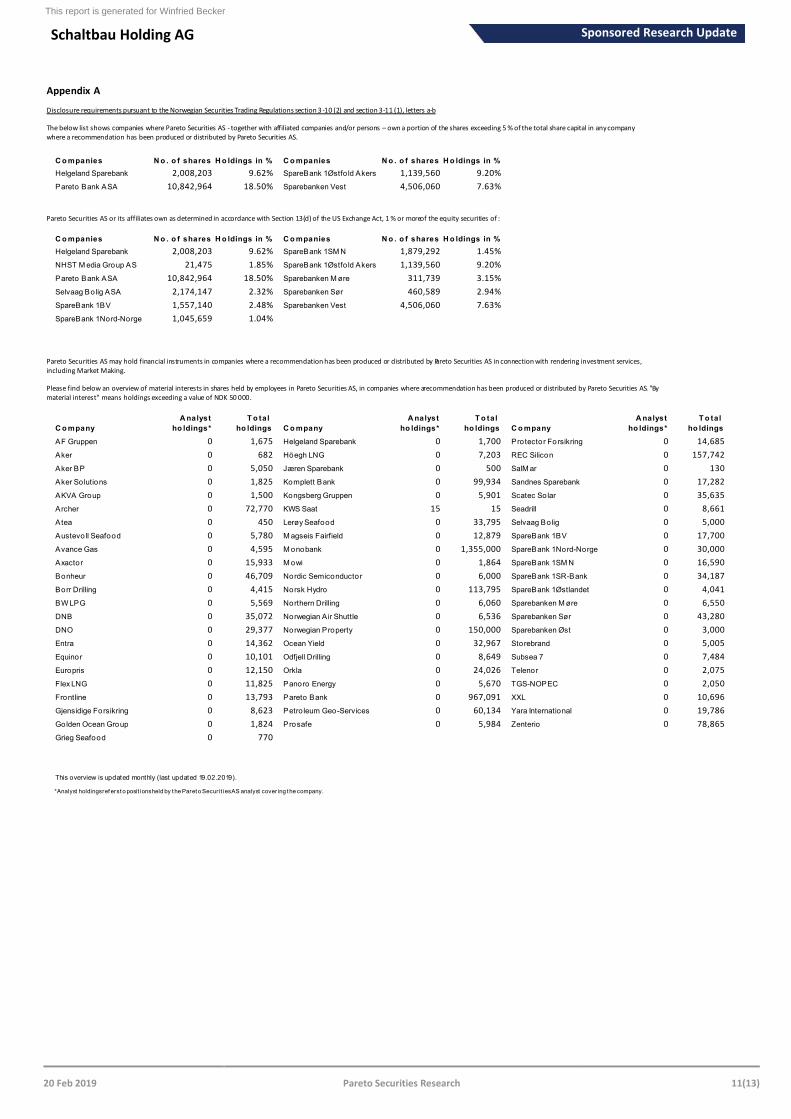
Appendix A
Disclosure requirements pursuant to the Norwegian Securities Trading Regulations section 3 -10 (2) and section 3-11 (1), letters a-b
The below list shows companies where Pareto Securities AS - together with affiliated companies and/or persons – own a portion of the shares exceeding 5 % of the total share capital in any company where a recommendation has been produced or distributed by Pareto Securities AS.
Pareto Securities AS or its affiliates own as determined in accordance with Section 13(d) of the US Exchange Act, 1 % or moreof the equity securities of :
Pareto Securities AS may hold financial instruments in companies where a recommendation has been produced or distributed by Pareto Securities AS in connection with rendering investment services, including Market Making.
Please find below an overview of material interests in shares held by employees in Pareto Securities AS, in companies where arecommendation has been produced or distributed by Pareto Securities AS. "By material interest" means holdings exceeding a value of NOK 50 000.
This report is generated for Winfried Becker
Schaltbau Holding AG Sponsored Research Update
20 Feb 2019 Pareto Securities Research 12(13)
Af r ica Energy Float el Okea AS
Akva Group Fort um Okeanis Eco Tankers
APC Forsikr ingsmæglere A/ S Gf init y Plc Pandion Energy
Arnarlax Gulf Keyst one Pet roleum Panoro Energy
At lant ic Sapphire AS Hert ha BSC GmbH Paret o Bank
Avida Holding AB Hunt er Group Pet ro Mat ad Limit ed
Bank Norwegian Ice Group Pet roleum Geo-Services
Bluewat er Holding Inst abank Pioneer Public Propert ies Finland Oy
Borealis Finance Jact el AS Point Resources AS
Borr Drilling Limit ed Klaveness Ship Holding Quant AB
Brado AB Lundin Pet roleum Rødovre Port Holding A/ S
Camanchaca Magseis Sand Hill Pet roleum
DNO ASA McDermot t Int ernat ional SAS
DOF ASA Monobank ASA Scat ec Solar
Dof Subsea AS Nemaska Lit hium Scorpio Tankers
Echo Energy NGEx Resources Shamaran
Eco At lant ic Oil and Gas Nort hern Drilling Sparebank 1 Øst landet
Eidesvik Of f shore Nort hmill Group AB SpareBank1 Buskerud-Vest f old
Eland Oil & Gas Norwegian Air Shut t le Sparebanken Vest
FFS Bidco Ocean Yield Union Mart ime Limit ed
Filo Mining Corp Odf jell Vant age Drilling
Flex LNG Odf jell Drilling
This overview is updated monthly (this overview is for the period 31.01.2018 – 31.01.2019).
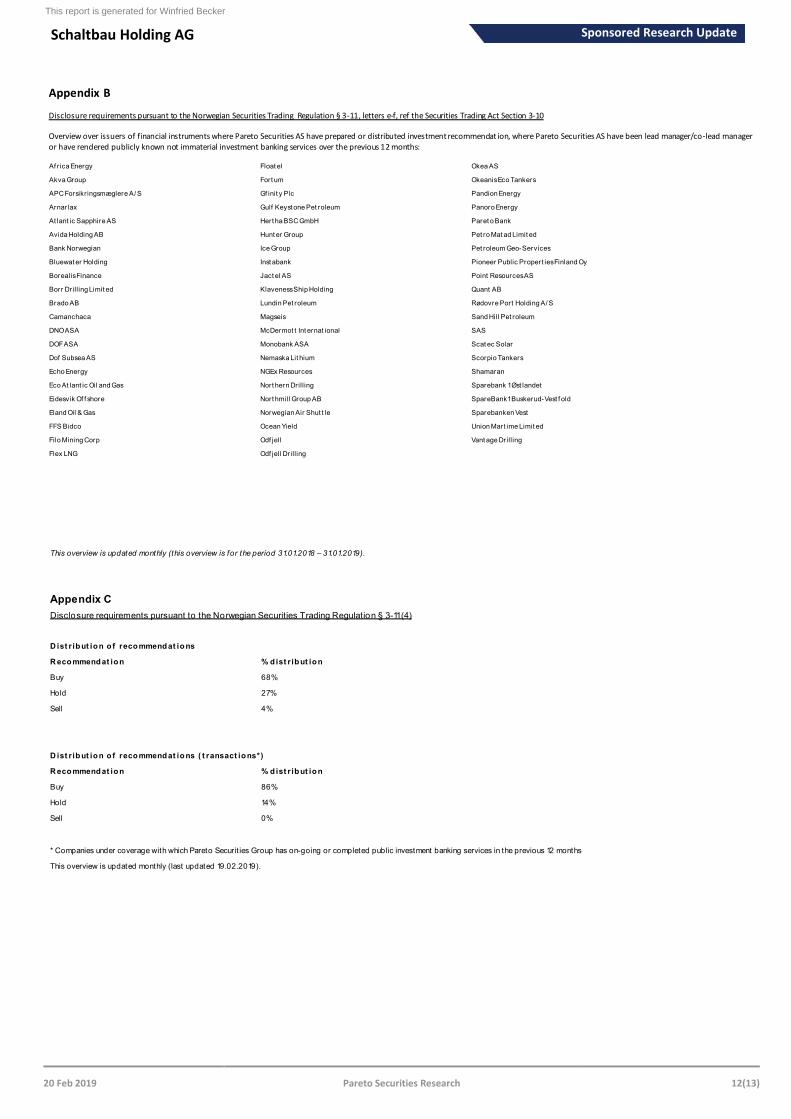
Appendix C
Disclosure requirements pursuant to the Norwegian Securities Trading Regulation § 3-11 (4)
R ecommendat ion % d ist r ibut ion
Buy 68%
Hold 27%
Sell 4%
R ecommendat ion % d ist r ibut ion
Buy 86%
Hold 14%
Sell 0%
* Companies under coverage with which Pareto Securit ies Group has on-going or completed public investment banking services in the previous 12 months
This overview is updated monthly (last updated 19.02.2019).
D ist r ibut ion o f recommendat ions
D ist r ibut ion o f recommendat ions ( t ransact ions*)
Appendix B
Disclosure requirements pursuant to the Norwegian Securities Trading Regulation § 3-11, letters e-f, ref the Securities Trading Act Section 3-10
Overview over issuers of financial instruments where Pareto Securities AS have prepared or distributed investment recommendat ion, where Pareto Securities AS have been lead manager/co-lead manager or have rendered publicly known not immaterial investment banking services over the previous 12 months:
This report is generated for Winfried Becker
Schaltbau Holding AG Sponsored Research Update
20 Feb 2019 Pareto Securities Research 13(13)
Azelio Jetpak Top Holding AB Sedana M edical Vostok New Ventures
Green Landscaping Holding M agnolia Bostad ShaM aran Petroleum
Cavotec Saltängen Property Invest Sedana M edical Tethys Oil
Cibus Nordic Real Estate SciBase Holding ShaM aran Petroleum Vostok Emerging Finance
Isofol M edical
2G Energy * Freenet M erkur Bank SCOUT24
Aixtron * Gesco * M LP * Siemens Healthineers AG
Baywa GFT Technologies * M OBOTIX AG SM T Scharf AG *
Biotest * Gigaset * OVB Holding AG Surteco Group *
Brenntag Heidelberg Pharma * Procredit Holding * Syzygy AG *
CORESTATE Capital Holding S.A. Hypoport AG PSI SOFTWARE AG * TAKKT AG
Demire Intershop Communicat ions AG PWO * Vapiano
Epigenomics AG* Logwin * RIB Software * va-Q-tec *
Euromicron AG * M anz AG * S&T AG * Viscom *
Eyemaxx Real Estate M AX Automation SE * Schaltbau Holding AG windeln.de
Adler M odemaerkte Daldrup & Söhne Intershop Communicat ions AG OVB Holding AG
Baywa Eyemaxx Real Estate M erkur Bank Schaltbau Holding AG
BB Biotech First Sensor M OBOTIX AG Siegfried Holding AG
comdirect Hypoport AG OHB SE Vapiano
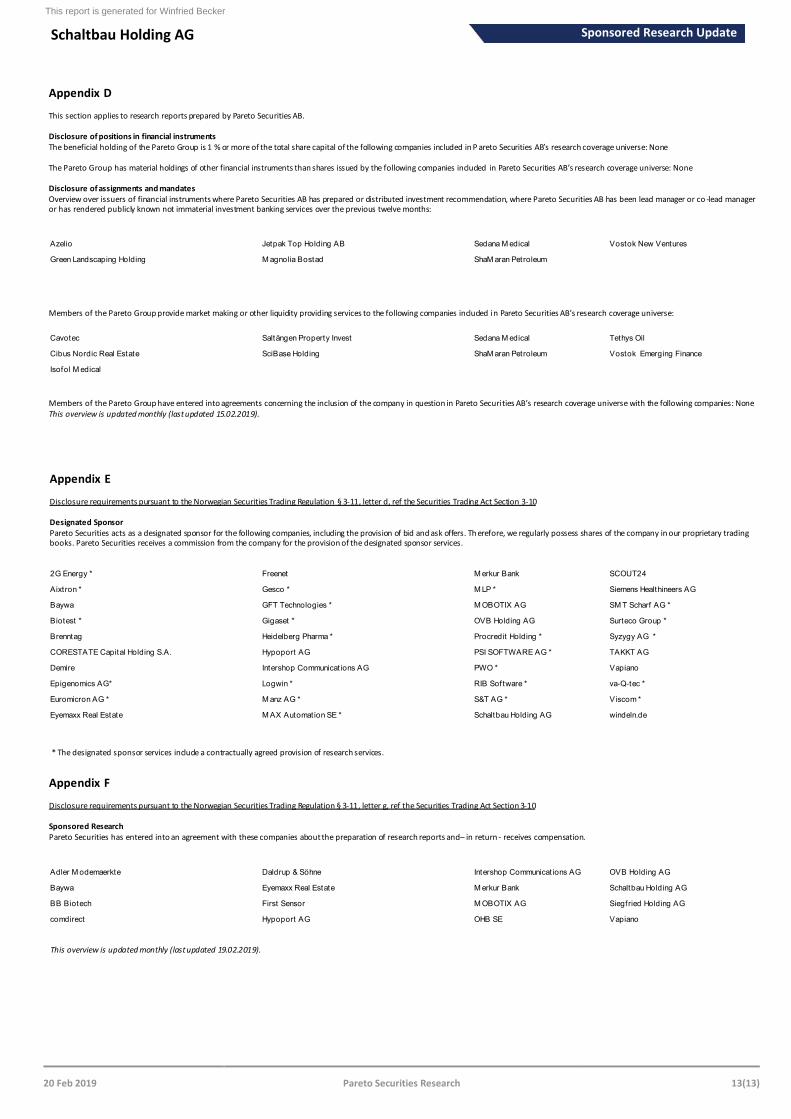
Appendix D
This section applies to research reports prepared by Pareto Securities AB.
Disclosure of positions in financial instruments The beneficial holding of the Pareto Group is 1 % or more of the total share capital of the following companies included in P areto Securities AB’s research coverage universe: None
The Pareto Group has material holdings of other financial instruments than shares issued by the following companies included in Pareto Securities AB’s research coverage universe: None
Disclosure of assignments and mandates Overview over issuers of financial instruments where Pareto Securities AB has prepared or distributed investment recommendation, where Pareto Securities AB has been lead manager or co -lead manager or has rendered publicly known not immaterial investment banking services over the previous twelve months:
Members of the Pareto Group provide market making or other liquidity providing services to the following companies included in Pareto Securities AB’s research coverage universe:
Members of the Pareto Group have entered into agreements concerning the inclusion of the company in question in Pareto Securities AB’s research coverage universe with the following companies: NoneThis overview is updated monthly (last updated 15.02.2019).
Appendix E
Disclosure requirements pursuant to the Norwegian Securities Trading Regulation § 3-11, letter d, ref the Securities Trading Act Section 3-10
Designated SponsorPareto Securities acts as a designated sponsor for the following companies, including the provision of bid and ask offers. Th erefore, we regularly possess shares of the company in our proprietary trading books. Pareto Securities receives a commission from the company for the provision of the designated sponsor services.
Appendix F
Disclosure requirements pursuant to the Norwegian Securities Trading Regulation § 3-11, letter g, ref the Securities Trading Act Section 3-10
Sponsored ResearchPareto Securities has entered into an agreement with these companies about the preparation of research reports and – in return - receives compensation.
* The designated sponsor services include a contractually agreed provision of research services.
This overview is updated monthly (last updated 19.02.2019).
This report is generated for Winfried Becker