Embed Size (px)
Citation preview

ISSN: 0798-1015 DOI: 10.48082/espacios-a20v41n49p14
https://www.revistaespacios.com 169
Vol. 41 (49) 2020 • Art. 14
Recibido/Received: 27/08/2020 • Aprobado/Approved: 14/12/2020 • Publicado/Published: 23/12/2020
Scenarios of the environmental impact of the industrial sector in the Metropolitan District of Quito - Ecuador Escenarios de impacto ambiental del sector industrial en el Distrito Metropolitano de Quito – Ecuador
ARROYO, Flavio R.1 DUTÁN, María I.2 REMACHE, Abel P.3
Abstract The Metropolitan District of Quito concentrates 37% of the large industries and is an axis of development in Ecuador. The activity carried out implies some modifications in the ecosystem, either due to the demand for resources, the emission of pollutants and the generation of waste that generate environmental impacts. For this study, a model based on system dynamics was generated, where different scenarios were shown until 2030. National and regional policies predict good results focused on sustainability. key words: industrial sector, environmental impacts, scenarios, sustainability Resumen El Distrito Metropolitano de Quito concentra el 37% de las grandes industrias y es un eje de desarrollo en Ecuador. La actividad desarrollada implica algunas modificaciones en el ecosistema, ya sea por la demanda de recursos, emisión de contaminantes y generación de residuos que originan impactos ambientales. Para este estudio se desarrolló un modelo basado en dinámica de sistemas, donde se mostraron diferentes escenarios hasta el 2030. Las políticas nacionales y regionales auguran buenos resultados enfocados en la sostenibilidad. Palabras clave: sector industrial, impactos ambientales, escenarios, sostenibilidad
1. Introduction
The industrial sector is fundamental for the economy of the countries, it has significant participation in GDP (Gross Domestic Product). The development of this sector has included multiple modifications in the environment that have undoubtedly caused a negative impact: water, soil and air contamination or excessive use of natural resources. In this sense, the WHO (World Health Organization) indicates that one in every nine deaths in the world is the result of pollution in the atmosphere, especially of contaminants derived from the combustion of fossils
1 Faculty of Engineering, Physical Sciences and Mathematics, Central University of Ecuador, University of Valladolid Spain. Contact e-mail: [email protected] 2 Faculty of Engineering, Physical Sciences and Mathematics, Central University of Ecuador. Contact e-mail: [email protected] 3 Faculty of Engineering, Physical Sciences and Mathematics, Central University of Ecuador. Contact e-mail: [email protected]

170
(Organización Panamericana de la Salud, 2016). According to the Report on the situation of CO2 emissions in the world, 2015 edition, 32,381 million tons of CO2 were generated, showing an increase of 0.8% compared to 2013. China, the United States, India, Russia and Japan are the largest emitters of CO2 as they have large industries, together they represented 60% of emissions; being 4.47 tons of CO2 the emission per inhabitant. In terms of sectors: 42.1% for the generation of electricity; 19.2% for the manufacturing and construction industries, and 17.5% for road transport (Foro de la Industria Nuclear Española, 2016). Regarding waste, worldwide between 7000 and 10 000 million were generated including urban, industrial, construction and demolition waste (Residuos Profesionales, 2015).
1.1. Industrial sector in Ecuador Ecuador has entered into an Industrial Policy 2016 - 2025, because the industry plays an indispensable role in the gradual impulse experienced by innovation, entrepreneurship, productivity, dynamism between sectors and presence in external markets. For this reason, this policy is aligned with the National Plan for Good Living and the Productive Transformation Agendas of Ecuador (Ministerio Coordinador de Producción, Empleo y Competitividad - Ministerio de Industrias y Productividad, 2015). The impacts generated by the industry are different, but they all affect the environment. Industry is the second sector with the highest energy consumption, after the transport sector, in the total consumption matrix (Arroyo & Miguel, 2019). Consumption of 11477 KBOE (Kilo Barrel of Oil Equivalent) was recorded in the base year. The BAU (Business As Usual) scenario projection achieve an energy demand of 27631 KBOE (Arroyo & Miguel, 2019). Among them is the emission of CO2, according to El Telégrafo, for 2010 in terms of emissions to the environment, Ecuador represented 0.15% of the world's total (El Telégrafo, 2015). When detailing greenhouse gases (GHG) emissions in 2010, Ecuador generated 49 Gt CO2, the sectors with the highest emission of these gases are: generation of electricity and heat (25%), sector of Agriculture, Forestry and Other Land Use (AFOLU) (25%), the industrial sector (21%) and finally the transport sector (14%) (Cárdenas, 2014). The increase in emissions in Ecuador has been produced, among other causes, by the increase in population, the indicators of population growth are above the average of the industrialized countries (Arroyo & Miguel, 2019). From the study carried out by Arroyo and Miguel (2019) on future scenarios of energy demand in Ecuador, it is concluded that the CO2 emissions in the base year were 27682 KT CO2, in 2016 they increased by 30%, reaching 35,913 KTCO2, and by 2030 the BAU Scenario projects 48129 KT CO2, an increase of 74% compared to the base year. This accelerated growth is mainly due to the use of highly polluting and inefficient non-renewable energy and the increase in energy production to meet the demand that has also grown over the last 15 years (Arroyo & Miguel, 2019).
1.2. The Metropolitan District of Quito At the Metropolitan District of Quito (MDQ) level, the population growth has been evident, until 2010 MDQ had 2239191 inhabitants; This growth requires and demands more and more services and infrastructure in the city, and commits its inhabitants to new consumption and production habits. According to Secretaría Nacional de Planificación y Desarrollo (SENPLADES), in Quito there has been an expansive, unbalanced and inequitable physical growth, which in turn affected functional and environmental deficiencies. By 2015, Quito's environmental and topographic characteristics were classified as irregular, since the construction of road systems is complicated, the concentration of the population has increased the built areas. The MDQ industry sector has experienced several stages in its development. As a consequence of massive demographic growth, industrial zones are already surrounded by residential neighborhoods, which is not compatible with the aforementioned sector and brings problems such as traffic and the lack of supply of general services.

171
According to Pricewaterhouse Coopers (2012), a diagnosis of the industrial sector of the MDQ based on data from the National Economic Census reveals that 90% of Pichincha's economy is located in Quito. In 2006, Pichincha contributed 19% of the total GDP, 80% of the GDP of the province, equal to one fifth of the national GDP. By 2010, Quito had 99,952 economic establishments, that is, 20% of the total nationwide, employing 547,067 individuals (27% of the total); and generating sales of US $ 66,651 million (45% of the total). Table 1 summarizes the manufacturing industries in the MDQ with the International Standard Industrial Classification (ISIC).
Table 1 Manufacturing industries in the MDQ Activity branch ISIC Code
Food products, beverages and tobacco 31 Textiles, clothing and leather 32 Wood and wood products 33 Manufacture of paper and printing 34 Chemicals and petroleum products 35 Non-metallic metals, except petroleum derivatives 36 Basic Metallic 37 Metal products, machinery and equipment 38 Other manufacturing industries 39
Note. Source: (Da Ros, 1992)
This study is based on reports issued by municipal and district entities. Industrial activities vary over the years, for example: by 2003, industrial activities included food and beverages, chemicals, metalworking, wood and cement (CORPAIRE, 2006). By 2005, they included food and beverages, paints and industrial solvents, metalworking and bodyworks, batteries, plastics, foundry, wood and cement (Distrito Metropolitano de Medio Ambiente, 2007). For consecutive years, certain activitie were included or not, so in 2007 cement was not taken into account (CORPAIRE, 2009); in 2009, the smelting and cement (Secretaría de Ambiente del DMQ, s.f); in 2011, the same activities as in 2009 were evidenced (Secretaría de Ambiente del DMQ, 2014).
2. Methodology
The research work was based on an exploratory study, which aims to examine a topic or research problem studied by other actors. Based on the collected data, a projection of each of the identified impacts is made till 2030, for which time series analysis was used in the programming language R (R Core Team, 2013). The time series were analyzed using the technique called ARIMA (Autoregressive Integrated Moving Average) (Mauricio, 2007). In some variables, the data were smoothed with the Hodrick-Prescott filter (Ahumada & Garegnani, 1999). With the projections made for each of the variables, the relationships between them were analyzed using Vensim software (Ventana Systems Inc., 2017), which is a modeling tool that allows documenting, conceptualizing, simulating, analyzing and optimizing models of dynamic of systems. To analyze, evaluate and identify the environmental impact, the simulation of the “Industrial Pollution” system and its behavior to 2030 was carried out.
2.1. Scenario analysis 2.1.1. BAU scenario The basic essence of the Business As Usual (BAU) is to state what to expect if current trends continue (Barton & Kopfmuller, 2016). In this case, the provision is maintained in the consumption of fuels, electricity and water, generation of waste and emission of pollutants into the air by the industrial sector of the DMQ, and future repercussions on the environment are expected.

172
Each of the variables constitutes time series ( ) where the behavior of a variable in time results from the composition of fundamental components such as: Trend ( ): is a smooth and regular movement of a long-term series, Cycle ( ): variations greater than a year that are not necessarily periodic, Seasonality ( ): regular movements of the series with periodicity less than one year, Noise ( ): variations of the series whose laws are unknown, their behavior is not systematic, it is impossible to predict them. It is composed of what is not explained with and (Esparza, s.f.). Resulting: An ARIMA model, particularly in time series, is a statistical model that uses variations and regressions of statistical data, to obtain guides that help to visualize a possible future, then this dynamic model based on time series predicts future estimates that are linked by past data (Gujarati & Porter, 2010). It is formulated by:
Where 𝑝 symbolizes the values taken by the variable throughout the previous 𝑝 periods (t-1, t-2,…, t-p)
the degree of influence of each previous value of the variable considered
represents the errors or residues of the variable in the previous moments (t-1, t-2,…, t-q)
The parameter means the degree of influence of the previous moments (Universidad Nacional Autónoma de México, s.f.) To build the "Industrial Pollution" model, historical data of variables have been introduced, which with subsequent treatment have calculated the Energy Demand, Growth Rates and Total Emissions. Next, the intervening variables are shown: Number of industries taken from Emissions Inventory Reports of the Metropolitan District of Quito according to the standardized methodology of the Global Protocol for Community Greenhouse Gas Emissions Inventories (GPC), carried out by the Municipality of the MDQ, CORPAIRE and the Secretary of Environment. Industrial GDP: it is historically built based on the GDP of Ecuador and the industrial GDP obtained from the World Bank and from a Strategic Diagnosis - Economic Axis elaborated by the Municipality of the Metropolitan District of Quito (CORPAIRE, 2006). Energy Demand Industrial Sector M. D. Quito: it is of auxiliary type in units of TJ, it is related to the demand level variables of each one of the fuels (diesel 1,4, electric diesel, bunker, Liquefied Petroleum Gas (LPG), wood) used by the MDQ industries. Total emissions of the MDQ Industries: it is an auxiliary variable, it is in units of tons, in turn they are also related to auxiliary variables. Water consumption: a level type variable, given in units of m3, is related to the flow of water consumption growth in the MDQ industries. The historical water consumption is constructed from the percentage of water used by the industrial sector of the MDQ (2.95%) and the total water consumption in the MDQ, obtained from a report titled ECCO (Environmental Climate Change Outlook) of the MDQ. Waste Generation Industries MDQ: The historical data was constructed from the total of solid waste in the MDQ prepared by Empresa Pública Metropolitana de Aseo (EMASEO) and the percentage equivalent to industrial waste (12.51%), obtained from the Service Plan of the Calderon zonal administration (EMASEO, 2010).
2.1.2. History of the Number of Industries in the MDQ For the year 2003 there were 277 establishments, it has decreased by 2% in a 9-year period (2003-2011). To carry out the projections, a filter called Hodrick-Prescott Filter was applied to extract the trend from the data.
2.1.3. Industrial GDP The term “industry” corresponds to the divisions from 10 to 45 of the ISIC (International Standard Industrial Classification), which includes the manufacturing industries (divisions from 15 to 37 of the ISIC) (United Nations,

173
2008). It includes the added value in exploitation of mines and quarries, manufacturing industries, construction, and electricity, gas and water supply.
2.1.4. Energy demand In the diesel projections a filter called Hodrick-Prescott filter was applied to extract the data trend. The growth projection in this scenario was carried out in the period 2011-2030.
2.1.5. Emissions Each energy source emits pollutants into the environment. To obtain emissions in equivalent tons of CO2, emission factors corresponding to each of the sources used were used (table 2).
Table 2 CO2 emission factors
CO2 EMISSION FACTORS (Kg/BOE) (Kg/TJ) Petroleum 448,54 73300 Natural Gas 343,29 56100 Firewood 685,36 112000 Products of cane 433,24 70800 Electricity - 0 Liquefied Petroleum Gas (LPG) 386,13 63100 Gasoline 424,06 69300 Kerosene and Turbo 439,97 71900 Diesel Oil 453,43 74100 Fuel Oil 473,63 77400 Asphalts and lubricants derived from Oil 448,54 73300
Source: (Arroyo & Bravo, 2017)
2.1.6. Water consumption The water consumption data were taken from user registers from 2003.
2.1.7. Waste generation In the BAU scenario, it is notorious that waste generation will grow if measures are not attempted to reduce this generation.
2.2. Scenario 1: National Policies 2.2.1. Industrial GDP This variable is important within the study, for this scenario the GDP projected to 2030 of the Plan Nacional del Buen Vivir (PNBV) is used, and by linking this value with the respective projected by the Central Bank of Ecuador to 2018, a rate is obtained of 4.61% (Senplades, 2012).
2.2.2. Industrial Establishments According to Instituto Nacional de Estadístcas y Censos (INEC), during the period 2009-2014 the manufacturing establishments in the country increased with an annual average of 8.6%, of course there were also company mortality rates in the period 2009-2010, the situation quickly recovered in 2010, moving to a net growth of 5.7% (INEC, 2016). By 2011, the growth was more noticeable, due to the economic expansion that the country experienced, in subsequent years such as 2012 and 2013, the number of establishments decreased with rates lower than the mentioned above ones, in 2014 it gains strength with a net rate of growth of 8.9%. For the same year the manufacturing industries had an excellent percentage of investment for constitution (Camino, Bermudez, & Avilés, 2018), which is why for the scenario 1 the most optimistic growth rate has been used.
2.2.3. Energy demand The Table 3 summarizes the measures and projects in the industrial sector for this scenario.
174
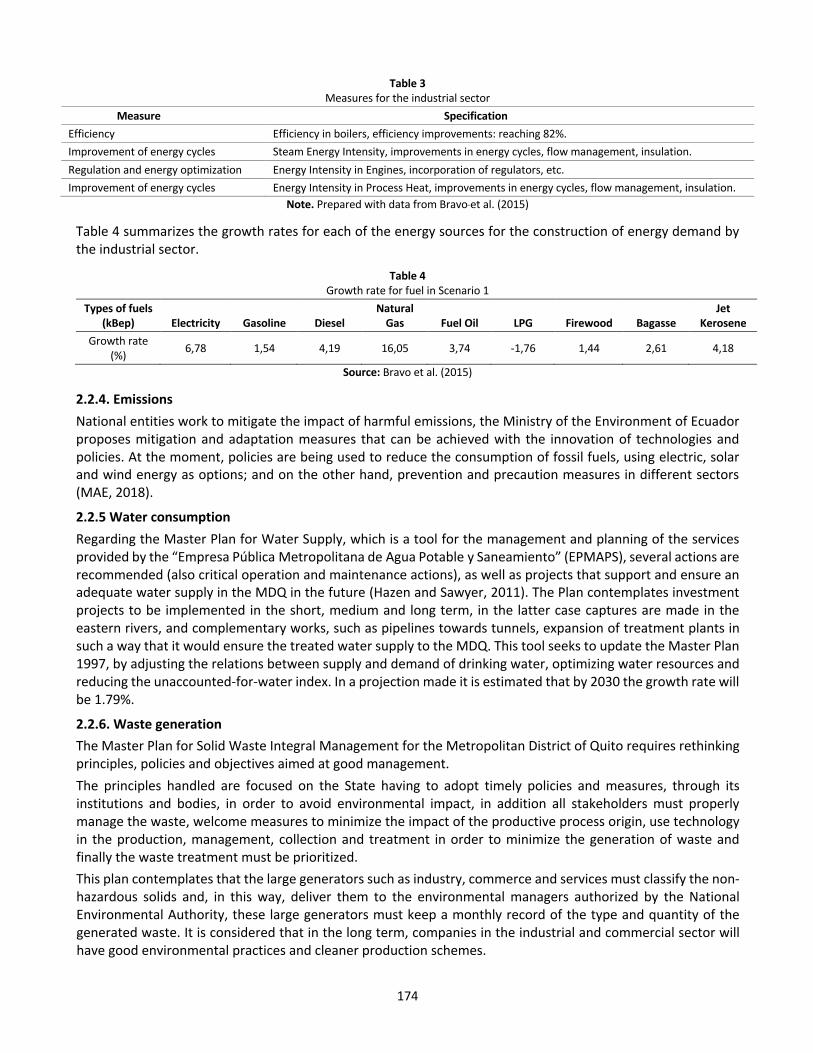
Table 3 Measures for the industrial sector
Measure Specification Efficiency Efficiency in boilers, efficiency improvements: reaching 82%. Improvement of energy cycles Steam Energy Intensity, improvements in energy cycles, flow management, insulation. Regulation and energy optimization Energy Intensity in Engines, incorporation of regulators, etc. Improvement of energy cycles Energy Intensity in Process Heat, improvements in energy cycles, flow management, insulation.
Note. Prepared with data from Bravo et al. (2015)
Table 4 summarizes the growth rates for each of the energy sources for the construction of energy demand by the industrial sector.
Table 4 Growth rate for fuel in Scenario 1
Types of fuels (kBep) Electricity Gasoline Diesel
Natural Gas Fuel Oil LPG Firewood Bagasse
Jet Kerosene
Growth rate (%) 6,78 1,54 4,19 16,05 3,74 -1,76 1,44 2,61 4,18
Source: Bravo et al. (2015)
2.2.4. Emissions National entities work to mitigate the impact of harmful emissions, the Ministry of the Environment of Ecuador proposes mitigation and adaptation measures that can be achieved with the innovation of technologies and policies. At the moment, policies are being used to reduce the consumption of fossil fuels, using electric, solar and wind energy as options; and on the other hand, prevention and precaution measures in different sectors (MAE, 2018).
2.2.5 Water consumption Regarding the Master Plan for Water Supply, which is a tool for the management and planning of the services provided by the “Empresa Pública Metropolitana de Agua Potable y Saneamiento” (EPMAPS), several actions are recommended (also critical operation and maintenance actions), as well as projects that support and ensure an adequate water supply in the MDQ in the future (Hazen and Sawyer, 2011). The Plan contemplates investment projects to be implemented in the short, medium and long term, in the latter case captures are made in the eastern rivers, and complementary works, such as pipelines towards tunnels, expansion of treatment plants in such a way that it would ensure the treated water supply to the MDQ. This tool seeks to update the Master Plan 1997, by adjusting the relations between supply and demand of drinking water, optimizing water resources and reducing the unaccounted-for-water index. In a projection made it is estimated that by 2030 the growth rate will be 1.79%.
2.2.6. Waste generation The Master Plan for Solid Waste Integral Management for the Metropolitan District of Quito requires rethinking principles, policies and objectives aimed at good management. The principles handled are focused on the State having to adopt timely policies and measures, through its institutions and bodies, in order to avoid environmental impact, in addition all stakeholders must properly manage the waste, welcome measures to minimize the impact of the productive process origin, use technology in the production, management, collection and treatment in order to minimize the generation of waste and finally the waste treatment must be prioritized. This plan contemplates that the large generators such as industry, commerce and services must classify the non-hazardous solids and, in this way, deliver them to the environmental managers authorized by the National Environmental Authority, these large generators must keep a monthly record of the type and quantity of the generated waste. It is considered that in the long term, companies in the industrial and commercial sector will have good environmental practices and cleaner production schemes.

175
For this scenario and based on this plan the data of a 5% decrease in the amount of waste per capita has been taken. At the same time, the culture of waste utilization is deepened, which also is based on the goal of 2018 National Development Plan, which is to utilize 20% of solid waste.
2.3. Scenario 2: Policies of Latin America and the Caribbean (LAC) It implies adopting measures or policies established at the level of Latin America and the Caribbean that focus on mitigating environmental impacts, some of which have not been reached due to poor management. It seeks a good economic development, a demand for energy based on renewable energies; In the case of water and waste, the efficient use of resources such as water, reduction in the emission of pollutants and the generation of waste have not been achieved. This comparison with Latin America and the Caribbean has been made because Ecuador is part of this region and its economic, population and industrial dynamics resemble some of these countries.
2.3.1. Industrial GDP It has experienced favorable growth throughout the last decade of 2000 due to the boom in raw materials. A report that analyzes Latin America and the Caribbean until the year 2030, realizes several scenarios, one of them, corresponding to the general picture, estimates that the economy will grow from USD 6.2 billion in 2015 to USD 9.2 billion in 2030, that is to say, with a growth rate of 2.4%, then the annual GDP growth is slightly higher than the GDP of the United States (2.2%) (Marczak, Engelke , Bohl, & Saldarriaga , 2016). The growth in the region is affected by slow growth, riots, crises and setbacks in South America, Argentina, Venezuela and Brazil respectively (World Bank, 2018).
2.3.2. Industrial establishments Under the GDP premises in LAC, the growth experienced by the industrial establishments is 8.2%.
2.3.3. Energy demand The industrial sector in this region aims at a technological innovation and it is considered the displacement of firewood by electricity and natural gas. To model this scenario, growth rates are used (table 5) for the different sources of energy.
Table 5 Fuel growth rate in Scenario 2
Types of Fuel
Natural gas Electricity
Products of cane Coke Fuel Oil
Firewood (wood)
Diesel Oil
Other biomass LPG
Other sources
Growth Rate (%) 2,67 2,11 4,56 3,58 2,82 -1,4 2,89 4,09 -2.00 4,21
Source: Organización Latinoamericana de Energía, OLADE (2013)
The decrease in firewood is due to the fact that the use of firewood indicates the lack of access to modern energy sources, it seeks to eradicate the impacts generated by its combustion in improper and inefficient conditions. The production of renewable and clean energy sources is an objective of national, regional and local entities of Latin America and the Caribbean (LAC) countries. In this way, “energy security is guaranteed in an economy subject to limits on carbon emissions and can help countries develop a competitive advantage in this expanding economic sector” (OCDE, 2017, p. 80).
2.3.4. Emissions It is obtained from the demand for energy. LAC has dabbled with initiatives to reduce CO2 emissions, these incentives in the long-term bring benefits, the countries of the region strive to increase the impulses in terms of mitigation and adaptation to climate change, these measures drive the 2030 Agenda by reducing vulnerability and promoting the growth of the economy and the insertion of clean energies.
2.3.5. Water consumption
176
For this scenario the forecasts of UNESCO have been used, that say that for 2000-2050 the increase in water demand of the whole industry will be estimated at 400% (UNESCO, 2015). For LAC, water is a common and fundamental resource, it is necessary to analyze that South America is one of the regions with the greatest water supply, it has 26% of the planet's water and, on the other hand, it has only 6% of the population. This means that most of the countries of the region have water availability, but at the same time, having more water resources increases its consumption by all sectors.
2.3.6. Waste generation One of the problems of LAC is the lack of good solid waste management. At urban level the problem is more noticeable, due to the generation of large amounts of waste. Management has improved in some respects in recent years; but it is not striding along because the plans and programs proposed by governments are truncated at the end of their period. Thus, for the next 20 years, there is no plan in such a way that adequate treatment and final disposal coverage is reached (BVSDE, 2009). “In LAC, the agenda of the integral management of the RSU has aspects that still need priority attention, since sub-financing predominates for the final disposition of the RSU” (Hernández, et al., Generación y composición de los residuos sólidos urbanos en América Latina y el Caribe, 2015, p. 12). This problem lies in the lack of trained personnel in waste management (especially in areas that do not belong to the mega cities), on the one hand the waste coverage is high but it differs in countries, the appropriate final disposition is adequate and that 54% are deposited in waste disposal sites, 18% in uncontrolled landfills and 25% in open dumping sites (Hernández, et al., 2015). The average annual increase in solid waste generation for developed countries is 3.2% and 4.5%, while for developing countries the average rate is 2.5%. It is necessary to comply with the proposals of the Earth Summit (Sáez & Urdaneta, 2014).
3. Results
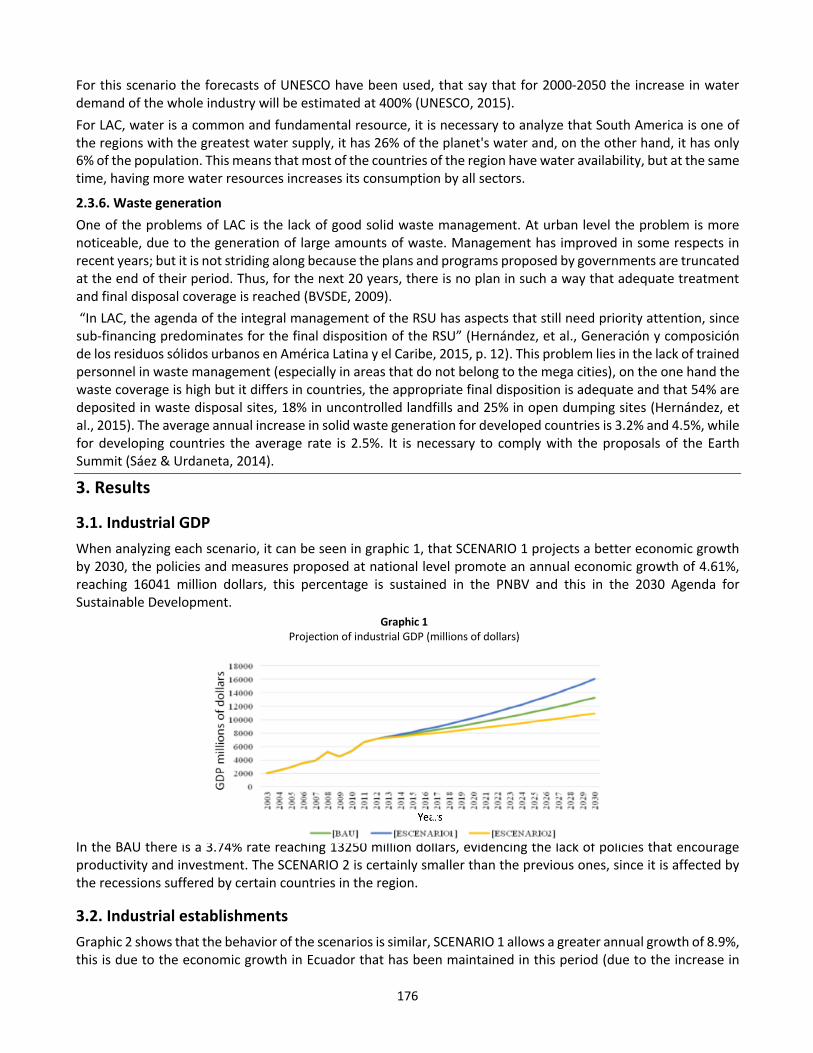
3.1. Industrial GDP When analyzing each scenario, it can be seen in graphic 1, that SCENARIO 1 projects a better economic growth by 2030, the policies and measures proposed at national level promote an annual economic growth of 4.61%, reaching 16041 million dollars, this percentage is sustained in the PNBV and this in the 2030 Agenda for Sustainable Development.
Source: authors own elaboration
In the BAU there is a 3.74% rate reaching 13250 million dollars, evidencing the lack of policies that encourage productivity and investment. The SCENARIO 2 is certainly smaller than the previous ones, since it is affected by the recessions suffered by certain countries in the region.
3.2. Industrial establishments Graphic 2 shows that the behavior of the scenarios is similar, SCENARIO 1 allows a greater annual growth of 8.9%, this is due to the economic growth in Ecuador that has been maintained in this period (due to the increase in
Graphic 1 Projection of industrial GDP (millions of dollars)

177
price of oil in the world market). Of course, crises are observed but then they resume a growth trend. It is intuitive to expect an increase of industrial establishments; having more capital, the establishments begin their operations with greater patrimonial support and working capital. In this scenario for 2030, 1964 establishments are reached. For the BAU and SCENARIO 2, the annual growth rate is 8.6% and 8.2%, respectively.
3.3. Energy demand When performing the analysis of the scenarios, in graphic 3 it is obtained that in the SCENARIO 2 there is a considerable reduction, with an annual rate of 2.7% reaching 16907 TJ by 2030 and equivalent to a 66% growth in the period 2012-2030. In comparison with the SCENARIO 1 and BAU, there is a saving of 8163 TJ and 3495 TJ, respectively. This shows that existing policies at the regional level focused on technological innovation in the industrial sector lead to a better demand for energy, this innovation is justified by the ISO 5000 standard, which encourages the processes of continuous improvement in energy management systems. This standard provides management strategies to increase energy efficiency, lower costs and achieve improvement in energy efficiency.
Source: authors own elaboration
3.4. Emissions According to graphic 4, in the SCENARIO 2 there is a decrease in CO2-eq emissions, by 2030 9209882 tons of CO2-eq will be emitted, with an annual rate of 2.9%. When compared with the BAU and the SCENARIO 1, a saving of 876419 tons of CO2-eq and 2082008 million tons of CO2-eq is achieved. This shows that the policies proposed at the regional level are more optimal in mitigating CO2 emissions, as well as the policies of countries that are developed regionally.
Graphic 3 Projection of energy demand by the industrial sector (TJ)
Graphic 2 Projection of the number of industrial establishments
0
5000
10000
15000
20000
25000
30000
2003 2005 2007 2009 2011 2013 2015 2017 2019 2021 2023 2025 2027 2029
TJ
year
[BAU] [ESCENARIO1] [ESCENARIO2]
0
500
1000
1500
2000
2500
2003
2004
2005
2006
2007
2008
2009
2010
2011
2012
2013
2014
2015
2016
2017
2018
2019
2020
2021
2022
2023
2024
2025
2026
2027
2028
2029
2030
Indu
stria
l est
ablis
hmen
ts
year
[BAU] [ESCENARIO1] [ESCENARIO2]

178
3.5. Water consumption When analyzing each of the scenarios in the Graphic 5, it is evident that the SCENARIO 1 is the best because by 2030 it demands 7255663 m3, as a result of an annual rate equivalent to 1.79%, when comparing with BAU and the SCENARIO 2, a saving of 754146 m3 and 1249724 m3 respectively is achieved. It is obvious that the measures contemplated in the Master Plan, that constitute a strategy of management, planning and execution in the short, medium and long term of the services provided by EPMAPS, are the most suitable ones. The SCENARIO 2 is affected by the lack of plans on water consumption mitigation, the availability that it has at the regional level is utilized.
3.6 Waste generation When looking at graphic 6, the SCENARIO 1 shows less generation of solid waste, reaching 84954 tons by 2030, with a negative rate of 0.73%, due to the application of policies and measures aimed at an adequate and participatory management by all entities immersed in the industrial sector and promoting recycling. On the other hand, the SCENARIO 2 experiences a growth rate of 2.5% per year as a result of the truncation of plans by the change of governments. This scenario resembles the BAU.
0
2000000
4000000
6000000
8000000
10000000
12000000
2003 2005 2007 2009 2011 2013 2015 2017 2019 2021 2023 2025 2027 2029
TJ
year
[BAU] [ESCENARIO1] [ESCENARIO2]
Graphic 4 Projection of energy demand by the industrial sector (TJ)
Graphic 5 Projection of water consumption by the industrial sector (m3)
0
2000000
4000000
6000000
8000000
10000000
20032005200720092011201320152017201920212023202520272029
m3
year
[BAU] [ESCENARIO1] [ESCENARIO2]

179
4. Conclusions
In order to project the different impacts generated by the industrial sector of the MDQ during the period 2003-2030, the systems dynamics and the Vensim software are used to model different scenarios and analyze possible effects in the future, in this way acting to mitigate these impacts with national policies and initiatives that go hand in hand with an efficient, productive and environmentally responsible industrial sector. When analyzing the historical data it is observed that the industrial establishments in the MDQ have experienced a negative 2% growth in the historical data, this is due to the fact that the historical data is in agreement with establishments that work with adequate permits and licenses and are constantly monitored by the Secretary of Environment and Municipality of the MDQ, nevertheless operation without the corresponding permits exists too. These establishments demand energy and water for their operation and in turn generate waste. The demand for energy is mainly made up of diesel, electricity and bunker, the use of LPG and wood has decreased. The water consumption of the industrial sector of the MDQ is equivalent to 2.95%, this percentage is not so high, but if it continues with a growth of industries, this consumption will increase and therefore, the discharge of wastewater into rivers without any treatment will increase as well. Inherent to industrial activity there is the generation of waste that corresponds to 12.51% of the total, according to the type of industry, waste of different types will be obtained that will be disposed of in sanitary landfills in a few cases, without taking advantage of them and increasing the volume of landfills. The BAU Scenario shows that the industrial sector for energy demand depends on the use of petroleum and electricity fuels, so by 2030 it will reach an energy demand of 20403 TJ and generate 10086301 tons CO2-eq, the trend of these variables is to grow, that is why it is necessary to take measures in terms of more transcendental energy policies either with the help of international entities or with the cooperation of all agencies and institutions with similar objectives. The results of the simulation show that the SCENARIO 1 offers greater economic growth by 2030 because it is based on national policies and measures that promote growth, thus achieving an annual rate of 4.61% and this represents an industrial GDP of 16041 million dollars. In the same way, to provide a better economic development, this scenario also indicates a better development of industrial establishments projecting the existence of 1964 establishments. Regarding energy demand, the most suitable scenario is SCENARIO 2, since by 2030 it grows at a lower rate compared to the other scenarios, demanding 16,907 TJ; With this value, a lower CO2-eq emissions projection is also obtained, corresponding to 9209882 tons; emphasizing the importance of policies at the regional level that in turn include industrialized countries. In addition, for the consumption of water it is necessary that the national policies present in the SCENARIO 1 offer a better result, demanding 7255663 m3 by 2030, an amount that shows savings in terms of the other scenarios. Likewise, SCENARIO 1 shows better results in the generation of waste, because the proposed policies are aimed at reducing the amounts of waste, projecting the generation of 84,954 tons by 2030.
0
20000
40000
60000
80000
100000
120000
140000
2003 2005 2007 2009 2011 2013 2015 2017 2019 2021 2023 2025 2027 2029
ton
year
[BAU] [ESCENARIO1] [ESCENARIO2]
Graphic 6 Projection of solid waste generation by the industrial sector (ton)

180
Finally, the industrial characteristics evidenced in the MDQ make it become an area where specialized industrial activities coexist within a varied industrial ecosystem. Due to aspects related to disorganization and lack of planning for productive growth in the area, environmental and social impacts that require attention by all the entities of the industry have been evidenced.
References
Ahumada, H., & Garegnani, M. L. (1999). Hodrick-Prescott Filter in Practice. Económica, 61-76.
Arroyo, F., & Miguel, L. J. (2019). Analysis of energy demand scenarios in Ecuador: National government policy perspectives and global trend to reduce CO2 emissions. International Journal of Energy Economics and Policy, 1-11.
Barton, J., & Kopfmuller, J. (2016). Santiago 2030 Escenarios para la Planificación Estratégica. En Análisis de escenarios: enfoque conceptual y base analítica (pág. 108). Santiago: Colección Estudios Urbanos UC.
BVSDE. (2009). El Reto de los Residuos Sólidos en América Latina y El Caribe. Obtenido de http://www.bvsde.paho.org/bvsacg/guialcalde/1salud/1-4salud.htm
Camino, S., Bermudez, N., & Avilés, P. (2018). Análisis Sectorial: Panorama de la Inversión Empresarial en el Ecuador 2013-2017.
Cárdenas, J. C. (2014). Estudio de la reducción de emisiones de carbono en el Ecuador. Quito.
CORPAIRE. (2006). Inventario de Emisiones del Distrito Metropolitano de Quito 2003. Quito.
CORPAIRE. (2009). Inventario de Emisiones Atmosféricas DMQ 2007. Quito: Corpaire.
Da Ros, G. (1992). La contaminación de aguas en Ecuador: una aproximación económica. Quito: Abyayala.
Distrito Metropolitano de Medio Ambiente. (2007). Inventario de Emisiones del DMQ 2005. Quito.
El Telégrafo. (12 de Noviembre de 2015). Obtenido de https://www.eltelegrafo.com.ec/noticias/sociedad/4/las-emisiones-ecuatorianas-apenas-representan-el-015-del-total-en-el-mundo
EMASEO. (2010). Plan de servicios de aseo Administracion Calderón . Quito.
Esparza, C. (s.f.). ieg CSIC. Obtenido de Series Temporales: http://humanidades.cchs.csic.es/cchs/web_UAE/tutoriales/PDF/SeriesTemporales.pdf
Foro de la Industria Nuclear Española. (Diciembre de 2016). Las emisiones de CO2 en el mundo, en un informe de la Fundación Empresa y Clima. Obtenido de https://www.foronuclear.org/es/newsletters/junio-2017/123084-las-emisiones-de-co2-en-el-mundo-en-un-informe-de-la-fundacion-empresa-y-clima
Gujarati, D. N., & Porter, D. C. (2010). Econometría. En Econometría de series de tiempo: pronósticos. México, D.F.: McGraw Hill.
Hazen and Sawyer. (2011). Estudios de Actualización del Plan Maestro Integrado de Agua Potable y Alcantarillado para el DMQ. Quito.
Hernández, M., Aguilar, Q., Taboada, P., Lima, R., Eljaiek, M., Márquez, L., & Buenrostro, O. (2015). Generación y composición de los residuos sólidos urbanos en América Latina y el Caribe. Revista Internacional de Contaminación Ambiental, 12.
Hernández, M., Aguilar, Q., Taboada, P., Lima, R., Eljaiek, M., Márquez, L., & Buenrostro, O. (2015). Generación y composición de los residuos sólidos urbanos en América Latina y el Caribe. Revista Internacional de Contaminación Ambiental, 12.

181
INEC. (2016). Panorama Laboral y Empresarial del Ecuador. Quito.
MAE. (2018). MAE trabaja en programas de mitigación y adaptación para reducir emisiones de Co2 en Ecuador. Obtenido de http://www.ambiente.gob.ec/mae-trabaja-en-programas-de-mitigacion-y-adaptacion-para-reducir-emisiones-de-co2-en-ecuador/
Marczak, J., Engelke , P., Bohl, D., & Saldarriaga , A. (2016). América Latina y el Caribe 2030: Escenarios futuros. Washington DC.
Mauricio, J. A. (2007). Introducción al Análisis de Series Temporales. Madrid: Universidad Complutense de Madrid.
Ministerio Coordinador de Producción, Empleo y Competitividad - Ministerio de Industrias y Productividad. (2015). Política Industrial del Ecuador 2016-2018. Obtenido de https://www.industrias.gob.ec/wp-content/uploads/2017/01/politicaIndustrialweb-16-dic-16-baja.pdf
OCDE. (2017). Activos con Ámerica Latina y el Caribe. París.
OLADE. (2013). Simulación de Medidas de Eficiencia Energética en los Sectores Industrial y Transporte de América Latina y el Caribe al Año 2030. Quito.
Organización Panamericana de la Salud. (2016). Contaminación del Aire Ambiental. Obtenido de https://www.paho.org/hq/index.php?option=com_content&view=article&id=12918:ambient-air-pollution&Itemid=72243&lang=es
PricewaterhouseCoopers. (2012). Municipio de Quito. Resultados de estudio de mercado - Pre Factibilidad - Parque Industrial Itulcachi. Quito: PwC.
R Core Team. (2013). The R Project for Statistical Computing. Obtenido de https://www.r-project.org/
Residuos Profesionales. (08 de Septiembre de 2015). Cada año se producen entre 7.000 y 10.000 millones de toneladas de residuos en el mundo. Obtenido de https://www.residuosprofesional.com/millones-toneladas-residuos-urbanos/
Sáez, A., & Urdaneta, J. (2014). Manejo de residuos sólidos en América Latinay el Caribe. Omnia, 121-135.
Secretaría de Ambiente del DMQ. (2014). Informe Final Inventario de Emisiones de Contaminantes Criterio, DMQ 2011. Quito.
Secretaría de Ambiente del DMQ. (s.f). Inventario de emisiones atmósfericas del Distrito Metropolitano de Quito 2009. Quito.
Senplades. (2012). Plan Nacional del Buen Vivir - PNBV - 2012-2016. Quito.
UNESCO. (2015). Agua para un Mundo Sostenible. World Water.
United Nations. (2008). International Standard Industrial Classification of All Economic Activities. New York: UN.
Universidad Nacional Autónoma de México. (s.f.). Repositorio digital de la Facultad de Ingeniería. Obtenido de Modelación ARIMA: http://www.ptolomeo.unam.mx:8080/xmlui/bitstream/handle/132.248.52.100/363/A7.pdf?sequence=7
Ventana Systems Inc. (2017). Vensim PLE. Obtenido de https://vensim.com/
World Bank. (2018). América Latina y el Caribe : panorama general. Obtenido de https://www.bancomundial.org/es/region/lac/overview

182
Annexes Figure 1
Structure of the simulation model for environmental impact analysis
Esta obra está bajo una Licencia Creative CommonsAttribución-NoCommercial 4.0 International