Embed Size (px)
Citation preview

103
NSave Nature to Survive
4(1): 103-106, 2010QUARTERLY
LAND USE AND LAND COVER CHANGE DRIVEN BY GREEN
MARBLE MINING IN KHERWARA TEHSIL UDAIPUR (INDIA) USING
REMOTE SENSING AND GIS
GIRIRAJ KUMAR SONGARA* AND NIDHI RAI
Department of Environmental Sciences,
Mohan Lal Sukhadia University, Udaipur, Rajasthan - 313 001
E-mail: [email protected]
INTRODUCTION
Land is a fundamental factor of production and through much of the course of
human history. It has been tightly coupled with economic growth. Often improper
land use is causing various forms of environmental degradation. Mining activity
is mostly land oriented activity and can only be carried out at palaces where
minerals exit. Mining activities cause considerable damage to the land environment
because of the excavation and dumping of waste materials. The first and foremost
consequence of any mining operation is removal top soil layer and present
vegetation reduction and land degradation. The change in any form of land use
is largely related either with external forces and the pressure built up within the
system (Bisht and Kothyari, 2001). The land use system is highly dynamic which
undergoes significant changes according to the changing socioeconomic and
natural environment (Kam, 1995; Luque, 2000). The importance of mapping
land-use classes and monitoring their changes with time has been widely
recognized in the scientific community. Remote sensing and geographical
information systems (GIS) are important tools for studying land-use patterns and
their dynamics. The changing land-use patterns require a frequent updating of
the existing land-use maps of the area. Remote sensing provides multi-spectral
and multi-temporal synoptic coverage for any area of environmental interest. The
satellite data provides a permanent and authentic record of the land-use patterns
of a particular area at any given time which can be re-used for verification and re-
assessment. On the other hand, GIS provides the facility to integrate multi-
disciplinary data for dedicated interpretations in an easy and logical way (Prakash
and Gupta, 1998). This integrated approach proves to be a time-saving and cost-
effective pathway. It is necessary to initiate comprehensive study for generating or
to update information on land use pattern. Such data would not only provide
data base required for environmental management planning, but would also
enable to identify the changes taking place due to industrialization and facilitate
the suggestion of remedial measures required to maintain the ecological balance
(Legg, 1990). Earlier works have described its potential in various aspects of
mining activity, viz. land use change detection in mining area (Ghosh and Ghosh,
1991; Singh et al., 1997; Prakash and Gupta, 1998) environmental impact of
mining (SAC, 1990; Rathore and Wright, 1993; Ghosh 1989). An attempt has
been made to map the land use/ land cover information using remote sensing
satellite data for two years (1999 and 2004) and to understand rate of land use/
land cover changes in time and space as well as to assess root cause of these
changes in the Kherwara tehsil (Udaipur) of southern Rajasthan using Arc GIS 9.2
package.
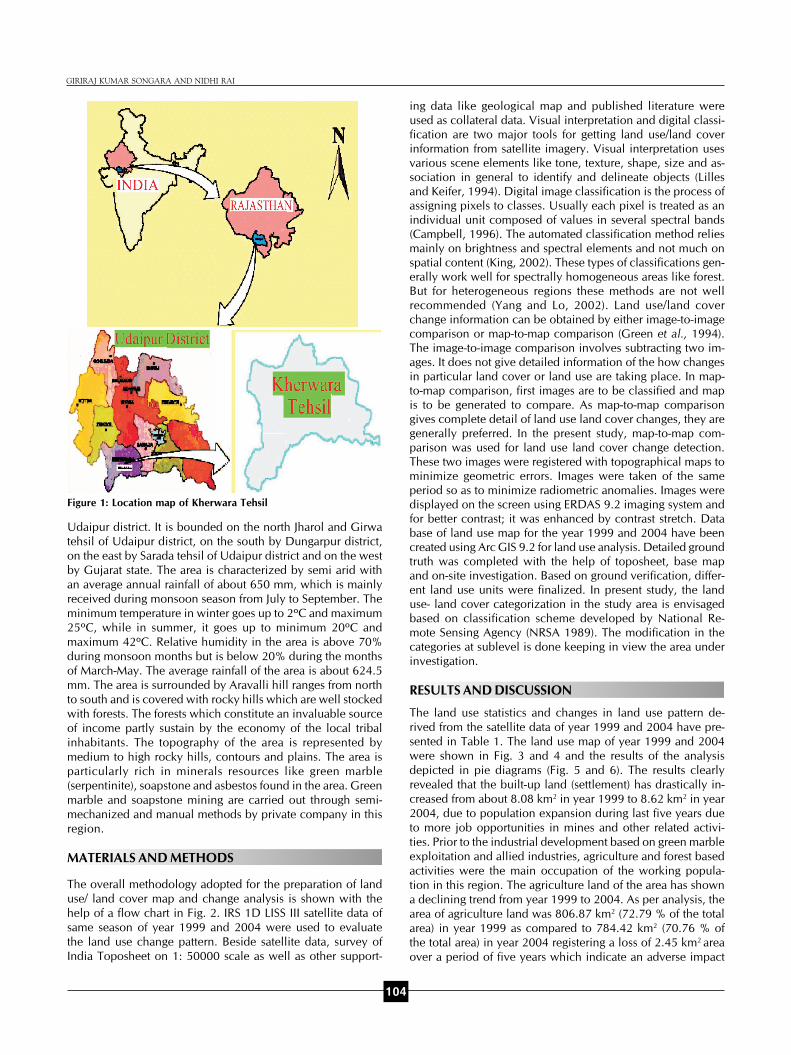
Study area
The area of present study (Fig. 1) is Kherwara tehsil of Udaipur district (Rajasthan).
Kherwara tehsil is situated in 23º48’08'’- 24º’14’10'’ NL and 73º21’11'’- 73º50’15'’
EL covering geographical area of about 1108.53 km2 and located southwest of
Received : 12.10.2009
Revised : 10.12.2009
Accepted : 05.02.2010
*Corresponding author
KEY WORDSLand use/ Land cover change
Green marble mining
ABSTRACT
Anthropogenic activities like mining activity
have great influence on fragile semi arid
ecosystem. For sustainable use of natural
resources it is very important to understand
land use/ land cover and its implications on
semiarid ecosystem. Remote sensing and GIS
technique can be an excellent source for
mapping, monitoring and understanding these
changes. In present study, the IRS-1D LISS III
satellite sensor data were used to assess the
rate of change in the land use pattern of green
marble and soapstone mining area of Kherwara
tehsil of Udaipur district, Rajasthan. In the
present study, the land use maps of year 1999
and 2004 were generated though the visual
interpretation of IRS -1D LISS III images
supported by ground truths and the majority
of changes are identified in agricultural land,
mining/ industrial waste land and degraded
forest areas. The comparative study shows that
the mining and industrial waste occupies
hardly about 0.11 km2 in year 1999 and
increased to about 13.08 km2 in year 2004
due to conversion of agricultural land and
degraded forest areas into mining area. The
result of the study indicates present scenarios
and mining impact in Kherwara Tehsil of
southern Rajasthan.
104
GIRIRAJ KUMAR SONGARA AND NIDHI RAI
Udaipur district. It is bounded on the north Jharol and Girwa
tehsil of Udaipur district, on the south by Dungarpur district,
on the east by Sarada tehsil of Udaipur district and on the west
by Gujarat state. The area is characterized by semi arid with
an average annual rainfall of about 650 mm, which is mainly
received during monsoon season from July to September. The
minimum temperature in winter goes up to 2ºC and maximum
25ºC, while in summer, it goes up to minimum 20ºC and
maximum 42ºC. Relative humidity in the area is above 70%
during monsoon months but is below 20% during the months
of March-May. The average rainfall of the area is about 624.5
mm. The area is surrounded by Aravalli hill ranges from north
to south and is covered with rocky hills which are well stocked
with forests. The forests which constitute an invaluable source
of income partly sustain by the economy of the local tribal
inhabitants. The topography of the area is represented by
medium to high rocky hills, contours and plains. The area is
particularly rich in minerals resources like green marble
(serpentinite), soapstone and asbestos found in the area. Green
marble and soapstone mining are carried out through semi-
mechanized and manual methods by private company in this
region.
MATERIALS AND METHODS
The overall methodology adopted for the preparation of land
use/ land cover map and change analysis is shown with the
help of a flow chart in Fig. 2. IRS 1D LISS III satellite data of
same season of year 1999 and 2004 were used to evaluate
the land use change pattern. Beside satellite data, survey of
India Toposheet on 1: 50000 scale as well as other support-
ing data like geological map and published literature wereused as collateral data. Visual interpretation and digital classi-fication are two major tools for getting land use/land coverinformation from satellite imagery. Visual interpretation usesvarious scene elements like tone, texture, shape, size and as-sociation in general to identify and delineate objects (Lillesand Keifer, 1994). Digital image classification is the process ofassigning pixels to classes. Usually each pixel is treated as anindividual unit composed of values in several spectral bands(Campbell, 1996). The automated classification method reliesmainly on brightness and spectral elements and not much onspatial content (King, 2002). These types of classifications gen-erally work well for spectrally homogeneous areas like forest.But for heterogeneous regions these methods are not wellrecommended (Yang and Lo, 2002). Land use/land coverchange information can be obtained by either image-to-imagecomparison or map-to-map comparison (Green et al., 1994).The image-to-image comparison involves subtracting two im-ages. It does not give detailed information of the how changesin particular land cover or land use are taking place. In map-to-map comparison, first images are to be classified and mapis to be generated to compare. As map-to-map comparisongives complete detail of land use land cover changes, they aregenerally preferred. In the present study, map-to-map com-parison was used for land use land cover change detection.These two images were registered with topographical maps tominimize geometric errors. Images were taken of the sameperiod so as to minimize radiometric anomalies. Images weredisplayed on the screen using ERDAS 9.2 imaging system andfor better contrast; it was enhanced by contrast stretch. Database of land use map for the year 1999 and 2004 have beencreated using Arc GIS 9.2 for land use analysis. Detailed groundtruth was completed with the help of toposheet, base mapand on-site investigation. Based on ground verification, differ-ent land use units were finalized. In present study, the landuse- land cover categorization in the study area is envisagedbased on classification scheme developed by National Re-mote Sensing Agency (NRSA 1989). The modification in thecategories at sublevel is done keeping in view the area underinvestigation.
RESULTS AND DISCUSSION
The land use statistics and changes in land use pattern de-
rived from the satellite data of year 1999 and 2004 have pre-
sented in Table 1. The land use map of year 1999 and 2004
were shown in Fig. 3 and 4 and the results of the analysis
depicted in pie diagrams (Fig. 5 and 6). The results clearly
revealed that the built-up land (settlement) has drastically in-
creased from about 8.08 km2 in year 1999 to 8.62 km2 in year
2004, due to population expansion during last five years due
to more job opportunities in mines and other related activi-
ties. Prior to the industrial development based on green marble
exploitation and allied industries, agriculture and forest based
activities were the main occupation of the working popula-
tion in this region. The agriculture land of the area has shown
a declining trend from year 1999 to 2004. As per analysis, the
area of agriculture land was 806.87 km2 (72.79 % of the total
area) in year 1999 as compared to 784.42 km2 (70.76 % of
the total area) in year 2004 registering a loss of 2.45 km2 area
over a period of five years which indicate an adverse impact
Figure 1: Location map of Kherwara Tehsil

105
of mining on land use pattern. This reduction in agricultural
land may be probably due to the use of this land for construc-
tion of haul roads, green marble mining and other mining
associated operations like dumping and processing units
along with housing for mine workers. The good forest land
has increased during year 1999 to 2004. As per analysis, the
good forest land was 70.64 km2 (6.37 % of the total area)
during year 1999 as compared to 74.61 km2 (6.73 % of the
total area) in the year 2004. The increase in good forest cover
may be attributed to various state and central government
schemes which have been implemented for the conservation
of flora and fauna and take care of forest areas by local tribal
people since they are using various plant species for their
medicinal use, edible purpose and also due to some religious
reasons. The degraded forest area has significantly declined
from about 22.24 km2 in year 1999 to 18.27 km2 in year
2004. The decrease in degraded forest land may due to cut-
ting of plants by the local tribal inhabitants for the earning of
money and for use of trees for fire wood and fuel purpose.
The land with and without scrub (waste land) has also in-
creased by about 184.57 km2 in year 1999 to 191.36 km2 in
year 2004. This may signifies lack of soil restoration and in-
creased soil erosion due to reduced agriculture practices in
Figure 3: Land use map of Kherwara Tehsil in year 1999
Figure 4: Land use map of Kherwara Tehsil in year 2004
Figure 2: Flowchart showing methodology for land use change
IRS 1D LISS III 1999
IRS 1D LISS III 2004
SOI Topo-Sheet
Base Map
Visual Analysi
Finalization of
Map
Map creation analysis through ERDAS imagine
9.2 and Arc GIS 9.2
Data Bank
Land use plot and statistics, 1999
Land use Change Analysis
Land use plot and statistics, 2004
S. N. Land use class Land use in year 1999 Land use in year 2004 Change in area (km2) during
Area (km2) Percentage to Area (km2) Percentage to year 1999 with respect to
total area total area year 2004
1. Built up land 8.08 0.73 8.62 0.78 +0.54
2. Agriculture land 806.87 72.79 784.42 70.76 -22.45
3. Good forest land 70.64 6.37 74.61 6.73 +3.97
4. Degraded forest land 22.24 2.01 18.27 1.65 -3.97
5. Land with and without scrub 184.57 16.65 191.36 17.26 +6.79
6. Water bodies 16.02 1.44 18.21 1.64 +2.19
7. Mining and industrial waste 0.11 0.01 13.04 1.18 +12.93
Table 1: Land use pattern in the year 1999 and 2004 (Total area considered for analysis= 1108.53 km2)
the study area because of outcrop of small and large mines.
Another reason which accounts for waste land development
is the hilly topography and sparse distribution of hillocks along
with the secluded residential pattern of native inhabitants who
are predominantly tribes. The area under water bodies in the
study area have been increased substantially from 16.02 km2
during year 1999 to 18.21 km2 during year 2004. The in-
crease of water bodies may attribute to construction of check
dams or ponds through government authority in tribal domi-
nated area of Kherwara tehsil and construction of water reser-
LAND USE AND LAND COVER CHANGE BY MARBLE MINING

106
8.08
806.87
70.64
22.24
184.57
16.020.11
Built up land Agriculture land
Good forest land Degraded forest land
Land with and without scrub Water bodies
Mining and industrial waste land
Figure 5: Major land use class in year 1999 (Area in sq. km)
GIRIRAJ KUMAR SONGARA AND NIDHI RAI
voirs by mine owners for their own vested interests. Beside
this, the excavation of land poor in mineral resources is left
fallow by the miners after preliminary quarrying process at
initial stages which are filled during rains. The mining and
industrial waste land was only 0.11 km2 (0.01 % of the total
area) during year 1999 is found to be 13.04 km2 (1.18 % of
the total area) during year 2004. This rapid increase in mining
area is probably due to higher production of green marble
and soapstone as well as stripping of overburden and dis-
posal of marble slurry with the out crop of large number of
green marble mines in the area under investigation.
CONCLUSION
The present analytical study will be very useful in assessment
of change in land use pattern due to mining activity. The
change in agriculture and forest land due to this activity will
further help in actually finding out the adverse effect on
vegetation of the area. This result of study will certainly be
helpful in designing the mining or land use management plan
of the tehsil for sustainable development and conservation of
Aravalli hill which is a vital step in ecological planning.
ACKNOWLEGEMENT
Giriraj K. Songara is grateful to University Grants Commission
(UGC) New Delhi for providing the financial assistance in the
form of senior research fellowship (SRF). We extend thanks to
Shri P. K. Bhatnagar, Superintendent Geologist (Remote sensing
cell) and Shri Sudheer Bhatnagar, Geologist (Remote sensing
cell), Directorate of Mines and Geology, Udaipur (Rajasthan)
for allowing to do this works. Thanks are also due to Dr. N. S.
Rathore Associate Professor and Head, Department of
Geography M. L. S. University Udaipur (Raj.) for valuable
suggestions throughout the study.
REFERENCES
Bisht, B. S. and Kothyari, B. P. 2001. Land-cover change analysis of
Garur Ganga watershed using GIS/remote sensing technique. J. Indian
Soc. Remote Sensing. 29(3): 165-174.
Campbell, James B. 1996. Introduction to Remote Sensing. Taylor
and Francis. London.
Ghosh, R. 1989. Mining in Jharia coalfield, Eastern India: An
estimation of its impact index. J. Geo. Soc. India. 33:353-360.
Ghosh, R. and Ghosh, D.N. 1991. Land use map of Jharia coalfield,
Eastern India, aided by remote sensing. J. Indian Soc. Remote Sensing.
18: 23-28.
Green, K., Kempka, D. and Lackley, L. 1994. Using remote sensing to
detect and monitor land cover and land use changes. Photogra. Eng.
Remote Sensing. 60(3):331-337.
Kam, T.S. 1995. Integrating GIS and remote sensing techniques for
urban land-cover land-use analysis. Geoc. Int., 10(1):39 -49.
King, R.B. 2002. Land cover mapping principles: a return to
interpretation fundamentals. Int. J. Remote Sensing, 23(18):3523-3545.
Legg, A.C. 1990. Application of remote sensing to environmental
aspects of surface mining operation in UK. Published by Institute of
Mining and Met., UK, 159-164p.
Lilles, T.M. and Keifer, R.W. 1994. Remote sensing and image
interpretation. John Wily, New York.
Luque, S.S. 2000. Evaluating temporal changes using multi-spectral
scanner and thematic mapper data on the landscape of natural reserve;
the New Jersey Pine Barrens, a case study. Int. J. of Remote Sensing,
21(13): 2589-2611.
National Remote Sensing Agency (NRSA) 1989. Manual of nationwide
land use/ land covers mapping using satellite imagery - Part-I, NRSA
publication (India).
Prakash, A. and Gupta, R. P. 1998. Land use mapping and change
detection in a coal mining area - a case study in the Jharia coalfield,
India. Int. J. of Remote Sensing, 19(3): 391-410.
Rathore, C.S. and Wright, R. 1993. Monitoring environmental impacts
of surface coal mining. Int. J. Remote Sensing. 14: 1021- 1042.
SAC (ISRO). 1990. Impact of mining activities and super thermal
power stations on environment. Project report no. RSAM/SAC/ENVN/
PR/08/90, November 1990.
Singh, N. P., Mukherjee, T. K. and Shrivastava, B. B. P. 1997.
Monitoring the impact of coal mining and thermal power industry on
land use pattern in and around Singrauli coalfield using remote sensing
and GIS. J. Indian Soc. Remote Sensing. 25(1): 61-73.
Yang, X. and Lo, C.P. 2002. Using a time series of satellite imagery to
detect land use and land cover changes in Atlanta, Georgia metropolitan
area. Int. J. Remote Sensing. 23(9): 1775-1798.
8.62
784.42
74.61
18.27
191.36
18.21
13.04
Built up land Agriculture land
Good forest land Degraded forest land
Land with and without scrub Water bodies
Mining and industrial waste land
Figure 6: Major land use class in year 2004 (Area in sq. km)