Embed Size (px)
Citation preview

Urban Discovery Academy
By February 1 of each year, every school in California is required by state law to publish a School Accountability Report Card (SARC).The SARC contains information aboutthe condit ion and performance of each California public school. Under the Local Control Funding Formula (LCFF) all local educat ional agencies (LEAs) are required toprepare a Local Control Accountability Plan (LCAP), which describes how they intend to meet annual school-specific goals for all pupils, w ith specific act ivit ies to addressstate and local priorit ies. Addit ionally, data reported in an LCAP is to be consistent w ith data reported in the SARC.
For more information about SARC requirements, see the California Department of Educat ion (CDE) SARC Web page at http://www.cde.ca.gov/ta/ac/sa/.
For more information about the LCFF or LCAP, see the CDE LCFF Web page at http://www.cde.ca.gov/fg/aa/lc/.
For addit ional information about the school, parents/guardians, and community members should contact the school principal or the district office.
DataQuest
Internet Access
California Department of Education
School Accountability Report CardReported Using Data from the 2015-16 School Year
DataQuest is an online data tool located on the CDE DataQuest Web page that contains addit ional information about this school and comparisons of the school tothe district and the county. Specifically, DataQuest is a dynamic system that provides reports for accountability (e.g., test data, enrollment, high school graduates,dropouts, course enrollments, staffing, and data regarding English learners).
Internet access is available at public libraries and other locat ions that are publicly accessible (e.g., the California State Library). Access to the Internet at librariesand public locat ions is generally provided on a first-come, first-served basis. Other use restrict ions may include the hours of operat ion, the length of t ime that aworkstat ion may be used (depending on availability), the types of software programs available on a workstat ion, and the ability to print documents.

Last updated: 1/30/2017
Last updated: 1/30/2017
About This School
Contact Information (School Year 2016-17)Contact Information (School Year 2016-17)
District Contact Information (School Year 2016-17)
District Name San Diego Unified
Phone Number (619) 725-8000
Superintendent Cindy Marten
E-mail Address [email protected]
Web Site www.sandi.net
School Contact Information (School Year 2016-17)
School Name Urban Discovery Academy
Street 840 14th St.
City, State, Zip San Diego, Ca, 92101-6608
Phone Number 619-788-4668
Principal Jenni Owen, Chief Execut ive Officer
E-mail Address [email protected]
Web Site http://www.urbandiscoveryacademy.com
County-District-School (CDS) Code
37683380118000
School Description and Mission Statement (School Year 2016-17)School Description and Mission Statement (School Year 2016-17)
Mission: The mission of Urban Discovery Academy is to provide a rigorous educat ion that develops the whole child as a scholar, athlete, art ist and democrat icmember of society.
Guiding Philosophies: Urban Discovery Academy aims to provide students w ith a high-quality, educat ion that is tailored to individual needs and inspires studentinquiry. Through a triad of support, parents, teachers and students establish a community of learners that encourages explorat ion and growth. We believe it isour responsibility as a school to ensure that we make learning meaningful, hands-on, and excit ing. We use project-based learning as our primary teachingmethodology. Project-based learning is the use of classroom projects, intended to bring about deep learning, where students use technology and inquiry toengage w ith issues and quest ions that are relevant to their lives. These classroom projects are used to assess student ’s subject matter competence compared totradit ional test ing.
Project-Based Learning: Project-based learning is an instruct ional approach built upon authent ic learning act ivit ies that engage student interest and motivat ion.These act ivit ies are designed to answer a quest ion or solve a problem and generally reflect the types of learning and work people do in the everyday worldoutside the classroom. A well-designed project provokes students to encounter (and struggle w ith) the central concepts and principles of a discipline, and isinterdisciplinary in nature. Project-based learning is generally done in groups of students working together towards a common goal. Performance is assessed on anindividual basis, and takes into account the quality of the product produced, the depth of content understanding demonstrated, and the contribut ions made tothe ongoing process of project realizat ion. Project-based learning allows students to reflect upon their own ideas and opinions, exercise voice and choice, andmake decisions that affect project outcomes and the learning process in general.
Enrichment Programming: In congruence w ith project-based learning, UDA’s general programmatic approach teaches the whole child while st ill maintaining ourrigorous academic program across the core disciplines. In addit ion, UDA helps students deepen learning through an interdisciplinary approach. Each studentpart icipates in rich enrichment program courses, including visual arts, performing arts, STEAM, Spanish, as well as physical educat ion. The enrichment courses areintent ially aligned w ith core courses, to help students bridge concepts and hone skills over the varying disciplines, including the arts, and to help studentsbecome creat ive problem solvers in the 21st Century. Throughout their coursework, students also learn important life-skills such as civility, trustworthiness,respect, responsibility, fairness, caring and cit izenship.
Learning Beyond the Classroom: UDA encourages teachers and students to explore the community around us. Our classrooms extend into the localcommunity so students can solve important problems in the real world. Teachers incorporate frequent field trips into the curriculum and work closely w ithcommunity partners to ensure learning is relevant, meaningful, and applied. Students ut ilize design-thinking strategies to problem-solve, innovate, and contributebeyond the classroom walls.
2015-16 SARC - Urban Discovery Academy
Page 2 of 33

Last updated: 1/30/2017
Last updated: 1/30/2017
Student Enrollment by Grade Level (School Year 2015-16)Student Enrollment by Grade Level (School Year 2015-16)
Grade Level Number of Students
Kindergarten 47
Grade 1 47
Grade 2 48
Grade 3 48
Grade 4 56
Grade 5 56
Grade 6 53
Grade 7 47
Grade 8 28
Total Enrollment 430
KindergartenGrade 1 Grade 2 Grade 3 Grade 4 Grade 5 Grade 6 Grade 7 Grade 80
10
20
30
40
50
60
Student Enrollment by Student Group (School Year 2015-16)Student Enrollment by Student Group (School Year 2015-16)
Student Group Percent of Total Enrollment
Black or African American 5.6 %
American Indian or Alaska Nat ive 0.0 %
Asian 3.0 %
Filipino 0.7 %
Hispanic or Lat ino 36.0 %
Native Hawaiian or Pacific Islander 0.0 %
White 46.5 %
Two or More Races 7.4 %
Other 0.8 %
Student Group (Other) Percent of Total Enrollment
Socioeconomically Disadvantaged 28.4 %
English Learners 8.6 %
Students w ith Disabilit ies 9.5 %
Foster Youth 0.0 %
2015-16 SARC - Urban Discovery Academy
Page 3 of 33

Last updated: 1/30/2017
Last updated: 1/30/2017
A. Conditions of Learning
State Priority: Basic
The SARC provides the follow ing information relevant to the State priority: Basic (Priority 1):
Degree to which teachers are appropriately assigned and fully credent ialed in the subject area and for the pupils they are teaching;Pupils have access to standards-aligned instruct ional materials; andSchool facilit ies are maintained in good repair
Note: “Misassignments” refers to the number of posit ions filled by teachers who lack legal authorizat ion to teach that grade level, subject area, student group, etc.
* Total Teacher Misassignments includes the number of Misassignments of Teachers of English learners.
Teacher CredentialsTeacher Credentials
Teachers School District
2014-15
2015-16
2016-17
2016-17
With Full Credent ial 22 25 30 4243
Without Full Credent ial 1 1 1 30
Teachers Teaching Outside SubjectArea of Competence (w ith fullcredent ial)
0 0 1 349
2014-15 2015-16 2016-170
5
10
15
20
25
30
35Teachers with Full Credential
Teachers without Full Credential
Teachers Teaching Outside Subject Area of Competence
Teacher Misassignments and Vacant Teacher PositionsTeacher Misassignments and Vacant Teacher Positions
Indicator2014-
152015-
162016-
17
Misassignments of Teachers of EnglishLearners
0 0 0
Total Teacher Misassignments* 0 0 0
Vacant Teacher Posit ions 0 0 0
2014-15 2015-16 2016-17-1.0
-0.5
0.0
0.5
1.0Misassignments of Teachers of English Learners
Total Teacher Misassignments
Vacant Teacher Positions
2015-16 SARC - Urban Discovery Academy
Page 4 of 33

Last updated: 1/30/2017
Note: High-poverty schools are defined as those schools w ith student eligibility of approximately 40 percent or more in the free and reduced price meals program. Low-poverty schools are those w ith student eligibility of approximately 39 percent or less in the free and reduced price meals program.
Core Academic Classes Taught by Highly Qualified Teachers (School Year 2015-16)Core Academic Classes Taught by Highly Qualified Teachers (School Year 2015-16)
Location of ClassesPercent of Classes In Core Academic Subjects Taught by
Highly Qualified TeachersPercent of Classes In Core Academic Subjects Not Taught by
Highly Qualified Teachers
This School 97.0% 3.0%
All Schools in District 96.0% 4.0%
High-Poverty Schoolsin District
96.0% 4.0%
Low-Poverty Schoolsin District
97.0% 3.0%
2015-16 SARC - Urban Discovery Academy
Page 5 of 33

Last updated: 1/30/2017
Last updated: 1/30/2017
School Facility Good Repair StatusYear and month of the most recent FIT report: January 2017
Overall Facility RateYear and month of the most recent FIT report: January 2017
School Facility Conditions and Planned ImprovementsSchool Facility Conditions and Planned Improvements
Urban Discovery Academy is located in a beaut iful new facility in the East Village of downtown San Diego. The building is in excellent condit ion throughout, w ithnew construct ion as of 2015. UDA's building is full of vibrant colors, modern classrooms, and technology infused throughout. We have a janitorial crew that cleansand maintains upkeep daily, after lunch and in the evenings. Because the building is new, it is easy to keep up w ith necessary building impovements to ensure atop-notch school building for our children.
System Inspected Rating
Repair Needed andAction Taken or
Planned
Systems: Gas Leaks, Mechanical/HVAC,Sewer
Good
Interior: Interior Surfaces Good
Cleanliness: Overall Cleanliness,Pest/Vermin Infestat ion
Good
Electrical: Electrical Good
Restrooms/Fountains: Restrooms,Sinks/Fountains
Good
Safety: Fire Safety, Hazardous Materials Good
Structural: Structural Damage, Roofs Good
External: Playground/School Grounds,W indows/Doors/Gates/Fences
Good
Overall Rat ing Exemplary
2015-16 SARC - Urban Discovery Academy
Page 6 of 33

Last updated: 1/30/2017
B. Pupil Outcomes
State Priority: Pupil Achievement
The SARC provides the follow ing information relevant to the State priority: Pupil Achievement (Priority 4):
Statewide assessments (i.e., California Assessment of Student Performance and Progress [CAASPP] System, which includes the Smarter Balanced SummativeAssessments for students in the general educat ion populat ion and the California Alternate Assessments [CAAs] for English language arts/literacy [ELA] andmathematics given in grades three through eight and grade eleven. The CAAs have replaced the California Alternate Performance Assessment [CAPA] for ELA andmathematics, which were eliminated in 2015. Only eligible students may part icipate in the administrat ion of the CAAs. CAA items are aligned w ith alternateachievement standards, which are linked w ith the Common Core State Standards [CCSS] for students w ith significant cognit ive disabilit ies); and
The percentage of students who have successfully completed courses that sat isfy the requirements for entrance to the University of California and the CaliforniaState University, or career technical educat ion sequences or programs of study.
Note: Percentages are not calculated when the number of students tested is ten or less, either because the number of students in this category is too small forstat ist ical accuracy or to protect student privacy.
CAASPP Test Results in English Language Arts/Literacy (ELA) and Mathematics for All StudentsCAASPP Test Results in English Language Arts/Literacy (ELA) and Mathematics for All Students
Subject
Percent of Students Meeting or Exceeding the State Standards
School District State
2014-15 2015-16 2014-15 2015-16 2014-15 2015-16
English Language Arts / Literacy (grades 3-8 and 11) 51.0% 57.0% 49.0% 54.0% 44.0% 48.0%
Mathematics (grades 3-8 and 11) 44.0% 41.0% 39.0% 42.0% 34.0% 36.0%
2015-16 SARC - Urban Discovery Academy
Page 7 of 33

Last updated: 1/30/2017
Note: ELA test results include the Smarter Balanced Summative Assessment and the CAA. The “Percent Met or Exceeded” is calculated by taking the total number ofstudents who met or exceeded the standard on the Smarter Balanced Summative Assessment plus the total number of students who met the standard on the CAAsdivided by the total number of students who part icipated in both assessments.
Double dashes (--) appear in the table when the number of students is ten or less, either because the number of students in this category is too small for stat ist icalaccuracy or to protect student privacy.
Note: The number of students tested includes all students who part icipated in the test whether they received a score or not; however, the number of students testedis not the number that was used to calculate the achievement level percentages. The achievement level percentages are calculated using only students who receivedscores.
CAASPP Test Results in ELA by Student Group CAASPP Test Results in ELA by Student Group
Grades Three through Eight and Grade Eleven (School Year 2015-16)Grades Three through Eight and Grade Eleven (School Year 2015-16)
ELA - Grade 3ELA - Grade 3
Student Group Total Enrollment Number Tested Percent Tested Percent Met or Exceeded
All Students 48 48 100.0% 54.2%
Male 24 24 100.0% 54.2%
Female 24 24 100.0% 54.2%
Black or African American -- -- -- --
American Indian or Alaska Nat ive -- -- -- --
Asian -- -- -- --
Filipino -- -- -- --
Hispanic or Lat ino 12 12 100.0% 16.7%
Native Hawaiian or Pacific Islander -- -- -- --
White 26 26 100.0% 73.1%
Two or More Races -- -- -- --
Socioeconomically Disadvantaged 11 11 100.0% 45.5%
English Learners -- -- -- --
Students w ith Disabilit ies -- -- -- --
Students Receiving Migrant Educat ion Services -- -- -- --
Foster Youth -- -- -- --
2015-16 SARC - Urban Discovery Academy
Page 8 of 33

Last updated: 1/30/2017
Note: ELA test results include the Smarter Balanced Summative Assessment and the CAA. The “Percent Met or Exceeded” is calculated by taking the total number ofstudents who met or exceeded the standard on the Smarter Balanced Summative Assessment plus the total number of students who met the standard on the CAAsdivided by the total number of students who part icipated in both assessments.
Double dashes (--) appear in the table when the number of students is ten or less, either because the number of students in this category is too small for stat ist icalaccuracy or to protect student privacy.
Note: The number of students tested includes all students who part icipated in the test whether they received a score or not; however, the number of students testedis not the number that was used to calculate the achievement level percentages. The achievement level percentages are calculated using only students who receivedscores.
ELA - Grade 4ELA - Grade 4
Student Group Total Enrollment Number Tested Percent Tested Percent Met or Exceeded
All Students 56 56 100.0% 71.4%
Male 28 28 100.0% 75.0%
Female 28 28 100.0% 67.9%
Black or African American -- -- -- --
American Indian or Alaska Nat ive -- -- -- --
Asian -- -- -- --
Filipino -- -- -- --
Hispanic or Lat ino 17 17 100.0% 52.9%
Native Hawaiian or Pacific Islander -- -- -- --
White 27 27 100.0% 81.5%
Two or More Races -- -- -- --
Socioeconomically Disadvantaged 13 13 100.0% 46.2%
English Learners -- -- -- --
Students w ith Disabilit ies -- -- -- --
Students Receiving Migrant Educat ion Services -- -- -- --
Foster Youth -- -- -- --
2015-16 SARC - Urban Discovery Academy
Page 9 of 33

Last updated: 1/30/2017
Note: ELA test results include the Smarter Balanced Summative Assessment and the CAA. The “Percent Met or Exceeded” is calculated by taking the total number ofstudents who met or exceeded the standard on the Smarter Balanced Summative Assessment plus the total number of students who met the standard on the CAAsdivided by the total number of students who part icipated in both assessments.
Double dashes (--) appear in the table when the number of students is ten or less, either because the number of students in this category is too small for stat ist icalaccuracy or to protect student privacy.
Note: The number of students tested includes all students who part icipated in the test whether they received a score or not; however, the number of students testedis not the number that was used to calculate the achievement level percentages. The achievement level percentages are calculated using only students who receivedscores.
ELA - Grade 5ELA - Grade 5
Student Group Total Enrollment Number Tested Percent Tested Percent Met or Exceeded
All Students 56 55 98.2% 32.7%
Male 29 28 96.6% 21.4%
Female 27 27 100.0% 44.4%
Black or African American -- -- -- --
American Indian or Alaska Nat ive -- -- -- --
Asian -- -- -- --
Filipino -- -- -- --
Hispanic or Lat ino 24 23 95.8% 17.4%
Native Hawaiian or Pacific Islander -- -- -- --
White 24 24 100.0% 45.8%
Two or More Races -- -- -- --
Socioeconomically Disadvantaged 21 21 100.0% 14.3%
English Learners -- -- -- --
Students w ith Disabilit ies -- -- -- --
Students Receiving Migrant Educat ion Services -- -- -- --
Foster Youth -- -- -- --
2015-16 SARC - Urban Discovery Academy
Page 10 of 33

Last updated: 1/30/2017
Note: ELA test results include the Smarter Balanced Summative Assessment and the CAA. The “Percent Met or Exceeded” is calculated by taking the total number ofstudents who met or exceeded the standard on the Smarter Balanced Summative Assessment plus the total number of students who met the standard on the CAAsdivided by the total number of students who part icipated in both assessments.
Double dashes (--) appear in the table when the number of students is ten or less, either because the number of students in this category is too small for stat ist icalaccuracy or to protect student privacy.
Note: The number of students tested includes all students who part icipated in the test whether they received a score or not; however, the number of students testedis not the number that was used to calculate the achievement level percentages. The achievement level percentages are calculated using only students who receivedscores.
ELA- ELA- Grade 6Grade 6
Student Group Total Enrollment Number Tested Percent Tested Percent Met or Exceeded
All Students 56 54 96.4% 59.3%
Male 24 23 95.8% 39.1%
Female 32 31 96.9% 74.2%
Black or African American -- -- -- --
American Indian or Alaska Nat ive -- -- -- --
Asian -- -- -- --
Filipino -- -- -- --
Hispanic or Lat ino 26 25 96.2% 56.0%
Native Hawaiian or Pacific Islander -- -- -- --
White 23 22 95.7% 63.6%
Two or More Races -- -- -- --
Socioeconomically Disadvantaged 19 19 100.0% 42.1%
English Learners -- -- -- --
Students w ith Disabilit ies -- -- -- --
Students Receiving Migrant Educat ion Services -- -- -- --
Foster Youth -- -- -- --
2015-16 SARC - Urban Discovery Academy
Page 11 of 33

Last updated: 1/30/2017
Note: ELA test results include the Smarter Balanced Summative Assessment and the CAA. The “Percent Met or Exceeded” is calculated by taking the total number ofstudents who met or exceeded the standard on the Smarter Balanced Summative Assessment plus the total number of students who met the standard on the CAAsdivided by the total number of students who part icipated in both assessments.
Double dashes (--) appear in the table when the number of students is ten or less, either because the number of students in this category is too small for stat ist icalaccuracy or to protect student privacy.
Note: The number of students tested includes all students who part icipated in the test whether they received a score or not; however, the number of students testedis not the number that was used to calculate the achievement level percentages. The achievement level percentages are calculated using only students who receivedscores.
ELA - Grade 7ELA - Grade 7
Student Group Total Enrollment Number Tested Percent Tested Percent Met or Exceeded
All Students 50 46 92.0% 67.4%
Male 25 22 88.0% 54.6%
Female 25 24 96.0% 79.2%
Black or African American -- -- -- --
American Indian or Alaska Nat ive -- -- -- --
Asian -- -- -- --
Filipino -- -- -- --
Hispanic or Lat ino 19 17 89.5% 58.8%
Native Hawaiian or Pacific Islander -- -- -- --
White 21 19 90.5% 73.7%
Two or More Races -- -- -- --
Socioeconomically Disadvantaged 14 14 100.0% 50.0%
English Learners -- -- -- --
Students w ith Disabilit ies -- -- -- --
Students Receiving Migrant Educat ion Services -- -- -- --
Foster Youth -- -- -- --
2015-16 SARC - Urban Discovery Academy
Page 12 of 33

Last updated: 1/30/2017
Note: ELA test results include the Smarter Balanced Summative Assessment and the CAA. The “Percent Met or Exceeded” is calculated by taking the total number ofstudents who met or exceeded the standard on the Smarter Balanced Summative Assessment plus the total number of students who met the standard on the CAAsdivided by the total number of students who part icipated in both assessments.
Double dashes (--) appear in the table when the number of students is ten or less, either because the number of students in this category is too small for stat ist icalaccuracy or to protect student privacy.
Note: The number of students tested includes all students who part icipated in the test whether they received a score or not; however, the number of students testedis not the number that was used to calculate the achievement level percentages. The achievement level percentages are calculated using only students who receivedscores.
ELA - Grade 8ELA - Grade 8
Student Group Total Enrollment Number Tested Percent Tested Percent Met or Exceeded
All Students 27 27 100.0% 55.6%
Male 15 15 100.0% 46.7%
Female 12 12 100.0% 66.7%
Black or African American -- -- -- --
American Indian or Alaska Nat ive -- -- -- --
Asian -- -- -- --
Filipino -- -- -- --
Hispanic or Lat ino 16 16 100.0% 37.5%
Native Hawaiian or Pacific Islander -- -- -- --
White -- -- -- --
Two or More Races -- -- -- --
Socioeconomically Disadvantaged -- -- -- --
English Learners -- -- -- --
Students w ith Disabilit ies -- -- -- --
Students Receiving Migrant Educat ion Services -- -- -- --
Foster Youth -- -- -- --
2015-16 SARC - Urban Discovery Academy
Page 13 of 33

Last updated: 1/30/2017
Note: ELA test results include the Smarter Balanced Summative Assessment and the CAA. The “Percent Met or Exceeded” is calculated by taking the total number ofstudents who met or exceeded the standard on the Smarter Balanced Summative Assessment plus the total number of students who met the standard on the CAAsdivided by the total number of students who part icipated in both assessments.
Double dashes (--) appear in the table when the number of students is ten or less, either because the number of students in this category is too small for stat ist icalaccuracy or to protect student privacy.
Note: The number of students tested includes all students who part icipated in the test whether they received a score or not; however, the number of students testedis not the number that was used to calculate the achievement level percentages. The achievement level percentages are calculated using only students who receivedscores.
ELA - Grade 11ELA - Grade 11
Student Group Total Enrollment Number Tested Percent Tested Percent Met or Exceeded
All Students -- -- -- --
Male -- -- -- --
Female -- -- -- --
Black or African American -- -- -- --
American Indian or Alaska Nat ive -- -- -- --
Asian -- -- -- --
Filipino -- -- -- --
Hispanic or Lat ino -- -- -- --
Nat ive Hawaiian or Pacific Islander -- -- -- --
White -- -- -- --
Two or More Races -- -- -- --
Socioeconomically Disadvantaged -- -- -- --
English Learners -- -- -- --
Students w ith Disabilit ies -- -- -- --
Students Receiving Migrant Educat ion Services -- -- -- --
Foster Youth -- -- -- --
2015-16 SARC - Urban Discovery Academy
Page 14 of 33

Last updated: 1/30/2017
Note: Mathematics test results include the Smarter Balanced Summative Assessment and the CAA. The “Percent Met or Exceeded” is calculated by taking the totalnumber of students who met or exceeded the standard on the Smarter Balanced Summative Assessment plus the total number of students who met the standard onthe CAAs divided by the total number of students who part icipated in both assessments.
Double dashes (--) appear in the table when the number of students is ten or less, either because the number of students in this category is too small for stat ist icalaccuracy or to protect student privacy.
Note: The number of students tested includes all students who part icipated in the test whether they received a score or not; however, the number of students testedis not the number that was used to calculate the achievement level percentages. The achievement level percentages are calculated using only students who receivedscores.
CAASPP Test Results in Mathematics by Student GroupCAASPP Test Results in Mathematics by Student Group
Grades Three through Eight and Grade Eleven (School Year 2015-16)Grades Three through Eight and Grade Eleven (School Year 2015-16)
Mathematics - Grade 3Mathematics - Grade 3
Student Group Total Enrollment Number Tested Percent Tested Percent Met or Exceeded
All Students 48 48 100.0% 52.1%
Male 24 24 100.0% 54.2%
Female 24 24 100.0% 50.0%
Black or African American -- -- -- --
American Indian or Alaska Nat ive -- -- -- --
Asian -- -- -- --
Filipino -- -- -- --
Hispanic or Lat ino 12 12 100.0% 16.7%
Native Hawaiian or Pacific Islander -- -- -- --
White 26 26 100.0% 69.2%
Two or More Races -- -- -- --
Socioeconomically Disadvantaged 11 11 100.0% 27.3%
English Learners -- -- -- --
Students w ith Disabilit ies -- -- -- --
Students Receiving Migrant Educat ion Services -- -- -- --
Foster Youth -- -- -- --
2015-16 SARC - Urban Discovery Academy
Page 15 of 33

Last updated: 1/30/2017
Note: Mathematics test results include the Smarter Balanced Summative Assessment and the CAA. The “Percent Met or Exceeded” is calculated by taking the totalnumber of students who met or exceeded the standard on the Smarter Balanced Summative Assessment plus the total number of students who met the standard onthe CAAs divided by the total number of students who part icipated in both assessments.
Double dashes (--) appear in the table when the number of students is ten or less, either because the number of students in this category is too small for stat ist icalaccuracy or to protect student privacy.
Note: The number of students tested includes all students who part icipated in the test whether they received a score or not; however, the number of students testedis not the number that was used to calculate the achievement level percentages. The achievement level percentages are calculated using only students who receivedscores.
Mathematics - Grade 4Mathematics - Grade 4
Student Group Total Enrollment Number Tested Percent Tested Percent Met or Exceeded
All Students 56 56 100.0% 51.8%
Male 28 28 100.0% 53.6%
Female 28 28 100.0% 50.0%
Black or African American -- -- -- --
American Indian or Alaska Nat ive -- -- -- --
Asian -- -- -- --
Filipino -- -- -- --
Hispanic or Lat ino 17 17 100.0% 41.2%
Native Hawaiian or Pacific Islander -- -- -- --
White 27 27 100.0% 55.6%
Two or More Races -- -- -- --
Socioeconomically Disadvantaged 13 13 100.0% 23.1%
English Learners -- -- -- --
Students w ith Disabilit ies -- -- -- --
Students Receiving Migrant Educat ion Services -- -- -- --
Foster Youth -- -- -- --
2015-16 SARC - Urban Discovery Academy
Page 16 of 33

Last updated: 1/30/2017
Note: Mathematics test results include the Smarter Balanced Summative Assessment and the CAA. The “Percent Met or Exceeded” is calculated by taking the totalnumber of students who met or exceeded the standard on the Smarter Balanced Summative Assessment plus the total number of students who met the standard onthe CAAs divided by the total number of students who part icipated in both assessments.
Double dashes (--) appear in the table when the number of students is ten or less, either because the number of students in this category is too small for stat ist icalaccuracy or to protect student privacy.
Note: The number of students tested includes all students who part icipated in the test whether they received a score or not; however, the number of students testedis not the number that was used to calculate the achievement level percentages. The achievement level percentages are calculated using only students who receivedscores.
Mathematics - Grade 5Mathematics - Grade 5
Student Group Total Enrollment Number Tested Percent Tested Percent Met or Exceeded
All Students 56 55 98.2% 30.9%
Male 29 28 96.6% 25.0%
Female 27 27 100.0% 37.0%
Black or African American -- -- -- --
American Indian or Alaska Nat ive -- -- -- --
Asian -- -- -- --
Filipino -- -- -- --
Hispanic or Lat ino 24 23 95.8% 17.4%
Native Hawaiian or Pacific Islander -- -- -- --
White 24 24 100.0% 41.7%
Two or More Races -- -- -- --
Socioeconomically Disadvantaged 21 21 100.0% 14.3%
English Learners -- -- -- --
Students w ith Disabilit ies -- -- -- --
Students Receiving Migrant Educat ion Services -- -- -- --
Foster Youth -- -- -- --
2015-16 SARC - Urban Discovery Academy
Page 17 of 33

Last updated: 1/30/2017
Note: Mathematics test results include the Smarter Balanced Summative Assessment and the CAA. The “Percent Met or Exceeded” is calculated by taking the totalnumber of students who met or exceeded the standard on the Smarter Balanced Summative Assessment plus the total number of students who met the standard onthe CAAs divided by the total number of students who part icipated in both assessments.
Double dashes (--) appear in the table when the number of students is ten or less, either because the number of students in this category is too small for stat ist icalaccuracy or to protect student privacy.
Note: The number of students tested includes all students who part icipated in the test whether they received a score or not; however, the number of students testedis not the number that was used to calculate the achievement level percentages. The achievement level percentages are calculated using only students who receivedscores.
Mathematics - Grade 6Mathematics - Grade 6
Student Group Total Enrollment Number Tested Percent Tested Percent Met or Exceeded
All Students 56 54 96.4% 40.7%
Male 24 23 95.8% 26.1%
Female 32 31 96.9% 51.6%
Black or African American -- -- -- --
American Indian or Alaska Nat ive -- -- -- --
Asian -- -- -- --
Filipino -- -- -- --
Hispanic or Lat ino 26 25 96.2% 40.0%
Native Hawaiian or Pacific Islander -- -- -- --
White 23 22 95.7% 45.5%
Two or More Races -- -- -- --
Socioeconomically Disadvantaged 19 19 100.0% 36.8%
English Learners -- -- -- --
Students w ith Disabilit ies -- -- -- --
Students Receiving Migrant Educat ion Services -- -- -- --
Foster Youth -- -- -- --
2015-16 SARC - Urban Discovery Academy
Page 18 of 33

Last updated: 1/30/2017
Note: Mathematics test results include the Smarter Balanced Summative Assessment and the CAA. The “Percent Met or Exceeded” is calculated by taking the totalnumber of students who met or exceeded the standard on the Smarter Balanced Summative Assessment plus the total number of students who met the standard onthe CAAs divided by the total number of students who part icipated in both assessments.
Double dashes (--) appear in the table when the number of students is ten or less, either because the number of students in this category is too small for stat ist icalaccuracy or to protect student privacy.
Note: The number of students tested includes all students who part icipated in the test whether they received a score or not; however, the number of students testedis not the number that was used to calculate the achievement level percentages. The achievement level percentages are calculated using only students who receivedscores.
Mathematics - Grade 7Mathematics - Grade 7
Student Group Total Enrollment Number Tested Percent Tested Percent Met or Exceeded
All Students 50 47 94.0% 34.0%
Male 25 23 92.0% 26.1%
Female 25 24 96.0% 41.7%
Black or African American -- -- -- --
American Indian or Alaska Nat ive -- -- -- --
Asian -- -- -- --
Filipino -- -- -- --
Hispanic or Lat ino 19 18 94.7% 33.3%
Native Hawaiian or Pacific Islander -- -- -- --
White 21 19 90.5% 36.8%
Two or More Races -- -- -- --
Socioeconomically Disadvantaged 14 14 100.0% 7.1%
English Learners -- -- -- --
Students w ith Disabilit ies -- -- -- --
Students Receiving Migrant Educat ion Services -- -- -- --
Foster Youth -- -- -- --
2015-16 SARC - Urban Discovery Academy
Page 19 of 33

Last updated: 1/30/2017
Note: Mathematics test results include the Smarter Balanced Summative Assessment and the CAA. The “Percent Met or Exceeded” is calculated by taking the totalnumber of students who met or exceeded the standard on the Smarter Balanced Summative Assessment plus the total number of students who met the standard onthe CAAs divided by the total number of students who part icipated in both assessments.
Double dashes (--) appear in the table when the number of students is ten or less, either because the number of students in this category is too small for stat ist icalaccuracy or to protect student privacy.
Note: The number of students tested includes all students who part icipated in the test whether they received a score or not; however, the number of students testedis not the number that was used to calculate the achievement level percentages. The achievement level percentages are calculated using only students who receivedscores.
Mathematics - Grade 8Mathematics - Grade 8
Student Group Total Enrollment Number Tested Percent Tested Percent Met or Exceeded
All Students 27 27 100.0% 37.0%
Male 15 15 100.0% 33.3%
Female 12 12 100.0% 41.7%
Black or African American -- -- -- --
American Indian or Alaska Nat ive -- -- -- --
Asian -- -- -- --
Filipino -- -- -- --
Hispanic or Lat ino 16 16 100.0% 18.8%
Native Hawaiian or Pacific Islander -- -- -- --
White -- -- -- --
Two or More Races -- -- -- --
Socioeconomically Disadvantaged -- -- -- --
English Learners -- -- -- --
Students w ith Disabilit ies -- -- -- --
Students Receiving Migrant Educat ion Services -- -- -- --
Foster Youth -- -- -- --
2015-16 SARC - Urban Discovery Academy
Page 20 of 33

Last updated: 1/30/2017
Note: Mathematics test results include the Smarter Balanced Summative Assessment and the CAA. The “Percent Met or Exceeded” is calculated by taking the totalnumber of students who met or exceeded the standard on the Smarter Balanced Summative Assessment plus the total number of students who met the standard onthe CAAs divided by the total number of students who part icipated in both assessments.
Double dashes (--) appear in the table when the number of students is ten or less, either because the number of students in this category is too small for stat ist icalaccuracy or to protect student privacy.
Note: The number of students tested includes all students who part icipated in the test whether they received a score or not; however, the number of students testedis not the number that was used to calculate the achievement level percentages. The achievement level percentages are calculated using only students who receivedscores.
Mathematics - Grade 11Mathematics - Grade 11
Student Group Total Enrollment Number Tested Percent Tested Percent Met or Exceeded
All Students -- -- -- --
Male -- -- -- --
Female -- -- -- --
Black or African American -- -- -- --
American Indian or Alaska Nat ive -- -- -- --
Asian -- -- -- --
Filipino -- -- -- --
Hispanic or Lat ino -- -- -- --
Nat ive Hawaiian or Pacific Islander -- -- -- --
White -- -- -- --
Two or More Races -- -- -- --
Socioeconomically Disadvantaged -- -- -- --
English Learners -- -- -- --
Students w ith Disabilit ies -- -- -- --
Students Receiving Migrant Educat ion Services -- -- -- --
Foster Youth -- -- -- --
2015-16 SARC - Urban Discovery Academy
Page 21 of 33

Last updated: 1/30/2017
Last updated: 1/30/2017
Note: Science test results include California Standards Tests (CSTs), California Modified Assessment (CMA), and California Alternate Performance Assessment (CAPA) ingrades five, eight, and ten.
Note: Scores are not shown when the number of students tested is ten or less, either because the number of students in this category is too small for stat ist icalaccuracy or to protect student privacy.
CAASPP Tests Results in Science by Student GroupGrades Five, Eight and Grade Ten (School Year 2015-16)
Note: Science test results include CSTs, CMA, and CAPA in grades five, eight, and ten. The “Proficient or Advanced” is calculated by taking the total number of studentswho scored at Proficient or Advanced on the science assessment divided by the total number of students w ith valid scores.
Note: Scores are not shown when the number of students tested is ten or less, either because the number of students in this category is too small for stat ist icalaccuracy or to protect student privacy.
CAASPP Test Results in Science for All StudentsCAASPP Test Results in Science for All Students
Subject
Percentage of Students Scoring at Proficient or Advanced
School District State
2013-14 2014-15 2015-16 2013-14 2014-15 2015-16 2013-14 2014-15 2015-16
Science (grades 5, 8, and 10) 80.0% 84.0% 61.0% 68.0% 65.0% 59.0% 60.0% 56.0% 54.0%
Student GroupTotal
EnrollmentNumber of Students with Valid
ScoresPercent of Students with Valid
ScoresPercent Proficient or
Advanced
All Students 83 83 100.0% 61.5%
Male 44 44 100.0% 56.8%
Female 39 39 100.0% 66.7%
Black or African American -- -- -- --
American Indian or Alaska Nat ive 0 0 0.0% 0.0%
Asian -- -- -- --
Filipino 0 0 0.0% 0.0%
Hispanic or Lat ino 40 40 100.0% 52.5%
Native Hawaiian or Pacific Islander 0 0 0.0% 0.0%
White 32 32 100.0% 68.8%
Two or More Races -- -- -- --
Socioeconomically Disadvantaged 31 31 100.0% 45.2%
English Learners 11 11 100.0% 18.2%
Students w ith Disabilit ies 14 14 100.0% 35.7%
Students Receiving Migrant Educat ionServices
0 0 0.0% 0.0%
Foster Youth -- -- -- --
2015-16 SARC - Urban Discovery Academy
Page 22 of 33

Career Technical Education Programs (School Year 2015-16)Career Technical Education Programs (School Year 2015-16)
N/A
2015-16 SARC - Urban Discovery Academy
Page 23 of 33

Last updated: 1/30/2017
Last updated: 1/30/2017
State Priority: Other Pupil Outcomes
The SARC provides the follow ing information relevant to the State priority: Other Pupil Outcomes (Priority 8):
Pupil outcomes in the subject area of physical educat ion
Note: Percentages are not calculated when the number of students tested is ten or less, either because the number of students in this category is too small forstat ist ical accuracy or to protect student privacy.
California Physical Fitness Test Results (School Year 2015-16)California Physical Fitness Test Results (School Year 2015-16)
Grade Level
Percentage of Students Meeting Fitness Standards
Four of Six Standards Five of Six Standards Six of Six Standards
5 16.1% 23.2% 51.8%
7 14.3% 32.7% 46.9%
2015-16 SARC - Urban Discovery Academy
Page 24 of 33

Last updated: 1/30/2017
C. Engagement
State Priority: Parental Involvement
The SARC provides the follow ing information relevant to the State priority: Parental Involvement (Priority 3):
Efforts the school district makes to seek parent input in making decisions for the school district and each schoolsite
State Priority: Pupil Engagement
The SARC provides the follow ing information relevant to the State priority: Pupil Engagement (Priority 5):
High school dropout rates; andHigh school graduat ion rates
Opportunities for Parental Involvement (School Year 2016-17)Opportunities for Parental Involvement (School Year 2016-17)
Parent Involvement: Parental involvement is highly encouraged at Urban Discovery Academy, w ith plent iful opportunit ies for fmaily involvement. Volunteeropportunit ies may include: helping w ith school events, classroom support, chaperoning field trips, helping at lunch, volunteering on our School Advisory Council,and much more. The UDA Network (open to all parents) focuses on building community, culture and a spirit of volunteerism across our dynamic school. We inviteyou to come to meetings to help plan upcoming events. Parents receive information about community involvement through our weekly school communicat ions.Events and act ivit ies include but are not limited to: Golf Tournament, Fall Fest ival, Arts Fest ival and Skate Night. Any money raised through school events goestowards current school goals or init iat ives, such as increasing technology access and sustaining our rich and varied extracurricular programming and supplies,including: STEAM resources, project-based learning, physical educat ion, performing arts, visual arts, and library.
General Meetings and Coffee Social: Our Coffee Socials take place on the first Friday of each month from 8:15am-9:00am: The Parent Network GeneralMeet ing takes place during Coffee Socials follow ing the monthly Stellar Student awards ceremony. All families are welcome and encouraged to attend.
Dropout Rate and Graduation Rate (Four-Year Cohort Rate)Dropout Rate and Graduation Rate (Four-Year Cohort Rate)
Indicator
School District State
2012-13 2013-14 2014-15 2012-13 2013-14 2014-15 2012-13 2013-14 2014-15
Dropout Rate 0.0% 0.0% 0.0% 0.0% 0.0% 0.0% 11.4% 11.5% 10.7%
Graduat ion Rate 87.90 89.70 89.40 80.44 80.95 82.27
Dropout/Graduation Rate (Four-Year Cohort Rate) Chart
2012-13 2013-14 2014-15-1.0
-0.5
0.0
0.5
1.0Dropout Rate
Graduation Rate
2015-16 SARC - Urban Discovery Academy
Page 25 of 33

Last updated: 1/30/2017
2015-16 SARC - Urban Discovery Academy
Page 26 of 33

Completion of High School Graduation Requirements - Graduating Class of 2015 Completion of High School Graduation Requirements - Graduating Class of 2015
(One-Year Rate)(One-Year Rate)
Student Group School District State
All Students -- 79 85
Black or African American -- 73 77
American Indian or Alaska Nat ive -- 75 75
Asian -- 89 99
Filipino -- 90 97
Hispanic or Lat ino -- 74 84
Native Hawaiian or Pacific Islander -- 82 85
White -- 85 87
Two or More Races -- 85 91
Socioeconomically Disadvantaged -- 77 77
English Learners -- 42 51
Students w ith Disabilit ies -- 47 68
Foster Youth -- -- --
2015-16 SARC - Urban Discovery Academy
Page 27 of 33

Last updated: 1/30/2017
Last updated: 1/30/2017
Last updated: 1/30/2017
State Priority: School Climate
The SARC provides the follow ing information relevant to the State priority: School Climate (Priority 6):
Pupil suspension rates;Pupil expulsion rates; andOther local measures on the sense of safety
School Safety Plan (School Year 2016-17)
Suspensions and ExpulsionsSuspensions and Expulsions
School District State
Rate 2013-14 2014-15 2015-16 2013-14 2014-15 2015-16 2013-14 2014-15 2015-16
Suspensions 5.0 3.5 2.5 4.2 3.7 3.4 4.4 3.8 3.7
Expulsions 0.0 0.0 0.0 0.1 0.1 0.1 0.1 0.1 0.1
Suspensions
2013-14 2014-15 2015-160.0
1.0
2.0
3.0
4.0
5.0
6.0School Suspensions
District Suspensions
State Suspensions
Expulsions
2013-14 2014-15 2015-160.00
0.02
0.04
0.06
0.08
0.10
0.12School Expulsions
District Expulsions
State Expulsions
Urban Discovery Academy believes that safety is of utmost importance. We have policies and procedures in place to keep students safe on school grounds before,during, and after the school day. Our safety plans are reviewed and approved annually by our Board of Directors, ensuring updates and oversight w ith each newschool year. Our staff and students are trained each year on important safety procedures, and pract ice regular monthly emergency drills throughout the year,including: earthquake, fire evacuat ion, and lockdown drills. UDA is a locked campus; visitors must enter through the front office, where they are required to signin and receive a badge from our front office staff.
UDA opens its school doors for supervision beginning at 7:15 in the morning for our K-8 students. We contract w ith a licensed after-school care organizat ion toprovide a safe and enriching program for students after school day. We work w ith addit ional contracted service providers to provide addit ional opt ions forafterschool programming, including: theater, arts, music, athlet ics, STEAM, and more. In addit ion to after-school care, UDA offers several sports teams, includingvolleyball and basketball. Many teachers also stay after school to support students w ith academic work and to sponsor student clubs.
2015-16 SARC - Urban Discovery Academy
Page 28 of 33

Last updated: 1/30/2017
Last updated: 1/30/2017
D. Other SARC InformationThe information in this sect ion is required to be in the SARC but is not included in the state priorit ies for LCFF.
Note: Cells w ith NA values do not require data.
Average Class Size and Class Size Distribution (Elementary)
* Number of classes indicates how many classes fall into each size category (a range of total students per class).
Federal Intervention Program (School Year 2016-17)Federal Intervention Program (School Year 2016-17)
Indicator School District
Program Improvement Status Not in PI In PI
First Year of Program Improvement 2012-2013
Year in Program Improvement Year 3
Number of Schools Current ly in Program Improvement N/A 145
Percent of Schools Current ly in Program Improvement N/A 75.1%
2013-14 2014-15 2015-16
Grade Level Average Class Size
Number of Classes *
Average Class Size
Number of Classes *
Average Class Size
Number of Classes *
1-20 21-32 33+ 1-20 21-32 33+ 1-20 21-32 33+
K 20.0 2 0 0 17.0 2 0 0 24.0 0 2 0
1 21.0 1 1 0 23.0 0 2 0 24.0 0 2 0
2 21.0 0 2 0 24.0 0 2 0 24.0 0 2 0
3 21.0 1 1 0 23.0 0 2 0 24.0 0 2 0
4 25.0 0 2 0 24.0 0 2 0 28.0 0 2 0
5 24.0 0 2 0 25.0 0 2 0 28.0 0 2 0
6 21.0 0 4 0 19.0 8 7 0 27.0 0 2 0
Other 0.0 0 0 0 0.0 0 0 0 25.0 0 3 0
2015-16 SARC - Urban Discovery Academy
Page 29 of 33

Last updated: 1/30/2017
Last updated: 1/30/2017
Last updated: 1/30/2017
* Number of classes indicates how many classrooms fall into each size category (a range of total students per classroom). At the secondary school level, this information isreported by subject area rather than grade level.
Academic Counselors and Other Support Staff (School Year 2015-16)
Note: Cells w ith N/A values do not require data.
*One Full T ime Equivalent (FTE) equals one staff member working full t ime; one FTE could also represent two staff members who each work 50 percent of full t ime.
Note: Cells w ith N/A values do not require data.
Average Class Size and Class Size Distribution (Secondary)Average Class Size and Class Size Distribution (Secondary)
2013-14 2014-15 2015-16
Subject Average Class Size
Number of Classes *
Average Class Size
Number of Classes *
Average Class Size
Number of Classes *
1-22 23-32 33+ 1-22 23-32 33+ 1-22 23-32 33+
English 22.0 0 0 0 20.0 2 1 0 27.0 0 5 0
Mathematics 22.0 1 1 0 20.0 2 1 0 27.0 0 5 0
Science 22.0 1 1 0 20.0 3 1 0 27.0 0 5 0
Social Science 22.0 1 1 0 20.0 1 1 0 27.0 0 5 0
Title Number of FTE* Assigned to School Average Number of Students per Academic Counselor
Academic Counselor 0.0
Counselor (Social/Behavioral or Career Development) 1.0 N/A
Library Media Teacher (librarian) 1.0 N/A
Library Media Services Staff (paraprofessional) N/A
Psychologist 0.4 N/A
Social Worker N/A
Nurse N/A
Speech/Language/Hearing Specialist N/A
Resource Specialist (non-teaching) 2.0 N/A
Other N/A
Expenditures Per Pupil and School Site Teacher Salaries (Fiscal Year 2014-15)Expenditures Per Pupil and School Site Teacher Salaries (Fiscal Year 2014-15)
LevelTotal Expenditures Per
PupilExpenditures Per Pupil
(Supplemental/Restricted)
Expenditures PerPupil
(Basic/Unrestricted)Average Teacher
Salary
School Site $6930.0 $1547.0 $5383.0 $42235.0
District N/A N/A -- --
Percent Difference – School Site andDistrict
-- -- -- --
State N/A N/A $5677.0 $75837.0
Percent Difference – School Site and State -- -- -- --
2015-16 SARC - Urban Discovery Academy
Page 30 of 33

Last updated: 1/30/2017
For detailed information on salaries, see the CDE Cert ificated Salaries & Benefits Web page at http://www.cde.ca.gov/ds/fd/cs/ .
Types of Services Funded (Fiscal Year 2015-16)Types of Services Funded (Fiscal Year 2015-16)
Our staff includes grade level teachers for core subjects, along w ith the follow ing enrichment teachers:
Two physical educat ion teachers
One Spanish teacher (w ith a second teacher through contracted programming)
One performing arts teacher
One fine arts teacher
One STEAM teacher
Our teachers use project-based learning and an interdisciplinary approach to integrated arts, and STEAM concepts throughout core courses.
In addit ion to general educat ion programming, we have a comprehensive special educat ion program w ith two ed specialists, four aides, and a variety ofcontracted service providers to service students w ith IEPs.
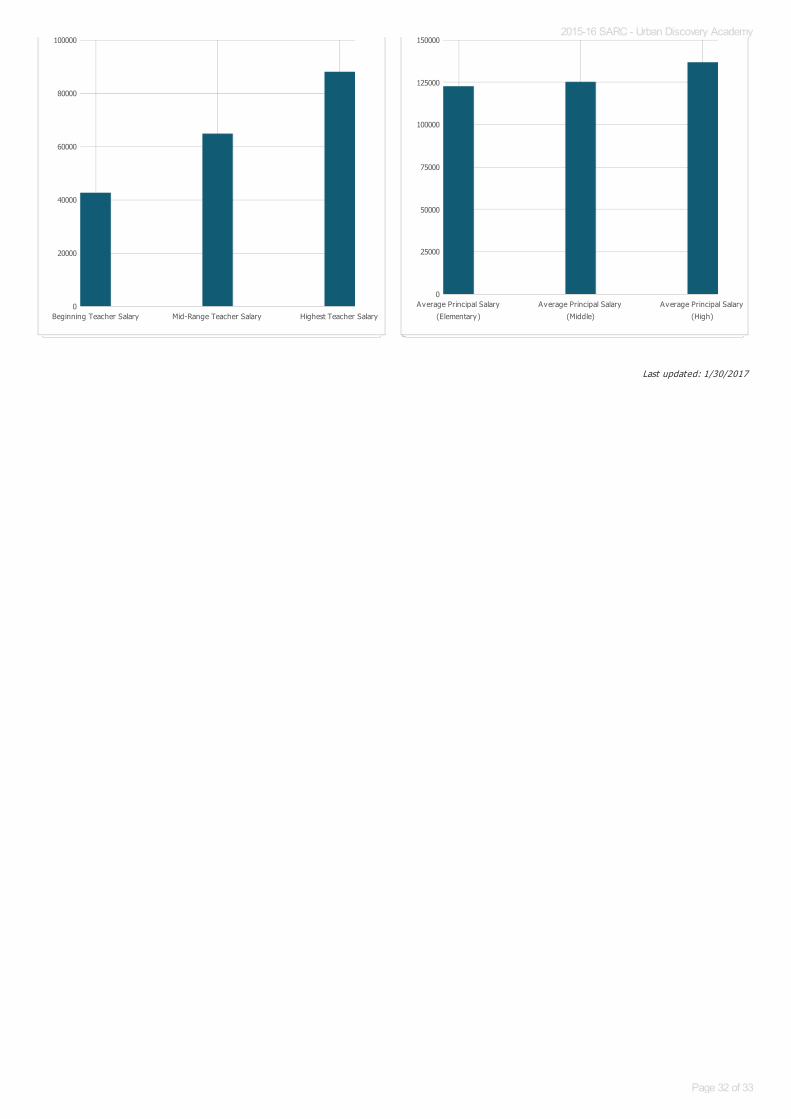
Teacher and Administrative Salaries (Fiscal Year 2014-15)Teacher and Administrative Salaries (Fiscal Year 2014-15)
Category District Amount State Average For Districts In Same Category
Beginning Teacher Salary $42,632 $45,092
Mid-Range Teacher Salary $64,780 $71,627
Highest Teacher Salary $88,049 $93,288
Average Principal Salary (Elementary) $122,585 $115,631
Average Principal Salary (Middle) $125,249 $120,915
Average Principal Salary (High) $136,833 $132,029
Superintendent Salary $261,667 $249,537
Percent of Budget for Teacher Salaries 37.0% 37.0%
Percent of Budget for Administrat ive Salaries 5.0% 5.0%
Teacher Salary Chart
100000
Principal Salary Chart
150000
2015-16 SARC - Urban Discovery Academy
Page 31 of 33
Last updated: 1/30/2017
Beginning Teacher Salary Mid-Range Teacher Salary Highest Teacher Salary0
20000
40000
60000
80000
100000
Average Principal Salary
(Elementary)
Average Principal Salary
(Middle)
Average Principal Salary
(High)
0
25000
50000
75000
100000
125000
1500002015-16 SARC - Urban Discovery Academy
Page 32 of 33

Last updated: 1/30/2017
Professional DevelopmentProfessional Development
Urban Discovery Academy has a minimum day each Wednesday for teacher professional development. In addit ion, teachers and staff meet for more than oneweek before school starts to part icipate in professional development and collaborat ive planning. Some of the act ivit ies our staff part icipate in include CommonCore State Standards training, project-based learning, creat ing a posit ive school culture, restorat ive pract ices, behavior/classroom management, safety training,English language development strategies, close reading, specific assessment training and data analysis, goal-sett ing, as well as grade-specific and content-specificworkshops. Teachers also part icipate in extended professional learning externally throughout the year. In addit ion to tranings, our teachers spend a significantamount of t ime on vert ical and horizontal collaborat ion, including innovat ive interdisciplinary project design.
2015-16 SARC - Urban Discovery Academy
Page 33 of 33