Embed Size (px)
Citation preview

Running head: THE QUESTIONNAIRE BIG SIX IN 26 NATIONS
The Questionnaire Big Six (QB6) in 26 Nations: Developing Cross-Culturally
Applicable Big Six, Big Five, and Big Two Inventories
Amber Gayle Thalmayer and Gerard Saucier
University of Oregon
Author Note
Amber Gayle Thalmayer and Gerard Saucier, Department of Psychology, University of
Oregon.
Amber Gayle Thalmayer is now at OptumHealth.
Correspondence concerning this article should be addressed to Amber Gayle Thalmayer,
OptumHealth, P.O. Box 9472 OR 995-1000, Minneapolis, MN, 55440-9472. Email:

THE QUESTIONNAIRE BIG SIX IN 26 NATIONS 2
Abstract
The Big Five is a useful model of attributes now commonly used in cross-cultural research, but
without the support of strong measurement invariance (MI) evidence. The Big Six has been
proposed as a cross-culturally informed update, and the broader Big Two (Social Self-Regulation
and Dynamism) draws on even more cross-cultural evidence. However, neither has been
rigorously tested for cross-cultural MI. Here a Big Six inventory (36QB6) and measures of the
Big Five and Big Two derived from it, were tested and refined for cross-cultural usability in
samples from 26 nations, divided into three subsets. CFA of the models in the first subset of
nations demonstrated fit as strong in translation as typical personality measures achieve in their
nation of origin (although poor per standard benchmarks). Items that performed inconsistently
across cultures were removed, and alternates considered in a second subset of nations. Fit and
invariance were improved for refined 30-item QB6 (30QB6), 25-item Big Five (25QB5), and 14-
item Big Two (14QB2) measures in the third subset of nations. For all models, decrease in CFI
between MI levels was larger than .01, indicating lack of support for higher levels. Configural
and factorial invariance were relatively stronger, compared to scalar and full.
Keywords: Personality Measures, Cross Cultural Psychology, Personality Traits
THE QUESTIONNAIRE BIG SIX IN 26 NATIONS 3
The Questionnaire Big Six (QB6) in 26 Nations: Developing Cross-Culturally
Applicable Big Six, Big Five and Big Two Inventories
While the scientists developing models of personality over the last century have generally
come from a restricted range of nations in North America and Europe, psychology is the study of
the human mind and behavior in general. It is certainly the goal of most psychologists to
understand human personality in ways that transcend the immediate place and time of the
researcher.
Standard practice in the field has been to thoroughly refine and validate a proposed
inventory in the initial language of development. Only after an inventory is well established, is it
translated into other languages, and its cross-cultural applicability assessed. With this project, we
take a more ‘culture-fair’ approach. Data from diverse nations is drawn on to refine three
personality measures (the QB6 and Big Five and Big Two measures derived from it). Here an
inventory platform developed in English (but based on evidence from lexical work in many
languages) is tested for cross-cultural applicability at a relatively early stage of development.
This allows evidence from diverse cultures to play a role in inventory refinement, and should
lead to inventories that are more culturally de-centered.
The Big Five
The use of lexical studies in the 1970s, based on the rationale that the most important
distinctions between people will be encoded in the natural languages (Goldberg, 1981), allowed
personality researchers to move away from expert judgment in selection of variables, and to base
studies of personality structure on objective patterns in personality lexicons. The procedure of
lexical studies is easily transferable to diverse languages. In any new setting, four basic steps can
be followed: 1) extract all personality relevant terms from a dictionary; 2) reduce to a tractable

THE QUESTIONNAIRE BIG SIX IN 26 NATIONS 4
number; 3) administer in inventory-form to participants; and 4) use factor analysis to determine
which terms hang together and best distinguish between individuals in the population. A standard
methodology (and the linking of results by the use of marker sets) has allowed for comparison of
structural models of personality attributes across languages.
The Big Five (Extraversion, Emotional Stability vs. Neuroticism, Conscientiousness,
Agreeableness, and Intellect/Openness) rose to prominence when factor-analytic studies
conducted with temperament and personality scales and lexical studies in English, German
(Ostendorf, 1990), and Dutch (De Raad, Henriks, & Hofstee, 1992) converged on this model
(Goldberg, 1990; Saucier & Goldberg, 1996). A degree of consensus has been highly generative
for the field of personality psychology, and many meaningful relations between life outcomes
and scores on the five factors have been established (e.g. Ozer & Benet-Martinez, 2006).
Big Five inventories have been used regularly in cross-cultural research, but have
generally not been subjected to full measurement invariance analyses (Church et al, 2011). Initial
investigations, including PCA, have suggested an initial level of configural invariance for the
NEO-PI-R across cultures (McCrae, 1997; Poortinga, Van De Vijver, & Van Helmert, 2002).
And Nye, Roberts, Saucier, & Zhou (2008), comparing one Big Five scale at a time across three
cultural groups (using the mini Markers, Saucier 1994), found configural but not factorial or
scalar invariance. More rigorous measurement invariance analyses of the NEO-PI-R in three
nations indicated considerable differential item functioning for nearly half the items (Church et
al, 2011).
The Big Six
Lexical studies have since been completed in languages increasingly culturally and
linguistically distant from the original trio of Germanic languages. The accumulating evidence

THE QUESTIONNAIRE BIG SIX IN 26 NATIONS 5
suggests that updates to the Big Five model could make it more cross-culturally informed
(Ashton et al, 2004; Saucier 2009). Studies in Italian (De Raad, DiBlas, & Perugini, 1997),
Hungarian (Szirmak & De Raad, 1994), Greek (Saucier, Georgiades, Tsaousis, & Goldberg,
2005), and Chinese (Zhou, Saucier, Gao, & Liu, 2009) have not found the Big Five in the five
factor solutions. The addition of a sixth factor, including content related to personal integrity
versus taking advantage of others, makes the model better match empirical results from a larger
group of lexical studies. A more cross-cultural model, drawn from a larger and more diverse
population base, is more likely to replicate over time and across additional languages and
cultures. Even in North America, the Big Six has been shown to have some theoretical and
predictive advantages over the Big Five, and to contribute additional interpretive power (Ashton
& Lee, 2007; Saucier, 2009; Thalmayer, Saucier, & Eigenhuis, 2011). Luckily, the Big Six
model is highly isomorphic to the Big Five, allowing for straightforward integration of previous
research results with this updated model.
The Questionnaire Big Six (QB6) scales, including Conscientiousness, Honesty/
Propriety, Agreeableness (Kindness & Even Temper), Resiliency versus Internalizing Negative
Emotionality, Extraversion (Gregariousness and Positive Emotionality), and Originality/Talent,
are highly comparable to Big Five dimensions, and to Ashton and Lee’s (2007) HEXACO six-
factor inventory (Saucier, 2009). The QB6 scales are complementary to the HEXACO
inventories in being shorter. Advantages of the QB6 include better elucidation of the
“externalizing” domain, compared to the Big Five, because Agreeableness and
Honesty/Propriety distinguish between reactive versus predatory aggression, respectively, at
their low ends. Internalizing affect (depression, anxiety, tendencies toward panic and phobias) is
also better represented than in Big Five measures of similar length. And Originality/Talent

THE QUESTIONNAIRE BIG SIX IN 26 NATIONS 6
encompasses perceived talents, abilities, and intellectual interests, including “positive valence”
content typically found in broader variable selection studies, but excluded in most inventories
(Thalmayer et al, 2011).
The Big Two
There is evidence that one-and two-factor models of personality structure may be even
more ubiquitous (Saucier, Thalmayer, & Bel-Bahar, 2014; Saucier, Thalmayer et al, 2014).
Saucier, Thalmayer et al (2014) provide specific highly recurrent terms for a two dimensional
model (Social Self-Regulation [S] and Dynamism [D]) drawn from nine diverse lexical studies.
This ‘Big Two’ was not derived as higher-order factors from Big Five (or Six) scales, but from
the first two factors derived when hundreds of natural-language descriptors are analyzed. One
factor (D) appears to relate to the relative proportion of approach versus avoidant tendencies in
the personality, whereas the other (S) relates to the internalization of social and cultural norms.
This model of personality attributes is more ‘culturally de-centered’ – based on data from diverse
populations around the world – thus it minimizes bias for or against one kind of human culture or
population.
A two-factor model is the highest of three levels of structure commonly used by
contemporary personality psychologists; higher-order factors of the Big Five (Digman, 1997; De
Young, 2006) are similarly at this level, and are comparable to the Big Two. This simple model
can be differentiated into the useful mid-level, with five or six factors. Even more predictive
power is available at the facet level, where each of the five or six factors are differentiated into
subcomponents (John & Srivastava, 1999), as in the NEO-PI-R (Costa & McCrae, 1992) or the
HEXACO (Lee & Ashton, 2004). Psychologists will naturally choose more differentiated models
where possible, to facilitate prediction. But two factors make for a parsimonious model with

THE QUESTIONNAIRE BIG SIX IN 26 NATIONS 7
potential advantages for theory. They replicate reliably across diverse cultures and languages and
across diverse variable selection strategies and procedures (Saucier, Thalmayer et al, 2014), and
thus offer a firmer foundation for the cross-cultural study of personality. An inventory developed
using this culturally de-centered model is more appropriately, and should be more easily,
translated into new languages, facilitating cross-cultural research and measurement invariance.
Cross-Cultural Measurement Invariance and Goals for the Current Study
The current study assesses cross-cultural consistency in Big Six self-report personality
data from 26 nations collected as part of the Survey of World Views, a large omnibus survey of
constructs relevant to cross-cultural psychology (Saucier, Kenner, et al., 2014). The 36QB6 is
tested for measurement invariance (MI) and refined for cross-cultural applicability. Because the
Big Five is the closest the field of personality has to a “consensual model,” and because it is now
often measured across cultures, a workable Big Five inventory is also constructed from items in
the dataset, tested, and refined. Because the Big Two has theoretical and cross-cultural
advantages, but no measure of it currently exists, a 20-item Big Two inventory developed from
QB6 items is also tested and refined. Developing and validating the three measures from QB6
items can allow researchers, regardless of preferred model, to make use of the translations into
31 languages of the 40 personality items used in the Survey of World Views (all items and
translations are freely available at http://psychometriglossia.uoregon.edu/).
Invariance testing allows us to determine the extent to which items are used in similar
ways by different groups, and the extent to which the same patterns of correlations between
items emerge. To the extent that MI can be established for the QB6 and/or it’s QB5 and QB2 off-
shoots, we can have more confidence that these models of personality and these specific
inventories are cross-culturally appropriate. Where established, comparison of correlations

THE QUESTIONNAIRE BIG SIX IN 26 NATIONS 8
between attribute dimensions and other constructs and life outcomes of interest can confidently
be made across cultural groups.
Invariance testing typically proceeds in four stages. At the most basic level, configural
MI tests whether the same factors apply across groups; there are no parameter equality
constraints. If established, configural MI indicates that individuals across nations use the same
number of latent variables to reflect differences in scores on the items, providing a reference
model for more constrained models. We can then proceed to test factorial or metric equivalence -
- whether the same factor structure (number of latent variables and interrelationships to one
another and indicator items) hold across the groups (Vandenberg & Lance, 2000), and thus
whether same items can be used to assess the constructs across groups. Factorial invariance
involves a constraint of equality-across-groups for factor loadings. If established, this suggests
that items are used in a similar way across groups with respect to factor structure, and that latent
variables have well-matched content across groups; in this case it is reasonable to examine the
relationships of these latent variables to other constructs of interest across groups. A lack of MI
at this stage means there is content in the latent constructs that varies from group to group, and
suggests that items are perceived and interpreted differently, or that attributes covary with one
another inconsistently across contexts. Factorial invariance is necessary though not sufficient for
comparing scores across groups.
The level of scalar equivalence tests whether patterns of scores and weight parameters
(factor loadings) match across groups, such that relative differences can be compared. It sets a
constraint that intercepts be equal across groups, so that any cross-cultural differences cannot be
attributed simply to differential functioning the single indicators in various groups. Finally, full
equivalence involves constraints on the residual variances and tests whether scales measure

THE QUESTIONNAIRE BIG SIX IN 26 NATIONS 9
latent traits with similar reliability across groups. Full (or strict) invariance means that one can
directly compare scores at face value across groups, interpreting differences as applied to latent
constructs.
Models will initially be tested in each country using single-group confirmatory factor
analysis (CFA). There is reason to anticipate levels of fit that do not achieve standard
benchmarks per Hu and Bentler (1999). For multi-factor inventories like the QB6, with
measurement at the item level, such benchmarks are rarely, if ever, achieved (Marsh, Hau &
Wen, 2004). This might be due to a variety of factors: accumulation of item-level error, order
and method effects, similarities in wording and life-domains referenced (e.g., Poortinga et al.
2002). It can also be argued that personality itself lacks the ‘local independence’ or simple
structure that fit indices reward (Cramer et al, 2012). In the QB6, items that are direct opposites
of one another have generally been avoided, and the largest possible range of domain content has
been included in each short scale. Such an approach is intended to maximize predictive validity,
not internal consistency.
Hopwood and Donnellan (2010) demonstrate that multidimensional personality
inventories, many of which were developed by exploratory factor analysis, routinely fail to
achieve adequate fit per standard benchmarks. Their CFAs of eight inventories (all constructed in
North America) found that none achieved adequate fit in a North American community sample,
despite established predictive validity. (Two had inadmissible results, remaining six: TLI .52-.70,
CFI .61-.79, RMSEA .09-.13.) If it is difficult to achieve good fit of multidimensional models in
one population, it will be even more challenging to find it in models tested across diverse
populations. Thus, comparisons will be made to the fit indices reported by Hopwood and
Donnellan (2010) as reasonably high, ‘domain specific’ benchmarks.

THE QUESTIONNAIRE BIG SIX IN 26 NATIONS 10
The current study initially assesses the cross-cultural usability of the QB6. The Big Six
model was developed using the results of culturally diverse lexical studies (Saucier, 2009), and
thus it is expected to have a better chance of measurement invariance across cultures than many
other personality models. However, the measures of the Big Six were developed using North
American data as a baseline, so the QB6 is likely to fit best in the North American populations
that had the most impact on its development. It is likely that it will fit less well as samples more
culturally distant from this place of origin are tested.
A Big Five and a Big Two model will also be tested. The Big Five is a simpler structure
than the Big Six, but it reflects a somewhat smaller base of lexical personality research. Thus the
overall fit is anticipated to be similar to the Big Six. The Big Two is a parsimonious model
drawing on a more diverse range of cultures than the Big Six (Saucier, Thalmayer et al, 2014).
Thus, it might be anticipated to demonstrate better cross-cultural measurement invariance,
particularly in non-western settings. The comparative fit of the models, however, is not the
purpose of the current study. Because the three models are all derived from a Big Six measure,
the Big Five and Big Two begin such a comparison at a disadvantage. Our main purpose in
including additional models derived from a Big Six measure is to explore the relative fit of items
and thereby refine measures of the three models for the use of researchers who collect survey
data for cross cultural comparisons.
Method
Participants
Survey of World Views data included 8,883 participants from 33 countries. In the current
study, several exclusion criteria were applied prior to analysis. Participants were eliminated if they
were not students; if more than 10% of a participant’s 36QB6 responses were missing; if that
participant’s standard deviation for 36QB6 items was below .50 (to cull those who tended to give the

THE QUESTIONNAIRE BIG SIX IN 26 NATIONS 11
same response for every item); or if they were one of a few cases judged to be a likely duplicate
responder. Participants were also excluded if they were very extreme and consistent with respect to
yea-saying or nay-saying in the full questionnaire. Finally, countries were excluded if the
remaining sample was smaller than 150 participants. Criteria for even stricter exclusions were
applied only as a last resort in individual country-samples where problems with analysis convergence
were encountered (noted in text).
Table 1 displays sample sizes per country for the 7,378 participants from 26 nations included
in the current analyses. Average age in the samples ranged from 19.8 in the Philippines and
Ukraine to almost 24 in Kenya, Ethiopia, and Argentina, and 24.5 in Tanzania (average sample
mean age = 21.7, SD = 1.28). In four of the 26 nations men were the majority of participants
(Bangladesh [22% female], Ethiopia [28%], Tanzania [31%], and Kenya [34%]). In the
remaining 22 nations, women were the majority, with the highest percentages in Thailand (75%),
Brazil (78%) and Poland (89%; average across samples = 59% female).
The country samples were grouped into three subsets to facilitate model respecification
and testing. Selection of countries into these subsets was made prior to this study by the second
author, such that each has a high N and represents all major parts of the world in a similar way.
Splitting the countries into three sets enabled us to: a) test a priori structural models, b)
empirically derive models that might achieve a better fit, and c) rigorously test those models to
establish their generalizability and usefulness to investigators in future studies. We were able to
use the first set of countries as a derivation sample, in which a model is derived and optimized,
and the second set of countries as a cross-validation sample, in which the fit of the optimized
model is interpreted as a realistic estimate of the generalizability of the optimized model to other
samples (Wiggins, 1973). This procedure could then be repeated to further refine the model for
cross-validation in the third set of countries. Cross-validation is recommended for regression-

THE QUESTIONNAIRE BIG SIX IN 26 NATIONS 12
based procedures when the sample is large enough (Horst, 1966; Wiggins, 1973). Each of our
sets of countries had over 2,000 cases, which seems a sufficient sample size for empirically
deriving or for testing a model.
Procedure
Country selection attempted to represent the world, in terms of demographic footprint and
economic impact. The 33 sampled countries have aggregated populations amounting to 67.3 percent
(4.7 billion) of the world’s population; when the gross domestic product of these 33 countries is
aggregated, the total makes up 76.2 percent of the gross aggregate domestic products of all countries
in the world (Central Intelligence Agency, 2012).
Cooperating faculty from diverse fields publicized the study to students at their own
higher-education institutions. Data were collected online in 2012 via a U.S. server platform, with
compensation handled via Western Union or Amazon gift coupons. See Saucier, Kenner et al (2014)
for details about data collection and the full sample. Use of college students enabled standardized
online administration and minimized between-population differences in level of education.
Materials
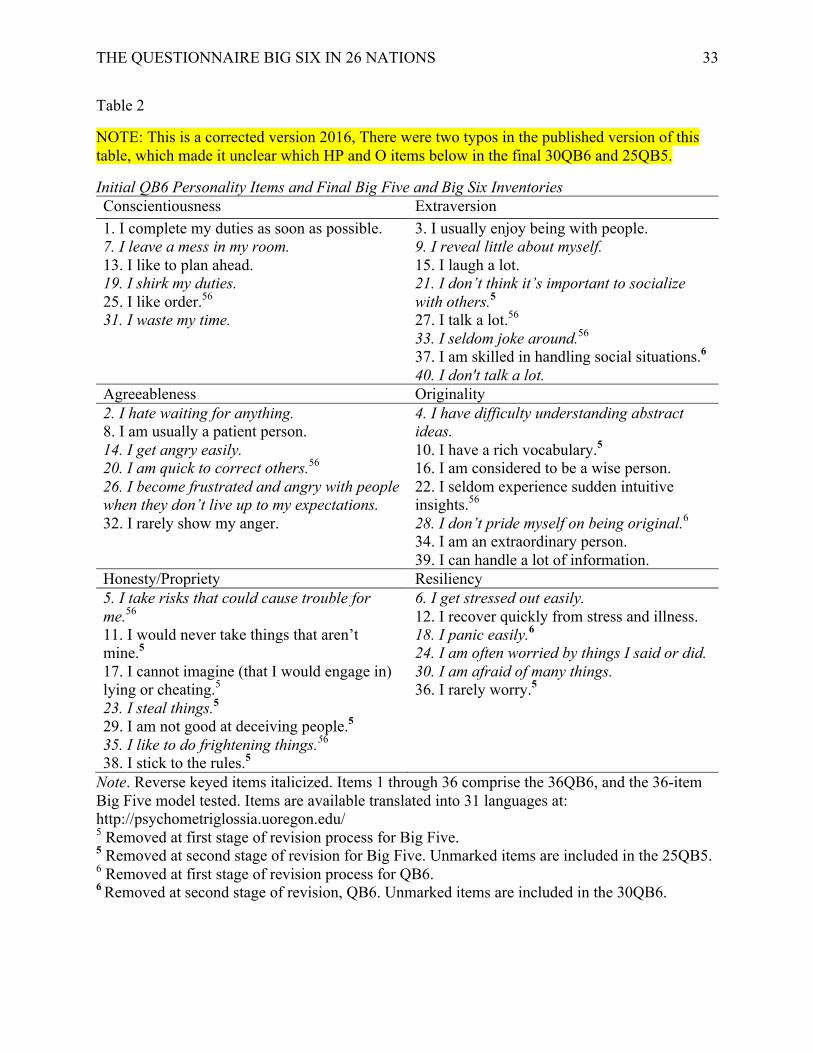
The current study used 40 total QB6 items (the 36QB6 and, appended at the end, four QB6
items from longer versions; Saucier, 2009; see Table 2). Questionnaires for participants in Canada,
England, India, Kenya, Singapore, and the United States were in English. Participants in other
countries used items translated into Chinese (China, Taiwan), ‘new world’ Spanish (Peru,
Argentina), Castilian Spanish (Spain), Arabic (Morocco), Kiswahili (Tanzania), Amharic (Ethiopia),
Portuguese (Brazil), or German, Polish, Ukrainian, Greek, Turkish, Japanese, Thai, Malay, Nepali,
Bengali, or Filipino/Tagalog. In all cases back-translation was used, with at least two translators
working independently.
In addition to the QB6, a Big Five model and indicators of the Big Two, Social Self-

THE QUESTIONNAIRE BIG SIX IN 26 NATIONS 13
regulation and Dynamism, were analyzed. The initial Big Five included all items from the 36QB6,
with Agreeableness (A) and Honesty/Propriety (H) items collapsed into a single scale. This
conceptualization of an A/H scale emphasizes H more than some Big Five A scales (there is
greater emphasis here on patience and on a lack of hostility or taking advantage of others, and
less on being actively kind). However, DeRaad et al (2010) argue that the Honesty dimension
should rightly be considered part of Agreeableness, in part based on their interpretation of
Ashton and Lee (2007) that two of the six facets of NEO-PI-R A are Honesty-related. As evident
in Thalmayer et al (2011, supplemental materials), the other scales of the 48QB6 (a slightly
longer version of the 36QB6) correlate highly with analogous BFI (John, Donahue, & Kentle,
1991) and NEO-FFI (Costa & McCrae, 1992) Big Five scales. The convergent correlations were
.80 to .81 for Conscientiousness, .76 to .82 for Resiliency and Emotional Stability versus
Neuroticism, .68 to .70 for Extraversion, .63 to .74 for Openness and Originality. The highest
divergent correlation was only .36 (BFI Agreeableness with QB6 Extraversion).
Ten-item Big Two scales (see Table 3) were developed from the 40 personality items
available in the Study of World Views data using the following procedure:
1. The 40 items were correlated in the Eugene Springfield Community Sample (N = 453)
with Big Two adjective markers from Saucier, Thalmayer et al (2014).
a. For Social Self-Regulation (S) terms included: Honest, kind, generous, gentle,
good, obedient, respectful, diligent, responsible and (reverse keyed) selfish.
b. For Dynamism (D), terms included: Active, brave, bold, lively and (reverse
keyed) timid, weak, and shy.
2. A reduced set with at least (roughly) double the loading on the primary versus secondary
factor (relatively univocal) were retained.
3. An EFA indicated items with low loadings that could be dropped, resulting in 13 S and12

THE QUESTIONNAIRE BIG SIX IN 26 NATIONS 14
D items retained.
4. An EFA with the 25 items in a college student sample (N=225) indicated four items with
low loadings and one overly redundant item for removal, leading to scales with 10 items
each.
Analyses
The 36QB6, 36-item Big Five, and the 20-item Big Two were initially tested individually
in each of the set 1 countries using confirmatory factor analysis in Mplus version 7. The set
including the United States was chosen as set 1 to facilitate comparison with fit in the country
most influential in creating the QB6 model. Comparisons were made to standard benchmarks per
Hu and Bentler (1999) and to domain specific benchmarks fit statistics (those reported by
Hopwood and Donnellan [2010]), as detailed above.
Measurement invariance was then tested in four stages (as described above, and
following Muthén and Muthén [2012]):
1. Configural invariance: Factor means fixed at zero in all groups but factor loadings and
other parameters allowed to vary.
2. Factorial/metric invariance: Adds constraint of equal factor loadings across samples to
above.
3. Scalar invariance: Adds constraint of equal intercepts across groups to above; factor
means fixed at zero in one group and free in others.
4. Full/strict invariance: Adds constraint of equal error variances to all above constraints.
According to Cheung and Rensvold (2002) and Kline (2011), change in CFI between one
level and the next of more than .01 indicates that the null hypothesis of invariance should not be
rejected (in other words, fit may be worse at the stricter level). Fit at all levels is reported,

THE QUESTIONNAIRE BIG SIX IN 26 NATIONS 15
however, regardless of whether the criterion is met, for relative comparisons.
Next, items were removed from the 36QB6, the 36-item Big Five, and the 20-item Big
Two based on review of standardized loadings and intercepts across the set 1 countries (for this
step, all 40 available items were considered for the QB6, and 39 of the 40 (excluding additional
H item “I stick to the rules”, which was believed to be more similar to Big Five
Conscientiousness than Agreeableness content). The refined, provisional models were then tested
individually in each set 2 nation, and again standardized loadings and intercept variation across
countries were perused to identify items for removal. The final refined models were then tested
individually and for measurement invariance in the set 3 nations. For comparison purposes, the
original, full-length models were also run in the set 3 nations.
Results
Questionnaire Big Six
The fit of the 36QB6 in the first set of nations is reported in Table 4. The model
converged in all, and fit was similar across countries. Notably, fit was not better in the United
States than in other cultural groups. The fit of the QB6 across nations did not meet standard
benchmarks for good fit in any nation, but it was similar to or better than that reported by
Hopwood and Donnellan (2010) for broad personality inventories developed and tested within
North American samples. Thus, fit can be said to have met domain specific benchmarks in most
of the set 1 nations.
The results of testing the four levels of measurement invariance of the 36-QB6 in set 1
are also reported in Table 4. These indicate little change in fit between configural and factorial
invariance, but some decline in fit between factorial and scalar levels. Between all levels,
however, the change was larger than the .01 criteria proposed by Cheung and Rensvold (2002) to

THE QUESTIONNAIRE BIG SIX IN 26 NATIONS 16
indicate non-significant change. The last stage, full measurement invariance, had to be tested
excluding Kenya, due to difficulty with convergence for the Kenyan group (not positive definite)
in this test only. For comparison purposes, the other three levels are additionally reported
excluding Kenya.
Next, in hopes of revising for maximum cross-cultural fit, we consulted modification
indices. However, these were difficult to act on, because of inconsistency in indications across
groups and lack of interpretability. Instead, we considered the item pool systematically, in terms
of indices of item difficulty and discrimination. The four additional QB6 items (two Extraversion
[E], one Honesty/Propriety [H] and one Originality [O]) were added to the 36 original items, and
the 40 items were perused for differential item functioning across set 1 countries. Items that fit
relatively poorly cross-culturally were identified in terms of: (a) number of countries for which
standardized loadings of the item on intended factor was lower than .25; and (b) high standard
deviation in intercepts, indicating greater relative variation in endorsement (difficulty) across
nations. On this basis, seven items (one each from Conscientiousness [C], H, and Agreeableness
[A], and two each from O and E) were removed from the group (see Table 2)1.
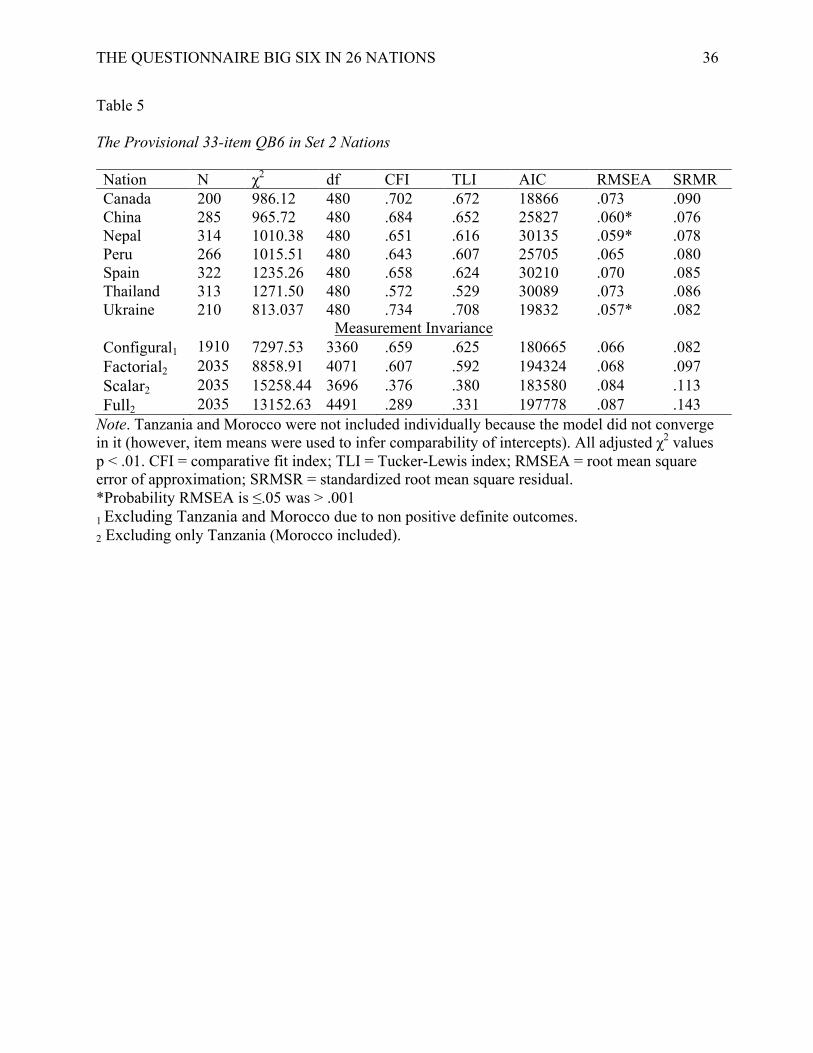
The provisional 33-item QB6 was then tested using CFA in the second set of nations
(see Table 5). Inspection of item standardized loadings and intercepts in this set, and an effort to
maintain balanced keying, led to further removal of one item each from the E, O, H, and
Resiliency scales. (Because the model did not converge in the data from Morocco or Tanzania,
standardized loadings from these groups were not available.) This led to a refined 30-item
version (henceforth 30QB6), with exactly five items on each scale.
The fit of the 30QB6 and the progressive measurement invariance analyses in set 3
1 One of the E item (“I talk a lot”) was removed not due to poor fit, but to avoid redundancy with an added item (”I don’t talk a lot”); the former was chosen for removal in the interest of balanced keying.

THE QUESTIONNAIRE BIG SIX IN 26 NATIONS 17
nations are reported in Table 6. Due to some difficulties with convergence in the data from
Ethiopia, more stringent data selection criteria were used in that group,2 and one item with
especially poor fit was excluded (R36: “I rarely worry”). Fit indices indicate better fit than for
the 36QB6 in set 1, and similar fit to domain specific benchmarks. For direct comparison,
progressive measurement invariance analyses for the 36QB6 in this set of nations are also
included. (At the scalar and full levels, the analysis could not be reported due to difficulties with
the Ethiopia set, and analyses are reported excluding Ethiopia. Comparable analyses of the
30QB6 were added.) The comparison favors the 30QB6 over the 36QB6, as hypothesized,
particularly (in some cases only) in terms of CFI and TLI.
The Big Five
The fit of the 36-item Big Five in the first set of nations is reported in Table 7. The model
converged in all, and fit was similar across countries. Again, fit was not better in the United
States than for other cultural groups. As for the 36QB6, fit across nations failed to meet standard
benchmarks, while generally meeting domain specific benchmarks. The results of testing the four
levels of measurement invariance again indicate little change in fit between configural and
factorial invariance, but some decline in fit in scalar and full levels. Fit is slightly better for the
Big Five than for the Big Six model in terms of CFI and TLI. Again, CFI difference between
2 This set of criteria was developed independently of and prior to the present study, including elimination of cases that might be problematic from a data-quality standpoint. Cases were excluded if any two of the following conditions were met: full (over 300-item) questionnaire completed in under 20 minutes, very low variance in responses across questionnaire, tendency to perseverate (give highly similar responses to adjacent items) across parts of the long questionnaire, high possibility based on cluster analysis of cases that the case was either random in responding or non-independent of another case, and having a response profile (across personality or other items) that was negatively correlated with the typical response profile. The criteria were applied in a conservative way, resulting in a set with N=305, and in a more liberal way, resulting in a set with N = 283. The largest set in which analyses would converge was used. The set used for a set of analyses can be seen in N size in top of Tables 6, 9, and 12.

THE QUESTIONNAIRE BIG SIX IN 26 NATIONS 18
levels of invariance was always greater than .01, indicating that more stringent models fit
significantly more poorly.
To revise for maximum cross-cultural fit, three of the four additional QB6 items (two
Extraversion [E] and one Originality [O]) were added to the 36 original items, and CFA results
for this 39-item version in each set 1 country were perused as described above for the QB6. Here
too, seven items (one each from Conscientiousness [C] and O, two from E, and three from
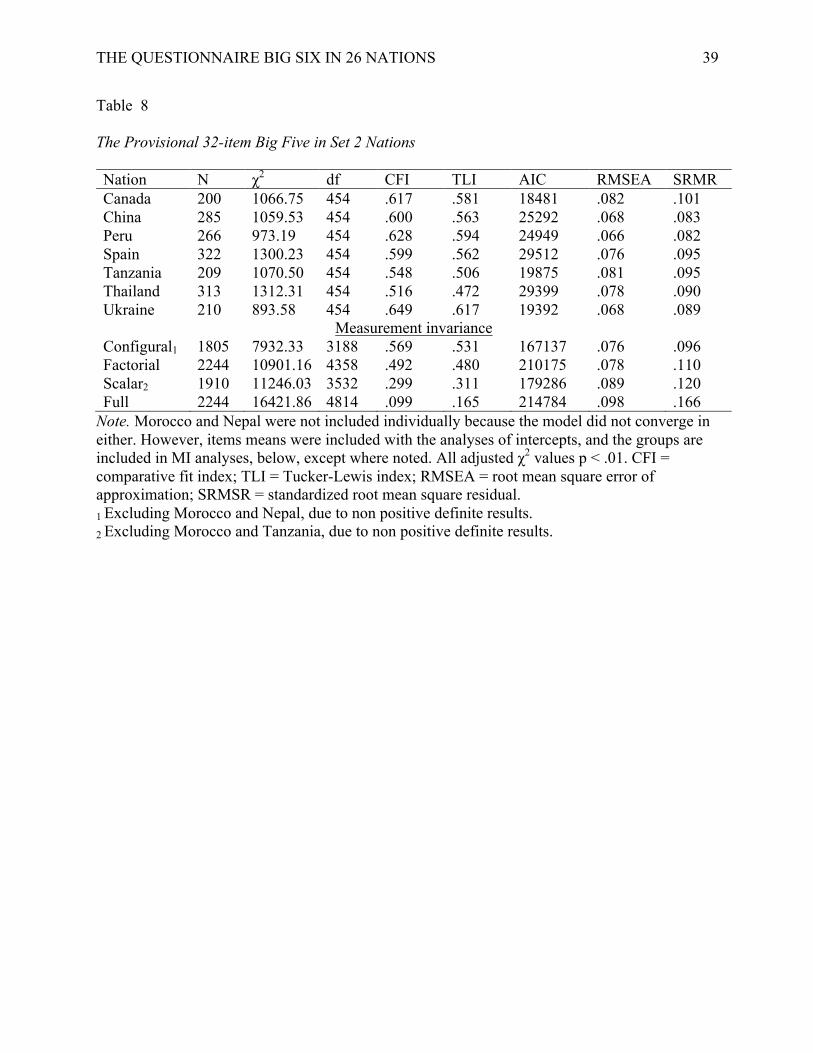
Agreeableness/Honesty [A/H]) were removed from the group. This provisional 32-item Big Five
measure was then tested using CFA in the second set of nations (see Table 8). Inspection of
standardized loadings and intercepts, and an effort to maintain balanced keying and scales of
similar length, next led to removal of one item each from the E, O, and Resiliency scales, and all
four remaining H items from the A/H scale. (Because the model did not converge in the data
from Morocco or Nepal, standardized loadings from these groups were not available.) This led to
a 25-item Big Five, with five items on each scale.
The fit of the 25-item Big Five measure (henceforth 25QB6) and the progressive
measurement invariance analyses in set 3 nations are reported in Table 9. Fit indices indicate
better fit than the 36-item version in set 1.
The Big Two
The 20-item Big Two measure fit slightly less well in the set 1 data than did the 36QB6
(see Table 10). Again, change in CFI between levels of measurement invariance was greater than
.01 in all cases. There was an especially substantial drop off in fit between factorial and scalar
levels, indicating variation in scale means across groups (see Table 1 for scale means by nation).
As above, the standardized loadings of items on their factors and the standard deviation
of item intercepts were consulted to identify cases of differential item functioning for removal.

THE QUESTIONNAIRE BIG SIX IN 26 NATIONS 19
Balanced keying and maintenance of relatively even proportions of Big Six factor content in
each of the Big Two were also considered. On the Social Self-Regulation scale, one H and two A
items stood out as having particularly problematic loadings and intercepts. Three others (two H
and one C item) had more minor indications of poor fit. Because the scale was made with three
H and three C, but only two A items, however, the worst fitting H and C items were removed,
and both A items were retained. Similarly, for Dynamism, because the scale was made from
three E and O but only two Resiliency (R) items, E and O items were chosen for removal from
the pool of those with most problems in fit (see Table 3).
This provisional 16-item Big Two measure was tested in the second set of nations (see
Table 11). Again, standardized loadings and intercepts across countries were consulted to
identify differential item functioning. For S, the poorest fit was observed for one item each from
C, H, and A. Only the C item was removed in order to retain an adequate range of content. For
D, the poorest fit was observed for one E and the two R items. In the interest of retaining the few
remaining reverse keyed items, only one R item was removed.
The refined 14-item Big Two inventory (henceforth 14QB2) was tested in set 3 nations
(see Table 12). Measurement invariance was still very poor at scalar and full levels. Compared to
the 20-item Big Two in the same datasets, fit was slightly improved at all levels.3
3 To explore the role of response biases, an additional set of measurement invariance tests were conducted, with the average acquiescence tendency for each person removed. This average was calculated using 10 heterogeneous pairs of items with opposite meaning in the full data set (e.g. “I talk a lot and “I don’t talk a lot”). The average response to the 20-items (which should logically be the midpoint of the response scale) was subtracted from each of that participant’s item responses, for acquiescence-adjusted datasets centered around the participant’s mean response to the pairs. For all models, results indicated better convergence (it was not necessary to exclude Ethiopia at any level for MI analyses in the QB6, for example, as it was in the non-adjusted data, and improved fit at the scalar and full levels. Overall fit, however was still quite poor at these levels. Results are available from the author. Although many factors make it difficult to determine the extent to which observed mean differences constitute true national differences versus response characteristics, this strategy for addressing the issue of response styles may be a promising future direction for cross-cultural survey research (which could be applicable in other kinds of group comparisons as well). Including matched pairs of forward- and reverse-keyed items allows for a quantatative assessment of a participants’ tendency to yea- or nay-say.

THE QUESTIONNAIRE BIG SIX IN 26 NATIONS 20
Table 14 presents reliability values for the refined scales. The modest level of many of
these indicators of internal consistency can be attributed in large part to the abbreviated nature of
the scales. The scales are designed to capture the core of each factor in a maximally cross-
culturally generalizable way, with the expectation that future psychometric work can effect an
increase the number of items and can rebuild internal-consistency indices to more consistently
adequate levels.
Discussion
In the current study, data from an unusually diverse group of nations was used to test the
measurement invariance and cross cultural applicability of the 36QB6, a measure developed to
improve on the cross-cultural validity of similar inventories. Big Five and the Big Two models
were also tested. Additionally, the large dataset was used to refine more cross-culturally
informed versions of all three measures. Refined (but still provisional) versions presented here
are the 30QB6, the 25QB5, and the 14QB2.
Compared to standard fit indices (Hu & Bentler, 1999), the fit of the initial models in set
1 was marginal. While SRMR was under .09 for most, and RMSEA (which rewards parsimony)
indicated close fit in some instances and adequate fit in many. in no case did CFI or TLI
“incremental fit indices” meet the benchmark (.90 or above). This was anticipated due to
analyzing an item-level, Likert-scale measure (Kline, 2011), with multiple factors, and because
broad-bandwidth personality inventories of this nature consistently achieve poor fit, even when
they demonstrate strong criterion validity (Hopwood & Donnellan, 2010). Fit in CFA may be
fundamentally constrained for such inventories, given cross loadings and similarities in wording
or life domain that logically result in correlated errors (Poortinga et al, 2002). For CFI (which
assesses variance explained over the null model), low values were likely due to low standardized

THE QUESTIONNAIRE BIG SIX IN 26 NATIONS 21
loadings of items on factors (low ‘factor saturation’). Compared to fit indices reported by
Hopwood and Donnellan (2010) for an array of personality inventories developed and tested and
in North America, the results of CFA in the individual countries suggested similar levels of fit.
This might be taken to indicate some level of cross-cultural fit in this particular field of study.
As predicted, neither the Big Six nor Big Five models had a clear advantage over the
other. Comparing the refined 30- and 25-item versions, the Big Five had slightly better CFI and
TLI values, but the QB6 had slightly better RMSEA values. SRMR values were mixed for CFA
in individual countries, but slightly better for across- country analyses in the QB6.
In the tests of measurement invariance, more stringent levels in no cases met the criteria
of less than .01 decrease in CFI. Thus, strictly speaking, the inventories do not meet criteria for
measurement invariance. Looking at relative fit across levels, however, it can be seen that results
suggest acceptable fit at the configural and factorial levels, provided that comparison is made to
domain specific benchmarks. Fit at the configural level suggests that the same number of factors
may work acceptably (again, by domain specific standards) across nations for the refined
versions of all three inventories. At the factorial level, there is likewise indication that the items
load in a rather consistent pattern on the same factors across nations, so that the factors would
have similar interpretation.
The moderate (for the QB6 and Big Five) or dramatic (for the Big Two) drop-off in fit at
the scalar level is not surprising given the divergences in scale means, observable in Table 1. It
appears that while the models all work more or less adequately (by domain specific benchmarks)
at basic levels, to explain the number of latent variables present for the items, and which items
relate to which scales, they do not currently offer any basis for mean comparisons across
cultures. Such comparisons, of course, are problematic for many reasons. Cultural diversity leads

THE QUESTIONNAIRE BIG SIX IN 26 NATIONS 22
to challenges in scale translation because in many cases the same concepts (pride, insights,
taking risks) convey different emotional or evaluative tones. Highly differential levels of
familiarity with survey tasks can lead to differences in use of the scale options. Reference group
effects can also affect responses and scores (Heine, 2012; Heine, Lehman, Peng, & Greenholz,
2002) – likely the case with Conscientiousness in the current data, where the lowest mean score
was observed in Japan, a place hardly known for a lackadaisical, impulsive way of life (scores in
Tanzania were two standard deviations higher). Consistent cultural differences in the amount of
variance observed in trait scales, with Europeans expressing the greatest within-group variation
and East Asians and Africans the least, have also been reported (McCrae, 2002). This may be
because in individualistic, as opposed to collectivistic cultures, more diversity may be expressed
and given importance (McCrae, 2002). It may also be due to response styles driven by similar
cultural forces. For example, in East Asia there is more tendency toward middle responding
(McCrae, 2002).
The difficulty of fitting the QB6 model in data from Africa (Morocco, Ethiopia, and
Tanzania) provides an excellent illustration of the effect of population selection in developing a
model. The Big Five was initially developed in a small range of nations, principally the United
States (e.g. Goldberg, 1990), with crucial early confirmation in the Netherlands and
Germany. The Big Six drew on data from a larger and more diverse group of countries (Ashton
et al, 2004), but this group did not include any from the African continent. None of the models
were developed using data from South America, either, but this has likely been less
consequential, since South American countries use European languages and their populations are
partly a European diaspora. The Big Two model conceptualized here, on the other hand, was
developed based on data from nine nations, two of them African (Saucier, Thalmayer et al,

THE QUESTIONNAIRE BIG SIX IN 26 NATIONS 23
2014). And in the present study, the Big Two model fit just as well in data from Africa as it did
in nations from other regions. It is of note that the final QB2 version fit best first in Ethiopia,
secondly in Bangladesh, and worst in England. The Big Two is, if anything, strongest in the
‘global south’, although the differences are small, and the model works nearly as well in the
‘global north’. Because of a dearth of lexical studies there, we don’t really know what
indigenous five- and six-factor models would be in the ‘global south’; they may have their own
replicable patterns e.g. an alternative ‘southern Big Five’ or Six.
Overall, however, it cannot be said that the QB2 fit better than the QB6 or QB5 – it
simply fit more evenly across contexts, applying in a more trouble-free manner in more places.
As items for this measure were chosen only from QB6 items, this particular measure of the
model started at a disadvantage – few of the core Big Two items identified in the last table in
Saucier, Thalmayer et al (2014) were available in the pool. Such core items would tend to be
interstitial to Honesty, Agreeableness, and Conscientiousness, rather than representing one of
these factors exclusively as in the QB6 item pool. The Big Two measure should thus especially
be seen as in an early stage of development. Future cross-cultural surveys would ideally draw on
a wider selection of items, hewing closer to the content in the adjectives identified in Saucier,
Thalmayer et al (2014); we are not however advocating using actual adjectives as measures of
the Big Two, since adjectives can be especially difficult to faithfully translate.
The QB6 is likewise still under development. Even the refined version presented here is
not intended as a final, superior measure of the Big Five or Six, but as an intermediate iteration
based on a large, interesting pool of items (IPIP; Goldberg et al, 2006). The current study
applies a cross-cultural generalizability criterion to a relatively early stage of inventory
development, with an eye toward creating an inventory and a model that is more culturally de-

THE QUESTIONNAIRE BIG SIX IN 26 NATIONS 24
centered. The results are informative as to which items translate more readily and comparably,
leading to more consistent intercepts and factor loadings. A limitation of the current study is the
restriction of participation to college students. While this facilitated cross-cultural comparison by
holding age, literacy, and education-level relatively constant, it does limit our ability to
generalize to the entire populations from which our samples were drawn.
A limitation specific to the Big Five and Big Two measures is that the QB6 items used
were not chosen with the measurement of these models in mind. This was particularly
problematic for the Big Two – the refined measures presented here are shorter and include fewer
core-content items than would be ideal to cover the two broad dimensions. For the 25QB5, this
limitation is specific to the Agreeableness domain, which here lacks some of the kindness and
warmth content often emphasized in Big Five measures. It is our hope, however, that developing
and validating Big Five and Big Two measures from this set of items will allow researchers,
regardless of preferred model, to make use of the translations of the personality items used in the
Survey of World Views. Translations of items on these inventories, now available in 31
languages, represent a significant cooperative effort on the part of translators, psychologists, and
linguists around the globe. We hope to facilitate cross-cultural research by making these items
and scales freely available to other researchers. While the scientists developing models of
personality have historically come from a restricted range of nations, there is increasing
awareness that broadening our scope of interest can improve the replicability, generalizability,
and quality of our results. The measures presented here should ideally contribute to the long-term
goal of understanding human personality in ways that transcend a single place and time.

THE QUESTIONNAIRE BIG SIX IN 26 NATIONS 25
References
Ashton, M. C., Lee, K., Perugini, M., Szarota, P. De Vries, R. E., Di Blas, L., Boies, K., & De
Raad, B. (2004). A six-factor structure of personality-descriptive adjectives: Solutions
from psycholexical studies in seven languages. Journal of Personality and Social
Psychology, 86, 356-366.
Ashton, M. C., & Lee, K. (2007). Empirical, theoretical, and practical advantages of the
HEXACO model of personality structure. Personality and Social Psychology Review, 11,
150–166. doi:10.1177/ 1088868306294907
Central Intelligence Agency (2012). The World Factbook. (Retrieved 12/11/2012 from https://
www.cia.gov/library/publications/the-world- factbook/rankorder/2119rank.html )
Cheung, G.W., & Rensvold R. B. (2002). Evaluating goodness-of-fit indexes for testing
measurement invariance. Structural Equation Modeling, 9, 233–255.
Church, A. T., Alvarez, J. M., Mai, N. T., French, B. F., Katigbak, M. S., & Ortiz, F. A. (2011).
Are cross-cultural comparisons of personality profiles meaningful? Differential item and
facet functioning in the Revised NEO Personality Inventory. Journal of Personality and
Social Psychology, 101, 1068-89.
Costa, P. T., Jr., & McCrae, R. R. (1992). Revised NEO Personality Inventory (NEO-PI-R) and
NEO Five-Factor Inventory (NEO-FFI) professional manual. Odessa, FL: Psychological
Assessment Resources.
Cramer, A. O. J., van, . S. S., Noordhof, A., Borsboom, D., Wichers, M., Geschwind, N., Aggen,
S. H., ... Borsboom, D. (2012). Dimensions of normal personality as networks in search
of equilibrium: You can't like parties if you don't like people. European Journal of
Personality, 26, 414-431.

THE QUESTIONNAIRE BIG SIX IN 26 NATIONS 26
De Raad, B., Barelds, D. P., Levert, E., Ostendorf, F., Mlacić, B., Di, B. L., Hrebícková, M., ...
Katigbak, M. S. (2010). Only three factors of personality description are fully replicable
across languages: a comparison of 14 trait taxonomies. Journal of Personality and Social
Psychology, 98, 160-73.
De Raad, B., DiBlas, L., & Perugini, M. (1998). Two independently constructed Italian trait
taxonomies: Comparisons among Italian and between Italian and Germanic languages.
European Journal of Personality, 12, 19–41.
De Raad, B., Henriks, A.A. J., & Hofstee, W. K. B. (1992) Towards a refined structure of
personality traits. European Journal of Personality, 6, 301-319.
DeYoung, C. G. (2006). Higher-order factors of the Big Five in a multi-informant sample.
Journal of Personality and Social Psychology, 91, 1138-1151.
Digman, J. M. (1997). Higher order factors of the Big Five. Journal of Personality and Social
Psychology, 73, 1246-1256.
Goldberg, L. R. (1981). Language and individual differences: The search for universals in
personality lexicons. In L. Wheeler (Ed.), Review of Personality and Social Psychology:
Vol. 2 (pp. 141-165). Beverly Hills, CA: Sage.
Goldberg, L. R. (1990). An alternative "Description of personality": The Big-Five factor
structure. Journal of Personality and Social Psychology, 59, 1216-1229.
Goldberg, L. R., Johnson, J. A., Eber, H. W., Hogan, R., Ashton, M. C., Cloninger, C. R., &
Gough, H. C. (2006). The International Personality Item Pool and the future of public
domain personality measures. Journal of Research in Personality, 40, 84-96.
Heine, S. J. (2012) Cultural psychology. NY: Norton.
Heine, S. J., Lehman, D. R., Peng, K., & Greenholtz, J. (2002). What’s wrong with cross-cultural
comparisons of subjective Likert scales? The reference-group effect. Journal of

THE QUESTIONNAIRE BIG SIX IN 26 NATIONS 27
Personality and Social Psychology, 82, 903-918.
Hopwood, C. J., & Donnellan, M. B. (2010). How should the internal structure of personality
inventories be evaluated? Personality and Social Psychology Review, 14, 332-346. doi:
10.1177/1088868310361240
Horst, P. (1966). An overview of the essentials of multivariate analysis methods. In R.B. Cattell
(Ed.), Handbook of Multivariate Experimental Psychology (pp. 129-152). Chicago, IL:
Rand McNally & Company.
Hu, L., & Bentler, P. M. (1999). Cutoff criteria for fit indexes in covariance structure analysis:
Conventional criteria versus new alternatives. Structural Equation Modeling, 6, 1-55.
John, O. P., Donahue, E. M., & Kentle, R. L. (1991). The Big Five Inventory (Versions 4a and
54). Berkeley, CA: University of California, Berkeley, Institute of Personality and Social
Research.
John, O. P. & Srivastava, S. (1999). The Big Five trait taxonomy: History, measurement, and
theoretical perspectives. In Pervin, L. A. & John, O. P. (Eds.), Handbook of Personality:
Theory and Research. NY: The Guilford Press.
Kline, R. B. (2011). Principles and practice of structural equation modeling. New York:
Guilford Press.
Lee, K., & Ashton, M. C. (2004). Psychometric properties of the HEXACO Personality Inventory.
Multivariate Behavioral Research, 39, 329-358.
Marsh, H. W., Hau, K. T., & Wen, Z. (2004). In search of golden rules: Comment on hypothesis-
testing approaches to setting cutoff values for fit indices and dangers in overgeneralizing
Hu and Bentler’s (1999) findings. Structural Equation Modeling, 11, 320-341.

THE QUESTIONNAIRE BIG SIX IN 26 NATIONS 28
McCrae, R.R. (2002) NEO-PI-R data from 36 cultures: further intercultural comparisons. In R.
R. McCrae, & J. Allik (Eds.), The Five Factor model of personality across cultures (pp.
105-125). New York: Kluwer Academic/Plenum Publishers.
McCrae, R. R. & Costa, P. T. (1997) Personality trait structure as a human universal. American
Psychologist, 52, 509-516.
Muthén, L. K. & Muthén, B. O. (1998- 2012) Mplus user’s guide (7th ed.). Los Angeles, CA:
Muthén & Muthén.
Nye, C. D., Roberts, B. W., Saucier, G., & Zhou, X. (2008). Testing the measurement
equivalence of personality adjective items across cultures. Journal of Research in
Personality, 42, 1524-1536.
Ostendorf, F. (1990). Sprache und Personlichkeitstrucktur: Zur Validität des Fünf-Faktoren-
Modells der Persönlichkeit. [Language and personality structure: Towards the validity of
the Five-Factor model of personality] Regensburg, Germany: Roderer.
Ozer, D. J., & Benet-Martínez, V. (2006). Personality and the prediction of consequential
outcomes. Annual Review of Psychology, 57, 401-21.
Poortinga, Van de Vijver, F. & Van Helmert, B. (2002). Cross-cultural equivalence of the Big
Five: A tentative interpretation of the evidence. In McCrae, R. R. & Allik, J., (Ed.s) The
Five Factor model of personality across cultures. New York: Kluwer Academic/Plenum
Publishers.
Saucier, G. (1994). Mini-markers: A brief version of Goldberg’s unipolar Big Five markers.
Journal of Personality Assessment, 63, 506–516. doi:10.1207/s15327752jpa6303_8
Saucier, G. (2009). Recurrent personality dimensions in inclusive lexical studies: Indications for
a Big Six structure. Journal of Personality, 77, 1577-1614.

THE QUESTIONNAIRE BIG SIX IN 26 NATIONS 29
Saucier, G., Georgiades, S., Tsaousis, I., & Goldberg, L. R. (2005). The factor structure of Greek
personality adjectives. Journal of Personality and Social Psychology, 88, 856–875.
Saucier, G., & Goldberg, L. R. (1996). The language of personality: Lexical perspectives on the
five-factor model. In J. S. Wiggins (Ed.), The five-factor model of personality:
Theoretical perspectives (pp. 21-50). New York: Guilford.
Saucier, G., Kenner, J., Bou Malham, P., Iurino, K., Chen, Z., Thalmayer, A.G., …, Kovaleva,
A. (2014). Cross-cultural differences in a global “Survey of World Views”. Submitted for
publication.
Saucier, G., Thalmayer, A.G., & Bel-Bahar, T. (in press) Personality descriptors ubiquitous
across 12 languages. Journal of Personality and Social Psychology.
Saucier, G., Thalmayer, A.G., Payne, D. L., Carlson, R., Sanogo, L., Ole-Kotikash, L., Church,
A.T., Katigbak, M. S., Szarota, P., Szirmák, Z., & Zhou, X. (2014). A basic bivariate
structure of personality attributes evident across nine languages. Journal of Personality,
82,1-14.
Szirmak, Z., & De Raad, B. (1994). Taxonomy and structure of Hungarian personality traits.
European Journal of Personality, 8, 95–117.
Thalmayer, A. G. Saucier, G. & Eigenhuis, A. (2011). The comparative validity of brief- to
medium–length Big Five and big six personality inventories. Psychological Assessment,
23, 995 1009. doi: 10.1037/a0024165
Vandenberg, R. J., & Lance, C. E. (2000). A review and synthesis of the measurement invariance
literature: Suggestions, practices, and recommendations for organizational research.
Organization Research Methods, 3, 4-70.
Wiggins, J.S. (1973). Personality and prediction: Principles of personality assessment.

THE QUESTIONNAIRE BIG SIX IN 26 NATIONS 30
Philippines: Addison-Wesley Publishing Company, Inc.
Zhou, X., Saucier, G., Gao, D., & Liu, J. (2009). The factor structure of Chinese personality
descriptors. Journal of Personality, 77, 363–400.

THE QUESTIONNAIRE BIG SIX IN 26 NATIONS 31
Table 1
Sample Sizes and Means and Standard Deviations of Scales for the 26 Countries, Grouped by Region
36QB6 Mean (SD) 20QB2 Mean (SD)
Country/Region N C H A R E O S D Africa (sub-Saharan)
Tanzania 209 4.14 (.73) 3.88 (.66) 3.01 (.59) 3.26 (.71) 3.35 (.56) 3.27 (.45) 3.95 (.60) 3.41 (.41) Kenya 237 4.09 (.62) 3.87 (.63) 2.97 (.64) 3.20 (.68) 3.63 (.57) 3.23 (.55) 3.80 (.53) 3.31 (.47)
Ethiopia 331 3.79 (.69) 3.79 (.65) 3.06 (.62) 3.19 (.68) 3.09 (.57) 3.00 (.53) 3.78 (.61) 3.11 (.37) North Africa/Middle East
Morocco 342 3.31 (.78) 3.41 (.85) 2.93 (.60) 3.02 (.66) 3.20 (.66) 3.05 (.49) 3.34 (.67) 3.09 (.46) Turkey 396 3.62 (.73) 3.65 (.66) 2.76 (.71) 2.91 (.82) 3.68 (.62) 3.48 (.56) 3.53 (.54) 3.37 (.51)
South Asia Bangladesh 242 3.67 (.67) 3.55 (.56) 2.87 (.62) 2.92 (.76) 3.27 (.63) 3.02 (.58) 3.54 (.51) 3.12 (.47)
India 333 3.47 (.63) 3.58 (.62) 2.77 (.71) 2.96 (.71) 3.49 (.65) 3.20 (.58) 3.44 (.52) 3.22 (.53) Nepal 314 3.73 (.62) 3.79 (.58) 2.73 (.56) 2.77 (.75) 3.58 (.65) 3.00 (.44) 3.63 (.47) 3.13 (.41)
Southeast Asia Malaysia 299 3.98 (.62) 3.60 (.55) 2.94 (.55) 2.81 (.66) 3.60 (.58) 3.21 (.53) 3.79 (.45) 3.21 (.44)
Philippines 362 3.67 (.71) 3.85 (.62) 3.05 (.61) 2.82 (.64) 3.78 (.64) 3.54 (.60) 3.80 (.52) 3.42 (.48) Thailand 313 3.59 (.61) 3.58 (.59) 2.86 (.63) 2.69 (.74) 3.63 (.65) 3.15 (.51) 3.52 (.45) 3.22 (.44)
Singapore 280 3.46 (.60) 3.46 (.61) 2.76 (.64) 2.90 (.74) 3.56 (.59) 3.38 (.63) 3.39 (.49) 3.21 (.49) East Asia
Mainland China 285 3.60 (.58) 3.66 (.56) 2.86 (.60) 2.91 (.67) 3.59 (.55) 3.33 (.57) 3.58 (.44) 3.17 (.46) Taiwan 352 3.46 (.61) 3.34 (.57) 2.96 (.66) 2.82 (.73) 3.73 (.65) 3.26 (.58) 3.37 (.45) 3.23 (.52)
Japan 366 2.74 (.70) 3.63 (.69) 3.03 (.70) 2.44 (.76) 3.67 (.72) 2.97 (.71) 3.19 (.50) 2.87 (.61) East/Southeast Europe
Ukraine 210 3.59 (.68) 3.72 (.65) 2.80 (.68) 3.12 (.82) 3.77 (.66) 3.57 (.61) 3.55 (.54) 3.36 (.48) Poland 223 3.34 (.77) 3.57 (.65) 2.83 (.80) 2.60 (.84) 3.62 (.75) 3.94 (.54) 3.38 (.58) 3.44 (.57) Greece 228 3.50 (.73) 3.85 (.69) 2.89 (.69) 2.78 (.76) 3.89 (.59) 3.18 (.58) 3.57 (.55) 3.26 (.44)
Western Europe Spain 322 3.67 (.69) 3.61 (.68) 3.00 (.67) 3.04 (.66) 3.80 (.67) 3.56 (.60) 3.63 (.55) 3.44 (.45)
Germany 306 3.49 (.71) 3.73 (.69) 2.89 (.69) 3.04 (.74) 3.80 (.65) 3.56 (.54) 3.54 (.51) 3.49 (.49) United Kingdom 164 3.40 (.69) 3.55 (.72) 3.00 (.74) 2.83 (.88) 3.85 (.63) 3.50 (.55) 3.46 (.57) 3.41 (.43)

THE QUESTIONNAIRE BIG SIX IN 26 NATIONS 32
North America Canada 200 3.52 (.63) 3.58 (.75) 3.08 (.71) 2.87 (.84 3.82 (.72) 3.65 (.59 3.55 (.53) 3.47 (.51)
United States 391 3.58 (.64) 3.57 (.68) 3.06 (.63) 2.99 (.79) 3.72 (.63) 3.57 (.60) 3.54 (.52) 3.43 (.45) Latin America
Peru 266 3.37 (.75) 3.62 (.58) 2.83 (.67) 2.97 (.67) 3.80 (.63) 3.47 (.55) 3.38 (.53) 3.45 (.49) Argentina 214 3.69 (.69) 3.84 (.57) 2.69 (.68) 2.94 (.66) 3.85 (.66) 3.38 (.59) 3.56 (.50) 3.32 (.50)
Brazil 193 3.25 (.73) 3.98 (.67) 2.84 (.71) 2.69 (.67) 3.77 (.69) 3.68 (.59) 3.55 (.52) 3.22 (.54) Total 7378 3.56 (.73) 3.65 (.66) 2.91 (.66) 2.90 (.75) 3.63 (.67) 3.34 (.62) 3.54 (.55) 3.28 (.51)
Note. C = Conscientiousness, H = Honesty/Propriety, A = Agreeableness, R = Resiliency, E = Extraversion, O = Originality/Talent, S = Social Self Regulation, D = Dynamism.
THE QUESTIONNAIRE BIG SIX IN 26 NATIONS 33
Table 2
NOTE: This is a corrected version 2016, There were two typos in the published version of this table, which made it unclear which HP and O items below in the final 30QB6 and 25QB5.
Initial QB6 Personality Items and Final Big Five and Big Six Inventories Conscientiousness Extraversion 1. I complete my duties as soon as possible. 7. I leave a mess in my room. 13. I like to plan ahead. 19. I shirk my duties. 25. I like order.56
31. I waste my time.
3. I usually enjoy being with people. 9. I reveal little about myself. 15. I laugh a lot. 21. I don’t think it’s important to socialize with others.5 27. I talk a lot.56 33. I seldom joke around.56 37. I am skilled in handling social situations.6
40. I don't talk a lot. Agreeableness Originality 2. I hate waiting for anything. 8. I am usually a patient person. 14. I get angry easily. 20. I am quick to correct others.56 26. I become frustrated and angry with people when they don’t live up to my expectations. 32. I rarely show my anger.
4. I have difficulty understanding abstract ideas. 10. I have a rich vocabulary.5 16. I am considered to be a wise person. 22. I seldom experience sudden intuitive insights.56 28. I don’t pride myself on being original.6
34. I am an extraordinary person. 39. I can handle a lot of information.
Honesty/Propriety Resiliency 5. I take risks that could cause trouble for me.56 11. I would never take things that aren’t mine.5 17. I cannot imagine (that I would engage in) lying or cheating.5 23. I steal things.5 29. I am not good at deceiving people.5 35. I like to do frightening things.56
38. I stick to the rules.5
6. I get stressed out easily. 12. I recover quickly from stress and illness. 18. I panic easily.6
24. I am often worried by things I said or did. 30. I am afraid of many things. 36. I rarely worry.5
Note. Reverse keyed items italicized. Items 1 through 36 comprise the 36QB6, and the 36-item Big Five model tested. Items are available translated into 31 languages at: http://psychometriglossia.uoregon.edu/ 5 Removed at first stage of revision process for Big Five. 5 Removed at second stage of revision for Big Five. Unmarked items are included in the 25QB5. 6 Removed at first stage of revision process for QB6. 6 Removed at second stage of revision, QB6. Unmarked items are included in the 30QB6.

THE QUESTIONNAIRE BIG SIX IN 26 NATIONS 34
Table 3
Big Two Items, with Big Six Scale Source Noted
Social Self-Regulation Dynamism
C1. I complete my duties as soon as possible A8. I am usually a patient person A14. I get angry easily H17. I cannot imagine lying or cheating C19. I shirk my duties H23. I steal things H38. I stick to the rules H5. I take risks that could cause trouble for me.* C7. I leave a mess in my room** C25. I like order*
O10. I have a rich vocabulary E15. I laugh a lot R30. I am afraid of many things O34. I am an extraordinary person E37. I am skilled at handling social situations O39. I can handle a lot of information E40. I don’t talk a lot E9. I reveal little about myself* O28. I don’t pride myself on being original* R36. I rarely worry**
Note. Items denoted by number and Big Six domain, and italicized if reverse keyed. C = Conscientiousness, H = Honesty/Propriety, A = Agreeableness, R = Resiliency, E = Extraversion, O = Originality/Talent. * Removed after examining model results in set 1 nations. ** Removed after examining results in set 2 nations. Unmarked items were included in final, 14- item version.

THE QUESTIONNAIRE BIG SIX IN 26 NATIONS 35
Table 4
Fit Indices of the 36-QB6 in Set 1 Nations, Individually, and for Progressively More Stringent
Measurement Invariance Tests
Nation N c2 df CFI TLI AIC RMSEA SRMR Argentina 214 1116.16 579 .582 .546 22401 .066 .082 Germany 306 1438.22 579 .646 .615 31294 .070 .087 Greece 228 1042.85 579 .678 .650 24324 .059* .078 India 333 1285.45 579 .524 .482 37864 .061 .077 Kenya 237 1221.40 579 .513 .471 25434 .068 .087 Malaysia 299 1302.66 579 .585 .548 30407 .065 .087 Taiwan 352 1557.93 579 .630 .590 35370 .069 .083 Turkey 396 1594.55 579 .660 .630 41518 .067 .078 USA 391 1557.25 579 .622 .589 40963 .066 .078
Measurement invariance Configural 2756 12132.35 5223 .614 .581 289569 .066 .082 Factorial 2756 13082.41 5499 .576 .563 289967 .067 .094 Scalar 2756 17906.47 5739 .320 .328 294311 .083 .113 Full1 2519 17998.42 5346 .237 .280 269818 .087 .145
Note. All adjusted χ2 values p < .01. CFI = comparative fit index; TLI = Tucker-Lewis index; RMSEA = root mean square error of approximation; SRMSR = standardized root mean square residual. 1 Excluding Kenya. *Probability RMSEA is ≤.05 was > .001
THE QUESTIONNAIRE BIG SIX IN 26 NATIONS 36
Table 5
The Provisional 33-item QB6 in Set 2 Nations
Nation N χ2 df CFI TLI AIC RMSEA SRMR Canada 200 986.12 480 .702 .672 18866 .073 .090 China 285 965.72 480 .684 .652 25827 .060* .076 Nepal 314 1010.38 480 .651 .616 30135 .059* .078 Peru 266 1015.51 480 .643 .607 25705 .065 .080 Spain 322 1235.26 480 .658 .624 30210 .070 .085 Thailand 313 1271.50 480 .572 .529 30089 .073 .086 Ukraine 210 813.037 480 .734 .708 19832 .057* .082
Measurement Invariance Configural1 1910 7297.53 3360 .659 .625 180665 .066 .082 Factorial2 2035 8858.91 4071 .607 .592 194324 .068 .097 Scalar2 2035 15258.44 3696 .376 .380 183580 .084 .113 Full2 2035 13152.63 4491 .289 .331 197778 .087 .143
Note. Tanzania and Morocco were not included individually because the model did not converge in it (however, item means were used to infer comparability of intercepts). All adjusted χ2 values p < .01. CFI = comparative fit index; TLI = Tucker-Lewis index; RMSEA = root mean square error of approximation; SRMSR = standardized root mean square residual. *Probability RMSEA is ≤.05 was > .001 1
Excluding Tanzania and Morocco due to non positive definite outcomes. 2 Excluding only Tanzania (Morocco included).

THE QUESTIONNAIRE BIG SIX IN 26 NATIONS 37
Table 6
The 30 QB6 in Set 3 Nations
Nation N χ2 df CFI TLI AIC RMSEA SRMR Bangladesh 242 854.69 390 .604 .558 22078 .070 .089 Brazil 193 829.60 390 .616 .571 16949 .076 .090 England 164 880.24 390 .599 .553 14304 .088 .096 Ethiopia** 283 710.53 362 .654 .612 24612 .058* .074 Japan 366 1209.92 390 .641 .600 32952 .076 .084 Philippines 362 1062.45 390 .674 .636 30421 .069 .082 Poland 223 691.07 390 .799 .776 19040 .059* .076 Singapore 280 831.34 390 .712 .678 23408 .064 .075
Measurement invariance Configural 2113 7157.79 3127 .663 .625 184648 .070 .083 Configural1 1830 6375.21 2736 .667 .629 159156 .071 .084 Factorial 2113 7983.97 3330 .611 .593 185068 .073 .103 Scalar 2113 10725.67 3498 .396 .399 187473 .088 .123 Scalar1 1830 9109.78 3054 .445 .447 161254 .087 .117 Full 2113 12287.32 3708 .281 .325 188153 .094 .174
Measurement invariance of the 36QB6 (for comparison) Configural1 1830 9379.69 4053 .615 .581 192627 .071 .088 Factorial 2113 11656.05 4884 .556 .541 224285 .072 .104 Scalar1 1830 13408.21 4449 .353 .359 195863 .088 .125 Full 2113 17473.30 5346 .204 .250 229178 .093 .161
Note. All adjusted χ2 values p < .01. CFI = comparative fit index; TLI = Tucker-Lewis index; RMSEA = root mean square error of approximation; SRMSR = standardized root mean square residual. *Probability RMSEA is ≤.05 was > .001 **The 30-item version was non-positive definite in Ethiopia. Thus, the version tested here is 29 items, excluding item 36. 1 Excluding Ethiopia, in cases where analyses were non positive definite, or for comparison.

THE QUESTIONNAIRE BIG SIX IN 26 NATIONS 38
Table 7
Fit Indices of Initial 36-item Big Five Measure in Set 1 Nations, Individually, and for
Progressively More Stringent Measurement Invariance Tests
Nation N c2 df CFI TLI AIC RMSEA SRMR Argentina 214 851.51 395 .601 .560 18785 .073 .084 Germany 306 1079.71 395 .655 .620 25868 .075 .085 Greece 228 730.84 395 .706 .676 20208 .061* .079 India 333 903.71 395 .571 .528 31439 .062 .076 Kenya 237 877.54 395 .520 .471 21195 .072 .087 Malaysia 299 929.09 395 .631 .593 25019 .067 .087 Taiwan 352 1078.67 395 .682 .650 29301 .070 .079 Turkey 396 1090.41 395 .716 .687 34315 .067 .076 USA 391 1121.41 395 .649 .613 33820 .069 .078
Measurement invariance Configural 2756 8662.88 3555 .650 .614 239949 .068 .081 Factorial 2756 9984.41 3845 .579 .571 240691 .072 .095 Scalar 2756 13740.94 3995 .331 .345 244147 .089 .116 Full 2519 15680.01 4235 .215 .274 245606 .094 .145
Note. All adjusted χ2 values p < .01. CFI = comparative fit index; TLI = Tucker-Lewis index; RMSEA = root mean square error of approximation; SRMSR = standardized root mean square residual. *Probability RMSEA is ≤.05 was > .001
THE QUESTIONNAIRE BIG SIX IN 26 NATIONS 39
Table 8
The Provisional 32-item Big Five in Set 2 Nations
Nation N χ2 df CFI TLI AIC RMSEA SRMR Canada 200 1066.75 454 .617 .581 18481 .082 .101 China 285 1059.53 454 .600 .563 25292 .068 .083 Peru 266 973.19 454 .628 .594 24949 .066 .082 Spain 322 1300.23 454 .599 .562 29512 .076 .095 Tanzania 209 1070.50 454 .548 .506 19875 .081 .095 Thailand 313 1312.31 454 .516 .472 29399 .078 .090 Ukraine 210 893.58 454 .649 .617 19392 .068 .089
Measurement invariance Configural1 1805 7932.33 3188 .569 .531 167137 .076 .096 Factorial 2244 10901.16 4358 .492 .480 210175 .078 .110 Scalar2 1910 11246.03 3532 .299 .311 179286 .089 .120 Full 2244 16421.86 4814 .099 .165 214784 .098 .166
Note. Morocco and Nepal were not included individually because the model did not converge in either. However, items means were included with the analyses of intercepts, and the groups are included in MI analyses, below, except where noted. All adjusted χ2 values p < .01. CFI = comparative fit index; TLI = Tucker-Lewis index; RMSEA = root mean square error of approximation; SRMSR = standardized root mean square residual. 1 Excluding Morocco and Nepal, due to non positive definite results. 2 Excluding Morocco and Tanzania, due to non positive definite results.

THE QUESTIONNAIRE BIG SIX IN 26 NATIONS 40
Table 9
The 25QB5 in Set 3 Nations
Nation N χ2 df CFI TLI AIC RMSEA SRMR Bangladesh 242 618.78 265 .624 .575 18497 .074 .092 Brazil 193 560.83 265 .665 .621 14381 .076 .086 England 164 594.78 265 .655 .609 11925 .087 .095 Ethiopia 305 553.28 265 .708 .669 22550 .060 .073 Japan 366 820.67 265 .698 .658 27848 .076 .085 Philippines 362 790.45 265 .685 .643 25699 .074 .083 Poland 223 504.92 265 .817 .793 16187 .064 .078 Singapore 280 530.47 265 .798 .771 19368 .060* .067
Measurement invariance Configural 2135 5436.09 2165 .670 .634 156827 .075 .090 Configural1 1830 4882.81 1900 .665 .630 134277 .077 .093 Factorial 2135 5716.92 2295 .654 .639 156848 .075 .103 Scalar 2135 8584.95 2435 .379 .388 159436 .097 .137 Full 2135 9736.67 2610 .280 .338 160238 .101 .162
Measurement invariance of 36-item version (for comparison) Configural1 1830 11048.24 4155 .501 .470 213754 .078 .102 Factorial 2135 12772.02 4924 .489 .477 227526 .077 .109 Scalar 2135 20387.84 5040 .233 .248 231234 .093 .134 Full 2135 18637.83 5393 .137 .194 232454 .096 .168
Note. All adjusted χ2 values p < .01. CFI = comparative fit index; TLI = Tucker-Lewis index; RMSEA = root mean square error of approximation; SRMSR = standardized root mean square residual. *Probability RMSEA is ≤.05 was > .001 1 Excluding Ethiopia, in cases where analyses were non positive definite, or for comparison.

THE QUESTIONNAIRE BIG SIX IN 26 NATIONS 41
Table 10 The 20-item QB2 in Set 1 Nations
Nation N χ2 df CFI TLI AIC RMSEA SRMR Argentina 214 393.04 169 .567 .513 12352 .079 .081 Germany 306 710.089 169 .454 .386 17633 .102 .096 Greece 228 355.33 169 .602 .552 13466 .070 .077 India 333 442.86 169 .539 .482 21167 .070 .075 Kenya 237 445.16 169 .500 .437 14188 .083 .086 Malaysia 299 477.31 169 .572 .519 16699 .078 .080 Taiwan 352 691.53 169 .485 .421 19879 .094 .090 Turkey 396 797.78 169 .474 .409 23246 .097 .093
Measurement invariance Configural 2756 4873.95 1521 .512 .451 161443 .085 .085 Factorial 2756 5432.76 1681 .453 .444 161681 .085 .101 Scalar 2756 7959.065 1825 .106 .163 163920 .105 .128 Full 2756 8939.367 1985 .000 .108 159970 .108 .170
Note. All adjusted χ2 values p < .01. CFI = comparative fit index; TLI = Tucker-Lewis index; RMSEA = root mean square error of approximation; SRMSR = standardized root mean square residual.

THE QUESTIONNAIRE BIG SIX IN 26 NATIONS 42
Table 11
The Provisional 16-Item QB2 in Set 2 Nations
Nation N χ2 df CFI TLI AIC RMSEA SRMR Canada 200 340.93 103 .482 .396 9379 .107 .100 China 285 312.40 103 .528 .450 12759 .084 .079 Morocco 342 314.40 103 .780 .743 17693 .077 .070 Nepal 314 304.21 103 .624 .562 14556 .079 .077 Peru 266 249.77 103 .637 .578 12375 .073* .072 Spain 322 348.22 103 .642 .583 14460 .086 .074 Tanzania 209 247.94 103 .701 .652 9595 .082 .076 Thailand 313 380.87 103 .504 .423 14570 .093 .083 Ukraine 210 208.96 103 .681 .628 9501 .070* .076
Measurement Invariance Configural 2461 2707.69 927 .634 .573 114887 .084 .078 Factorial 2461 3498.53 1039 .498 .486 115422 .092 .111 Scalar 2461 5650.94 1167 .078 .147 117351 .119 .150 Full 2461 6897.58 1295 .000 .039 118341 .126 .255
Note. All adjusted χ2 values p < .01. CFI = comparative fit index; TLI = Tucker-Lewis index; RMSEA = root mean square error of approximation; SRMSR = standardized root mean square residual. *Probability RMSEA is ≤.05 was > .001

THE QUESTIONNAIRE BIG SIX IN 26 NATIONS 43
Table 12
The 14QB2 in Set 3 Nations
Nation N χ2 df CFI TLI AIC RMSEA SRMR Bangladesh 242 211.84 76 .671 .606 10156 .086 .077 Brazil 193 228.24 76 .525 .431 7756 .102 .092 England 164 190.34 76 .597 .518 6647 .096 .088 Ethiopia 331 152.87 76 .815 .779 13663 .055* .056 Japan 366 354.24 76 .587 .505 15453 .100 .084 Philippines 362 291.86 76 .628 .555 13862 .089 .073 Poland 223 244.32 76 .641 .570 8767 .100 .087 Singapore 280 263.58 76 .583 .500 11012 .094 .083
Measurement invariance Configural 2161 1937.29 608 .631 .559 87316 .090 .079 Factorial 2161 2430.91 706 .552 .507 87613 .095 .112 Scalar 2161 4307.55 790 .024 .101 89322 .128 .156 Full 2161 5033.92 888 .000 .057 89582 .131 .284
Measurement invariance of 20QB2 (for comparison) Configural 2161 4182.45 1352 .542 .485 126757 .088 .088 Factorial 2161 5109.62 1492 .415 .404 127404 .095 .120 Scalar 2161 8226.68 1618 .000 -.004 130269 .123 .166 Full 2161 9148.06 1758 .000 .034 130910 .125 .235
Note. All adjusted χ2 values p < .01. CFI = comparative fit index; TLI = Tucker-Lewis index; RMSEA = root mean square error of approximation; SRMSR = standardized root mean square residual. *Probability RMSEA is ≤.05 was > .001

THE QUESTIONNAIRE BIG SIX IN 26 NATIONS 44
Table 13
Standardized Loadings and Inter-Factor Correlations (Factorial Invariance), Refined Inventories 30QB6 25QB5 14QB2 C A E O R HP C A E O R S D C1 .57 .55 .40 C7 .39 .40 C13 .43 .42 C19 .57 .56 .45 C31 .57 .59 A2 .31 .31 A8 .50 .47 .33 A14 .81 .85 .25 A26 .40 .39 A32 .58 .56 E3 .54 .50 E9 .39 .36 E15 .50 .49 .32 E21 .47 E37 .59 .69 E40 .60 .58 .28 O4 .36 .37 O10 .66 .56 O16 .69 .61 O28 .31 O34 .45 .47 .40 O39 .59 .58 .56 R6 .74 .73 R12 .42 .40 R18 .69 R24 .46 .42 R30 .56 .59 .24 R36 .57 H11 .47 H17 .49 .39 H23 .64 .50 H29 .34 H38 .51 .48 A .05 .05 E .07 -.11 .12 -.05 O .16 -.05 .36 .23 .03 .58 R .25 .45 .27 .44 .25 .44 .41 .60 HP .39 .12 -.08 -.05 -.27 D .00

THE QUESTIONNAIRE BIG SIX IN 26 NATIONS 45

THE QUESTIONNAIRE BIG SIX IN 26 NATIONS 46
Table 14
Internal Consistency (Cronbach’s Alpha) for refined scales in 26 nations
30QB6 25QB5* 14QB2 C H A R E O R E O S D Argentina 61 55 53 53 70 63 66 70 55 44 57 Bangladesh 53 62 57 60 36 53 68 36 49 60 38 Brazil 59 56 68 62 65 56 62 64 43 40 64 Canada 58 69 70 71 76 58 75 76 55 61 61 China 57 59 62 61 50 58 66 52 55 55 51 England 63 66 67 75 65 59 79 67 53 63 51 Ethiopia 57 54 50 39 37 27 65 27 08 60 15 Germany 64 65 70 70 70 63 72 70 51 54 62 Greece 64 63 60 65 62 63 70 56 48 50 54 India 50 50 60 49 58 53 56 60 34 46 59 Japan 63 59 65 69 68 63 67 69 59 51 65 Kenya 58 61 51 50 49 55 55 45 39 49 46 Malaysia 65 53 52 56 51 60 61 52 47 51 56 Morocco 46 76 25 39 27 39 47 23 -10 67 45 Nepal 55 60 46 62 57 52 66 49 21 54 45 Peru 71 50 58 54 66 59 62 64 56 47 57 Philippines 73 54 58 51 65 63 60 61 58 59 56 Poland 69 51 75 78 73 56 76 73 53 53 68 Singapore 60 62 66 70 63 63 73 67 55 53 63 Spain 64 60 64 58 64 68 62 63 59 57 62 Taiwan 65 56 69 72 68 58 72 72 56 55 62 Tanzania 69 53 43 42 49 32 65 39 08 60 47 Thailand 57 61 61 67 54 48 65 52 31 53 48 Turkey 70 63 70 70 58 62 72 63 58 56 56 Ukraine 59 59 61 74 67 53 77 61 54 58 50 United States 54 60 58 70 67 61 74 64 57 52 54
Note. Decimal points removed for readability. C = Conscientiousness, H = Honesty/Propriety, A = Agreeableness, R = Resiliency, E = Extraversion, O = Originality/Talent, S = Social Self-Regulation, D = Dynamism. The negative reliability for Big Five Originality in Morocco was because one item “I don’t pride myself on being original” had correlations in the wrong direction with all other O items. This was likely due to an Arabic translation that captured the literal meaning, but gave the phrase a different emotional tone and difficulty level (“pride myself” could have been understood as “brag about”.) * C and A scales are the same for the 30QB6 and 25QB5, so alpha values are not repeated.