Embed Size (px)
DESCRIPTION
Â
Citation preview

Facts & TrendsR e a l E s t a t e
Ruhl&Ruhl Realtors Summer 2015
Caroline RuhlPresident
RuhlHomes.com
IN THIS ISSUE:page 4Home Prices Continue to Appreciatepage 6Ruhl&Ruhl Realtors Awarded Coolest Places to Workpage 65 Questions to Ask Before Selecting a Home Service Vendorpage 7New Home Sales Show Modest Improvement
Record low interest rates fueled a strong first half of 2015 for home sales in our region. Some of our top performing markets were:
Some of our weaker markets were:
Results in all 14 of our market areas are shown on the Regional Real Estate Activity Chart on page 2. As always, there is considerable variation from market to market.Forecast for Second Half of 2015 We expect home sales to remain strong. However, year over year the increase will not be as great as the first half of 2015. This is because the first half of 2014 regional sales were down 4% compared to 2013. The second half of 2014 was up, so we will be comparing the second half of 2015 to stronger second half 2014 results.
Home Prices Continue to Appreciate
Home prices continue to appreciate in most of our metro areas. Statewide in Iowa, prices were up 2.40% year over
year through March 2015. A complete chart is located on page 4.
Last Chance to Refinance Mortgage interest rates have been volatile with the Greek financial crisis, but rates are still great, hovering in the following ranges:Conventional Fixed15-year (no points)...........................3.375%Conventional Fixed30-year (no points)...........................4.000%FHA/VA.........................................3.875%
Federal Reserve Chairwoman Janet Yellen is stating rates will go up by the end of the year. But we’ve heard this for a couple of years, so who knows? We do know rates will rise eventually. Hopefully growth in employment and the subsequent drop in the unemployment rate will lead to wage growth and increasing incomes, and this will take some of the sting out of any rate increase.
Home Sales Strong and Prices Appreciating
+21%CedarRapids
Area
+27%Illinois
Quad Cities
+23% Muscatine,
WiltonArea
% Change in Sales Volume
24.2Galena & Galena
Territory
16.9 Galesburg
Area
Months of Inventory
“We expect home sales to remain strong.
However, year over year the increase will not be as great as the
first half of 2015”~ Caroline Ruhl
President, Ruhl&Ruhl Realtors
Cedar Rapids, IADavenport-Moline-Rock Island, IA-ILDubuque, IAIowa City, IA
+2.62%
+3.71%
+1.93%+2.38%
1 YearMetropolitan Statistical Areas
+3.39%
+6.41%
+9.56%+6.63%
% Change in Prices5 Year
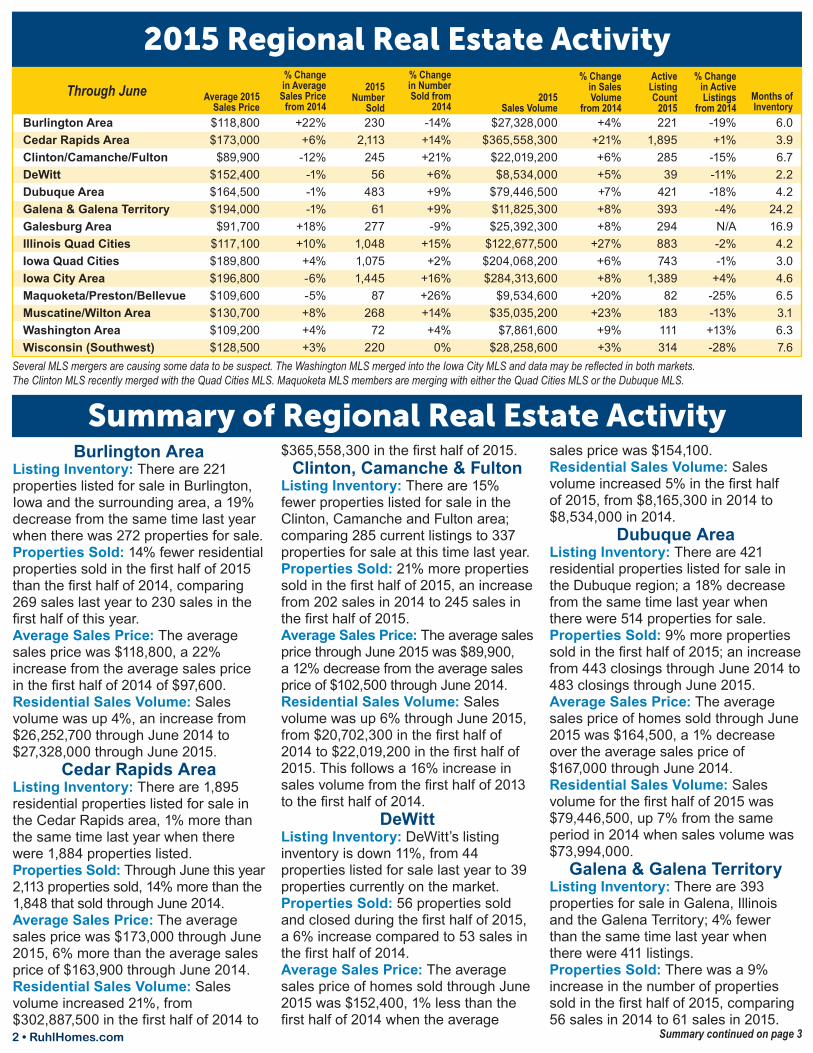
Burlington AreaListing Inventory: There are 221 properties listed for sale in Burlington, Iowa and the surrounding area, a 19% decrease from the same time last year when there was 272 properties for sale.Properties Sold: 14% fewer residential properties sold in the first half of 2015 than the first half of 2014, comparing 269 sales last year to 230 sales in the first half of this year.Average Sales Price: The average sales price was $118,800, a 22% increase from the average sales price in the first half of 2014 of $97,600.Residential Sales Volume: Sales volume was up 4%, an increase from $26,252,700 through June 2014 to $27,328,000 through June 2015.
Cedar Rapids AreaListing Inventory: There are 1,895 residential properties listed for sale in the Cedar Rapids area, 1% more than the same time last year when there were 1,884 properties listed.Properties Sold: Through June this year 2,113 properties sold, 14% more than the 1,848 that sold through June 2014.Average Sales Price: The average sales price was $173,000 through June 2015, 6% more than the average sales price of $163,900 through June 2014.Residential Sales Volume: Sales volume increased 21%, from $302,887,500 in the first half of 2014 to
$365,558,300 in the first half of 2015.Clinton, Camanche & Fulton
Listing Inventory: There are 15% fewer properties listed for sale in the Clinton, Camanche and Fulton area; comparing 285 current listings to 337 properties for sale at this time last year.Properties Sold: 21% more properties sold in the first half of 2015, an increase from 202 sales in 2014 to 245 sales in the first half of 2015.Average Sales Price: The average sales price through June 2015 was $89,900, a 12% decrease from the average sales price of $102,500 through June 2014.Residential Sales Volume: Sales volume was up 6% through June 2015, from $20,702,300 in the first half of 2014 to $22,019,200 in the first half of 2015. This follows a 16% increase in sales volume from the first half of 2013 to the first half of 2014.
DeWittListing Inventory: DeWitt’s listing inventory is down 11%, from 44 properties listed for sale last year to 39 properties currently on the market.Properties Sold: 56 properties sold and closed during the first half of 2015, a 6% increase compared to 53 sales in the first half of 2014.Average Sales Price: The average sales price of homes sold through June 2015 was $152,400, 1% less than the first half of 2014 when the average
sales price was $154,100.Residential Sales Volume: Sales volume increased 5% in the first half of 2015, from $8,165,300 in 2014 to $8,534,000 in 2014.
Dubuque AreaListing Inventory: There are 421 residential properties listed for sale in the Dubuque region; a 18% decrease from the same time last year when there were 514 properties for sale.Properties Sold: 9% more properties sold in the first half of 2015; an increase from 443 closings through June 2014 to 483 closings through June 2015.Average Sales Price: The average sales price of homes sold through June 2015 was $164,500, a 1% decrease over the average sales price of $167,000 through June 2014.Residential Sales Volume: Sales volume for the first half of 2015 was $79,446,500, up 7% from the same period in 2014 when sales volume was $73,994,000.
Galena & Galena TerritoryListing Inventory: There are 393 properties for sale in Galena, Illinois and the Galena Territory; 4% fewer than the same time last year when there were 411 listings.Properties Sold: There was a 9% increase in the number of properties sold in the first half of 2015, comparing 56 sales in 2014 to 61 sales in 2015.
2 • RuhlHomes.com
2015 Regional Real Estate Activity
Average 2015Sales Price
2015Number
Sold
% Change in Average
Sales Price from 2014
% Change in Number Sold from
20142015
Sales Volume
Active Listing Count
2015Months of Inventory
% Change in Active Listings
from 2014
% Change in Sales Volume
from 2014Burlington AreaCedar Rapids AreaClinton/Camanche/FultonDeWittDubuque AreaGalena & Galena TerritoryGalesburg AreaIllinois Quad CitiesIowa Quad CitiesIowa City AreaMaquoketa/Preston/BellevueMuscatine/Wilton AreaWashington AreaWisconsin (Southwest)
$118,800$173,000
$89,900$152,400$164,500$194,000
$91,700$117,100$189,800$196,800$109,600$130,700$109,200$128,500
+22%+6%-12%
-1%-1%-1%
+18%+10%+4%-6%-5%+8%+4%+3%
-14%+14%+21%+6%+9%+9%-9%
+15%+2%
+16%+26%+14%+4%
0%
+4%+21%+6%+5%+7%+8%+8%
+27%+6%+8%
+20%+23%+9%+3%
6.03.96.72.24.2
24.216.94.23.04.66.53.16.37.6
-19%+1%
-15%-11%-18%-4%N/A-2%-1%
+4%-25%-13%+13%-28%
2302,113
24556
48361
2771,0481,0751,445
87268
72220
2211,895
28539
421393294883743
1,38982
183111314
$27,328,000$365,558,300
$22,019,200$8,534,000
$79,446,500$11,825,300$25,392,300
$122,677,500$204,068,200$284,313,600
$9,534,600$35,035,200
$7,861,600$28,258,600
Through June
Several MLS mergers are causing some data to be suspect. The Washington MLS merged into the Iowa City MLS and data may be reflected in both markets. The Clinton MLS recently merged with the Quad Cities MLS. Maquoketa MLS members are merging with either the Quad Cities MLS or the Dubuque MLS.
Summary continued on page 3
Summary of Regional Real Estate Activity

Average Sales Price: The average sales price was $194,000 through June 2015, 1% less than last year when the average sales price was $195,700.Residential Sales Volume: Sales volume was up 8% for the first half of 2015, an increase from $10,960,900 through June 2014 to $11,825,300 through June 2015.
Galesburg AreaListing Inventory: There are 294 residential properties currently listed for sale in the Galesburg area. This is the first year we have tracked this data.Properties Sold: Sales have decreased 9% from 304 properties sold through the second quarter of 2014 to 277 through June 2015.Average Sales Price: The average sales price was $77,900 through June 2014, 18% more than the average sales price of $91,700 through June 2015.Residential Sales Volume: Sales volume increased 8% in the second quarter of 2015, from $23,602,000 to $25,392,300.
Illinois Quad CitiesListing Inventory: The number of properties for sale in the Illinois Quad Cities is down 2%; from 899 in 2014 to 883 listings currently on the market.Properties Sold: Through the second quarter of 2015, 15% more properties sold, comparing 909 sales through June 2014 to 1,048 sales through June 2015.Average Sales Price: The average sales price was up 10%, from $106,000 through June 2014 to $117,100 through June 2015.Residential Sales Volume: Sales volume increased 27% in the first half of 2015, from $96,317,100 to $122,677,500.
Iowa Quad CitiesListing Inventory: There are 743 properties for sale in the Iowa Quad Cities, 1% fewer than the same time last year when there were 750 for sale.Properties Sold: 2% more properties sold through the second quarter of 2015, an increase from 1,059 sales in the first half of 2014 to 1,075 sales in
the first half of this year.Average Sales Price: The average sales price increased 4%; from $182,500 through June 2014 to $189,800 through June 2015.Residential Sales Volume: Sales volume went up 6% from $193,316,000 through the second quarter of 2014 to $204,068,200 through the second quarter of 2015.
Iowa City AreaListing Inventory: The number of properties for sale in Iowa City is up 4%, an increase from 1,334 in 2014 to 1,389 properties currently on the market.Properties Sold: 16% more properties sold during the first half of 2015, an increase from 1,250 sales in 2014 to 1,445 sales in 2015.Average Sales Price: The average sales price was $196,800; a 6% decrease from the first half of 2014 when the average sales price was $209,800.Residential Sales Volume: Sales volume increased 8%, from $262,306,200 through June 2014 to $284,313,600 through June 2015.
Maquoketa, Preston & Bellevue
Listing Inventory: There are 82 properties for sale in the Maquoketa, Preston, and Bellevue area, 25% fewer than the same time last year when there were 110 properties for sale.Properties Sold: 26% more properties sold during the first half of 2015, an increase from 69 sales in 2014 to 87 sales in 2015.Average Sales Price: The average sales price of homes sold through June 2015 was $109,600, 5% less than the average sales price of $115,400 through June 2014.Residential Sales Volume: Sales volume increased 20%, from $7,965,600 in the first half of 2014 to $9,534,600 in the first half of 2015. This follows a 14% decrease from 2013 to 2014.
Muscatine & Wilton AreaListing Inventory: There are 183 homes and condominiums listed for sale in the Muscatine and Wilton area,
13% fewer than the same time last year when there were 210 properties for sale.Properties Sold: 14% more residential properties sold in the first half of 2015, comparing 235 sales last year to 268 sales in the first half of this year.Average Sales Price: The average sales price was $130,700, an 8% increase from the average sales price in the first half of 2014 of $121,000.Residential Sales Volume: Sales volume was up 23%, from $28,426,900 through June 2014 to $35,035,200 through June 2015. This follows a 7% decrease from 2013 to 2014.
Washington AreaListing Inventory: There are 111 properties for sale in Washington, Iowa and the surrounding area, a 13% increase from the same time last year when there were 98 properties for sale.Properties Sold: Through the second quarter of 2015, 4% more properties sold, comparing 69 sales through June 2014 to 72 sales through June 2015.Average Sales Price: The average sales price was $109,200, 4% higher than the average sales price of $104,500 in the first half of 2014.Residential Sales Volume: Sales volume was up 9%, an increase from $7,207,900 through June 2014 to $7,861,600 through June 2015.
Wisconsin (Southwest)Listing Inventory: There are 314 properties for sale in the southwest Wisconsin region, a 28% decrease compared to the same time last year when there were 434 properties.Properties Sold: There was no statistical change in the number of properties sold in the first half of 2015, comparing 221 properties sold in 2014 to 220 properties sold this year.Average Sales Price: The average sales price was $128,500 through June 2015, 3% higher than through June 2014 when the average sales price was $124,300.Residential Sales Volume: Sales volume was up 3%, an increase from $27,470,400 through June 2014 to $28,258,600 through June 2015.
RuhlHomes.com • 3
Quad Cities MLS Statistics - Iowa & Illinois Combined2011 2012 2013 20152014 % Change
2014 vs. 2015Current MLS ListingsAverage Sales PriceTotal Sales VolumeTotal # of Sales YTD
2,106$132,600
$216,732,1001,634
1,883$142,800
$259,519,2001,817
1,636$146,800
$295,570,4002,014
1,626$153,900
$326,745,7002,123
1,649$147,200
$289,633,1001,968
-1.4%+4.6%
+12.8%+7.9%
Through June
Summary continued from page 2

Burlington Area (Burlington Board of Realtors)Cedar Rapids Area (Cedar Rapids Area Assoc. of Realtors)Southeast Cedar RapidsNortheast Cedar RapidsSouthwest Cedar RapidsNorthwest Cedar RapidsHiawatha & RobinsMarionEast of I-380: Mechanicsville, Anamosa, Mt. Vernon, Lisbon, etc.West of I-380: Walford, Fairfax, Atkins, etc.Corridor Area: Solon, Ely, SwisherCondominiumsClinton, Camanche & Fulton (Quad City Area Realtor Assoc.)DeWitt (Quad City Area Realtor Assoc.)Dubuque Area (Dubuque Board of Realtors)DubuqueNorth, South and West DubuqueIllinoisWisconsinGalena & Galena Territory (Realtor Assoc. of Northwest IL)Galesburg Area (W. Central IL Association of Realtors)Illinois Quad Cities (Quad City Area Realtor Assoc.)Rock IslandMilan & Rural Rock Island CountyMolineCoal Valley, Rural Moline, MiscellaneousEast Moline & SilvisPort Byron, Upper Rock Island CountyMercer CountyHenry CountyCondominiumsIowa Quad Cities (Quad City Area Realtor Assoc.)DavenportBettendorf & RiverdaleBlue Grass, Buffalo, Durant & WalcottLeClaire, Pleasant Valley & PrincetonNorth Scott CountyMiscellaneousCondominiumsIowa City Area (Iowa City Area Assoc. of Realtors)Iowa CityCoralvilleNorthwest Iowa CityNortheast Iowa CitySoutheast Iowa CitySouthwest Iowa CityCorridor AreaMiscellaneousCondominiumsMaquoketa, Preston & Bellevue (Jackson Co. MLS & QCARA)Muscatine & Wilton Area (Muscatine Board of Realtors)MuscatineWiltonMuscatine OutlyingCondominiumsWashington Area (Iowa City Area Assoc. of Realtors)Wisconsin - Grant & Lafayette Co. (S. Central Wisconsin)
Through June
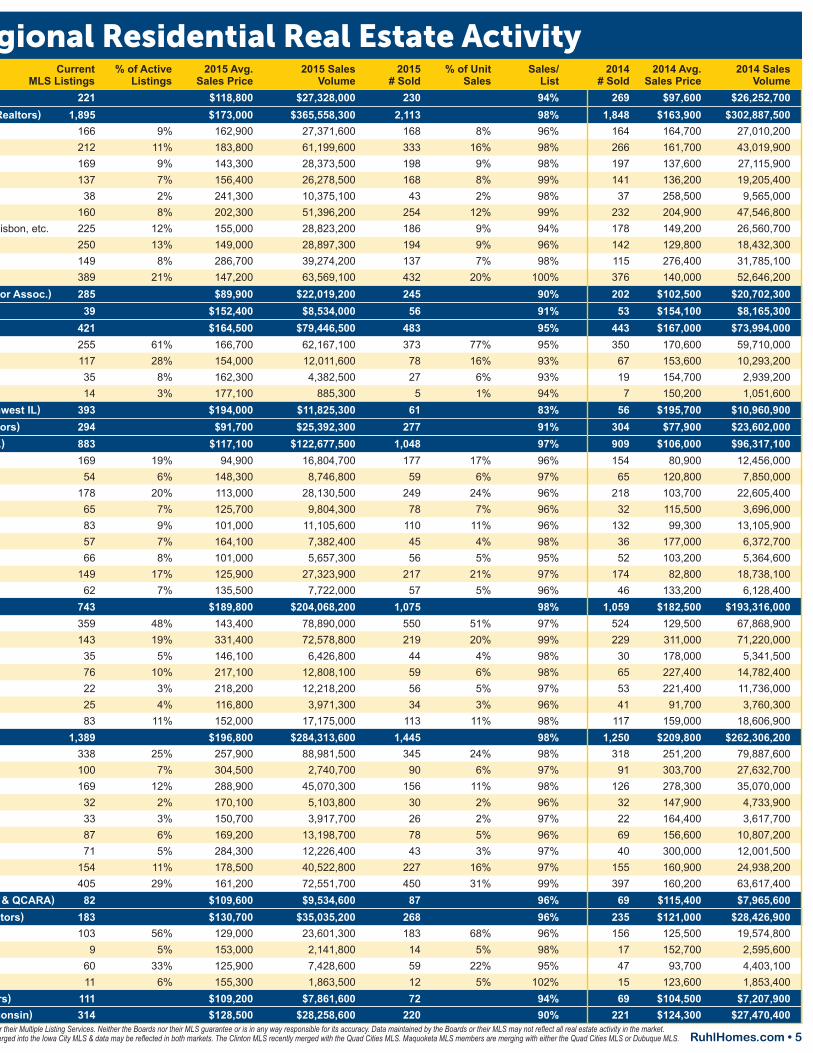
Regional Residential Real Estate Activity
4 • RuhlHomes.comThis representation is based in part on data supplied by the REALTOR Associations or their Multiple List ing Services. Neither the Boards nor their MLS guarantee or is in any way responsible for its accuracy. Data maintained by the Boards or their MLS may not reflect all real estate activity in the market. Several MLS mergers are causing some data to be suspect. The Washington MLS merged into the Iowa City MLS & data may be reflected in both markets. The Clinton MLS recently merged with the Quad Cities MLS. Maquoketa MLS members are merging with either the Quad Cities MLS or Dubuque MLS.
The eastern Iowa and northwestern Illinois region continues its steady climb in home price appreciation – with all of our markets showing positive gain. Nationally, home prices have appreciated 4.96% over the last year. In our local markets the gains, while not as large, continue to be positive. We did not have the significant decline in home prices that other markets across the nation suffered, insulating our communities from the super highs and lows. The majority of our metro areas showed 1-year gains over the Iowa statewide average of 2.40%. Home prices are up: 1.93% in
Dubuque; 2.38% in Iowa City; 3.71% in the Quad Cities and 2.62% in Cedar Rapids. This compares to other cities: Des Moines up 3.54% and Chicago, IL up 5.35%. This data is provided by the Federal Housing Finance Agency (FHFA) for the first quarter of 2015 (see chart and website below). “Now is a good time to sell,” said Caroline Ruhl, President of Ruhl&Ruhl Realtors. “Buyers are ready to buy but there are simply not enough listings, especially in certain price ranges. If you have considered selling, please contact a Realtor for a consultation.”
Home Prices Continue to Appreciate
Information courtesy of Federal Housing Finance Agency (FHFA) for first quarter 2015. FHFA stats always run one quarter behind. Their full report is accessible at www.fhfa.gov. *Rankings based on annual percentage change in house prices.
Cedar Rapids, IADavenport-Moline-Rock Island, IA-ILDes Moines-West Des Moines, IADubuque, IAIowa City, IAUSA
230
180
190
251241
+2.62%
+3.71%
+3.54%
+1.93%+2.38%+4.96%
+3.39%
+6.41%
+5.92%
+9.56%+6.63%
+14.23%
Metropolitan Statistical Areas (MSAs) 2015 1st Quarter National Ranking of 276 MSAs*
Percent Change in House Prices1 Year 5 Year
2015201420132012201120102009200820072006200520042003200220012000
1,0751,0591,140977901
1,064884
1,0291,1711,2181,2001,2571,1391,1371,1541,059
743750743934973972957
1,0811,1081,107960989931813843700
1,048909874840733833749907
1,0111,0541,1021,074971996997
1,028
883899893949
1,1331,067981
1,079991985885959835844913726
2,1231,9682,0141,8171,6341,8971,6331,9362,1822,2722,3022,3312,1102,1332,1512,087
1,6261,6491,6361,8832,1062,0391,9382,1602,0992,0921,8451,9481,7661,6571,7561,426
Sales Listings
Mid-Year Comparison of Quad Cities Real Estate Activity
IA IAIL ILTotals Totals
RuhlHomes.com • 5
Current MLS Listings
% of Active Listings
2015 Avg. Sales Price
2015 Sales Volume
2015 # Sold
% of Unit Sales
Sales/List
2014 # Sold
2014 Avg. Sales Price
2014 Sales Volume
Burlington Area (Burlington Board of Realtors)Cedar Rapids Area (Cedar Rapids Area Assoc. of Realtors)Southeast Cedar RapidsNortheast Cedar RapidsSouthwest Cedar RapidsNorthwest Cedar RapidsHiawatha & RobinsMarionEast of I-380: Mechanicsville, Anamosa, Mt. Vernon, Lisbon, etc.West of I-380: Walford, Fairfax, Atkins, etc.Corridor Area: Solon, Ely, SwisherCondominiumsClinton, Camanche & Fulton (Quad City Area Realtor Assoc.)DeWitt (Quad City Area Realtor Assoc.)Dubuque Area (Dubuque Board of Realtors)DubuqueNorth, South and West DubuqueIllinoisWisconsinGalena & Galena Territory (Realtor Assoc. of Northwest IL)Galesburg Area (W. Central IL Association of Realtors)Illinois Quad Cities (Quad City Area Realtor Assoc.)Rock IslandMilan & Rural Rock Island CountyMolineCoal Valley, Rural Moline, MiscellaneousEast Moline & SilvisPort Byron, Upper Rock Island CountyMercer CountyHenry CountyCondominiumsIowa Quad Cities (Quad City Area Realtor Assoc.)DavenportBettendorf & RiverdaleBlue Grass, Buffalo, Durant & WalcottLeClaire, Pleasant Valley & PrincetonNorth Scott CountyMiscellaneousCondominiumsIowa City Area (Iowa City Area Assoc. of Realtors)Iowa CityCoralvilleNorthwest Iowa CityNortheast Iowa CitySoutheast Iowa CitySouthwest Iowa CityCorridor AreaMiscellaneousCondominiumsMaquoketa, Preston & Bellevue (Jackson Co. MLS & QCARA)Muscatine & Wilton Area (Muscatine Board of Realtors)MuscatineWiltonMuscatine OutlyingCondominiumsWashington Area (Iowa City Area Assoc. of Realtors)Wisconsin - Grant & Lafayette Co. (S. Central Wisconsin)
2211,895
166212169137
38160225250149389285
394212551173514
393294883169
54178
65835766
14962
743359143
3576222583
1,389338100169
32338771
154405
82183103
96011
111314
9%11%9%7%2%8%
12%13%
8%21%
61%28%
8%3%
19%6%
20%7%9%7%8%
17%7%
48%19%
5%10%
3%4%
11%
25%7%
12%2%3%6%5%
11%29%
56%5%
33%6%
$118,800$173,000
162,900183,800143,300156,400241,300202,300155,000149,000286,700147,200$89,900
$152,400$164,500
166,700154,000162,300177,100
$194,000$91,700
$117,10094,900
148,300113,000125,700101,000164,100101,000125,900135,500
$189,800143,400331,400146,100217,100218,200116,800152,000
$196,800257,900304,500288,900170,100150,700169,200284,300178,500161,200
$109,600$130,700
129,000153,000125,900155,300
$109,200$128,500
$27,328,000$365,558,300
27,371,60061,199,60028,373,50026,278,50010,375,10051,396,20028,823,20028,897,30039,274,20063,569,100
$22,019,200$8,534,000
$79,446,50062,167,10012,011,6004,382,500
885,300$11,825,300$25,392,300
$122,677,50016,804,700
8,746,80028,130,500
9,804,30011,105,6007,382,4005,657,300
27,323,9007,722,000
$204,068,20078,890,00072,578,800
6,426,80012,808,10012,218,200
3,971,30017,175,000
$284,313,60088,981,500
2,740,70045,070,300
5,103,8003,917,700
13,198,70012,226,40040,522,80072,551,700$9,534,600
$35,035,20023,601,300
2,141,8007,428,6001,863,500
$7,861,600$28,258,600
2302,113
168333198168
43254186194137432245
56483373
7827
561
2771,048
17759
24978
1104556
21757
1,075550219
44595634
1131,445
34590
15630267843
227450
87268183
14591272
220
8%16%
9%8%2%
12%9%9%7%
20%
77%16%
6%1%
17%6%
24%7%
11%4%5%
21%5%
51%20%
4%6%5%3%
11%
24%6%
11%2%2%5%3%
16%31%
68%5%
22%5%
94%98%96%98%98%99%98%99%94%96%98%
100%90%91%95%95%93%93%94%83%91%97%96%97%96%96%96%98%95%97%96%98%97%99%98%98%97%96%98%98%98%97%98%96%97%96%97%97%99%96%96%96%98%95%
102%94%90%
2691,848
164266197141
37232178142115376202
53443350
6719
756
304909154
65218
32132
3652
17446
1,059524229
30655341
1171,250
31891
12632226940
155397
69235156
17471569
221
$97,600$163,900
164,700161,700137,600136,200258,500204,900149,200129,800276,400140,000
$102,500$154,100$167,000
170,600153,600154,700150,200
$195,700$77,900
$106,00080,900
120,800103,700115,50099,300
177,000103,200
82,800133,200
$182,500129,500311,000178,000227,400221,400
91,700159,000
$209,800251,200303,700278,300147,900164,400156,600300,000160,900160,200
$115,400$121,000
125,500152,700
93,700123,600
$104,500$124,300
$26,252,700$302,887,500
27,010,20043,019,90027,115,90019,205,400
9,565,00047,546,80026,560,70018,432,30031,785,10052,646,200
$20,702,300$8,165,300
$73,994,00059,710,00010,293,200
2,939,2001,051,600
$10,960,900$23,602,000$96,317,100
12,456,0007,850,000
22,605,4003,696,000
13,105,9006,372,7005,364,600
18,738,1006,128,400
$193,316,00067,868,90071,220,000
5,341,50014,782,40011,736,0003,760,300
18,606,900$262,306,200
79,887,60027,632,70035,070,000
4,733,9003,617,700
10,807,20012,001,50024,938,20063,617,400$7,965,600
$28,426,90019,574,800
2,595,6004,403,1001,853,400
$7,207,900$27,470,400
Regional Residential Real Estate Activity
This representation is based in part on data supplied by the REALTOR Associations or their Multiple List ing Services. Neither the Boards nor their MLS guarantee or is in any way responsible for its accuracy. Data maintained by the Boards or their MLS may not reflect all real estate activity in the market. Several MLS mergers are causing some data to be suspect. The Washington MLS merged into the Iowa City MLS & data may be reflected in both markets. The Clinton MLS recently merged with the Quad Cities MLS. Maquoketa MLS members are merging with either the Quad Cities MLS or Dubuque MLS.

6 • RuhlHomes.com
Regional New Construction Home SalesActive
Inventory 6/30/13
Active Inventory
6/30/15
Active Inventory
6/30/14
% Change in Inventory
from 2014Sales2013
Sales2015
% Change in Sales
from 2014Sales2014
Cedar Rapids Area Houses Condos/VillasDubuque Area Houses Condos/VillasIllinois Quad Cities (Rock Island County) Houses Condos/VillasIowa Quad Cities (Scott County) Houses Condos/VillasIowa City Area Houses Condos/VillasTotal Regional Combined
133755855332212
210864541
216138
78502
163109
54573621
624
1046242
249168
81579
-18%-15%-26%-26%-6%
-62%-17%
+50%-50%+6%
+26%-24%
+45%+20%+95%+12%
14685613636
0431
1108921
18011664
476
+8%+5%
+11%-17%-17%
0%+25%+33%
0%+2%-7%
+38%-2%
-12%+17%+1%
13393404234
8532
1107832
360202158650
15789683030
0541
1128329
177102
75481
14593523433
1321
1078225
20411292
493
Through June
5 Questions to Ask Before Selecting a Home Service Vendor
We often hear that buyers, sellers and current home owners have a hard time finding trusted partners for basic home services. They often ask for recommendations and then decide based on who gets back in touch with them the quickest. Here are some questions we’ve developed for you to ask before deciding what company to partner with: 1. Are they bonded and/or licensed? 2. Do they have up-to-date insurance? 3. Have you heard from three or four people that they are trustworthy and
do good work? 4. Are they established in the community? 5. Have you received a few quotes to price compare? If you need help finding a home service partner, Ruhl&Ruhl has a program developed to make your move or house projects as easy and stress-free as possible. All of our partners have been highly recommended by Ruhl&Ruhl clients and associates and have the proper insurance and licensing. In addition,
their work meets our high-quality standards. For more information, you can visit RuhlHomes.com/Vendors.
Ruhl&Ruhl Realtors Awarded Coolest Places to Work Ruhl&Ruhl Realtors received
recognition as one of the Coolest Places to Work by the Corridor Business Journal. Founded 153 years ago, Ruhl&Ruhl is one of the oldest real estate brokerages in the country. And while that fact doesn’t necessarily scream “cool,” Ruhl&Ruhl sales associates and staff highlighted the flexible atmosphere as one of the company’s greatest strengths. “We focus on personal mastery. We want our agents not to just set business
goals, but we also ask them what they want to accomplish in their personal lives, because that goes hand in hand,” said Chris Beason, Broker/Owner of Ruhl&Ruhl Realtors. “We have more tools for our agents to use than they can even make use of,” said Travis Hiatt, Managing Broker of Ruhl&Ruhl’s Iowa City Office. “It’s like a carpenter’s toolbox with everything at your fingertips.” Learn more at JoinTheRuhlTeam.com.
Ruhl&Ruhl Realtors celebrates the honor of being one of the Coolest Places to Work!
Pictured (left to right): Travis Hiatt, Iowa City Manager; Connie Larsen, Sales Associate; Caroline Ruhl, President; Chris Beason, Broker/Owner

RuhlHomes.com • 7
New Home Sales continued on page 8
New home sales across the region slowed slightly in the second quarter, but still left us with a 1% increase in overall unit sales year-to-date, as reported by our regional Multiple Listing Services (MLSs). While house sales were down 6%, the sales of new condos are up 18%, compared with the first six months of 2014. This accompanies a 12% increase in overall unit inventory, with houses up 9% and condos up 19%. Sales and inventory figures for regional markets are available on page 6. The price breakdown for house and condo sales follows:
Even with increased sales, condos represent 37% of the new homes market. Ranch style homes were preferred by 74% of buyers, with 19% of buyers choosing 2-story houses. New homes represent about 1 of every 9 homes purchased. Overall new home sales and inventory are higher than 2014, but results vary across the region. For a detailed look at housing starts, by market, please consult the chart to the left. Following is a brief summary of activity in each of the major market areas:CEDAR RAPIDS: A strong second quarter helped sales to show an overall increase of 8%, with houses up 5% and condos up 11%. The city of Cedar Rapids led the market up-tick with a combined increase of 24% in sales. These sales consumed available inventory, which dropped by 18% compared to the same time last year.DUBUQUE: House sales for the year are down 17% and, for the second quarter in a row, there were no condos sales reported in the MLS. With overall unit inventory down 26%, Dubuque seems to be in need of an infusion on new spec homes. The strongest segment for homes in 2015 is $225-300K, with a 73% increase over last year. No new construction sales over $300K have been reported in 2015.IOWA CITY: Sales here slowed after a great start, with second quarter sales 11% below those of last year and overall year-to-date sales down 2%. For 2015, houses are down 12% while condo sales are up 17%. At the same time, overall
New Home Sales Show Modest Improvement
New Housing Starts20082012 2013 20152014 % Change
2014 vs. 2015Burlington AreaBurlingtonWest BurlingtonCedar Rapids AreaCedar RapidsMarionRural Linn CountyHiawatha & Mechanicsville AreasDubuque AreaDubuqueEast DubuqueGalenaJo Daviess CountyPeostaSurrounding Dubuque AreaIllinois Quad CitiesMoline & Coal ValleyRock IslandEast Moline & HamptonColonaPort ByronGeneseoRural Rock Island County & MilanSilvisWhiteside CountyIowa Quad CitiesDavenportBettendorfRural Scott CountyEldridge & Long GroveLeClaire & PrincetonBlue Grass - city ofIowa City AreaIowa CityCoralvilleNorth LibertyRural Johnson CountyWest BranchWilliamsburg, Wellman & KalonaWest LibertyMuscatine AreaMuscatineMuscatine CountyWiltonOther AreasClintonDeWittMaquoketa, Preston & BellevueWashington AreaTotal Regional StartsDes Moines Area*
770
2331178821
7188
6310
164
104641114
2007
122
16200
5970262121
3236
75298429
712
010
631
142291
952881
12111
249107
903715
16748
10
178
9366
976
1011
160
16282
4881662658
3203
76205736
671
132
101
112441
1,0031,049
187
113071619643
713536
11
104
8342
810118
101
121913370402420
419758137345
152
228
140
228581
9341,211
1275
253153
602713
16239
70
16109050
517
0412
1227
2024689301519
3225
85159824
120
16295
2467
101
9441,042
+50%0%
+120%+21%+5%
+60%+59%-46%-17%-8%
-86%+100%
-38%-60%
-8%-16%
+60%-94%
0%-75%
0%+300%
-17%-50%+71%
-5%-28%-21%
+33%+60%
+5%+33%-12%-32%-13%-26%+86%
0%+150%+200%
+38%+300%
+56%-100%
-8%+33%-29%-20%
0%-1%
+16%Source: Municipal offices. There may be additional new homes built which are not included with this data. *Des Moines Area is comprised of Adel, Altoona, Ankeny, Clive, Des Moines, Indianola, Johnston, Pleasant Hill, Polk City, Urbandale, Waukee, & West Des Moines.
Through June
Condos: Below $200K = 66% $200-$300K = 29% Above $300K = 5%
Houses: Below $300K = 44% $300-$400K = 32% Above $400K = 24%

Corporate Relocation Center5403 Victoria Avenue, Suite 100Davenport, IA 52807
RETURN SERVICE REQUESTED
Chris BeasonBroker/Owner
RuhlHomes.com
For further information or to be added to our mailing list, contact Caroline Ruhl or Veronica Pianca • 563.355.74745403 Victoria Avenue, Suite 100 • Davenport, Iowa 52807-3925 • [email protected] or [email protected]
8 • RuhlHomes.com
Enjoy the comfort of a stable, successful company supporting you every step of the way.
With its flexible and rewarding environment, a career in real estate could be for you!
The
way to
a new .careerTo see if a career in real estate is right for you, visit
RuhlHomes.com/Careers or JoinTheRuhlTeam.com.
Since 1862
YOUR NAMEREALTOR®
Follow Us Online At:
New Home Sales continued from page 7unit inventory is up 45% over 2014, with the number of new condos on the market nearly doubling that of last year. There are also 20% more houses available. New development in Tiffin should spur sales and help to continue to even out
the local market shares between North Liberty, Iowa City and Coralville/Tiffin.QUAD CITIES: With both overall sales and overall inventory up slightly, compared to 2014, the area continues a slow new homes recovery process. House sales at both ends of the price
spectrum showed gains, while condo sales below $175K were up 128%, helping condos to an overall increase of 36%. This sales increase contributed to a 26% decrease in condo inventory. House sales dropped by 5%, despite a 27% increase in inventory.
The Largest Privately-Owned Real Estate Company in Iowa!