Embed Size (px)
Citation preview


RoutledgeTaylor & Francis Group711 Third AvenueNew York, NY 10017
RoutledgeTaylor & Francis Group27 Church RoadHove, East Sussex BN3 2FA
© 2012 by Taylor & Francis Group, LLCRoutledge is an imprint of Taylor & Francis Group, an Informa business
Printed in the United States of America on acid-free paperVersion Date: 20111017
International Standard Book Number: 978-0-415-87768-8 (Hardback) 978-0-415-87769-5 (Paperback)
For permission to photocopy or use material electronically from this work, please access www.copyright.com (http://www.copyright.com/) or contact the Copyright Clearance Center, Inc. (CCC), 222 Rosewood Drive, Danvers, MA 01923, 978-750-8400. CCC is a not-for-profit organiza-tion that provides licenses and registration for a variety of users. For organizations that have been granted a photocopy license by the CCC, a separate system of payment has been arranged.
Trademark Notice: Product or corporate names may be trademarks or registered trademarks, and are used only for identification and explanation without intent to infringe.
Library of Congress Cataloging‑in‑Publication Data
Grissom, Robert J.Effect sizes for research : univariate and multivariate applications / by Robert
J. Grissom, John J. Kim. -- 2nd ed.p. cm.
Includes bibliographical references and index.ISBN 978-0-415-87768-8 (hardback) -- ISBN 978-0-415-87769-5 (softcover)1. Analysis of variance. 2. Effect sizes (Statistics) 3. Experimental design. I.
Kim, John J. II. Title.
QA279.G75 2012519.5’38--dc23 2011023926
Visit the Taylor & Francis Web site athttp://www.taylorandfrancis.com
and the Psychology Press Web site athttp://www.psypress.com
http://www.psypress.com/effect-sizes-for-research-9780415877695

This book is dedicated to those scholars, who are amply cited herein, who during the past four decades have worked
diligently to develop and promote the use of effect sizes, confidence intervals, and robust statistical methods, and to those who have constructively critiqued such procedures.
In memory of a beloved son, Philip R. Grissom.
http://www.psypress.com/effect-sizes-for-research-9780415877695

vii
ContentsPreface................................................................................................................xiiiAcknowledgments..............................................................................................xvii
Chapter 1 Introduction...................................................................................... 1
Introduction...................................................................................... 1Null-Hypothesis.Significance.Testing.............................................. 1Statistically.Signifying.and.Practical.Significance.......................... 3Definition,.Characteristics,.and.Uses.of.Effect.Sizes....................... 5Some.Factors.Influencing.Effect.Sizes............................................. 6Controversy.About.Null-Hypothesis.Significance.Testing.............. 9Purpose.of.This.Book.................................................................... 11Power.Analysis............................................................................... 12Replication.and.Meta-Analysis...................................................... 13Assumptions.of.Test.Statistics.and.Effect.Sizes............................. 15Violations.of.Assumptions.Suggested.by.Real.Data...................... 17Exploring.the.Data.for.a.Possible.Effect.of.a.Treatment.on Variability.................................................................................. 20Worked.Examples.of.Measures.of.Variability............................... 26Summary........................................................................................ 28Questions........................................................................................ 28
Chapter 2 Confidence.Intervals.for.Comparing.the.Averages.of.Two.Groups................................................................................ 31
Introduction.................................................................................... 31Ratio-of-Means.Effect.Size............................................................ 31Background.................................................................................... 32Confidence.Intervals.for.μa.−.μb:.Independent.Groups.................. 33Frequentist.and.Bayesian.Perspectives........................................... 38Equivalence.Testing,.Non-Inferiority,.and.Superiority.................. 40Worked.Example.for.Independent.Groups..................................... 42Further.Discussions.and.Methods.................................................. 44Solutions.to.Violations.of.Assumptions:.Welch’s.Approximate.Method..................................................................... 45Worked.Example.of.the.Welch.Method......................................... 47Yuen’s.Confidence.Interval.for.the.Difference.Between.Two.Trimmed.Means............................................................................. 47Other.Methods.for.Independent.Groups........................................ 51
http://www.psypress.com/effect-sizes-for-research-9780415877695

viii Contents
Criteria.for.Methods.for.Constructing.a.Confidence.Interval........ 54Dependent.Groups.......................................................................... 55Summary........................................................................................ 58Questions........................................................................................ 59
Chapter 3 The.Standardized.Difference.Between.Means.............................. 61
Introduction.................................................................................... 61Standardized.Difference.Between.Treatment.and Comparison.Means.Assuming.Normality............................... 62Uses.and.Limitations.of.a.Standardized.Difference...................... 66Equal.or.Unequal.Variances.......................................................... 68Outliers.and.Standardized-Difference.Effect.Sizes....................... 72Tentative.Recommendations.......................................................... 73Additional.Standardized-Difference.Effect.Sizes.When There.Are.Outliers............................................................... 74Confidence.Intervals.for.Standardized-Difference.Effect.Sizes.......75Counternull.Effect.Size.................................................................. 83Extreme.Groups............................................................................. 85Percent.of.Maximum.Possible.Score.............................................. 86Dependent.Groups.......................................................................... 87Effect.Sizes.for.Pretest–Posttest.Control-Group.Designs.............. 90Summary........................................................................................ 92Questions........................................................................................ 94
Chapter 4 Correlational.Effect.Sizes.and.Related.Topics............................... 97
Introduction.................................................................................... 97Dichotomizing.and.Correlation...................................................... 97Point-Biserial.Correlation............................................................... 99Unequal.Base.Rates.in.Nonexperimental.Research..................... 102Correcting.for.Bias....................................................................... 106Confidence.Intervals.for.rpop......................................................... 107Null–Counternull.Interval.for.rpop................................................ 108Assumptions.of.Correlation.and.Point-Biserial.Correlation........ 109Unequal.Sample.Sizes.in.Experimental.Research........................115Unreliability..................................................................................116Adjusting.Effect.Sizes.for.Unreliability....................................... 120Restricted.Range.......................................................................... 123Scale.Coarseness.......................................................................... 126Small,.Medium,.and.Large.Effect.Size.Values............................ 127Binomial.Effect.Size.Display....................................................... 132Coefficient.of.Determination........................................................ 135Criticisms.of.the.Coefficient.of.Determination............................ 140Slopes.as.Effect.Sizes................................................................... 142
http://www.psypress.com/effect-sizes-for-research-9780415877695

ixContents
Effect.Sizes.for.Mediating.and.Moderating.Variables................. 144Summary...................................................................................... 145Questions...................................................................................... 146
Chapter 5 Effect.Size.Measures.That.Go.Beyond.Comparing.Two Averages............................................................................... 149
Introduction.................................................................................. 149Probability.of.Superiority:.Independent.Groups.......................... 149Introduction.to.Overlap.and.Related.Measures............................ 166Dominance.Measure.................................................................... 166Cohen’s.Measures.of.Nonoverlap................................................. 167Relationships.Among.Measures.of.Effect.Size............................ 169Estimating.Effect.Sizes.Throughout.a.Distribution......................170Other.Graphical.Estimators.of.Effect.Sizes................................. 172Dependent.Groups........................................................................ 172Summary.......................................................................................174Questions.......................................................................................175
Chapter 6 Effect.Sizes.for.One-Way.ANOVA.and.Nonparametric.Approaches................................................................................... 177
Introduction.................................................................................. 177Assumptions..................................................................................178ANOVA.Results.for.This.Chapter.................................................178Standardized-Difference.Measure.of.Overall.Effect.Size............178Standardized.Overall.Effect.Size.Using.All.Means.................... 179Strength.of.Association.................................................................181Evaluation.of.Criticisms.of.Strength.of.Association.................... 185Standardized-Difference.Effect.Sizes.for.Contrasts.................... 188Worked.Examples......................................................................... 189Unstandardized.Differences.Between.Means...............................191More.on.Standardized.Differences.Between.Means.................... 194Intransitivity.and.the.PS.Effect.Size............................................ 196Within-Groups.Designs................................................................ 196Summary...................................................................................... 201Questions...................................................................................... 202
Chapter 7 Effect.Sizes.for.Factorial.Designs................................................ 205
Introduction.................................................................................. 205Assumptions.and.Handling.Violations......................................... 205Discretizing.Continuous.Independent.Variables.......................... 205Factors:.Targeted,.Peripheral,.Extrinsic,.Intrinsic....................... 206Strength.of.Association:.Proportion.of.Variance.Explained........ 207
http://www.psypress.com/effect-sizes-for-research-9780415877695

x Contents
Designs.and.Results.for.This.Chapter...........................................211Manipulated.Factors.Only.............................................................211Manipulated.Targeted.Factor and Intrinsic.Peripheral.Factor..... 215Illustrative.Worked.Examples.......................................................217Comparisons.of.Levels.of.a.Manipulated.Factor.at.One.Level of.a.Peripheral.Factor......................................................... 220Targeted.Classificatory.Factor.and.Extrinsic.Peripheral.Factor......223Classificatory.Factors.Only.......................................................... 224Statistical.Inference.and.Further.Reading.................................... 227Within-Groups.Factorial.Designs................................................ 230Additional.Designs,.Measures,.and.Discussion........................... 233Summary...................................................................................... 235Questions...................................................................................... 237
Chapter 8 Effect.Sizes.for.Categorical.Variables......................................... 241
Introduction.................................................................................. 241Unreliability.of.Categorization.................................................... 243Dichotomizing.a.Continuous.Variable......................................... 246Chi-Square.Test.and.Phi............................................................... 247Confidence.Intervals.and.Null–Counternull.Intervals.for.phipop......251Difference.Between.Two.Proportions.......................................... 251Relative.Risk................................................................................ 259Propensity-Score.Analysis........................................................... 263Relative.Risk.Reduction............................................................... 264Number.Needed.to.Treat.............................................................. 265Relationships.Among.Measures................................................... 268Odds.Ratio.................................................................................... 269Tables.Larger.Than.2.×.2............................................................. 277Multiway.Tables........................................................................... 279More.on.Testing.and.Effect.Sizes.for.Related.Proportions.......... 279Further.Discussions...................................................................... 280Summary...................................................................................... 281Questions...................................................................................... 282
Chapter 9 Effect.Sizes.for.Ordinal.Categorical.Dependent.Variables.(Rating.Scales)............................................................................. 285
Introduction.................................................................................. 285Point-Biserial.r.Applied.to.Ordinal.Categorical.Data.................. 288Probability.of.Superiority.Applied.to.Ordinal.Data..................... 292Dominance.Measure.................................................................... 298Somers’.D,.the.Risk.Difference,.and.the.NNT............................. 299Worked.Example.of.the.Dominance.Statistic.and.NNTest............ 300Generalized.Odds.Ratio............................................................... 301
http://www.psypress.com/effect-sizes-for-research-9780415877695

xiContents
Cumulative.Odds.Ratios............................................................... 302Phi.Coefficient.............................................................................. 304Further.Reading........................................................................... 304Summary...................................................................................... 305Questions...................................................................................... 305
Chapter 10 Effect.Sizes.for.Multiple.Regression/Correlation........................ 307
Introduction.................................................................................. 307Multiple.Coefficient.of.Determination......................................... 308Semipartial.Correlation.................................................................313Partial.Correlation.........................................................................315Statistical.Control.of.Unwanted.Effects........................................317Higher-Order.Correlation.Coefficients..........................................318More.Statistical.Significance.Testing.and.Confidence.Intervals........319Sets.of.Included.and.Excluded.X.Variables.................................. 321Multiple.Regression.and.ANOVA:.Dummy.Coding.................... 323Worked.Example.of.Multiple.Regression/Correlation................. 328Nonlinear.Regression................................................................... 332Hierarchical.Linear.Modeling.(Multilevel.Modeling)................. 334Path.Analysis.and.Structural.Equation.Modeling........................ 335Effect.Size.for.Ordinal.Multiple.Regression................................ 337Additional.Topics.and.Reading.................................................... 337Summary...................................................................................... 339Questions...................................................................................... 341
Chapter 11 Effect.Sizes.for.Analysis.of.Covariance....................................... 343
Introduction.................................................................................. 343ANCOVA.in.Nonexperimental.Research..................................... 344Proportion.of.Variance.Explained.Overall.................................. 347Proportion.of.Variance.Explained.by.a.Contrast......................... 348Standardized.Difference.Between.Means.................................... 348Unstandardized.Difference.Between.Means................................ 350Worked.Examples.of.Effect.Sizes.................................................351Summary...................................................................................... 355Questions...................................................................................... 356
Chapter 12 Effect.Sizes.for.Multivariate.Analysis.of.Variance...................... 357
Introduction.................................................................................. 357Assumptions.of.MANOVA.......................................................... 358Statistical.Tests............................................................................. 358Effect.Sizes.for.One-Way.MANOVA........................................... 360MANCOVA.................................................................................. 371
http://www.psypress.com/effect-sizes-for-research-9780415877695

xii Contents
Factorial.Between-Groups.MANOVA......................................... 373One-Way.Within-Groups.MANOVA........................................... 378Effect.Sizes.for.Mixed.MANOVA.Designs................................. 382Effect.Sizes.for.Within-Groups.MANOVA.Factorial.Designs......... 387Additional.Analyses..................................................................... 388Summary...................................................................................... 388Questions...................................................................................... 389
References......................................................................................................... 391
Author Index.................................................................................................... 421
Subject Index.................................................................................................... 429
http://www.psypress.com/effect-sizes-for-research-9780415877695
xiii
PrefaceEmphasis.on.effect.sizes.is.rapidly.rising.as.at.least.24.journals.in.various.fields.require.that.authors.of.research.reports.provide.estimates.of.effect.size..For.cer-tain.kinds.of.applied.research,.it.is.no.longer.considered.acceptable.only.to.report.that.results.were.statistically.significant..Statistically.significant.results.indicate.that.a.researcher.has.discovered.some.evidence.of,.say,.a.real.difference.between.parameters. or. a. real. association. between. variables,. but. one. of. unknown. size..Especially.in.applied.research,.such.statements.often.need.to.be.augmented.with.estimates.of.how.different.the.average.results.for.studied.groups.are.or.how.strong.the.association.between.variables.is..Those.who.apply.the.results.of.research.often.need. to.know.more,. for. example,. than. that.one. therapy,.one. teaching.method,.one.marketing.campaign,.or.one.medication.appears. to.be.better. than.another;.they.often.need.evidence.of.how.much.better.it.is.(i.e.,.the.estimated.effect.size)..Chapter. 1. provides. a. more. detailed. definition. of. effect. size. and. discussion. of.those.circumstances.in.which.estimation.of.effect.sizes.is.especially.important.
The.purpose.of.this.book.is.to.inform.a.broad.readership.(broad.with.respect.to.fields.of.research.and.extent.of.knowledge.of.general.statistics).about.a.variety.of.mea-sures.and.estimators.of.effect.sizes.for.analysis.of.univariate.and.multivariate.data,.their.proper.applications.and.interpretations,.and.their.limitations..Thus,.this.book.focuses.on.analyzing.the.results.of.a.study.in.terms.of.the.size.of.the.obtained.effects.
Contents
The.book.discusses.a.broad.variety.of.measures.and.estimators.of.effect. sizes.for.different.kinds.of.variables.(nominal,.ordinal,.continuous),.and.different.cir-cumstances.and.purposes.. It.provides.detailed.discussions.of. standardized.and.unstandardized.differences.between.means.(Chapters.2,.3,.6,.7,.and.11),.many.of.the.correlational.measures.(Chapters.4.and.10),.strength.of.association.(Chapters.6,.7,.and.10.through.12),.association.in.contingency.tables.(Chapters.8.and.9),.con-fidence.intervals.(Chapter.2.and.thereafter.for.many.measures),.and.some.impor-tant.less-known.measures.that.are.simple.and.more.robust.when.assumptions.are.violated.(Chapters.5.and.9)..In.the.interest.of.fairness.and.completeness,.for.cases.in.which.experts.disagree.about.the.appropriate.measure.of.effect.size,.this.book.cites.alternative.viewpoints.
new to this edition
This.second.edition•. Provides.updated.and.more.detailed.discussions.of.the.univariate.effect.
size.measures.that.were.discussed.in.the.first.edition•. Adds.univariate.effect.size.measures.that.were.not.discussed.in.the.first.
edition
http://www.psypress.com/effect-sizes-for-research-9780415877695

xiv Preface
•. Adds. figures. and. tables. to. demonstrate. some. important. concepts.graphically
•. Adds.three.chapters.on.measures.of.effect.sizes.in.multiple.regression,.analysis.of.covariance,.and.multivariate.analysis.of.variance.and.other.multivariate.methods
•. Expands.coverage.of.effect.size.measures.for.dependent.groups•. Expands.the.discussions.of.confidence.intervals.for.effect.sizes•. Discusses.newer.robust.methods•. Expands. the. discussions. of. commercial. software. and. cites. more. free.
software•. Adds. pedagogical. aids. to. all. chapters:. introductions,. summaries,. tips.
and.pitfalls.sections,.and.additional.problems•. Adds.sections.on.recommendations.where.helpful•. Adds.a.website.with.data.sets,.http://www.psypress.com/9780415877695
The. usefulness. of. an. estimate. of. effect. size. depends. on. the. soundness. of. the.underlying.research.method.and,.many.believe,.also.on.the.features.of.the.under-lying.statistical.analysis;.thus,.this.book.discusses.many.issues.involving.method-ology,.psychometrics,.and.modern.data.analysis..
intended AudienCe
The.level.and.content.of.this.book.make.it.appropriate.for.use.as.a.supplement.for.graduate.courses.in.statistics.in.such.fields.as.psychology,.education,.the.social.sciences,.business,.management,.and.medicine..The.book.is.also.appropriate.for.use.as.the.text.for.a.graduate.course.on.effect.sizes,.or.a.special-topics.seminar.or.independent-reading.course.in.those.fields..Because.of.its.broad.content.and.extensive.references,.the.book.is.also.intended.to.be.a.valuable.resource.for.pro-fessional.researchers.and.data.analysts,.graduate.students.who.are.analyzing.data.for.theses,.and.advanced.undergraduates.who.are.doing.research.
To.enhance.its.use.as.a.resource,.the.book.briefly.mentions,.and.provides.ref-erences.for,.some.topics.for.which.constraint.on.length.does.not.permit.detailed.discussion..Some.instructors.may.choose.to.omit.such.material..
With. regard. to. the. first. nine. chapters. of. the. book. (univariate. effect. sizes),.readers.are.expected. to.have.knowledge.of.parametric. statistics. through. facto-rial.analysis.of.variance.as.well.as.some.knowledge.of.chi-squared.analysis.of.contingency.tables..Some.knowledge.of.nonparametric.analysis.in.the.case.of.two.independent.groups.(i.e.,.the.Mann–Whitney.U.test.or.the.equivalent.Wilcoxon.Wm.test).would.be.helpful,.but.not.essential.
With.regard.to.the.final.three.chapters.(multivariate.effect.sizes),.we.assume.that.some.readers.have.only.scant.familiarity.with.the.elements.of.multiple.regres-sion,.analysis.of.covariance,.and.multivariate.analysis.of.variance;.thus,.a.brief.conceptual.overview.is.provided.before.discussing.effect.sizes..Where.graduate.students. are. sufficiently. prepared. in. univariate. and. multivariate. statistics,. this.book.can.be.used.as.the.textbook.in.an.advanced.statistics.course..Although.the.
http://www.psypress.com/effect-sizes-for-research-9780415877695

xvPreface
book.is.not.introductory.with.regard.to.statistics.in.general,.we.assume.that.many.readers. have. little. or. no. prior. knowledge. of. measures. of. effect. size. and. their.estimation.
Chapter. 1. includes. a. brief. discussion,. with. many. references,. of. the. contro-versy.about.null-hypothesis. significance. testing..However,. the.use.of.appropri-ate.effect.sizes.and.confidence.intervals.for.effect.sizes.is.generally.approved.by.those.on.either.side.of.this.controversy,.either.for.replacing.or.augmenting.testing.for.statistical.significance..We.note.that.the.first.edition.of.this.book.was.favorably.reviewed.by.those.on.either.side.of.this.controversy.
Readers.should.be.able.to.find.in.this.book.many.kinds.of.effect.sizes.that.they.can.knowledgeably.apply.to.many.of.their.sets.of.data..We.attempt.to.enhance.the.practicality.of.the.book.by.the.use.of.worked.examples.that.often.involve.real.data,. for.which. the.book.provides.calculations.of.estimates.of.effect. sizes. that.had.not.previously.been.made.by.the.original.researchers..Finally,.in.addition.to.standard.commercial.software,.we.often.cite.free.statistical.software.for.special.calculations.of.effect.sizes.and.confidence.intervals.for.them.
http://www.psypress.com/effect-sizes-for-research-9780415877695

1
Introduction
introduCtion
Simply.defined.for.now,.an.effect.size.usually.quantifies.the.degree.of.difference.between.or.among.groups.or.the.strength.of.association.between.variables.such.as.a.group-membership.variable.and.an.outcome.variable..This.chapter.introduces.the.general.concept.of.effect.sizes.in.the.contexts.of.null-hypothesis.significance.testing.(NHST),.power.analysis,.and.meta-analysis..The.main.focus.of. the.rest.of.this.book.is.on.effect.sizes.for.the.purpose.of.analyzing.the.data.from.a.single.piece.of.research..For.this.purpose,.this.chapter.discusses.some.assumptions.of.effect.sizes.and.of.the.test.statistics.to.which.they.often.relate.
null-hypothesis signifiCAnCe testing
Much.applied.research.begins.with.a.research.hypothesis.that.states.that.there.is.a.relationship.between.two.variables.or.a.difference.between.two.parameters,.such.as.means..(In.later.chapters,.we.discuss.research.involving.more.than.two.vari-ables.or.more.than.two.parameters.).One.typical.form.of.the.research.hypothesis.is. that. there. is. a.nonzero.correlation.between. the. two.variables. in. the.popula-tion.. Often. one. variable. is. a. categorical. independent. variable. involving. group.membership. (a grouping variable),. such.as.male.versus. female.or.Treatment.a.versus.Treatment b,. and. the.other.variable. is. a. continuous.dependent.variable,.such.as.blood.pressure,.or.score.on.an.attitude.scale.or.on.a.test.of.mental.health.or.achievement.
In.the.case.of.a.grouping.variable,.there.are.two.customary.forms.of.research.hypothesis..The.hypothesis.may.again.be.stated.correlationally,.positing.a.non-zero.correlation.between.group.membership.and.the.dependent.variable,.as.is.dis-cussed.in.Chapter.4..More.often.in.this.case.of.a.grouping.variable,.the.research.hypothesis. posits. that. there. is. a. difference. between. means. in. the. two. popula-tions..Although.a.researcher.may.prefer.one.approach,.some.readers.of.a.research.report. may. prefer. the. other.. Therefore,. a. researcher. should. consider. reporting.effect.sizes.from.both.approaches.
The.usual.statistical.analysis.of.the.results.from.the.kinds.of.research.at.hand.involves.testing.a.null hypothesis.(H0).that.conflicts.with.the.research.hypothesis.typically.either.by.positing.that.the.correlation.between.the.two.variables.is.zero.in.the.population.or.by.positing.that.there.is.no.difference.between.the.means.of.the.two.populations..(Strictly,.a.null.hypothesis.may.posit.any.value.for.a.parameter..When.the.null-hypothesized.value.corresponds.to.no.effect,.such.as.no.difference.between.population.means.or.zero.correlation.in.the.population,.the.null.hypoth-esis.is.sometimes.called.a.nil hypothesis,.about.which.more.is.discussed.later.)
1
http://www.psypress.com/effect-sizes-for-research-9780415877695

2 Effect Sizes for Research: Univariate and Multivariate Applications
The. t. statistic. is.usually.used. to. test. the.H0.against. the. research.hypothesis.regarding.a.difference.between.the.means.of.two.populations..The.significance level.(p level).that.is.attained.by.a.test.statistic.such.as.t.represents.the.probability.that.a.result.at.least.as.extreme.as.the.obtained.result.would.occur.if.the.H0.were.true..It.is.very.important.for.applied.researchers.to.recognize.that.this.attained.p.value.is.not.the.probability.that.the.H0.is.wrong,.and.it.does.not.indicate.how.wrong.H0.is,.the.latter.goal.being.a.purpose.of.an.effect.size..Also,.the.p.value.traditionally.informs.a.decision.about.whether.or.not.to.reject.H0,.but.it.does.not.guide.a.decision.about.what.further.inference.to.make.after.rejecting.a.H0.
Observe.in.Equation.1.1.for.t.for.independent.groups.that.the.part.of.the.for-mula.that.is.usually.of.greatest.interest.in.applied.research.that.uses.a.familiar.scale.for.the.measure.of.the.dependent.variable.is.the.numerator,.the.difference.between.means..(This.difference.is.a.major.component.of.a.common.estimator.of.effect.size.that.is.discussed.in.Chapter.3.).However,.Equation.1.1.reveals.that.whether.or.not.t.is.large.enough.to.attain.statistical.significance.is.not.merely.a.function.of.how.large.this.numerator.is,.but.depends.on.how.large.this.numerator.is.relative.to.the.denominator..Equation.1.1.and.the.nature.of.division.reveal.that.for.any.given.difference.between.means.an.increase.in.sample.sizes.will.increase.the.absolute.value.of.t.and,.thus,.decrease.the.magnitude.of.p..Therefore,.a.statisti-cally.significant.t.may.indicate.a.large.difference.between.means.or.perhaps.a.less.important.small.difference.that.has.been.elevated.to.the.status.of.statistical.sig-nificance.because.the.researcher.had.the.resources.to.use.relatively.large.samples.
Tips and PitfallsThe.lesson.here.is.that.the.outcome.of.a.t.test,.or.an.outcome.using.another.test.statistic,.that.indicates.by,.say,.p.<..05.that.one.treatment’s.result.is.statistically.sig-nificantly.different.from.another.treatment’s.result,.or.that.the.treatment.variable.is.statistically.significantly.related.to.the.outcome.variable,.does.not.sufficiently.indicate.how.much. the.groups.differ.or.how.strongly. the.variables.are. related..The.degree.of.difference.between.groups.and.the.strength.of.relationship.between.variables.are.matters.of.effect.size..Attaining.statistical.significance.depends.on.effect.size,.sample.sizes,.variances,.choice.of.one-tailed.or.two-tailed.testing,.the.adopted.significance.level,.and.the.degree.to.which.assumptions.are.satisfied.
In.applied.research.it.is.often.very.important.to.estimate.how.much.better.a.statisti-cally.significantly.better.treatment.is..It.is.not.enough.to.know.merely.that.there.is.sup-posedly.evidence.(e.g.,.p.<..05),.or.supposedly.even.stronger.evidence.(e.g.,.p < .01),.that.there.is.some.unknown.degree.of.difference.in.mean.performance.of.the.two.groups..If.the.difference.between.two.population.means.is.not.0.it.can.be.anywhere.from.nearly.0.to.far.from.0..If.two.treatments.are.not.equally.efficacious,.the.better.of.the.two.can.be.anywhere.from.slightly.better.to.very.much.better.than.the.other.
For.an.example.involving.the.t.test,.suppose.that.a.researcher.were.to.compare.the.mean.weights.of.two.groups.of.overweight.diabetic.people.who.have.under-gone. random.assignment. to. either.weight-reduction.program.a. or.b..Often. the.difference.in.mean.postprogram.weights.would.be.tested.using.the.t.test.of.a.H0.that.posits.that.there.is.no.difference.in.mean.weights,.μa.and.μb,.of.populations.
http://www.psypress.com/effect-sizes-for-research-9780415877695

3Introduction
who.undertake.program.a.or.b.(H0:.μa.−.μb.=.0)..The.independent-groups.t.statistic.in.this.nil-hypothesis.case.is
.
tY Y
s
n
s
n
= −
+
a b
a
a
b
b
2 2 1 2/ , . (1.1)
where.Y–.values,.s2.values,.and.ns.are.sample.means,.variances,.and.sizes,.respec-
tively..Again,.if.the.value.of.t.is.great.enough.(positive.or.negative).to.place.t.in.the. extreme. range. of. values. that. are. improbable. to. occur. if. H0. were. true,. the.researcher.will.reject.H0.and.conclude.that.it.is.plausible.that.there.is.a.difference.between.the.mean.weights.in.the.populations.
Tips and PitfallsConsider.a.possible.limitation.of.the.aforementioned.interpretation.of.the.statis-tically. significant. result..What. the. researcher.has.apparently.discovered. is. that.there.is.evidence.that.the.difference.between.mean.weights.in.the.populations.is.not.zero..Such.information.may.be.of.use,.especially.if.the.overall.costs.of.the.two.treatments.are.the.same,.but.it.would.often.be.more.informative.to.have.an.estimate.of.what.the.amount.of.difference.is.(an.effect.size).than.merely.learning.that.there.is.evidence.of.what.it.is.not.(i.e.,.not.0).
stAtistiCAlly signifying And prACtiCAl signifiCAnCe
The. phrase. “statistically. significant”. can. be. misleading. because. synonyms. of.“significant”. in. the.English. language,.but.not. in. the. language.of. statistics,. are.“important”. and. “large,”. and.we.have. just. observed.with. the. t. test,. and. could.illustrate.with.other.statistics.such.as.F.and.χ2,.that.a.statistically.significant.result.may.not.be.a.large.or.important.result..“Statistically.significant”.is.best.thought.of.as.meaning.“statistically.signifying.”.A.statistically.significant.result.is.signify-ing.that.the.result.is.sufficient,.by.the.researcher’s.adopted.standard.of.required.evidence.against.H0.(say,.adopted.significance.level.α.<..05),.to.justify.rejecting.H0..There.are.possible.substitutes.for.the.phrase.“statistically.significant,”.such.as. “result. (or. difference). not. likely. attributable. to. chance,”. “difference.beyond.a.reasonable.doubt,”.“apparently.truly.(or.really.or.convincingly).different,”.and.“apparently.real.difference.of.as.yet.unknown.magnitude.”
A.medical.example.of.a.statistically.significant.result.that.would.not.be.prac-tically. significant. in. the. sense. of. clinical significance. would. be. a. statistically.significant.lowering.of.weight.or.blood.pressure.that.is.too.small.to.lower.risk.of.disease.importantly..Also,.a.statistically.significant.difference.between.a.standard.treatment.and.a.placebo.is.less.clinically.significant.than.one.of.the.same.mag-nitude.between.a.standard.treatment.and.a.new.treatment..A.psychotherapeutic.example.would.be.a.statistically.significant.lowering.of.scores.on.a.test.of.depres-sion. that. is. insufficient. to.be. reflected. in. the. clients’. behaviors. or. self-reports.
http://www.psypress.com/effect-sizes-for-research-9780415877695

4 Effect Sizes for Research: Univariate and Multivariate Applications
of. well-being.. Another. example. would. be. a. statistically. significant. difference.between.schoolgirls.and.schoolboys.that.is.not.large.enough.to.justify.a.change.in.educational.practice.(educational insignificance)..Thus,.a.result.that.attains.a.researcher’s.standard.for.“significance”.may.not.attain.a.practitioner’s.standard.of.significance.
Bloom,. Hill,. Black,. and. Lipsey. (2008). and. Hill,. Bloom,. Black,. and. Lipsey.(2008).discussed.the.use.of.benchmarks.that.proceed.from.effect.sizes.to.assess.the.practical.significance.of.educational.interventions..Their.approach.emphasizes.that.it.is.not.the.mere.numerical.value.of.an.effect.size.that.is.of.importance.but.how.such.a.value.compares.to.important.benchmarks.in.a.field..In.clinical.research,.one.definition.of.a.practically.significant.difference.is.the.smallest.amount.of.ben-efit.that.a.treatment.would.have.to.provide.to.justify.all.costs,.including.risks,.of.the.treatment,.the.benefit.being.determined.by.the.patient..Matsumoto,.Grissom,.and.Dinnel. (2001).reported.on. the.cultural significance.of.differences.between.Japan.and.the.United.States.in.terms.of.effect.sizes.involving.mean.differences.
Onwuegbuzie,. Levin,. and. Leech. (2003). recommended,. where. appropriate,.that. practical. significance.be. conveyed. in. terms.of.economic significance..For.example,.when.reporting.the.results.of.a.successful.treatment.for.improving.the.reading.level.of.learning-disabled.children,.in.addition.to.a.p.level.and.an.estimate.of.a.traditional.effect.size.the.researcher.should.report.the.estimated.annual.mon-etary.savings.per.treated.child.with.respect.to.reduced.cost.of.special.education.and.other.costs.of.remedial.instruction..Another.example.is.a.report.stating.that.for. every.dollar. a. state. spends.on.education. (education.being.a. “treatment”.or.“intervention”).in.a.state.university,.the.state’s.return.benefit.is.eventually.Y.dol-lars.(Y.>.1)..Harris.(2009).proposed.as.a.measure.of.educational.significance.the.ratio.of.an.effect.size.and.the.monetary.cost.of.the.intervention.that.brings.about.that.effect.size..In.this.proposal,.to.be.considered.large.such.a.ratio.must.be.at.least.as.large.as.the.largest.such.ratio.for.a.competing.intervention.
In.clinical.research.the.focus.is.often.on.the.effect.size.for.a.treatment.that.is.intended.to.reduce.a.risk.factor.for.disease,.such.as.lowering.blood.pressure.or.lowering.cholesterol.levels..However,.the.relative.effect.sizes.of.competing.treat-ments.with.regard.to.a.risk.factor.for.a.disease.may.not.predict.the.treatments’.relative.effects.on. the.ultimate.outcomes,. such.as. rate.of.mortality,.because.of.possibly.different.side.effects.associated.with.the.competing.treatments..This.is.a.matter.of.net clinical benefit..Similarly,.in.psychotherapeutic.research.the.focus.of.estimation.of.effect.size.may.be.on.competing.treatments.to.reduce.a.risk.factor.such.as.suicidal.thoughts,.whereas.the.ultimate.interest.should.be.elsewhere,.that.is,.effect.sizes.of.competing.treatments.with.regard.to.suicide.itself.in.this.case.
More.is.written.about.practical.significance.throughout.this.book,.including.the. fact. that. the. extent. of. practical. significance. is. not. always. reflected.by. the.magnitude.of.an.effect.size..The.quality.of.a.judgment.about.the.practical.signifi-cance.of.a.result.is.enhanced.by.expertise.in.the.area.of.research..Although.effect.size,.a broad.definition.of.which.is.discussed.in.the.next.section,.is.not.synony-mous.with.practical.significance,.knowledge.of.a.result’s.effect.size.can.inform.a subjective.judgment.about.practical.significance.
http://www.psypress.com/effect-sizes-for-research-9780415877695

5Introduction
definition, ChArACteristiCs, And uses of effeCt sizes
We.assume.for.now.the.case.of.the.typical.null.hypothesis.that.implies.that.there.is.no.effect.or.no.relationship.between.variables;.for.example,.a.null.hypothesis.that.states.that.there.is.no.difference.between.means.of.populations.or.that.the.correlation.between.variables.in.the.population.is.zero..Whereas.a.test.of.statisti-cal.significance.is.traditionally.used.to.provide.evidence.(attained.p.level).that.a.null.hypothesis.is.wrong,.an.effect.size.(ES).measures.the.degree.to.which.such.a.null.hypothesis.is.wrong.(if.it.is.wrong)..Because.of.its.pervasive.use.and.usefulness,.we.use.the.name.effect size.for.all.such.measures.that.are.discussed.in.this.book..Many.effect.size.measures.involve.some.form.of.correlation.(Chapters.4.and.10).or.its.square.(Chapters.4,.6,.7,.10,.and.12),.some.form.of.standardized.difference.between.means.(Chapters.3,.6,.7,.11,.and.12),.or.the.degree.of.overlap.of.distribu-tions.(Chapter.5),.but.many.measures.that.will.be.discussed.do.not.fit.into.these.categories..Again,.we.use.the.label.effect.size.for.measures.of.the.degree.to.which.results.differ.from.what.is.implied.for.them.by.a.typical.null.hypothesis.
Often.the.relationship.between.the.numerical.value.of.a.test.statistic.(TS).and.an.estimator.of.ES.is.ESest.=.TS/f(N),.where.f(N).is.some.function.of.total.sample.size,. such.as.degrees.of. freedom..Specific. forms.of. this.equation.are.available.for.many.test.statistics,.including.t,.F,.and.χ2,.so.that.reported.test.statistics.can.be.approximately.converted.to.indirect.estimates.of.effect.size.by.a.reader.of.a.research.report.or.a.meta-analyst.without.access. to. the.raw.data. that.would.be.required.to.estimate.an.effect.size.directly..However,.researchers.who.work.with.their.own.raw.data.(called.primary researchers).and.who.use.this.book.can.esti-mate.effect.sizes.directly.so.they.do.not.need.to.use.an.approximate.conversion.equation.to.convert.a.value.of.the.test.statistic.to.an.estimate.of.effect.size.
Although.some.function.of.sample.size.typically.appears.in.equations.for.esti-mators.of.effect.sizes.(explicitly,.or.implicitly.in.their.denominators),.these.func-tions.of. sample.sizes.merely.serve. to.compensate. for. the.effect.of. sample.size.elsewhere. in. the.equation,. typically. the.numerator..However,. sample. sizes.can.influence.the.bias.(often.slight).of.estimators.in.some.cases..(Also,.smaller.sample.size.results.in.greater.sampling.variability.of.an.estimator.of.effect.size,.which.can.increase.the.difference.between.the.estimated.effect.size.and.the.actual.effect.size.in.the.population.).In.various.published.literatures,.studies.with.larger.sample.sizes.tend.to.be.associated.with.lower.estimated.effect.sizes.because.attaining.a.statistically.significant.result.is.often.a.prerequisite.for.publication.and.the.smaller.a.sample’s.effect.size.the.larger.the.sample.that.is.needed.to.attain.statistical.sig-nificance.(Slavin.&.Smith,.2009).
Merely.reporting.an.effect.size.without.properly.interpreting.it.adds.little.to.a.report.of.research..In.their.study.of.articles. that.appeared.in.10.journals. that.publish.educational.research,.Alhija.and.Levy.(2009).reported.that.different.con-clusions.could.often.be.reached.if.reported.effect.sizes.had.been.interpreted..The.American.Educational.Research.Association.recommends.including.an.estimate.and. interpretation. of. effect. size. for. each. important. inferential. statistic. that. is.reported.
http://www.psypress.com/effect-sizes-for-research-9780415877695

6 Effect Sizes for Research: Univariate and Multivariate Applications
some fACtors influenCing effeCt sizes
Some.important.factors.that.influence.estimates.of.effect.size.are.(a).the.research.design,.(b).which.of.a.variety.of.possibly.conflicting.effect.sizes.a.researcher.chooses.to.report,.(c).violations.of.assumptions.such.as.equal.variances.and.normality,.and.(d).the.reliability.of.the.scores.on.the.dependent.variable..Other.influential.factors.include.the.nature.of.the.participants.and.their.variability.(e.g.,.effect.size.might.be.larger.when.participants.come.from.populations.that.are.homogeneous.with.regard.to.background.variables),.the.choice.of.measure.of.the.dependent.variable.(alterna-tive.measures.may.differ.in.their.reliability.[Chapter.4].and.in.their.sensitivity.to.the.effect.of.the.independent.variable),.and.the.amount.of.time.between.administration.of.a.treatment.and.the.collection.of.the.data.from.which.an.effect.size.is.calculated..The.magnitudes.of.effect.sizes.for.gender.differences.in.mathematics.vary.depend-ing.on.the.domain.of.mathematics.that.is.being.tested.and.the.form.of.the.test.(e.g.,.multiple-choice.or.open-ended;.Liu.&.Wilson,.2009).
Sometimes.a.clinical.study.is.stopped.ahead.of.schedule.because.the.results.appear.to.be.obviously.favorable.for.a.new.treatment.for.a.serious.disease..In.this.case.an.estimate.of.effect.size.at.that.point.is.likely.to.be.greater.than.it.would.have.been.if.the.study.had.proceeded.to.its.scheduled.end.
Some.estimators.of.effect.size.are.biased.to.an.extent.that.depends.on.sample.size,.as.is.observed.throughout.this.book..Also,.in.some.areas.of.research.effect.sizes.tend.to.be.smaller.in.later.research.than.in.earlier.research.(effect size decline)..Some.of.the.possible.reasons.for.such.a.decline.relate.to.sample.size.and.publica-tion bias.and.outcome reporting bias,.which.are,.respectively,.the.disinclination.of.many.editors.of.journals.to.publish,.and.the.disinclination.of.many.researchers.to.submit,.reports.of.research.whose.results.do.not.attain.statistical.significance..Larger.estimates.of.effect.size.in.the.distribution.of.possible.sample.effect.sizes.will.be.required.to.attain.statistical.significance.in.an.earlier.study.than.in.a.later.study.if.the.former.uses.smaller.samples..In.this.case.earlier.published.effect.size.estimates.will.be.relatively.large.for.a.particular.area.of.research.whereas.later.pub-lished.studies.will.be.more.likely.to.include.relatively.small.estimates.of.effect.size.
Another.possible.related.reason.for.effect.size.decline.over.time.is.the.statistical.phenomenon.called.“regression.to.the.mean,”.whereby.an.extreme.sample.value.of.a.variable.is.likely.to.be.followed.by.a.less.extreme.sample.value..The.possible.sequence.of.events.is.as.follows..Because.of.sampling.variability.(greater.with.a.smaller.sample).a.given.sample.is.likely.to.produce.an.estimate.of.effect.size.that.is.greater.or.smaller.than.the.population.effect.size..Assume.the.case.in.which.it.is.a.greater.sample.effect.size.that.is.obtained.(an.overestimate)..The.greater.a.sample.effect. size. the. more. likely. that. the. researcher. will. submit,. and. the. editor. will.accept,.for.publication.a.report.of.that.effect.size..The.greater.the.sample.effect.size. the.more. likely. that. it. is.overestimating. the.population.effect. size. and. the.more.likely.that.a.second.independent.sample.will.yield.a.less.extreme.estimate.
Staines.and.Cleland.(2007).discussed.additional.factors.that.can.possibly.influ-ence.the.size.of.effect,.including.partial-sample.bias,.researcher-allegiance.bias,.and.wait-list-control-group.bias..Such.biases.are.especially.plausible.in.clinical.research..
http://www.psypress.com/effect-sizes-for-research-9780415877695

7Introduction
A.partial-sample bias.(or.bias.from.differential attrition).occurs.when.participants.who.drop.out.of.a.study.would.have.contributed.results.that.are.different.from.the.results. from. remaining. participants.. Researcher-allegiance bias. occurs. when. a.researcher. favors.one.of. the. treatments. that.are.being.compared.and. the.favorit-ism.results.in.the.preferred.treatment.being.given.an.unintended.advantage.in.the.conduct.of.the.study..For.example,.compared.to.the.not-favored.treatment,.a.favored.treatment.may.be.administered.more.effectively.by.more.experienced.and.more.motivated.practitioners.of.that.treatment.
A. wait-list-control-group bias. can. occur. in. comparative. psychotherapeutic.studies.in.which.those.of.the.volunteers.who.are.randomly.assigned.to.treatment.receive.treatment.promptly.whereas.those.who.are.randomly.assigned.to.be.con-trols.have.to.wait.before.being.treated.so.that.nontreatment.data.can.be.collected.from.them.for.the.purpose.of.comparison.with.data.from.those.who.have.already.been.treated..Patients.who.are.treated.promptly.have.an.opportunity.to.improve.not.only.from.any.direct.benefits.of.treatment.but.also.from.any.placebo effect.that. they.gain.from.their.expectation.that. they.will.get.better.because.they.are.receiving.professional.help..On.the.other.hand,.members.of.the.waiting.control.group.not.only.receive.no.treatment.prior.to.the.collection.of.outcome.data.but.they.may.well.have.a.negative.expectancy.about.their.condition.because.they.are.disappointed.by.this.fact,.perhaps.to.the.point.of.being.demoralized.and.having.their.condition.deteriorate..Negative.expectancy.and.anxiety.about.possible.risks.from.treatment,.such.as.drugs.or.surgery,.can.cause.some.people.to.experience.adverse.effects..Such.an.experience.is.called.a.nocebo effect.
Effect.sizes.for.treatments.versus.control.comparison.groups.may.be.reduced.to.the.extent.that.receipt.of.treatment.is.perceived.as.probable.by.participants.in.control.groups..Particularly,.signing.an.informed-consent.form.can.enhance.the.perceived.probability.of.treatment.and,.therefore,.enhance.a.placebo.effect.in.such.comparison.groups..Lipman.(2008a).provided.a.concise.discussion.of.factors.that.can.influence.the.extent.of.a.medical.placebo.effect..In.any.study.that.estimates.an.effect.size.for.treatment.versus.control,.or.compares.two.or.more.such.effect.sizes,. the. strength. of. the. placebo(s). must. be. considered. when. interpreting. the.effect.size(s)..Also,.a.nocebo.effect.can.influence.an.effect.size.in.a.study.in.which.a.nocebo.effect.is.greater.for.one.treatment.than.another.
In.applied.experimental.research.the.usefulness.of.an.estimate.of.effect.size.depends.on.the.external validity.of. the.results,.which.is. the.generalizability.of.the.results.to.the.kind.of.population.to.which.the.researcher.intended.to.apply.the.results..For.example,.in.randomized clinical trials.(RCTs,.more.generally.random-ized controlled trials. or.experimental designs),. research. reports. should. clearly.describe.such.factors.as.the.research.setting,.criteria.for.inclusion.and.exclusion.for.forming.the.pool.of.prospective.participants.from.which.random.assignment.was.made,.demographics. and.clinically. relevant.baseline.characteristics.of. the.participants,. nature. of. any. background. treatment. other. than. the. treatment. on.which.the.experiment.is.based,.strength.and.duration.of.the.treatment,.timing.of.the.measurement.of.the.outcome.(follow-up?),.attrition.or.removal.of.participants,.adverse.effects,.reliability.of.the.scores.(Chapter.4),.and.clinical.relevance.of.the.
http://www.psypress.com/effect-sizes-for-research-9780415877695

8 Effect Sizes for Research: Univariate and Multivariate Applications
measure.of.the.dependent.variable.in.cases.in.which.they.are.indirect.measures.of.the.patient’s.problem..Also.relevant.are.the.levels.of.expertise.of.those.who.are.administering.the.treatment(s)..(In.RCTs,.in.contrast.with.observational studies.that.are.discussed.in.Chapter.8,.participants.are.randomly.assigned.to.conditions.[e.g.,.treatment,.control,.placebo].to.reduce.the.chance.that.groups.will.differ.at.baseline.with.respect.to.variables.that.might.influence.the.results.[confounding variables,.e.g.,.gender,.age].other.than.the.variable(s).that.the.researcher.intends.to.vary.[independent variables].)
There.may.be.important.differences.between.characteristics.of.the.participants.in.research.and.the.people.to.whom.the.results.of.research.are.to.be.applied.later.(e.g.,.health.and.age. in.clinical. research)..Therefore,.even. the. results.of. research.that.used.random.assignment.should.be.said.to.provide.evidence.of.the.efficacy.of.treatments,.not.direct.evidence.of. the.effectiveness.of. treatments..Efficacy. is. the.potential.for.effectiveness.of.a.treatment.in.the.realm.of.clinical.practice.because.of.promising.results.for.that.treatment.in.earlier.clinical.research..The.effectiveness.of.a.treatment.is.a.matter.of.its.success.in.actual.applied.settings.(e.g.,.clinical.settings)..For.example,.many.medical.journals.endorse.a.common.set.of.standards.of.quality.for.RCTs.known.by.the.acronym.CONSORT.(Consolidated Standards of Reporting Trials)..These.standards.emphasize.the.internal validity.of.a.clinical.trial,.which.addresses.the.issue.of.whether.the.results.are.correctly.attributable.to.the.treatment.variable.because.of.control.of.extraneous.variables.that.could.have.influenced.the.results..The.greatest.benefit.of. random.assignment. is. to.bolster. internal.validity..Also,.nonrandom.attrition.of.participants.can.undo.the.initial.equality.of.samples.with.respect.to.relevant.variables.in.research.with.random.assignment.
Tips and PitfallsMethods.sections.of.reports.of.experimental.studies.should.go.beyond.merely.stating.that.participants.were.randomly.assigned.to.groups.because.what.happens.to.partici-pants.between.the.time.of.their.random.assignment.and.the.collection.of.data.can.greatly.influence.the.effect.sizes.and.conclusions.from.the.study..Medical.research-ers.are.setting.a.good.example.of.becoming.very.much.aware.of.this.issue..Reports.of.RCTs.increasingly.have.come.to.distinguish.among.three.criteria.for.the.inclusion.or.exclusion.of.data..First,.there.is.the.controversial.intent-to-treat.(or.intention-to-treat),.in.which.the.data.from.all.those.were.assigned.to.a.condition.are.to.be.included.in.the.analysis.whether.or.not.they.received.full.treatment.or.any.treatment..Second,.there.is.the.per-protocol.criterion,.in.which.only.data.from.those.who.participated.fully.are.included..Third,.there.is.modified intent-to-treat,. in.which.data.from.all.patients.assigned.to.a.condition.are.to.be.considered.for.inclusion,.whether.or.not.the.patients.received.treatment,.but.some.data.are.to.be.excluded.based.on.a.pre-determined.criterion.such.as.postrandomization.discovery.of.a.preexisting.disease.in.a.patient.other.than.the.disease.targeted.by.the.treatment..Fidler,.Faulkner,.and.Cumming.(2008).discussed.estimation.of.effect.sizes.and.construction.of.confidence.intervals.for.effect.sizes.for.intention-to-treat.and.per-protocol.analyses.
The.best.way. to.compare. treatments. is. in.a.head-to-head.comparison. in.an.experiment.. However,. in. some. areas. of. research,. such. as. those. that. study. the.
http://www.psypress.com/effect-sizes-for-research-9780415877695

9Introduction
efficacy.of.a.drug.for.attention-deficit.hyperactivity.disorder,.direct.comparison.of.alternative.treatments.is.infrequent..Instead.the.typical.study.compares.a.drug.with.a.placebo..In.such.cases.one.can.compare.the.(a).effect.sizes.from.experi-ments.that.involved.drug.a.and.a.placebo.and.(b).effect.sizes.from.experiments.that.involved.drug.b.and.a.placebo..Such.is.one.of.the.uses.of.effect.sizes,.but.the.usefulness.of.these.comparisons.depends.on.the.essential.features.of.the.studies.of.drug.a.and.drug.b.being.comparable..The.comparison.of.effect.sizes.can.be.undertaken.using.meta-analysis,.which.is.discussed.later.in.this.chapter..To.make.an. inference.about. the.optimal.or. sufficient.magnitude.of.a. treatment,. such.as.duration.of.therapy.or.dose.of.a.drug,.primary.researchers.can.compare.the.esti-mates.of.effect.size.at.each.level.of.magnitude.of.the.treatment.
Any.effect.size.that.is.chosen.from.possible.alternatives.should.be.technically.appropriate.while.being. comprehensible. to.policy.makers,. such. as. educational.or.health.officials.who.want.to.apply.the.results.to.some.practical.problem,.and.be.minimally.influenced.by.factors.other.than.the.studied.independent.variables..Such.an.ideal.should.be.sought,.but,.as.can.be.learned.from.the.interpretations.of.various.effect.sizes.in.this.book,.very.difficult.to.realize.fully..For.a.review.of.the.history.of.effect.sizes.refer.to.Huberty.(2002).
Controversy About null-hypothesis signifiCAnCe testing
It.can.be.argued.that.readers.of.a.report.of.applied.research.that.involves.control.or.placebo.groups,.or.that.involves.treatments.whose.costs.are.different,.have.a.right.to.be.informed.of.estimates.of.effect.sizes..Some.may.even.argue.that.not.reporting. such. estimates. in. an. understandable. manner. to. those. who. apply. the.results. of. research. in. such. cases. (e.g.,. educators,. health. officials,. managers. of.trainee.programs,.clinicians,.governmental.officials).is.a.kind.of.withholding.of.evidence.. Indeed,. the. reporting.of.effect. sizes.has.been. likened. to. telling.“the.truth,.the.whole.truth,.and.nothing.but.the.truth”.(Zakzanis,.2001)..Increasingly,.editors.of.journals.that.publish.research.are.recommending,.or.requiring.(but.not.necessarily. enforcing),. the. reporting.of. estimates. of. effect. sizes..For. example,.the.American.Psychological.Association.and.the.American.Educational.Research.Association. recommend,. and. the. Journal of Educational and Psychological Measurement.and.at.least.22.other.journals.as.of.the.time.of.this.writing.require,.the.reporting.of.such.estimates.
Tips and PitfallsThere.is.disagreement.regarding.when.estimates.of.effect.sizes.should.be.reported..On.the.one.hand.is.the.view.that.traditional.NHST.is.meaningless.because.no.nil.hypothesis.(i.e.,.no.difference.or.zero.correlation).can.be.literally.true.(at. least.for.populations.of.infinite.size.measured.on.continuous.variables)..For.example,.according.to.this.view.no.two.or.more.population.means.can.be.exactly.equal.to.all.decimal.places..(Consult.Mulaik,.Raju,.&.Harshman,.1997,.for.an.opposing.view.).Therefore,.from.this.point.of.view.that.implies.that.no.effect.size.can.be.
http://www.psypress.com/effect-sizes-for-research-9780415877695

10 Effect Sizes for Research: Univariate and Multivariate Applications
exactly.zero,.the.task.of.a.researcher.is.to.estimate.the.size.of.this.“obviously”.nonzero.effect..Those.who.are.in.this.camp.believe.that.not.reporting.an.effect.size.when.the.researcher.concludes.that.the.results.are.statistically.“insignificant”.is.equivalent.to.treating.such.effect.sizes.as.if.they.were.known.to.be.equal.to.zero.when.in.fact.they.are.not.known.to.be.equal.to.zero..(From.the.review.of.the.magnitudes.of.many.obtained.effect.sizes.by.Lipsey.and.Wilson.[1993],.Hunter.and.Schmidt.[2004].estimated.that.99.3%.of.the.null-hypothesized.0.differences.from.research.on.psychological.treatments.are.wrong.[although.it.is.possible.that.this.percentage.is.somewhat.positively.biased].).The.opposite.opinion.is.that.sig-nificance.testing.is.paramount.and.that.effect.sizes.are.to.be.reported.only.when.results.are. found. to.be.statistically.significant..For. further.discussions. relating.to.this.debate.consult.Anderson,.Burnham,.and.Thompson.(2000),.Barnette.and.McLean.(1999),.Browne.(2010),.Carver (1978),.Cortina.and.Landis.(in.press),.Fan.(2001),.Hedges.and.Olkin.(1985),.Howard.et.al.,.(2009a,b),.Hunter.and.Schmidt.(1990),. Knapp. (2003),. Knapp. and. Sawilowsky. (2001),. Levin. and. Robinson.(2003), Onwuegbuzie. and. Levin. (2003,. 2005),. Roberts. and. Henson. (2003),.Robinson.and.Levin.(1997),.Rosenthal,.Rosnow,.and.Rubin.(2000),.Rosnow.and.Rosenthal. (1989),. Sawilowsky. (2003a,. 2003b,. 2007a),. Sawilowsky. and. Yoon.(2002),.Snyder.and.Lawson.(1993),.Staines.and.Cleland.(2007),.Thompson.(1996,.2007),.Vacha-Haase.and.Thompson.(2004),.and.the.articles.in.volume.33.(2004).of.the.Journal of Economics.
As. we. discuss. in. Chapters. 3. and. 6,. many. estimators. of. effect. size. tend. to.overestimate.effect.sizes.in.the.population,.overestimation.that.is.called.positive.or.upward bias..A.major.question.that.is.debated.is.whether.or.not.this.upward.bias. of. estimators. of. effect. size. is. large. enough. (it. is. often. very. small. except.when.sample.sizes.are.very.small).so.that.the.reporting.of.a.bias-based.nonzero.estimate.of.effect.size.will.seriously.inflate.the.overall.estimate.of.effect.size.in.a.field.of.study.when.the.null.hypothesis.is.true.(i.e.,.there.is.actually.zero.effect.in. the.population).and. the. results. are. statistically. insignificant..Those.who.are.not.concerned.about.such.bias.urge.the.reporting.of.all.effect.sizes,.statistically.significant.or.not.significant,.to.improve.the.accuracy.of.meta-analyses..Their.rea-soning.is.that.such.reporting.will.avoid.the.problem.of.inflating.overall.estimates.of.effect. size. in. the. literature. that.would. result. from.not. including. the.smaller.effect.sizes.that.arise.from.primary.studies.whose.results.did.not.attain.statistical.significance.
Some.are.of.the.opinion.that.effect.sizes.are.more.important.in.applied.research,.in.which.one.may.be.interested.in.whether.or.not.the.effect.size.is.estimated.to.be.large.enough.to.be.of.practical.use..In.contrast,.in.theoretical.research.one.may.only.be.interested.in.whether.or.not.results.support.a.theory’s.prediction,.say,.for.example,.that.mean.a.will.be.greater.than.mean.b..In.cases.in.which.it.is.obvious.that.a.traditional.null.hypothesis.that.posits.a.value.of.0.for.a.parameter.is.wrong.the.research.should.address.the.question.of.how.far.from.0.the.parameter.is.by.estimating.an.effect.size..For.example,.it.is.obvious.that.in.the.general.population.the.size.of.children’s.vocabularies.is.positively.correlated.with.their.age.(rpop.>.0),.
http://www.psypress.com/effect-sizes-for-research-9780415877695
11Introduction
so.research.in.that.area.would.most.usefully.focus.on.constructing.a.confidence.interval.for.the.effect.size,.rpop,.as.is.discussed.in.Chapter.4..In.cases.in.which.a.parameter.is.obviously.not.zero,.one.can.also.test.a.null.hypothesis.that.posits.that.the.parameter.is.equal.to.some.specified.nonzero.value.or.conduct.equivalence.testing.as.is.discussed.in.Chapters.2,.5,.and.8.
purpose of this book
It.is.not.necessary.for.this.book.to.discuss.the.controversy.about.NHST.further.because.the.purpose.of.this.book.is.to.inform.readers.about.a.variety.of.measures.of.effect. size.and. their.proper.applications.and. limitations..Regardless.of.one’s.position.about.NHST,.most.researchers.agree.that.estimates.of.effect.size.are.often.important.for.interpreting.and.reporting.results..One.reason.that.a.variety.of.effect.size.measures.is.needed.is.that.different.kinds.of.measures.are.appropriate.depend-ing.on.whether.variables.are.scaled.categorically,.ordinally,.or.continuously.(and.also.sometimes.depending.on.certain.characteristics.of.the.sampling.method,.and.the.research.design.and.purpose,.that.are.discussed.where.pertinent.in.later.chap-ters)..The.results.from.a.given.study.often.lend.themselves.to.more.than.one.type.of.measure.of.effect.size..These.different.measures.can.sometimes.provide.very.different,.even.conflicting,.perspectives.on.the.results..Consumers.of.the.results.of.research,. including.editors.of. journals,. those. in. the.news.media.who.convey.results. to. the.public,.and.patients.who.are.giving.supposedly. informed.consent.to.treatment,.often.need.to.be.made.aware.of.the.results.in.terms.of.alternative.measures.of.effect.sizes.to.guard.against.the.possibility.that.biased.or.unwitting.researchers.have.used.a.measure.that.makes.a.treatment.appear.to.be.more.effec-tive.than.another.measure.would.have.done..Some.of.the.topics.in.Chapter.8.exem-plify.this.issue.particularly.well..Also,.alternative.measures.should.be.considered.when.the.statistical.assumptions.of.traditional.measures.are.not.satisfied.
Data.sets.can.have.complex.characteristics..For.example,.traditionally.research-ers.have.focused.on.the.effects.of.independent.variables.on.just.one.characteristic.of.distributions.of.data,.their.centers,.such.as.their.means.or.medians,.representing.the.effect.on.the.typical.(average).participant..However,.a.treatment.can.also.have.an.effect.on.aspects.of.a.distribution.other.than.its.center,.such.as.its.tails.(Chapter 5)..Treatment.can.have.an.effect.on.the.center.of.a.distribution.and/or.the.variability.around.that.center..For.example,.consider.a.treatment.that.increases.the.scores.of.some.experimental-group.participants.and.decreases.the.scores.of.others.in.that.group,.a.treatment.×.subject interaction..The.result.is.that.the.variability.of.the.experimental.group’s.distribution.will.be.larger.or.smaller.(may.be.greatly.so).than.the.variability.of.the.control.or.comparison.group’s.distribution..Whether.there.is.an.increase.or.decrease.in.variability.of.the.experimental.group’s.distribution.depends.on.whether.it.is.the.higher-.or.lower-performing.participants.who.are.improved.or.worsened.by.the.treatment..In.such.cases.the.centers.of.the.two.distributions.may.be.nearly.the.same.whereas.the.treatment.in.fact.has.had.an.effect.on.the.tails.of.a.distribution..However,.it.is.quite.likely.that.a.treatment.will.have.an.effect.on.both.the.center.and.
http://www.psypress.com/effect-sizes-for-research-9780415877695

12 Effect Sizes for Research: Univariate and Multivariate Applications
the.variability.of.a.distribution.because.it.is.common.to.find.that.distributions.that.have.higher.means.than.other.distributions.also.have.the.greater.variabilities.
As. is.demonstrated. in. later.examples. in. this.book,.by.applying.a.variety.of.appropriate.estimates.of.measures.of.effect.size.to.the.same.set.of.data,.research-ers.and.readers.of.their.reports.can.gain.a.broader.perspective.on.the.effects.of.an. independent. variable.. In. some. later. examples. we. observe. that. examination.of.estimates.of.different.kinds.of.measures.of.effect.size.can.greatly.alter.one’s.interpretation.of.results.and.of.their.importance..Also,.any.appropriate.estimate.of.effect.size.that.a.researcher.has.calculated.must.be.reported.in.order.to.guard.against.a.biased.interpretation.of.the.results..However,.we.acknowledge,.as.will.be.observed.from.time.to.time.in.this.book,.that.there.can.be.disagreement.among.experts.about.the.appropriate.measure.of.effect.size.for.certain.kinds.of.data.
There.are.several.excellent.books.that.discuss.effect.sizes..Although.this.book.cites. this. work. when. relevant,. most. of. these. books. treat. the. topic. in. a. differ-ent.context.(power.analysis.or.meta-analysis).and.for.a.purpose.that.is.different.from the.purpose.of.this.book,.as.we.briefly.discuss.in.the.next.two.sections.of.this.chapter.
power AnAlysis
Some. books. consider. effect. sizes. in. the. context. of. estimation. of. statistical.power.for.determining.needed.sample.sizes.for.planned.research.(Cohen,.1988;.Kraemer &.Thiemann,.1987;.Murphy.&.Myors,.2008)..The.power.of.a.statisti-cal.test.is.the.probability.that.use.of.the.test.will.lead.to.rejection.of.a.false.H0..Statistical.power.decreases.as.population.effect.size.decreases.and.increases.as.sample.size.increases,.so.deciding.the.minimum.effect.size.that.one.is.interested.in.having.one’s.research.detect.is.very.important.for.researchers.who.are.plan-ning. research..Books.on.power.analysis.are.very.useful. for.planning. research,.as. they. take. into. account.power-determining. factors. such.as. the.magnitude.of.effect.that.the.research.is.intended.to.detect,.the.researcher’s.adopted.alpha.level,.likely.variances.(influenced.by.factors.that.are.discussed.in.this.book.such.as.the.research.design.and.the.reliability.of.the.scores),.and.maximum.available.sample.sizes..(The.use.of.such.factors,.including.expected.effect.size,.to.estimate.needed.sample.sizes.is.an.example.of.what.is.called.a.frequentist.approach..Discussion.of.an.alternative.Bayesian.approach.to.estimating.needed.sample.size.can.be.found.in.Pezeshk,.Maroufy,.and.Gittens.[2009].)
The. report. by. the. American. Psychological. Association’s. Task. Force. on.Statistical.Inference.urged.researchers.to.report.obtained.estimates.of.effect.sizes.to.facilitate.future.power.analyses.in.a.researcher’s.field.of.interest.(Wilkinson.&.APA.Task.Force.on.Statistical.Inference,.1999)..(However,.an.appropriate.kind.of.effect.size.for.power.analysis.may.sometimes.not.be.an.appropriate.kind.of.effect.size.for.data.analysis.[Feingold,.2009;.Raudenbush.&.Liu,.2001].).Free.applets.for.calculating.power.and.estimating.needed.sample.sizes.for.planned.research.are.available,.courtesy.of.Russell.Lenth.(2006),.at.http://www.stat.iowa.edu/~rlenth/Power/.
http://www.psypress.com/effect-sizes-for-research-9780415877695
13Introduction
repliCAtion And metA-AnAlysis
A.single.study.is.rarely.definitive..Several.books.cover.estimation.of.effect.sizes.in.the.context.of.meta-analysis..Meta-analytic.methods.are.procedures.for.quan-titatively.summarizing.the.effect.sizes.from.a.set.of.related.research.studies.in.a.specific.area.of.research.(replicated,.i.e.,.repeated,.studies)..“Meta”.in.this.context.means.“beyond”.or.“more.comprehensive.”.Synonyms.for.meta-analyzing.such.sets.of.effect.sizes.include.quantitatively integrating,.combining,.synthesizing,.or.cumulating.them..Again,.each.individual.study.in.the.set.of.meta-analyzed.stud-ies.is.called.primary.research..In.many.applied.areas,.such.as.medical.practice,.effect. sizes. from.meta-analyses.are.becoming.major.determinants.of. the. treat-ments.that.are.considered.to.constitute.the.best evidence-based practice.
Replicating.studies.means.replicating.methods,.but.does.not.necessarily.mean.obtaining. replicated.results,. as.we.discuss. later.with. regard. to.what.are.called.moderator.variables..Ioannidis.(2005).discussed.many.factors.that.can.influence.the.probability.that.a.finding.from.a.single.study.is.true.(critique.by.Goodman &.Greenland,. 2007).. Vickers’. (2006,. 2008a). discussions. of. errors. in. recording.and.entering.data.further.support. the.need.for.replication.of. important.studies..Schmidt.(2009).discussed.different.meanings.and.implementations.of.replication.and.offered.recommendations.
Among.other.procedures,.an.early.form.of.meta-analysis.includes.testing.for.homogeneity. (i.e.,. equality). of. the. estimates.of. effect. size. from.each.primary.study. using. the. Q. statistic. or. more. recently. proposed. alternatives,. such. as. I2.(Borenstein. et. al.,. 2009).. In. the. traditional. meta-analytic. method,. if. the. esti-mated. effect. sizes. from. the. primary. (i.e.,. underlying). studies. are. declared. to.be. homogeneous,. they. are. averaged. (weighting. each. primary. estimate. by. the.inverse. of. its. sampling. variance). to. make. the. best. estimate. of. the. effect. size.in. the. population.. If. the. primary. estimates. are. declared. to. be. heterogeneous.(unequal),.the.meta-analyst.in.this.type.of.meta-analysis.then.tests.for.modera-tor variables. that. may. be. responsible. for. the. varying. effect. sizes.. Moderator.variables.may.be.found.to.be.varying.characteristics.of.the.participants.across.the. primary. studies. (e.g.,. gender,. age,. ethnicity,. educational. level,. or. severity.of.illness).or.varying.kinds.of.designs.across.the.primary.studies.(e.g.,.experi-mental.versus.nonexperimental.designs.or.between-groups.versus.within-groups.designs)..Hunter.and.Schmidt.(2004).generally.opposed.testing.for.homogeneity.of.effect.sizes.(also.consult.Schmidt,.Oh,.and.Hayes,.2009)..Construction.of.confi-dence.intervals.for.the.population.effect.size.estimated.from.a.meta-analysis.can.also.be.very.informative,.but.problematic.methods.of.meta-analysis.may.result.in. greatly. overstated. confidence. levels. (Bonett,. 2009a;. Schmidt. et. al.,. 2009)..The.construction.of.confidence.intervals.from.primary.research.is.discussed.in.Chapter.2.and.thereafter.throughout.this.book.
Among.other.factors,.the.accuracy.of.a.meta-analysis.depends.on.the.represen-tativeness.of.the.primary.studies.on.which.it.is.based..Meta-analyses.in.many.areas.may.overestimate.effect.size.because.some.studies.with.effect.sizes.that.are.truly.nonzero,.but.still.too.small.to.attain.statistical.significance,.will.have.been.excluded.
http://www.psypress.com/effect-sizes-for-research-9780415877695

14 Effect Sizes for Research: Univariate and Multivariate Applications
from.the.literature.because.of.publication.bias.(Ferguson.&.Brannick,.in.press).and.outcome.reporting.bias..Consult.Borenstein.et.al..(2009).for.further.discussion.
Tips and PitfallsTo.accommodate.readers.of.reports.of.primary.research,.especially.readers.who.are.meta-analysts,.authors.of.such.reports.should.not.only.include.an.estimate.of.effect.size.but.also.provide.all.of. the.summary.statistics.(e.g.,.means.and.vari-ances.in.many.cases).that.readers.may.need.to.be.able.to.calculate.their.preferred.estimators.of.effect.size,.which.may.not.be.the.type.that.was.reported..Reporting.effect.sizes.enables.more.informative.comparison.of.results.with.earlier.reported.results.and.facilitates.any.later.meta-analysis.of.such.results..Meta-analyses.that.use.previously.reported.effect.sizes.that.had.been.directly.calculated.by.primary.researchers. on. their. raw. data. will. be. more. accurate. than. those. that. are. based.on.effect. sizes. that.had. to.be. retrospectively. estimated.by.meta-analysts.using.approximately.accurate.equations. to.convert. the.primary. studies’. reported. test.statistics.to.estimates.of.effect.size..Effect.sizes.are.often.not.reported.in.older.articles.or. in.articles. that. are.published. in. journals. that.do.not. strictly. require.such.reporting,.nor.are.raw.data.typically.conveniently.available.to.meta-analysts..Therefore,. as. previously. mentioned,. books. on. meta-analytic. methods. include.equations. for. converting. previously. reported. test. statistics. into. individual. esti-mates.of.effect.size.that.meta-analysts.can.then.average.
For.those.who.do.not.have.access.to.the.raw.data,.Walker.(2005).provided.IBM.SPSS.syntax.for.calculating.many.estimates.of.effect.sizes.for.the.univariate.and.multivariate.cases.of. two. independent.groups.either. from. test. statistics. (e.g.,. t).or.from.descriptive.statistics..Again,.when.raw.data.are.available,.more.accurate.estimation.of.effect.sizes.can.be.made.using.the.equations.in.this.book.
Consider.a.set.of.primary.studies.in.each.one.of.which.the.dependent.variable.is.some.measure.of.mental.health.and. the. independent.variable. is.membership.in.either.a.treated.group.or.a.control.group..Most.such.studies.yield.a.moderate.value.for.estimated.effect.size.(i.e.,.therapy.usually.seems.to.help,.at.least.mod-erately),.some.yield.a.high.or.low.positive.value.(i.e.,.therapy.seems.to.help.very.much.or.very.little),.and.a.very.small.number.of.studies.yield.a.negative.value.for.the.effect.size,. indicating.possible.harm.from.the.therapy..Again,.no.one.piece.of.primary.research.is.necessarily.definitive.in.its.findings.because.of.sampling.variability.and.the.previously.discussed.possibly.moderating.variables.that.vary.among.the.individual.studies,.factors.such.as.the.nature.of.the.therapy,.diagnostic.and.demographic. characteristics.of. the.participants. across. the. studies,. kind.of.test.of.mental.health,.and.characteristics.of.the.therapists..An.early.example.of.a.meta-analysis.is.the.averaging.of.the.effect.size.estimates.from.many.such.studies.by.Smith.and.Glass.(1977)..Consult.Staines.and.Cleland.(2007).for.a.discussion.of.possible.biases.of.underestimation.and.overestimation.of.effect.sizes.in.primary.and.meta-analytic.studies.
Because.the.focus.of.this.book.is.on.direct.estimation.of.effect.sizes.from.the.raw.data.of.a.primary.research.study,.there.will.only.be.occasional.mention.of.meta-analysis.in.later.chapters..There.are.several.approaches.to.meta-analytic methods..
http://www.psypress.com/effect-sizes-for-research-9780415877695

15Introduction
Books. that. cover. these. methods. include. those. by. Borenstein. et. al.. (2009). and.Hunter.and.Schmidt.(2004)..The.journal.Research Synthesis Methods.is.devoted.to.methodology.in.meta-analysis.and.related.topics.
Assumptions of test stAtistiCs And effeCt sizes
When.statisticians.create.a.new.test.statistic.or.measure.of.effect.size.they.often.do.so.for.populations.that.have.certain.characteristics,.which.are.called.assump-tions..For.the.t. test,.F. test,.and.some.common.examples.of.effect.sizes,.two.of.these.assumptions.are.that.the.populations.from.which.the.samples.are.drawn.are.normally.distributed.and.have.equal.variances..The. latter.assumption. is.called.homogeneity of variance.or.homoscedasticity. (the. latter.from.Greek.words.for.“same”.and.“scattered”)..When.data.come.from.populations.with.unequal.vari-ances.this.violation.of.homoscedasticity.is.called.heterogeneity of variance.or.het-eroscedasticity..When.researchers.use.statistical.tests.whose.developers.assumed.homoscedasticity,.the.researchers.are.likely.not.strictly.holding.this.assumption.but.are.assuming.that.the.populations.do.not.differ.enough.in.their.variances.to.invalidate. the. results. of. the. test.. However,. many. statistical. tests. may. be. more.sensitive.to.seemingly.small.violations.of.assumptions.than.researchers.realize..Throughout.this.book.we.observe.how.violation.of.assumptions.can.affect.estima-tion.and.interpretation.of.effect.sizes,.and.we.discuss.some.alternative.methods.that. accommodate. such. violations.. There. is. a. trend. toward. the. use. of. modern.methods. that. are. more. robust. against. violation. of. assumptions.. (However,. we.observe.later.in.this.book.that.interpretation.of.inferential.statistics.that.involve.robust.alternatives.to.the.mean.and.variance.can.sometimes.be.problematic.)
Tips and PitfallsOften.a.researcher.asserts.that.an.effect.size.that.involves.the.degree.of.difference.between.two.means.(Chapter.3).is.significantly.different.from.zero.because.sig-nificance.was.attained.when.comparing.the.two.means.by.a.t.test..However,.suf-ficient.nonnormality.and.heteroscedasticity.can.result.in.the.shape.of.the.actual.sampling. distribution. of. the. test. statistic. departing. sufficiently. from. the. theo-retical.sampling.distribution.of.t.(or.F).so.that,.unbeknownst.to.the.researcher,.the. actual. p. value. for. the. result. is. importantly. different. from. the. p. value. that.is.observed. in.a.printout..Even.slight.nonnormality.can. lower.statistical.power.greatly.(e.g.,.Wilcox,.2008a),.and.nonnormality.can.also. inflate. the.probability.of.rejecting.a.true.null.hypothesis.(Type.I.error).(Keselman,.Algina,.Lix,.Wilcox, &.Deering,.2008)..Also,.we.observe.in.Chapter.3.that.the.usual.interpretation.of.a.widely.used. effect. size. involving. the.difference.between. two.means. is. invalid.under.nonnormality.
It.is.well.known.that.the.rate.of.Type.I.error.for.the.t.test.and.F.test.is.increased.in.the.case.of.unequal.sample.sizes.if.sample.sizes.and.variances.of.populations.are.negatively.related,.regardless.of.normality.and.sample.sizes.(e.g.,.Keselman.et.al.,.2008)..Also,.even.if.sample.sizes.are.equal.and.there.is.normality,.when.samples.are.small.enough.(maybe.each.n.≤.7),.heteroscedasticity.can.inflate.the.
http://www.psypress.com/effect-sizes-for-research-9780415877695

16 Effect Sizes for Research: Univariate and Multivariate Applications
rate.of.Type.I.error.for.the.independent-groups.t.test.beyond.what.is.indicated.by.the.observed.p.value.(Ramsey,.1980;.also.consult.Algina,.Oshima,.&.Lin,.1994).
Tips and PitfallsTraditionally,.many.researchers.have.not.been.concerned.about.heteroscedasticity.unless.ratios.of.sample.variances.exceeded.3,.but.even.under.slight.nonnormality.a.ratio.of.variances.in.the.population.as.low.as.1.5.can.cause.the.t.test.to.begin.to.falter..In.this.case.a.ratio.of.variances.in.the.population.that.is.equal.to.1.5.can.result.in.an.apparent.p.<..05.masking.an.actual.p.=..075.for.the.t.test.(Reed.&.Stark,.2004)..Considering.the.relatively.low.power.of.traditional.tests.of.homosce-dasticity.(Grissom,.2000),.a.ratio.of.variances.in.the.population.that.is.equal.to.1.5.would.likely.be.very.difficult.to.detect.
For. references. and. further. discussions. of. the. consequences. of,. and. solu-tions. to,.violation.of.assumptions.on. t. testing.and.F. testing,.consult.Sawilowsky.(2002),.Wilcox.(2005a),.and.Wilcox.and.Keselman.(2003)..When.incorrect.con-clusions. from. research. jeopardize.public. health. and. safety,. a. data. analyst. has. a.special. responsibility. to.deal.with. statistical. assumptions.correctly..Ramsey.and.Ramsey (2007).discussed.the.relative.conservativeness.of.robust.tests.of.equality.of.two.variances.
Christensen.(2005).noted. that. if. results. lead. to. rejection.of.a.nil.hypothesis.it.could.be.that.the.nil.hypothesis.is.indeed.false.or.it.could.mean.only.that.one.or.more.assumptions.have.been.violated..If.the.latter.were.the.case.some.would.argue.that.there.would.thereby.be.insufficient.evidence.that.an.effect.size.involv-ing. the.difference.between. two.means. is.different. from.zero..Christensen.also.discussed.how.in.the.analysis.of.variance.very.small.values.of.F,.which.are.usu-ally.ignored.by.researchers,.or.large.values.of.F,.sometimes.can.be.attributed.to.heteroscedasticity.or.other.problems.with.the.data.
Huberty’s.(2002).article.on.the.history.of.effect.sizes.noted.that.heteroscedas-ticity.is.common.but.has.been.given.insufficient.attention.in.discussions.of.effect.sizes..This.book.attempts.to.redress.this.shortcoming..The.fact.that.nonnormality.and.heteroscedasticity.can.affect.estimation.and.interpretation.of.effect.sizes.is.of.concern.and.discussed.throughout.this.book.because.real.data.often.exhibit.such.characteristics,.as.is.documented.in.the.next.section.
Independence of scores.is.the.very.important.assumption.that.the.probability.of.each.score.in.a.group.is.not.conditional.on.any.other.score.in.the.group..For.example,.in.research.that.compares.the.effectiveness.of.methods.of.teaching.in.elementary.school,.a.disruptive.child.in.a.classroom.will.likely.have.a.low.score.on.the.test.of.achievement.that.is.the.measure.of.the.dependent.variable.and.will.also.likely.cause.a.lowering.of.scores.of.some.other.children.in.the.classroom..In.general,.individual.scores.are.less.likely.to.be.independent.when.treatment.is.administered.to.a.group.jointly. instead.of. individually..Examples.of. the.use.of.such.jointly.treated.groups.include.research.on.group.therapy,.social.interaction,.classrooms.or.sets.of.two.or.more.learners,.and.groups.of.job.trainees..Stevens.(2009). provided. extensive. discussion. of. the. seriousness. of. violation. of. this.assumption,.including.the.facts.that.random.sampling.and.random.assignment.do.
http://www.psypress.com/effect-sizes-for-research-9780415877695

17Introduction
not.eliminate.the.problem..In.the.case.of.tests.for.differences.between.or.among.independent.groups,.such.as.the.between-groups.t.or.F.tests,.it.is.also.assumed.that.the.scores.in.one.group.are.independent.of.(i.e.,.not.conditional.on).the.scores.in.any.other.group,.as. is.discussed. in.Chapter.2..Violation.of. independence.of.scores.can.greatly.inflate.the.rate.of.Type.I.error.(e.g.,.consult.Table.6.1.on.p..220.in.Stevens).and.distort.estimates.of.effect.sizes.by.influencing.variances.
violAtions of Assumptions suggested by reAl dAtA
Unfortunately,.violations.of.assumptions.are.commonly.suggested.by. real.data.and.often.in.combinations.of.violations..Micceri.(1989).presented.many.examples.of.nonnormal.data,.reporting.that.only.approximately.3%.of.data.in.educational.and. psychological. research. have. the. appearance. of. near-symmetry. and. light.tails.as.in.a.normal.distribution..Wilcox.(1996).illustrated.how.two.distributions.can.appear.to.be.normal.and.appear.to.have.very.similar.variances.when.in.fact.they.have.very.different.variances,.even.a.ratio.of.variances.greater. than.10.to.1..Distributions.of.biomedical.and.ecological.data.have.often.been.described.as.lumpy,. irregular,. skewed,.and.heavy-tailed..Because.many.measures.of.depen-dent.variables.in.behavioral.and.biomedical.research.allow.only.positive.values,.positive.skew,.which.is.discussed.later,.is.likely.
Tests.of.normality.differ.in.various.ways,.including.the.characteristics.of.nor-mality.that.they.address.and.the.manner.in.which.they.measure.these.characteris-tics..Seir.(2002).evaluated.the.performances.of.10.tests.of.normality.with.respect.to.their.power.and.rate.of.Type.I.error.for.a.wide.range.of.sample.sizes.and.distri-butions..Thadewald.and.Büning.(2007).reported.comparisons.of.power.of.various.tests. of. normality. depending. on. the. nature. of. the. departure. from. normality..Coin.(2007).reported.that.many.tests.of.normality.were.insensitive.to.nonnormal.symmetrical.distributions.
In.a.review.of. the. literature.Grissom.(2000).noted.that. there.are. theoretical.reasons. to. expect,. and. empirical. results. to. document,. likely. heteroscedasticity.throughout.various.areas.of.research..When.raw.data.that.are.amounts.or.counts.have. some. zeros. (such. as. the. number. of. alcoholic. drinks. consumed. by. some.patients.during.an.alcoholism.rehabilitation.program).group.means.and.variances.are.often.positively.related.(e.g.,.Sawilowsky,.2002)..Therefore,.distributions.for.samples. with. larger. means. often. have. larger. variances. than. those. for. samples.with. smaller. means,. resulting. in. the. possibility. of. heteroscedasticity.. Again,.homoscedasticity. and. heteroscedasticity. are. characteristics. of. populations,. not.samples,.but.these.characteristics.may.not.be.accurately.reflected.by.comparison.of.variances.of.samples.taken.from.those.populations.because.the.sampling.vari-ability.of.variances.is.high..Refer.to.Sawilowsky.for.a.discussion.of.the.implica-tions.of.the.relationship.between.means.and.variances,.including.citations.of.an.opposing.view.
Sample.distributions.with.greater.positive skew.tend.to.have.the.larger.means.and.variances,.again.suggesting.possible.heteroscedasticity..Positive.skew.roughly.
http://www.psypress.com/effect-sizes-for-research-9780415877695
18 Effect Sizes for Research: Univariate and Multivariate Applications
means.that.a.distribution.is.not.symmetrically.shaped.because.its.right.tail.is.more.extensive.than.its.left.tail,.the.opposite.being.true.for.negative skew..Examples.of.positive.skew.include.distributions.of.data.from.studies.of.difference.thresholds.(sensitivity. to.a.change. in.a. stimulus),. reaction. time,. latency.of. response,. time.to.complete.a. task,. income,. length.of.hospital.stay,.and.galvanic.skin.response.(emotional.palm.sweating)..Malgady.(2007).proposed.an.effect.size.for.skew.that.is.based.on.the.value.of.skew.relative.to.its.maximum.possible.value,.so.this.effect.size.ranges.from.0.to.1.
Tips and PitfallsThe.problem.of.heteroscedasticity.is.often.addressed.by.transforming.the.data.to.logarithms.in.an.attempt.to.reduce.the.relationship.between.the.means.and.vari-ances..It.would.be.beyond.the.scope.of.this.book.to.discuss.the.possible.failure.of.results.from.transformed.data.to.apply.to.the.original.data;.results.such.as.p.levels,.confidence.levels,.effect.sizes.(Ruscio,.2008a),.and.inferences.about.main.effects.and.interaction.effects.
There.are.reasons.for.expecting.heteroscedasticity.in.data.from.research.on.the.efficacy.of.a.treatment..First,.a.treatment.may.be.more.beneficial.for.some.partici-pants.than.for.others,.or.even.harmful.for.others..If.this.variability.of.responsive-ness. to. treatment.differs. from.treatment.group.a. to. treatment.group.b.because.of.the.natures.of.the.treatments.that.are.being.compared,.heteroscedasticity.may.result..For.example,.Lambert.and.Bergin.(1994).found.that.there.is.deterioration.in.some.patients.in.psychotherapy,.usually.more.so.in.treated.groups.than.in.con-trol.groups..Mohr.(1995).cited.negative.outcomes.from.therapy.for.some.adults.with.psychosis..Also,.some.therapies.may.increase.the.violence.of.certain.kinds.of.offenders.(Rice,.1997).
Second,.suppose.that.the.measure.of.the.dependent.variable.does.not.sufficiently.cover.the.range.of.the.underlying.variable.that.it.is.supposed.to.be.measuring.(the.latent variable)..For.example,. a.paper-and-pencil. test.of.depression.may.not.be.covering.the.full.range.of.depression.that.can.actually.occur.in.depressives..In.this.case.a.ceiling.or.floor.effect.can.produce.a.greater.reduction.of.variabilities.within.those.groups.whose.treatments.most.greatly.decrease.or.increase.their.scores.
A.ceiling effect.occurs.when.the.highest.score.obtainable.on.a.measure.of.the.dependent.variable.does.not.represent.the.highest.possible.standing.with.respect.to.the.latent.(underlying).variable..For.example,.a.classroom.test.is.supposed.to.measure.the.latent.variable.of.students’.knowledge,.but.if. the.test.is.too.easy.a.student.who.scores.100%.may.not.have.as.much.knowledge.of. the.material.as.is.possible,.and.another.student.who.scores.100%.may.have.even.greater.knowl-edge.that.the.easy.test.does.not.enable.that.student.to.demonstrate..A.floor effect.occurs.when.the.lowest.score.obtainable.on.a.measure.of.the.dependent.variable.does.not.represent.the.lowest.possible.standing.with.respect.to.the.latent.variable..For. example,. a. screening. test. for.memory.disorder.may.be. so.difficult. for. the.participants.that.among.those.memory-impaired.patients.who.score.0.on.the.test.there.may.be.some.who.actually.have.even.a.poorer.memory.than.the.others.who.
http://www.psypress.com/effect-sizes-for-research-9780415877695
19Introduction
scored.0,.but.who.cannot.exhibit.their.poorer.memory.because.scores.below.0.are.not.possible..In.addition.to.lowering.an.estimate.of.effect.size,.a.ceiling.effect.can.inflate.the.rate.of.Type.I.error.
Heteroscedasticity.can.also.result. from.outliers,.which.are. typically.defined.roughly.as.extremely.atypically.high.or.low.scores..Outliers.may.merely.reflect.recording. errors. or. another. kind. of. research. error,. but. they. are. common. and.should.be.reported.as.possibly.reflecting.an.important.effect.of.a.treatment.on.a.small.minority.of.participants,.or.an.indication.of.an.important.characteristic.of.a.small.minority.of.the.participants..(Consult.Vickers,.2006,.for.a.checklist.for.avoiding.recording.errors.and.errors.in.data.entry,.data.analysis,.and.manuscript.preparation.).Outliers.may.arise.from.a.small.sub-population.that.differs.from.a.larger.sub-population.from.which.most.of.the.scores.come.
Wilcox.(2001,.2003).discussed.a.simple.method.for.detecting.outliers.and.also.provided. S-PLUS. and. R. software. functions. for. such. detection. (Wilcox,. 2003,.2005a).. This. method. is. based. on. the. median absolute deviation. (MAD).. The.MAD.is.defined.and.discussed.as.one.of.the.alternative.measures.of.variability.in.the.last.two.sections.of.this.chapter..Wilcox.and.Keselman.(2003).further.dis-cussed.detection.and. treatment.of.outliers.and. their.effect.on.statistical.power..Wilcox’s.code.for.R.software.for.detecting.outliers.is.freely.downloadable.from.http://www-rcf.usc.edu/~rwilcox..Researchers.should.reflect.on.the.possible.rea-sons.for.any.outliers.and.about.what,.if.anything,.to.do.about.them.in.the.analysis.of.their.data..It.is.unlikely.that.a.single.definition.or.rule.for.dealing.with.outliers.will.be.applicable.to.all.data.
An.overview.of.major.developments.in.the.detection.of.outliers.was.provided.by.Hadi,.Imon,.and.Werner.(2009)..Again,.we.are.concerned.about.outliers.here.because.of.the.possibility.that.they.may.result.in.heteroscedasticity.that.can.make.the.use.of.statistical.tests.and.certain.measures.of.effect.size.problematic.
The.assumption.of.homoscedasticity.amounts.to.an.assumption.that.a.ratio.of.variances.in.populations.equals.1..Data.support.the.theoretical.expectation.that.heteroscedasticity.is.common..Wilcox.(1987).found.that.ratios.of.largest.to.small-est.sample.variances,.called.maximum.sample.variance.ratios.(VRs),.exceeding.16.are.not.uncommon,.and.there.are.reports.of.sample.VRs.above.566.(Keselman.et.al.,.1998)..Because.of.the.great.sampling.variability.of.variances.one.can.expect.to.find.some.sample.VRs.that.greatly.exceed.the.population.VRs,.especially.when.sample.sizes.are.small..However,.in.a.study.of.gender.differences.using.ns.>.100,.a.sample.VR.was.approximately.18,000.(Pedersen,.Miller,.Putcha-Bhagavatula, &.Yang,.2002)..Grissom.(2000).found.that.research.reports.in.a.single.issue.of.the.Journal of Consulting and Clinical Psychology.contained.sample.VR.values.of.3.24,.4.00.(several),.6.48,.6.67,.7.32,.7.84,.25.00,.and.281.79.
Groups.that.are.formed.by.random.assignment.are.expected.to.represent,.by.virtue. of. truly. random. assignment,. populations. with. equal. variances. prior. to.treatment..However,.preexisting.groups.often.seem.to.represent.populations.with.different.variances..Humphreys.(1988).discussed.why.gender.differences.in.vari-ability.may.be.more.important.than.gender.differences.in.means.
http://www.psypress.com/effect-sizes-for-research-9780415877695

20 Effect Sizes for Research: Univariate and Multivariate Applications
Tips and PitfallsBecause.treatment.can.affect. the.variabilities.as.well.as.the.centers.of.distribu-tions,.and.because.changes.in.variances.can.be.of.as.much.practical.significance.as.are.changes.in.means,.researchers.should.think.of.variances.not.just.with.regard.to.whether.or.not.their.data.satisfy.the.assumption.of.homoscedasticity,.but.as.infor-mative.aspects.of.treatment.effect..For.example,.Skinner.(1958).predicted.that.pro-grammed.instruction,.contrasted.with.traditional.instruction,.would.result.in.lower.variances.in.achievement.scores..Similarly,.in.research.on.the.outcome.of.therapy.more.support.would.be.given.for.the.efficacy.of.a.therapy.if.it.were.found.that.the.therapy.not.only.results.in.a.“healthier”.mean.on.a.test.of.mental.health,.but.also.in.less.variability.on.the.test.when.contrasted.with.a.control.group.or.alternative.therapy.group..Also,.a.remedial.program.that.is.intended.to.raise.all.participants’.competence. levels. to.a.minimally.acceptable. level.could.be.considered. to.be.a.failure.or.a.limited.success.if.it.brought.the.group.mean.up.to.that.level.but.also.greatly.increased.variability.in.part.by.lowering.the.performance.of.some.partici-pants..For.example,.a.remedial.program.increased.mean.scholastic.performance.but.also. increased.variability. (Bryk,.1977;.Raudenbush.&.Bryk,.1987)..Keppel.(1991).presented.additional.examples.of.treatments.affecting.variances..Bryk.and.Raudenbush.(1988).presented.methods.in.clinical.outcome.research.for.identify-ing.the.patient.characteristics.that.result.in.heteroscedasticity.and.for.separately.estimating.treatment.effects.for. the. identified.types.of.patients..Consult.Wilcox.(2003).and.Singh,.Goyal,.and.Gil.(2010).for.discussions.of.comparing.variances.
exploring the dAtA for A possible effeCt of A treAtment on vAriAbility
Because.treatment.often.has.an.effect.on.variability,.and.unequal.variances.can.influence.the.choice.of.a.measure.of.effect.size,.it.is.worthwhile.to.consider.the.topic.of.exploring.the.data.for.a.possible.effect.of.treatment.on.variability..Also,.as.we.soon.observe,. there.sometimes.are.limitations.to.the.use.of. the.standard.deviation.as.a.measure.of.variability,.and.many.common.measures.of.effect.size.involve.a.standard.deviation.in.their.denominators..Therefore,.in.this.section.we.also.consider.the.use.of.alternative.measures.of.variability.
Tips and PitfallsAn.obvious.approach.to.determining.whether.or.not.a.treatment.has.had.an.effect.on.variability.would.be. to.apply.one.of. the.common. tests.of.homoscedasticity.(typically.outputted.by.statistical.software).to.determine.if.there.is.a.statistically.significant.difference.between.the.variances.of.the.two.samples..This.approach.is. problematic. because. the. traditional. tests. of. homoscedasticity. often. produce.inaccurate. p. values. when. sample. sizes. are. small. (say,. each. sample. n. < 11). or.unequal,. or. distributions. are.not. normal,. and.have. low.power. even.under.nor-mality..However,.Wilcox.(2003,.2005a).provided.an.S-PLUS.software.function.for.a.bootstrap.method.for.comparing.two.variances,.a.method.that.appears. to.produce. accurate. p. values. and. acceptable. power.. A. basic. bootstrap. method. is.
http://www.psypress.com/effect-sizes-for-research-9780415877695
21Introduction
briefly.described.in.Chapter.2..Bonett.(2006).proposed.a.method.for.constructing.a.confidence.interval.for.the.ratio.of.two.standard.deviations.(or.two.variances).for.the.case.of.dependent.groups.under.nonnormality..For.references.and.more.details.about.traditional.tests.of.homoscedasticity.consult.Grissom.(2000).
Sequential teSting
It. is.common,.and.facilitated.by.major.statistical.software.packages,. to. test. for.homoscedasticity.and. then.conduct.or. report.a.conventional. t. test. that.assumes.homoscedasticity.if.the.difference.in.variances.is.not.statistically.significant..Some.of.those.who.require.statistically.significant.results.to.justify.reporting.effect.sizes.for.such.results.might.be.inclined.to.adopt.such.a.sequence.of.testing..(The.same.sequential.method.is.also.common.prior. to.conducting.a.conventional.F. test. in.the.case.of.two.or.more.means.).If.the.difference.in.variances.is.significant,.the.researcher.forgoes.the.traditional.t.test.for.the.Welch.t.test.that.does.not.assume.homoscedasticity,.as.is.discussed.in.Chapter.2..However,. this.sequential.proce-dure.is.problematic.not.only.because.of.likely.low.power.for.the.test.of.homosce-dasticity.but.because.of.the.resulting.increase.in.rate.of.Type.I.error.for.the.test.on.means..A.Type.I.error.defeats. the.goal.of.many.researchers.of.reporting.an.effect.size.only.for.statistically.significant.results..For.discussions.of.the.problem.of.sequential.testing.consult.Sawilowsky.and.Spence.(2007).and.Serlin.(2002)..As.Serlin.noted,.such.inflation.of.Type.I.error.can.also.result.from.the.use.of.a.test.of.symmetry.to.decide.if.a.subsequent.comparison.of.groups.is.to.be.made.using.a.normality-assuming.statistical.test.or.a.nonparametric.test..Recently,.some.stat-isticians.have.come.to.recommend.foregoing.testing.of.assumptions.and.instead.using.a. robust. test,. especially.when. the. robust. test.has. statistical.power. that. is.competitive.with.the.power.of.the.nonrobust.test.when.assumptions.are.satisfied.
Although. traditional. inferential. methods. may. often. not. be. powerful. enough.to.detect.heteroscedasticity.or.yield.accurate.p.values,.researchers.should.at.least.report.s2.for.each.sample.for.informally.comparing.sample.variabilities,.and.per-haps. report.other.measures.of. the. samples’.variabilities,. to.which.we.now. turn.our.attention..These.measures.of.variability.are.less.sensitive.to.outliers.and.skew.than.are.the.traditional.variance.and.standard.deviation,.and.they.can.provide.bet-ter.measures.of.the.typical.deviation.from.average.scores.under.those.conditions..Again,.heteroscedasticity.can.invalidate.some.measures.of.effect.size,.as.will.be.observed.throughout.this.book..Also,.we.note.in.Chapter.3.and.thereafter.that.these.alternative.measures.of.variability.can.also.be.of.use.in.estimating.an.effect.size.
Variance and range
Recall.that.the.variance.of.a.sample,.s2,.is.the.mean.of.squared.deviations.of.raw.scores.from.the.mean:
.s
Y Y
n2
2
=−∑( )
. (1.2)
http://www.psypress.com/effect-sizes-for-research-9780415877695

22 Effect Sizes for Research: Univariate and Multivariate Applications
or,.when.the.variance.of.a.sample.is.used.as.an.unbiased.estimator.of.a.population.variance:
.s
Y Y
n2
2
1=
−
−∑( )
. . (1.3)
The. variance. and. standard. deviation. will. be. observed. in. later. chapters. to. be.involved.in.various.kinds.of.effect.sizes..Unless.otherwise.noted.in.this.book,.s2.will.denote.an.unbiased.estimate.of.population.variance..Observe.in.Equations.1.2 and.1.3.that.one.or.a.few.extremely.outlying.low.or.extremely.outlying.high.scores. can. have. a. great. effect. on. the. variance.. An. outlying. score. contributes.(adds).1. to. the.denominator.while. contributing.a. large. amount. to. the.numera-tor.because.of.its.large.squared.deviation.from.the.mean,.whereas.each.small.or.moderate.score.contributes.1.to.the.denominator.while.contributing.only.a.small.or.moderate.amount.to.the.numerator.
A.statistic.or.a.parameter.is.said.to.be.nonresistant.if.only.one.or.a.few.outliers.can.have.a.relatively.large.effect.on.it..Thus,.the.variance.and.standard.deviation.are.nonresistant..Therefore,.although.presenting.the.sample.variances.or.standard.devi-ations.for.comparison.across.groups.can.be.of.use.in.a.research.report,.researchers.should.consider.additionally.presenting.an.alternative.measure.of.variability.that.is.more.resistant.to.outliers.than.the.variance.or.standard.deviation.is.
Also,.the.median.is.a.more.outlier-resistant.measure.of.a.distribution’s.location.(center). than.is. the.arithmetic.mean.because.the.median,.as. the.middle-ranked.score,.is.influenced.by.the.ranking,.not.the.magnitude,.of.scores..The.mean.of.raw.scores,.as.we.noted.is.true.of.the.variance,.has.a.numerator.that.can.be.greatly.influenced.by.each.extreme.score,.whereas.each.extreme.score.only.adds.1.to.the.denominator..Consult.Wilcox.(2005a).for.a.discussion.of.resistance.and.different.kinds.of.robustness,.and.for.S-PLUS.and.R.software.functions.for.robust.compar-ison.of.two.variances.and.for.constructing.a.confidence.interval.for.σ σ1
222− ,.the.
difference.between.two.populations’.variances..(Unfortunately,.the.terminology.and.connotations.for.“robustness”.are.used.inconsistently. in. the.literature.).We.previously.cited.in.this.chapter.free.access.to.Wilcox’s.code.for.R.
The.range.is.not.very.useful.as.a.measure.of.variability.because.it.is.extremely.nonresistant..The.range,.by.definition,.is.only.sensitive.to.the.most.extremely.high.score.and.the.most.extremely.low.score,.so.the.magnitude.of.either.one.of.these.scores.can.have.a.great.effect.on.the.range..However,.researchers.should.report.the.lowest.and.highest.score.within.each.group.because.it.can.be.informative.to.compare.the.lowest.scores.across.the.groups.and.to.compare.the.highest.scores.across.the.groups..Also,.the.range.can.provide.information.about.possible.floor.or.ceiling.effects.
WinSorized Variance
Among. the. measures. of. variability. within. a. sample. that. are. more. resistant. to.outliers. than. are. the. variance,. standard. deviation,. and. range,. we. consider. the.
http://www.psypress.com/effect-sizes-for-research-9780415877695

23Introduction
Winsorized.variance,.the.MAD,.and.the.interquartile.range,.each.of.which.will.be.observed.in.later.chapters.to.be.applicable,.but.not.widely.used,.for.concep-tualizing.an.effect.size..Calculation.of.one.or.more.of. these.measures.for.each.sample.should.also.be.considered.for.an.informal.exploration.of.a.possible.effect.of.an.independent.variable.on.variability..However,.again.we.note.that.if.groups.have.not.been.randomly.formed,.a.posttreatment.difference.in.variabilities.of.the.samples.may.not.necessarily.be.attributable,.or.entirely.attributable,.to.an.effect.of.treatment..Although.the.measures.of.variability.that.we.consider.here.are.not.new.to.statisticians,.they.are.only.recently.becoming.widely.known.to.researchers.through.the.writings,.frequently.cited.here,.of.Rand.R..Wilcox.
The.steps.that.follow.for.calculating.a.Winsorized variance,.which.is.named.for.the.statistician.Charles.Winsor,.are.clarified.by.the.worked.example.in.the.next.section..To.calculate.the.Winsorized.variance.of.a.sample:
. 1..Order.the.scores.in.the.sample.from.the.lowest.to.the.highest.
. 2..Remove.the.most.extreme..cn.of.the.lowest.scores.and.remove.the.same..cn.of.the.most.extreme.of.the.highest.scores.of.that.sample,.where..c.is.a.proportion.(often..2).and.n.is.the.total.sample.size..If..cn.is.not.an.integer.round.it.down.to.the.nearest.integer.
. 3..Call.the.lowest.remaining.score.YL.and.the.highest.remaining.score.YH.
. 4..Replace.each.of.the.removed.lowest.scores.with..cn.repetitions.of.YL.and.replace.each.of.the.removed.highest.scores.with..cn.repetitions.of.YH,.so.that.the.total.size.of.this.reconstituted.sample.returns.to.its.original.size.
. 5..The.Winsorized.variance,.sw2 ,.is.simply.the.unbiased.variance.(i.e.,.n − 1.
in. the. denominator). of. the. reconstituted. scores.. The. deviation. scores.whose.squares.are.averaged.in.the.Winsorized.variance.are.the.devia-tions. of. the. reconstituted. scores. around. the. arithmetic. mean. of. these.reconstituted.scores.(i.e.,.the.Winsorized mean),.not.around.the.original.mean.
Depending. on. various. factors,. the. amount. of. Winsorizing. (i.e.,. removing. and.replacing).that.is.typically.recommended.is..c.=..10,..20,.or..25..The.greater.the.value.of.c.that.is.used.the.more.the.researcher.is.focusing.on.the.variability.of.the more.central.subset.of.data..For.example,.when..c.=..20,.more.than.20%.of.the.scores.would.have.to.be.outliers.before.the.Winsorized.variance.would.be.influ-enced.by.outliers..Wilcox.(1996,.2003).provided.further.discussion,.references,.and.an.S-PLUS.software.function.(Wilcox,.2003).for.calculating.a.Winsorized.variance.. However,. of. the. alternatives. to. the. nonresistant. s2. that. we. discuss.here,.we.believe.that.sw
2 .may.be.the.most.grudgingly.adopted.by.researchers.for.two.reasons..First,.many.researchers.may.balk.at.the.uncertainty.regarding.the.choice.of.a.value.for.c..Second,.although.Winsorizing.is.actually.a.decades-old.procedure. that.has.been.used.and. recommended.by. respected.statisticians,. the.procedure.may.seem. to.some.researchers. (excluding. the.present.authors). to.be.“hocus-pocus.”.For.similar.reasons.some.instructors.may.refrain.from.teaching.this.method.to.students.because.of.concern.that.it.would.encourage.them.to.devise.
http://www.psypress.com/effect-sizes-for-research-9780415877695

24 Effect Sizes for Research: Univariate and Multivariate Applications
their.own.less.justifiable.methods.for.altering.data..For.a.method.that.is.perhaps.less.psychologically.and.pedagogically.problematic.than.Winsorizing,.but,.as.we.exemplify.in.later.chapters,.also.less.wide-ranging.in.its.possible.applications.to.effect.sizes,.we.turn.now.to.the.MAD.
Median abSolute deViation
The.MAD.for.a.sample.is.calculated.as.follows:
. 1..Order.the.sample’s.scores.from.the.lowest.to.the.highest.
. 2..Find.the.median.score,.Mdn..If.there.is.an.even.number.of.scores.in.a.sample.there.will.be.two.middle-ranked.scores.tied.for.the.median..In.this.case.calculate.Mdn.as.the.mid-point.(arithmetic.mean).of.these.two.scores.
. 3..For.each.score.in.the.sample.find.its.absolute.deviation.from.the.sample’s.median.by. successively. subtracting.Mdn. from.each.Yi. score,. ignoring.whether.each.such.difference.is.positive.or.negative,.to.produce.the.set.of.deviations.|Y1.−.Mdn|,.…,.|Yn.−.Mdn|.
. 4..Order.the.absolute.deviations,.|Yi.−.Mdn|,.from.the.lowest.to.the.highest,.to.produce.a.series.of.increasing.absolute.numbers.
. 5..Obtain.the.MAD.by.finding.the.median.of.these.absolute.deviations.
The.MAD.is.conceptually.more.similar.to.the.traditional.s.than.to.s2.because.the.latter.involves.squaring.deviation.scores.whereas.the.MAD.does.not.square.devia-tions..The.MAD.is.much.more.resistant.to.outliers.than.is.the.standard.deviation..Under.normality.the.MAD.=..6745s..Wilcox.(2003).provided.an.S-PLUS.software.function. for. calculating. the. MAD.. Calculation. by. hand. is. demonstrated. in. the.next.section..Bonett.and.Seier.(2003).proposed.a.method.for.constructing.a.con-fidence.interval.for.the.ratio.of.two.mean.absolute.deviations.from.the.median,.and.they.discussed.other.robust.methods.that.are.applicable.when.distributions.are.extremely.nonnormal.
quantileS
The.final.measure.of.variability.that.is.discussed.here.is.the.interquartile.range,.which.is.based.on.quantiles..A.quantile. is.roughly.defined.here.as.a.score.that.is.equal.to.or.greater.than.a.specified.proportion.of.the.scores.in.a.distribution..Common.examples.of.quantiles.are.quartiles,.which.divide.the.data.into.succes-sive.fourths.of.the.data:..25,..50,..75,.and.1.00..The.second.quartile,.Q2.(.50.quan-tile),.is.the.overall.median.(Mdn).of.the.scores.in.the.distribution,.that.is,.the.score.that.has..50.of.the.scores.ranked.below.it..The.first.quartile,.Q1.(.25.quantile),.is.the.median.of.the.scores.that.rank.below.the.overall.Mdn,.that.is,.the.score.that.outranks.25%.of.the.scores..The.third.quartile,.Q3.(.75.quantile),.is.the.median.of.the.scores.that.rank.above.the.overall.Mdn,.that.is,.the.score.that.outranks.75%.of.the.scores..The.more.variable.a.distribution.is.the.greater.the.difference.there.
http://www.psypress.com/effect-sizes-for-research-9780415877695

25Introduction
should.be.between.the.scores.at.Q3.and.Q1,.at.least.with.respect.to.variability.of.the.middle.bulk.of. the.data..A.measure.of. such.variability. is. the. interquartile range,.Riq,.which.is.defined.as
.R Q Qiq 3 1= – . . (1.4)
For.normal.distributions.the.approximate.relationship.between.the.ordinary.s.and.Riq.is.s.=..75Riq..When.using.statistical.software.packages.researchers.should.try.to. ascertain.how. the. software. is.defining.quantiles.because.only.a. rough.defi-nition.has.been.given.here.for.our.purposes.and.definitions.vary..For.example,.consider.the.following.small.set.of.data.that.was.presented.for.illustration.of.the.problem.to.a.statistical.listserve.by.Dennis.M..Roberts:.25,.30,.33,.39,.39,.40,.59,.67,.69,.94,.130..For.these.data,.most.software.algorithms.that.were.tested.yield.Q1 =.33.and.Q3.=.69,.but.some.yield.Q1.=.36.and.Q3.=.68,.and.another.yields.Q1.=.32.25.and.Q3.=.67.5..Some.software.provide.options.for.the.algorithms.that.are.to.be.used.for.the.calculation.
There.are.additional.measures. that.are.more.resistant. to.outliers. than.are.s2.and.s,.but.discussion.of.these.would.be.beyond.the.scope.of.this.book..Note.that.what.we.loosely.call.a.measure.of.variability.in.this.book.is.technically.called.a.measure.of.a.distribution’s.dispersion.or.scale.
graphical MethodS
Graphical.methods. for.exploring.differences.between.distributions. in.addition.to.differences.between.their.means.will.be.cited.in.Chapter.5..One.such.graphic.depiction.of.data.that.is.relevant.to.the.present.discussion.and.which.research-ers.are.urged.to.present.for.each.sample.is.a.boxplot.(see.Figure.1.2)..Statistical.software.packages.vary.in.the.details.of.the.boxplots.that.they.present,.but.gen-erally.included.are.the.range,.median,.first.and.third.quartiles.so.that.the.inter-quartile. range.can.be.calculated,. and.outliers. that. can.also.give.an. indication.of.skew..Unfortunately,.an.outlier.that.is.not.detected.using.a.boxplot.may.still.importantly.distort.results.of.data.analysis..Many.statistical.software.packages.produce.two.or.more.boxplots.in.the.same.figure.for.direct.comparison..Trenkler.(2002).provided.software.for.a.more.detailed.comparison.of.two.or.more.box-plots.. Boxplot. methods. should. detect. outliers. while. avoiding. misclassifying. a.non-outlier.as.an.outlier..One.method.may.be.better.at.detection.whereas.another.method.may.be.better.at.avoiding.such.misclassification.(Carter,.Schwertman,.&.Kiser,.2009).
A. change. or. changes. in. location,. variability,. and/or. shape. of. a. distribution.after.treatment.can.be.depicted.graphically.by.a.bihistogram..A.bihistogram.can.be.produced.using.the.Dataplot.free.software,.which.is.available.at.the.time.of.this. writing. at. http://www.itl.nist.gov/div898/handbook/eda/section3/bihistog.htm..Informative.discussions.of.a.variety.of.ways.to.convey.results.graphically.can.be.found.in.Cleveland.(1994).and.Lane.and.Sándor.(2009).
http://www.psypress.com/effect-sizes-for-research-9780415877695

26 Effect Sizes for Research: Univariate and Multivariate Applications
worked exAmples of meAsures of vAriAbility
Consider.the.following.real.data.that.represent.partial.data.from.research.on.mothers.of.schizophrenic.children.(one.of.the.two.groups.in.research.that.will.be.discussed.in.detail.where.needed.in.Chapter.3):.1,.1,.1,.1,.2,.2,.2,.3,.3,.7..The.possible.scores.ranged.from.0.to.10..Observe.in.Figure.1.1.that.the.data.are.positively.skewed.
Standard. software. output,. or. simple. inspection. of. the. data,. yields. for. the.median.of.the.raw.scores.Mdn.=.2..As.should.be.expected,.because.positive.skew.pulls.the.very.nonresistant.mean.to.a.value.that.is.greater.than.the.median,.Y
–.>
Mdn.in.the.present.case;.specifically,.Y–.=.2.3..Observe.that.although.9.of.the.10.
scores.range.from.1.to.3,.the.outlying.score,.7,.causes.the.range.to.be.6..Software.output.yields.for.the.unbiased.estimate.of.population.variance.for.these.data.s2.=.3.34..Although.the.present.small.set.of.data.is.not.ideal.for.justifying.the.applica-tion.of.the.alternative.measures.of.variability,.it.serves.to.demonstrate.the.calcula-tion.of.the.Winsorized.variance.and.the.MAD..Again,.many.statistical.software.packages.calculate.Riq..For.this.example,.the.calculation.yields.Riq.=.2.
We.presented.a.value.for.Riq.for.the.current.data.only.for.completeness..Recall.that.there.is.a.variety.of.algorithms.used.by.software.packages.to.calculate.quar-tiles.and.that.results.such.as.the.current.Riq.=.2.may.differ.across.different.pack-ages..Moreover,.knowledge.of.the.Riq.is.of.little.value.in.the.present.case.of.a.very.small.set.of.data.with.many.ties.
Step.1.for.calculating.the.Winsorized.variance. sw2( ),.ordering.the.scores.from.
the.lowest.to.the.highest,.has.already.been.done..For.step.2,.we.use.c.=.20,.so..cn =..2(10).=.2..Therefore,.we.remove. the.2. lowest.scores.and. the.2.highest.scores,.which.leaves.6.of.the.original.10.scores.remaining..Applying.step.3,.YL.=.1.and.YH =.3..Applying.step.4,.we.replace.the.two.lowest.removed.scores.with.two.rep-etitions.of.YL.=.1,.and.we.replace.the.two.highest.removed.scores.with.two.repeti-tions.of.YH.=.3,.so.that.the.reconstituted.sample.of.n.=.10.is.1,.1,.1,.1,.2,.2,.2,.3,.3,.3..Although.steps.1.through.4.have.not.changed.the.left.side.of.the.distribution,.the.reconstituted.data.clearly.are.more.symmetrical.than.before.because.of.the.removal.and.replacement.of.the.outlying.score,.7..For.step.5,.we.use.any.statistical.
4
3
2
Freq
uenc
y
1
01 2 3 4
Scores5 6 7
figure 1.1 Skewed.data.(n.=.10).
http://www.psypress.com/effect-sizes-for-research-9780415877695
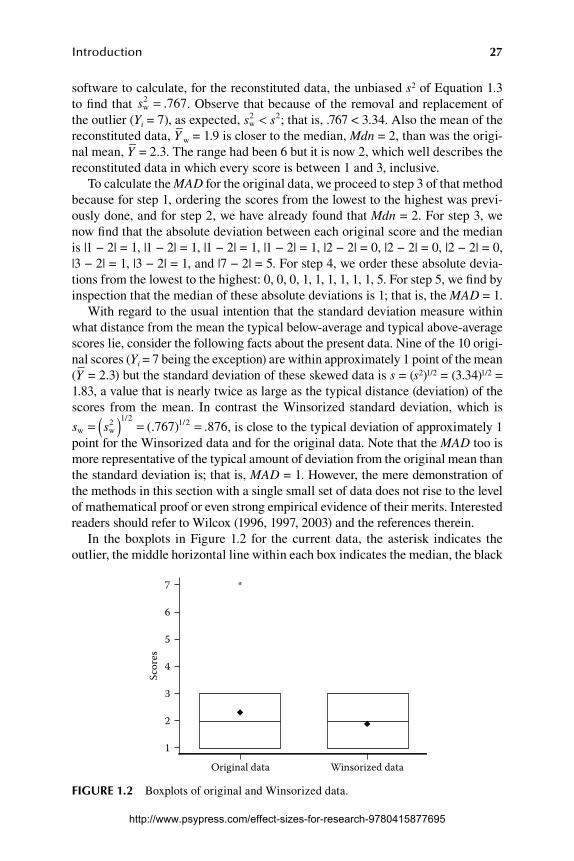
27Introduction
software.to.calculate,.for.the.reconstituted.data,.the.unbiased.s2.of.Equation.1.3.to.find.that. sw
2 767= . ..Observe.that.because.of.the.removal.and.replacement.of.the.outlier.(Yi.=.7),.as.expected,.s sw
2 2< ;.that.is,..767.<.3.34..Also.the.mean.of.the.reconstituted.data,.Y
–w.=.1.9.is.closer.to.the.median,.Mdn.=.2,.than.was.the.origi-
nal.mean,.Y–
=.2.3..The.range.had.been.6.but.it.is.now.2,.which.well.describes.the.reconstituted.data.in.which.every.score.is.between.1.and.3,.inclusive.
To.calculate.the.MAD.for.the.original.data,.we.proceed.to.step.3.of.that.method.because.for.step.1,.ordering.the.scores.from.the.lowest.to.the.highest.was.previ-ously.done,.and.for.step.2,.we.have.already.found.that.Mdn.=.2..For.step.3,.we.now.find.that.the.absolute.deviation.between.each.original.score.and.the.median.is.|1.−.2|.=.1,.|1.−.2|.=.1,.|1.−.2|.=.1,.|1.−.2|.=.1,.|2.−.2|.=.0,.|2.−.2|.= 0,.|2.−.2|.=.0,.|3.−.2|.=.1,.|3.−.2|.=.1,.and.|7.−.2|.=.5..For.step.4,.we.order.these.absolute.devia-tions.from.the.lowest.to.the.highest:.0,.0,.0,.1,.1,.1,.1,.1,.1,.5..For.step.5,.we.find.by.inspection.that.the.median.of.these.absolute.deviations.is.1;.that.is,.the.MAD.=.1.
With.regard.to.the.usual.intention.that.the.standard.deviation.measure.within.what.distance.from.the.mean.the.typical.below-average.and.typical.above-average.scores.lie,.consider.the.following.facts.about.the.present.data..Nine.of.the.10.origi-nal.scores.(Yi.=.7.being.the.exception).are.within.approximately.1.point.of.the.mean.(Y–
=.2.3).but.the.standard.deviation.of.these.skewed.data.is.s.=.(s2)1/2.=.(3.34)1/2.=.1.83,.a.value.that.is.nearly.twice.as.large.as.the.typical.distance.(deviation).of.the.scores. from. the.mean.. In. contrast. the.Winsorized. standard.deviation,.which. is.
s sw w
1 2 1 2767 876= ( ) = =2 / /(. ) . ,.is.close.to.the.typical.deviation.of.approximately.1.point.for.the.Winsorized.data.and.for.the.original.data..Note.that.the.MAD.too.is.more.representative.of.the.typical.amount.of.deviation.from.the.original.mean.than.the.standard.deviation.is;.that.is,.MAD.=.1..However,.the.mere.demonstration.of.the.methods.in.this.section.with.a.single.small.set.of.data.does.not.rise.to.the.level.of.mathematical.proof.or.even.strong.empirical.evidence.of.their.merits..Interested.readers.should.refer.to.Wilcox.(1996,.1997,.2003).and.the.references.therein.
In. the.boxplots. in.Figure.1.2. for. the.current.data,. the.asterisk. indicates. the.outlier,.the.middle.horizontal.line.within.each.box.indicates.the.median,.the.black.
Original data Winsorized data
7
1
2
3
4
5
*
6
Scor
es
figure 1.2 Boxplots.of.original.and.Winsorized.data.
http://www.psypress.com/effect-sizes-for-research-9780415877695

28 Effect Sizes for Research: Univariate and Multivariate Applications
diamond.within.each.box.indicates.the.mean,.and.the.lines.that.form.the.bottom.and.top.of.each.box.indicate.the.first.and.third.quartiles,.respectively..Because.of.the.idiosyncratic.nature.of.the.current.data.set.(many.repeated.values),.the.inter-quartile.range.for.the.Winsorized.data.(2).happens.to.be.equal.to.the.range.of.the.Winsorized.data.
summAry
The.result.of.a.test.of.statistical.significance.does.not.directly.estimate.how.much.different. a. study’s. groups. are. or. how. strongly. related. variables. are.. For. these.purposes. an. estimate. of. effect. size. is. required.. Whereas. a. statistical. test. pro-vides.evidence.regarding.the.possible.falseness.of.a.null.hypothesis,.an.estimate.of.effect.size.provides.evidence.of.the.degree.of.such.falseness..A.“statistically.significant”.difference.between.groups.or.relationship.between.variables.does.not.necessarily.mean.a. large.difference.or.strong.relationship,.but.merely.a.degree.of.difference.or.relationship.that.is.in.the.range.of.values.that.are.unlikely.to.be.attributable.to.chance.
Many.factors.can.influence.an.effect.size,.including.the.research.design,.kind.of.effect.size,.reliability.of.the.scores,.nature.of.the.participants,.type.of.measure.of.the.independent.variable,.time.between.treatment.and.data.collection,.various.biases,.and.violation.of.assumptions..Research.reports.should.include.information.about.such.factors.and,.even.if.reporting.an.estimate.of.effect.size,.to.accommo-date.readers.who.might.want.to.calculate.another.kind.of.estimator,.provide.all.of.the.summary.statistics.(e.g.,.means.and.variances).that.might.be.needed.
Statistical.tests.(e.g.,.t.or.F).that.might.be.used.to.support.a.statement.that.an.estimate.of.effect.size.is.significantly.greater.than,.say,.zero.can.yield.erroneous.results.when.an.assumption.such.as.normality.or.equal.variances.is.violated..There.are.theoretical.reasons.and.empirical.evidence.to.indicate.that.outliers.and.viola-tions.of.assumptions,.even.extreme.violations,.are.common..Therefore,.research-ers.should.consider.using.statistics.that.are.more.resistant.to.outliers.than.are.the.mean.and.variance,.and.robust.statistical.tests.that.are.insensitive.or.less.sensitive.to.violation.of.assumptions.than.are.the.t.and.F.tests..Also,.because.treatments.can.affect.variability.as.well.as.means,.and.preexisting.groups.(e.g.,.females.and.males).may.differ.in.variability,.researchers.should.explore.their.data.for.differ-ences. in. variability.between.groups..There. are. arguments. against. sequentially.testing.for.violation.of.equal.variances.and.then.testing.for.difference.in.means.
Questions
1.1. List.six.factors.that.influence.the.statistical.significance.of.t.1.2. What.is.the.meaning.of.statistical significance,.and.what.do.the.authors.
mean.by.statistically signifying?1.3. Define.effect size.in.general.terms.1.4. In.what.circumstances.would.the.reporting.of.effect.sizes.be.most.useful?
http://www.psypress.com/effect-sizes-for-research-9780415877695

29Introduction
1.5. What.is. the.major.issue.in.the.debate.regarding.the.reporting.of.effect.sizes.when.results.do.not.attain.statistical.significance?
1.6. Why.should.a.researcher.consider.reporting.more.than.one.kind.of.effect.size.for.a.set.of.data?
1.7. What.is.often.the.relationship.between.a.treatment’s.effect.on.means.and.variances?
1.8. Define. (a). heteroscedasticity,. (b). power. analysis,. (c). meta-analysis,. (d).MAD,. (e). interquartile. range,. (f). researcher-allegiance. bias,. (g). wait-list-control.bias,. (h). internal.validity,. (i). external.validity,. (j). random-ized. clinical. trial,. (k). ceiling. and. floor. effects,. (l). nonresistance. and.robustness,. (m). quantile. and. quartile,. (n). nil. hypothesis,. (o). differen-tial.attrition,.(p).efficacy.and.effectiveness,.(q).intent-to-treat,.modified.intent-to-treat,.and.per.protocol.criteria.
1.9. Is.heteroscedasticity.a.practical.concern.for.data.analysts,.or.is.it.merely.of.theoretical.interest?.Explain.briefly.
1.10. Define.outliers.and.provide.two.possible.causes.of.them.1.11. Discuss.whether.or.not.the.use.of.preexisting.groups.or.randomly.formed.
groups.differently.impacts.the.possibility.of.heteroscedasticity.1.12. Discuss.the.usefulness.of.tests.of.homoscedasticity.in.general.1.13. What.effect.can.one.or.a.few.outliers.have.on.the.variance?1.14. How.resistant.to.outliers.is.the.variance?.In.general.terms,.compare.its.
resistance.with.that.of.four.other.measures.of.variability.1.15. Which.characteristics.of.data.do.boxplots.usually.depict?1.16. What.is.often.the.relationship.between.the.value.of.a.test.statistic.and.an.
estimate.of.effect.size?1.17. List.11.factors.that.can.influence.the.value.of.an.effect.size.1.18. Define. and. briefly. discuss. the. problem. of. publication bias. and. define.
outcome reporting bias.1.19. For.the.following.real.data.(a).calculate.the.sample.variance,.Winsorized.
variance,.MAD,.and.interquartile.range;.(b).construct.a.boxplot;.(c).in.light.of. the.boxplot.and. the.discussions. in. the. text,.discuss. the.differ-ences.in.the.numerical.results.and.the.appropriateness.of.each.of.these.measures.of.variability:.2,.1,.1,.3,.2,.7,.2,.1,.3,.1,.0,.2,.4,.2,.3,.3,.0,.1,.2,.2.
http://www.psypress.com/effect-sizes-for-research-9780415877695