Embed Size (px)
Citation preview
FACULTY OF SCIENCEDEPARTMENT OF PHYSICS AND TECHNOLOGY
Rockslide Mapping in Norway by Means of Interferometric SAR Time Series Analysis
Tom Rune LauknesA dissertation for the degree of Philosophiae Doctor
December 2010

Abstract
Rockslides have a high socioeconomic and environmental importance in many coun-tries. Norway is particularly susceptible to large rockslides due to its many fjords andsteep mountains. One of the most dangerous hazards related to rock slope failures aretsunamis that can lead to large loss of life. It is therefore very important to systemati-cally identify potential unstable rock slopes.
In this thesis, we consider the use of satellite remote sensing interferometric syn-thetic aperture radar (InSAR) for detecting surface displacement in rural areas of Nor-way. The main focus of the work has been on developing small baseline (SB) InSARtime series methods for mapping and monitoring of rockslides in Norway.
The first part of the thesis is a basic review of the satellite SAR imaging instrument,with a focus on the InSAR methodology. Different satellite sensors and their limitationsis discussed. The introduction chapters have been written with the nonspecialist inmind.
In the second part of the thesis, we present a discussion about particular InSARprocessing challenges in Norway, as well as preliminary results from two ongoing re-search projects, with the aim of demonstrating the possibilities that emerges by usingnew high-resolution SAR sensors, as well as the potential to perform regular surfacedisplacement monitoring using radar corner reflectors.
Spatial phase unwrapping is a critical step for all InSAR processing, and two-dimen-sional unwrapping of sparse data sets is particularly challenging. We propose an L1-norm-based SB InSAR time series approach that leads to better robustness with respectto phase unwrapping errors in the interferometric data stack.
It is well known that in mountainous regions, temporal variations in the stratified at-mospheric refractive index profile will lead to a interferometric phase delay correlatingto topography. We present a SB method for estimating and correcting the troposphericstratification effect observed in a stack of SB interferograms.
The last chapters of the thesis demonstrate that InSAR is a powerful tool that can beused to identify the relative magnitude and spatial pattern of active rockslide sites onboth a regional and individual rockslide site scale.
i

ii

Acknowledgements
I owe my deepest gratitude to my team of supervisors: Torbjørn Eltoft from the Univer-sity of Tromsø, Harald Johnsen and Yngvar Larsen from Norut, and John Dehls fromthe Geological Survey of Norway (NGU). I am grateful to you all for allowing me un-restricted freedom to pursue my own research ideas, and for providing knowledgeableguidance and tutoring when needed. Kjell Arild Høgda has been the project leader andmy boss at Norut. I am thankful for his good-temper and never-ending patience, allow-ing me to focus on my thesis, even if other duties called. I am grateful to my colleaguesat Norut for providing an excellent research environment.
I have had the opportunity to participate in fieldwork at several rockslide sites inTroms and at Aknes. In Troms, I have had the pleasure of joining researchers Iain Hen-derson, Tim Redfield, and Per Terje Osmundsen from NGU. I am grateful for their ever-lasting patience when trying to teach me concepts of field geology. I have many memo-rable experiences from the daily debriefings at Bla Rock. I am thankful to the crew fromFjellskred i Troms for their positive attitude to the InSAR monitoring project.
I am thankful to Lars Harald Blikra, Kjell Jogerud, and Tore Bergeng for supportingmy work related to the Aknes/Tafjord rockslide monitoring project. The radar cornerreflectors would not have been there without the skillful assistance of Age Kjølas andMarc-Henri Derron. I thank Dan Johan Weydahl at Norwegian Defence Research Estab-lishment (FFI) for being instrumental in initiating my PhD project.
Special thanks go to Howard Zebker for welcoming me to his research group at Stan-ford University during the academic year 2007/2008. I enjoyed the open collaborativestyle, and the weekly group meetings that provided a forum for stimulating discus-sions. I am further indebted to Piyush Shanker Agram for many interesting and fruitfuldiscussions about everything from InSAR to cricket. I would also like to thank all othermembers of the lab for making my stay at Stanford a very memorable one.
I am grateful to Sean Buckley at Center for Space Research, University of Texas atAustin, for providing me with an undisturbed workplace during the period January2010–June 2010. His hospitality was instrumental for the completion of this thesis.
I would like to thank the University of Tromsø for granting me the scholarship thatmade my research stay in California possible. The International Centre for Geohazardsand NGU are acknowledged for cofunding my project. Satellite SAR data have beenkindly provided by Kongsberg Satellite Services (KSAT) through an agreement withNorwegian Space Centre and the European Space Agency (ESA).
I am indebted to Anja Strømme in Menlo Park, California, for her unconditionalhospitality when I needed a place to crash for a few days or weeks.
I thank all my friends for the good time I have had during the time of my study. Ithank my family for supporting me throughout the years.
Last, but not least, I deeply thank Anna for all her patience, and for the good life weshare.
Tom Rune Lauknes — Tromsø, 23rd December 2010.
iii

iv

Contents
Abstract i
Acknowledgements iv
Table of Contents vi
1 Introduction 11.1 Motivation . . . . . . . . . . . . . . . . . . . . . . . . . . . . . . . . . . . . . 11.2 Organization of the Thesis . . . . . . . . . . . . . . . . . . . . . . . . . . . . 31.3 Other Contributions by Author . . . . . . . . . . . . . . . . . . . . . . . . . 6
2 Synthetic Aperture Radar Imaging 112.1 Synthetic Aperture Radar . . . . . . . . . . . . . . . . . . . . . . . . . . . . 11
2.1.1 Range and azimuth resolution . . . . . . . . . . . . . . . . . . . . . . 112.2 SAR Geometrical Effects . . . . . . . . . . . . . . . . . . . . . . . . . . . . . 14
2.2.1 Ground range resolution . . . . . . . . . . . . . . . . . . . . . . . . . 142.2.2 Radar shadow and foreshortening . . . . . . . . . . . . . . . . . . . 16
2.3 Satellite Orbit Configuration . . . . . . . . . . . . . . . . . . . . . . . . . . . 17
3 SAR Interferometry 193.1 Introduction . . . . . . . . . . . . . . . . . . . . . . . . . . . . . . . . . . . . 193.2 Interferometric Phase . . . . . . . . . . . . . . . . . . . . . . . . . . . . . . . 203.3 Interferometric Coherence . . . . . . . . . . . . . . . . . . . . . . . . . . . . 213.4 Interferometric Phase Decorrelation . . . . . . . . . . . . . . . . . . . . . . 223.5 Phase Unwrapping . . . . . . . . . . . . . . . . . . . . . . . . . . . . . . . . 233.6 Electromagnetic Propagation Delay . . . . . . . . . . . . . . . . . . . . . . . 24
3.6.1 Tropospheric effects on InSAR measurements . . . . . . . . . . . . . 243.7 Time Series InSAR . . . . . . . . . . . . . . . . . . . . . . . . . . . . . . . . . 25
3.7.1 Small baseline methods . . . . . . . . . . . . . . . . . . . . . . . . . 263.7.2 Persistent scatterer methods . . . . . . . . . . . . . . . . . . . . . . . 27
4 Discussion 294.1 Study Areas . . . . . . . . . . . . . . . . . . . . . . . . . . . . . . . . . . . . 29
4.1.1 Aknes . . . . . . . . . . . . . . . . . . . . . . . . . . . . . . . . . . . . 29
v
4.1.2 Nordnes . . . . . . . . . . . . . . . . . . . . . . . . . . . . . . . . . . 304.2 InSAR Processing Challenges in Norway . . . . . . . . . . . . . . . . . . . 31
4.2.1 Irregular data sampling . . . . . . . . . . . . . . . . . . . . . . . . . 314.2.2 Sparse phase unwrapping . . . . . . . . . . . . . . . . . . . . . . . . 32
4.3 Possibilities With New High-Resolution Sensors . . . . . . . . . . . . . . . 344.3.1 Mapping of Aknes rockslide using RADARSAT-2 Ultra-fine data . 34
4.4 Monitoring of the Nordnes Rockslide Using Radar Corner Reflectors . . . 354.4.1 Corner reflectors . . . . . . . . . . . . . . . . . . . . . . . . . . . . . 354.4.2 Satellite data . . . . . . . . . . . . . . . . . . . . . . . . . . . . . . . . 354.4.3 InSAR processing of the reflector double differences . . . . . . . . . 364.4.4 Displacement results . . . . . . . . . . . . . . . . . . . . . . . . . . . 374.4.5 Corner reflector summary . . . . . . . . . . . . . . . . . . . . . . . . 37
5 Paper 1:InSAR Deformation Time Series Using an L1-norm Small-Baseline Approach 39
6 Paper 2:InSAR Tropospheric Stratification Delays: Correction Using a Small BaselineApproach 53
7 Paper 3:Detailed rockslide mapping in northern Norway with small baseline and per-sistent scatterer interferometric SAR time series methods 61
8 Paper 4:A structural, geomorphological and InSAR study of an active rock slope failuredevelopment 77
9 Paper 5:Active normal fault control on landscape and rock-slope failure in northernNorway 95
10 Conclusions 10110.1 Summary . . . . . . . . . . . . . . . . . . . . . . . . . . . . . . . . . . . . . . 10110.2 Suggestions for Further Work . . . . . . . . . . . . . . . . . . . . . . . . . . 102
Bibliography 112
vi

Nomenclature
List of Acronyms
2D two-dimensional
3D three-dimensional
APS atmospheric phase screen
ASAR Advanced Synthetic Aperture Radar
DEM digital elevation model
EM electromagnetic
ERS European Remote Sensing
ESA European Space Agency
FM frequency modulated
GB-InSAR ground based interferometric SAR
GNSS global navigation satellite system
GPS global positioning system
InSAR interferometric synthetic aperture radar
IRLS iteratively reweighted least squares
LIDAR light detection and ranging
LOS line-of-sight
LS least squares
ML maximum likelihood
ML-PS maximum likelihood persistent scatterer
vii

NASA National Aeronautics and Space Administration
PS persistent scatterer
PSI persistent scatterer interferometry
SAR synthetic aperture radar
SB small baseline
SBAS small baseline subset algorithm
SLC single-look complex
SNR signal-to-noise ratio
ZTD zenith total delay
viii

Chapter 1
Introduction
This thesis is about differential interferometric synthetic aperture radar (InSAR) timeseries methods and their applications for land deformation monitoring. In this Chapter,we present the motivation for our study, and give an extended summary of the subse-quent chapters of the thesis, including five journal publications. We conclude the Chap-ter by including a list of other international publications and presentations publishedby the author.
1.1 Motivation
Being a mountainous country, with long fjords and steep valley sides, Norway is partic-ularly susceptible to large rock avalanches. In the last 100 years, over 170 people havebeen killed by tsunamis in fjords caused by large rock avalanches. In each case, the rockavalanche was preceded by many years of slow movement, with acceleration prior toslope failure [Ganerød et al., 2008,Eiken, 2008]. With several thousand kilometres of in-habited coastline and valleys, it is a challenge to identify similar hazards in an efficientmanner. Once we suspect an area to be sliding, it may take several years of measure-ments to confirm it, and an extensive ground instrumentation to characterize the typeof motion.
In order to fully understand the kinematics and geometric configurations susceptiblefor sliding, it is imperative to obtain precise measurements of the stability of potentialunstable rock slopes. Traditionally, a discrete network of surface benchmarks have beeninstalled and precisely levelled periodically. Lately, the use of global navigation satel-lite system (GNSS) monuments allows either periodical, or continuous measurementsof surface motion. Other ground-based surveying techniques include robotic total sta-tions, which measure distance and angle to a defined set of reflectors, and ground-basedscanning light detection and ranging (LIDAR) systems. Furthermore, extensometersand tiltmeters can measure precise changes in an opening crack, and boreholes can bedrilled in order to study the bedrock characteristics.
Common for all these approaches are that they produce sparse measurements (few
1
observations due to cost of establishing an observation network), and are often sur-veyed infrequently due to expensive infrastructure and logistics. In conclusion, thereis an obvious need for the development of remote sensing methods that regularly can measuresurface stability over large areas.
The InSAR remote sensing technique involves comparing the phase informationfrom two ground-based, airborne, or spaceborne synthetic aperture radar (SAR) images,produced at different times, to potentially detect millimeter to centimeter scale grounddeformation patterns. The first demonstration of the repeat-pass InSAR technique todetect surface displacement was presented by [Gabriel et al., 1989]. They used twoNational Aeronautics and Space Administration (NASA) SEASAT satellite SAR obser-vations, separated by 12 days, to produce a ground surface displacement map relatingthe observed ground displacement to water absorbing clays.
Over the last decades, and in particular after the launch of the European SpaceAgency (ESA) European Remote Sensing (ERS) satellites in the 1990’s, satellite basedSAR interferometry has become an important tool for mapping topography, study-ing surface deformation, and observing glacial flows, see e.g. [Zebker and Goldstein,1986,Massonnet et al., 1993,Goldstein et al., 1993,Massonnet et al., 1995,Massonnet andFeigl, 1998].
The interferometric phase measurements are, however, affected by various effectsthat can hamper operational surface displacement monitoring. The main limiting fac-tors are atmospheric path delay that can introduce an unknown bias in the phase mea-surement [Zebker et al., 1997], and temporal decorrelation that makes InSAR phasemeasurements unreliable due to the change in relative position of the scatterers in a res-olution element [Zebker and Villasenor, 1992]. These effects can to a certain degree bemitigated by combining multiple SAR observations using multi-temporal InSAR tech-niques. Using more than two SAR scenes can lead to redundant measurements, allow-ing for more advanced time series methods. The access to large historical SAR dataarchives, dating back to the early 1990’s (ERS-satellites), have inspired the developmentof several innovative multi-temporal InSAR algorithms, e.g. [Ferretti et al., 2000, Fer-retti et al., 2001, Berardino et al., 2002, Schmidt and Burgmann, 2003, Werner et al.,2003, Hooper et al., 2004].
The motivation for this PhD project was to develop and improve time series InSARalgorithms, with the main purpose to actively use InSAR as a tool for rockslide map-ping in Norway. The applicability of the small baseline subset algorithm (SBAS) [Be-rardino et al., 2002] to detect urban subsidence in Norway has already been demon-strated [Lauknes, 2004], and the use of the persistent scatterer interferometry (PSI)method for deformation mapping in rural terrain in northern Norway has been demon-strated by [Dehls et al., 2002]. However, relatively few InSAR studies in rural terrainhave been performed.
The potential of InSAR to study landslides has been investigated by several authors,e.g. [Berardino et al., 2003,Hilley et al., 2004,Strozzi et al., 2005,Colesanti and Wasowski,2006, Rott and Nagler, 2006]. Few of the studied areas are however directly comparableto typical conditions in northern Norway. The main challenges are long winter seasons,
2

limiting the total number of SAR scenes applicable for analysis and making temporalatmospheric filtering difficult, as well as constraining the deformation values that couldbe measured due to signal aliasing. Furthermore, the typical fjord landscape with steepmountains introduces large areas with low coherence, possibly introducing phase un-wrapping ambiguities. The area with steep topography is also highly susceptible toInSAR atmospheric stratification effects [Hanssen, 2001].
1.2 Organization of the Thesis
This thesis consists of ten chapters, and is organized as follows. Chapters 2–3 containan introduction to the topics of SAR and interferometric SAR, while Chapter 4 con-tains a description of the main study areas, as well as a discussion on particular InSARprocessing challenges in Norway. We present preliminary results from two ongoing re-search projects, with the aim of demonstrating the possibilities that emerges by usingnew high-resolution SAR sensors, as well as the potential to perform continuous sur-face displacement monitoring using radar corner reflectors. Chapters 5–9 contains fivemanuscripts, forming the basis of this thesis. These are separately described in this sub-section, where we summarize the main findings and highlight the original contributionof the author. Finally, Chapter 10 gives the conclusions, and points out future researchdirections.
Paper 1
T. R. Lauknes, H. A. Zebker, and Y. Larsen, “InSAR Deformation Time Series Using anL1-norm Small Baseline Approach,” IEEE Transactions on Geoscience and Remote Sensing,doi:10.1109/TGRS.2010.2051951, 2010.
Spatial phase unwrapping is a critical step for all InSAR processing, and two-dimen-sional (2D) unwrapping of sparse data sets is particularly challenging. A typical inter-ferogram is often divided into several sparsely distributed coherent areas, separated bylarge decorrelated areas such as e.g. water or vegetated areas. The decorrelated areascan introduce ambiguities for traditional 2D unwrapping methods, and unwrappingerrors can lead to incorrectly estimated deformation time series when using time seriesInSAR methods.
In this paper, we propose an L1-norm-based small baseline (SB) InSAR time seriesapproach that leads to better robustness with respect to phase unwrapping errors in theinterferometric data stack. It is well known that cost function minimization using L1-norm is more robust than L2-norm (least squares (LS)) if the data set has outlying points.Our method is based on the original SBAS method, and we implemented the L1-normbased inversion using the iteratively reweighted least squares (IRLS) algorithm. In thepaper, we show that the displacement phase of both synthetic data, as well as a real
3
data set that covers the San Francisco Bay area, is recovered more accurately than withL2-norm solutions.
Paper 2
T. R. Lauknes, “Atmospheric Stratification Delays in InSAR, Correction Using a SmallBaseline Approach,” IEEE Geoscience and Remote Sensing Letters, submitted, 2010.
Our main study areas are located along the Norwegian coastline, with typical fjordlandscape with mountains that rise up to 2000 m above the Norwegian Sea. It is wellknown that in mountainous regions, temporal variations in the stratified refractive in-dex profile will lead to a interferometric phase delay correlating with elevation [Dela-court et al., 1998,Hanssen, 2001,Doin et al., 2009]. This path delay can be misinterpretedas surface displacement, and correction is imperative. Mitigation of atmospheric strat-ification is therefore crucial to successfully apply InSAR for deformation mapping inareas with strong topography. Neither of the atmospheric filtering methods applied to-day in time series InSAR are optimized to handle temporally correlated atmosphericdelay due to stratification.
The topic of this paper is mitigation of atmospheric stratification effects in time se-ries InSAR. We present a SB method for estimating and correcting the troposphericstratification observed in a stack of SB interferograms. We demonstrate the value of thisapproach using InSAR data from Envisat Advanced Synthetic Aperture Radar (ASAR),and compare the InSAR estimated delays with results from a global positioning sys-tem (GPS) network from the Aknes rockslide site in western Norway.
Paper 3
T. R. Lauknes, A. Piyush Shanker, J. F. Dehls, H. A. Zebker, I. H. C. Henderson, andY. Larsen, “Detailed rockslide mapping in northern Norway with small baseline andpersistent scatterer interferometric SAR time series methods,” Remote Sensing of Envi-ronment, vol. 114, no. 9, pp. 2097–2109, doi:10.1016/j.rse.2010.04.015, 2010.
In Norway, the arctic area of Lyngen is one area where rockslides cluster [Braathenet al., 2004, Blikra et al., 2006]. In this paper, we take the opportunity to apply bothSBAS and PSI time series InSAR methods to study several known rockslides in thisarea. Due to the high latitude and arctic climate, vegetation above 600–700 m is scarce.This area is thus very suited for application of the InSAR methodology. Several differentelectromagnetic (EM) surface scattering mechanisms can be expected.
In this paper, we address the differences and similarities between the SB and thePSI multitemporal InSAR methods for displacement studies in rural terrain. The paperincludes a short review of both the SBAS and the maximum likelihood persistent scat-terer (ML-PS) implementation, as well as a discussion including the relevance of both
4
SB and PSI methods for analyzing the surface displacement in the study area.
Paper 4
I. H. C. Henderson, T. R. Lauknes, P. T. Osmundsen, J. Dehls, Y. Larsen, and T. F. Red-field, “A structural, geomorphological and InSAR study of an active rock slope failuredevelopment,” Slope Tectonics, Geological Society, London, Special Publications, 351,pp. 185–189, doi:10.1144/SP351.10, 2011.
Few studies of rockslides have addressed the relationships between structures, ge-omorphological expressions and direct evidence of movement. In this paper, we de-scribe a case study where we combine time series InSAR with structural geology andgeomorphology in the assessment of sliding processes on the Gamanjunni site in TromsCounty, northern Norway. We employ structural geology, geomorphology and the SBInSAR methodology to investigate the evolution of the surface features developed inresponse to movement of the Gamanjunni rockslide site.
In this paper, we show that the SB time series InSAR methodology provides a newmethod to measure the movement of potential rockslides, and thus provides a directlink between qualitative movement data and field observations. We document the re-lationship between variations in ground movement rates and changing back-scarp ge-omorphology at the Gamanjunni site as well as movement patterns within the incip-ient rockslide. We demonstrate that variations in InSAR detected movement velocitydocuments millimetre variations in scarp displacement and that this is reflected in theevolving back scarp geometry.
Tom Rune Lauknes collected the SAR data, carried out the InSAR analysis, partici-pated in fieldwork, assisted in interpretation of the results, and contributed to writingof the manuscript.
Paper 5
P. T. Osmundsen, I. H. C. Henderson, T. R. Lauknes, Y. Larsen, T. Redfield, and J. Dehls,“Active normal fault control on landscape and rock-slope failure in northern Nor-way,” Geology, vol. 37, no. 2, pp. 135–138, doi:10.1130/G25208A.1, 2009.
In this paper, we apply a combination of structural, geomorphic, and InSAR surfacedisplacement data to show that uplift of the northernmost onshore Scandinavian pas-sive margin is associated with active normal faulting and anomalous clusters of land-slides. We demonstrate that active normal faults control both landscape distributionand the clustering of rock-slope failures in the Lyngen area.
Tom Rune Lauknes collected the SAR data, carried out the InSAR analysis, partici-pated in fieldwork, assisted in interpretation of the results, and contributed to writingof the manuscript.
5

1.3 Other Contributions by Author
During the course of the PhD research, the author has contributed to several publica-tions and presentations, not included in the thesis.
Peer review
1. J. A. Reeves, R. Knight, H. A. Zebker, W. A. Schreuder, P. S. Agram, and T. R.Lauknes, “InSAR data links seasonal head change and aquifer parameters foran agricultural area in the San Luis Valley, Colorado,” Water Resources Research,submitted, 2010.
2. P. T. Osmundsen, T. F. Redfield, B. H. W. Hendriks, S. Bergh, J. A. Hansen, I. H. C.Henderson, J. Dehls, T. R. Lauknes, Y. Larsen, E. Anda, and B. Davidsen, “Fault-controlled Alpine topography in Norway ,” Journal of the Geological Society of Lon-don, Vol. 167, pp. 83–98, doi:10.1144/0016-76492009-019, 2010.
3. K. A. Høgda, R. Storvold, and T. R. Lauknes, “SAR Imaging of Glaciers,” bookchapter in Remote Sensing of Glaciers: Techniques for Topographic, Spatial and ThematicMapping of Glaciers, P. Pellika and W. Gareth Rees (eds.), Taylor & Francis, pp. 153–178, 2009.
Other presentations
1. J. Reeves, R. Knight, H. A. Zebker, W. A. Schreuder, P. S. Agram, and T. R. Lauk-nes, “InSAR data produce specific storage estimates for an agricultural area in theSan Luis Valley, Colorado,” American Geophysical Union Fall Meeting (AGU 2010),San Francisco, CA, U.S.A., December 13–17, 2010, presentation only.
2. T. R. Lauknes, Y. Larsen, E. Malnes, and H. H. Christiansen, “Permafrost moni-toring using SAR and ground based techniques in Svalbard,” Third European Con-ference on Permafrost (EUCOP III), Longyearbyen, Svalbard, Norway, June 13–17,2010, presentation only.
3. T. R. Lauknes, Y. Larsen, E. Malnes, and H. H. Christiansen, “Monitoring of peri-glacial landform changes in permafrost landscape using radar satellite time se-ries,” ESA Living Planet Symposium 2010, Bergen, Norway, June 28–July 2, 2010,presentation only.
4. T. R. Lauknes, Y. Larsen, and J. Dehls, “Mitigating InSAR phase delay due to tro-pospheric stratification using GPS and weather models, a corner reflector study,”ESA Living Planet Symposium 2010, Bergen, Norway, June 28–July 2, 2010, presen-tation only.
6

5. T. R. Lauknes, J. Dehls, Y. Larsen, and L. H. Blikra, “Monitoring of the Aknesrockslide in Storfjorden, Western Norway using corner reflector InSAR,” 6th In-ternational Workshop on SAR Interferometry: Advances in the Science and Applicationsof SAR Interferometry (FRINGE 2009), ESA ESRIN, Frascati, Italy, November 30–December 4, 2009, presentation only.
6. J. Dehls, Y. Larsen, T. R. Lauknes, and C. Froese, “Assessment of residual coalmine subsidence and riverbank stability in an urban setting using X-band and C-band PSI,” 6th International Workshop on SAR Interferometry: Advances in the Scienceand Applications of SAR Interferometry (FRINGE 2009), ESA ESRIN, Frascati, Italy,November 30–December 4, 2009, presentation only.
7. Y. Larsen, T. R. Lauknes, E. Malnes, and H. H. Christiansen, “High-resolution In-SAR analysis of Radarsat-2 Ultra-Fine mode and TerraSAR-X data for measuringfine-scale landscape changes due to permafrost activity,” 6th International Work-shop on SAR Interferometry: Advances in the Science and Applications of SAR Inter-ferometry (FRINGE 2009), ESA ESRIN, Frascati, Italy, November 30–December 4,2009, presentation only.
8. J. Reeves, R. Knight, H. A. Zebker, W. A. Schreuder, P. S. Agram, and T. R. Lauk-nes, “InSAR deformation time series for an agricultural area in the San Luis Val-ley,” Eos Trans. AGU, 90(22), Jt. Assem. Suppl., Abstract H13A-03, 2009, presentationonly.
9. C. Michoud, T. R. Lauknes, A. Pedrazzini, M. Jaboyedoff, R. Tapia, and G. Stein-mann, “Differential Synthetic Aperture Radar Interferometry in monitoring largelandslide (La Frasse, Switzerland),” European Geosciences Union Annual Meeting(EGU 2009), Vienna, Austria, April 19–24, 2009, presentation only.
10. T. R. Lauknes, P. Shanker. A., and H. Zebker, “Multi-temporal InSAR analysis oflandslides in Lyngen region, Norway,” American Geophysical Union Fall Meeting(AGU 2008), San Francisco, CA, U.S.A., December 15–19, 2008, presentation only.
11. T. R. Lauknes, P. Shanker. A., H. Zebker, and Y. Larsen, “A combined small base-line and persistent scatterer InSAR method for resolving land deformation in nat-ural terrain,” 33rd International Geological Congress (IGC33), Oslo, Norway, August6–14, 2008, presentation only.
12. T. R. Lauknes, P. Shanker. A., H. Zebker, and Y. Larsen, “A combined smallbaseline and persistent scatterer InSAR method for resolving land deformationin natural terrain,” 2008 IEEE International Geoscience & Remote Sensing Symposium(IGARSS), Boston, Massachusetts, U.S.A., July 6–11, 2008, presentation only.
13. T. R. Lauknes, P. Shanker. A., and H. Zebker, “A preliminary look at the Sichuanearthquake using ENVISAT ASAR interferometry,” 2008 IEEE International Geo-
7

science & Remote Sensing Symposium (IGARSS), Boston, Massachusetts, U.S.A., July6–11, 2008, presentation only.
14. R. Freuenfelder, J. Tolgensbakk, H. Farbrot, T. R. Lauknes, “Rockglaciers in theKafjord Area, Troms, Northern Norway,” 9th Internat. Conference on Permafrost,Fairbanks, Alaska, U.S.A., June 29 - July 3, 2008.
15. J. F. Dehls, T. R. Lauknes, Y. Larsen, and I. H. C. Henderson, “Landslide map-ping in northern Norway using SBAS InSAR,” European Geosciences Union AnnualMeeting (EGU 2008), Vienna, Austria, April 13–18, 2008, presentation only.
16. P. T. Osmundsen, T. F. Redfield, B. Hendriks, I. Henderson, J. Dehls, T. R. Lauknes,O. Fredin, Y. Larsen, B. Davidsen, and E. Anda, “Normal fault control on alpinelandscapes in Norway,” European Geosciences Union Annual Meeting (EGU 2008),Vienna, Austria, April 13–18, 2008, presentation only.
17. I. H. C. Henderson, T. R. Lauknes, P. T. Osmundsen, T. Redfield, and Y. Larsen,“The dynamics of active landslide development and evolution: a combined struc-tural geology, geomorphology and InSAR approach,” Slope Tectonics 08, Lausanne,Switzerland, February 15–16, 2008, presentation only.
18. P. T. Osmundsen, I. Henderson, T. R. Lauknes, T. F. Redfield, Y. Larsen, andJ. Dehls, “Tectonic controls on topography and rockslide distribution in Tromscounty, Norway,” Slope Tectonics 08, Lausanne, Switzerland, February 15–16, 2008,presentation only.
19. T. R. Lauknes, Y. Larsen, J. Dehls, I. Henderson, and H. A. Zebker, “RegionalLandslide Mapping and Monitoring in Norway Using SBAS InSAR,” AmericanGeophysical Union Fall Meeting (AGU 2007), San Francisco, CA, U.S.A., December10–14, 2007, presentation only.
20. T. R. Lauknes, J. Dehls, L. H. Blikra, and Y. Larsen, “Rockslide hazards in Stor-fjorden, Western Norway - Application of InSAR and other site investigations,”5th International Workshop on ERS SAR Interferometry: Advances in SAR Interferom-etry from ENVISAT and ERS missions (FRINGE 2007), ESA ESRIN, Frascati, Italy,November 26–30, 2007, presentation only.
21. T. R. Lauknes, Y. Larsen, J. Dehls, I. Henderson, and H. A. Zebker, “Regional scalelandslide mapping in Northern Norway using SBAS InSAR,” 5th InternationalWorkshop on ERS SAR Interferometry: Advances in SAR Interferometry from ENVISATand ERS missions (FRINGE 2007), ESA ESRIN, Frascati, Italy, November 26–30,2007, presentation only.
22. T. R. Lauknes, Y. Larsen, H. Johnsen, and T. Eltoft, “Characterization of coher-ent scatterers in natural terrain using SAR polarimetry,” in Proc. 3rd International
8

Workshop on Science and Applications of SAR Polarimetry and Polarimetric Interferom-etry (PolInSAR 2007), ESA ESRIN, Frascati, Italy, January 22–26, 2007, 6 pp.
23. I. H. Henderson, T. R. Lauknes, P. T. Osmundsen, T. Redfield, J. Dehls, and Y.Larsen, “The dynamics of active landslide development and evolution: a com-bined structural geology, geomorphology and InSAR approach,” American Geo-physical Union Fall Meeting (AGU 2007), San Francisco, CA, U.S.A., December 10–14, 2007, presentation only.
24. H. H. Christiansen, I. Berthling, L. H. Blikra, J. Dehls, B. Etzelmller, H. Farbrot,O. Humlum, K. Isaksen, H. Juliussen, T. R. Lauknes, K. Midttømme, and J. S.Rønning, “Permafrost Observatory Project: A Contribution to the Thermal State ofPermafrost in Norway and Svalbard, TSP NORWAY,” American Geophysical UnionFall Meeting (AGU 2007), San Francisco, CA, U.S.A., December 10–14, 2007, pre-sentation only.
25. J. Dehls, T. R. Lauknes, Y. Larsen, and I. H. C. Henderson, “Regional landslidemapping and monitoring in Norway using SBAS InSAR,” 3rd International Geohaz-ards Workshop, IGOS Geohazards, ESA ESRIN, Frascati, Italy, November 6–9, 2007,presentation only.
26. Y. Larsen, G. Engen, T. R. Lauknes, E. Malnes, and K. A. Høgda, “A genericdifferential InSAR processing system, with applications to land subsidence andSWE retrieval,” in Proc. Advances in SAR Interferometry from ENVISAT and ERSmissions (FRINGE 2005), ESA ESRIN, Frascati, Italy, November 28–December 2, 6pp., 2005.
9

10
Chapter 2
Synthetic Aperture Radar Imaging
In this Chapter, we will introduce the basic principles behind satellite synthetic apertureradar (SAR) imaging. More detailed treatments of the SAR principle can be found ine.g. [Curlander and McDonough, 1991, Franceschetti and Lanari, 1999, Cumming andWong, 2005].
2.1 Synthetic Aperture Radar
A spaceborne or airborne SAR images the Earth’s surface in a side-looking geometry asshown in Figure 2.1. As the SAR moves along its (assumed) straight path, it illuminatesa swath on the ground by transmitting a series of EM microwave pulses. The anglebetween the radar beam and the surface normal is called incidence angle, θ.
The SAR receiver detects the stream of echoes reflected from the Earth’s surface. Theenergy scattered back towards the radar is called backscatter, and the echoes are pro-duced since the terrain consists of different scatterers such as, trees, rocks, or buildingson the ground that interacts with the incoming microwave radiation. The received sig-nals, after demodulation, are complex, having both amplitude and phase. The receivedamplitude is characterized by geometrical properties of the scatterer, as well as geomet-rical imaging factors. The received phase is determined by the phase of the transmittedsignal, the dielectric properties of the medium, and the position of the scatterer.
The SAR focused image, referred to as single-look complex (SLC), is arranged in a2D array, with coordinates slant range, R, for the distance from the SAR, and azimuth, x,for the position of the scatterer along the SAR flight path, see Figure 2.1.
2.1.1 Range and azimuth resolution
A high signal-to-noise ratio (SNR) is desirable in all radar systems. The SAR focusingprinciple involves transmitting a linear frequency modulated (FM) chirped pulse, al-lowing the use of longer pulses to increase the pulse energy. If the bandwidth of the
11

Look angle
SAR satelliteSatelliteflight direction
Radiated pulses
Ground swath
Figure 2.1: Simplified geometry of a synthetic aperture radar (SAR) system.
chirp is β [MHz], the slant range resolution is [Cumming and Wong, 2005]
∆R =c
2β, (2.1)
where c is the velocity of light. For typical spaceborne SAR systems with pulse band-widths from 15–150 MHz, this will result in a slant range resolution between 1–10 m.
Wiley showed in 1954 that a moving platform produces a Doppler shift, creatingan azimuth frequency spread when passing over an object on the ground. Echoes re-flected from objects in front of the moving sensor are frequency shifted relative to theechoes reflected from behind [Wiley, 1954]. This Doppler spread is in essence a motion-induced chirp, and a similar processing technique that is used in range can now also beemployed in azimuth. The best azimuth resolution obtainable with a SAR is
∆x =L
2, (2.2)
which is independent on the distance from the radar to the target [Franceschetti andLanari, 1999]. Here, L is the antenna length in along-track direction. Shorter antennasyield finer resolutions since a single point on the ground will be illuminated for a longertime.
Table 2.1 summarizes the relevant satellite SAR sensors, with their important param-eters.
12

(a) (b)
(c) (d)
Figure 2.2: SAR images from different sensors illustrating different ground resolu-tions. All images have been geocoded to the same pixel size. (a) Envisat ASAR, (b)RADARSAT-2 Ultra-fine, (c) TerraSAR-X Stripmap. (d) aerial photo. It should be notedthat the three SAR sensors operate with different incidence angles, leading to differentlevels of radar shadow.
13
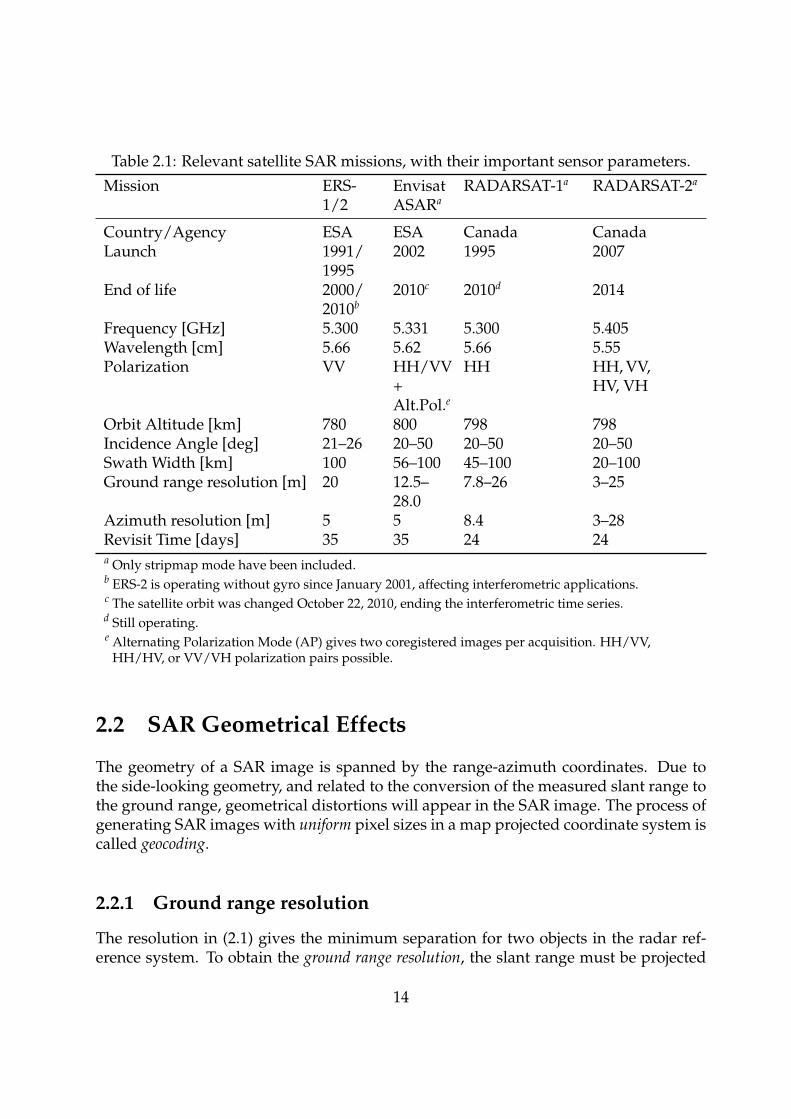
Table 2.1: Relevant satellite SAR missions, with their important sensor parameters.
Mission ERS-1/2
EnvisatASARa
RADARSAT-1a RADARSAT-2a
Country/Agency ESA ESA Canada CanadaLaunch 1991/
19952002 1995 2007
End of life 2000/2010b
2010c 2010d 2014
Frequency [GHz] 5.300 5.331 5.300 5.405Wavelength [cm] 5.66 5.62 5.66 5.55Polarization VV HH/VV
+Alt.Pol.e
HH HH, VV,HV, VH
Orbit Altitude [km] 780 800 798 798Incidence Angle [deg] 21–26 20–50 20–50 20–50Swath Width [km] 100 56–100 45–100 20–100Ground range resolution [m] 20 12.5–
28.07.8–26 3–25
Azimuth resolution [m] 5 5 8.4 3–28Revisit Time [days] 35 35 24 24a Only stripmap mode have been included.b ERS-2 is operating without gyro since January 2001, affecting interferometric applications.c The satellite orbit was changed October 22, 2010, ending the interferometric time series.d Still operating.e Alternating Polarization Mode (AP) gives two coregistered images per acquisition. HH/VV,
HH/HV, or VV/VH polarization pairs possible.
2.2 SAR Geometrical Effects
The geometry of a SAR image is spanned by the range-azimuth coordinates. Due tothe side-looking geometry, and related to the conversion of the measured slant range tothe ground range, geometrical distortions will appear in the SAR image. The process ofgenerating SAR images with uniform pixel sizes in a map projected coordinate system iscalled geocoding.
2.2.1 Ground range resolution
The resolution in (2.1) gives the minimum separation for two objects in the radar ref-erence system. To obtain the ground range resolution, the slant range must be projected
14

Table 2.1: Relevant satellite SAR missions, with their important sensor parameters. (con-tinued)Mission ALOS
PALSARaTerraSAR-Xa COSMO-
SkyMedaSentinel-1a/ba
Country/Agency Japan Germany Italy ESALaunch 2005 2007 2007 2012End of life 2010d 5 years 5 yearsf 7 yearsFrequency [GHz] 1.27 9.65 9.6 5.405Wavelength [cm] 23.60 3.10 3.12 5.55Polarization HH, VV,
HV, VHHH, VV,HV, VH
HH, VV,HV, VH
VV+VH,HH+HV
Orbit Altitude [km] 692 514 620 693Incidence Angle [deg] 8–60 20–55 25–50 20–45Swath Width [km] 30–70 5–30 10–40 80–400Ground range resolution [m] 10–30 0.75–3.5 1–3 5–25Azimuth resolution [m] 4.5 1.1–3.3 1–3 5–40Revisit Time [days] 46 11 4g 12h
a Only spotlight and stripmap modes have been included.d Still operating.f Lifetime of each cluster satellite is 5 years, with a planned cluster operational period of 3 years.g Cluster of four satellites with a theoretical 4 days revisit time.h With the addition of Sentinel-1b, the revisit time will be 6 days.
onto the ground, see Figure 2.1
∆Rg =∆R
sin θ=
c
2β sin θ, (2.3)
where β is the radar bandwidth, ∆R is the slant range resolution from (2.1), and θ isthe radar incidence angle, as observed in Figure 2.1. The increase of the incidence angleθ from near to far range leads to an improvement in the ground resolution. For theERS satellites, with a relatively steep incidence angle of 21◦–26◦, this corresponds to animprovement in the ground range resolution from near range to far range.
Figure 2.2 shows examples of SAR images with different resolutions, including En-visat ASAR (5 m × 25 m), RADARSAT-2 Ultra-fine (1.6 m × 2.8 m), and TerraSAR-XStripmap mode (1.0 m × 3.3 m), where the resolutions are given in (slant) range and az-imuth directions, respectively. The improvement in distinguishable features is obvious.
15

Layover Shadow
RadarImage
Radar beam
Shadow region
(a) (b)
Figure 2.3: Example illustrating geometrical imaging effects that can limit SAR appli-cations in mountainous regions. (a) geometrical principles behind radar layover andshadow, (b) a SAR intensity image covering the area of Romsdalen in Norway. Areaswith severe layover and shadow can be seen.
2.2.2 Radar shadow and foreshortening
When topographic features exist, foreshortening can appear on the front side of a hill,resulting in compressed pixels on the ground. For steep-looking spaceborne radar sys-tems, the across-track slant range differences between two points located on foreslopesof mountains are smaller than they would be in flat areas. In the extreme case, layoverappear when the top of a hill is closer to the radar than the foot of the hill. In this case,the received signal from at least two different altitudes is added into one slant rangeresolution cell, leading to a very high radar return. The layover effect can easily be ob-served in SAR images as areas with extremely high intensity. On the other side of themountain, radar shadow occurs in the area not being illuminated. In mountainous areas,foreshortening, layover, and shadow effects are obvious, see Figure 2.3 for an extremeexample from the area of Romsdalen in Norway. Most modern satellites have the pos-sibility to operate within a range of different incidence angles, while the ERS satellites,for example, had a fixed, relatively steep, incidence angle.
16

azimuth
slantrange
East
North
azimuth
slantrange
East
North
Figure 2.4: Geometry of ascending (left) and descending (right) satellite orbits.
2.3 Satellite Orbit Configuration
A polar orbiting satellite passes any area in both ascending and descending modes. Anascending orbit is defined where the satellite crosses the equator going from south tonorth, and the descending orbit where the satellite crosses the equator going from northto south, see Figure 2.4.
From Figure 2.4 it is clear that a descending orbit gives mainly nondistorted coveragein west facing slopes, and an ascending orbit covers east facing slopes.
However, as we will return to in Chapter 3, we would at this point like to stressthat the satellite SAR imaging geometry, shown in Figure 2.4, limits the applicabilityto perform surface displacement analysis in certain areas. The radar is only sensitiveto displacement that has a component in the radar line-of-sight (LOS) direction. Sen-sitivity is thus very low in cases where the actual surface displacement vector is nearperpendicular to the LOS. Earth observing satellites in polar orbits fly in a directionclose to North-South direction, and the sensitivity to surface displacement in this planeis near zero.
17

18
Chapter 3
SAR Interferometry
In this Chapter, we will introduce the principles behind the InSAR method. More de-tailed InSAR treatments can be found in e.g. [Massonnet and Feigl, 1998, Bamler andHartl, 1998,Franceschetti and Lanari, 1999,Rosen et al., 2000,Rocca et al., 2000,Hanssen,2001, Kampes, 2006]. In Section 3.7, we introduce the concept of interferometric timeseries methods.
3.1 Introduction
SAR interferometry uses the phase difference between a target in two SAR images tocharacterize ground surface parameters. Due to the imaging geometry, InSAR providessensitivity to both surface topography as well as possible surface displacement changes.The first example of using InSAR for topographic mapping was shown by [Graham,1974], while the first practical results of observations performed with a dual antennaside-looking airborne radar was reported by [Zebker and Goldstein, 1986]. The firstdemonstration of the repeat-pass differential InSAR technique to detect surface dis-placement was presented by [Gabriel et al., 1989].
The differential InSAR technique involves removing the topographic phase contri-bution [Rosen et al., 2000]. The phase difference between two SAR images can thenpotentially be used to detect millimeter to centimeter scale ground deformation pat-terns.
The so called repeat-pass InSAR technique involves comparing SAR data acquiredat repeated satellite (or airborne) orbits, providing the possibility to study phenomenarelated to temporal ground surface changes occurring between the acquisitions. Thelaunch of the ESA ERS satellites in the 1990’s triggered a lot of InSAR research activity,and numerous applications were demonstrated. In this period, InSAR was success-fully used to study surface displacement due to e.g. glacier dynamics [Goldstein et al.,1993], volcano deformation [Massonnet et al., 1995, Amelung et al., 2000], and earth-quakes [Massonnet et al., 1993, Massonnet and Feigl, 1998].
Recently, the potentiality of differential InSAR has been investigated to study land-
19

Surfacedisplacementin radar LOS
Figure 3.1: Detecting surface displacement with InSAR. An area on the ground is im-aged at two different times t0 and t1. A possible surface deformation occurring betweenthe acquisition times will lead to an interferometric phase term ∆Rd. The cloud at thet0 radar acquisition illustrates that atmospheric effects can effect the radar propagation,producing an additional path delay.
slides and rockslides [Berardino et al., 2003, Hilley et al., 2004, Strozzi et al., 2005, Rottand Nagler, 2006, Colesanti and Wasowski, 2006].
3.2 Interferometric Phase
A coherent radar extracts information about a target by measuring both amplitude andphase of the received echo. The phase measured by a radar is a function of the two-waypropagation delay, and is proportional to the distance to the target
φ =4π
λR, (3.1)
where R is the geometrical distance travelled by the propagating EM wave.Let us consider the InSAR configuration as shown in Figure 3.1, where an object on
the ground at height z is imaged at two different times, t = t0 and t = t1. The two SARantennas are separated by a baseline vector B. The distances from the two antennas tothe point on the ground are R and R+∆R. Each radar independently measures the timedelay for the radar pulse to reach the point on the ground and return to the antenna.
The received amplitude and phase for a pixel on the ground in each of the two an-
20
tennas can then be written as
u0 = a0e−jφ0 = a0e
−j 4πλ
R
u1 = a1e−jφ1 = a1e
−j 4πλ
(R+∆R),(3.2)
where a0 and a1 are the amplitudes of the two signals, j is the imaginary unit, and thereceived phase of each antenna is related to the target distance. From (3.2) we form thecomplex interferogram as
Φ = u0u∗1 = a0a1e
j 4πλ
∆R = a0a1ej∆φ, (3.3)
where ∗ denotes the complex conjugate, and ∆φ is the interferometric phase. The pathdifference between the two signals can then be determined to an accuracy within afraction of the wavelength by looking at the phase difference of the received echoes.
The observed phase in an interferogram (∆φ) is thus related to the difference in dis-tance to the target for the two acquisitions. The phase difference has several signalcomponents: topography, terrain deformation in the radar line of sight (LOS) betweenthe acquisitions, and atmospheric differences, as illustrated in Figure 3.1.
The interferometric phase difference, with respect to a ground reference point, canbe decomposed into several parts [Berardino et al., 2002]
∆φ =4π
λ
B⊥
R sin θz +
4π
λ∆Rd + ∆φAPS + ∆φdecorr, (3.4)
where λ is the radar wavelength, z is the elevation of the target point above a referenceplane, B⊥ is the distance between the two orbits (perpendicular baseline), projected ontothe LOS, ∆Rd is possible surface displacement in LOS, R is the range distance, θ is theincidence angle, ∆φAPS is the difference in atmospheric path delay (atmospheric phasescreen (APS)), and ∆φdecorr is a noise term including other noise contributions.
In order to study surface displacement, the topographic contribution (first term of(3.4)) has to be removed. This is most often done by using an external high-precisiondigital elevation model (DEM) [Rosen et al., 2000]. However, a three-pass InSAR methodcan also be used. This method involves combining three SAR scenes; two with a shorttemporal baseline to retrieve the topographic signal, and the combination of these twowith a third to produce a differential interferogram [Zebker et al., 1994].
InSAR is an extremely powerful technique for detection of surface displacement inthe radar LOS direction. From Figure 3.1(right) it is clear that the interferometer mea-sures the projection of the displacement vector in the radar LOS direction. In order toreconstruct the full three-dimensional (3D) vector displacement, several observationshave to be made from different viewing angles.
3.3 Interferometric Coherence
The phase accuracy in SAR interferometry is mainly affected by phase noise and decor-relation. A quality measure of the interferometric phase is the complex correlation co-
21

efficient, or complex coherence, defined as [Bamler and Hartl, 1998]
γ =E[u0u
∗1]√
E[|u0|2]E[|u1|2], (3.5)
where E[·] is the expectation operator, and u0 and u1 are the two complex SAR imagevalues. The expectation operators in (3.5) are often replaced with spatial averagingwithin a neighborhood of the pixel of interest. If we assume Gaussian image statistics,the maximum likelihood (ML) estimate of the coherence |γ| is [Bamler and Hartl, 1998]
|γ|ML =|∑L
n=1 u0[n] u∗1[n]|√∑Ln=1 |u0[n]|2
∑Ln=1 |u1[n]|2
, (3.6)
summing over L independent samples. Note that often only the magnitude value ofthe complex coherence, referred to as coherence, is used. The values of |γ| are between0 and 1, where a coherence value of 1 corresponds to perfect phase correlation betweenthe two measurements. Coherence values less than unity correspond to reduced phasecoherence, caused by noisy phase measurements.
3.4 Interferometric Phase Decorrelation
Phase decorrelation is due to changes in position of individual scatterers within theresolution cell [Zebker and Villasenor, 1992], and is one of the main limitations for suc-cessful use of InSAR. Decorrelation can arise from either SAR imaging geometric ef-fects (spatial decorrelation), or from temporal backscattering changes (temporal decor-relation) [Gatelli et al., 1994, Zebker and Villasenor, 1992]. The different decorrelationsources contribute multiplicatively to the coherence γ, and the most important decorre-lation sources can be written as [Zebker and Villasenor, 1992, Hanssen, 2001]
γ = γspatial · γtemporal · γthermal · γDopplerCentroid · γvolumetric. (3.7)
Spatial baseline decorrelation occurs when the interferometric baseline is not exactlyzero. The radar receives the coherent sum of all independent scatterers within the res-olution cell, and these contributions are added slightly differently due to the differentgeometries. The baseline decorrelation is related to the different incidence angles of thetwo SAR acquisitions, and leads to a critical baseline1 length, above which the interfero-metric phase is pure noise.
Temporal decorrelation is the most problematic to characterize theoretically. It isdue to changes in geometrical or electrical properties of the surface, as function of timebetween the acquisitions. These changes may be caused by moving parts of vegetation,erosion on the land surface, or agricultural activity. Terrain containing variable liquid
1The critical baseline depends on pulse bandwidth, wavelength, and local topography.
22

water, such as e.g., areas covered with wet snow, will also have different scatteringproperties from one observation to the next [Guneriussen et al., 2001]. Forest is shown tohave a generally low coherence, even for a temporal baseline as short as one day, whileurban and arid areas show high coherence also for acquisition time intervals longer thanone year [Strozzi et al., 2000]. The temporal decorrelation phenomena are dependenton the radar wavelength; longer wavelengths are less sensitive to small scale surfacescattering changes, however with reduced sensitivity to displacement [Strozzi et al.,2003].
Thermal decorrelation is due to system noise, and can be related to the SNR, of theradar system, which for modern SAR sensors is close to unity [Hanssen, 2001]. Further-more, decorrelation terms for the InSAR processing have not been included, since theyonly introduce small amounts of decorrelation [Hanssen, 2001].
Doppler centroid decorrelation is caused by the differences in Doppler centroids forthe two acquisitions. It is the azimuth equivalent of the spatial decorrelation compo-nent, which is a range geometry phenomena.
Volumetric decorrelation is caused by propagation of the radar wave through thescattering medium. It depends highly on the radar wavelength and the dielectric prop-erties in the medium.
3.5 Phase Unwrapping
Due to the complex SAR imaging process, the interferometric phase may only be mea-sured on the restricted interval [−π, π] (wrapped phase) [Bamler and Hartl, 1998]. Aretrieval operation must therefore be carried out on the 2D measured InSAR phase fieldin order to estimate the phase gradient between two adjacent phase samples, and to re-late it to any geophysical phenomenon [Goldstein et al., 1988]. The absolute unwrappedinterferometric phase is directly proportional to the difference in path lengths for theSAR image pair. The process of restoring the correct multiple of 2π to each point of theinterferometric phase image is referred to as phase unwrapping, and this step is one ofthe most challenging aspects for successful application of SAR interferometry.
Many different phase unwrapping algorithms exist, and the topic of 2D phase un-wrapping is still one of the most challenging for operational use of InSAR. Some well-used phase unwrapping algorithms are discussed by [Goldstein et al., 1988,Bamler andHartl, 1998, Costantini, 1998, Ghiglia and Pritt, 1998, Chen and Zebker, 2000, Chen andZebker, 2001].
If we are interested in monitoring slow moving surface phenomena, e.g. rockslides,we need to apply many SAR scenes captured over a long period. Consequently, theinterferogram stack will include interferograms formed using large temporal or spatialbaselines. Thus, large areas will often decorrelate, due mainly to large spatial baselinesand temporal effects that result from changes in scattering properties within the resolu-tion cell between the two dates used to form the interferogram [Zebker and Villasenor,1992, Hanssen and Usai, 1997]. Such decorrelation effects often contaminate large ar-
23

eas in the interferograms with phase noise, making the retrieval of absolute phase frommeasurements that are ambiguous by integer multiples of 2π, a very challenging task.
Access to large stacks of SAR data have led to the development of sparse space-timealgorithms that try to exploit the redundant information in both space and time [Pepeand Lanari, 2006, Hooper and Zebker, 2007, Shanker and Zebker, 2010].
3.6 Electromagnetic Propagation Delay
The true refractivity of the atmosphere is different from vacuum, and any propagat-ing electromagnetic waves will be delayed. The total atmospheric delay consists oftwo parts. The first part is related to the propagation velocity being lower than speedof light. The other part is related to signal bending, which is a result of refractive in-dex variations both in the plane perpendicular to the propagation direction, and in thepropagation direction [Ishimaru, 1978,Ulaby et al., 1982,Davis et al., 1985]. The bendingdelay is very small, and can be ignored for typical SAR systems.
Assuming a spherically symmetric atmosphere, the atmospheric zenith total delay(ZTD) through the atmosphere is found by integrating the refractivity N(z) along thepropagation path between the surface elevation z0 and the top of the atmosphere z∞
l =
∫ z∞
z0
N(z)dz. (3.8)
From 3.1, the total two-way phase delay measured by the radar is
φ =4π
λ(R + l) =
4π
λ[R +
∫ z∞
z0
N(z)dz], (3.9)
where R is the geometrical distance (in free space), and l is an equivalent distance dueto the atmospheric path delay.
3.6.1 Tropospheric effects on InSAR measurements
An interferogram is a difference between two SAR acquisitions, and spatial or temporalchanges of the refractivity modify the spatial propagation velocity of the electromag-netic wave. A radar interferometer measures the phase difference with accuracy onthe order of a fraction of the wavelength; more than accurate enough to be influencedby atmospheric path delay. Phase propagation delay due to atmospheric variability isone of the main error sources in repeat-pass InSAR. It produces erroneous differentialrange delays that, if not corrected for, can be misinterpreted as either topography ordisplacement [Goldstein, 1995,Zebker et al., 1997]. At the microwave frequencies in useat the current operating SAR satellites (X-, L-, and C-band), phase delay caused by tro-pospheric precipitable water vapor can reach up to 10–20 cm [Goldstein, 1995, Zebkeret al., 1997, Hanssen, 2001].
24

It is common to divide the atmospheric path delay into one component comingfrom turbulent mixing processes, and a stratified component correlating with eleva-tion [Hanssen, 2001]. Turbulent mixing comes from mixing processes in the inhomo-geneous atmosphere [Ishimaru, 1978], while stratification results from variations in thevertical refractive index profile [Hanssen, 2001].
Following [Hanssen, 2001,Doin et al., 2009], we separate the atmospheric refractivityinto a component δN(x, y, z) related to spatially variable, turbulent atmosphere, and onecomponent N(z) related to a spatially averaged atmospheric stratification.
N(x, y, z) = N(z) + δN(x, y, z), (3.10)
where x, y are range and azimuth positions, and z is height above the ellipsoid.The stratification effect on InSAR data can be severe in areas with rough topography,
and the research topic has been the source of several investigations, focusing both onquantification and mitigation, e.g. [Goldstein, 1995,Beauducel et al., 2000,Bonforte et al.,2001, Wadge et al., 2002, Webley et al., 2002, Remy et al., 2003, Lohman and Simons,2005, Cavalie et al., 2007, Chaabane et al., 2007, Doin et al., 2009].
In Chapter 6, we present an approach to estimate and mitigate stratification effectsusing a stack of small baseline SAR interferograms.
3.7 Time Series InSAR
The use of spaceborne InSAR for surface displacement studies had its breakthroughwith the launch of the ESA ERS C-band (5.5 cm wavelength) satellites, and during the1990’s, the principle of differential InSAR to study different kinds of surface displace-ment phenomena was widely demonstrated [Massonnet and Feigl, 1998].
The challenge in InSAR is to separate the wanted signal (e.g. deformation or to-pography) from the sum of all phase contributions. For terrain displacement studies,temporal decorrelation can be considered a random noise source while errors in theDEM used to remove the topographic phase, orbital errors, and atmospheric changeswill introduce a spatially correlated phase error contribution [Zebker and Villasenor,1992, Zebker et al., 1997, Hanssen, 2001].
Later, the research community realized that C-band InSAR systems are very proneto temporal decorrelation, limiting the use of C-band radars for long-term surface dis-placement monitoring, particularly in areas with vegetation cover.
The general availability of historical SAR data for research use, has since the late1990’s led to the development of several innovative time series InSAR methods. Bymoving from single interferograms that can give information about a distinct defor-mation event (e.g. an earthquake), new methods are focusing on the studies of entiredata stacks, composed of SAR data from many years, to study the temporal displacementhistory. Furthermore, the availability of large data stacks makes it possible to applytemporal and spatial filters to mitigate unwanted phase contributions.
25

Distributedscattering
Singlescatterer (PS)
One dominatingscatterer (PS)
Figure 3.2: Different surface scattering mechanisms. A pixel with distributed scatteringmechanism (left), a dominating point scatterer (middle), and a pixel with one scattererthat is brighter than all other (right). The images represent the scatterers contributing tothe phase of a singe pixel. Modified from [Hooper et al., 2007].
The advanced time series InSAR methods can be broadly classified into two maingroups:
• methods based on spatial correlation and distributed scattering, referred to as smallbaseline methods (SB) [Lundgren et al., 2001, Berardino et al., 2002, Mora et al.,2003, Schmidt and Burgmann, 2003, Lanari et al., 2007, Prati et al., 2010, Sansostiet al., 2010], and
• methods based on locating persistent scatterers (PSs), referred to as persistent scat-terer interferometry (PSI) methods [Ferretti et al., 2000, Ferretti et al., 2001, Werneret al., 2003, Hooper et al., 2004, Kampes, 2006, Prati et al., 2010].
A method combining both SB and PSI has been presented by [Hooper, 2008].Figure 3.2 illustrates different scattering mechanisms that can be expected from a
pixel under study. A coherent point like target is a scatterer that dominates the scatter-ing from the resolution cell. Due to the broad scattering lobe, point targets are visiblefrom a large span of viewing angles. A PS is a target whose amplitude and phase isconstant as a function of time.
If a pixel includes one scatterer that is brighter than the other ones, the pixel phasevariance is significantly reduced with respect to the case of distributed scattering froma high number of point targets. A persistent scatterer can be the corner of a building ora rock formation in rural areas.
The other scattering method illustrated in Figure 3.2 is distributed scattering, wherethe measured scattering is the coherent summation of all individual small scattererswithin the resolution cell.
3.7.1 Small baseline methods
Small baseline methods are optimized for the distributed scattering mechanism, whereseveral adjacent resolution cells represent the same physical deformation phenomena.
26

In areas with distributed scattering, complex multilooking is applied in order to reducephase decorrelation noise [Zebker and Villasenor, 1992]. However, the cost of this aver-aging is a reduction of the spatial resolution.
Given a data stack of multiple SAR images, the distributed scattering method willgive best results when exploiting interferometric pairs with as small spatial baselineas possible. The rationale behind all SB methods is to combine interferograms with ashort spatial baseline, in order to minimize spatial decorrelation as well as effects dueto errors in the DEM used.
The stacking approach is the simplest form of an SB approach. In this method, shortbaseline interferograms are averaged, weighted by the temporal difference between thescenes used, in order to provide a mean velocity displacement map, with reduced at-mospheric noise [Sandwell and Price, 1998, Peltzer et al., 2001].
Later, other SB approaches have been presented, with SBAS as the most well known.Common to these SB methods is that they combine interferograms acquired with smallbaselines, to invert for displacement signatures, in addition to allowing for applicationof advanced atmospheric filters.
The SBAS method, one specific SB implementation, is described in more detail inchapters 5 and 7.
3.7.2 Persistent scatterer methods
The term persistent scatterer interferometry (PSI) characterizes InSAR techniques thatanalyze the temporal phase evolution of individual coherent point scatterers.
It was first noted by [Hanssen and Usai, 1997, Usai, 1997] that certain man madetargets exhibited high coherence even when using interferograms with long time spans(temporal baseline) and large spatial baselines. It became clear that these point targetscould be exploited for displacement monitoring.
The approach referred to in the literature as “Permanent Scatterer” or “PersistentScatterer” has been developed by Politecnico di Milano (the Technical University of Mi-lan) [Ferretti et al., 2000, Ferretti et al., 2001], and is based on analyzing a data stackof multiple SAR scenes (typically >20) in order to find pixels that contain a scattererthat is coherent over time. Differential interferograms are produced with respect to onecommon master geometry. All interferometric combinations are employed, even thoseexceeding the critical baseline. The generated interferograms are often severely decor-related. However, by searching for pixels that include a stable scatterer, a network ofso called persistent scatterers can be established, where displacement signal and 3D scat-terer position can be resolved, even in areas where temporal and spatial decorrelationprevents the use of standard multilooking techniques. The persistent scatterers can beselected based on amplitude stability in the whole set of images. Such a statistical mea-sure requires a large stack of images.
The persistent scatterer InSAR principle is not the main topic of this thesis. However,in Chapter 7, we present a study where SBAS and PSI methods are compared.
27

28

Chapter 4
Discussion
In this Chapter, we discuss particular challenges for successful application of InSAR intypical Norwegian fjord landscape. As a general comment, we observe that the rock-slides in northern Norway are mostly located above 500–700 m elevation, where thevegetation cover is limited. Hence, the interferometric coherence is generally very good.However, as we will discuss in this Chapter, there are certain conditions that makeInSAR processing challenging. In Section 4.3 we discuss the possibilities that emergesfrom using new high-resolution sensors, and in Section 4.4 we briefly discuss how wecan move from mapping to monitoring by using radar corner reflectors.
4.1 Study Areas
In Norway, several counties are susceptible to large rockslides [Blikra et al., 2006]. Acomprehensive study is currently ongoing, involving several different institutions andinternational partners, focusing on the possibility for large rockslides in Norway. Themain focus areas has been Lyngen in Troms County and Møre og Romsdal County.These were chosen because of their steep topography and history of rockslide activ-ity [Braathen et al., 2004, Blikra et al., 2006].
Two selected rockslides, Aknes in Møre og Romsdal County, western Norway, andNordnes in Troms County, northern Norway, have been classified as high-risk due totheir high consequence if a catastrophic failure would happen. These rockslides, illus-trated in Figure 4.1, are the main study sites for the research in this thesis.
4.1.1 Aknes
The Aknes rockslide is located in Møre og Romsdal County, western Norway, see Fig-ure 4.1. This rockslide is located in an fjord where many historical landslides have beenmapped [Blikra et al., 2006]. This area draws considerable attention due to the hazardof a tsunami, generated as a result of a large rock slope failure.
29
The Aknes rockslide is one of the most investigated and monitored rockslides in theworld. The investigations include both regional mapping in the fjord region and a mul-titude of site specific investigations [Blikra et al., 2008, Ganerød et al., 2008, Kveldsviket al., 2009,Nordvik and Nyrnes, 2009,Nordvik et al., 2009,Grøneng et al., 2009,Grønenget al., 2010a, Grøneng et al., 2010b].
At the Aknes site, steep topography and vegetation limit the InSAR coherence be-tween successive SAR acquisitions. In fall of 2005, we installed four radar corner re-flectors. SAR data from three parallel Envisat ASAR tracks have been regularly ac-quired in the period 2005–2010, and RADARSAT-2 Fine and Ultra-fine modes, as well asTerraSAR-X data are currently being acquired. Processing of this data is ongoing [Lauk-nes et al., 2009].
The Aknes area has been the study location for the work presented in Section 4.3.1and in Chapter 6.
4.1.2 Nordnes
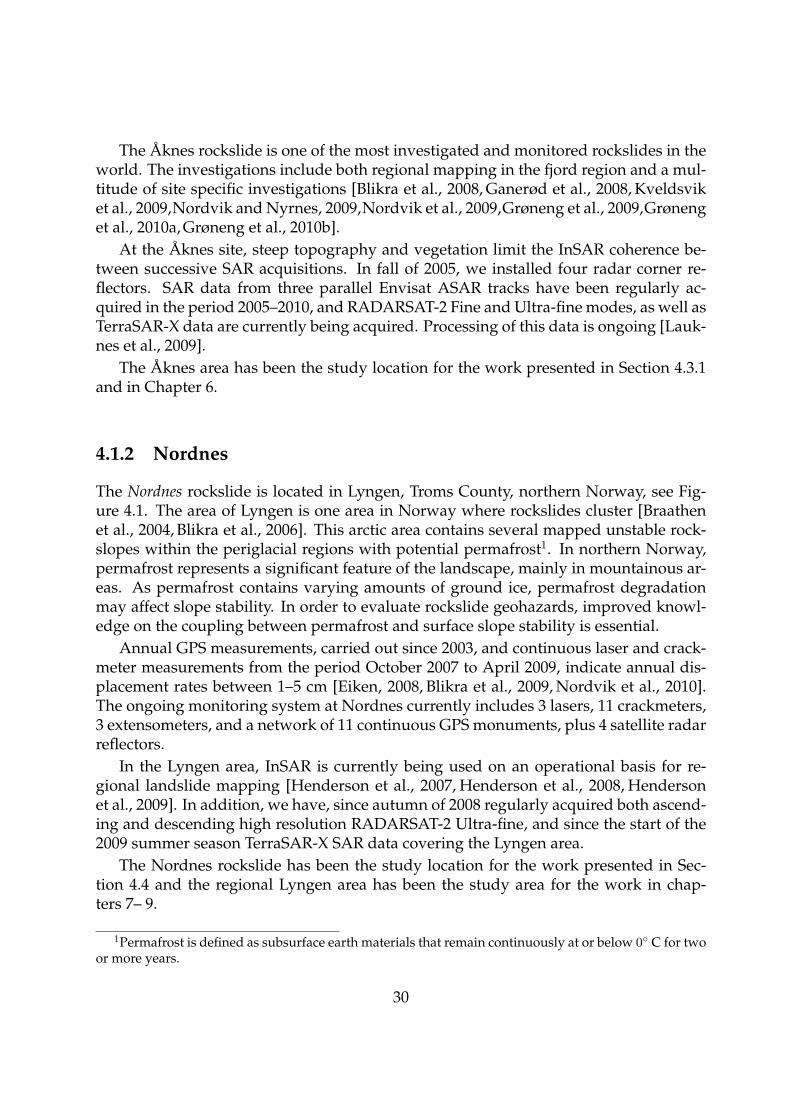
The Nordnes rockslide is located in Lyngen, Troms County, northern Norway, see Fig-ure 4.1. The area of Lyngen is one area in Norway where rockslides cluster [Braathenet al., 2004, Blikra et al., 2006]. This arctic area contains several mapped unstable rock-slopes within the periglacial regions with potential permafrost1. In northern Norway,permafrost represents a significant feature of the landscape, mainly in mountainous ar-eas. As permafrost contains varying amounts of ground ice, permafrost degradationmay affect slope stability. In order to evaluate rockslide geohazards, improved knowl-edge on the coupling between permafrost and surface slope stability is essential.
Annual GPS measurements, carried out since 2003, and continuous laser and crack-meter measurements from the period October 2007 to April 2009, indicate annual dis-placement rates between 1–5 cm [Eiken, 2008, Blikra et al., 2009, Nordvik et al., 2010].The ongoing monitoring system at Nordnes currently includes 3 lasers, 11 crackmeters,3 extensometers, and a network of 11 continuous GPS monuments, plus 4 satellite radarreflectors.
In the Lyngen area, InSAR is currently being used on an operational basis for re-gional landslide mapping [Henderson et al., 2007, Henderson et al., 2008, Hendersonet al., 2009]. In addition, we have, since autumn of 2008 regularly acquired both ascend-ing and descending high resolution RADARSAT-2 Ultra-fine, and since the start of the2009 summer season TerraSAR-X SAR data covering the Lyngen area.
The Nordnes rockslide has been the study location for the work presented in Sec-tion 4.4 and the regional Lyngen area has been the study area for the work in chap-ters 7– 9.
1Permafrost is defined as subsurface earth materials that remain continuously at or below 0◦ C for twoor more years.
30
5˚
5˚
10˚
10˚
15˚
15˚
20˚
20˚
25˚
25˚
30˚
30˚
60˚ 60˚
65˚ 65˚
70˚ 70˚
Oslo
Trondheim
Åknesrockslide
Tromsø
Nordnesrockslide(Lyngen)
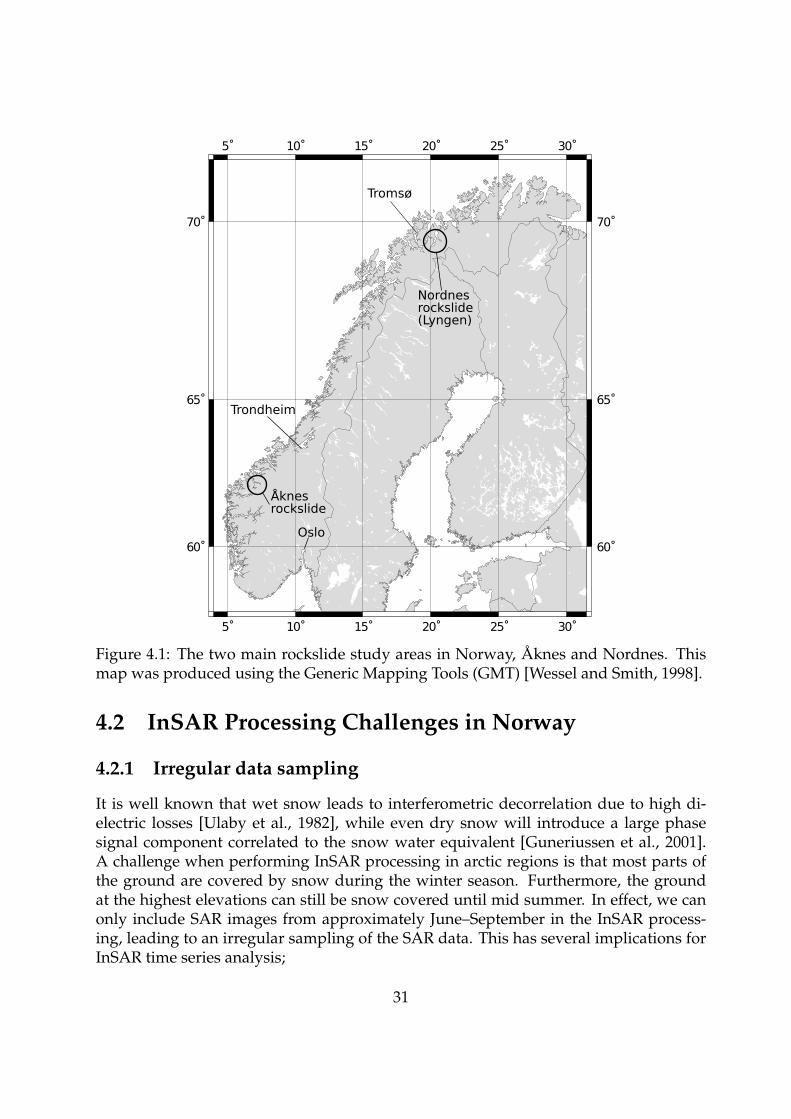
Figure 4.1: The two main rockslide study areas in Norway, Aknes and Nordnes. Thismap was produced using the Generic Mapping Tools (GMT) [Wessel and Smith, 1998].
4.2 InSAR Processing Challenges in Norway
4.2.1 Irregular data sampling
It is well known that wet snow leads to interferometric decorrelation due to high di-electric losses [Ulaby et al., 1982], while even dry snow will introduce a large phasesignal component correlated to the snow water equivalent [Guneriussen et al., 2001].A challenge when performing InSAR processing in arctic regions is that most parts ofthe ground are covered by snow during the winter season. Furthermore, the groundat the highest elevations can still be snow covered until mid summer. In effect, we canonly include SAR images from approximately June–September in the InSAR process-ing, leading to an irregular sampling of the SAR data. This has several implications forInSAR time series analysis;
31
• The irregular sampling, and in particular the long time period between each snowfree season with data, affects temporal atmospheric filtering. We can with the 35-day repeat cycle of the ERS and Envisat satellites typically only get 4–5 snow freescenes per year. The data samples are then clustered along the time dimensionwith a regular time spacing of approximately half a year between clusters. For thetemporal atmospheric filtering applied2, we need to apply long filter lengths thatspan between two seasons. Such an irregularity in the atmospheric filter lengthmay lead to filter end effects.
• The long temporal separation between some SAR image acquisitions imposes alimit on the maximum surface displacement that can be detected between isolatedcoherent areas. If the displacement is more than half the wavelength of the radar(see Table 2.1 for a summary of radar properties) between the last image of oneyear and the first the next year, the displacement signal will be aliased, and conse-quently the total displacement will be underestimated.
• Few SAR scenes each summer limit the analysis to studies of long-term or inter-annual displacement trends. Intraseasonal displacement variations are difficult,if not impossible, to detect. In arctic regions with permafrost, the seasonal thaw-freeze cycle of the active layer causes settlement and uplift of certain landforms,with an amplitude of up to several centimeters [Lauknes et al., 2010].
• Lastly, the fact that we are using snow free scenes only leads to a relatively lownumber of total images available for time series processing. For a typical area innorthern Norway, only 15–20 ERS-1/2 scenes exist in the archive, with on average3–5 scenes per season. This number is lower than most other reported time seriesInSAR studies. It should be noted that as sensors with shorter revisit times becomeavailable (e.g., RADARSAT-2 with 24 days, TerraSAR-X with 11 days, and ESASentinel-1 with 12 days), the potential number of processable scenes per seasonwill significantly increase.
4.2.2 Sparse phase unwrapping
A typical interferogram is often divided into several disconnected coherent areas, sepa-rated by large decorrelated areas. In a typical fjord landscape, such as in coastal Norway,this is manifested in the form of interferograms which include large, decorrelated partswith water. The decorrelated water areas can introduce ambiguities for traditional 2Dphase unwrapping methods.
In order to exclude the decorrelated areas, the common approach in SBAS methodsis to perform a pixel thresholding, selecting only the pixels exhibiting an estimated co-herence value larger than a selected threshold in a chosen fraction of the interferograms.
2See e.g. [Ferretti et al., 2000, Berardino et al., 2002] for a description of the atmospheric filtering strat-egy applied in most InSAR time series methods.
32

-30 mm
15 mm
(a)
-40 mm
20 mm
(b)
Figure 4.2: Displacement results (LOS velocity in mm/year) at the Aknes rockslide. Pre-liminary RADARSAT-2 SBAS results based on Ultra-fine mode data (left), and LISALabresults (right) [Lauknes et al., 2009].
By performing this operation, we are able to retain the coherent areas, but we are leftwith sparse interferograms. The sparse interferograms can then be filled in using a De-launay triangulation and interpolation [Costantini and Rosen, 1999]. The interpolationallows us to link spatially separated coherent patches. We use linear interpolation be-tween the sparse points. However, nearest neighbor interpolation can also be appliedto convert the sparse data set to an equivalent regularly spaced 2D data set [Shankerand Zebker, 2009]. Following this operation, we unwrap all interferograms using theSNAPHU 2D regular grid solver [Chen and Zebker, 2001]. However, we have observedthat this approach can produce interferograms with significant unwrapping errors, inparticular across the fjords, or across areas with severe layover.
Most unwrapping algorithms unwrap consistently within a coherent area; however,relative values between the different coherent patches may have unknown integer mul-tiples of 2π phase jumps. If one of these jumps is not known accurately, the unwrappedphase field can have large discontinuities. For each selected coherent pixel in the SBASmethod, the measured time vector of all unwrapped interferograms will include spike-like noise from each patch that is initially unwrapped with the wrong ambiguity value.
In Chapter 5, we propose an extension to the SBAS method that leads to better ro-bustness with respect to phase unwrapping errors in the interferometric data stack. Ourmethod is based on the original SBAS technique, but improves the robustness in thephase inversion step by replacing the L2-norm cost function with an L1-norm basedcost function, which is known to be less susceptible to spikelike noise.
33

4.3 Possibilities With New High-Resolution Sensors
As discussed in Section 3.1, the first generation SAR satellites (ERS-1/2, Envisat,RADARSAT-1, JERS-1, ALOS) have proven well suited for InSAR studies to detect landdeformation in many different areas. However, these satellites often fail to provideinformation in areas with low coherence and high displacement gradients.
The new generation X- and C-band sensors (RADARSAT-2 Ultra-fine mode, Terra-SAR-X stripmap and spotlight modes, and COSMO-SkyMed) have higher spatial res-olution and shorter revisit times, allowing for detection of deformation at both a finerspatial scale, but also making it possible to detect faster varying deformation phenom-ena [Prati et al., 2010, Sansosti et al., 2010, Strozzi et al., 2010, Wegmuller et al., 2010].The high spatial resolution allows for a finer sampling of the deformation phenomena,thereby increasing the potential to discern coherent areas within vegetated regions. Theshorter repeat intervals allows detection of larger magnitude displacements betweentwo scenes, reducing the risk of undersampling. In effect, these improvements reducethe complexity of phase unwrapping. Furthermore, TerraSAR-X and COSMO-SkyMedoperate at X-band, which gives higher sensitivity than C-band sensors to discern finescale displacements.
An understanding of the 3D kinematics of the rockslope is essential for hazard anal-ysis [Braathen et al., 2004,Henderson and Saintot, 2009], and it is expected that the newgeneration SAR sensors can further improve the knowledge of both spatial and tem-poral rockslide movement patterns. For fast moving landslides, it can be expected thatmany more objects will be detected. These objects may have been discarded previouslydue to signal decorrelation, or they have been classified as slow-moving due to tempo-ral undersampling.
4.3.1 Mapping of the Aknes rockslide using RADARSAT-2 Ultra-finedata
Here, we present preliminary results from an ongoing research project where we recordhigh-resolution RADARSAT-2 Ultra-fine mode data over the Aknes rockslide. We haveperformed a preliminary SBAS InSAR analysis of the Aknes rockslide using only eightRADARSAT-2 Ultra-fine mode SAR scenes [Lauknes et al., 2009]. Figure 4.2(a) showsthe mean LOS velocity in mm/year for the rockslide area. The SAR data have beenmultilooked to produce pixels with ground sizes of approximately 10 m, and the resultshave been draped on a high resolution DEM.
In order to better understand the complex movement pattern at Aknes, the LISALabground based interferometric SAR (GB-InSAR) system was installed and operated be-tween July 17 and October 13, 2008. Figure 4.2(b) shows the mean LOS velocity inmm/year.
The preliminary results using the RADARSAT-2 Ultra-fine mode data show a goodmatch with the LISALab GB-InSAR results. It should be noted that the radar LOS direc-
34
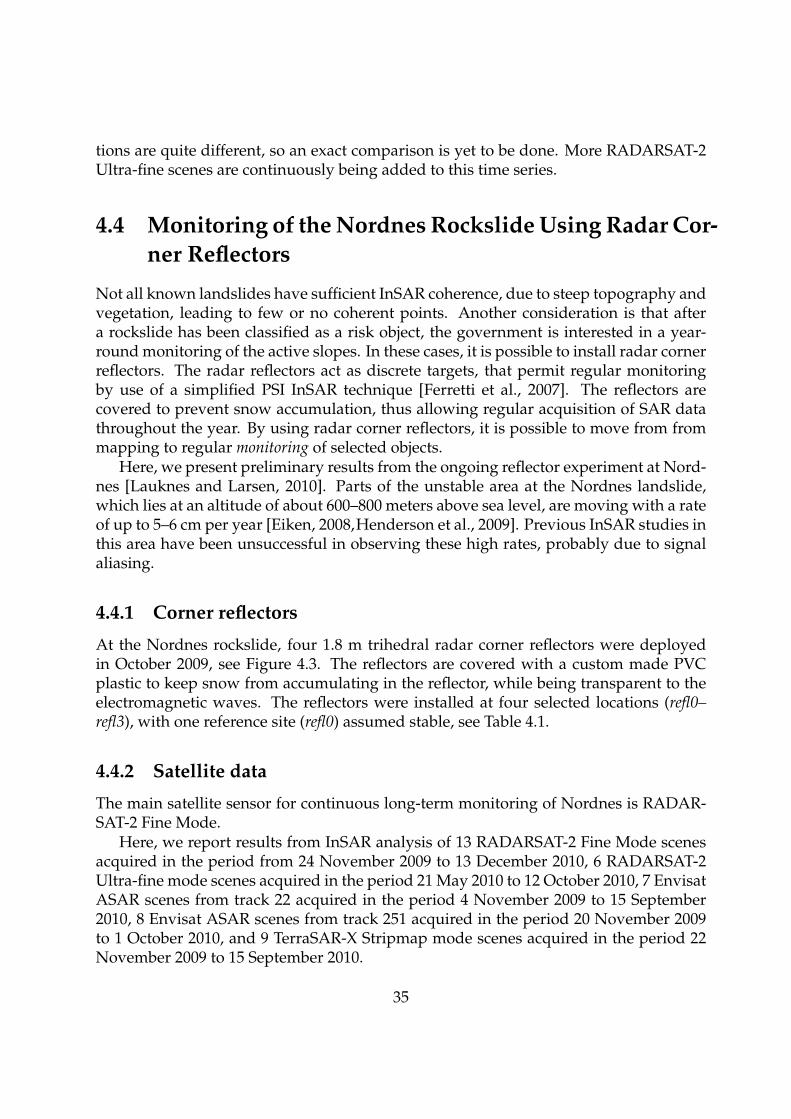
tions are quite different, so an exact comparison is yet to be done. More RADARSAT-2Ultra-fine scenes are continuously being added to this time series.
4.4 Monitoring of the Nordnes Rockslide Using Radar Cor-ner Reflectors
Not all known landslides have sufficient InSAR coherence, due to steep topography andvegetation, leading to few or no coherent points. Another consideration is that aftera rockslide has been classified as a risk object, the government is interested in a year-round monitoring of the active slopes. In these cases, it is possible to install radar cornerreflectors. The radar reflectors act as discrete targets, that permit regular monitoringby use of a simplified PSI InSAR technique [Ferretti et al., 2007]. The reflectors arecovered to prevent snow accumulation, thus allowing regular acquisition of SAR datathroughout the year. By using radar corner reflectors, it is possible to move from frommapping to regular monitoring of selected objects.
Here, we present preliminary results from the ongoing reflector experiment at Nord-nes [Lauknes and Larsen, 2010]. Parts of the unstable area at the Nordnes landslide,which lies at an altitude of about 600–800 meters above sea level, are moving with a rateof up to 5–6 cm per year [Eiken, 2008,Henderson et al., 2009]. Previous InSAR studies inthis area have been unsuccessful in observing these high rates, probably due to signalaliasing.
4.4.1 Corner reflectors
At the Nordnes rockslide, four 1.8 m trihedral radar corner reflectors were deployedin October 2009, see Figure 4.3. The reflectors are covered with a custom made PVCplastic to keep snow from accumulating in the reflector, while being transparent to theelectromagnetic waves. The reflectors were installed at four selected locations (refl0–refl3), with one reference site (refl0) assumed stable, see Table 4.1.
4.4.2 Satellite data
The main satellite sensor for continuous long-term monitoring of Nordnes is RADAR-SAT-2 Fine Mode.
Here, we report results from InSAR analysis of 13 RADARSAT-2 Fine Mode scenesacquired in the period from 24 November 2009 to 13 December 2010, 6 RADARSAT-2Ultra-fine mode scenes acquired in the period 21 May 2010 to 12 October 2010, 7 EnvisatASAR scenes from track 22 acquired in the period 4 November 2009 to 15 September2010, 8 Envisat ASAR scenes from track 251 acquired in the period 20 November 2009to 1 October 2010, and 9 TerraSAR-X Stripmap mode scenes acquired in the period 22November 2009 to 15 September 2010.
35

GPSstation
SARreflector
Laserreflector
Figure 4.3: Location of refl1 at the Nordnes rockslide. The reflector is mounted on aconcrete pillar, and is collocated with the YN3 GPS station and a laser reflector.
All data are acquired in descending mode.
4.4.3 InSAR processing of the reflector double differences
For each of the satellite sensors used, a simplified PSI processing similar to [Ferrettiet al., 2001, Lauknes and Larsen, 2007] was used to estimate the double-difference dis-placement rates. Precise height information from collocated GPS receivers were used toremove the topographic phase contribution.
Displacement time series were estimated for all satellite tracks, between all reflec-tor combinations. The vertical component was estimated by multiplication with cos θ,where θ is the incidence angle.
36
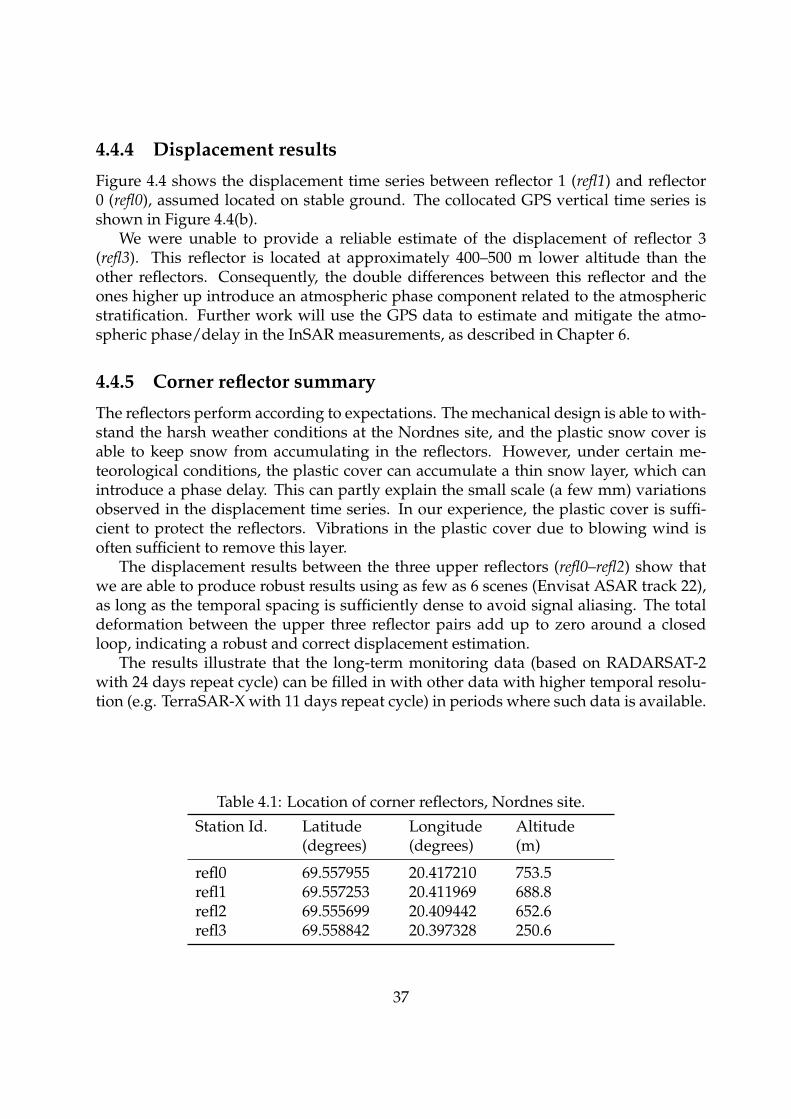
4.4.4 Displacement results
Figure 4.4 shows the displacement time series between reflector 1 (refl1) and reflector0 (refl0), assumed located on stable ground. The collocated GPS vertical time series isshown in Figure 4.4(b).
We were unable to provide a reliable estimate of the displacement of reflector 3(refl3). This reflector is located at approximately 400–500 m lower altitude than theother reflectors. Consequently, the double differences between this reflector and theones higher up introduce an atmospheric phase component related to the atmosphericstratification. Further work will use the GPS data to estimate and mitigate the atmo-spheric phase/delay in the InSAR measurements, as described in Chapter 6.
4.4.5 Corner reflector summary
The reflectors perform according to expectations. The mechanical design is able to with-stand the harsh weather conditions at the Nordnes site, and the plastic snow cover isable to keep snow from accumulating in the reflectors. However, under certain me-teorological conditions, the plastic cover can accumulate a thin snow layer, which canintroduce a phase delay. This can partly explain the small scale (a few mm) variationsobserved in the displacement time series. In our experience, the plastic cover is suffi-cient to protect the reflectors. Vibrations in the plastic cover due to blowing wind isoften sufficient to remove this layer.
The displacement results between the three upper reflectors (refl0–refl2) show thatwe are able to produce robust results using as few as 6 scenes (Envisat ASAR track 22),as long as the temporal spacing is sufficiently dense to avoid signal aliasing. The totaldeformation between the upper three reflector pairs add up to zero around a closedloop, indicating a robust and correct displacement estimation.
The results illustrate that the long-term monitoring data (based on RADARSAT-2with 24 days repeat cycle) can be filled in with other data with higher temporal resolu-tion (e.g. TerraSAR-X with 11 days repeat cycle) in periods where such data is available.
Table 4.1: Location of corner reflectors, Nordnes site.
Station Id. Latitude Longitude Altitude(degrees) (degrees) (m)
refl0 69.557955 20.417210 753.5refl1 69.557253 20.411969 688.8refl2 69.555699 20.409442 652.6refl3 69.558842 20.397328 250.6
37

Nov Dec Jan Feb Mar Apr May Jun Jul Aug Sep Oct Nov Dec Jan
2010 2011Year
-30
-20
-10
0
10
20ve
rtica
l [m
m]
Envisat ASAR IS2 (22)Envisat ASAR IS2 (251)Radarsat-2 F21FRadarsat-2 U2TerraSAR-X
(a)
(b)
Figure 4.4: (a) Displacement time series for refl1 relative to the reference reflector fordifferent SAR sensors. (b) Vertical displacement estimated from GPS station YN3, whichis collocated with refl1. Source: Fjellskred i Troms.
38

Chapter 5
Paper 1:InSAR Deformation Time Series Using anL1-norm Small-Baseline Approach
39

40

Chapter 6
Paper 2:InSAR Tropospheric Stratification Delays:Correction Using a Small BaselineApproach
53

54
Chapter 7
Paper 3:Detailed rockslide mapping in northernNorway with small baseline andpersistent scatterer interferometric SARtime series methods
61

62
Chapter 8
Paper 4:A structural, geomorphological andInSAR study of an active rock slopefailure development
77

78
Chapter 9
Paper 5:Active normal fault control on landscapeand rock-slope failure in northernNorway
95

96
Chapter 10
Conclusions
In this chapter, we give concluding remarks and suggestions for future research.
10.1 Summary
The research topic of this study has been development and application of SB InSAR timeseries methods for extracting information about ground surface stability in rural terrain,with a main focus on rockslides. The work has concentrated on improvements to thewell known SBAS method, to make detecting surface displacements in arctic terrainfeasible.
In chapters 2–3 of this thesis, we presented a brief background on the principlesbehind SAR imaging and an introduction to the InSAR concept. The chapters werewritten with a nonspecialist in mind, focusing on the limitations and strengths of theInSAR satellite remote sensing tool.
Chapter 4 contains a discussion on the particular InSAR challenges we faced in thestudy areas in Norway, mainly focusing on the steep topography and high relief causingunwrapping problems and prominent atmospheric stratification effects, as well as thechallenge with long periods with snow. We concluded Chapter 4 by presenting possibil-ities with new satellite sensors, and we presented two preliminary results from ongoingInSAR mapping and monitoring projects in Norway. The first considers mapping of theAknes landslide with high-resolution RADARSAT-2 data, and the second one considersyear round monitoring of the Nordnes landslide using radar corner reflectors.
Chapters 5–9 include the 5 papers that make up the core of the thesis. The first twopapers contribute to new technology insight, while the last three present applicationswhere the technology has been used.
The research has demonstrated that time series InSAR is a powerful tool which canbe used to identify the relative magnitude and spatial pattern of rockslides. On theregional scale, large areas can be determined to be stable, thereby allowing rather expen-sive field activities to be focused on areas where movement has been detected. On thelocal scale, the InSAR data have contributed to the detailed interpretation of the failure
101
mechanism of several rockslides. Our extensive experience in the ground-truthing ofthe InSAR method demonstrates a remarkable correlation between subsidence detectedfrom the InSAR and mappable, unstable slopes in the terrain.
We have demonstrated that the time series InSAR methodology provides a newand unprecedented technique to determine potential rockslide movement and thereforeprovides a direct link between quantitative ground movement data and the structures,kinematics and changes of slope.
We conclude that time series InSAR is a valuable tool in providing quantitative dataof the activity in rockslides. For year round monitoring of high-risk objects in arcticregions, radar corner reflectors must be installed.
10.2 Suggestions for Further Work
Robust 2D or 3D phase unwrapping is crucial for successful application of small base-line InSAR methods. Future work should focus on development of faster and morereliable unwrapping algorithms that are optimized for sparsely coherent datasets.
The exploitation of partially coherent targets, plus development of InSAR methodsthat utilize information from both persistent point targets as well as from areas withdistributed scattering, is expected to increase the spatial density of points, in particularin rural areas [Hooper et al., 2004, Lanari et al., 2004, Perissin et al., 2007, Prati et al.,2010].
For the Aknes radar corner reflector project, future work will apply atmosphericpath delay information inferred from the GPS network, to correct for the path delaycorrelating with topography. Such correction is imperative in order to robustly estimatedisplacement of radar corner reflectors in steep terrain.
In Norway, permafrost represents a significant feature of the landscape, mainly inmountainous areas, and it is well known that thawing permafrost can have a substan-tial impact of slope stability. In order to evaluate the rockslide geohazard, improvedknowledge on the relationship between ground stability and thawing permafrost is es-sential.
The new satellite sensors, with increased spatial resolution and shorter revisit times,will hopefully permit us to use advanced InSAR time series methods to better quantifyand understand the temporal deformation patterns of different landscape forms in areaswith permafrost. However, much work still remains for proper understanding of theinteraction between the measured InSAR displacement signal and the variety of spatialand temporal surface movements recorded in the different permafrost landforms.
102

Bibliography
[Amelung et al., 2000] F. Amelung, S. Jonsson, H. Zebker and P. Segall. Widespread up-lift and ’trapdoor’ faulting on Galapagos volcanoes observed with radar interferometry.Nature, 407: 993–996, 2000. doi:10.1038/35039604.
[Bamler and Hartl, 1998] R. Bamler and P. Hartl. Synthetic aperture radar interferometry.Inverse Problems, 14: R1–R54, 1998. doi:10.1088/0266-5611/14/4/001.
[Beauducel et al., 2000] F. Beauducel, P. Briole and J.-L. Froger. Volcano-wide fringes inERS synthetic aperture radar interferograms of Etna (1992-1998): Deformation or tropo-spheric effect?. J. Geophys. Res., 105(B7): 391–402, 2000.
[Berardino et al., 2002] P. Berardino, G. Fornaro, R. Lanari and E. Sansosti. A new algo-rithm for surface deformation monitoring based on small baseline differential SAR interfer-ograms. IEEE Transactions on Geoscience and Remote Sensing, 40(11): 2375–2383, Nov.2002. doi:10.1109/TGRS.2002.803792.
[Berardino et al., 2003] P. Berardino, M. Costantini, G. Franceschetti, A. Iodice,L. Pietranera and V. Rizzo. Use of differential SAR interferometry in monitoring andmodelling large slope instability at Maratea (Basilicata, Italy). Engineering Geology, 68:31–51, 2003. doi:10.1016/S0013-7952(02)00197-7.
[Blikra et al., 2006] L. H. Blikra, O. Longva, A. Braathen, E. Anda, J. Dehls and K. Stals-berg. Rock-slope failures in Norwegian fjord areas: examples, spatial distribution andtemporal pattern. In Landslides from Massive Rock Slope Failure: NATO Science Series:IV: Earth and Environmental Sciences, volume 49. 2006.
[Blikra et al., 2008] L. H. Blikra, K. Jogerud, J. Hole and T. Bergeng. The Aknes/Tafjordproject – Monitoring and implementation of early-warning systems. In European Geo-sciences Union Program with Abstracts, General Assembly 2008, Vienna, 13–18 April2008: Geophysical Research Abstracts. 2008.
[Blikra et al., 2009] L. H. Blikra, I. Henderson and T. Nordvik. Faren for fjellskred fraNordnesfjellet i Lyngenfjorden, Troms. Report 2009.026, Geological Survey of Norway,2009. (in Norwegian).
103
[Bonforte et al., 2001] A. Bonforte, A. Ferretti, C. Prati, G. Puglisi and F. Rocca. Calibra-tion of atmospheric effects on SAR interferograms by GPS and local atmosphere models:first results. Journal of Atmospheric and Solar-Terrestrial Physics, 63(12): 1343–1357,2001. doi:10.1016/S1364-6826(00)00252-2.
[Braathen et al., 2004] A. Braathen, L. H. Blikra, S. S. Berg and F. Karlsen. Rock-slopefailures in Norway; type, geometry, deformation mechanisms and stability. NorwegianJournal of Geology, 84: 67–88, 2004.
[Cavalie et al., 2007] O. Cavalie, M.-P. Doin, C. Lasserre and P. Briole. Ground motionmeasurement in the Lake Mead area, Nevada, by differential synthetic aperture radar in-terferometry time series analysis: Probing the lithosphere rheological structure. Journal ofGeophysical Research, 112(B03403), 2007. doi:10.1029/2006JB004344.
[Chaabane et al., 2007] F. Chaabane, A. Avallone, F. Tupin, P. Briole and H. Maitre. Amultitemporal method for correction of tropospheric effects in differential SAR interferom-etry: Application to the Gulf of Corinth earthquake. IEEE Transactions on Geoscience andRemote Sensing, 45(6), 2007. doi:10.1109/TGRS.2007.894026.
[Chen and Zebker, 2000] C. W. Chen and H. A. Zebker. Network approaches to two-dimensional phase unwrapping: intractability and two new algorithms. Journal of theOptical Society of America A., 17(3): 401–414, 2000. doi:10.1364/JOSAA.17.000401.
[Chen and Zebker, 2001] C. W. Chen and H. A. Zebker. Two-dimensional phase un-wrapping with use of stastistical models for cost functions in nonlinear optimiza-tion. Journal of the Optical Society of America A., 18(2): 338–351, 2001.doi:10.1364/JOSAA.18.000338.
[Colesanti and Wasowski, 2006] C. Colesanti and J. Wasowski. Investigating landslideswith space-borne Synthetic Aperture Radar (SAR) interferometry. Engineering Geology,88(3–4): 173–199, 2006. doi:10.1016/j.enggeo.2006.09.013.
[Costantini, 1998] M. Costantini. A novel phase unwrapping method based on network pro-gramming. IEEE Transactions on Geoscience and Remote Sensing, 36(3): 813–821, May.1998. doi:10.1109/36.673674.
[Costantini and Rosen, 1999] M. Costantini and P. A. Rosen. A generalized phase unwrap-ping approach for sparse data. Proc. IGARSS, Hamburg, Germany, Jun. 28–Jul. 2, 1:267–269, 1999. doi:10.1109/IGARSS.1999.773467.
[Cumming and Wong, 2005] I. G. Cumming and F. H. Wong. Digital Processing of Syn-thetic Aperture Radar Data: Algorithms and Implementation. Artech House Inc., NewYork, 2005.
[Curlander and McDonough, 1991] J. C. Curlander and R. N. McDonough. SyntheticAperture Radar. Wiley, 1991.
104
[Davis et al., 1985] J. L. Davis, T. A. Herring, I. I. Shapiro, A. E. E. Rogers and G. Elgered.Geodesy by radio interferometry: Effects of atmospheric modeling errors on estimates ofbaseline length. Radio Science, 20(6): 1593–1607, 1985.
[Dehls et al., 2002] J. F. Dehls, M. Basilico and C. Colesanti. Ground deformationmonitoring in the Ranafjord area of Norway by means of the permanent scatter-ers technique. Proc. IGARSS, Toronto, Canada, June 24–28, 1: 203–207, 2002.doi:10.1109/IGARSS.2002.1024988.
[Delacourt et al., 1998] C. Delacourt, P. Briole and J. A. Achache. Tropospheric correctionsof SAR interferograms with strong topography. Application to Etna. Geophysical ResearchLetters, 25(15): 2849–2852, 1998. doi:10.1029/98GL02112.
[Doin et al., 2009] M.-P. Doin, C. Lasserre, G. Peltzer, O. Cavalie and C. Doubre.Corrections of stratified tropospheric delays in SAR interferometry: Validation withglobal atmospheric models. Journal of Applied Geophysics, 69(1): 35–50, 2009.doi:10.1016/j.jappgeo.2009.03.010.
[Eiken, 2008] T. Eiken. Rapport om Deformasjonsmalingar i Troms 2003–2008. Technicalreport, University of Oslo, 2008. (in Norwegian).
[Ferretti et al., 2000] A. Ferretti, C. Prati and F. Rocca. Nonlinear subsidence rate estima-tion using permanent scatterers in differential SAR interferometry. IEEE Transactions onGeoscience and Remote Sensing, 38(5): 2202–2212, Sep. 2000. doi:10.1109/36.868878.
[Ferretti et al., 2001] A. Ferretti, C. Prati and F. Rocca. Permanent scatterers in SAR inter-ferometry. IEEE Transactions on Geoscience and Remote Sensing, 39(1): 8–20, Jan. 2001.doi:10.1109/36.898661.
[Ferretti et al., 2007] A. Ferretti, G. Savio, R. Barzaghi, A. Borghi, S. Musazzi, F. Novali,C. Prati and F. Rocca. Submillimeter accuracy of InSAR time series: experimental vali-dation. IEEE Transactions on Geoscience and Remote Sensing, 45(5): 1142–1153, 2007.doi:10.1109/TGRS.2007.894440.
[Franceschetti and Lanari, 1999] G. Franceschetti and R. Lanari. Synthetic ApertureRadar Processing. CRC Press, 1999.
[Gabriel et al., 1989] A. K. Gabriel, R. M. Goldstein and H. A. Zebker. Mapping small el-evation changes over large areas: Differential radar interferometry. Journal of GeophysicalResearch, 94(B7): 9183–9191, 1989. Doi:10.1029/JB094iB07p09183.
[Ganerød et al., 2008] G. V. Ganerød, G. Grøneng, J. S. Rønning, E. Dalsegg, H. Elve-bakk, J. F. Tønnesen, V. Kveldsvik, T. Eiken, L. H. Blikra and A. Braathen. Geologi-cal model of the Aknes rockslide, western Norway. Engineering Geology, 102(1–2): 1–18,2008. doi:10.1016/j.enggeo.2008.01.018.
105
[Gatelli et al., 1994] F. Gatelli, A. M. Guarnieri, F. Parizzi, P. Pasquali, C. Prati andF. Rocca. The wavenumber shift in SAR interferometry. IEEE Transactions on Geoscienceand Remote Sensing, 32(4): 855–865, 1994. doi:10.1109/36.298013.
[Ghiglia and Pritt, 1998] D. C. Ghiglia and M. D. Pritt. Two-dimensional Phase Unwrap-ping: Theory, Algorithms, and Software,. Wiley, New York, 1998.
[Goldstein, 1995] R. M. Goldstein. Atmospheric limitations to repeat-track radar interferom-etry. Geophysical Research Letters, 22(18): 2517–2520, 1995. doi:10.1029/95GL02475.
[Goldstein et al., 1988] R. M. Goldstein, H. A. Zebker and C. L. Werner. Satellite radarinterferometry: Two-dimensional phase unwrapping. Radio Science, 23(4): 713–720, 1988.doi:10.1029/RS023i004p00713.
[Goldstein et al., 1993] R. M. Goldstein, R. Engelhardt, B. Kamp and R. M. Frolich. Satel-lite radar interferometry for monitoring ice sheet motion: Application to an Antarctic icestream. Science, 262: 1525–1530, 1993. doi:10.1126/science.262.5139.1525.
[Graham, 1974] L. C. Graham. Synthetic Interferometer Radar for Topographic Mapping.Proceedings of the IEEE, 62(6): 763–768, 1974. doi:10.1109/PROC.1974.9516.
[Grøneng et al., 2009] G. Grøneng, B. Nilsen and R. Sandven. Shear strength estimationfor Aknes sliding area in western Norway. International Journal of Rock Mechanics &Mining Sciences, 46(3): 479–488, 2009. doi:10.1016/j.ijrmms.2008.10.006.
[Grøneng et al., 2010a] G. Grøneng, H. H. Christiansen, B. Nilsen and L. H. Blikra. Mete-orological effects on seasonal displacements of the Aknes rockslide, western Norway. Land-slides, 2010a. doi:10.1007/s10346-010-0224-x.
[Grøneng et al., 2010b] G. Grøneng, M. Lu, B. Nilsen and A. K. Jenssen. Mod-elling of time-dependent behavior of the basal sliding surface of the Aknes rock-slide area in western Norway. Engineering Geology, 114(3–4): 414–422, 2010b.10.1016/j.enggeo.2010.05.017.
[Guneriussen et al., 2001] T. Guneriussen, K. A. Høgda, H. Johnsen and I. Lauknes. In-SAR for estimation of changes in snow water equivalent of dry snow. IEEE Transactionson Geoscience and Remote Sensing, 39(10): 2101–2108, 2001. doi:10.1109/36.957273.
[Hanssen, 2001] R. Hanssen. Radar Interferometry: Data Interpretation and Error Analysis.Kluwer Academic, Dordrecht, The Netherlands, 2001.
[Hanssen and Usai, 1997] R. Hanssen and S. Usai. Interferometric phase analysis for moni-toring slow deformation processes. In Proc. Third ERS Symp., Florence, Italy, Mar. 17–21,pp. 487–491. 1997.
106

[Henderson and Saintot, 2009] I. H. C. Henderson and A. Saintot. Regional spatial varia-tions in rockslide distribution from structural geology ranking: an example from Storfjor-den, western Norway. Slope Tectonics, Geological Society, London, Special Publications,2009. (in press).
[Henderson et al., 2007] I. H. C. Henderson, A. Saintot, G. V.-G. d and L. H. Blikra. Fjell-skredkartlegging i Troms. Report 2007.041, Geological Survey of Norway, 2007. (inNorwegian).
[Henderson et al., 2008] I. H. C. Henderson, P. T. Osmundsen and T. F. Redfield. ROSFjellskred i Troms: Statusrapport. Report 2008.025, Geological Survey of Norway,2008. (in Norwegian).
[Henderson et al., 2009] I. H. C. Henderson, P. T. Osmundsen and T. F. Redfield. ROSFjellskred i Troms: Status og planer. Report 2009.023, Geological Survey of Norway,2009. (in Norwegian).
[Hilley et al., 2004] G. E. Hilley, R. Burgmann, A. Ferretti, F. Novali and F. Rocca. Dy-namics of slow-moving landslides from permanent scatterer analysis. Science, 304(5679):1952–1955, 2004. doi:10.1126/science.1098821.
[Hooper, 2008] A. Hooper. A multi-temporal InSAR method incorporating both persistentscatterer and small baseline approaches. Geophysical Research Letters, 35(L16302), 2008.doi:10.1029/2008GL034654.
[Hooper and Zebker, 2007] A. Hooper and H. A. Zebker. Phase unwrapping in three di-mensions with application to InSAR time series. Journal of the Optical Society of AmericaA., 24(9): 2737–2747, 2007. doi:10.1364/JOSAA.24.002737.
[Hooper et al., 2004] A. Hooper, H. Zebker, P. Segall and B. Kampes. A new method formeasuring deformation on volcanoes and other natural terrains using InSAR persistentscatterers. Geophysical Research Letters, 31(L23611), 2004. doi:10.1029/2004GL021737.
[Hooper et al., 2007] A. Hooper, P. Segall and H. Zebker. Persistent scatterer inter-ferometric synthetic aperture radar for crustal deformation analysis, with applicationto Volcan Alcedo, Galapagos. Journal of Geophysical Research, 112(B07407), 2007.doi:10.1029/2006JB004763.
[Ishimaru, 1978] A. Ishimaru. Wave Propagation and Scattering in Random Media. Aca-demic Press, 1978.
[Kampes, 2006] B. M. Kampes. Radar Interferometry - Persistent Scatterer Technique.Springer, Dordrecht, The Netherlands, 2006.
[Kveldsvik et al., 2009] V. Kveldsvik, H. H. Einstein, B. Nilsen and L. H. Blikra. Nu-merical analysis of the 650,000 m2 Aknes rock slope based on measured displacements
107
and geotechnical data. Rock Mechanics and Rock Engineering, 42(5): 689–728, 2009.doi:10.1007/s00603-008-0005-1.
[Lanari et al., 2004] R. Lanari, O. Mora, M. Manuta, J. J. Mallorquı, P. Berardino andE. Sansosti. A small-baseline approach for investigating deformations on full-resolutiondifferential SAR interferograms. IEEE Transactions on Geoscience and Remote Sensing,42(7): 1377–1386, 2004. doi:10.1109/TGRS.2004.828196.
[Lanari et al., 2007] R. Lanari, F. Casu, M. Manzo, G. Zeni, P. Berardino, M. Manuta andA. Pepe. An overview of the small baseline subset algorithm: A DInSAR technique forsurface deformation analysis. Pure and Applied Geophysics, 164(4): 637–661, Apr. 2007.doi:10.1007/s00024-007-0192-9.
[Lauknes, 2004] T. R. Lauknes. Long-Term Surface Deformation Mapping using Small-Baseline Differential SAR Interferograms. Master’s thesis, University of Tromsø, Nor-way, 2004.
[Lauknes and Larsen, 2007] T. R. Lauknes and Y. Larsen. Persistent scatterer interferomet-ric SAR. Report 2007.15, Norut Tromsø, 2007.
[Lauknes and Larsen, 2010] T. R. Lauknes and Y. Larsen. Nordnes InSAR corner reflectorstatus report 2010. Report 2010.18, Norut Tromsø, 2010.
[Lauknes et al., 2009] T. R. Lauknes, J. F. Dehls, Y. Larsen and L. H. Blikra. Monitoringof the Aknes rockslide in Storfjorden, Norway using InSAR. In Abstract. Fringe 2009Workshop, ESA ESRIN, Frascati, Rome, Nov. 30–Dec. 4. 2009.
[Lauknes et al., 2010] T. R. Lauknes, Y. Larsen, E. Malnes and H. H. Christiansen. Per-mafrost monitoring using SAR and ground based techniques in Svalbard. In Abstract,Third European Conference on Permafrost (EUCOP III), Longyearbyen, Svalbard, Nor-way, June 13–17. 2010.
[Lohman and Simons, 2005] R. B. Lohman and M. Simons. Some thoughts on theuse of InSAR data to constrain models of surface deformation: Noise structureand data downsampling. Geochemistry Geophysics Geosystems, 6(Q01007), 2005.doi:10.1029/2004GC000841.
[Lundgren et al., 2001] P. Lundgren, S. Usai, E. Sansosti, R. Lanari, M. Tesauro,G. Fornaro and P. Berardino. Modelling surface deformation observed with syntheticaperture radar interferometry at Campi Flegrei caldera. Journal of Geophysical Research,106(B9): 19355–19366, 2001. doi:10.1029/2001JB000194.
[Massonnet and Feigl, 1998] D. Massonnet and K. L. Feigl. Radar interferometry and itsapplication to changes in the earth’s surface. Reviews of Geophysics, 36(4): 441–500, 1998.doi:10.1029/97RG03139.
108

[Massonnet et al., 1993] D. Massonnet, M. Rossi, C. Carmona, F. Adagna, G. Peltzer,K. Feigl and T. Rabaute. The displacement field of the Landers earthquake mapped byradar interferometry. Nature, 364(8): 138–142, 1993. doi:10.1038/364138a0.
[Massonnet et al., 1995] D. Massonnet, P. Briole and A. Arnaud. Deflation of MountEtna monitored by spaceborne radar interferometry. Nature, 375: 567–570, 1995.doi:10.1038/375567a0.
[Mora et al., 2003] O. Mora, J. J. Mallorquı and A. Broquetas. Linear and non-linear terrain deformation maps from a reduced set of interferometric sar images.IEEE Transactions on Geoscience and Remote Sensing, 41(10): 2243–2253, 2003.doi:10.1109/TGRS.2003.814657.
[Nordvik and Nyrnes, 2009] T. Nordvik and E. Nyrnes. Statistical analysis of surfacedisplacements-an example from the Aknes rockslide, western Norway. Natural Hazardsand Earth System Sciences, 9: 713–724, 2009. doi:10.5194/nhess-9-713-2009.
[Nordvik et al., 2009] T. Nordvik, G. Grøneng, G. V. Ganerød, B. Nilsen, C. Harding andL. H. Blikra. Geovisualization, geometric modelling and volume estimation of the Aknesrockslide, Western Norway. Bulletin of Engineering Geology and the Environment, 68(2):245–256, 2009. doi:10.1007/s10064-009-0198-x.
[Nordvik et al., 2010] T. Nordvik, L. H. Blikra, E. Nyrnes and M.-H. Derron. Statisticalanalysis of seasonal displacements at the Nordnes rockslide, northern Norway. EngineeringGeology, 114(3–4): 228–337, 2010. doi:10.1016/j.enggeo.2010.04.019.
[Peltzer et al., 2001] G. Peltzer, F. Crampe, S. Hensley and P. Rosen. Transient strainaccumulation and fault interaction in the Eastern California shear zone. Geology, 29(11):975–978, 2001. doi:10.1130/0091-7613(2001)029.
[Pepe and Lanari, 2006] A. Pepe and R. Lanari. On the extension of the minimum costflow algorithm for phase unwrapping of multitemporal differential SAR interferograms.IEEE Transactions on Geoscience and Remote Sensing, 44(9): 2374–2383, Sep. 2006.doi:10.1109/TGRS.2006.873207.
[Perissin et al., 2007] D. Perissin, A. Ferretti, R. Piantanida, D. Piccagli, C. Prati,F. Rocca, A. Rucci and F. de Zan. Repeat-pass SAR interferometry with partiallycoherent targets. Proc. Fifth International Workshop on ERS SAR Interferometry,“FRINGE07”, ESA ESRIN, Frascati, Rome, November 26–30, 2007.
[Prati et al., 2010] C. Prati, A. Ferretti and C. Perissin. Recent advances on surface grounddeformation measurement by means of repeated space-borne SAR observations. Journal ofGeodynamics, 49(3–4): 161–170, 2010. doi:10.1016/j.jog.2009.10.011.
[Remy et al., 2003] D. Remy, S. Bonvalot, P. Briole and M. Murakami. Accurate measure-ments of tropospheric effects in volcanic areas from SAR interferometry data: application
109

to Sakurajima volcano (Japan). Earth and Planetary Science Letters, 213: 299–310, 2003.doi:10.1016/S0012-821X(03)00331-5.
[Rocca et al., 2000] F. Rocca, C. Prati, A. M. Guarnieri and A. Ferretti. SAR in-terferometry and its applications. Surveys in Geophysics, 21(2–3): 159–176, 2000.doi:10.1023/A:1006710731155.
[Rosen et al., 2000] P. A. Rosen, S. Hensley, I. R. Joughin, F. K. Li, S. N. Madsen,E. Rodrıguez and R. M. Goldstein. Synthetic aperture radar interferometry. Proceedingsof the IEEE, 88(3): 333–382, 2000. doi:10.1109/5.838084.
[Rott and Nagler, 2006] H. Rott and T. Nagler. The contribution of radar interferometry tothe assessment of landslide hazards. Advances in Space Research, 37(4): 710–719, 2006.doi:10.1016/j.asr.2005.06.059.
[Sandwell and Price, 1998] D. T. Sandwell and E. J. Price. Phase gradient approach tostacking interferograms. Journal of Geophysical Research, 103(B12): 30183–30204, 1998.doi:10.1029/1998JB900008.
[Sansosti et al., 2010] E. Sansosti, F. Casu, M. Manzu and R. Lanari. Space-borne radarinterferometry techniques for the generation of deformation time series: An advanced toolfor Earth’s surface displacement analysis. Geophysical Research Letters, 37(L20305), 2010.doi:10.1029/2010GL044379.
[Schmidt and Burgmann, 2003] D. A. Schmidt and R. Burgmann. Time-dependent landuplift and subsidence in the Santa Clara valley, California, from a large InSAR data set.Journal of Geophysical Research, 108(B9), 2003. doi:10.1029/2002JB002267.
[Shanker and Zebker, 2009] A. P. Shanker and H. Zebker. Sparse two-dimensional phaseunwrapping using regular grid methods. IEEE Geoscience and Remote Sensing Letters,6(3), 2009. doi:10.1109/LGRS.2009.2020522.
[Shanker and Zebker, 2010] A. P. Shanker and H. Zebker. Edgelist phase unwrapping algo-rithm for time series InSAR analysis. Journal of the Optical Society of America A., 27(3):605–612, 2010. doi:10.1364/JOSAA.27.000605.
[Strozzi et al., 2000] T. Strozzi, P. Dammert, U. Wegmuller, J. M. Martinez, J. Askne,A. Beaudoin and M. Hallikainen. Landuse mapping with ERS SAR Interferome-try. IEEE Transactions on Geoscience and Remote Sensing, 38(2): 766–775, 2000.doi:10.1109/36.842005.
[Strozzi et al., 2003] T. Strozzi, U. Wegmuller, C. L. Werner, A. Wiesmann and V. Spreck-els. JERS SAR interferometry for land subsidence monitoring. IEEE Transactions on Geo-science and Remote Sensing, 41(7): 1702–1708, 2003. doi:10.1109/TGRS.2003.813273.
110

[Strozzi et al., 2005] T. Strozzi, P. Farina, A. Corsini, C. Ambrosi, M. Thuring, J. Zilger,A. Wiesmann, U. Wegmuller and C. Werner. Survey and monitoring of landslide dis-placements by means of L-band satellite SAR interferometry. Landslides, 2(3): 193–201,2005. doi:10.1007/s10346-005-0003-2.
[Strozzi et al., 2010] T. Strozzi, R. Delaloye, A. Kaab, C. Ambrosi, E. Perruchoudand U. Wegmuller. Combined observations of rock mass movements using satel-lite SAR interferometry, differential GPS, airborne digital photogrammetry, and air-borne photography interpretation. Journal of Geophysical Research, 115(F01014), 2010.doi:10.1029/2009JF001311.
[Ulaby et al., 1982] F. T. Ulaby, R. K. Moore and A. K. Fung. Microwave Remote Sensing,volume II. Addison-Wesley, 1982.
[Usai, 1997] S. Usai. The use of man-made features for long-time scale INSAR. In Proc.IGARSS, Singapore, August 3–8, pp. 1542–1544. 1997.
[Wadge et al., 2002] G. Wadge, P. W. Webley, I. N. James, R. Bingley, A. Dodson,S. Waugh, T. Veneboer, G. Puglisi, M. Mattia, D. Baker, S. C. Edwards, S. J. Edwardsand P. J. Clarke. Atmospheric models, GPS and InSAR measurements of the troposphericwater vapour field over Mount Etna. Geophysical Research Letters, 29(19): 1905, 2002.doi:10.1029/2002GL015159.
[Webley et al., 2002] P. W. Webley, R. M. Bingley, A. H. Dodson, G. Wadge, S. J. Waughand I. N. James. Atmospheric water vapour correction to InSAR surface motion mea-surements on mountains: results from a dense GPS network on Mount Etna. Physics andChemistry of the Earth, 27: 363–370, 2002. doi:10.1016/S1474-7065(02)00013-X.
[Wegmuller et al., 2010] U. Wegmuller, D. Walter, V. Spreckels and C. L. Werner.Nonuniform ground motion monitoring with TerraSAR-X persistent scatterer inter-ferometry. IEEE Transactions on Geoscience and Remote Sensing, 48(2), 2010.doi:10.1109/TGRS.2009.2030792.
[Werner et al., 2003] C. Werner, U. Wegmuller, T. Strozzi and A. Wiesmann. Interferomet-ric point target analysis for deformation mapping. Proceedings of International Geoscienceand Remote Sensing Symposium 2003 (IGARSS’03), Toulouse, France, July 21–25, 7:4362–4364, 2003.
[Wessel and Smith, 1998] P. Wessel and W. H. F. Smith. New, improved version of theGeneric Mapping Tools released. EOS Trans. AGU, 79(579), 1998.
[Wiley, 1954] C. A. Wiley. Pulsed Doppler radar methods and apparatus. Technical report,United States Patent, No. 3196436, 1954.
[Zebker and Goldstein, 1986] H. A. Zebker and R. M. Goldstein. Topographic mappingfrom interferometric synthetic aperture radar observations. Journal of Geophysical Re-search, 91(B5): 4993–4999, 1986. doi:10.1029/JB091iB05p04993.
111

[Zebker and Villasenor, 1992] H. A. Zebker and J. Villasenor. Decorrelation in interfero-metric radar echoes. IEEE Transactions on Geoscience and Remote Sensing, 30(5): 950–959, Sep. 1992. doi:10.1109/36.175330.
[Zebker et al., 1994] H. A. Zebker, P. A. Rosen, R. M. Goldstein, A. Gabriel and C. L.Werner. On the derivation of coseismic displacement fields using differential radar interfer-ometry: The Landers earthquake. Journal of Geophysical Research, 99(B10): 19617–19634,1994. doi:10.1029/94JB01179.
[Zebker et al., 1997] H. A. Zebker, P. A. Rosen and S. Hensley. Atmospheric effects in in-terferometric synthetic aperture radar surface deformation and topographic maps. Journalof Geophysical Research, 102(B4): 7547–7563, 1997. doi:10.1029/96JB03804.
112

About the author — Tom Rune Lauknes was born in 1977 in Kirkenes, Norway, andgrew up in the town of Tromsø. In December 2004, he graduated with the degree ofCand. Scient. (M. Sc. equivalent) in physics from the University of Tromsø, Tromsø,Norway. Since 2005, he has been a Research Scientist with the Northern Research In-stitute Tromsø (Norut), Tromsø. From September 2007 to August 2008, he was a Vis-iting Researcher with the Radar Interferometry Group, Stanford University, Stanford,CA, USA. In March 2011, he defended the current PhD thesis, entitled “Rockslide Map-ping in Norway by Means of Interferometric SAR Time-Series Analysis” at Universityof Tromsø, Department of Physics and Technology. His research interests include SARand InSAR signal processing techniques applied to surface displacement monitoring,glacier movement detection, and ionospheric studies.

ISBN 978-82-8236-024-1