Embed Size (px)
Citation preview
Italian Journal of Engineering Geology and Environment - Book Series (6) www.ijege.uniroma1.it © 2013 Sapienza Università Editrice
339
DOI: 10.4408/IJEGE.2013-06.B-32
GB INSAR MEASUREMENT AT THE ÅKNES ROCKSLIDE, NORWAY
Lene KRISTENSEN(*), CarLo RIVOLTA(**), John DEHLS(***) & Lars h. BLIKRA(*)
(*)Åknes/Tafjord Early Warning Centre - Ødegårdsvegen 176 - 6200 Stranda, NorwayEmail: [email protected]. Telephone: +47 40040265
location on the opposite side of the fjord since 2006. In 2012 these measurements were supplemented with a short overlapping campaign from a closer location immediately outside the unstable area.
InSAR (or Differential InSAR - DInSAR) is a re-mote sensing technology that is increasingly being used to detect displacements on the earth surface. It utilizes the phase difference between two coherent images to measure change in distance. A detailed description of the InSAR method, in particular as measured by satel-lite is given by Farretti et alii, (2007). The method can detect small changes in distance to a satellite or a ground based system in a way that can be independent of installations on the ground. InSAR from satellites have been used for regional landslide mapping or char-acterization of particular landslides (taburini et alii, 2011; reiden & WaLther, 2007). Satellite based In-SAR is becoming more applicable to detailed surface instability studies, as images from new satellites have improved temporal and spatial resolution, for example Terrasar X and in future the ESA Sentinel satellites.
When monitoring a limited area, such as a single landslide; ground based InSAR systems have some important advantages over a satellite based ones. They offer measurements of much shorter time inter-vals (minutes rather than several days) and a better spatial resolution without being controlled by satellite geometry (Casagi et alii, 2010). Ground based InSAR systems usually measure from a fixed position so the baseline (difference in radar position) is zero.
ABSTRACT Åknes is a 54 mil. m3 rockslide at Storfjorden,
Western Norway. It has the potential to form a devastat-ing tsunami in the fjord, and therefore it is thoroughly investigated and continuously monitored. Five GB In-SAR campaigns have been carried out since 2006 in order to investigate the patterns of surface displace-ment. Here we present the results of these measure-ments, and compare them with in situ measurements of surface displacement. The data provide detailed infor-mation on the displacement fields in the rockslide. The InSAR system is placed opposite the fjord in relation to the rockslide and due to unusually strong atmospheric disturbance, a statistical filter needs to be applied to the signal when processing. Therefore the data is not included in the early warning system, but in 2012 an-other GB InSAR system was installed at a different site, which focus on the upper and most active part of the rockslide - and this will be used for early warning in critical phases of the rockslide monitoring, such as during accelerated movement or after a partial collapse.
Key words: Åknes, rockslide, landslide, monitoring, GB InSAR
INTRODUCTIONThe Åknes rockslide poses a big risk to human
lives, and is thoroughly investigated and closely mon-itored. As a part of the rockslide investigations, five ground based interferometric synthetic aperture radar (GB InSAR) campaigns have been carried out from a
L. KRISTENSEN, C. RIVOLTA, J. DEHLS & L.H. BLIKRA
340
International Conference Vajont 1963-2013. Thoughts and analyses after 50 years since the catastrophic landslide Padua, Italy - 8-10 October 2013
present activity of rockslides for risk classification (Kristensen, 2011), Kristensen, 2012 (b), Kristensen, 2012 (c) and to identify unstable areas in along roads (Kristensen & rivoLta, 2011).
THE ÅKNES ROCKSLIDEÅknes is a large rock instability in Storfjorden,
Western Norway, and is one of four mapped high-risk rockslides in Norway subjected to permanent monitoring. The maximum volume of the unstable area is estimated to 54 million m3 (bLiKra et alii, 2010). Due to its size, relatively high probability, and
Ground based InSAR systems are for exam-ple used to monitor open pit mines (Lingua & rin-audo, 2008; Farina et alii, 2011), construction sites (bozzano et alii, 2011) and volcanos and landslides (antoneLLo et alii, 2004; sChuLz et alii, 2012). For rockslide studies it has been used on Ruinon (tarChi et alii, 2003; agLiardi et alii, 2011) and Cortenova rockslide (tarChi et alii, 2005). In Norway, the GB InSAR method has been used in the investigations and early warning at the high risk rockslides Mannen (Kristensen & bLiKra, 2011) and Jettan [Kristensen, 2012 (a)]. Also it has been used to characterize the
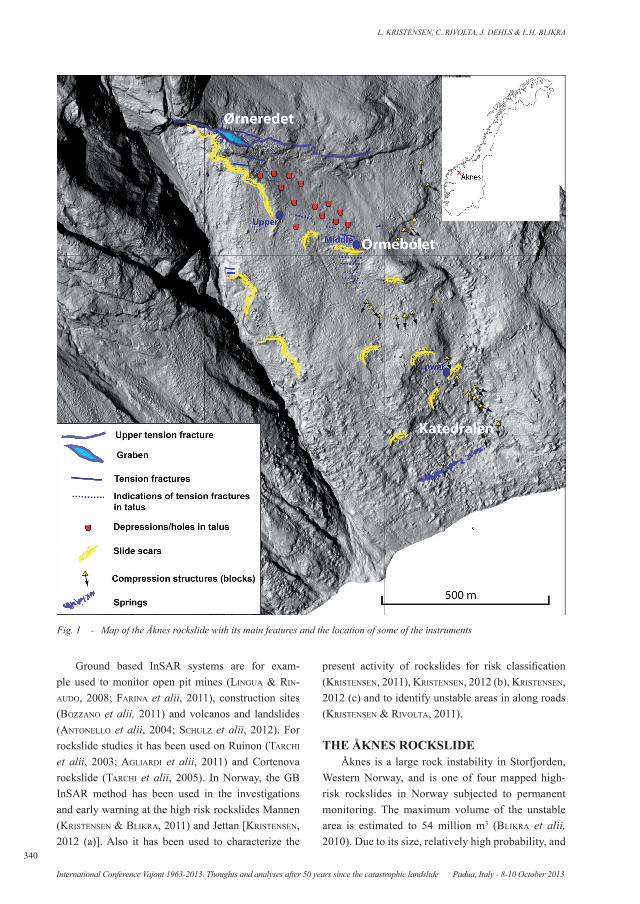
Fig. 1 - Map of the Åknes rockslide with its main features and the location of some of the instruments
GB INSAR MEASUREMENT AT THE ÅKNES ROCKSLIDE, NORWAY
Italian Journal of Engineering Geology and Environment - Book Series (6) www.ijege.uniroma1.it © 2013 Sapienza Università Editrice
341
tem was placed at the opposite side of the fjord from the rockslide (see Fig. 3). In 2005, the first attempt of radar measurements was made with the radar placed very close to the fjord; however the results were of low quality due to atmosphere and tidal effects in the images. From 2006, the radar was placed in a perma-nent shed, with a plastic covered window, which is close to transparent to the microwaves. Power and in-ternet is available at the site.
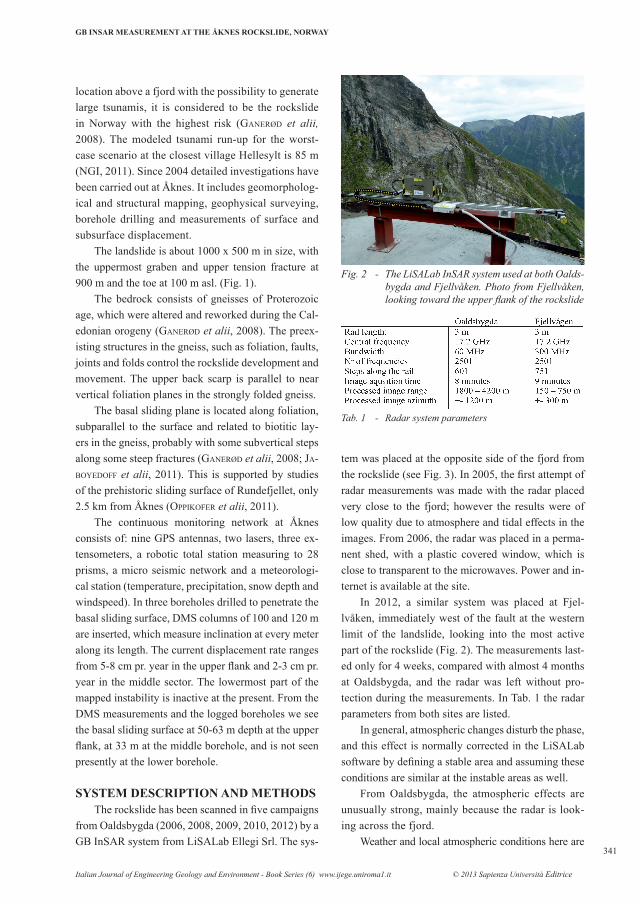
In 2012, a similar system was placed at Fjel-lvåken, immediately west of the fault at the western limit of the landslide, looking into the most active part of the rockslide (Fig. 2). The measurements last-ed only for 4 weeks, compared with almost 4 months at Oaldsbygda, and the radar was left without pro-tection during the measurements. In Tab. 1 the radar parameters from both sites are listed.
In general, atmospheric changes disturb the phase, and this effect is normally corrected in the LiSALab software by defining a stable area and assuming these conditions are similar at the instable areas as well.
From Oaldsbygda, the atmospheric effects are unusually strong, mainly because the radar is look-ing across the fjord.
Weather and local atmospheric conditions here are
location above a fjord with the possibility to generate large tsunamis, it is considered to be the rockslide in Norway with the highest risk (ganerød et alii, 2008). The modeled tsunami run-up for the worst-case scenario at the closest village Hellesylt is 85 m (NGI, 2011). Since 2004 detailed investigations have been carried out at Åknes. It includes geomorpholog-ical and structural mapping, geophysical surveying, borehole drilling and measurements of surface and subsurface displacement.
The landslide is about 1000 x 500 m in size, with the uppermost graben and upper tension fracture at 900 m and the toe at 100 m asl. (Fig. 1).
The bedrock consists of gneisses of Proterozoic age, which were altered and reworked during the Cal-edonian orogeny (ganerød et alii, 2008). The preex-isting structures in the gneiss, such as foliation, faults, joints and folds control the rockslide development and movement. The upper back scarp is parallel to near vertical foliation planes in the strongly folded gneiss.
The basal sliding plane is located along foliation, subparallel to the surface and related to biotitic lay-ers in the gneiss, probably with some subvertical steps along some steep fractures (ganerød et alii, 2008; Ja-boyedoFF et alii, 2011). This is supported by studies of the prehistoric sliding surface of Rundefjellet, only 2.5 km from Åknes (oppiKoFer et alii, 2011).
The continuous monitoring network at Åknes consists of: nine GPS antennas, two lasers, three ex-tensometers, a robotic total station measuring to 28 prisms, a micro seismic network and a meteorologi-cal station (temperature, precipitation, snow depth and windspeed). In three boreholes drilled to penetrate the basal sliding surface, DMS columns of 100 and 120 m are inserted, which measure inclination at every meter along its length. The current displacement rate ranges from 5-8 cm pr. year in the upper flank and 2-3 cm pr. year in the middle sector. The lowermost part of the mapped instability is inactive at the present. From the DMS measurements and the logged boreholes we see the basal sliding surface at 50-63 m depth at the upper flank, at 33 m at the middle borehole, and is not seen presently at the lower borehole.
SYSTEM DESCRIPTION AND METHODSThe rockslide has been scanned in five campaigns
from Oaldsbygda (2006, 2008, 2009, 2010, 2012) by a GB InSAR system from LiSALab Ellegi Srl. The sys-
Fig. 2 - The LiSALab InSAR system used at both Oalds-bygda and Fjellvåken. Photo from Fjellvåken, looking toward the upper flank of the rockslide
Tab. 1 - Radar system parameters
L. KRISTENSEN, C. RIVOLTA, J. DEHLS & L.H. BLIKRA
342
International Conference Vajont 1963-2013. Thoughts and analyses after 50 years since the catastrophic landslide Padua, Italy - 8-10 October 2013
that was subtracted to the radar images. This proce-dure led to radar images, where the individual pixels represented the phase values that can be considered free from the atmospheric effects and noise and of good quality. After applying the algorithms, the re-sidual atmospheric effect in the images was in the order of 1 mm, which is an acceptable level for the GB InSAR method.
At Fjellvåken the radar is located at similar al-titude as the upper flank and graben area, and the unique atmospheric disturbance experienced at Oaldsbygda is entirely absent.
All radar images were processed with the LiSAL-ab software. Daily images were cumulated, in order to avoid phase wrapping when looking at longer time intervals. Then the images were projected or subject to coordinate transformation to display the data in Arc-GIS, together with other types of monitoring data and satellite based InSAR.
DISCUSSION OF LOSAn InSAR system will measure the difference
in distance to the target in the Line Of Sight (LOS), which is usually less than the true displacement vec-tor. It is possible to obtain the true displacement if three (or, with some assumptions, two) radar systems are measuring the same target area simultaneously (severin et alii, 2011). The very big advantage of obtaining overlapping measurement is the possibility to draw the displacement vectors and thus identify sectors or blocks with different velocity or direction.
At Åknes we had a period of two systems measur-ing at overlapping interval; however the view angle and ground resolution was very different, making it difficulties to calculate the true displacement vectors.
It would basically have required a third radar sys-tem, and still the pixel coverage would be poor.
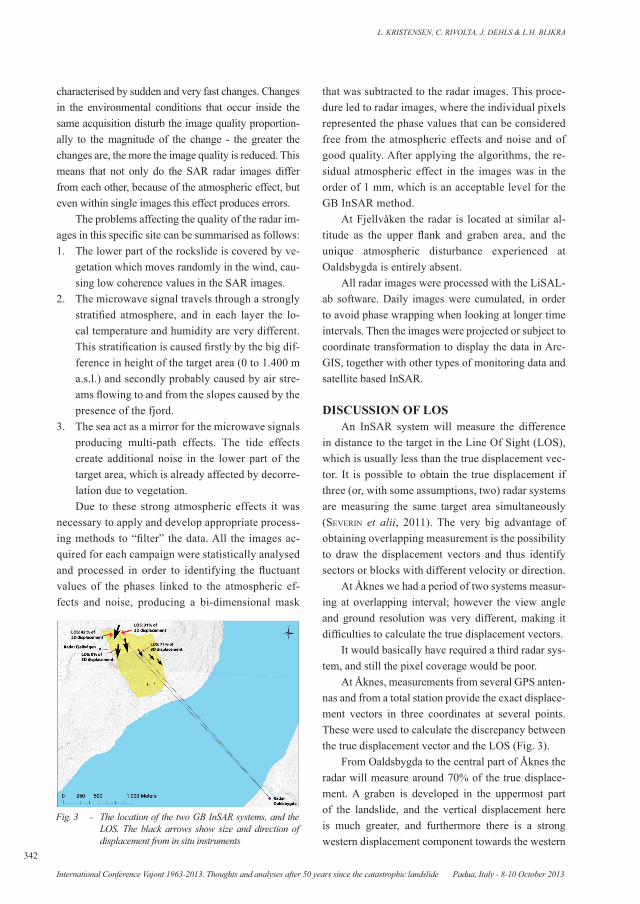
At Åknes, measurements from several GPS anten-nas and from a total station provide the exact displace-ment vectors in three coordinates at several points. These were used to calculate the discrepancy between the true displacement vector and the LOS (Fig. 3).
From Oaldsbygda to the central part of Åknes the radar will measure around 70% of the true displace-ment. A graben is developed in the uppermost part of the landslide, and the vertical displacement here is much greater, and furthermore there is a strong western displacement component towards the western
characterised by sudden and very fast changes. Changes in the environmental conditions that occur inside the same acquisition disturb the image quality proportion-ally to the magnitude of the change - the greater the changes are, the more the image quality is reduced. This means that not only do the SAR radar images differ from each other, because of the atmospheric effect, but even within single images this effect produces errors.
The problems affecting the quality of the radar im-ages in this specific site can be summarised as follows:1. The lower part of the rockslide is covered by ve-
getation which moves randomly in the wind, cau-sing low coherence values in the SAR images.
2. The microwave signal travels through a strongly stratified atmosphere, and in each layer the lo-cal temperature and humidity are very different. This stratification is caused firstly by the big dif-ference in height of the target area (0 to 1.400 m a.s.l.) and secondly probably caused by air stre-ams flowing to and from the slopes caused by the presence of the fjord.
3. The sea act as a mirror for the microwave signals producing multi-path effects. The tide effects create additional noise in the lower part of the target area, which is already affected by decorre-lation due to vegetation.Due to these strong atmospheric effects it was
necessary to apply and develop appropriate process-ing methods to “filter” the data. All the images ac-quired for each campaign were statistically analysed and processed in order to identifying the fluctuant values of the phases linked to the atmospheric ef-fects and noise, producing a bi-dimensional mask
Fig. 3 - The location of the two GB InSAR systems, and the LOS. The black arrows show size and direction of displacement from in situ instruments
GB INSAR MEASUREMENT AT THE ÅKNES ROCKSLIDE, NORWAY
Italian Journal of Engineering Geology and Environment - Book Series (6) www.ijege.uniroma1.it © 2013 Sapienza Università Editrice
343
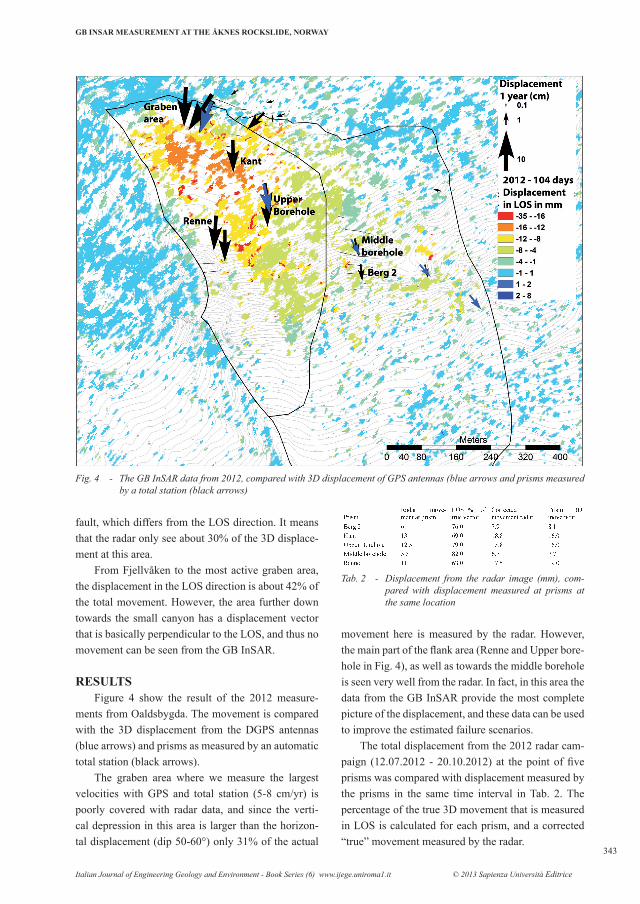
movement here is measured by the radar. However, the main part of the flank area (Renne and Upper bore-hole in Fig. 4), as well as towards the middle borehole is seen very well from the radar. In fact, in this area the data from the GB InSAR provide the most complete picture of the displacement, and these data can be used to improve the estimated failure scenarios.
The total displacement from the 2012 radar cam-paign (12.07.2012 - 20.10.2012) at the point of five prisms was compared with displacement measured by the prisms in the same time interval in Tab. 2. The percentage of the true 3D movement that is measured in LOS is calculated for each prism, and a corrected “true” movement measured by the radar.
fault, which differs from the LOS direction. It means that the radar only see about 30% of the 3D displace-ment at this area.
From Fjellvåken to the most active graben area, the displacement in the LOS direction is about 42% of the total movement. However, the area further down towards the small canyon has a displacement vector that is basically perpendicular to the LOS, and thus no movement can be seen from the GB InSAR.
RESULTS Figure 4 show the result of the 2012 measure-
ments from Oaldsbygda. The movement is compared with the 3D displacement from the DGPS antennas (blue arrows) and prisms as measured by an automatic total station (black arrows).
The graben area where we measure the largest velocities with GPS and total station (5-8 cm/yr) is poorly covered with radar data, and since the verti-cal depression in this area is larger than the horizon-tal displacement (dip 50-60°) only 31% of the actual
Fig. 4 - The GB InSAR data from 2012, compared with 3D displacement of GPS antennas (blue arrows and prisms measured by a total station (black arrows)
Tab. 2 - Displacement from the radar image (mm), com-pared with displacement measured at prisms at the same location
L. KRISTENSEN, C. RIVOLTA, J. DEHLS & L.H. BLIKRA
344
International Conference Vajont 1963-2013. Thoughts and analyses after 50 years since the catastrophic landslide Padua, Italy - 8-10 October 2013
We see that the movement measured by the radar is very similar to that of the prisms in the same inter-val, with the biggest errors of -13 and + 17%. This is within the uncertainty of the instruments.
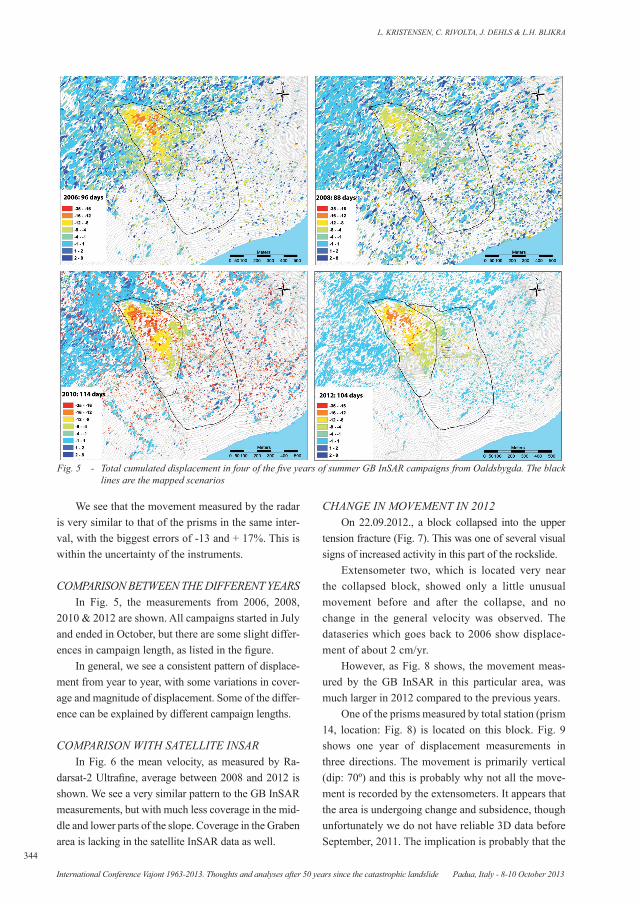
COMPARISON BETWEEN THE DIFFERENT YEARSIn Fig. 5, the measurements from 2006, 2008,
2010 & 2012 are shown. All campaigns started in July and ended in October, but there are some slight differ-ences in campaign length, as listed in the figure.
In general, we see a consistent pattern of displace-ment from year to year, with some variations in cover-age and magnitude of displacement. Some of the differ-ence can be explained by different campaign lengths.
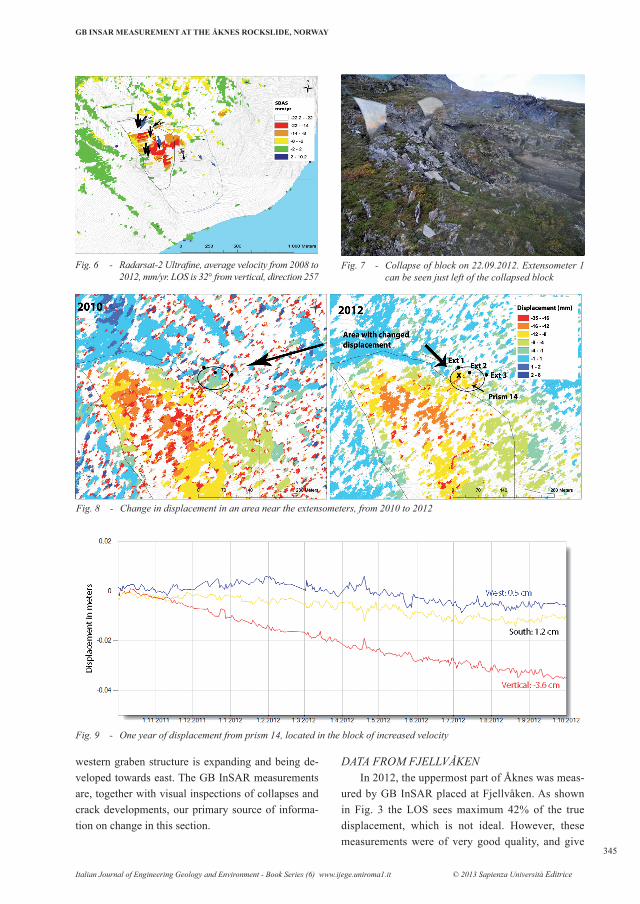
COMPARISON WITH SATELLITE INSARIn Fig. 6 the mean velocity, as measured by Ra-
darsat-2 Ultrafine, average between 2008 and 2012 is shown. We see a very similar pattern to the GB InSAR measurements, but with much less coverage in the mid-dle and lower parts of the slope. Coverage in the Graben area is lacking in the satellite InSAR data as well.
CHANGE IN MOVEMENT IN 2012On 22.09.2012., a block collapsed into the upper
tension fracture (Fig. 7). This was one of several visual signs of increased activity in this part of the rockslide.
Extensometer two, which is located very near the collapsed block, showed only a little unusual movement before and after the collapse, and no change in the general velocity was observed. The dataseries which goes back to 2006 show displace-ment of about 2 cm/yr.
However, as Fig. 8 shows, the movement meas-ured by the GB InSAR in this particular area, was much larger in 2012 compared to the previous years.
One of the prisms measured by total station (prism 14, location: Fig. 8) is located on this block. Fig. 9 shows one year of displacement measurements in three directions. The movement is primarily vertical (dip: 70º) and this is probably why not all the move-ment is recorded by the extensometers. It appears that the area is undergoing change and subsidence, though unfortunately we do not have reliable 3D data before September, 2011. The implication is probably that the
Fig. 5 - Total cumulated displacement in four of the five years of summer GB InSAR campaigns from Oaldsbygda. The black lines are the mapped scenarios
GB INSAR MEASUREMENT AT THE ÅKNES ROCKSLIDE, NORWAY
Italian Journal of Engineering Geology and Environment - Book Series (6) www.ijege.uniroma1.it © 2013 Sapienza Università Editrice
345
DATA FROM FJELLVÅKENIn 2012, the uppermost part of Åknes was meas-
ured by GB InSAR placed at Fjellvåken. As shown in Fig. 3 the LOS sees maximum 42% of the true displacement, which is not ideal. However, these measurements were of very good quality, and give
western graben structure is expanding and being de-veloped towards east. The GB InSAR measurements are, together with visual inspections of collapses and crack developments, our primary source of informa-tion on change in this section.
Fig. 6 - Radarsat-2 Ultrafine, average velocity from 2008 to 2012, mm/yr. LOS is 32° from vertical, direction 257
Fig. 7 - Collapse of block on 22.09.2012. Extensometer 1 can be seen just left of the collapsed block
Fig. 8 - Change in displacement in an area near the extensometers, from 2010 to 2012
Fig. 9 - One year of displacement from prism 14, located in the block of increased velocity
L. KRISTENSEN, C. RIVOLTA, J. DEHLS & L.H. BLIKRA
346
International Conference Vajont 1963-2013. Thoughts and analyses after 50 years since the catastrophic landslide Padua, Italy - 8-10 October 2013
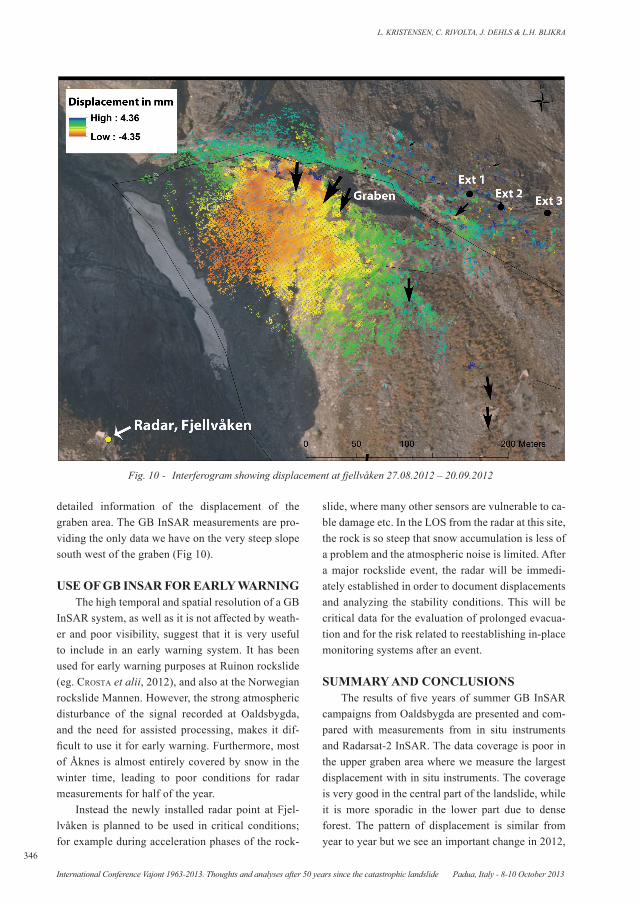
Fig. 10 - Interferogram showing displacement at fjellvåken 27.08.2012 – 20.09.2012
slide, where many other sensors are vulnerable to ca-ble damage etc. In the LOS from the radar at this site, the rock is so steep that snow accumulation is less of a problem and the atmospheric noise is limited. After a major rockslide event, the radar will be immedi-ately established in order to document displacements and analyzing the stability conditions. This will be critical data for the evaluation of prolonged evacua-tion and for the risk related to reestablishing in-place monitoring systems after an event.
SUMMARY AND CONCLUSIONSThe results of five years of summer GB InSAR
campaigns from Oaldsbygda are presented and com-pared with measurements from in situ instruments and Radarsat-2 InSAR. The data coverage is poor in the upper graben area where we measure the largest displacement with in situ instruments. The coverage is very good in the central part of the landslide, while it is more sporadic in the lower part due to dense forest. The pattern of displacement is similar from year to year but we see an important change in 2012,
detailed information of the displacement of the graben area. The GB InSAR measurements are pro-viding the only data we have on the very steep slope south west of the graben (Fig 10).
USE OF GB INSAR FOR EARLY WARNINGThe high temporal and spatial resolution of a GB
InSAR system, as well as it is not affected by weath-er and poor visibility, suggest that it is very useful to include in an early warning system. It has been used for early warning purposes at Ruinon rockslide (eg. Crosta et alii, 2012), and also at the Norwegian rockslide Mannen. However, the strong atmospheric disturbance of the signal recorded at Oaldsbygda, and the need for assisted processing, makes it dif-ficult to use it for early warning. Furthermore, most of Åknes is almost entirely covered by snow in the winter time, leading to poor conditions for radar measurements for half of the year.
Instead the newly installed radar point at Fjel-lvåken is planned to be used in critical conditions; for example during acceleration phases of the rock-
GB INSAR MEASUREMENT AT THE ÅKNES ROCKSLIDE, NORWAY
Italian Journal of Engineering Geology and Environment - Book Series (6) www.ijege.uniroma1.it © 2013 Sapienza Università Editrice
347
which suggest that the upper graben area is further developing towards east. The measured displacement compares very well with the measurements by the total station when the GB InSAR measurements are corrected for the discrepancy between LOS and the displacement vector. The GB InSAR measurements from Oaldsbygda give the most complete displace-ment pattern, but due to strong atmospheric effects
REFERENCESantoneLLo g., CasagLi n., Farina p., Leva d., niCo g., sieber a.J. & tarChi d. (2004) - Ground based SAR interferometry for
monitoring mass movements. Landslides, 1: 21-28.bLiKra L. h., hoLe J. & anda e. (2010) - Scenario og prognoser for fjellskred og flodbølger fra Åknes og Hegguraksla. Åknes
report 1.2010.bozzano F., Cipriani i., Mazzanti p. & prestininzi a. (2011) - Displacement patterns of a landslide affected by human activities:
insights from ground-based InSAR monitoring. Nat. Hazards, 59: 1377-1396.CasagLi n., Catani F., ventisette C.d. & Luzi g. (2010) - Advances in Geosciences InSAR processing for the recognition of
landslides. Landslides, 7: 291-301.Crosta g.b., agLiardi F., sosio r., rivoLta C., Leva d. & dei gas L. (2012) - Long term real-time monitoring of large alpine
rockslides by GB-InSAR: mechanisms, triggers, scenario assessment and EarlyWarning. Geophysical Research Abstracts, 14: EGU2012-11496.
Farina p., Leoni L., babboni F., Coppi F., Mayer L. & riCCi p. (2011) - IBIS-M, an Innovative Radar for Monitoring Slopes in Open-Pit Mines. Proceedings, Slope Stability: International Symposium on Rock Slope Stability in Open Pit Mining and Civil Engineering, Vancouver, Canada
Ferretti a., Monti guarnieri a., prati C. & roCCa F. (2007) - InSAR Principles: Guidelines for SAR Interferometry Processing and Interpretation. ESA.
ganerød g.v., grøneng g., rønning J.s., daLsegg e., eLvebaKK, h., tønnesen J.F., KveLdsviK v., eiKen t. & bLiKra L.h. (2008) - Geological model of the Åknes rockslide, western Norway. Engineering Geology, 102: 1-18.
harbitz C. & gLiMsdaL s. (2011) - Numerical simulations of tsunamis from potential and historical rock slides in Storfjorden: hazard zoning and comparison with 3D laboratory experiments. Revised NGI report 20051018-00-1-R.
JaboyedoFF M., oppiKoFer t., derron M.h., bLiKra L.h. böhMe M & saintot A. (2011) - Complex landslide behavior and structural control: a three-dimensional conceptual model of Åknes rockslide, Norway. Geological Society London. Special Publications 2011, 351: 147-161.
Kristensen L. & bLiKra L.h. (2011) - Monitoring displacement on the Mannen rockslide in Western Norway. Proceedings of the 2nd World Landslide Forum - 3-7 October 2011, Rome.
Kristensen L. & rivoLta C. (2011) - Instability mapping by Ground Based inSAR along a road, Oppdølsstranda, Norway. Poster. Fringe 2011 Workshop, Frascati, Italy, 19-23 September.
Kristensen L. (2011) - Ground based radar measurements at Gamanjunni 3 and Oksfjellet, Troms. Åknes report 09.2011.Kristensen L. (2012a) - Radarkartlegging av bevegelse på Jettan og Indre Nordnes, 2011. Åknes report 04.2012Kristensen L. (2012b) - GB radar measurements at Joasete/Furekamben in Flåm, Sogn og Fjordane, 2012. Åknes report 06.2012.Kristensen L. (2012c) - GB InSAR measurements at Storhaugen in Manndalen, Troms, 2012. Åknes report 11.2012. Lingua a., piatti d. & rinaudo F. (2008) - Remote monitoring of a landslide using an integration of GB InSAR and LIDAR
techniques. The International Archive of the Photogrammetry, Remote Sensing and Spatial Information Sciences, XXXVll. Part B1. Beijing 2001.
riedeL b & WaLther a. (2008) - Monitoring, prediction, and early warning using ground-based radar interferometry. Adv. Geosci., 14: 189-194.
sChuLz W.h., Coe J.a., shurtLeFF b.L. & panosKy J. (2012) - Kinematics of the Slumgullion landslide revealed by ground-based InSAR surveys. In: eberhardt et alii (eds.). Landslides and engineered slopes: protecting society through improved
along the fjords, it is difficult to use for early warning. Measurements from Fjellvåken do not suffer the same atmospheric effects. This site provides measurements of the graben and upper flank area, which has the largest deformations and probably the highest prob-abilities for a catastrophic failure. This site will be used for early warning, in connection with accelera-tion of movements and after a major event.

L. KRISTENSEN, C. RIVOLTA, J. DEHLS & L.H. BLIKRA
348
International Conference Vajont 1963-2013. Thoughts and analyses after 50 years since the catastrophic landslide Padua, Italy - 8-10 October 2013
understanding. Taylor & Francis Group, London.severin J., eberhardt e., Leoni L. & Fortin s. (2011) - Use of ground-based synthetic aperture radar to investigate complex
3-D pit slope kinematics. Proceedings, Slope Stability 2011: International Symposium on Rock Slope Stability in Open Pit Mining and Civil Engineering, Vancouver, Canada.
tarChi d., CasagLi n., Leva d., Moretti s. & sieber a.J. (2003) - Monitoring landslide displacements by using ground-based SAR interferometry: application to the Ruinon landslide in the Italian Alps. Journal Geophysical Research, 108: 2387-2401.
tarChi d., antoneLLo g., CasagLi n. Farina p., Fortuny-guasCh J., guerri L & Leva d. (2005) - On the use of roundbased SAR interferometry for slope failure early warning: the Cortenova rock slide, Italy. In: sassa et alii (eds.). Landslides, risk analysis and sustainable disaster management. Springer, 337-342.